Article

Examining Structural Relationships among Night Tourism Experience, Lovemarks, Brand Satisfaction, and Brand Loyalty on “Cultural Heritage Night” in South Korea

1
Research Institute for Study Travel, Henan University, Kaifeng 475001, China
2
School of Cultural Industry & Tourism Management, Henan University, Kaifeng 475001, China
3
Department of Leisure Service & Sports, Pai Chai University, Daejeon 35345, Korea
*
Author to whom correspondence should be addressed.
Sustainability 2020, 12(17), 6723; https://0-doi-org.brum.beds.ac.uk/10.3390/su12176723
Submission received: 1 August 2020 / Revised: 17 August 2020 / Accepted: 17 August 2020 / Published: 19 August 2020

Abstract

:
The night-time economy is an important part of the urban economy and contributes significantly to modern cities’ GDP. The development of night tourism is one of the crucial means to enrich and prosper the night-time economy. Recently, as a popular topic of sustainable development, night tourism has received extensive attention. However, little attention has been paid to night tourism, especially from the emotional perspective of tourists. Furthermore, discussions on how and why tourists become interested in night tourism are still lacking. To fill the research gap, based on the theory of experience economy, we used the concept of lovemarks to explore the influence of tourists’ tourism experience and lovemarks on their brand satisfaction and brand loyalty. A self-administered questionnaire was completed by 487 tourists of “Cultural Heritage Night”, a night tourism brand in South Korea. The results indicate that tourists’ entertainment and educational experience significantly influence their lovemarks (both of brand love and respect), and esthetic experience only significantly influences brand respect. Furthermore, the influence of tourists’ lovemarks on brand satisfaction and loyalty is also validated. To retain the sustainable development of night-time economy and night tourism, local authorities and destination managers are recommended to provide night tourism brands (products) with optimal experience effects and entirely emotional and functional attributes.

1. Introduction

In 2016, the Cultural Heritage Administration of South Korea launched a plan of “the night of cultural heritage” and then built a national night tourism brand named “Cultural Heritage Night.” Based on the representative cultural heritage sites and areas of 10 cities in South Korea, it was a product designed for sustainable night tourism that contained eight sections, including night scenery, night road, night history, night book, night talk, night food, night market, and night stay [1]. Since building the “Cultural Heritage Night,” the night consumption level of each host city has been effectively activated. For example, the number of tourists has increased from 1.05 million in 2016 to 2.29 million in 2018; the number of listed cultural heritage sites and areas has increased from 10 in 2016 to 27 in 2019, and a total of about 17.5 billion won (around 14.6 million dollars ($1 USD = KRW ₩1199.36 (as of 28 July 2020))) has been invested to this night tourism brand [2]. The important feature of the “Cultural Heritage Night” is the unitary plan proposed by the national administration, which provides night tourism activities in different sites, areas, and themes with various periods. The unitary night tourism brand also realizes the overall activation and reuse of all levels of cultural heritage sites and areas within the country. Given this, as a pivotal section of the night-time economy (NTE), night tourism plays a vital role in activating the cultural heritage sites and the sustainable development of the city [3,4].
Night-time economy mainly refers to the consumption of leisure activities from 6:00 p.m. to 6:00 a.m. the next day, including the core activities (drinking, entertainment, diet), non-core activities (transportation, culture, accommodation, etc.), and supporting activities (the supply chain related to core and non-core activities) [5]. Nowadays, NTE, including night tourism, has been paid more and more attention by governments in the world, even in developing countries. According to some NTE reports, it was said that the NTE in the UK could generate an average of 66 billion pounds in revenue and provided 1.3 million jobs per year [6]. In London, the capital of the UK, it was found that around one-fifth of all trips made by residents began between 6:00 p.m. and 6:00 a.m., and two-thirds of trips during night time were for leisure reasons [7]. In developing countries like China, the night consumption and night tourism market are also deeply developed. For example, in 2019, the total social retail sales of Shanghai at night was almost equal to half of the day it made [8]. During a short holiday on the National Day (1 October 2019), around 44.96% of tourists participated in night tourism activities [9]. Before the outbreak of coronavirus disease (COVID-19), iiMedia Research once predicted that the NTE size in China would exceed 30 trillion yuan in 2020 (around 419.0 billion dollars ($1 USD = RMB ¥7.16 (as of 27 May 2020))) [10]. Despite all these “dazzling” data, most of the prior studies focused on night tourism within NTE paid much attention to host and guest relationships [11], crimes [12], sex [13], and violence (e.g., alcohol, drugs) [14]. An empirical exploration of how and why tourists are more and more interested in night tourism activities is still lacking.
Brand loyalty is a direct reflection of customer’s attitudes and behaviors on a specific product. Customers with a high level of brand loyalty always held positive attitudes and behaviors on the product [15]. In the highly competitive consumer market, improving the brand loyalty of products is beneficial to its market share and price positioning [16]. Therefore, in the process of branding development, brand loyalty is particularly important. In the context of the fact that the modern market economy has changed from a service economy to experience economy, consumers have not only merely purchased products or services, but also paid more attention to the emotions and feelings in the process of product experience [17,18,19]. A good experience of a product can positively affect the brand loyalty of consumers, as well as the emotions and enthusiasm for products (such as brand love and brand trust) [18,20,21]. In light of these kinds of emotional bonding, Roberts proposed the theory of lovemarks, containing brand love and brand respect, showing loyalty beyond reason [22]. The theory of lovemarks argues that the successful product or service marketing means the consumers have emotional attachment or enthusiasm for a specific brand; more specifically, the love and respect to a brand are more important than the brand marketing [23]. The meaning of lovemarks is extremely obvious in the management of night tourism products with certain fame or rich cultural contents, such as mega-events (Festival of Lights in Lyon), World Cultural Heritage (“Cultural Heritage Night” in South Korea), or influential performing arts (“Impression” series of performing arts in China). Based on the logic of lovemarks, after experiencing these kinds of night tourism products, tourists are more likely to love and respect the brand based on the trust or cultural attachment pre-formed by strong cultural identities and emotional connections [22]. Therefore, it seems that lovemarks can contribute to building more strengthened brand loyalty within night tourism tourists. However, although the relationships between experience, brand love, satisfaction, and loyalty have been discussed to some extent [21], little attention has been paid to the loyalty formation by including the more comprehensive theory of lovemarks, especially in the underestimated field of night tourism activities in NTE.
Given these research gaps, the current study suggests three research questions on the sustainable marketing of night tourism brands (products): Firstly, what kinds of experience make tourists keen on night tourism brands (products)? Secondly, what emotions do tourists generate as a result of experiencing a night tourism brand (product)? Thirdly, how is a tourist’s loyalty to the night tourism brand (product) generated and enhanced through their emotions?
Based on the above background and research questions, the purposes of the current study were as follows: Firstly, the theory of lovemarks was used to examine the formation mechanism of tourist’s brand loyalty on the mature night tourism brand―“Cultural Heritage Night;” secondly, the structural relationships between tourism experience, lovemarks, brand satisfaction, and brand loyalty were explored; thirdly, based on the results, we further proposed some managerial recommendations on how to improve tourist’s night tourism brand loyalty and satisfaction through the understanding of lovemarks and experience, since night tourism had been one of the crucial boosters to promote the sustainable development of economy, society, and environment in the modern cities.

2. Literature Review

2.1. The Sustainable Functions of Night Tourism

Night Tourism is the extension and expansion of regular tourism activities in the daytime. Compared with giving a hurried and cursory glance at tourism sites during the daytime, the leisure and recreational style at night is more conducive to tourists’ perceptions of local culture and experience of life style [24]. During night tourism, tourists can go shopping, taste delicious food, visit iconic tourism sites, make social contact with residents, and experience the authentic atmosphere that cannot be perceived in the day [3,24,25,26]. Therefore, night tourism is an extraordinary approach to show urban development, cultural connotation, and the style and features of residents.
Night tourism has sustainable functions in three aspects: Firstly, night tourism has sustainable economic functions. In the era of the experience economy, night tourism plays an essential role in NTE [6,7,8,9]. The development of night tourism can stimulate consumption and commerce at night, providing extra chances for tourists to experience what they may interest. In this context, the long-term development of night tourism will help to attract more tourists and enhance potential business opportunities [27]. Secondly, night tourism also contributes to the sustainability of society and culture. Although prior studies paid more attention to the adverse effects of nightlife [12,13], for a tourism destination, the development of night tourism further strengthened the content mining and protection of tourism attractions [27]. Furthermore, the relationship between the host and the guest was more harmonious [28]. For the city itself, the extended opening time resulted from night tourism could give their citizens more chances to make short stays or sightseeing in their cities [27]. Thirdly, in the context of environmental protection, night tourism promotes more low-carbon behaviors. For example, it was found that after dark, 81% of tourists used a tube, and 75% of tourists chose to walk before midnight [7]. With the increase of night tourism demand, local governments have further strengthened public transport services, which not only facilitates the travel of tourists, but also reduces potential carbon emissions. Additionally, some night tourism products, like the “Cultural Heritage Night” in South Korea, are designed for merely walking and seeing the tourism sites on foot [29]. While tourists slowly experience cultural heritages, the environmentally friendly idea is also practiced. Generally speaking, night tourism will benefit the sustainable development of the host city from the aspects of economic, socio-cultural, and environmental.
Prior studies of night tourism have tried to emphasize on the related adverse impacts (e.g., violence, crime) [12,14], types of night tourism products or activities (e.g., night markets in Taiwan, night festival, astronomical tourism) [30,31,32,33], and psychological variables (e.g., perceived problems, experience, image, motivation) [24,26,34]. While the above topics have been widely discussed, how night tourism products gain increasing brand loyalty from tourists has been less explored. More specifically, the focus on the tourist’s beyond rational brand emotion within night tourism products has also been neglected. Therefore, further exploration of the formation of night tourism brand loyalty by lovemarks is needed to fill these research gaps and provide practical recommendations for the sustainable management of night tourism products.

2.2. Brand Satisfaction and Brand Loyalty
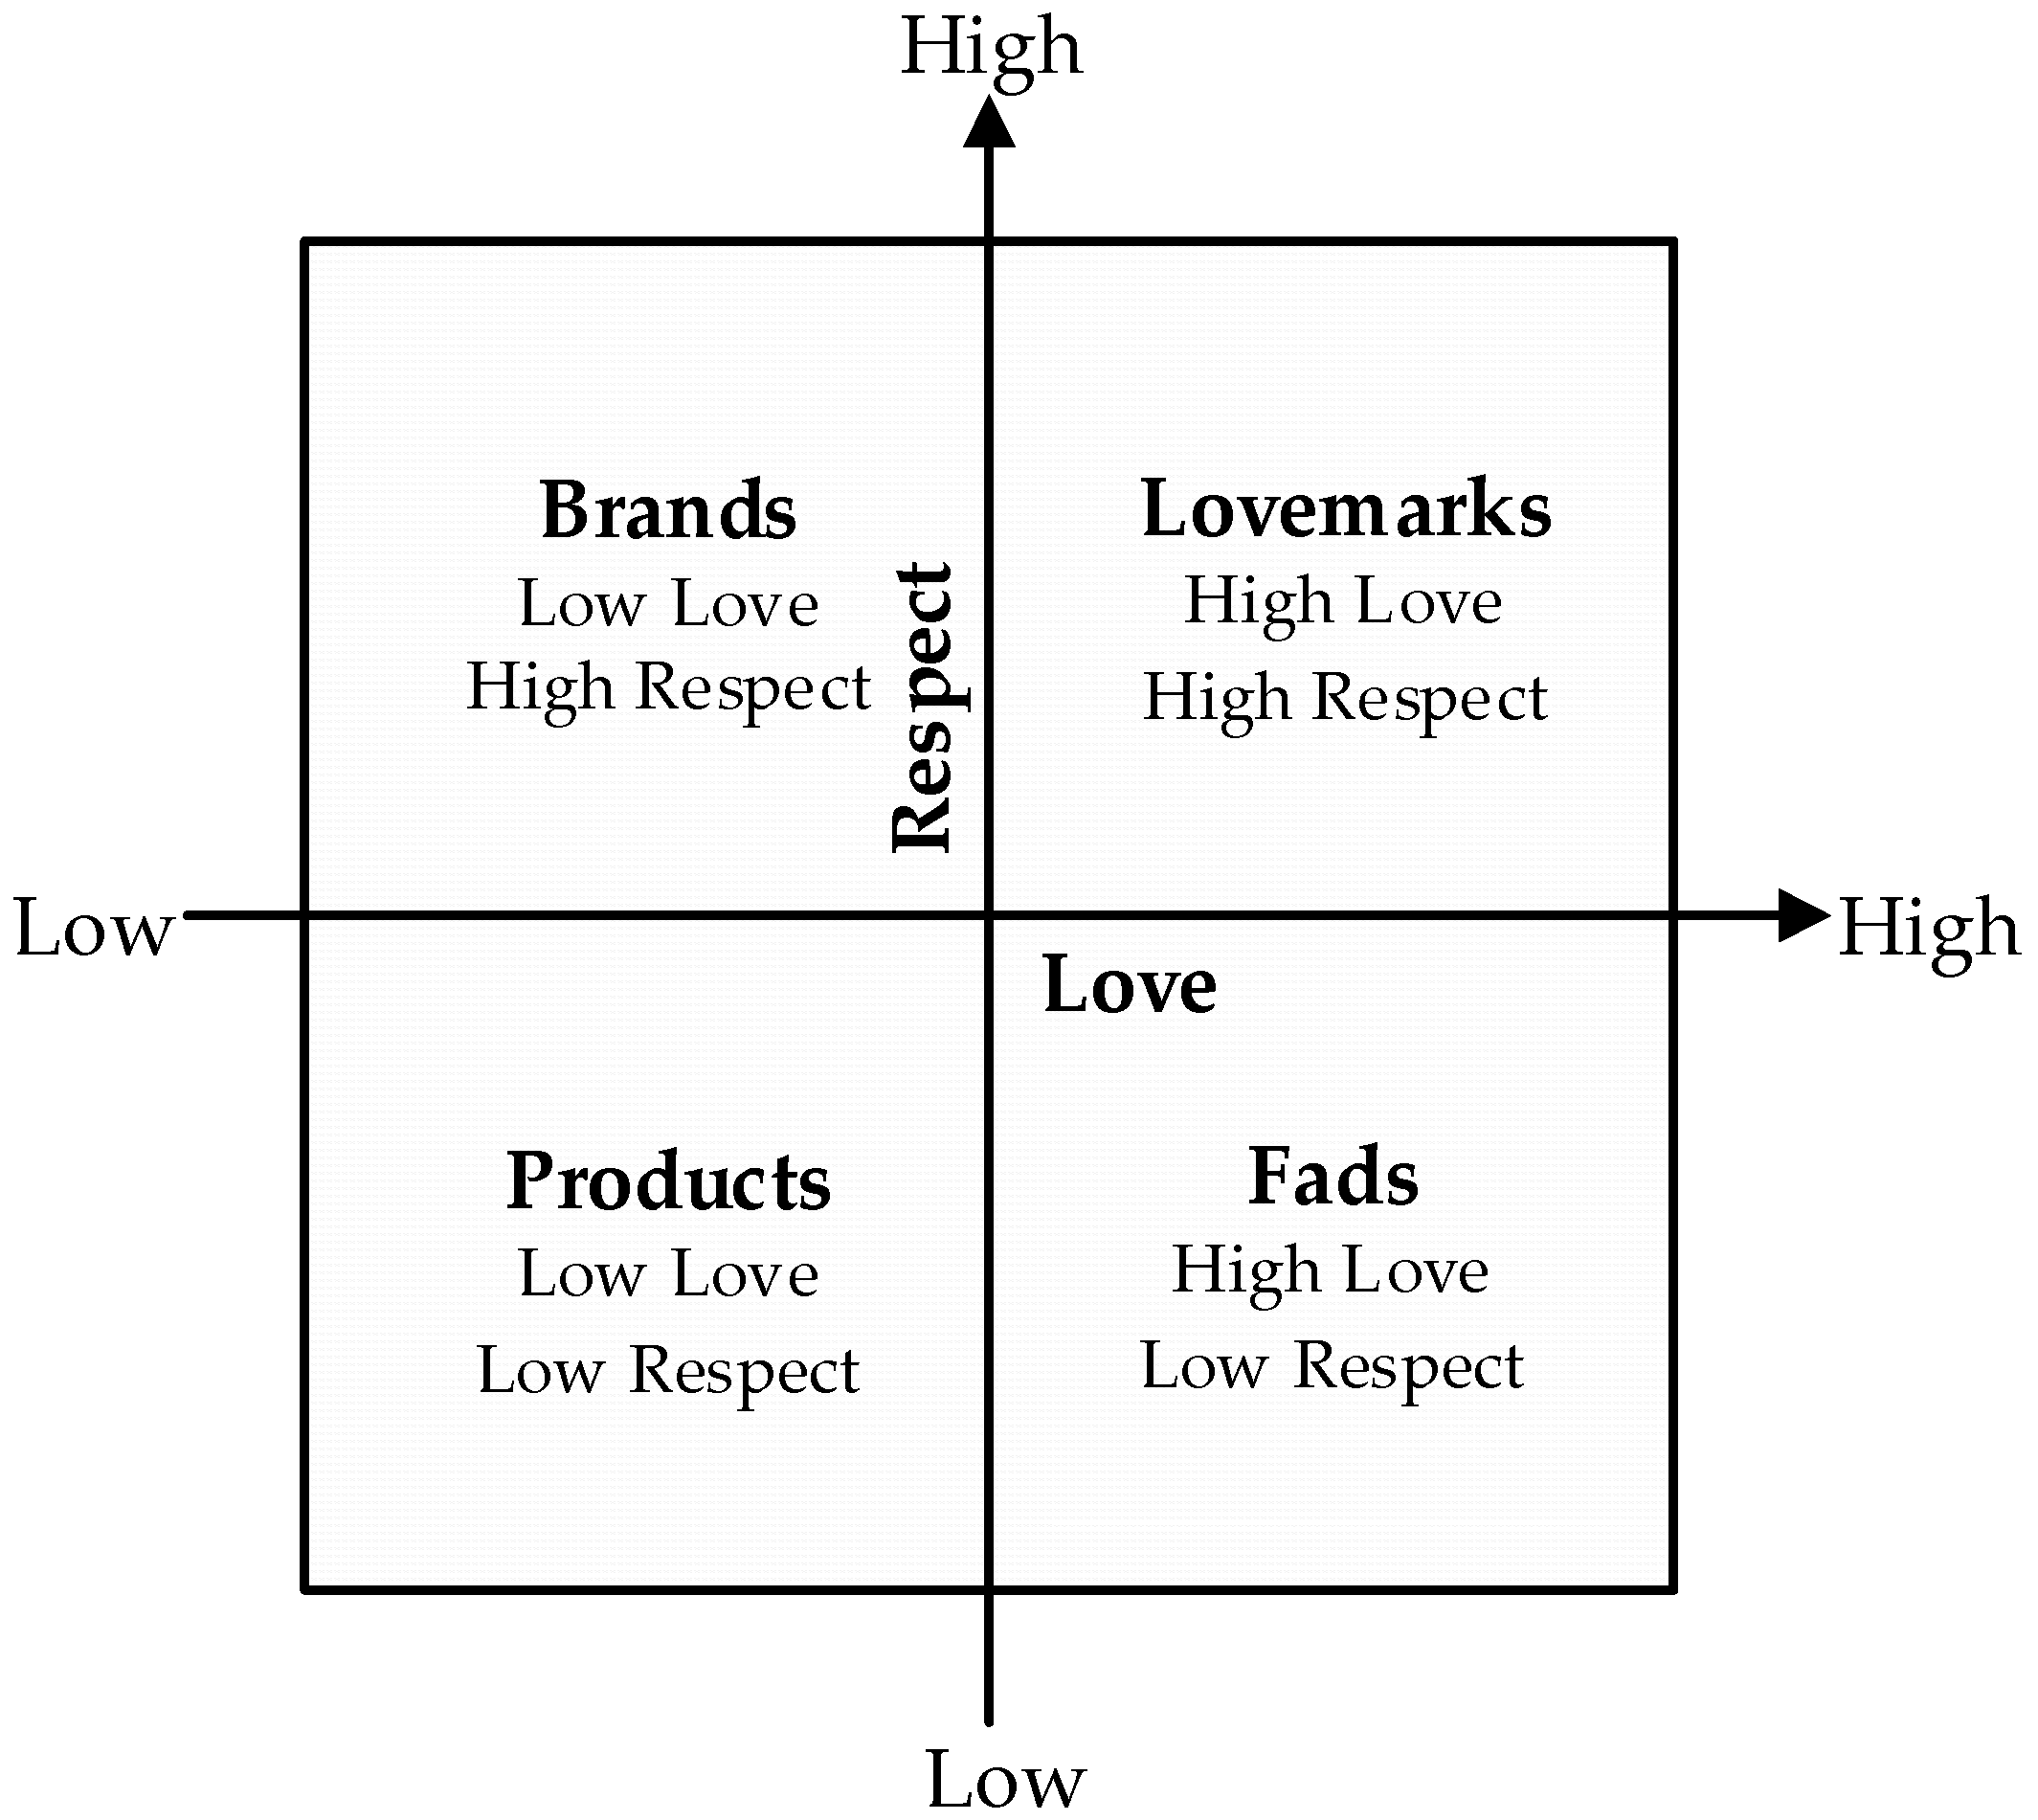
The concept of brand satisfaction and loyalty has been widely discussed in academic researches. Brand satisfaction has been regarded as a subjective evaluation result of whether the experience effect of the selected brand has reached or exceeded the expectation, and it can also refer to the overall evaluation of the purchase and consumption experience of the designated brand in a certain period of time [35,36]. Song et al. [15] believed that the core content of brand satisfaction is the consumers’ emotional evaluation or pleasure level of a specific brand in the mind. However, Baker and Crompton [37] suggested that brand satisfaction is a psychological and emotional result based on personal experience, regardless of whether psychological expectations can be achieved, but its level of evaluation will affect the success of the brand. As a whole, the mainstream concept of brand satisfaction is mainly based on the comparison between consumers’ actual product experience and expectation, emphasizing an individual’s mental activities in emotion.
Brand loyalty mainly refers to the consumer’s repeat purchasing behavior and commitment to the same brand (over time) [35]. It can also be refined into the positive and significantly tendentious emotions or evaluations on a brand [38]. Also, the induced cognition of buying a specific brand from this commitment will not vary even if the objective matter and market changes [39]. The core of brand loyalty is the loyalty level of consumers to the inclined brand in attitude and behavior when the existing favorite brand and other alternative brands exist together [40]. In this context, brand loyalty can be divided into attitudinal loyalty and behavioral loyalty, and the premise of behavioral loyalty is attitudinal loyalty. More specifically, attitudinal loyalty refers to an attitudinal tendency, which is the preference and repurchasing intention of a consumer for a specific brand [41]. Furthermore, behavioral loyalty refers to the consumer’s continuous, repetitive, and systematic purchasing behavior for a specific brand [41]. However, consumers with behavioral loyalty, which can be observed as the direct behaviors, may also be illusory because the repeat consumption may be limited by certain situations [42]. By emphasizing the intentions in an indirect approach, attitudinal loyalty can be operationalized as the repurchasing intentions to represent consumer’s authentic ideas regardless of the limited circumstances [42]. Therefore, the research on brand loyalty has developed a trend of exploration based on attitudinal loyalty (consumer’s behavior intention) by including different types of intentions, such as repurchasing (reuse) intention and recommendation (word-of-mouth) intention [43,44,45]. The repurchasing (reuse) intention refers to one’s judgement on purchasing (reusing) a specific brand of product or service again from the same firm based on his or her realistic status [46]. Furthermore, the recommendation (word-of-mouse) intention interprets customer’s willingness to disseminate a positive word-of-mouse [47]. In the context of tourism, as some tourism products and services (brands) are related to the tourism destinations (e.g., the “Cultural Heritage Night” is a night tourism brand but is held in different host cities), the expression of repurchasing intention is usually redefined as revisit intention to show the willingness of tourists to “reuse” the brand of tourism products generated from destinations [48,49]. Thus, in the current study, brand loyalty is used to represent tourist’s revisit and recommendation intentions to the “Cultural Heritage Night” in South Korea.
The positive relationship between brand satisfaction and loyalty has been widely discussed in prior studies. Bloemer and Kasper [35] demonstrated that the consumers’ satisfaction has a directly positive impact on their brand loyalty. Some empirical studies also regarded brand loyalty as the direct result of brand satisfaction, indicating that the brand satisfaction can contribute to a higher level of brand loyalty [50,51,52]. In the context of tourism, similar results have also been found. Drennan, Bianchi, Cacho-Elizondo, Louriero, Guibert, and Proud [53] found that among the five wine countries of origin, besides Portugal, the relationship between brand satisfaction and brand loyalty is significant and positive within the consumers from Australia, Chile, France, and Mexico. Also, the total effect of the wine brand satisfaction on brand loyalty is higher than other brand-related factors (brand trust and brand love). Nam, Ekinci, and Whyatt [54] explored a partial mediation model through brand equity, brand satisfaction, and brand loyalty in hospitality industry. Compared with the direct paths assessed by the predictors of brand equity, they found that brand satisfaction has the highest influence on hospitality consumer’s brand loyalty. Thus, it can be concluded that tourists’ brand satisfaction is a positive antecedent of their brand loyalty. The better the brand satisfaction perceived by tourists, the higher their level of brand loyalty will be [55,56,57]. Based on the findings above, the following hypotheses are proposed in the current study:
Hypothesis 1 (H1). 
Tourist’s brand satisfaction positively influences their brand loyalty.

2.3. Lovemarks

Lovemarks was initially proposed by Kevin Roberts, the president of a world-famous advertising firm named Saatchi and Saatchi. He argued that a brand that all eyes are fixed on should get brand love and brand respect from the consumers at the same time [22]. According to Roberts [22], brand love represented the consumer’s feeling and emotion to the brand (emotional attributes), including mystery (customer’s aspirations, goals, dreams, stories, and myths on a brand that are beyond rationality and calculation), sensuality (perceptions formed through consumer’s five senses: Sound, sight, smell, touch, and taste), and intimacy (the degree of commitment, empathy, and passion that consumers have on a brand). Further, brand respect refers to consumer’s perceptions of brand function and performance (functional attributes), including performance (market share, brand value, and the innovation and superiority of brand quality) [16,58], reputation (the actual degree of commitment fulfilling a brand has provided to consumers) [58], and trust (consumer’s sense of security in the process of interacting with a brand) [59]. Although the lovemarks express the intense feelings of the consumer for a specific brand, the premise of brand love is brand respect since it is the basis for maintaining a long-term relationship [22,60]. Without brand respect, brand love will be unrealistic [19]. The theory of lovemarks explains why consumers are attached and loyal to a specific brand rather than other ones because their loyalty will go beyond reason when they have love and respect for the brand [60].
Based on the degree of brand respect and brand love recognized by consumers, Roberts [22] redefined four types of the brand: Lovemarks, brands, products, and fads (as shown in Figure 1). The area of lovemarks refers to the brands with high respect and love, which contributes to building the most reliable brand loyalty of, and long-term emotional bonds with, consumers. Then, the area of brands indicates brands with low love but high respect, which is beneficial to make a certain degree of brand loyalty but may fail to facilitate consumers to have emotional connections with the brand. Furthermore, the brands in the area of fads are with high love but low respect, which leads to an unstable level of brand loyalty because the brand may withdraw from the market if a consumer’s enthusiasm is fading. Finally, the brands in the area with low love and low respect can only be called “products,” which means a weak brand loyalty between consumers and brands. In the context of these types of brands, Song et al. [58] argued that it is undoubtful that Apple (e.g., iPhone, iPad) is a lovemark because consumers have great passions and phrases for its products. However, compared to Apple, Lenovo computers can only be attributed to the area of brands because they just have admired quality and hardware but fail to win enough passion from consumers. Therefore, it is obvious that consumers with a higher level of brand love and respect can have greater emotions and cognitions on the brand. In the current study, the case of “Cultural Heritage Night” can be regarded as a successful brand of lovemarks in the night tourism and festival fields in South Korea (discussed in Introduction). As a national night tourism brand, the content of “Cultural Heritage Night” contains many famous world/nationwide cultural heritages and various recreational activities, providing a historical and enjoyable atmosphere for tourists to experience all along the year in different cities at night. On the one hand, the cultural heritages developed at night can make tourists generate more emotional feelings (e.g., memories for the country’s history, mysteries for the buildings, touched five senses by designed lights and activities, etc.). On the other hand, some World Heritage Sites can easily facilitate tourists to gain a high level of reputation and trust in them. Thus, it is necessary to explore how this night tourism brand forms tourist’s emotional and functional recognitions, and then, leads to a high level of brand loyalty.
As a high level of lovemarks means that consumers have a close emotional connection and good functional evaluation to a specific brand, their degree of satisfaction and loyalty to the brand will also be stimulated [58]. Lee and Oh [61] explored the relationship between lovemarks, satisfaction, and behavior intention of festival consumers from the perspective of strategic experiential modules and environmental cues. They found consumers with a high level of brand love and brand respect are more likely to get satisfied from the festival and generate repurchasing and recommendation intentions. In the context of the in-flight product, Han, Yu, and Lee [62] demonstrated that passengers’ brand love and respect are critical factors in building their behavioral intention in the full-service airline industry. Through a comparative perspective of the predictors (of lovemarks) between traditional media and new media communication in the field of the foodservice industry, Lee [63] argued that brand love and respect of lovemarks have a positive influence on customer’s satisfaction and behavior intention, respectively. Shuv-Ami, Vrontis, and Thrassou [64] developed a lovemarks scale for assessing a brand of sports team or club. They suggested that sports fans’ brand love and respect are positively related to their brand loyalty. Furthermore, by comparing the full-service and low-cost carriers in South Korea, Han, Yu, Chua, Lee, and Kim [65] found that brand love can significantly influence passengers’ repurchase intention (brand loyalty). Therefore, it could be concluded that the more customers feel love and respect from a brand, the higher their level of satisfaction and loyalty will be [15,58,66]. Hence, this study proposes the following hypotheses:
Hypothesis 2 (H2). 
Tourist’s lovemarks positively influences their brand satisfaction.
Hypothesis 3 (H3). 
Tourist’s lovemarks positively influences their brand loyalty.

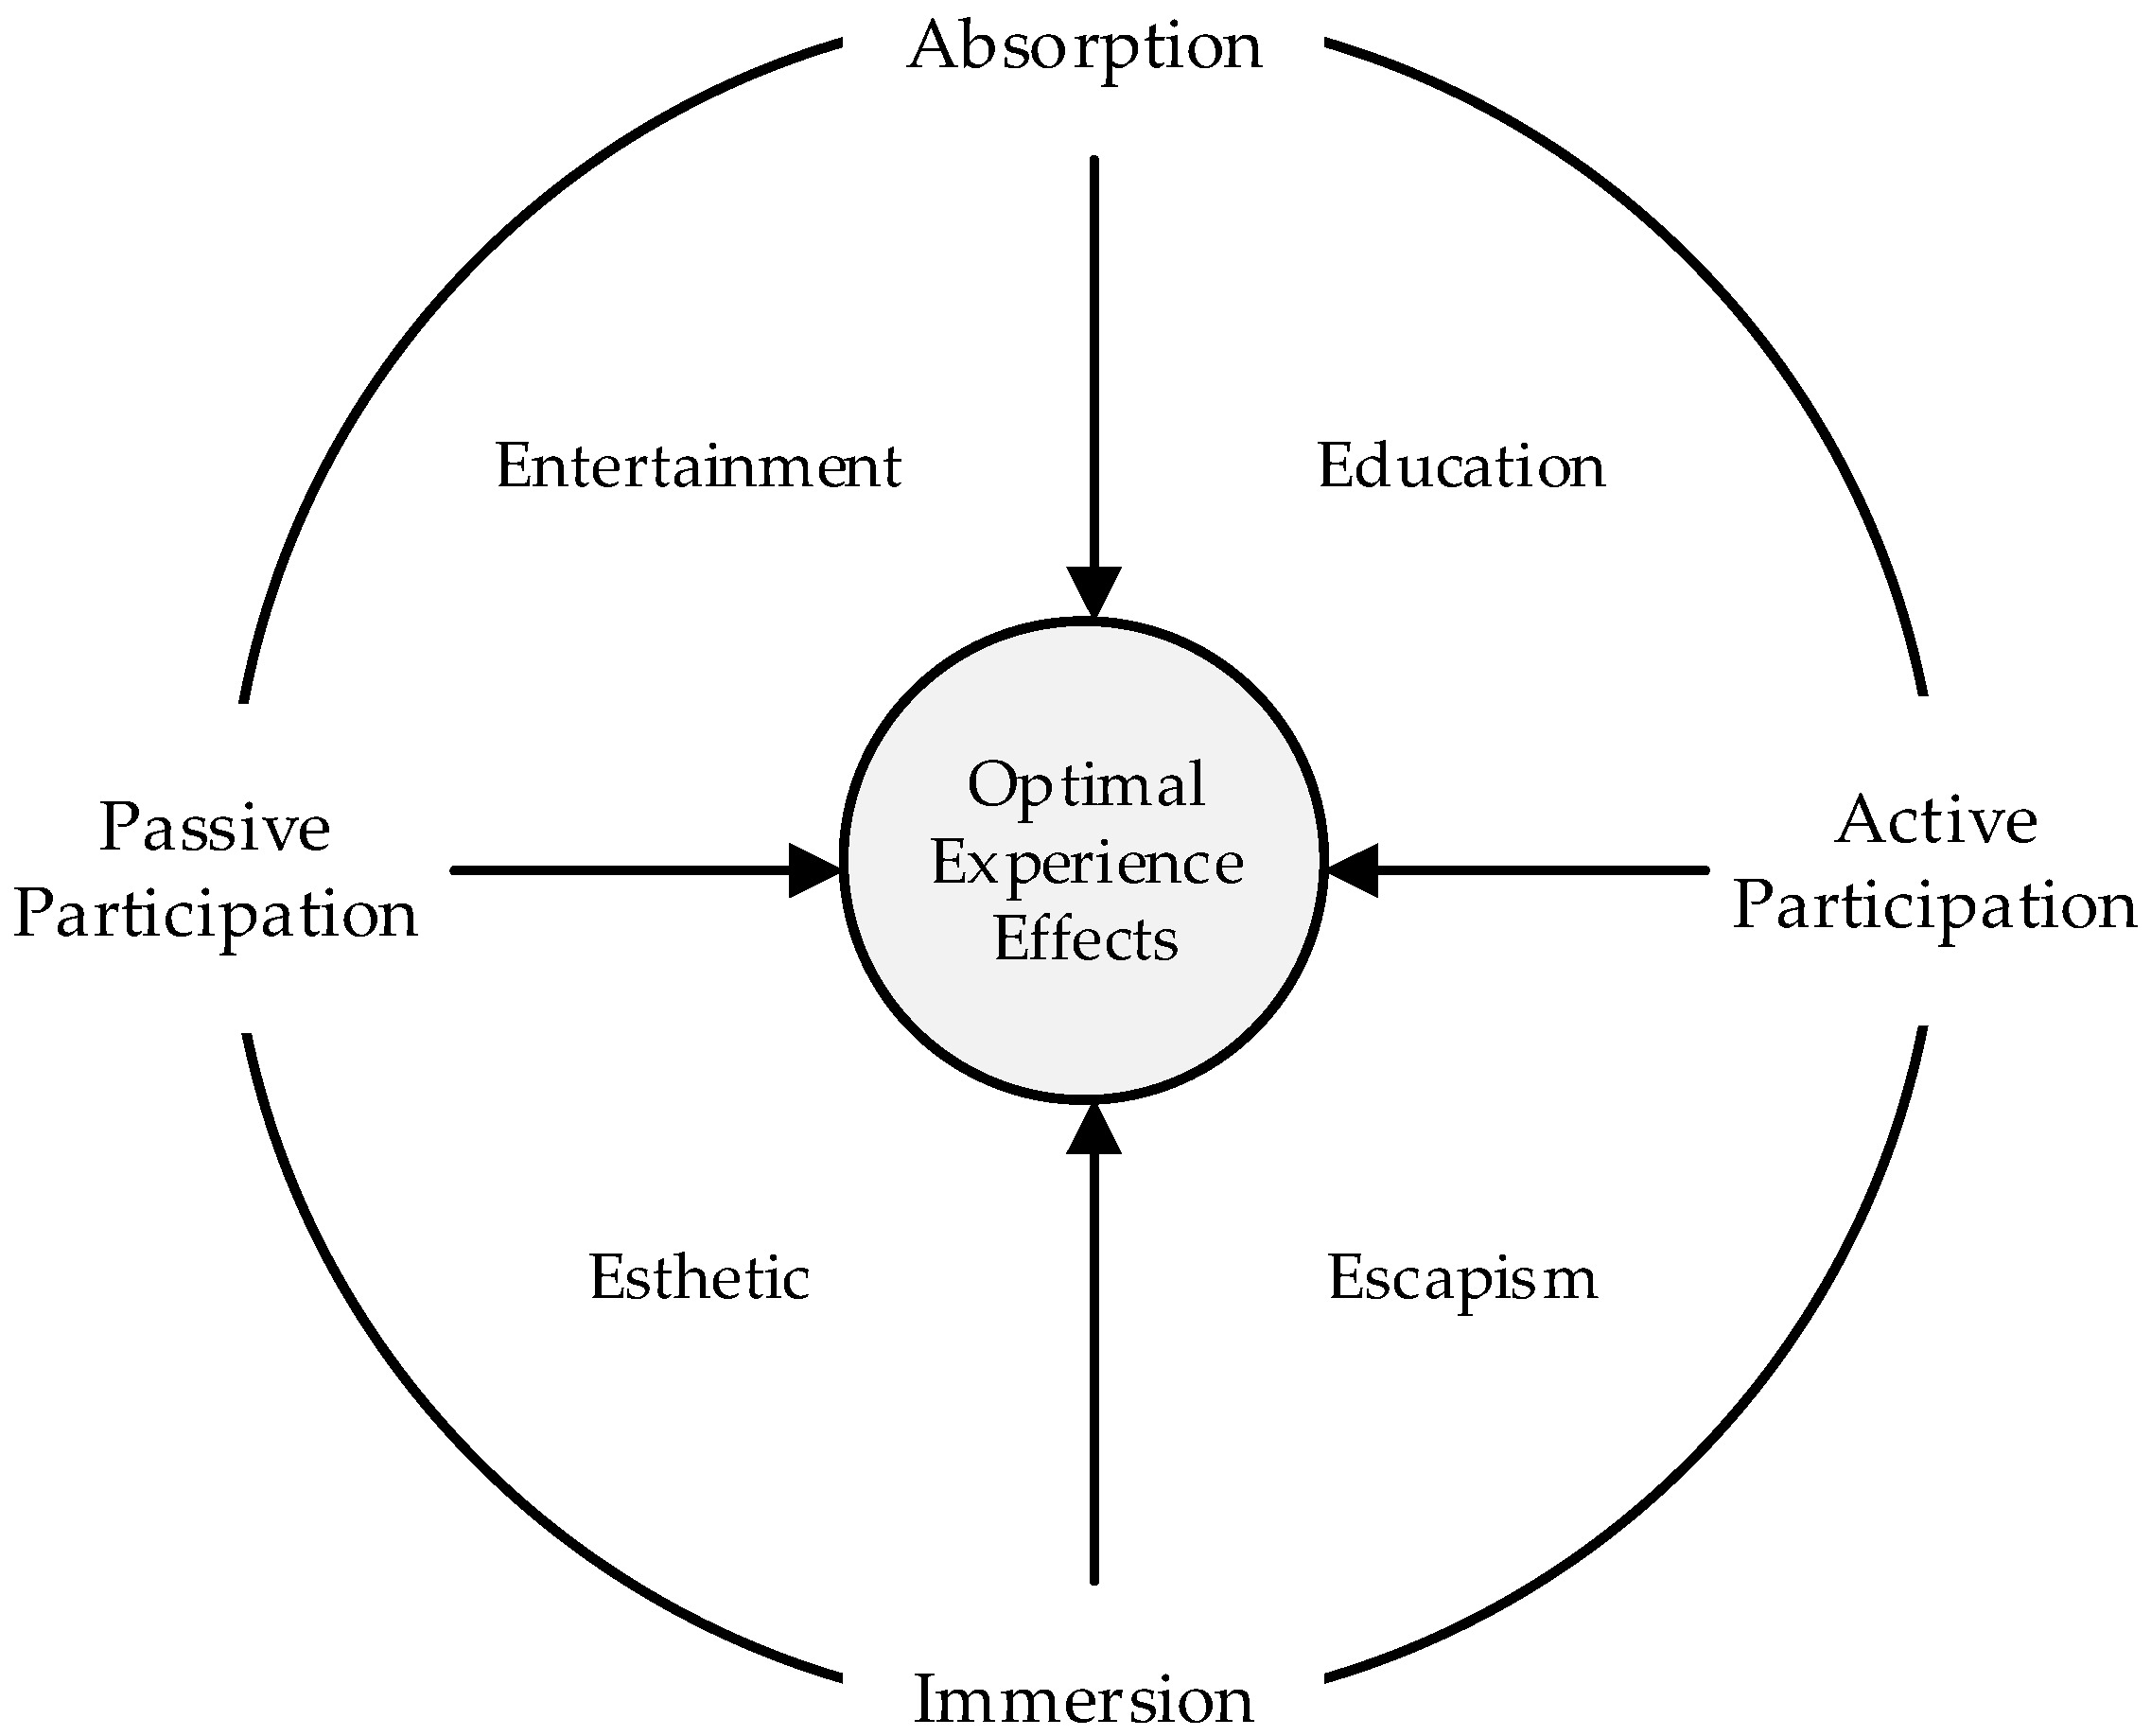
2.4. Tourism Experience
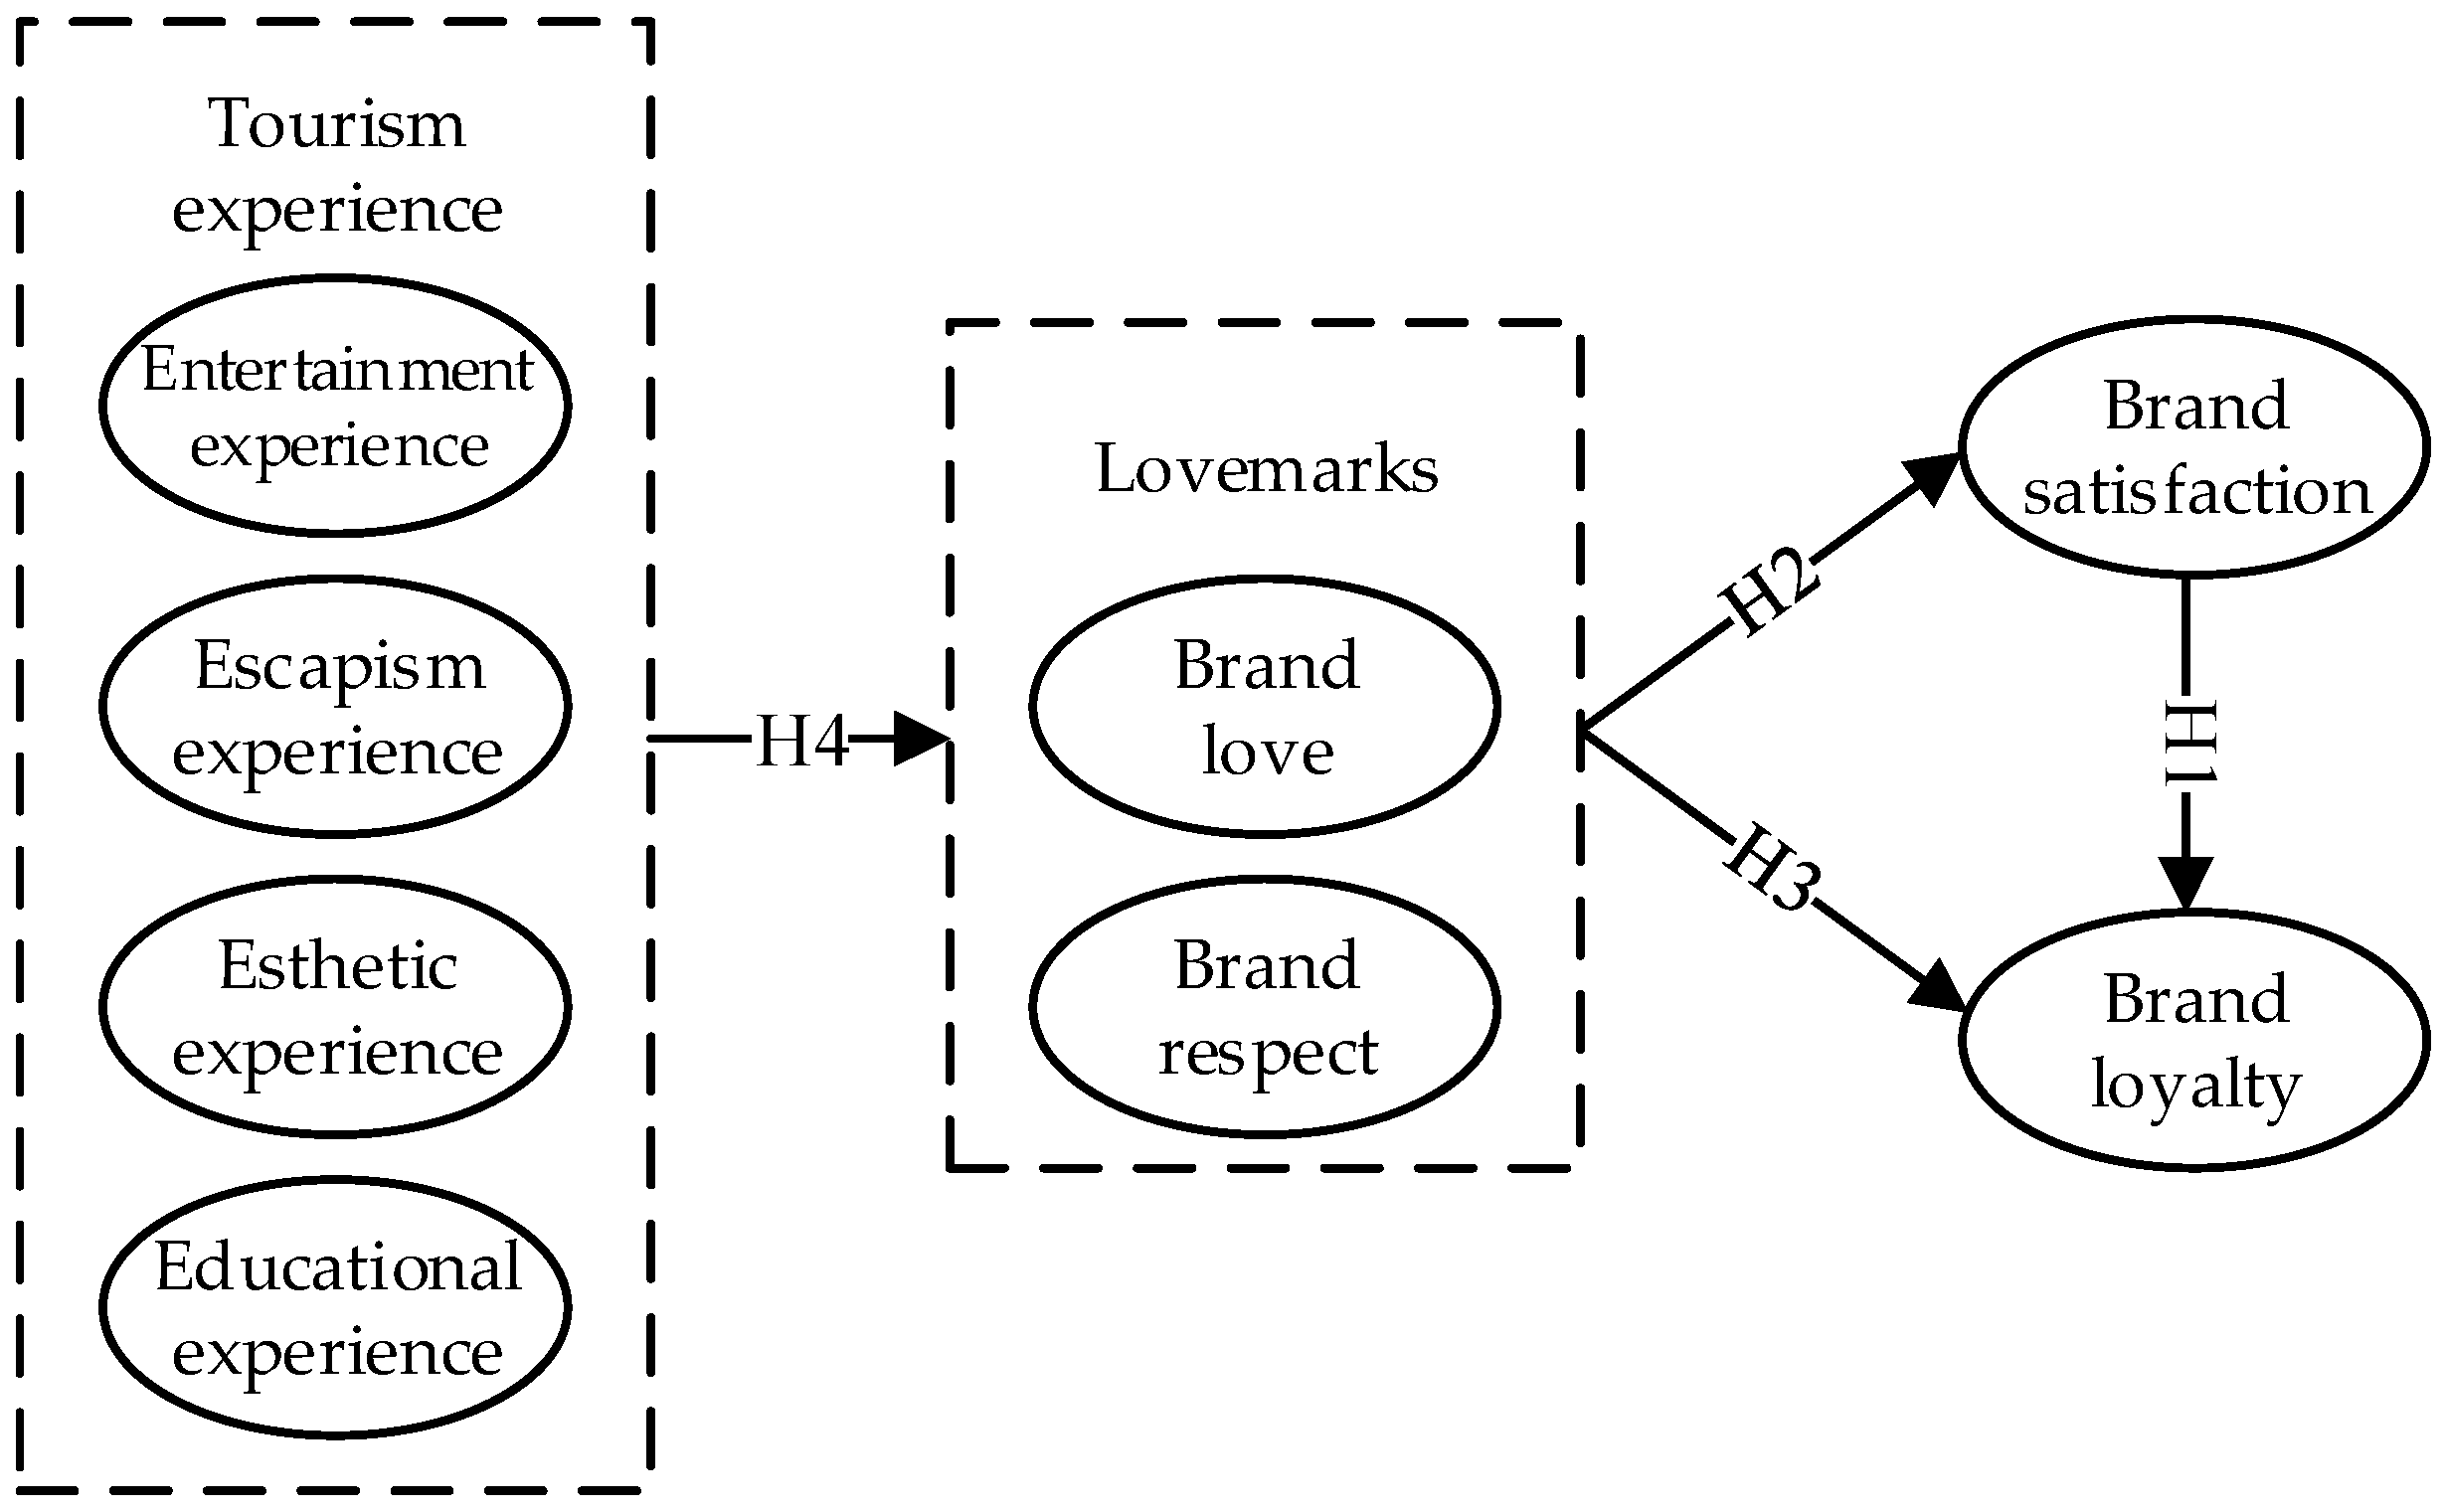
The most significant difference between tourism products and non-tourism products is whether consumers participate in the production process, which means that the production process of tourism products must be accompanied by a large number of tourists’ participation and experiences [67]. In the era of experience economy in which products and services no longer have the highest economic value, the most popular tourism products must be the one that can bring rich experience to tourists [68]. As the proponent of the experience economy concept, Pine and Gilmore [17] believed that experience occurs when the company intends to use services as a platform and commodities as props to attract consumers in a way that can create unforgettable memories in some specific events. Based on the theory of experience economy, Oh, Fiore, and Jeoung [69] argued that tourist’s participation level (active or passive) and participation form (absorption or immersion) could determine their distinct states of tourism experience (as shown in Figure 2): (1) From the perspective of their participation level when participation is more passive, tourists will get entertainment and esthetic experience, and when participation is more active, tourists will get education and escapism experience; from the perspective of participation form, tourists usually “absorb” entertainment and educational experience from tourism products, and immerse themselves in the aesthetic and escapism experience that tourism products bring to them. The “absorb” refers to attracting tourists’ attention by introducing experience into their minds, and the “immerse” means tourists themselves become part of the experience [70]. Relevant studies also showed that tourism experience would promote individuals’ strong and positive emotional responses, which is the reflection of individuals based on absorption and immersion experience [69,71,72]. Given this, entertainment experience, educational experience, aesthetic experience, and escapism experience are generally regarded as the four dimensions of tourism experience to explore the role and function of experience process between tourists and tourism activities [69,71,72,73].
Although the theory of tourism experience has been widely examined in the study of various types of tourism, the sufficient discussion of the relationship between tourism experience and tourist’s lovemarks is still lacking, especially in the aspect of night tourism brand and the experience economy theory. The empirical study of Zhang and Min [74] was the only one that proved the more and better tourists have entertainment, esthetics, and esthetic experience on the theme park, the higher their love and respect for the brand of the theme park will be. However, based on the brand experience theory of Brakus, Schmitt, and Zarantonello [75] (a similar and popular concept of experience in marketing studies which is classified into sensory, affective, behavioral, and intellectual experiences), some product marketing studies also indirectly explored the relationship between experience and brand love and brand trust. Huang [21] suggested that consumers’ experience on the mobile phone brand will directly affect their love and trust in the brand. Bıçakcıoğlu, İpek, and Bayraktaroğlu [76] also demonstrated that consumer’s brand experience can effectively predict their love for the brand. Although the indirect studies were originated from different experience theories, they all showed an individual’s stimulated reactions and specific experiences with a tangible product. Given this, this study argues that the more excellent tourism experience tourists generated from the night tourism product (brand), the more likely they will have love and respect for it. Therefore, this study proposes the following hypotheses:
Hypothesis 4 (H4). 
Tourism experience positively influences tourist’s lovemarks.
Based on the contents and relationships between brand satisfaction, brand loyalty, lovemarks, and tourism experience discussed above, the current study proposes the theoretical framework to explore the formation mechanism of night tourism brand loyalty (as shown in Figure 3).

3. Research Method

3.1. Case Study

As of 2019, there have been 27 cities and regions in South Korea listed in the brand of “Cultural Heritage Night,” and 36 cities and regions will compete for the supplementary quotas to be filled in 2020 [2,77]. As a large number of new cities and regions have joined in the past two years, it is difficult to measure the authentic evaluation of the “Cultural Heritage Night” by tourists who may have more “expectations” for new tourism activities in such a short period. Therefore, this study will only select more representative ones of the 10 cities and regions firstly listed in 2016 as the case studies. Specifically, according to the popularity of relevant cities and regions, the content of night tourism, and the utilization level of cultural heritage, the following four cities and regions are finally selected as the case studies (as shown in Table 1).

3.2. Questionnaire Development

Based on the requirements of DeVellis [78] and Churchill and Gilbert [79] on questionnaire development and dimension management, this study developed a self-administered questionnaire for empirical research on the relationship between brand loyalty, brand satisfaction, lovemarks, and tourism experience. The self-administered questionnaire consisted of five sections: Firstly, the tourism experience section, which had four dimensions (educational experience, entertainment experience, aesthetic experience, escapist experience) with 12 indicators, was adopted from the theory of experience economy and its application in empirical tourism studies to measure the immersion and absorption state of Korean tourists in the “Cultural Heritage Night” experience [17,69,70,71,72]. Secondly, the lovemarks section, which had two dimensions (brand love and brand respect) with 6 indicators, was adopted from the theory of lovemarks demonstrated by Roberts [22,60] to measure Korean tourists’ emotional connection with, and their evaluation of, functional performance on the “Cultural Heritage Night” after they experienced it [64,80]. Thirdly, the brand satisfaction section had 3 indicators adopted from Yoon et al. [55] and was developed to measure tourists’ brand satisfaction with “Cultural Heritage Night”. Fourthly, the brand loyalty section had 3 indicators adopted from to explore tourists’ intention to revisit, recommend, and give good word-of-mouth toward the “Cultural Heritage Night” [43,44]. Finally, the demographic profile section was composed of gender, age, occupation, marital status, education level, and monthly income level adopted from Song et al. [72]. In the first four sections, all the indicators were measured on a five-point Likert scale ranging from 1 = “strongly disagree” to 5 = “strongly agree.”

3.3. Sampling and Data Collection

A pilot study was conducted to ensure the quality of empirical research. Since the indicators in this study were all derived from English-speaking countries, and the self-administered questionnaire needed to be translated into Korean, we invited a Korean doctor who majored in leisure service at Pai Chai University (in South Korea) to translate the original English survey into Korean. Then, following the guidelines of the back-translation method [81], two Korean professors who majored in tourism management at Pai Chai University were invited to check whether the translation and terminology expressions of the Korean self-administered questionnaire were accurate. Then, on December 5, 2017, this study randomly selected 20 students from Pai Chai University, who had participated in the “Cultural Heritage Night” at Jeong-dong, Seoul, on October 28, 2017, for the pilot study with the revised self-administered questionnaire. Based on their feedback on language understanding, expression clarity, and the length of the survey, the self-administered questionnaire was revised again, and the final edition was prepared for the main study.
The main study was conducted at the selected four “Cultural Heritage Night” destinations (Buyeo County, Seoul, Jeonju, and Daegu) at different times in 2018 (see Table 1). One hundred and fifty questionnaires (a total of 600 questionnaires) were distributed to each destination. Furthermore, the investigators, who majored in leisure service at Pai Chai University, were all master and doctoral candidates with excellent Korean communication ability and relevant professional backgrounds. Finally, 523 samples were collected. After the elimination of invalid samples (respondents who gave the same evaluation (points) to all the indicators, or questionnaire existed missing values), 487 valid samples were retained. When using the structural equation model, it is suggested that acceptable sample size should be more than 400 if the population size exceeded 5000 [82], or each indicator matches at least 5–10 samples [83,84]. As the retained sample size was 487 (>400) and with 24 Likert styled indicators (487 > 24 × 10 = 240), the retained samples were acceptable for the subsequent process of data analysis.
Podsakoff, MacKenzie, Lee, and Podsakoff [85] a common method variance (CMV) might exist, especially in behavioral studies, when hypotheses between different operationalized constructs were discussed. The reason is that the antecedent variables of behavioral concepts often had similar contents. In this context, Podsakoff and Organ [86] recommended verifying the issue of CMV through Harman’s single factor test. Harman’s single factor test had been well examined in tourism studies [87,88]. The test is achieved by including all the constructs in one’s theoretical framework to have a non-rotated exploratory factor analysis (EFA). If the result of EFA has only one common factor or two or more common factors are found, and the rate of these common factors’ variance explained to account for more than 50%, CMV exists, and the theoretical framework should be revised [85,86,89]. In this study, after the non-rotated EFA, seven common factors (eigenvalues were all greater than 1) were extracted, and the variance explained of the first common factor accounted for 35.98% (less than 50%) of the accumulative extracted variance (out of 79.49%), indicating that there was no CMV issue within the theoretical framework and the data.

3.4. Data Analysis

In this study, Statistical Product and Service Solutions 24.0 (SPSS, IBM, Armonk, NY, USA) and Analysis of Moment Structures 24.0 (AMOS, IBM, Armonk, NY, USA) were used to analyze the data step by step. SPSS 24.0 was used to (1) analyze the respondents’ demographic profiles by using frequency analysis, (2) measure each construct’s internal consistency through the cutoff criteria of their Cronbach’s alpha values, (3) calculate the means of each construct by using descriptive analysis, and (4) examine the CMV by using EFA. Based on the two-step guidelines of the structural equation model (SEM) [90], AMOS 24.0 with maximum likelihood (ML) method was used to generate the necessary fit indices of measurement model (also known as the confirmatory factor analysis, CFA) and structural model. The reliability, convergent validity, and discriminant validity of the measurement model were tested through CFA. Finally, the path coefficients of each construct’s relationships were also tested under a 95% confidence interval.

4. Findings

4.1. Demographic Profile

The demographic profile of this empirical study is shown in Table 2. Among all the respondents who experienced “Cultural Heritage Night,” 50.9% of the respondents were male, and 49.1% were female. Around 25% of the respondents aged between 40 and 49, and 50 and 59, followed by the ages of 60 and above (19.5%), 20–29 (14.4%), and 30–39 (16.6%). Seventy-one percent of the respondents were married, and 58.5% were undergraduate students. Nearly half of the respondents were office staff, followed by housewife (14.4%) and professional/technicians (8.0%). Further, 20.9% of the respondents had a monthly income of ₩2 - 2.99 million, followed by ₩3—3.99 million (20.2%), ₩4—4.99 million (14.6%), and ₩1—1.99 million (12.5%).

4.2. Measurement Model

In SEM, it is suggested that the normality assumption should be examined before the measurement and structural model [91]. If the Mardia’s normalized coefficient of multivariate normality, which is represented as multivariate kurtosis in AMOS, is lower than 5, the normality assumption is not violated. However, through the calculation of AMOS 24.0, the multivariate kurtosis of the current study was 53.787 (>5), indicating a multivariate non-normal distribution. In AMOS, Hancock and Liu [92] suggested that the bootstrap method is good at managing non-normal distribution in the estimation of measurement and structural model. They argued that the bootstrap method could re-estimate the standardized errors (Boot SE) of each parameter by fixing all the paths of pairs of variables. It was also suggested that the bootstrap ML (maximum likelihood) and bias-corrected 95% confidence intervals (CI) should also be applied in the bootstrap method in AMOS [91,93,94]. Additionally, based on some tourism studies using the bootstrap method [88,95,96,97], the current study chose 10,000 resamples for the bootstrap method.
The results of the fit indices indicated that all the indicators corresponded well to the construct to which they belong. The external fitness of the measurement model was acceptable with Chi-square (χ2) = 427.343, degree of freedom (df) = 224, p < 0.05, χ2/df = 1.908 (<3), Root Mean Square Residual (RMR) = 0.027 (<0.05), Goodness of Fit Index (GFI) = 0.932 (>0.9), Normed Fit Index (NFI) = 0.952 (>0.9), Tucker-Lewis Index (TLI) = 0.971 (>0.9), Comparative Fit Index (CFI) = 0.976 (>0.9), Root Mean Square Error of Approximation (RMSEA) = 0.043 (<0.08) [84,98,99,100]. As shown in Table 3, except for the first indicator of brand respect (0.577 and 0.332), all the factor loadings and squared multiple correlations (SMC) of for each construct’s indicator were higher than 0.7 (ranging from 0.740 to 0.934) and 0.5 (ranging from 0.548 to 0.873), respectively, showing the convergence of each indicator was well formed on its construct [84].
The convergent validity was also examined through average variance extracted (AVE), Cronbach’s α, and composite reliability (CR). As shown in Table 4, all of the AVE values (along the diagonal) of each construct exceeded 0.5 (ranging from 0.519 to 0.816), indicating the good average amount of variance in indicators that each construct tried to specify [101]. All of the Cronbach’s α values of each construct were high than 0.7, showing good reliability [102]. Then, all of the CR values of each construct also exceeded 0.6 (ranging from 0.761 to 0.930), indicating the good internal consistency of each construct [103,104]. Therefore, the convergent validity had been well verified by the approaches of factor loadings, AVE, and CR. The discriminant validity was then identified by comparing the AVE and the Squared Inter-construct Correlation coefficients (SIC) of the pairs of constructs [105]. All the AVE values (along the diagonal) were higher than SIC values (outside the parenthesis and above the diagonal), showing a tenable discriminant validity.

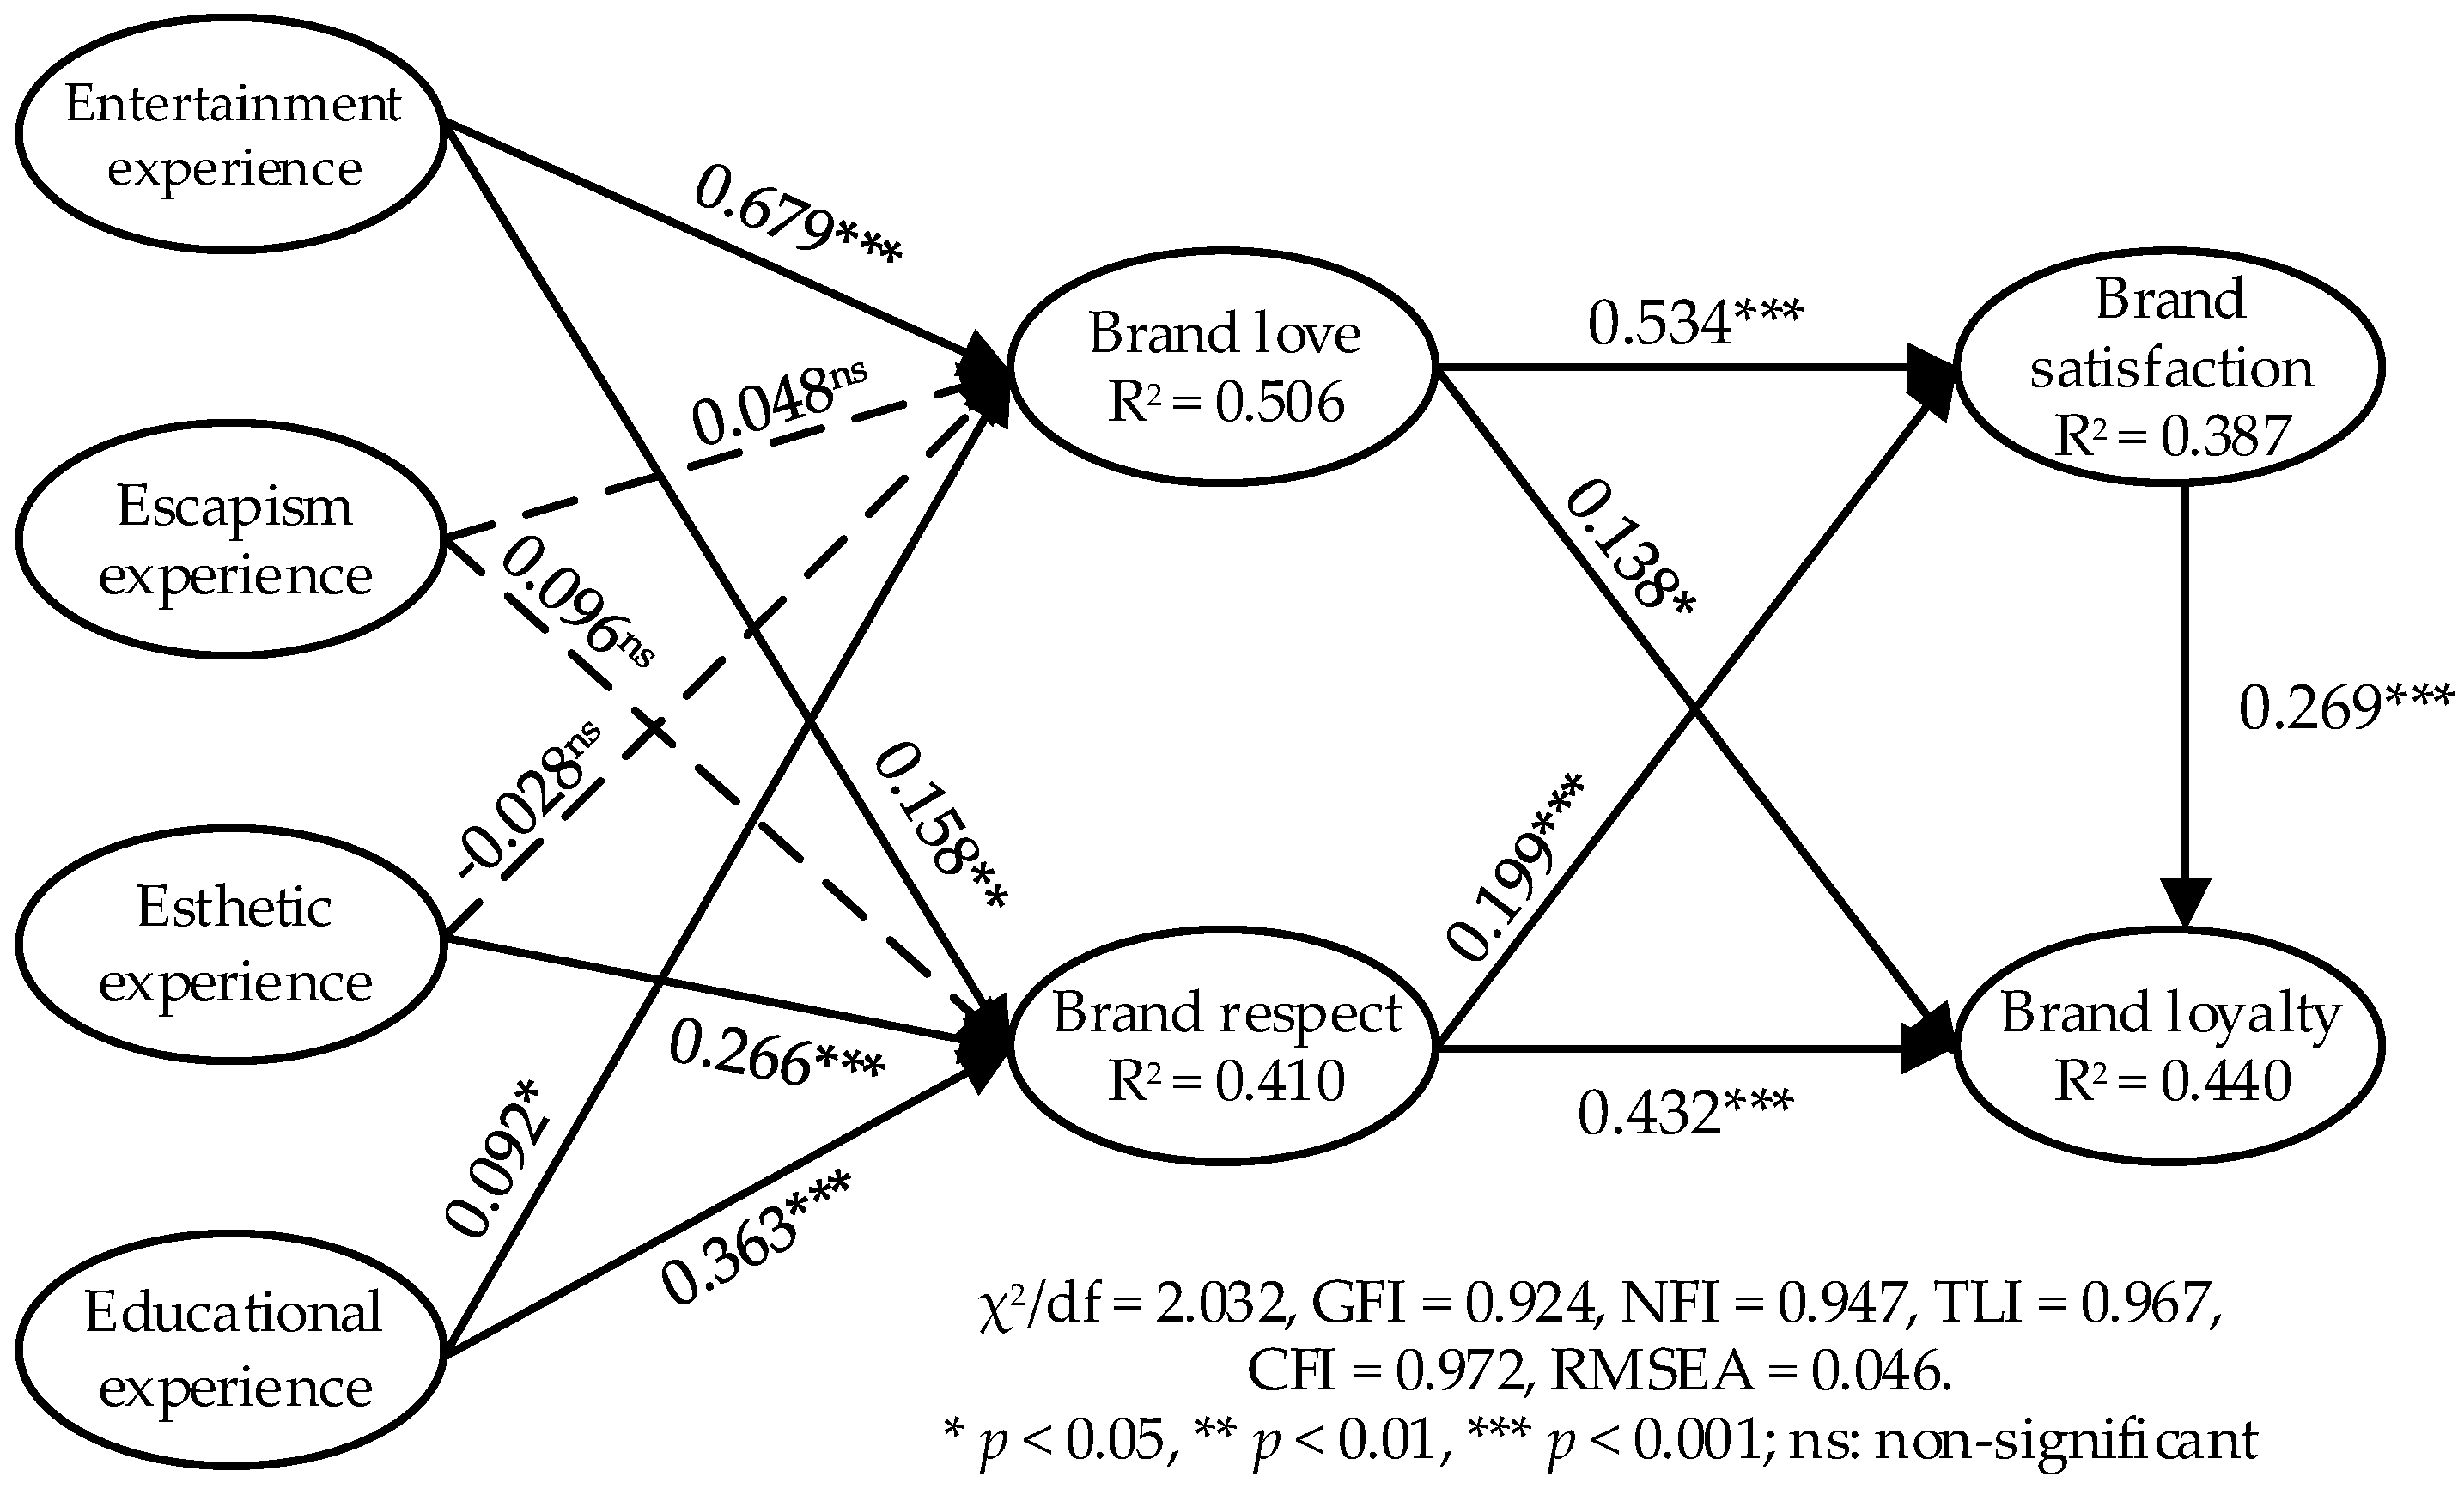
4.3. Structural Model

Based on the validated measurement model, the structural model was estimated by the maximum likelihood approach and bias-corrected percentile method through bootstrap resamples (N = 10,000) in AMOS [92,94]. The fit indices of the structural model were tenable with χ2 = 473.572, df = 233, p < 0.05, χ2/df = 2.032 (<3), RMR = 0.032 (<0.05), GFI = 0.924 (>0.9), NFI = 0.947 (>0.9), TLI = 0.967 (>0.9), CFI = 0.972 (>0.9), RMSEA = 0.046 (<0.08) [84,98,99,100], indicating a good fitness between the collected sample and the proposed conceptual model. The structural model explained 50.6%, 41.0%, 38.7%, and 44.0% of the variance in brand love, brand respect, brand satisfaction, and brand loyalty, respectively.
As shown in Table 5, 13 sub-hypotheses were supported, whereas 3 sub-hypotheses (H4–2, H4-3, H5-2) were rejected. Furthermore, the final structural model was concluded in Figure 4. In the relationship between brand satisfaction and brand loyalty (H1), brand satisfaction positively and significantly influenced brand loyalty, supporting H1 (βBS→BLY = 0.269 ***, SE Boot = 0.072, p < 0.001). In the relationship between lovemarks and brand satisfaction and brand loyalty, tourists’ brand love and brand respect positively and significantly influenced their brand satisfaction and brand loyalty, respectively, providing support for H2-1 (βBL→BS = 0.534 ***, SE Boot = 0.045, p < 0.001), H2-2 (βBR→BS = 0.199 ***, SE Boot = 0.057, p < 0.001), H3-1 (βBL→BLY = 0.138 *, SE Boot = 0.059, p < 0.05), H3-2 (βBR→BLY = 0.432 ***, SE Boot = 0.058, p < 0.001). In the relationship between tourism experience and lovemarks, tourism experience had partial influence on lovemarks. Specifically, among the four dimensions of experience, only tourists’ entertainment experience and educational experience positively, and significantly influenced their brand love, supporting H4-1 (βENTE→BL = 0.679 ***, SE Boot = 0.051, p < 0.001) and H4-4 (βEDUE→BL = 0.092 *, SE Boot = 0.046, p < 0.05), with H4-2 (βESCE→BL = 0.048, SE Boot = 0.055, p > 0.05) and H4-3 (βESTE→BL = − 0.028, SE Boot = 0.058, p > 0.05) being rejected. Furthermore, only escapism experience failed to significantly influence brand respect, rejecting H5-2 (βESCE→BR = 0.096, SE Boot = 0.064, p > 0.05), with H5-1 (βENTE→BR = 0.158 **, SE Boot = 0.059, p < 0.01), H5-3 (βESTE→BR = 0.266, SE Boot = 0.062, p < 0.001), and H5-4 (βEDUE→BR = 0.363 ***, SE Boot = 0.057, p < 0.001) being supported. Additionally, this study also found that brand satisfaction had a significant indirect effect on the relationship between lovemarks and brand loyalty.

5. Conclusions

In the era of the experience economy, consumers have shifted from consumption of products or services to emotional and perceptual experience of products [17,70]. As an emerging element of the experience economy, the night-time economy (NTE) is gradually becoming a new tool for cities to promote sustainable urban development [6,7]. Also, as a new tourism trend, night tourism plays an important role in realizing the prosperity of the night economy. Although night tourism can further activate the experience economy and the NTE, little research attention has been paid to the related topics. Given this, based on the theory of experience economy and the night tourism brand “Cultural Heritage Night” in South Korea, the current study used the concept of lovemarks as the emotional and cognitive response to night tourism experiences. It then explored how tourists could generate brand satisfaction and brand loyalty through these tourism experiences and lovemarks.

5.1. Theoretical Implications

The findings are partially consistent with prior studies that tourism experience could positively influence tourists’ lovemarks [74]. Among the four dimensions of tourism experience, entertainment experience had the most substantial influence on brand love (β = 0.679), and educational experience had the strongest influence on brand respect (β = 0.363). The findings indicated that the more entertainment and educational experience tourists could generate from the “Cultural Heritage Night,” the more likely they would love and respect the night tourism brand. However, contrary to the findings of Zhang and Min [74], they found that educational experience could not influence tourists’ lovemarks. The possible explanation for this could be related to the research object. As their study focused on the theme park’s brand in South Korea, it paid more attention to its entertainment attribute. Furthermore, generally, the educational experience is not the core content in a theme park, while the “Cultural Heritage Night” in this study is composed of various traditional cultural heritages in South Korea. As cultural heritage is often entirely educational and enriches the tourist’s sense of cultural satisfaction and identity [106], the educational experience should play an essential role in building tourists’ emotional and cognitive responses.
Furthermore, escapism experience was found to be not related to the two dimensions of lovemarks. The possible explanation for the non-significant relationship between escapism experience and lovemarks could be referred to as another similar study that focused on the Incheon Asian Games researched by Song et al. [72]. They argued that the reason that tourist’s escapism experience does not significantly influence their emotional perceptions might be related to the seemingly close to life Asian Games. Since South Korea has hosted a large number of international events, the Asian Games is not something far from the realm of everyday life, which reduces the effect of the respondents’ sense of escapism experience. Similarly, for a long time, South Korea has attached great importance to the protection and development of cultural heritage, and the location of “Cultural Heritage Night” in selected cities is mainly based on the cultural heritage in urban blocks, so these heritages are not unfamiliar to night tourism tourists who are mainly dwellers. Additionally, interestingly, there was no significant influence of esthetic experience on brand love. The possible explanation can be attributed to the theory of the experience economy. In this context, tourists’ esthetic experience on “Cultural Heritage Night” is a passive immersion. As the experience of night tourism is short-lived, an esthetic experience that is passive and requires immersion is difficult to generate sufficient mystery, sensuality, and intimacy (emotions within brand love) for night tourism brands without initiative and time.
Findings also suggested that brand love and brand respect, derived from lovemarks, were the positive driving factors of brand satisfaction and brand loyalty. Within the two dimensions of lovemarks, brand love had a higher influence on brand satisfaction (β = 0.534), while brand respect had a better influence on brand loyalty (β = 0.432). These results are in line with the findings of Lee and Oh [61] that the brand love and brand respect of catering product consumers positively influence their brand satisfaction and the conclusions of Giovanis and Athanasopoulou [42] and Han et al. [62] that consumers’ brand love and brand respect could positively shape their brand loyalty. The findings above show that when tourists make a proper evaluation of the night tourism brand (after they experience it), which can be composed of feeling and emotion (brand love), and function and performance (brand respect), their level of satisfaction with, their recommendation intention and repurchase intention to, and word-of-mouth on the night tourism brand will be enhanced.
Brand satisfaction was found to be directly and indirectly related to brand loyalty. Consistent with prior studies [35,50,55], tourists’ brand satisfaction can actively promote the formation of brand loyalty (β = 0.269). Furthermore, brand satisfaction can also be an indirect construct to provide additional paths between brand loyalty and brand love (β = 0.144) and brand respect (β = 0.054), respectively. The results are consistent with Lee [63] that for the brands of new and old media, the influences of consumers’ brand love and brand respect on brand loyalty can be indirectly achieved through brand satisfaction. These results indicate that tourists with a high level of brand satisfaction will also show excellent brand loyalty. Furthermore, tourists’ brand love and brand respect for night tourism brand can contribute to their brand loyalty through brand satisfaction.
In summary, the theoretical contributions in this study are concluded as follows: Firstly, although NTE is a hotspot in worldwide society, little attention has been paid to the research field, especially in the field of tourism management. The current study fills this research gap by conducting an empirical study on a national night tourism brand (“Cultural Heritage Night”) in South Korea. Secondly, based on the theory of experience economy and lovemarks, our findings contribute to understanding how and why tourists’ brand loyalty is generated in night tourism activities by including the structural relationships between tourism experience, lovemarks, brand satisfaction, and brand loyalty. Thirdly, this study is a response to calls for considering consumers’ emotions in determining their decision-making process [58]. As a concept for showing consumers’ love and respect for a brand (product), lovemarks has yet to be discussed in the relationships between experience, brand satisfaction, and brand loyalty in the field of night tourism and its related brand. The findings in this study emphasized that lovemarks plays a decisive role in shaping tourists’ night tourism decision-making. Fourthly, night tourism has been seen as a new booster for the sustainable development of modern cities, as it extends the “service” hours of destination cities. The revitalization of cultural heritage also provides new ways of transmission and continuity for sustainable urban development. This study provides a logical analysis process for enhancing tourists’ emotions (brand love), identification (brand respect and brand satisfaction), and adhesion (brand loyalty) on night tourism products by investigating a cultural-heritage-themed night tourism brand. It adds theoretical support for further expanding the boundaries of the concept of sustainable development.

5.2. Managerial Implications

Based on the above theoretical findings, some policy recommendations are suggested to enhance tourists’ lovemarks, brand satisfaction, and brand loyalty on the night tourism brand (product). First of all, in the management process of night tourism products, especially for the cultural-heritage-themed ones, it should be noted that lovemarks mainly contain emotions (brand love) and cognitions (brand respect). Destination managers should know the actual level of tourists’ various cognitions (e.g., trust, performance, and reputation) and emotions (e.g., sensuality, mystery, and intimacy) of night tour brands well through regular visits and surveys to improve the quality of, and ensure the sustainable development of, night tourism brands (products). For example, the Cultural Heritage Administration of South Korea has designed eight sections to enhance the sensuality, intimacy, and performance of “Cultural Heritage Night,” including night scenery, night road, night history, night book, night talk, night food, night market, and night stay [1].
Furthermore, destination managers need to understand the four dimensions of tourism experience under the experience economy. The findings suggest that tourists’ entertainment experience and educational experience positively influence their lovemarks (both brand love and brand respect), and the influence of esthetic experience on brand respect is also examined. Therefore, more attention should be paid to product polishing in the aspects of entertainment, esthetic, and educational. For example, among the four selected “Cultural Heritage Night” cases in this study, activities related to Korean history and the national independence movement have achieved an excellent educational experience. Hanbok Experience, Cross-cultural Experience, and Handicraft Making have generated entertainment experience. Also, the Cherry Blossom Night Walk, Light Show, and Architectural Lantern Tourism also lead to esthetic experience. For night tourism destinations with cultural heritage resources, the appropriate use of the relevant type and content of the tourism sites will contribute to the generation of the tourism experience.
Additionally, destination managers of night tourism brand (product) should mainly focus on two aspects to establish a stable brand loyalty owned by tourists. The first aspect is to build high-quality brand loyalty by activating good lovemarks. For example, local authorities can embed heritage conservation and practical education in night tourism activities with cultural themes. In this way, essential knowledge for protecting these cultural (heritage) sites can be promoted for the public. Furthermore, based on big data technology, some travel technology companies can make efforts to collect tourists’ behavioral preferences of night tourism (under the premise of legality) through highly participatory experiential activities (e.g., bonus, such as coupons or small gifts, can be prepared for tourists to stimulate their participation), which can not only deepen the emotional connections between tourists and night tourism brand, but also serve as the basis for improving the content of a product. The other aspect is to realize the promotion effect of tourists’ lovemarks on their brand loyalty through brand satisfaction since the findings show that brand satisfaction plays an indirect role in the relationship between lovemarks and brand loyalty. For example, destination managers can use popular social media tools, such as TikTok and Instagram, to promote night tourism activities. Creating relevant topics to increase the audience’s interest can also be a valid option. The interaction and participation between tourists and night tourism brands can be increased to improve their overall satisfaction on night tourism, indirectly contributing to brand loyalty.
Although night tourism is now widely discussed and embraced around the world (e.g., Festival of Lights in Lyon, France (Fête des Lumières), Pink Night in Romagna, Italy), well-known night tourism brands are relatively rare. The “Cultural Heritage Night” in this study can be seen as an emerging brand of night tourism focused on cultural heritage sites. The findings of this study shed light on countries and cities with cultural heritages that are interested in developing night tourism. More importantly, the process and approach in which the night tourism brand (the “Cultural Heritage Night”) is developed are critical for the sustainable development of the tourism destination. The United Nations, Educational, Scientific, and Cultural Organization (UNESCO) argued that if appropriately managed, world heritage properties, which are important travel destinations, have significant potential impact for local economic development and long-term sustainability [107]. Furthermore, night tourism offers heritages the ability to present heritage properties, and also a means to realize community benefits through sustainable use [108]. In the context of these relationships between heritage and sustainable tourism, the sustainability of night tourism is proven by three aspects. First of all, these cultural heritage sites are less expensive to revitalize and use at night. For example, the cultural heritage sites in this study are also regular tourism sites during the day. The development of night tourism only requires visitors to daily tourist sites by installing lights or using the existing urban lighting system in the surrounding area. It not only extends the service hours of the tourism sites, but also expands the economic benefits, which makes the tourism sites sustainable over time. Furthermore, the development of night tourism is also vital for the destination’s social, cultural, and environmental sustainability. For destination societies, night tourism provides new leisure and recreational options for residents and tourists, furthering their experience of a better life and contributing to the enhancement of the city’s image. In the context of cultural sustainability, the essence of night tourism development is the revitalization of cultural heritage, contributing to its preservation, education, and transmission. These benefits can be proven by the proper evaluation (mean values) of tourism experience, lovemarks, brand satisfaction, and loyalty in this study (in Table 3). Finally, night tourism development is equally beneficial to the sustainability of the destination environment. For example, the “Cultural Heritage Night” in Korea generally requires tourists to walk through the historic and cultural districts that are strung together from various cultural heritage sites. This method reduces the use of public and private transport and potentially reduces the corresponding carbon emissions level.

5.3. Limitations

There are still some limitations in this study. Firstly, the theoretical model of this study needs to be discussed and validated in various types of tourism resources and destination countries (cities) because the cases of this study are all in Korea and there are some differences among countries (cities) in terms of types of tourism resources, national wealth, tourism development policies, democracy, and civic values [88]. Secondly, this study only explored how tourists develop the lovemarks for the night tourism brand from an experience economy perspective, and did not explore the direct influence of the tourism experience on brand satisfaction and loyalty. Thus, this study calls for more attentions on exploring other antecedent variables that potentially influence the formation of lovemarks, and to discuss whether tourist’s lovemarks acts as an effective mediator between other antecedent variables and brand satisfaction, and loyalty. These explorations will help the researcher to longitudinally understand tourists’ behaviors of night tourism brands (products). Thirdly, as this study is the first to discuss tourists’ emotional and functional evaluation on night tourism brand by using lovemarks, and its main aim is to illustrate the importance of lovemarks. Thus, the operationalized constructs of lovemarks are still not sufficiently comprehensive. Based on the studies of Shuv-Ami et al. [64] and Cho et al. [80], lovemarks were operationalized into two dimensions (brand love and brand respect). However, this operationalization may not be sufficient to show the detailed emotional (mystery, sensuality, and intimacy) and functional (performance, reputation, and trust) attributes of lovemarks [15,58]. Therefore, based on this theoretical model, multidimensional constructs of lovemarks or higher-order models could be used to further explore the effects of various attributes of lovemarks. Finally, this study is an exploratory analysis to explain tourists’ experiences, emotions, and behaviors towards the night heritage tourism brand. Therefore, this study selected generic variables (terms) that have more legitimacy in quantitative research. However, it remains to be further discussed whether the use of these generic variables may impose limitations (pre-determined) on cultural heritage that has characteristics of authenticity, uniqueness, and the local culture they represent. For example, the use of generic variables is better at demonstrating the commonalities of heritage but not necessarily conducive to demonstrating its uniqueness. Therefore, the further development and selection of variables that better reflect the uniqueness of the target case should be considered for future relevant research.

Author Contributions

Conceptualization, N.C. and Q.Y.; methodology, N.C., Y.W. (Yahui Wang), J.L., Y.W. (Yuqian, Wei), and Q.Y.; software, N.C. and Q.Y.; validation, Y.W. (Yahui Wang), J.L., and Y.W. (Yuqian, Wei); formal analysis, N.C. and Q.Y.; investigation, J.L. and Y.W. (Yuqian, Wei); resources, Y.W. (Yahui Wang); data curation, Y.W. (Yahui Wang), J.L., and Y.W. (Yuqian, Wei); writing—original draft preparation, N.C. and Q.Y.; writing—review and editing, N.C., Y.W. (Yahui Wang), J.L., Y.W. (Yuqian, Wei), and Q.Y.; visualization, N.C. and Q.Y.; supervision, N.C. and Q.Y.; project administration, N.C. and Q.Y.; funding acquisition, N.C. and Q.Y. All authors have read and agreed to the published version of the manuscript.

Funding

This research was funded by China National Social Science Fund, grant number 19BGJ007; Program for Science & Technology Innovation Talents in Universities of Henan Province (Humanities and Social Sciences), grant number 2020-cx-002; The Programming of Young Backbone Teachers in Institutions of Higher Learning of Henan Province, grant number 2018GGJS023; Program for Postgraduate Education Reform and Quality Improvement in Henan Province, grant number hnyjs2018kc32; China Scholarship Council, grant number 201708410142.

Acknowledgments

The authors are particularly grateful to editors and reviewers for their suggestions and comments on improving this study.

Conflicts of Interest

The authors declare no conflict of interest.

References

  1. Korea Cultural Heritage Administration. 2016 Cultural Heritage Night. Available online: http://www.heritage.go.kr/yahang/pages/2016_heritage_night_journey.pdf (accessed on 15 October 2019).
  2. Korea Cultural Heritage Administration. The Improvement of Evaluation System on Cultural Heritage Night. Available online: http://www.cha.go.kr/cop/bbs/selectBoardArticle.do?nttId=74673&bbsId=BBSMSTR_1021&mn=NS_03_08_01 (accessed on 15 October 2019).
  3. Evans, G. Hold back the night: Nuit Blanche and all-night events in capital cities. Curr. Issues Tour. 2012, 15, 35–49. [Google Scholar] [CrossRef]
  4. Shaw, R. Neoliberal subjectivities and the development of the night-time economy in British cities. Geogr. Compass 2010, 4, 893–903. [Google Scholar] [CrossRef] [Green Version]
  5. Houghton, M.; Rowell, A. The Australian Night Time Economy 2009–2015; Ortus Economic Research: Newcastle, UK, 2017. [Google Scholar]
  6. Diplomacy, S.; Seijas, A. A Guide to Managing Your Night Time Economy; Sound Diplomacy: London, UK, 2018. [Google Scholar]
  7. GLA Economics. London at Night: An Evidence Base for a 24-Hour City; Greater London Authority: London, UK, 2018.
  8. China Tourism Academy. Night Tourism: Just at the Right Time. Available online: http://www.ctaweb.org/html/2019-3/2019-3-15-11-11-60474.html (accessed on 15 October 2019).
  9. Ministry of Culture and Tourism of the People’s Republic of China. The Culture and Tourism Market of the National Day in 2019. Available online: https://www.mct.gov.cn/whzx/whyw/201910/t20191007_847119.htm (accessed on 15 October 2019).
  10. iiMedia Research. 20 Measures of the State Council to Boost Consumption: Activating Night Commerce and Market, What is the Development Trend of China’s Night Economy in 2019? Available online: https://www.iimedia.cn/c460/65888.html (accessed on 15 October 2019).
  11. Eldridge, A. Strangers in the night: Nightlife studies and new urban tourism. J. Policy Res. Tour. Leis. Events 2019, 11, 422–435. [Google Scholar] [CrossRef]
  12. Botterill, D.; Jones, T. Tourism and Crime: Key Themes; Goodfellow Publishers Ltd.: Oxford, UK, 2010. [Google Scholar]
  13. Bishop, R.; Robinson, L.S. In the night market: Tourism, sex, and commerce in contemporary Thailand. Women’s Stud. Q. 1999, 27, 32–46. [Google Scholar]
  14. Calafat, A.; Blay, N.; Bellis, M.; Hughes, K.; Kokkevi, A.; Mendes, F.; Cibin, B.; Lazarov, P.; Bajcarova, L.; Boyiadjis, G.; et al. Tourism, Nightlife and Violence: A Cross Cultural Analysis and Preventive Recommendations; European Commission: Valencia, Spain, 2011. [Google Scholar]
  15. Song, H.J.; Wang, J.H.; Han, H.S. Effect of image, satisfaction, trust, love, and respect on loyalty formation for name-brand coffee shops. Int. J. Hosp. Manag. 2019, 79, 50–59. [Google Scholar] [CrossRef]
  16. Chaudhuri, A.; Holbrook, M.B. The chain of effects from brand trust and brand affect to brand performance: The role of brand loyalty. J. Mark. 2001, 65, 81–93. [Google Scholar] [CrossRef] [Green Version]
  17. Pine, B.J.; Gilmore, J.H. Welcome to the experience economy. Harv. Bus. Rev. 1998, 76, 97–105. [Google Scholar]
  18. Morrison, S.; Crane, F.G. Building the service brand by creating and managing an emotional brand experience. J. Brand Manag. 2007, 14, 410–421. [Google Scholar] [CrossRef]
  19. Tandon, A.; Tripathi, V.; Gupta, A. The transformation of value and evolution of customer experience: An exploration of the typologies, facets and significance. Int. J. Indian Cult. Bus. Manag. 2014, 8, 425–441. [Google Scholar] [CrossRef]
  20. Lglesias, O.; Singh, J.J.; Batista-Foguet, J.M. The role of brand experience and affective commitment in determining brand loyalty. J. Brand Manag. 2011, 18, 570–582. [Google Scholar] [CrossRef]
  21. Huang, C.C. The impacts of brand experiences on brand loyalty: Mediators of brand love and trust. Manag. Decis. 2017, 55, 915–934. [Google Scholar] [CrossRef]
  22. Roberts, K. Lovemarks: The Future beyond Brands; PowerHouse Books: New York, NY, USA, 2005. [Google Scholar]
  23. Pawle, J.; Cooper, P. Measuring emotion—Lovemarks, the future beyond brands. J. Advert. Res. 2006, 46, 38–48. [Google Scholar] [CrossRef]
  24. Hsieh, A.T.; Chang, J. Shopping and tourist night markets in Taiwan. Tour. Manag. 2006, 27, 138–145. [Google Scholar] [CrossRef]
  25. Tsai, C.T.L. Culinary tourism and night markets in Taiwan. Int. J. Bus. Inf. 2013, 8, 247–266. [Google Scholar]
  26. Lee, S.H.; Chang, S.C.; Hou, J.S.; Lin, C.H. Night market experience andimage of temporary residentsand foreign visitors. Int. J. Cult. Tour. Hosp. Res. 2008, 2, 217–233. [Google Scholar] [CrossRef]
  27. Eldridge, A.; Smith, A. Tourism and the night: Towards a broader understanding of nocturnal city destinations. J. Policy Res. Tour. Leis. Events 2019, 11, 371–379. [Google Scholar] [CrossRef] [Green Version]
  28. Yeo, S.J.; Heng, C.K. An (extra)ordinary night out: Urban informality, social sustainability and the night-time economy. Urban Stud. 2014, 51, 712–726. [Google Scholar] [CrossRef]
  29. Twobrownfeet. Jeonju Cultural Heritage Night Tour. Available online: https://twobrownfeet.com/2019/07/23/jeonju-cultural-heritage-night-tour/ (accessed on 15 October 2019).
  30. Chang, J.; Chiang, C.H. Segmenting american and Japanese tourists on novelty-seeking at night markets in Taiwan. Asia Pacfic J. Tour. Res. 2006, 11, 391–406. [Google Scholar] [CrossRef]
  31. Mariani, M.M.; Giorgio, L. The ”Pink Night” festival revisited: Meta-events and the role ofdestination partnerships in staging event tourism. Ann. Tour. Res. 2017, 62, 89–109. [Google Scholar] [CrossRef] [Green Version]
  32. Ingle, M. Making the most of ‘nothing’: Astro-tourism, the Sublime, and the Karoo as a ‘space destination’. Transform. Crit. Perspect. S. Afr. 2010, 74, 87–111. [Google Scholar] [CrossRef]
  33. Collison, F.M.; Poe, K. “Astronomical Tourism”: The astronomy and Dark Sky Program at Bryce Canyon National Park. Tour. Manag. Perspect. 2013, 7, 1–15. [Google Scholar] [CrossRef]
  34. Chang, J.; Min, J.C.H.; Lin, Y.H.P.; Chiang, C.H. Profiling Japanese tourists visiting night markets in Taiwan. J. Qual. Assur. Hosp. Tour. 2007, 8, 25–44. [Google Scholar] [CrossRef]
  35. Bloemer, J.M.; Kasper, H.D.P. The complex relationship between consumer satisfaction and brand loyalty. J. Econ. Psychol. 1995, 16, 311–329. [Google Scholar] [CrossRef]
  36. Anderson, E.W.; Fornell, C.; Lehmann, D.R. Customer satisfaction, market share, and profitability: Findings from Sweden. J. Mark. 1994, 58, 53–66. [Google Scholar] [CrossRef]
  37. Baker, D.A.; Crompton, J.L. Quality, satisfaction and behavioral intentions. Ann. Tour. Res. 2000, 27, 785–804. [Google Scholar] [CrossRef]
  38. Dick, A.S.; Basu, K. Customer loyalty: Toward an integrated conceptual framework. J. Acad. Mark. Sci. 1994, 22, 99–113. [Google Scholar] [CrossRef]
  39. Oliver, R.L. Whence consumer loyalty? J. Mark. 1999, 63, 33–44. [Google Scholar] [CrossRef]
  40. Chen, S.C.; Quester, P.G. The relative contribution of love and trust towards customer loyalty. Australas. Mark. J. 2015, 23, 13–18. [Google Scholar] [CrossRef]
  41. Alnawas, I.; Altarifi, S. Exploring the role of brand identification and brand love in generating higher levels of brand loyalty. J. Vacat. Mark. 2016, 22, 111–128. [Google Scholar] [CrossRef]
  42. Giovanis, A.; Athanasopoulou, P. Understanding lovemark brands: Dimensions and effect on brand loyalty in high-technology products. Span. J. Mark. ESIC 2018, 22, 272–294. [Google Scholar] [CrossRef]
  43. Kim, J.W.; Lee, F.; Suh, Y.G. Satisfaction and loyalty from shopping mall experience and brand personality. Serv. Mark. Q. 2015, 36, 62–76. [Google Scholar] [CrossRef]
  44. Kim, M.J.; Lee, C.K.; Chung, N.H.; Kim, W.G. Factors affecting online tourism group buying and the moderating role of loyalty. J. Travel Res. 2014, 53, 380–394. [Google Scholar] [CrossRef]
  45. Schultz, D.E.; Bailey, S.E. Customer/brand loyalty in an interactive marketplace. J. Advert. Res. 2000, 40, 41–52. [Google Scholar] [CrossRef]
  46. Hellier, P.K.; Geursen, G.M.; Carr, R.A.; Rickard, J.A. Customer repurchase intention: A general structural equation model. Eur. J. Mark. 2003, 37, 1762–1800. [Google Scholar] [CrossRef] [Green Version]
  47. Oliver, R.L. A cognitive model of the antecedents and consequences of satisfaction decisions. J. Mark. Res. 1980, 17, 460–469. [Google Scholar] [CrossRef]
  48. Altunel, M.C.; Erkut, B. Cultural tourism in Istanbul: The mediation effect of tourist experienceand satisfaction on the relationship between involvement andrecommendation intention. J. Destin. Mark. Manag. 2015, 4, 213–221. [Google Scholar] [CrossRef]
  49. Oppermann, M. Tourism destination loyalty. J. Travel Res. 2000, 39, 78–84. [Google Scholar] [CrossRef]
  50. Lombart, C.; Louis, D. Consumer satisfaction and loyalty: Two main consequences of retailer personality. J. Retail. Consum. Serv. 2012, 19, 644–652. [Google Scholar] [CrossRef]
  51. Kuikka, A.; Laukkanen, T. Brand loyalty and the role of hedonic value. J. Prod. Brand Manag. 2012, 21, 529–537. [Google Scholar] [CrossRef]
  52. Solem, B.A.A. Influences of customer participation and customer brand engagement on brand loyalty. J. Consum. Mark. 2016, 33, 332–342. [Google Scholar] [CrossRef]
  53. Drennan, J.; Bianchi, C.; Cacho-Elizondo, S.; Louriero, S.; Guibert, N.; Proud, W. Examining the role of wine brand love on brand loyalty: A multi-country comparison. Int. J. Hosp. Manag. 2015, 49, 47–55. [Google Scholar] [CrossRef]
  54. Nam, J.; Ekinci, Y.; Whyatt, G. Brand equity, brand loyalty and consumer satisfaction. Ann. Tour. Res. 2011, 38, 1009–1030. [Google Scholar] [CrossRef]
  55. Yoon, Y.S.; Lee, J.S.; Lee, C.K. Measuring festival quality and value affecting visitors’ satisfaction and loyalty using a structural approach. Int. J. Hosp. Manag. 2010, 29, 335–342. [Google Scholar] [CrossRef]
  56. Chen, C.F.; Myagmarsuren, O. Exploring relationships between Mongolian destination brand equity, satisfaction and destination loyalty. Tour. Econ. 2010, 16, 981–994. [Google Scholar] [CrossRef]
  57. Cheng, Q.; Fang, L.; Chen, H. Visitors’ brand loyalty to a historical and cultural theme park: A casestudy of Hangzhou Songcheng, China. Curr. Issues Tour. 2016, 19, 861–868. [Google Scholar] [CrossRef]
  58. Song, H.J.; Bae, S.Y.; Han, H.S. Emotional comprehension of a name-brand coffee shop: Focus on lovemarks theory. Int. J. Contemp. Hosp. Manag. 2019, 31, 1046–1065. [Google Scholar] [CrossRef]
  59. Elena, D.B.; Jose Luis, M.A.; María Jesús, Y.G. Development and validation of a brand trust scale. Int. J. Mark. Res. 2003, 45, 35–53. [Google Scholar] [CrossRef]
  60. Roberts, K. The Lovemarks Effect: Winning in the Consumer Revolution; PowerHouse Books: New York, NY, USA, 2006. [Google Scholar]
  61. Lee, T.H.; Oh, S.Y. The effect of festival lovemarks on satisfaction and behavior intentions: Focused on SEMs (Strategic Experiential Modules) and environmental cues. J. Tour. Sci. 2012, 36, 101–118. [Google Scholar]
  62. Han, H.S.; Yu, J.S.; Lee, H.R. Lovemarks and effect of in-flight product performance on airline passengers’ purchase intention. Soc. Behav. Personal. 2020, 48, 1–10. [Google Scholar] [CrossRef]
  63. Lee, S.H. Influence of traditional media and new media communication on lovemarks, satisfaction and behavior intention of foodservice industry. J. Digit. Converg. 2017, 15, 221–231. [Google Scholar] [CrossRef]
  64. Shuv-Ami, A.; Vrontis, D.; Thrassou, A. Brand lovemarks scale of sport fans. J. Promot. Manag. 2018, 24, 215–232. [Google Scholar] [CrossRef]
  65. Han, H.S.; Yu, J.S.; Chua, B.L.; Lee, S.H.; Kim, W.S. Impact of core-product and service-encounter quality, attitude, image, trust and love on repurchase: Full-service vs low-cost carriers in South Korea. Int. J. Contemp. Hosp. Manag. 2019, 31, 1588–1608. [Google Scholar] [CrossRef]
  66. Yoon, S.M.; Lee, T.H. The effect of the perceived lovemark constructs of travel agency on repurchase/recommendation intention and consumer support toward the extension of discounted travel products. J. Korea Serv. Manag. Soc. 2013, 14, 49–72. [Google Scholar] [CrossRef]
  67. Smith, S.L.J. The tourism product. Ann. Tour. Res. 1994, 21, 582–595. [Google Scholar] [CrossRef]
  68. Stamboulis, Y.; Skayannis, P. Innovation strategies and technology for experience-based tourism. Tour. Manag. 2003, 24, 35–43. [Google Scholar] [CrossRef]
  69. Oh, H.; Fiore, A.M.; Jeoung, M. Measuring experience economy concepts: Tourism applications. J. Travel Res. 2007, 46, 119–132. [Google Scholar] [CrossRef]
  70. Pine, B.J.; Gilmore, J.H. The Experience Economy: Work is Theatre & Every Business a Stage; Harvard Business School Press: Boston, MA, USA, 1999. [Google Scholar]
  71. Loureiro, S.M.C. The role of the rural tourism experience economy in place attachment and behavioral intentions. Int. J. Hosp. Manag. 2014, 40, 1–9. [Google Scholar] [CrossRef]
  72. Song, H.J.; Kim, M.C.; Choe, Y.S. Structural relationships among mega-event experiences, emotional responses, and satisfaction: Focused on the 2014 Incheon Asian Games. Curr. Issues Tour. 2019, 22, 575–581. [Google Scholar] [CrossRef]
  73. Quadri-Felitti, D.; Fiore, A.M. Experience economy constructs as a framework for understanding wine tourism. J. Vacat. Mark. 2012, 18, 3–15. [Google Scholar] [CrossRef]
  74. Zhang, D.D.; Min, B.Y. Effects of theme park experience on lovemarks and recommendation: Pine and Gilmore’s experience economy perspective. J. Hosp. Tour. Stud. 2018, 20, 157–170. [Google Scholar] [CrossRef]
  75. Brakus, J.J.; Schmitt, B.H.; Zarantonello, L. Brand experience: What is it? How is it measured? Does it affect loyalty? J. Mark. 2009, 73, 52–68. [Google Scholar] [CrossRef]
  76. Bıçakcıoğlu, N.; İpek, İ.; Bayraktaroğlu, G. Antecedents and outcomes of brand love: The mediating role of brand loyalty. J. Mark. Commun. 2018, 24, 863–877. [Google Scholar] [CrossRef]
  77. Korea Cultural Heritage Administration. Selected List of Regional Application Projects in 2020 (Night Journey). Available online: http://www.cha.go.kr/cop/bbs/selectBoardArticle.do?nttId=75419&bbsId=BBSMSTR_1045&pageIndex=1&pageUnit=10&searchCnd=&searchWrd=&ctgryLrcls=&ctgryMdcls=&ctgrySmcls=&ntcStartDt=&ntcEndDt=&searchUseYn=&mn=NS_03_09_01 (accessed on 15 October 2019).
  78. DeVellis, R.F. Scale Development: Theory and Application, 4th ed.; SAGE: Los Angeles, CA, USA, 2016. [Google Scholar]
  79. Churchill, J.; Gilbert, A. A paradigm for developing better measures of marketing constructs. J. Mark. Res. 1979, 16, 64–73. [Google Scholar] [CrossRef]
  80. Cho, E.; Fiore, A.M.; Russell, D.W. Validation of a fashion brand image scale capturing cognitive, sensory, and affective associations: Testing its role in an extended brand equity model. Psychol. Mark. 2015, 32, 28–48. [Google Scholar] [CrossRef]
  81. Brislin, R. Back-translation for cross-cultural research. J. Cross Cult. Psychol. 1970, 1, 185–216. [Google Scholar] [CrossRef]
  82. Mills, G.E.; Gay, L.R. Educational Research: Competencies for Analysis and Applications, 11th ed.; Pearson Education Limited: Essex, UK, 2016. [Google Scholar]
  83. Bentler, P.M.; Chou, C.P. Practival issues in structural modeling. Sociol. Methods Res. 1987, 16, 78–117. [Google Scholar] [CrossRef]
  84. Hair, J., Jr.; Black, W.; Babin, B.; Anderson, R. Multivariate Data Analysis, 7th ed.; Pearson: London, UK, 2009. [Google Scholar]
  85. Podsakoff, P.M.; MacKenzie, S.B.; Lee, J.-Y.; Podsakoff, N.P. Common method biases in behavioral research: A critical review of the literature and recommended remedies. J. Appl. Psychol. 2003, 88, 879–903. [Google Scholar] [CrossRef]
  86. Podsakoff, P.M.; Organ, D.W. Self-reports in organizational research: Problems and prospects. J. Manag. 1986, 12, 531–544. [Google Scholar] [CrossRef]
  87. Hosany, S.; Prayag, G.; Van Der Veen, R.; Huang, S.S.; Deesilatham, S. Mediating effects of place attachment and satisfaction on the relationship between tourists’ emotions and intention to recommend. J. Travel Res. 2017, 56, 1079–1093. [Google Scholar] [CrossRef] [Green Version]
  88. Yuan, Q.; Song, H.; Chen, N.; Shang, W. Roles of tourism involvement and place attachment in determining residents’ attitudes toward industrial heritage tourism in a resource-exhausted city in China. Sustainability 2019, 11, 5151. [Google Scholar] [CrossRef] [Green Version]
  89. Podsakoff, P.M.; MacKenzie, S.B.; Podsakoff, N.P. Sources of method bias in social science research and recommendations on how to control it. Annu. Rev. Psychol 2012, 63, 539–569. [Google Scholar] [CrossRef] [PubMed] [Green Version]
  90. Anderson, J.; Gerbing, D. Structural equation modeling in practice: A review and recommended two-step approach. Psychol. Bull. 1988, 103, 411–423. [Google Scholar] [CrossRef]
  91. Byrne, B.M. Structural Equation Modeling with Amos: Basic Concepts, Applications, and Programming, 3rd ed.; Routledge: New York, NY, USA, 2016. [Google Scholar]
  92. Hancock, G.R.; Liu, M. Bootstrapping standard errors and data-model fit statistics in structural equation modeling. In Handbook of Structural Equation Modeling; Hoyle, R.H., Ed.; Guilford Press: New York, NY, USA, 2012; pp. 296–306. [Google Scholar]
  93. Bollen, K.A.; Stine, R.A. Bootstrapping goodness-of-fit measures in structural equation models. Sociol. Methods Res. 1992, 21, 205–229. [Google Scholar] [CrossRef]
  94. Arbuckle, J.L.; Wothke, W. Amos 4.0 User’s Guide; Small Waters Corporation: Chicago, IL, USA, 1999. [Google Scholar]
  95. Song, Z.; Xing, L.; Chathoth, P.K. The effects of festival impacts on support intentions based on residents’ ratings of festival performance and satisfaction: A new integrative approach. J. Sustain. Tour. 2015, 23, 316–337. [Google Scholar] [CrossRef]
  96. Vong, T.-N.L.; Lai, K.; Li, Y. Sense of place: Affective link missing between casino impact perception and support for casino development? Asia Pacfic J. Tour. Res. 2016, 21, S76–S100. [Google Scholar] [CrossRef]
  97. Shang, W.; Yuan, Q.; Chen, N. Examining structural relationships among brand experience, existential authenticity, and place attachment in Slow Tourism destinations. Sustainability 2020, 12, 2784. [Google Scholar] [CrossRef] [Green Version]
  98. Jöreskog, K.G.; Sörbom, D. LISREL 7: A Guide to the Program and Applications.; SPSS Inc.: Chicago, IL, USA, 1989. [Google Scholar]
  99. Kline, R.B. Principles and Practice of Structural Equation Modeling; The Guilford Press: New York, NY, USA, 2016. [Google Scholar]
  100. Bentler, P.M.; Bonett, D.G. Significance tests and goodness of fit in the analysis of covariance structures. Psychol. Bull. 1980, 88, 588–606. [Google Scholar] [CrossRef]
  101. Fornell, C.; Larcker, D.F. Evaluating structural equation models with unobservable variables and measurement error. J. Mark. Res. 1981, 18, 39–50. [Google Scholar] [CrossRef]
  102. Nunnally, J.C.; Bemstein, I.H. Psychometric Theory, 3rd ed.; McGraw-Hill: New York, NY, USA, 1994. [Google Scholar]
  103. Loehlin, J.; Beaujean, A. Latent Variable Models: An Introduction to Factor, Path, and Structural Analysis, 5th ed.; Routledge, Taylor & Francis: New York, NY, USA, 2017. [Google Scholar]
  104. Netemeyer, R.G.; Bearden, W.O.; Sharma, S. Scaling Procedures: Issues and Applications; SAGE Publications, Inc.: Oaks, CA, USA, 2003. [Google Scholar]
  105. Campbell, D.T.; Fiske, D.W. Convergent and discriminant validation by the multitrait-multimethod matrix. Psychol. Bull. 1959, 56, 81–105. [Google Scholar] [CrossRef] [Green Version]
  106. Zhang, H.; Cho, T.Y.; Wang, H.J.; Ge, Q.S. The influence of cross-cultural awareness and tourist experience on authenticity, tourist satisfaction and acculturation in World Cultural Heritage Sites of Korea. Sustainability 2018, 10, 927. [Google Scholar] [CrossRef] [Green Version]
  107. UNESCO. UNESCO World Heritage and Sustainable Tourism Programme. Available online: https://whc.unesco.org/uploads/activities/documents/activity-669-7.pdf (accessed on 14 August 2020).
  108. World Heritage Committee. Report on the World Heritage Thematic Programmes. Available online: https://whc.unesco.org/en/decisions/4240/ (accessed on 14 August 2020).
Figure 1. The classification of lovemarks.
Sustainability 12 06723 g001
Figure 2. The dimension classification of tourism experience suggested by Oh et al. [17,69].
Sustainability 12 06723 g002
Figure 3. The theoretical framework.
Sustainability 12 06723 g003
Figure 4. The results of structural model.
Sustainability 12 06723 g004
Table 1. The case studies of “Cultural Heritage Night”.
Case
City/Region
DatePopularityRevitalization Number of Cultural Heritages in (2017)Main Cultural HeritageNight Tourism Content
National LevelLocal Level
Buyeo County, Chungcheong-namdo2018
4.6–4.7
Capital of Baekje50Baekje World Heritage Center; Jeongnimsa Temple Site (The 9th national treasure of South Korea)Cherry Blossom Night Walk; Jeongnimsa Temple; Buyeo Bridge; Baekje Museum, etc.
Seoul, Central District, Jeong-dong2018
5.11–5.12
National capital57Location of early foreign consulates; Authentic church schools and buildings; Deoksugung, etc.Self-examination on modern education and diplomacy; Literature and media inclusion; Samil Undong 100th Anniversary, etc.
Jeonju
Jeollabuk-do
2018
5.25–5.26
Birthplace of the Joseon Dynasty;
International Slow City
510Jeonju Hanok Village (Korea’s largest traditional building complex);
World Cultural Heritage “Pansori” etc.
Hanok village night Tour; Han-jeongsik; Hanbok experience, Light show, etc.
Daegu
Central District
2018
8.24–8.25
The fourth largest city in South Korea;
One of the capitals of the Joseon Dynasty
17Gyesan Cathedral; National Independence Movement Ruins, etc.Architectural lantern tourism; Missionary Cultural Celebration; Flea market; Cross-cultural experience; Handicraft making;
Cultural concerts, etc.
Note: The contents were compiled from various types of information published by the Korea Cultural Heritage Administration [1,2,77].
Table 2. Profile of respondents (N = 487).
IndicatorsN (%)IndicatorsN (%)
Gender Marital status
Male248 (50.9)Single133 (27.3)
Female239 (49.1)Married346 (71.0)
Age (years) Others8 (1.7)
20–2970 (14.4)Education
30–3981 (16.6)High school and below84 (17.2)
40–49123 (25.3)Three-year college55 (11.3)
50–59118 (24.2)University285 (58.5)
60 and above95 (19.5)Postgraduates63 (12.9)
Occupation Monthly income (KRW *)
Office staff229 (47.0)Less than 1 million38 (7.8)
Entrepreneurs (self-employed)29 (6.0)1–1.99 million61 (12.5)
Civil servant18 (3.7)2–2.99 million102 (20.9)
Student33 (6.8)3–3.99 million98 (20.2)
Housewife70 (14.4)4–4.99 million71 (14.6)
Professional/Technicians39 (8.0)5–5.99 million47 (9.7)
Retiree8 (1.6)6–6.99 million25 (5.1)
Education25 (5.1)7–7.99 million20 (4.1)
Others36 (7.4)8 million and more25 (5.1)
* $1 USD = KRW ₩1199.36 (as of 28 July 2020).
Table 3. The measurement model.
Constructs/IndicatorsFactor loading aSE Boot bMeanSMC c
Entertainment Experience (ENTE)
The “Cultural Heritage Night” is amusing to participate0.877-3.7200.770
The “Cultural Heritage Night” is very entertaining0.8790.0443.7700.772
The entertaining activities of the “Cultural Heritage Night” is captivating0.8610.0483.6800.741
Escapism Experience (ESCE)
Through the “Cultural Heritage Night,” I feel stayed in a different world0.740-3.6500.548
Through the “Cultural Heritage Night,” I can forget my daily life0.9230.0613.7500.852
Through the “Cultural Heritage Night,” I can escape from reality0.8220.0623.7200.675
Esthetic Experience (ESTE)
The setting of the “Cultural Heritage Night” makes me feel good0.885-3.6400.783
The setting of “Cultural Heritage Night” is interesting0.9160.0323.6000.838
The environment of “Cultural Heritage Night” made me feel happy.0.9090.0333.6300.826
Educational Experience (EDUE)
The experience of the “Cultural Heritage Night” increased my knowledge, and I learned a lot from it0.850-3.5400.722
The experience of the “Cultural Heritage Night” inspired my curiosity and interest in learning cultural heritage and history0.9090.0453.3900.826
The experience of the “Cultural Heritage Night” is highly educational for me0.8370.0503.4600.701
Brand Love (BL)
I like the “Cultural Heritage Night”0.877-3.8800.770
I enjoy taking part in the “Cultural Heritage Night”0.9300.0383.9000.865
If the “Cultural Heritage Night” would stop to exist, I would miss it very much0.8570.0413.9400.735
Brand Respect (BR)
The “Cultural Heritage Night” is full of creativity, which makes me excited0.577-4.1100.332
The “Cultural Heritage Night” is the leading brand of cultural heritage tourism in Korea0.7950.1953.4700.631
I approve the performance of “Cultural Heritage Night”0.7700.1783.5200.593
Brand Satisfaction (BS)
Overall, I am satisfied with the “Cultural Heritage Night”0.818-3.9100.669
As a whole, I am happy with the “Cultural Heritage Night” 0.8900.0524.0000.792
I think take part in the “Cultural Heritage Night” is a good decision0.9340.0503.9300.873
Brand Loyalty (BLY)
I would continue to attend the “Cultural Heritage Night” in the future0.857-4.1500.734
Instead of trying other unknown night tourism brands, I would prefer to choose “Cultural Heritage Night”0.9130.0454.0900.834
I would continue to make the “Cultural Heritage Night” a priority brand0.9170.0464.1300.840
a The factor loadings of all indicators were significant (p < 0.001) as determined by the two-tailed 95% bias-corrected percentile method through bootstrap resamples (N = 10,000) in AMOS; b SE Boot: the standardized errors (SE) were estimated by the maximum likelihood approach through bootstrap resamples (N = 10,000) in AMOS; c Squared multiple correlation.
Table 4. The discriminant validity.
ConstructsENTEESCEESTEEDUEBLBRBSBLY
ENTE0.761a0.168 b
(0.410 c)
0.137
(0.370)
0.031
(0.175)
0.461
(0.697 *)
0.109
(0.330)
0.278
(0.527)
0.184
(0.429)
ESCE0.048 d0.6920.094
(0.307)
0.059
(0.243)
0.108
(0.328)
0.092
(0.303)
0.162
(0.402)
0.092
(0.304)
ESTE0.0480.0490.8160.155
(0.394)
0.071
(0.266)
0.204
(0.452)
0.111
(0.333)
0.181
(0.426)
EDUE0.0520.0540.0540.7500.043
(0.207)
0.246
(0.496)
0.063
(0.250)
0.144
(0.379)
BL0.0370.0520.0540.0510.7900.075
(0.274)
0.338
(0.581)
0.172
(0.415)
BR0.0570.0590.0550.0470.0560.5190.090
(0.300)
0.262
(0.512)
BS0.0480.0480.0440.0480.0400.0580.7780.254
(0.504)
BLY0.0440.0490.0410.0440.0440.0520.0470.803
Cronbach’sα0.9050.8630.9300.8990.9160.7470.9110.924
CR0.9050.8700.9300.9000.918 0.7610.9130.924
Note: ENTE: Entertainment Experience; ESCE: Escapism Experience; ESTE: Esthetic Experience; EDUE: Educational Experience; BL: Brand Love; BR: Brand Respect; BS: Brand Satisfaction; BLY: Brand Loyalty. a Average variance extracted (AVE): the coefficients along the diagonal (italics); b The squared inter-construct correlation (SIC) coefficients: the coefficients outside the parentheses and above the diagonal; c The correlation coefficients between pairs of constructs: the coefficients in the parentheses; d The standardized errors (SE) between pairs of constructs (estimated by the maximum likelihood approach through bootstrap resamples (N = 10,000) in AMOS): the coefficients below the diagonal; * The highest correlation coefficient between pairs of constructs.
Table 5. The hypotheses testing.
HypothesisPathEstimateSE Boot ap-ValueResult
H1BS → BLY0.2690.072***Supported
H2-1BL → BS0.5340.045***Supported
H2-2BR → BS0.1990.057***Supported
H3-1BL → BLY0.1380.0590.020 *Supported
H3-2BR → BLY0.4320.058***Supported
H4-1ENTE → BL0.6790.051***Supported
H4-2ESCE → BL0.0480.0550.375Rejected
H4-3ESTE → BL−0.0280.0580.640Rejected
H4-4EDUE → BL0.0920.0460.043 *Supported
H5-1ENTE → BR0.1580.0590.007 **Supported
H5-2ESCE → BR0.0960.0640.137Rejected
H5-3ESTE → BR0.2660.062***Supported
H5-4EDUE → BR0.3630.057***Supported
Indirect PathDirect EffectIndirect EffectTotal Effect
BL → BS → BLY0.138 ** (0.059 b)0.144 *** (0.019)0.282 *** (0.049)
BR → BS → BLY0.432 *** (0.058)0.054 *** (0.037)0.486 *** (0.057)
Note: ENTE: Entertainment Experience; ESCE: Escapism Experience; ESTE: Esthetic Experience; EDUE: Educational Experience; BL: Brand Love; BR: Brand Respect; BS: Brand Satisfaction; BLY: Brand Loyalty. a & b The standardized errors (SE): Estimated by the maximum likelihood approach through bootstrap resamples (N = 10,000) in AMOS; * p < 0.05, ** p < 0.01, *** p < 0.001, the significant levels were estimated by the two-tailed 95% bias-corrected percentile method through bootstrap resamples (N = 10,000) in AMOS.

