Article

Smart Cities Oriented Project Planning and Evaluation Methodology Driven by Citizen Perception—IoT Smart Mobility Case

by
Luis F. Luque-Vega
,
Miriam A. Carlos-Mancilla
*,
Verónica G. Payán-Quiñónez
and
Emmanuel Lopez-Neri
Centro de Investigación, Innovación y Desarrollo Tecnológico CIIDETEC-UVM, Universidad del Valle de Mexico, Tlaquepaque, Jalisco 45601, Mexico
*
Author to whom correspondence should be addressed.
Sustainability 2020, 12(17), 7088; https://0-doi-org.brum.beds.ac.uk/10.3390/su12177088
Submission received: 30 June 2020 / Revised: 14 August 2020 / Accepted: 24 August 2020 / Published: 31 August 2020

Abstract

:
Smart Cities empower progress through technology integration directed with a strategic approach to sustainable development and citizen well-being. The creation of solid strategic planning boosts the development of infrastructure, innovation, and technology. However, the above can be compromised if citizens are not properly involved; therefore, it is relevant to enhance citizen participation when a new Smart City project appears on the horizon. This work presents a Smart Cities Oriented Project Planning and Evaluation (SCOPPE) Methodology that combines the citizen participation and the Minimum Viable Product creation through adaptive project management. Moreover, since the smart mobility projects represent the first step towards a Smart City, a case of study of an Intelligent Parking System (SEI-UVM) is presented following the SCOPPE Methodology. The application’s steps results lead us to key and useful information when defining, designing, and implementing the minimum viable product of the cornerstone device of the SEI-UVM: the Smart Vehicle Presence Sensor (SPIN-V). It is worthwhile to mention that the proposed SCOPPE Methodology could be extended to any Smart City project.

1. Introduction

Today, cities are conceived as complex places that are immersed in processes of constant evolution and change, where synergies corresponding to certain main factors, such as culture, environment, and technology, among others, are intertwined. Smart Cities are described as cities that use Information and Communication Technologies (ICTs), among other technologies, to increase public benefits and improve the quality of life of the individuals who live and work there.
Six thematic areas must be present and addressed in any Smart City proposal. These are: Smart Economy, Smart People, Smart Mobility, Smart Living, Smart Government, and Smart Environment, proposed in the model by Boyd Cohen and known as “The Cohen Wheel” [1]. Each thematic area contains a set of city indicators.
A Smart City is defined as one that performs well in a future perspective in the economy, mobility, environment, citizenship, quality of life, and government [2]. Besides, Smart People refers to individuals who count and use e-skills, are enabled in working with ICTs, have access to education and training, human resources, and management capacity, within an inclusive society that improves creativity and encourages innovation. Smart Economy refers to the use of e-business and e-commerce, which allow an increase in productivity, manufacturing, and advanced services enabled by ICTs, new products, new services, and business models. Smart Environment consists of an environment that is made up of intelligent energy in which renewable energies are included, defined by the University of Alicante (UA) Smart University [3]. In addition to energy networks enabled by ICTs, there is a measurement, monitoring, and control of pollution, renovation of the built environment(buildings and facilities), green urban planning, as well as the reuse of resources. Smart Living is a lifestyle based on the use and consumption of ICTs. At the same time, Smart Living aims to provide a healthy and safe environment, as well as living in a culturally vibrant city, that is, having various cultural facilities. Regarding Smart Government, this is the governance linked to the city where the public, private, and civil community is linked [4].
Moreover, a smart and sustainable city aims to become adaptable, reliable, scalable, accessible, and resilient. To improve quality of life, and well-being of its citizens by guaranteeing access to social and community services, ensuring economic growth with better employment opportunities, establishing a sustainable and responsible development approach with the environment; the efficient provision of essential services and infrastructures, such as public transport, water supply, and drainage, telecommunication, and other utilities [5].
According to Forbes (see Reference [6]), the smartest city is London, with a Smart mobility system, transportation, governance, and technology. New York City takes second place with 817,000 sensors that provide real-time access to monitoring water, a congestion management system for traffic, cybersecurity, a plan for cycling in the city, etc. The third-place Amsterdam, with opening data for a connected city that shares traffic and transport data. Paris in fourth place with technology, electric mobility, and data transportation. Fifth place goes to Reykjavik, which accounts for 99 percent of electricity production from hydroelectric and geothermal energy. In sixth-place is Tokyo, with the development of human capital and environment, urban planning, and transportation. The seventh place is occupied by Singapore, with a fiber-optic network that covers the entire island, gardens, and transport. Eighth is Copenhagen, working with the Massachusetts Institute of Technology (MIT) to develop a smart bike system. In addition, there are Berlin, Vienna, Dubai, and Barcelona, to mention some of the most relevant Smart Cities. Moreover, it is worth mentioning that the founders of digital media from Google, Facebook, Microsoft, Amazon, and Tesla become beneficiaries of ’Smart City’ planning [7].
A significant characteristic of a Smart City is that it works to a large extent thanks to the cooperation and participation generated among the three pillars of a city, the industry, citizens, and government [8]. Commonly, Smart Cities are not able to reach their objectives because citizens are not adequately involved in their definition, scope, or impact on their daily lives is not consider. Some works have been carried out that promote citizen participation, such as Reference [9], which is an evaluation tool that refers to the analysis of one city along with all the criteria of the framework and suggests citizen participation in the three main steps. (1) Non-participation; (2) Consultation (collecting ideas without impact on decision-making); and (3) Co-decision (with decision-making shared between officials and citizens).
The main issue is that a government might include citizens in the decision process only to obtain a more cooperative public that expects to face less resistance when the project discussed is implemented. In Reference [10], an evaluation of citizen participation is established based on a cause/effect relationship between the activities of the participation program and the achievement of the agreed-upon goals, in order to minimize this risk and aim to enable democratic participation.
More recently, Reference [11] presents a governance tool for government officials that want to invest in a citizen-oriented Smart City strategy. CitiVoice can be considered as guidelines for implementation, and it allows the issuing of more concrete recommendations for a specific city. CitiVoice establishing a “dashboard” overview of citizen participation categories: citizen as democratic participants, as co-creators and as ICTs users. For instance, the city of Brussels used this framework in a participatory budget activity: They used the guidelines of the democratic participation category to improve their strategy, and, ultimately, they decided to use a multi-channel approach to enable co-creation of projects with citizens.
Although significant progress has been made in relation to the tools to promote citizen participation in the three categories, to the knowledge of the authors, there is still no evidence of a methodology that contemplates the definition of a Smart City project from its inception. From the choice made by the citizens that consider the attributes selection of the solution, the evaluation of the Minimum Viable Product (MVP), until the final product is released to the entire city.
This paper presents a Smart Cities Oriented Project Planning and Evaluation (SCOPPE) methodology that combines the citizen participation and the MVP creation through adaptive project management. This methodology enhances the engagement of people, that is, citizens must be consulted, through interviews and survey, in which the objective is to know the real needs and generate processes, products, and services that meet these needs but also make the city a Smart City [12]. Moreover, a process to generate the Minimum Viable Product (see Reference [13]) is carried out in order to develop the technology according to citizen perception. To validate, the case of study of an Intelligent Parking System (SEI-UVM) is presented following the SCOPPE Methodology.
Thus, the present investigation is composed of the following sections. In Section 2, the theoretical background is explained and addresses Kano’s satisfaction model, Kano’s refined model, and the importance–satisfaction model. Then, Section 3 describes the SCOPPE methodology, while the results on the application of this methodology to an Internet of Things (IoT) Smart Mobility Project are presented in Section 4. A discussion regarding the importance of the SCOPPE Methodology when dealing with Smart City projects, and materials and methods are shown in Section 5 and Section 6, respectively. Finally, some remarked conclusions to close the paper are detailed.

2. Theoretical Background

2.1. The Kano Model

The Kano model is also known as the attractive quality theory. It was proposed in 1984 by the quality management for product development and customer satisfaction expert Noriaki Kano after his study conducted about the quality and its importance. This approach was formulated as a blueprint that could categorize and prioritize customer needs and provide the manufacturer with guidance for the product development life cycle and provide increased customer satisfaction upon returning for a new product line [14]. Moreover, the model in Reference [15] captures the nonlinear relationship between product performance and customer satisfaction.
Thus, from the model came the recognition of two important characteristics of quality. On the one hand, the physical compliance with the specifications of a product was placed, and the subjective aspect of it. This is, the satisfaction generated in the final user, as well as the correlation between these two aspects.
Kano makes a distinction between various quality elements that translates them into attributes of a product or service, which influence customer satisfaction according to [16,17]:
  • Obligatory attributes or basic quality (M).—Those that, if not satisfied, will produce dissatisfaction in the client. These attributes are basic elements of a product, which are perceived as prerequisites.
  • One-dimensional or linear attributes (O).—Those in which customer satisfaction is proportional to the level of compliance with them. These are usually requested by the customer.
  • Attractive or enthusiastic attributes (A).—The elements of the product that have the greatest influence on customer satisfaction with a given product are considered.
In addition to these attributes, three other possible options are described below.
  • Indifferent quality attributes (I).—Those in which their presence or absence does not contribute or increase customer satisfaction.
  • Reverse quality attributes (R).—Elements that result in dissatisfaction when fulfilled and satisfaction when not fulfilled.
  • Questionable quality attributes (Q).—These elements indicate that either the question is poorly formulated (wrong) or the response is illogical.
To determine the classification of the attributes of the product or service, a questionnaire format is used. For each attribute, a pair of questions are formulated: a functional and a dysfunctional question. Each question has five answer options, as shown in Table 1. The description of each answer option is described as follows.
Like. Reflects the attitude of the interviewee by preferring the attribute convincingly and clearly.
Must be. Reflects the attitude of the interviewee that the attribute must be present and disappoint him if it is not.
Neutral. Shows the attitudes of the respondents when they have no relation with the attribute, that is, they do not care if it is present or not.
Acceptable. Means that the satisfaction of the respondent is not affected if he finds the attribute present in the product the respondent is looking for.
Dislike. Reflects an attitude of the respondent of displeasure if it finds the attribute present or if it is not.
The results are evaluated for each attribute, according to the functional and dysfunctional responses to the question. The responses are classified as shown in Table 2.

2.2. The Refined Kano’s Model

In Yang [18], the measurement of the importance of each attribute of the products is incorporated. Furthermore, each category of the Kano Model is divided into two, resulting in a total of 8 types. Each new quality attribute is described below.
  • The Attractive attributes
    Highly attractive quality attributes (HA).—The strategic attribute that offerings a represent effective means of attracting potential customers.
    Less attractive quality attributes (LA).—These are unattractive to customers and can be reduced if cost considerations dictate.
  • The One-dimensional attributes
    High value-added quality attributes (HO).—Attributes that contribute significantly to customers satisfaction and, therefore, lead to increased revenue.
    Low value-added quality attributes (LO).—Attributes that make a limited contribution to customer satisfaction.
  • The Must be attributes
    Critical quality attributes (CM).—Attributes that are critical to customers; firms must provide sufficient fulfillment of these attributes to customers.
    Necessary quality attributes (NM).—Firms can meet these at a level sufficient to avoid dissatisfying customers.
  • The Indifferent attributes
    Potential quality attributes (PI).—These attributes will gradually become attractive attributes.
    Care-Free quality attributes (CFI).—Firms need not offer these attributes if cost considerations preclude this.
When dealing with new products or services, Reference [18] introduced three more categories, enumerated as follows.
  • Improve the features of the product: this option matches the ‘raise’ action noted above and has effects on “creative value” and “functional value”.
  • Integrate critical features into a new product: this strategy matches the ‘create’ action noted above and will contribute to “psychological value” and “creative value” significantly.
  • Create innovative products: Acquiring new customers and non-customers through the research and development of an innovative product is the best initiative of the ’create’ action of the ‘blue ocean’ strategy. This has significant effects on “psychological value” and “creative value”.
Once the categorization of each attribute has been achieved with the refined model approach and the categories of the Kano model; the next thing to do is to identify the attributes to be removed, lowered, raised, or created. Table 3 shows the categories of attributes and the actions to be implemented.

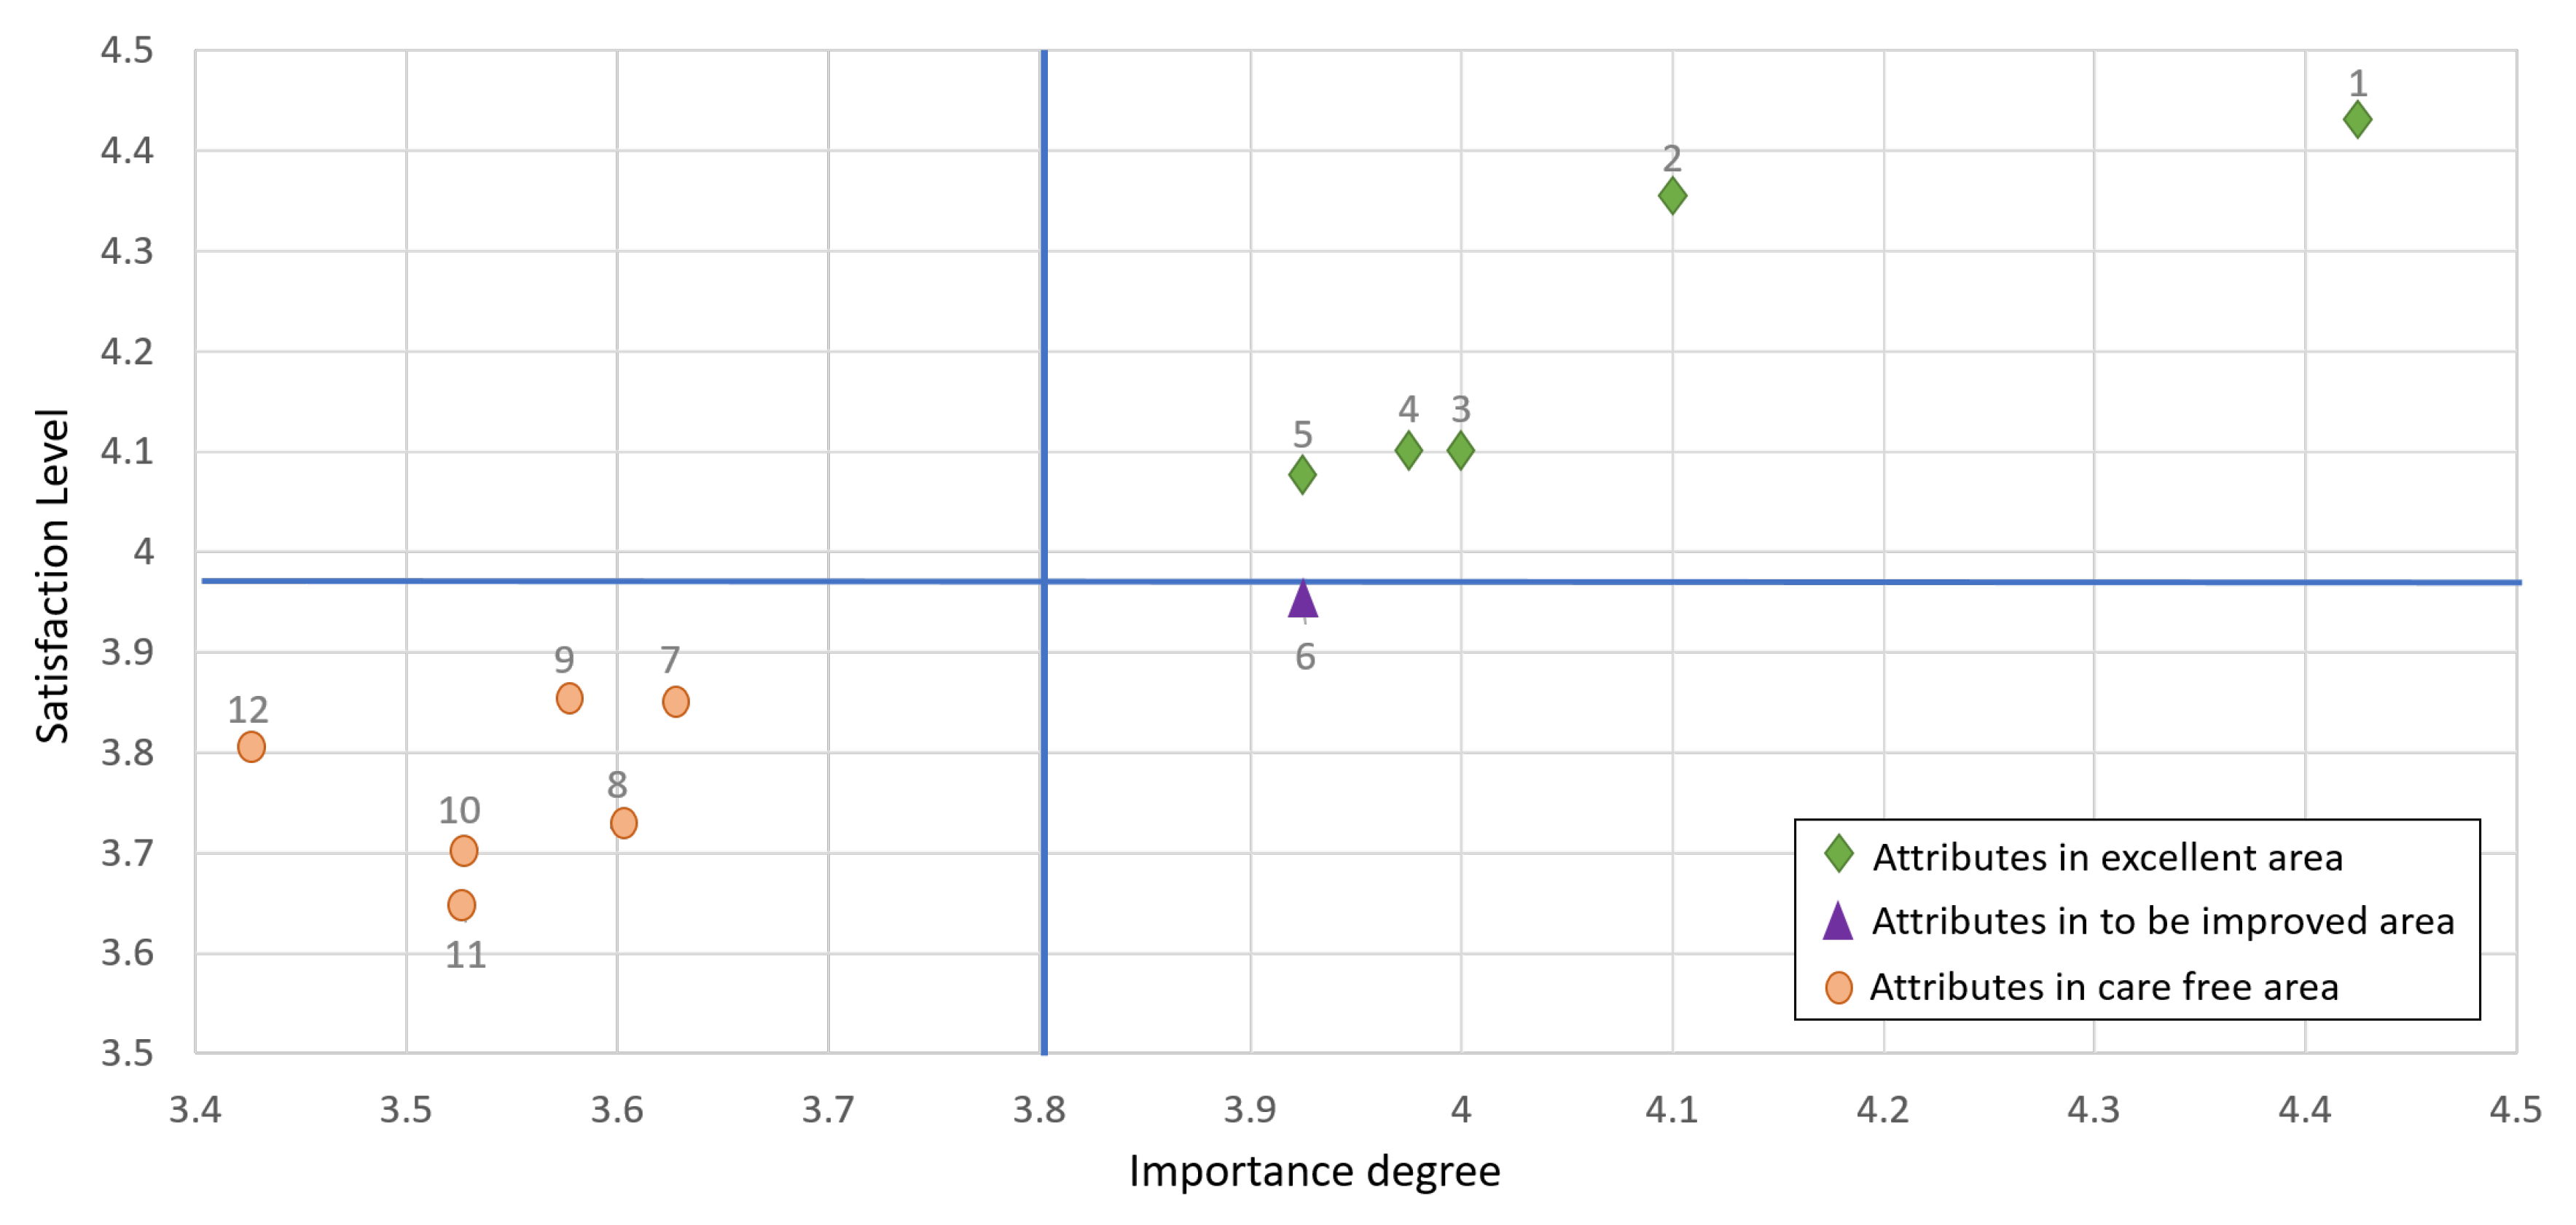
2.3. The Importance – Satisfaction Model

The Importance-Satisfaction (IS) model reflects the horizontal dimension, which shows the degree of importance of a quality attribute, and the vertical dimension shows the satisfaction level of the quality attribute [19]. The means of the importance scale and the satisfaction scale is used to divide the coordinate into four areas (see Figure 1), as follows.
I. Excellent area. The attributes located in this area are those that customers consider relevant, and for which the performance is satisfactory to customers. Retention of customers requires that performance in these attributes be continued.
II. To be improved area. It shows the attributes of the respondents when they have no relation to the attribute, that is, they do not care if it is present or not.
III. Surplus area. The attributes listed in this area are not very important to customers, but the perceptions of customers are quite satisfactory. The company can put these quality attributes aside. If the company needs to cut costs, these are the attributes that can be eliminated without incurring a significant negative impact on customer satisfaction.
IV. Care-free area. These quality attributes are those about which customers have a lower satisfaction level, but which they also rank as being less important. The company does not need to worry about these attributes because these items have less impact on the whole quality-evaluation process.

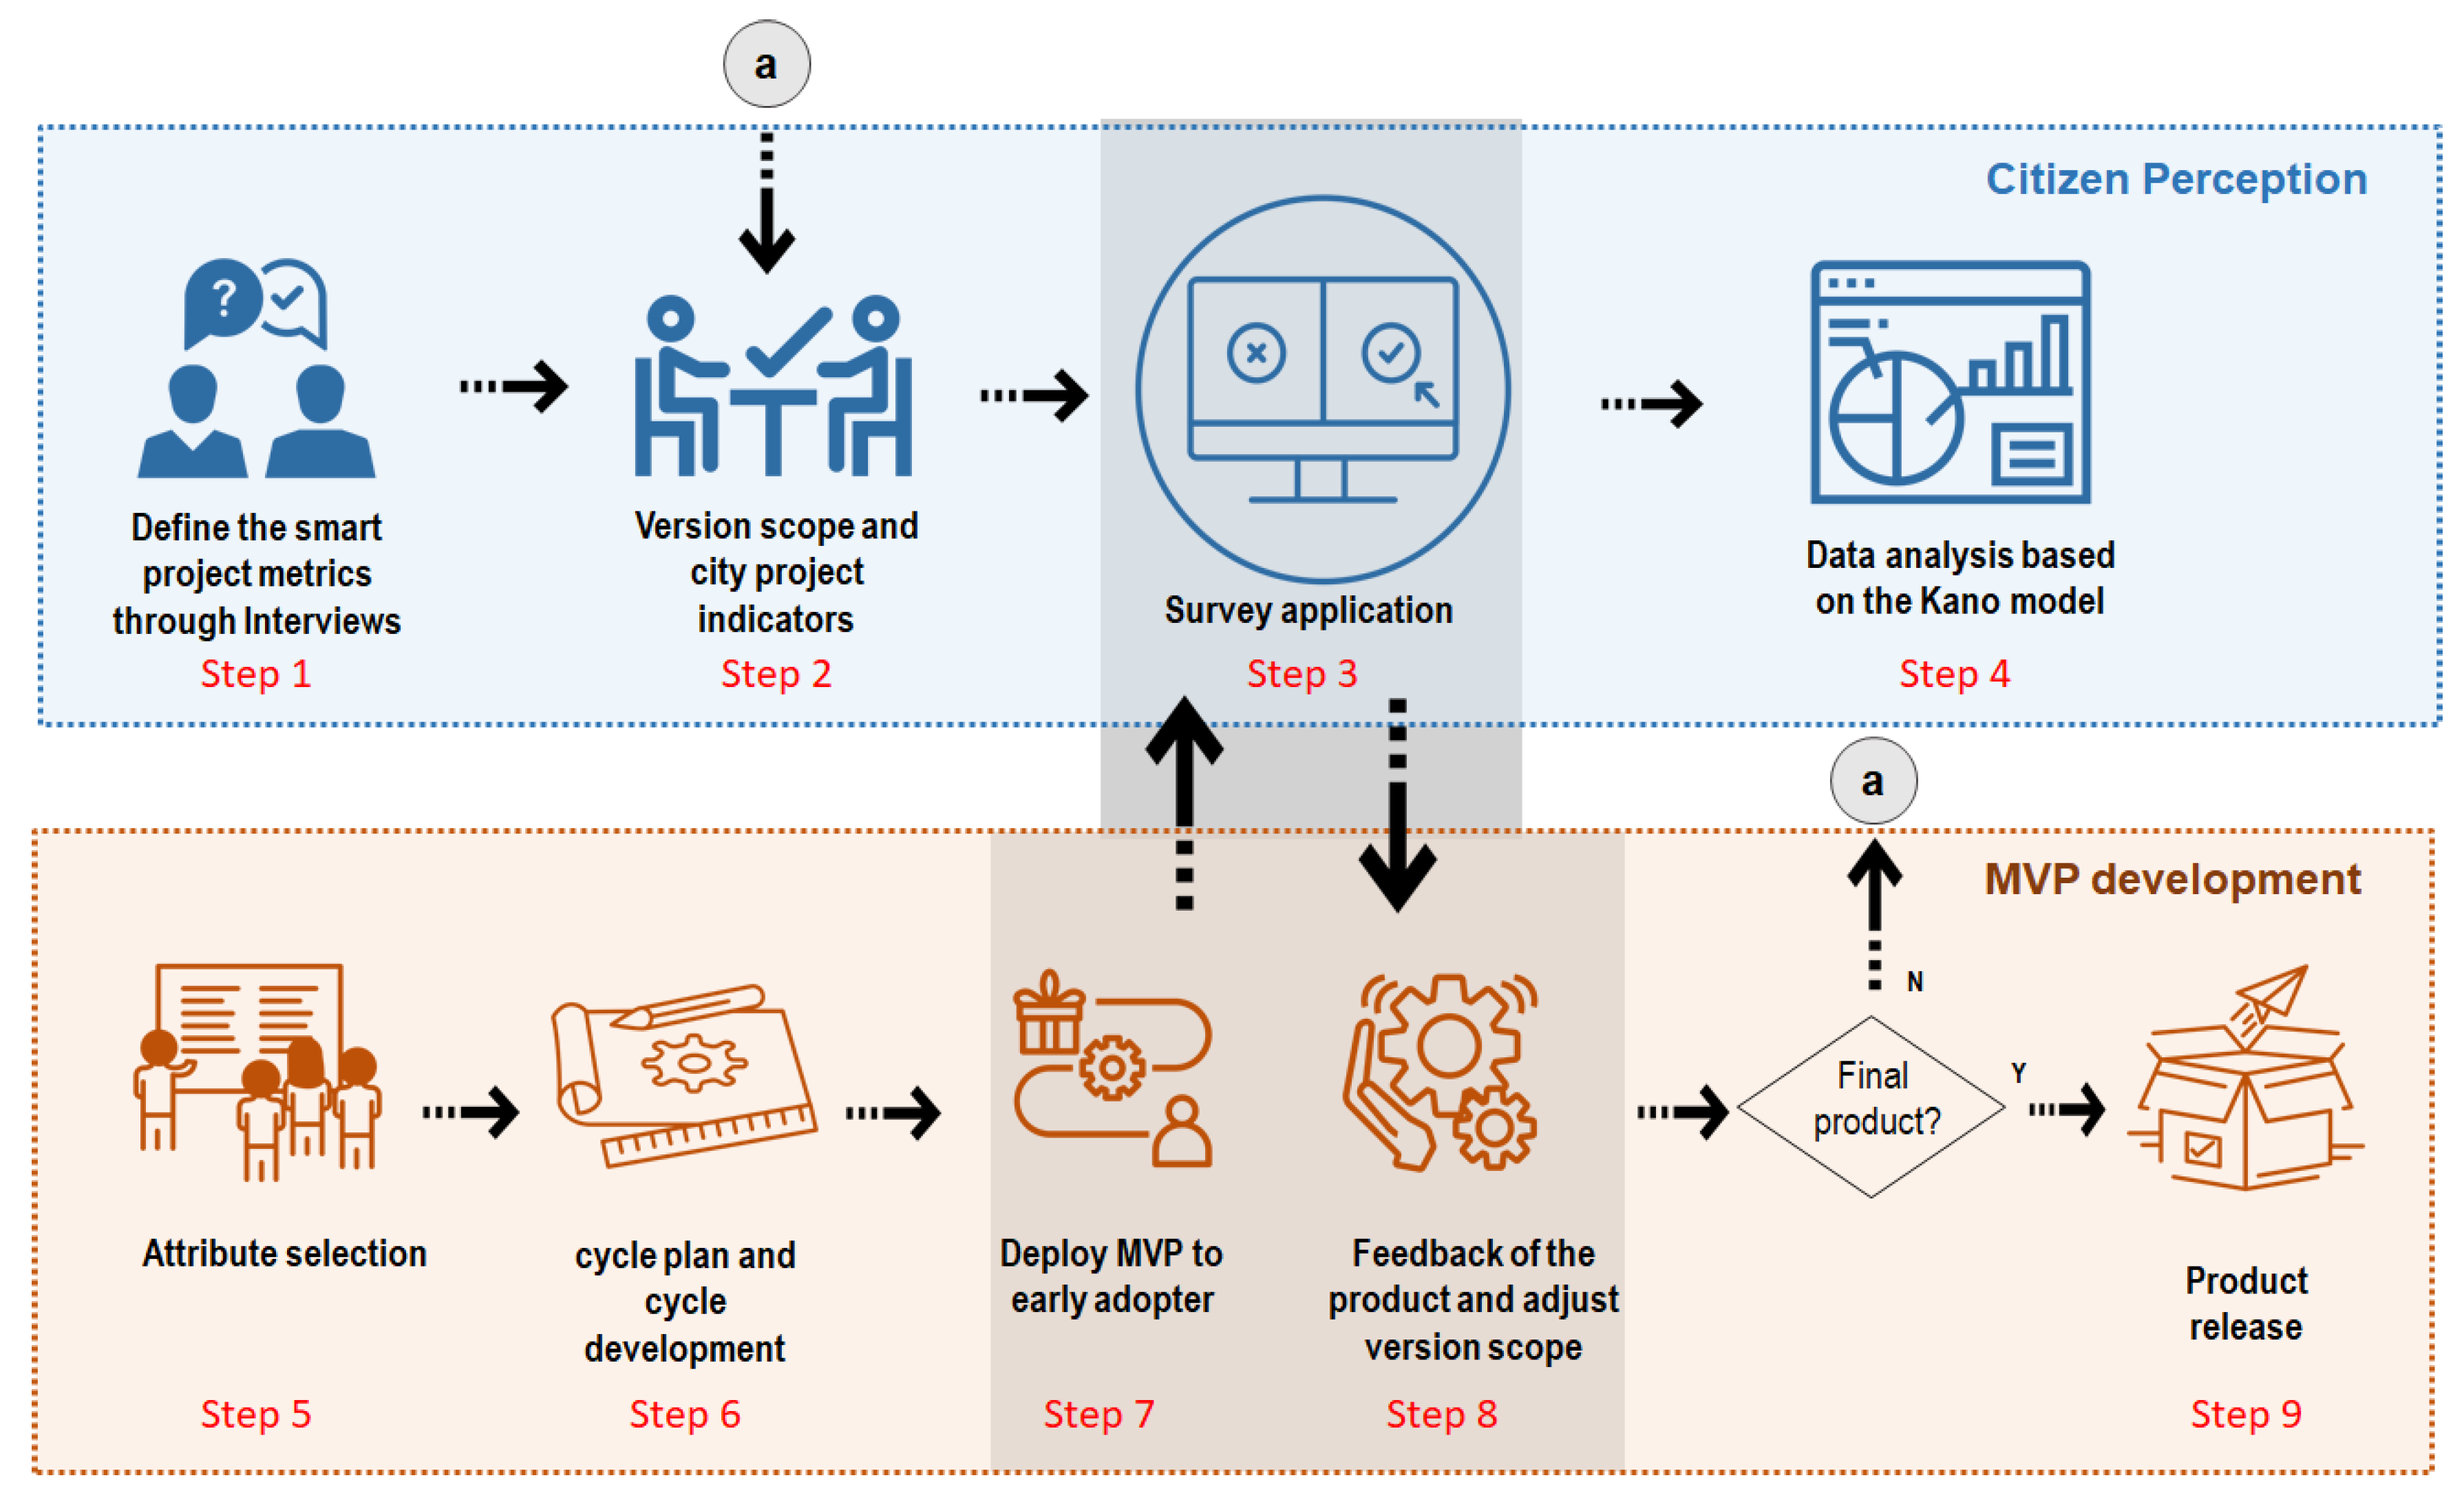
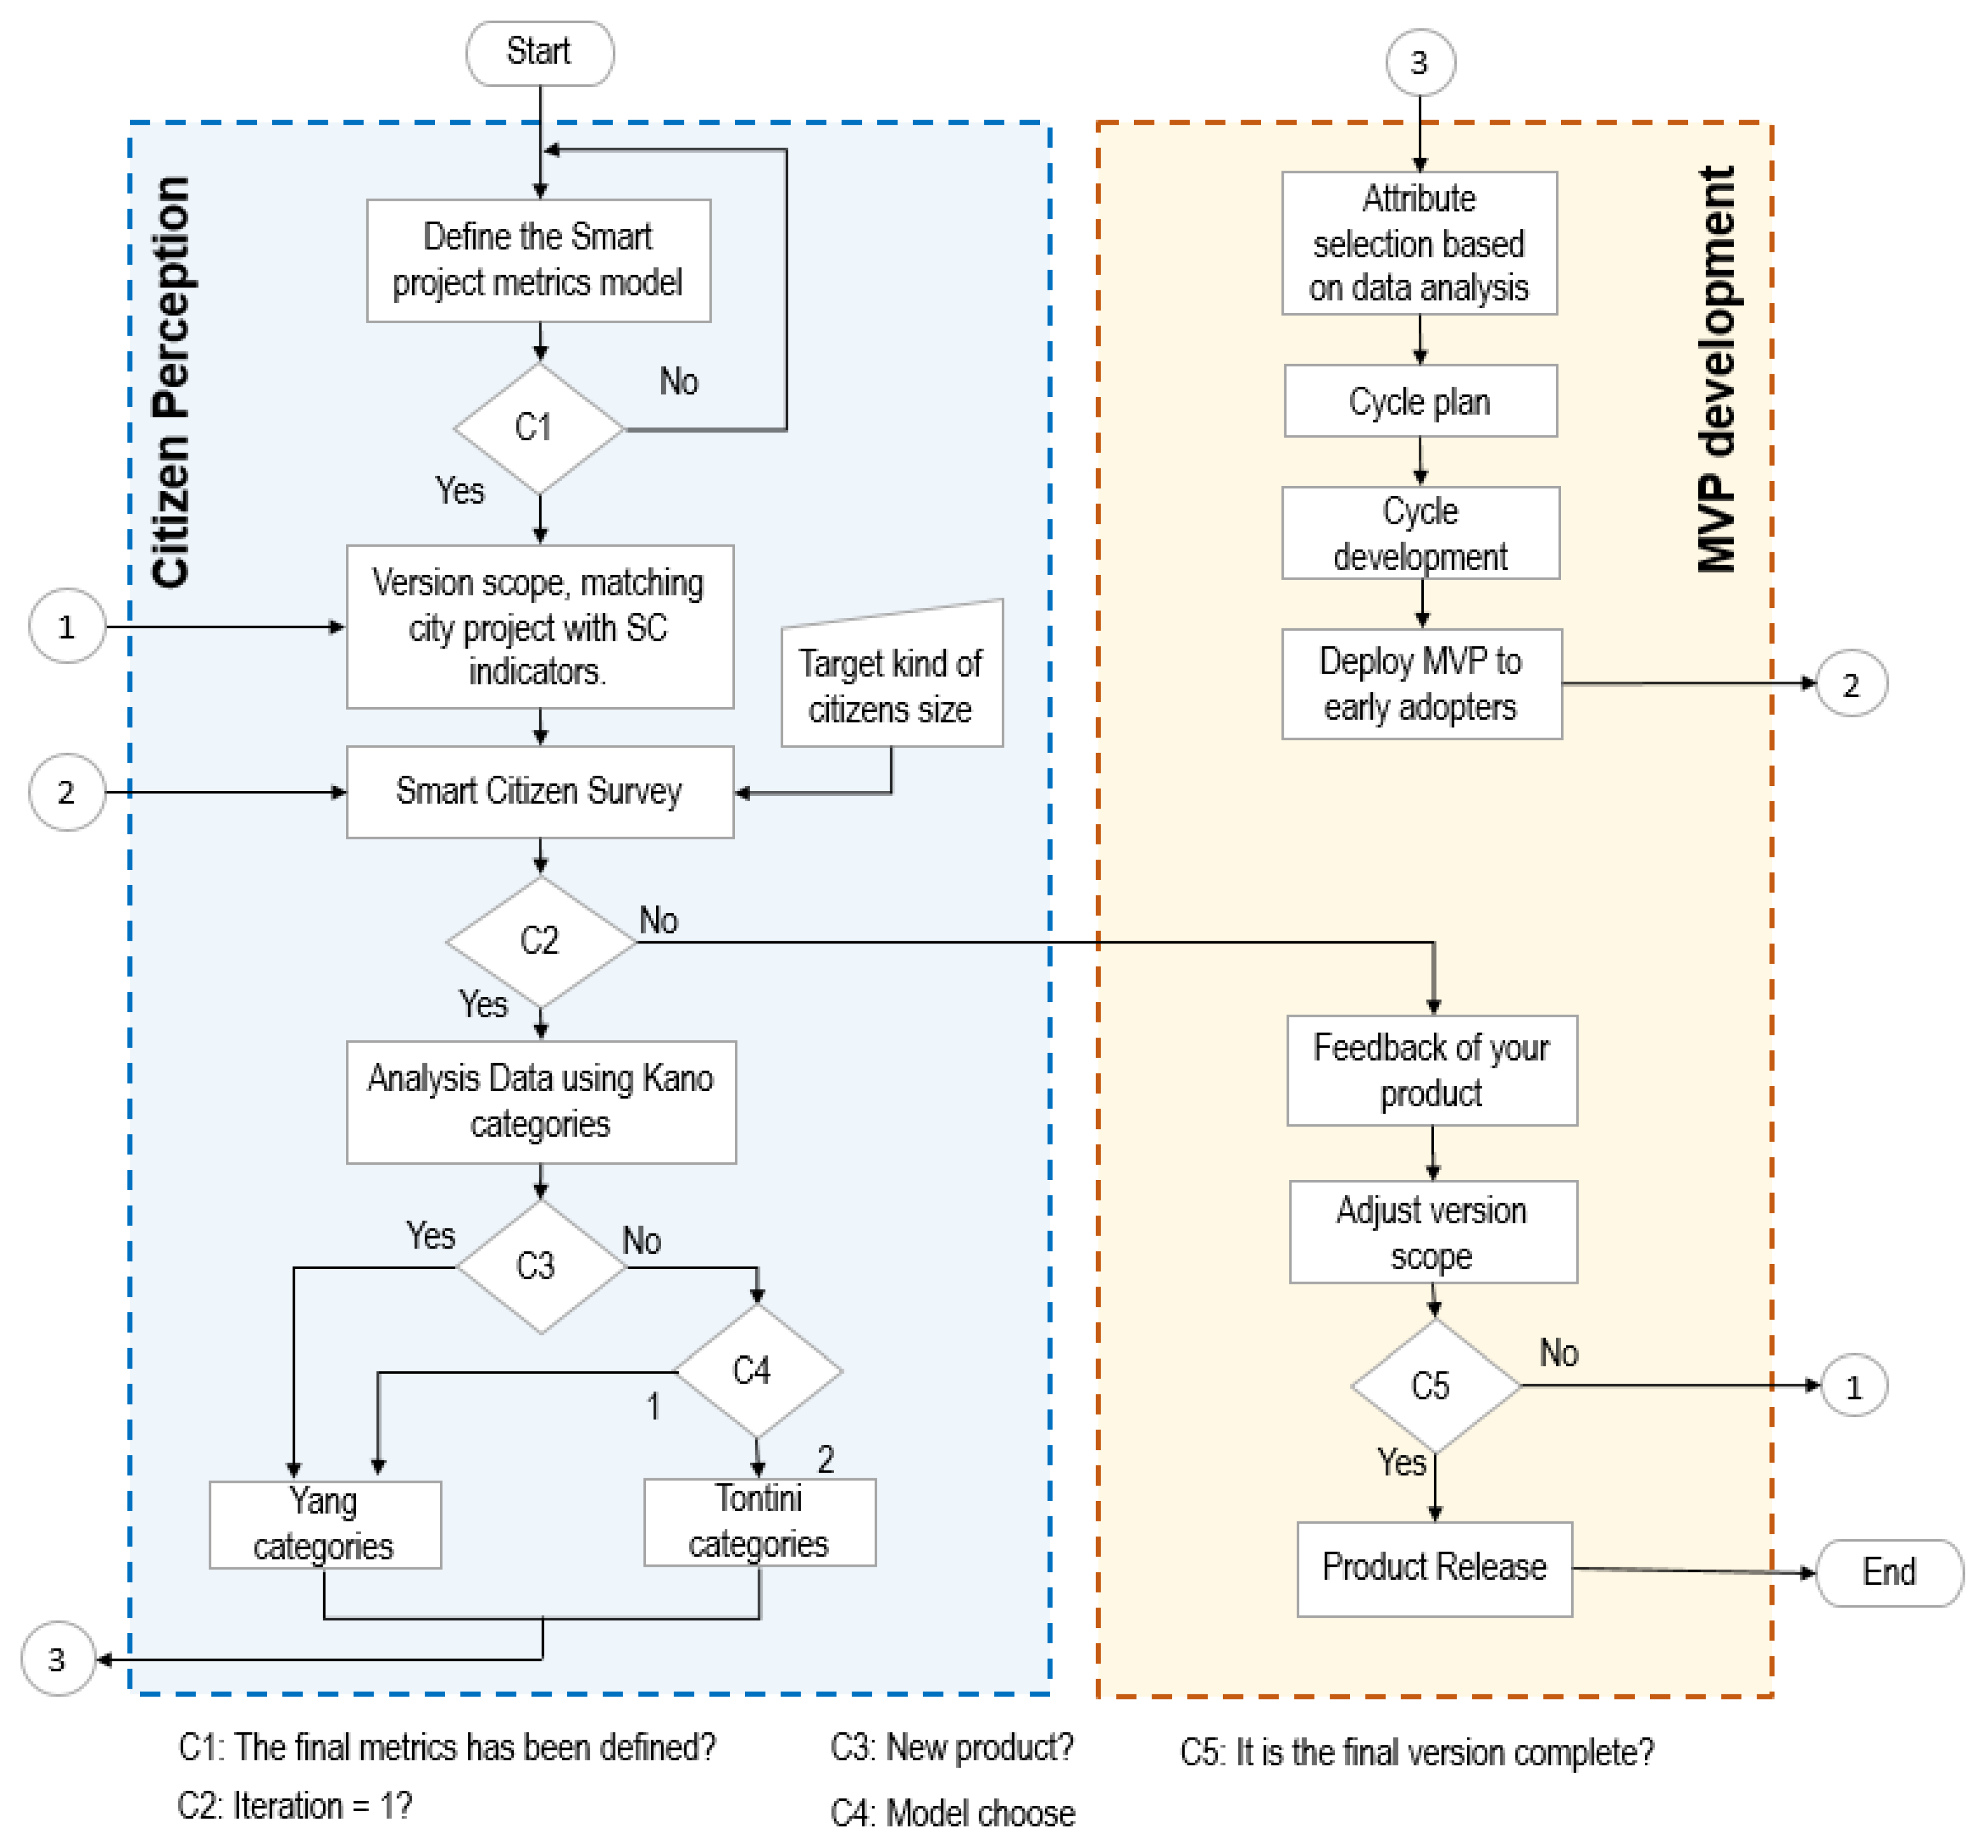
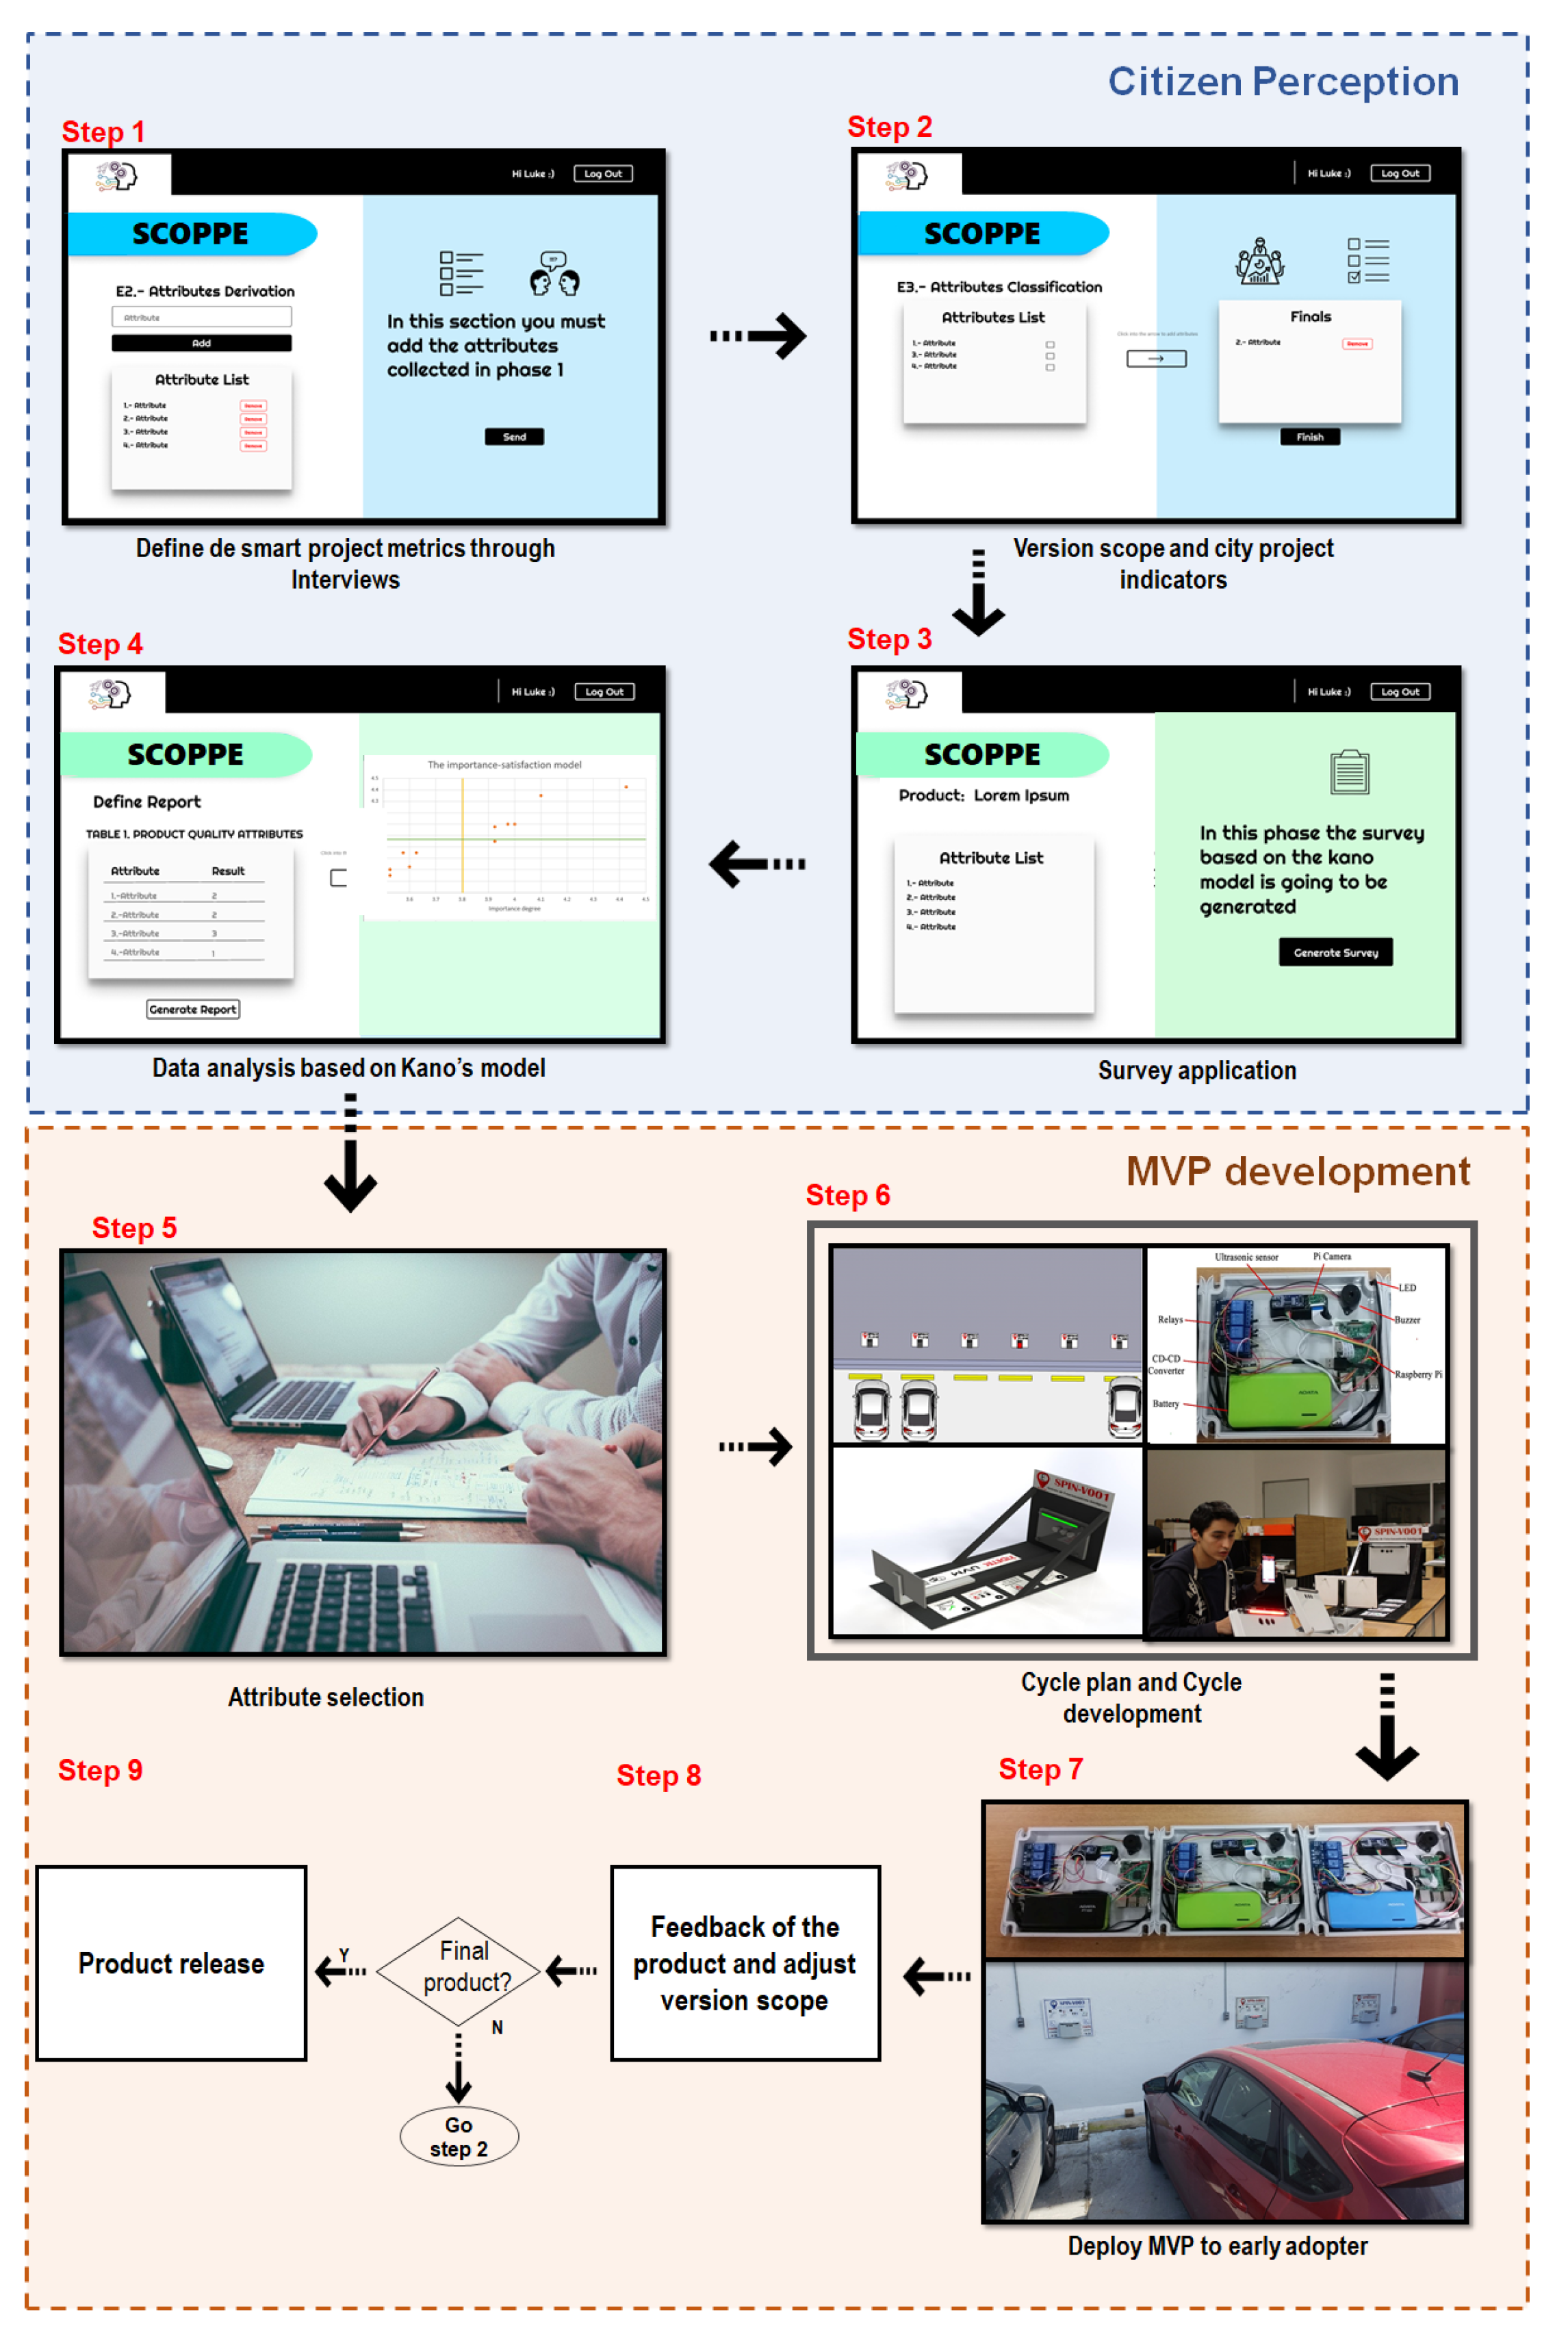
3. Smart Cities Oriented Project Planning and Evaluation (SCOPPE) Methodology

This work is inspired by the premise of maximizing benefits and promoting citizen participation when building a Smart City through Smart City projects. The three elements that need to be considered for building a Smart City are: (1) Data-ization that takes place first in order to strengthen connectivity, (2) a cloud-based open platform needs to be built, and (3) to create active mashup activities that make use of the data uploaded in the cloud [8]. It is key to decide how the technological possibilities will be used in order to advance the ICTs infrastructure of the city and optimally exploit their assets. Therefore, the proposed SCOPPE methodology involves the selection, planning, and evaluation of a Smart City project driven by citizen participation, taking into account the three main citizen’s categories: democratic participation, co-creators, and ICTs users [11].
Since the ultimate goal of building a Smart City is to improve the quality of life of the citizen, a key challenge is to carry out actions in coordination with the three pillars of a city: the Industry (production), Citizen (consumption), and Government (circulation). To do so, the SCOPPE methodology is introduced, and it is composed of two main stages: the Citizen Perception (CP) and the Minimum Viable Product (MVP) development (see Figure 2). Both stages consider the participation of the three mentioned pillars of a city. However, the complete SCOPPE methodology is driven mainly by citizen perception.
The SCOPPE methodology involves nine steps; steps two to eight can be iterated as many times as required until the product is ready to be released (step 9) (see Figure 2). The proposed methodology takes into account the framework presented in Reference [12] for the first stage (CP), and the second stage considers the necessary steps to release an MVP with the minimum indispensable metrics considered for people as in Reference [13].
In the CP stage, the steps describe the process for defining the Smart City project, their metrics, and the categorization of the attributes of the product or service presented. The results of this stage are used for the Smart City project planning.
Step 1. Defining the smart project metrics through interviews. When a Smart City project appears on the horizon, the government (decision-makers) and the industry (manufacturers of the product or service) define the first project metrics; then, interviews are applied to citizens to know their perception regarding the smart project.
Step 2. Version scope and city project indicators. Thanks to the interviews of citizens, the government and industry define the version scope of the Smart City project and city indicators according to the Cohen wheel. A relationship between the defined attributes and the Smart City indicators is obtained. Then, the target market that will use the product or service is determined.
Step 3. Survey application. A survey is generated following the Kano model, which is useful to classify the attributes of the product or service according to the perception of citizens. This survey is sent to people within the target market. The data is collected for posterior analysis, which will be carried out in the next step. If it is the first iteration of the product continues with step 4; otherwise, continue with step 7.
Step 4. Data analysis based on the Kano model. An analysis and attributes of categorization are carried-out. If the product or service is new, then Yang categorization will be used; otherwise, the industry can decide if they use Yang or Tontini categorization [20]. This categorization is intended to obtain the most sought-after and attractive attributes for the target market.
The MVP stage involves the planning, development, and evaluation of the MVP, which is a functional prototype that has the selected attributes by a decision-making process with industry and government according to the citizen perception.
Step 5. Attribute selection. The outcome of the data analysis is the attribute categorization. Once this is done, a meeting is held between the government and industry to select final attributes that will be present in the MVP of the product or service.
Step 6. Cycle plan and cycle development. The industry team: project manager and the development team, define the cycle plan to design and develop the MVP considering a low-level Work Breakdown Structure (WBS) for the cycle’s functionality. The assignment of activities to sub-teams, dependencies, and schedule, and finally micro-plans for sub-teams are made in this step.
Step 7. Deploy MVP to early adopters. A ready MVP with the core features or attributes allows the product to be deployed to early adopters. The interest of the early adopters is not only purely technological but also moves them to practical possibilities and to solving real problems that affect them. They are usually people who have social prestige and like to be seen as leaders or initiators of new trends.
Step 8. Feedback of the product and adjust version scope. Once the early adopters use the product, they will provide feedback about the MVP. According to this feedback, the government and industry can decide whether to release the product and go to step 9, or adjusting the version scope and go to step 2 to improve the MVP.
Step 9. Product release. At this point, the product can be considered ready to be released and the Smart City project can be launched on a large scale. It is worthwhile to mention that once the product is released, the same platform could be used to follow up on the project and continue learning about citizen perception.
The SCOPPE methodology enhances the participation of people, where citizens are consulted in every stage of the process when defining the Smart City project when classifying the attributes of the product or service to be developed and to given feedback when they participate as early adopters. The whole process is carried-out through adaptive project management. This methodology could be iterate as many times as required until we yield to product release and benefit all urban planning when transforming a city into a Smart City.

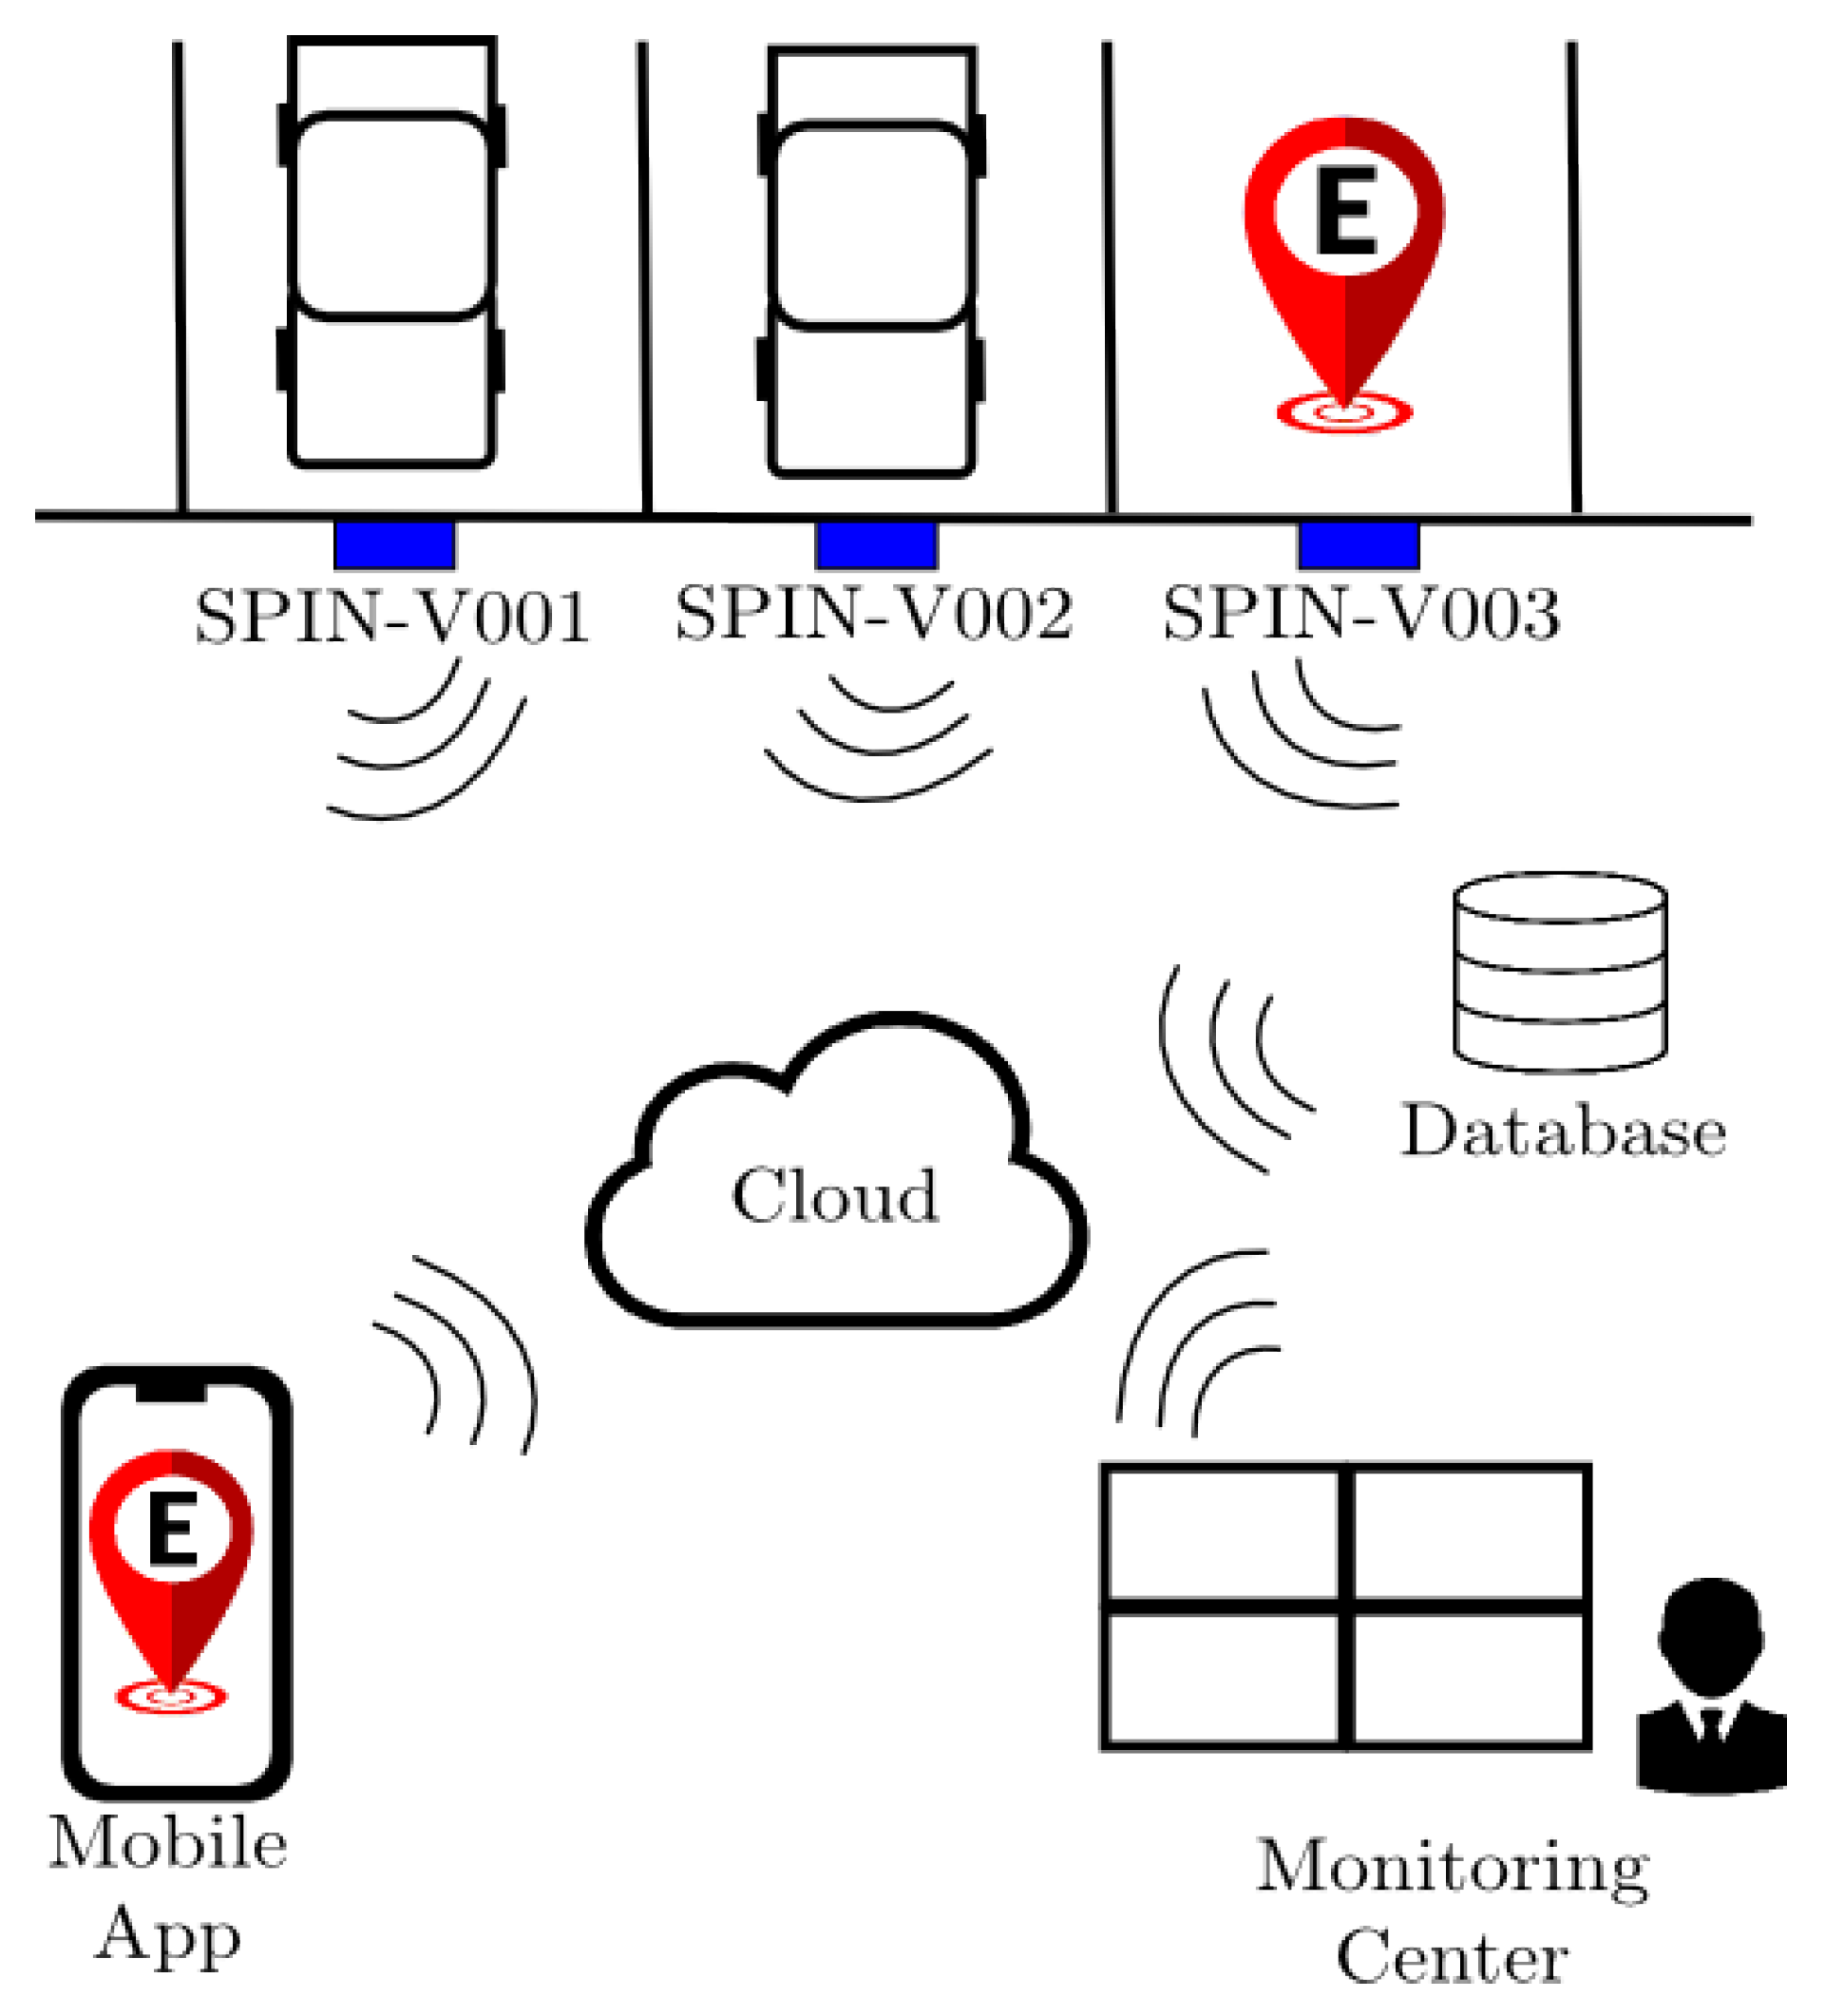
4. Results on the Application of the SCOPPE Methodology to an IoT Smart Mobility Project

As was mention in the previous section, the coordination of the proposal is based on three pillars of the city. For this proposal, these pillars are divided into government represented by the Rector of the university. The industry is composed of researchers from the Center of Research, Innovation, and Technological Development of the University of Mexican Valley (CIIDETEC-UVM, by its initials in Spanish). Finally, citizens are students, personal of the university, administrative and school staff, and researchers.
This initiative emerges from the availability of the university (Government) to create a smart university, invest in programs that facilitate and promote the use of the university resources, and involves the participation of the university community. The researchers (Industry) propose the implementation of a methodology that allows to validate relevant attributes to citizens and design an intelligent parking sensor as a case study. Finally, citizens made up of students, administrative staff, teachers, and researchers will be in charge of evaluating the attributes of the case study and the methodology proposed.

Application of the SCOPPE Methodology to the Case of Study: Intelligent Parking System SEI-UVM

For the validation of the proposed methodology, the SEI-UVM intelligent parking system study case was implemented within the facilities of the Universidad del Valle de Mexico (UVM), campus Guadalajara Sur. Following the steps of SCOPPE methodology, next to the implementation, and the results of every step are described below.
The SCOPPE methodology is composed of nine steps. Each of the activities carried out for the development of the smart parking sensor is described in detail in the flow diagram in Figure 3.
The CP stage is made up of different activities thought its four steps, in order to conduct the citizen participation, a dashboard called SCOPPE platform was implemented. Every one of the steps are described as follows.
Step 1. Define the smart project metrics model. For this first step, a group of researchers related to the project met to determine the metrics the parking sensor would have and what attributes would be the initials. It is worth mentioning that initially 17 possible attributes were chosen. This step ends when there are no more changes and the initial attributes are determined (condition represented by the rhombus). These attributes are introduced in the platform as a first working version.
Step 2. Version scope, matching city projects with smart cities indicators. The scope of the version is defined by the same group of researchers. The Cohen wheel is used to obtain the relationship between the defined attributes and the smart cities indicators. With the version scope, the target market that will use the product is defined. When the scope version and Smart City metrics are decided, the final attribute selection is performed in the SCOPPE platform, next the SCOPPE platform will generate the applying survey. For this study, only the integrated ICTs indicators have been taking into account due to the status quo of the UVM scenario.
Step 3. Smart City survey. A survey is obtained following the Kano model for the validation of the attributes, and it is sent to the people of the target market (students, administrative staff, teachers, and other researchers). The platform will be in charge of generating the survey that will be applied; the link of the interview will be sent directly to the email to share it with the end-users defined as my target market. Every time a user answers the survey, it will be automatically counted on the platform to control the number of people who evaluate the attributes of the product. If it is the first iteration of the product, continue with step 4; otherwise, continue with step 7.
After explaining the functionality of SPIN-V, using application models and explaining its operation, an interview was applied to a nominal total of 60 citizens, in order to determine the qualitative attributes of the product, of which it was possible to obtain 12 attributes.
Step 4. Analysis Data using Kano categories. An analysis and attributes categorization are carried out. Once a considerable number of answered surveys (defined by the user) have been reached, (60 surveys were conducted for our case study), the data analysis can be generated, which presents the categorization of the attributes for their relevance and satisfaction according to the Kano model. For this proposal, as it is a new product, Yang categorization was used (condition C3 in the Flowchart).
For designing the smart citizen survey, three kinds of questionnaires were designed considering the Kano’s model, the refined Kano’s model, and the Importance-Satisfaction (IS) model:
  • The importance of quality attributes.
  • The satisfaction of quality attributes.
  • The categorization of attributes according to Kano’s model.
For the first two surveys (Importance and Satisfaction), Likert-type 5 scales were used. The questionnaire for the categorization of attributes with Kano’s model is designed as in Table 1.
For the target kind of citizen, a total of 59 individuals randomly were surveyed, and 49 valid questionnaires were obtained. The participants included students (55 percent of respondents), educational (36 percent of respondents), and administrative staff (9 percent of respondents) from the UVM campus Guadalajara Sur, of which 64 percent of the respondents were male, and 36 percent were female. Additionally, 59 percent of the interviewees are between 19 and 25 years old, 21 percent range between 26 and 35 years, and 29 percent are over 36 years old.
In our study, we considered the SEI-UVM as a new product/service since there is no record of a parking program at the University. Therefore, the category of each attribute is defined using refined Kano’s categories and the IS model as is in the Section 2.2 and Section 2.3, respectively. The results of the implementation following the CUCEA methodology for Yang categorization are shown in Table 4.
Finally, the results, as it is mentioned by [12], is to know if this smart mobility project represents a valuable asset for the city’s authorities, to support strategic investments for the Smart City development based on the perception of the citizens. In order to define the relevance of the perceptions, 12 quality attributes and the degrees of importance were evaluated and classified in two categories: ‘high’ importance if the degree of importance was greater than the mean for the 12 quality attributes, and ‘low’ importance otherwise. This allowed the classification of the categories according to the refined Kano model (see the sixth column of Table 4). Once this step is finished, continue with the MVP stage.
For the second stage, the MVP development, the steps five to nine describe the process after receiving the data categorization until the product is released to the market.
Step 5. Attribute selection based on data analysis. In this step, the final attributes that will be part of the working version are obtained (follow the circle with the number 3). This final classification is decided by the government and industry. Figure 4 presents the attributes and their classification according to the Importance-Satisfaction model.
Table 3 presents the obtained results from the data analysis, and it shows that the people surveyed have given priority to the attributes related to security. The attribute ranked number one is the attribute that corresponds to an alarm center to report if a vehicle leaves the parking place without the driver’s permission. This attribute is classified as one-dimension and high value-added according to the Kano model and the refined model of Kano, respectively. Therefore, this attribute is usually demanded by customers, and their level of satisfaction is proportional to the level of compliance, and is significant to customer satisfaction so they can generate an increase in revenue. It is worthwhile to mention that the attributes ranked from first to fifth place are located in the excellent quadrant (area) in the IS Model (see Figure 4); therefore, customers considered them to be important, and for which their performance is satisfactory to customers. Retention of customers requires that performance in these attributes be continued.
The attribute ranked as number two is the attribute corresponding to the option to notify the user when he arrives and when the vehicle is removed from the parking place. This attribute is classified as indifferent in the Kano model, and potential quality according to the refined Kano model, which means that this attribute has the potential to satisfy customers in the near future.
The third attribute corresponds to a system to identify if a vehicle is incorrectly parked and warns the driver; the fourth place corresponds to the device that verifies if a parking space is free, occupied, reserved, or out of service. Both attributes are classified as attractive and highly attractive quality according to the Kano model and the refined model of Kano, respectively. Therefore, these attributes represent strategic elements to attract potential customers.
The fifth attribute is a mobile application to publicize the availability of parking places to users, which is classified as indifferent and potential quality according to the Kano model and the refined model of Kano, respectively, meaning that this attribute has the potential to satisfy customers shortly.
The sixth attribute is related to a light that indicates that a parking spot is already reserved, and is classified as indifferent in the Kano model, and potential quality according to the refined Kano model. Furthermore, it is located in the to-be improved quadrant in the IS Model; therefore, customers considered it important; however, the performance has not met expectations. Then, improvements to this attribute should be made immediately.
The attributes ranked from seventh to twelfth place, are located in the care-free area in the IS Model; therefore, we do not need to worry about these attributes because these items have less impact on the whole quality-evaluation process from the client.
The results lead us to key information to make the attribute selection process before continuing with the development of the MVP, which will be composed of these selected attributes. Attributes ranked (1st, 2nd, 3rd, 4th, 5th) in the excellent area, the attribute ranked 6th in the to-be improved area, and the attribute ranked 9th in the care-free area are selected for the MVP development. It can be noted that the ninth attribute is classified as attractive and highly attractive quality according to the Kano model and the refined Kano model, respectively. This means that this attribute can be discarded if cost considerations demand this; however, adding this attribute will not represent an extra cost in terms of hardware. In addition, although this attribute is located in the care-free area, we consider it relevant to take it into account since it can automate the vehicle identification process.
Step 6. Cycle plan and cycle development. A meeting is held to plan the development of the prototype (Industry). During this activity, the necessary personnel, costs, available resources, and development time are considered ( activities of this step include cycle plan and cycle development).
The proposed SEI-UVM is a smart parking system that is devoted to private parking lots, and it is composed of three main elements: (1) the SPIN-V, (2) a mobile application, and (3) a monitoring center (see Figure 5). Each parking space is equipped with a SPIN-V located in the middle of the rear of the parking place; the mobile application is for the driver/user to monitor and reserve a parking space, developed and monitored in the National Observatory of Digital Smart Environments (OBNiSE by its acronym in Spanish) in UVM; and finally, the monitoring center is for the owner of the private parking lots to manage and control parking spaces.
The smart vehicular presence sensor (SPIN-V, in its Spanish acronym) is going to be the cornerstone of the SEI-UVM. The SPIN-V gathers the information on the occupation of the parking spaces. More information about the development of the SPIN-v can be found in [21]).
Step 7. Deploy MVP to early adopters. When a MVP is obtained and release to early adopters, feedback is considered about the product, to obtain information about the attributes they liked, and those that did not and information about the general operation of the product. The installation of a smart parking MVP at the UVM is shown as a case of study. Currently, the SEI-UVM is in this stage. The complete sensor for the SEI-UVM is presented in Figure 6.
The SEI-UVM smart mobility project is ready to be released to the early adopters. Therefore, step 8 and 9 represent the future work for this project.
A summary of the application of the SCOPPE methodology with all the steps involved to the SEI-UVM is shown in Figure 7.

5. Discussion

Smart City strategies until now emphasized solving customer problems instead of competitiveness in production, decentralization rather than centralization, building new cities instead of innovating big old ones. However, the advent of the 4th Industrial Revolution is calling for new Smart City strategies [8]. Besides, Smart Cities are mostly focused on strategic drivers and specific actions, instead of prioritizing the creation of environments that promote happiness and well being of their citizens, which should be the main function of a city.
It is interesting how the wide spectrum of applications that the SCOPPE methodology could bring when new urban planning projects appear on the horizon. Moreover, promote the people’s participation could lead to getting useful and necessary information that allows the analysis of people’s perception. In addition, using this information to drive the design and construction of products and/or services that satisfy the needs of citizens will improve the environment of cities, and the technology acceptance and appropriation curve is reduced considerably.
Finally, the university can be seen as a micro-city. Here a Smart Campus plus the SCOPPE methodology will play a key role when the academic and student population look for consulting for the validation and development of new smart projects before launching them to the actual city; bringing more certainty and rising the success rate of these kinds of projects.

6. Materials and Methods

This research is considered a qualitative nature because it seeks to analyze representative population perception level of UVM in terms of satisfaction, quality, and importance of the SEI-UVM, through applications of surveys, and thus make decisions regarding the system design, development, and deployment.
This study involves the survey applications to humans; however, there is no need for ethical approval since the survey contained a privacy notice. The access to the database can be done in the following link: https://url2.cl/TEVG5.
Besides, the materials for the design and implementation of the cornerstone of the SEI-UVM, the SPIN-V, can bee found in [21]. Moreover, for videos on the performance tests of the SPIN-V can be downloaded from https://url2.cl/qCifp.

7. Conclusions

An important theoretical framework was considered to relate the citizen satisfaction index with the metrics of Smart Cities to interpret the perception of citizens of a representative population of the UVM Campus Guadalajara South. The participants answered allows to cluster the different perception and classified the final attributes using the Kano’s model and to evaluate the attributes for a minimum viable product implementation.
The combination of a framework that promotes citizen participation and the development and design of a minimum viable product are the main contributions of this proposal. The results of this contribution allow the communication of the three pillars on the smart cities. (1) To introduce the citizens’ participation during the implementation of a proposal; (2) the government oversight and intervention during any process; and (3) the confidence of the industry for the development of products/services that consider the needs of a city. The proposed SCOPPE methodology allows adaptive project management, improves the quality of the resulting product/service, and takes advantage of the process to obtain a better evaluation and automation of attributes with the SCOPPE platform implementation. To gather information on the type of target citizen, since we can apply the survey at any stage of the product/service, from its conception until the version that is already suitable for release.
Since smart mobility projects represent the first step towards the Smart City, the case study of an Intelligent Parking System (SEI-UVM) represents a solution aimed at contributing technologically to the development of smart cities through the use of ICTs and test the theoretical concept in which the variable Smart City was shown with a direct positive relation in the perception of satisfaction. In particular, the SPIN-V based on the internet of things has been identified as the cornerstone of the SEI-UVM solution. It is worthwhile to mention that the smart mobility project appears in the Boyd Cohen Wheel with three main indicators: integrated ICTs, mixed-modal access, and prioritized clean, and non-motorized option. The proposed methodology can be easily adapted and applicable not only to sustainability projects but also to any work area. For future implementations, we aim to extend the SEI-UVM proposal, receive feedback from customers, make the required changes, and release the product.

Author Contributions

Conceptualization, V.G.P.-Q. and L.F.L.-V.; methodology, V.G.P.-Q., L.F.L.-V., E.L.-N. and M.A.C.-M.; software, L.F.L.-V., V.G.P.-Q. and M.A.C.-M.; validation, M.A.C.-M. and E.L.-N.; formal analysis, L.F.L.-V. and V.G.P.-Q.; investigation, L.F.L.-V., V.G.P.-Q., M.A.C.-M. and E.L.-N.; resources, V.G.P.-Q.; data curation, L.F.L.-V.; writing–original draft preparation, V.G.P.-Q., L.F.L.-V. and M.A.C.-M.; writing–review and editing, V.G.P.-Q., L.F.L.-V. and M.A.C.-M.; visualization, M.A.C.-M. and L.F.L.-V.; supervision, L.F.L.-V. and E.L.-N.; project administration, L.F.L.-V. All authors have read and agreed to the published version of the manuscript.

Funding

This research received no external funding.

Acknowledgments

We acknowledge the Mexican research agency CONACYT for the scholarships 77513 and 366999. We would like to thank the engineering student David Michel-Torres, Jesus R. Miranda-Flores and Fernando Vázquez-Durand from Universidad del Valle de México, who has been collaborating in the development of the project SEI-UVM.

Conflicts of Interest

The authors declare no conflict of interest.

References

  1. Ceballos, G.R. La viabilidad de un proyecto de Smart City como estrategia mercadológica. Caso: CUCEA. Red Int. Investig. Compet. 2018, 10, 629–646. [Google Scholar]
  2. Peek, G.J.; Troxler, P. City in transition: Urban open innovation environments as a radical innovation. In Proceedings of the 19th International Conference on Urban Planning, Regional Development and Information Society (REAL CORP), Vienna, Austria, 21–23 May 2014; pp. 1–10. [Google Scholar]
  3. Maciá Perez, F.; Berná, M.J.; Sánchez, J.M.; Fonseca, I.; Fuster, A. Smart University, Hacia una Universidad más Abierta; Alfaomega MarcoCombo Editorial S.A.: Mexico City, Mexico, 2016; Chapter 3; ISBN 9788426723284. [Google Scholar]
  4. Manville, C.; Cochrane, G.; Cave, J.; Millard, J.; Pederson, J.K.; Thaarup, R.K.; Liebe, A.; Wissner, M.; Massink, B.; Kotterink, B. Mapping Smart Cities in the EU: Study; Publications Office of the European Union: Luxembourg, 2014; Chapter 2; ISBN 9282347613. [Google Scholar]
  5. Trindade, E.P.; Farias-HInning, M.P.; Moreira da Costa, E.; Sabatini-Marques, J.; Cid-Bastos, R.; Yigitcanlar, T. Sustainable development of Smart Cities: A systematic review of the literature. J. Open Innov. Technol. Mark. Complex. 2017, 3, 1–14. [Google Scholar] [CrossRef] [Green Version]
  6. IESE Business School. These Are the Smartest Cities in the World for 2019, Forbes, IESE Cities in Motion Index 2019. University of Navarra. Available online: https://cutt.ly/GfdTxz9 (accessed on 26 August 2020).
  7. Cooke, P. Silicon Valley imperialists create new model villages as Smart Cities in their own image. J. Open Innov. Technol. Mark. Complex. 2020, 6, 24. [Google Scholar] [CrossRef] [Green Version]
  8. Yun, Y.; Lee, M. Smart City 4.0 from the perspective of open innovation. J. Open Innov. Technol. Mark. Complex. 2019, 5, 92. [Google Scholar] [CrossRef] [Green Version]
  9. Arnstein, S.R. A ladder of citizen participation. J. Am. Inst. Plan. 1969, 35, 216–224. [Google Scholar] [CrossRef] [Green Version]
  10. Rosener, J.B. Citizen participation: Can we measure its effectiveness. Public Adm. Rev. 1978, 38, 457–463. [Google Scholar] [CrossRef]
  11. Simonofski, A.; Serral-Asensio, E.; Wautelet, Y. Citizen participation in the design of Smart Cities: Methods and management framework. In Smart Cities: Issues and Challenges. Mapping Political, Social and Economic Risks and Threats; Elsevier: Amsterdam, The Netherlands, 2019; pp. 47–62. [Google Scholar]
  12. Ceballos, G.R.; Larios, V.M. A model to promote citizen driven government in a Smart City: Use case at Guadalajara Smart City. In Proceedings of the 2016 IEEE International Smart Cities Conference (ISC2), Trento, Italy, 12–15 September 2016; pp. 1–6. [Google Scholar]
  13. Nuseibah, A.; Reimann, C.; Zadnepryanets, M.; Wolff, C.; Otegi Olasco, J.R. Minimum Viable Product creation through adaptive project management- An extended approach for the management of innovation Projects: The Ecochallenge Case. In Proceedings of the 9th International Conference on Intelligence Data Adquisicion and Advanced Computing Systems: Technology and Applications (IDAACS), Bucharest, Romania, 21–23 September 2017; pp. 1–6. [Google Scholar]
  14. Rotar, L.J.; Kozar, M. The Use of the Kano Model to enhance customer satisfaction. Organizacija 2017, 50, 339–351. [Google Scholar] [CrossRef] [Green Version]
  15. Xu, Q.; Jiao, R.J.; Yang, X.; Helander, M.; Khalid, H.M.; Opperud, A. An analytical Kano model for customer need analysis. Des. Stud. 2009, 30, 87–110. [Google Scholar] [CrossRef]
  16. Mote, S.; Kulkarni, V.; Narkhede, B.E. Kano Model application in new service development and Customer satisfaction. IOSR J. Bus. Manag. 2016, 18, 10–14. [Google Scholar] [CrossRef]
  17. Coleman, L.B. The Customer-Driven Organization: Employing the Kano Model; CRC Press Taylor & Francis Group: Boca Raton, FL, USA, 2014. [Google Scholar]
  18. Yang, C.C.; Yang, K.J. An integrated model of value creation based on the refined Kano’s model and the blue ocean strategy. Total Qual. Manag. Bus. Excell. 2011, 22, 925–940. [Google Scholar] [CrossRef]
  19. Yang, C.C. The refined Kano’s model and its application. Total Qual. Manag. Bus. Excell. 2005, 16, 1127–1137. [Google Scholar] [CrossRef]
  20. Gérson, T. Identification of customer attractive and must be requirements using a modified Kano’s model method: Guidelines and Case Study. In Quality Congress. ASQ’s Annual Quality Congress; ABI/INFORM Global: Indianapolis, IN, USA, 2000; p. 728. [Google Scholar]
  21. Luque-Vega, L.F.; Michel-Torres, D.A.; Lopez-Neri, E.; Carlos-Macilla, M.A.; González-Jiménez, L.E. IoT Smart Parking System Based on the Visual-Aided Smart Vehicle Presence Sensor: SPIN-V. Sensors 2020, 20, 1476. [Google Scholar] [CrossRef] [Green Version]
Figure 1. The importance-satisfaction model.
Sustainability 12 07088 g001
Figure 2. Smart Cities Oriented Project Planning and Evaluation (SCOPPE) methodology.
Sustainability 12 07088 g002
Figure 3. Proposed methodology: citizen perception and minimum viable product generation.
Sustainability 12 07088 g003
Figure 4. The importance-satisfaction model of the SEI-UVM project.
Sustainability 12 07088 g004
Figure 5. Smart parking system SEI-UVM.
Sustainability 12 07088 g005
Figure 6. SPIN-V for the SEI-UVM.
Sustainability 12 07088 g006
Figure 7. Extended SCOPPE Methodology applied to SEI-UVM project.
Sustainability 12 07088 g007
Table 1. Functional and dysfunctional questions of the Kano’s Model.
Question TypeQuestionOptions
Like
How does it feel if the attribute isMust be
Functionalpresent in the product?Neutral
Acceptable
Dislike
Like
How does it feel if the attributeMust be
Dysfunctionalis not present in the product?Neutral
Acceptable
Dislike
Table 2. Categories used in the Kano model.
CustomerDysfunctional (Negative Question)
RequirementsLikeMust beNeutralAcceptableDislike
LikeQAAAO
FunctionalMust beRIIIM
(PositiveNeutralRIIIM
Question)AcceptableRIIIM
DislikeRRRRQ
Table 3. Categories used by Yang [18] in a refined version of the Kano model.
CategoryDescription
Highly attractive quality attributesFirms should use these strategic attributes to attract potential customers.
Less attractive attributesFirms should maintain the existing level of these attributes, but fulfillment levels of these attributes can be reduced if required by cost considerations.
High value-added attributesThe fulfillment levels of these attributes should be raised.
Low value-added attributesFirms can reduce the fulfillment levels of these attributes to reduce costs but need to avoid reducing these attributes to a level that will cause customer dissatisfaction.
Critical attributesThese attributes are of great importance to customers, and the fulfillment levels of these attributes should therefore be raised.
Necessary attributesThese attributes should therefore be maintained at existing levels; however, care should be taken to avoid reducing these attributes to a level that will cause customer dissatisfaction.
Potential attributesFirms should improve the fulfillment level of these attributes—because they do have potential to satisfy customers in the near future.
Care-free attributesFirms should eliminate these attributes in view of cost considerations.
Reverse attributesFirms should eliminate these attributes to avoid dissatisfying customers.
Table 4. SEI-UVM quality attributes.
RankingQuality AttributeImportance (Mean)Satisfaction (Mean)Category in Kano’s ModelCategory in Refined Kano’s ModelCategory in I–S Model
1An alarm center to report if a vehicle leaves the
parking place without the driver’s permission. 4.42 4.42 One-DimensionalHigh value-addedExcellent
2The option to notify the user when they arrive and
when the vehicle is removed from the parking place. 4.10 4.35 IndifferentPotential qualityExcellent
3A system to identify if a vehicle is parked incorrectly
and indicates it to the driver. 3.97 4.14 AttractiveHighly attractive qualityExcellent
4A device that checks if a parking spot is free, busy,
reserved, or out of service. 4.00 4.10 AttractiveHighly attractive qualityExcellent
5A mobile application to publicize the availability
of parking places to users. 3.92 4.07 indifferentPotential qualityExcellent
6A light to show that a parking spot is already reserved. 3.92 3.95 IndifferentPotential qualityTo be improved
7The ability to interact with users who do not
have the mobile application. 3.62 3.85 IndifferentCare free qualityCare-free
8A system that recommends the best location
of parking places according to the type of user;
either for the disabled, hybrid or VIP. 3.60 3.72 IndifferentCare free qualityCare-free
9The option to make a reservation for a
parking spot from any location. 3.57 3.85 AttractiveLess attractiveCare-free
10Recognition of the license plate number of the
vehicle that arrives at a parking place. 3.52 3.70 IndifferentCare free qualityCare-free
11A maximum wait time to reach the parking spot
after a reservation is made. 3.52 3.65 IndifferentCare free qualityCare-free
12The option of providing the shortest route
to reach a parking spot. 3.42 3.80 IndifferentCare free qualityCare-free
Mean 3.80 3.96
Note: Ranking is according to level of importance.

