1. Introduction
Agriculture, following the development and modernization paradigm begun with the green revolution (1930–1960) [
1], has evolved from extensive production, family, and share farming to intensive production, reliant on chemical products. In this transition, agriculture assumed the characteristics of a productivist and linear system, which aims mainly to increase productivity. This approach leads to industrialized and efficient production whose purpose is profit maximization, usually by increasing farm unit size, specialization, and the reliance on external industrial input [
2]. Nevertheless, with the current social, economic, and environmental requirements, this production process is no longer viable, in terms of negative externalities, and the necessity of a more sustainable and circular farming method is emerging. The application of precision agriculture and smart farming approach can be considered a step towards the solution needed to continue feeding the world, sustainably.
The concept of precision agriculture, intended as site-specific crop management, dates back to 1980. Still, this term was used for the first time in 1990, during a workshop in Montana [
3], and lately has been associated with the concept of smart farming. The term “smart” came from the definition of Smart Communities: a social unit with commons values and ideals that have made a mindful effort to use information technology to transform life and work in the region where they are located, in meaningful and fundamental, rather than incremental, ways [
4]. A “smart” system permits an open, inclusive, systematic, inter and transdisciplinary system vision.
Thus, the concept of “smart” applied in farming includes the employment of new digital and high-tech technology and the creation of a localized community in which these technologies have a meaning. Innovation, intended as a new idea or method, is the cornerstone of smart farming.
New forms of innovation cover all dimensions of the agrarian production cycle, along the entire value chain. Those innovations range from crop, input, and resource management, to organization, marketing, and distribution. New technologies such as sensors, Decision Support Systems (DSS), automation and robotics, collected data, traceability, and blockchain [
5] are available to farmers for supporting and enhancing productivity.
Achieving innovation in agriculture is not easy, as it requires diffusion in the early stage of its introduction in a sector. As explained by Rogers [
6], diffusion is the process by which an innovation is communicated through various channels over time among the members of a production ecosystem. It is a communication, in that the messages are concerned with new ideas. So, there are four main elements in diffusion: the innovation itself, the communication channel, time, and the social system in which introduce the innovation. As is clear from the above, the efficient application of innovation in a production system needs:
Those who will adopt and use the innovation (farmers);
Those who know how to use it (producers, retailers, research institutes);
Systems and channels of communication between the subject above (instruction, universities);
Time to achieve communication objective;
A social system intended as a set of interrelated units that are engaged in joint problem-solving to accomplish a common goal. Following the paradigm of Rogers, the diffusion of innovation appears to be challenging due to the intrinsic characteristic of the agricultural system (distance from urban areas, isolation, difficulties in disseminating information, and farmers’ mentality).
Two additional elements should be considered. Firstly, the number of innovations available in precision agriculture and smart farming is large, and the types of new techniques and products are incredibly varied. Secondly, introducing an innovation may lead to an upheaval of a prior structural organization in farms [
7], requiring a completely new organization. Those two points may cause confusion and difficulty when farmers have to choose the solution that best suits their needs. Such problems can lead to the wrong choice and to purchasing an underestimated or overestimated set of solutions.
From another perspective, to implement innovation adoption the main economic framework given by common agriculture policy (CAP), funding should be taken into account. It is well known that CAP strategic objectives for the period 2014–2020 mainly aim to invest in rural jobs and growth, improve the sustainable management of natural resources, and roll-out fast and ultra-fast broadband in rural areas. Internet access is closely related to the successful adoption of innovations and technologies. The EU has several tools to finance projects on Information and Communication Technologies (ICT) and broadband in rural areas by 2020. As an example, €21.4 billion for ICT coming from EU structural and Investment funds (ESIF), €1.6–2.0 billion from the CAP’s Pillar II Rural development (EAFRD), and €6.4 billion to finance high-speed broadband roll-out. The 2014–2020 timeframe EAFRD budget amounts to approximately €100 billion. Throughout this time, the budget will be invested in implementing rural development programs that run until the end of 2023. The European Agricultural Fund for Rural Development ICT Broadband is in continuous implementation from year to year. Data from ICT Broadband of the rural population potentially benefiting from new or improved ICT services or infrastructures show that if in 2016 the implemented part was only 2% of the total (100%), in 2018 became the 17% of the total. Hopefully, the trend is going to grow [
8].
This article aims to create a reference framework to suggest a methodology for farmers, experts, and other actors of the agricultural sector. This methodology allows the orientation towards the multiple-choice offered by precision agriculture and smart farming to find the best entrepreneurial and technological choice and solution. It is possible to summarize this methodology in four steps:
Understanding the changes in action;
Identifying the added value of smart farming processes;
Verifying the reliability of new technologies;
Adjusting production processes.
In order to identify drivers and elements of the listed four steps, in the present study both a systematic review of the literature and empirical evidence from on-field wine farm projects are undertaken. The wine sector is chosen as an example for the application of the proposed methodology because it is one of the most important agricultural production in EU. In the period between 2014 and 2018, it accounted for 65% of global production, 60% of consumption and 70% of exports, with 45% of the world’s wine-growing regions with 3,215,549 ha in 2018, with an average price of €4 Vol
−1 Hl
−1 (red wine) [
8,
9,
10], making the wine sector one of the most profitable agrarian productions.
The second motivation concerns the background of the research activities carried out, since most of the projects considered focus on wine production and vine growth operations.
This article could be considered as a first guideline in developing a new approach to smart farming, that can lead to further research to gather data necessary to support and increase this theory. Especially regarding lean approach and Technology Readiness Level (TRL) analysis, a minimal number of studies are found.
2. Materials and Methods
2.1. Systematic Literature Review
The method chosen was a systematic literature review which came from a clearly defined objective of the research, following a structured protocol, that minimized subjectivity and allowed the critical evaluation of relevant studies. Furthermore, it permitted the removal of subjectivities derived from traditional literature reviews based on the author’s knowledge perspective [
11]. The aim was, first, to review and analyze papers that discussed smart farming, focusing on the aforementioned four steps (1,2,3,4). This provided a depth knowledge of such elements that strengthened our postulations derived from empirical findings.
The research database and keywords definitions were built on Scopus, Science Direct (Elsevier), and Google Scholar, the main scientific multi-disciplinary abstract and citation databases of peer-reviewed literature (major journal publishers and conferences in the science and technology fields). Selected keywords were prepared for the databases, chosen coherently with the four steps of the smart farming approach. In the first step we included “Sustainable” and “Multidimensional Analysis”. The second step included “Business Model Canvas”, the third set involved “Technological Readiness Level”, “Market Readiness Levels”, and “Local Ecosystem Readiness Level”. Finally, the fourth step included “lean management”, “manufacturing”, and “farm management”. When more than one keyword was included in the search, they were linked with the Boolean operator OR, whereas the sets were connected to each other through the AND operator. Specifically, each keyword was followed by the Boolean operator AND with the terms “viticulture” and “agriculture”. This phase allowed the authors to achieve the final list of keywords used for the search. The literature search covered the period until May 2020 and all the papers published in Scopus, Science Direct (Elsevier), and Google Scholar in the areas of interest were considered to be screened. The year range limit set was 2000.
Articles which included the selected keywords in their title abstract or keywords were analyzed. In order to provide a significative review, only papers published in peer-reviewed journals, conference proceedings, or books and providing an English version were considered.
In order to select the papers relevant for the scope three screening steps were conducted. The first was the reading of the title and the abstract. In this screening phase articles were classified as included or excluded based on two exclusion criteria (EC). The 1st EC was entire conference proceedings, the 2nd EC out of topic. The latter refers to the papers that clearly showed no relationship with the aim of this paper and its research questions and, then, they have not dealt with smart farming, viticulture, and innovation technology adoption issue. Then, the second step consisted of the reading of the full text of the papers selected and, hence, was a definitive assessment to finally include only relevant papers. During this phase, papers that did not precisely respond to the research topics were excluded, while papers discussing the four steps were considered as included. All the information was extracted and reported in the paper as a specific element of each step, allowing the authors to have a general view and do a thorough evaluation of the present state of the art in the field of research.
The review results derived from the total number of papers searched in the databases with the previously reported keywords. Those papers were 1583. Once the duplicates were deleted, 1112 were used for review. After the screening, 104 papers were included for this study, while the others were omitted according to the two EC previously stated during the first screening phase. Then, 38 articles were chosen after a thorough reading of the 104 documents, while 8 additional articles were explored by scanning of sources, with a total number of 46 documents classified as important, as they specifically suit the intent of the study. The low number of articles selected was a consequence of the highly specific research issues, indicative of a systematic analysis of literature.
2.2. Nonlinear Process Analysis
In parallel with the systematic literature review, a method for empirical findings emerged from a nonlinear process for the introduction of smart farming innovation in wine farms, which was defined as follows. The nonlinear process was developed in periodic brainstorming sessions and interviews in which the authors reflected on the significance of technology adoption means and how it plays out in practice. Our framework was iteratively developed over time, using our individual experiences with bottom-up initiatives, and engaging with the theoretical and practical literature. Our beliefs were presented at various symposiums, and in response to the comments received and our reflections the framework was developed adaptively. The process here described takes its cue from the research and prototyping process. This approach, proven to be very important, provided the comparison between authors and actors in the supply chain, interested in finding a way to orient themselves in the vastness of technological innovation and smart farming. The merit lies in the open opportunities thanks to projects on technological innovations, used not only for the contribution in terms of technology but also in social advancement. The work carried out over years of research-action in the agricultural field, during European, national, or regional funded projects focused on precision agriculture and technology adoption, has made urgent the need to find a way to summarize and spread out the work done. Indeed, we were able to empathise with farmers and the other actors (as consultancy) of the wine sector, and this was very useful to focus a new path, which was needed. For example, it happened with several projects as the INTERREG MARTE+ which had the aim to develop and design technological solutions for “heroic viticulture” with small machinery in the vineyards or with regional funded projects VELTHA, TINIA, OENOSMART, SEMIA, KATTIVO, SMASH, SUSTAIN-BIO, CAMPI CONNESSI, INTRACERT, (
Table 1) all focused mainly on viticulture and technology adoption. Moreover, with SPARKLE, we started to test and check the “setting in order” of all the material collected on smart farming with an online e-Learning course for
agripreneurs (agricultural entrepreneurs) [
12]. This permitted to collect information through the practice of focus groups, useful for developing ideas and then defining one or more solutions. The reiterative process adopted helped in receiving feedback and improving solutions for technologies or services provided. Therefore, a set of tools is needed for future agripreneurs and future consultants and technicians.
Table 1 shows in detail the international and national research projects in which focus groups, field days, and brainstorming sessions were held in order to postulate and build our new proposal through personal experiences and information coming from the actors of the wine farms or farmers. The listed projects provided empirical findings, which represent part of the principles used for the development of the methodological proposal. Information about the name of the research projects involved our research team, the starting year, the number of focus group conducted and interviewees, the main findings regarded by every single project, the webpage, and the total amount funding about every project were listed. The funding resources were of the following types: European Agricultural Fund for Rural Development (EAFRD) through Tuscany Region innovative actions (TR 16.2), European Regional Development Fund (ERDF) through Interreg Europe (INTERREG) and Regional Operational Programme (ROP), ERASMUS + Key Action 2 (KA2). Specifically, 11 running projects from 2012 to 2021 (some are still on-going projects) made possible the organization of 46 sessions, the interviewing of 708 farmers, the conduction of surveys with 536 students (Portugal, Spain, Greece, Italy). Moreover, 19 interviews were carried out with European academic experts on precision agriculture adoption and 19 demo events were conducted on several issues related to innovation and technology adoption. Detailed information is analytically reported in
Table 1. Usually, the period for each activity was a working day, but it depended on the kind of project and the target involved.
Each project had questions regarding several issues related mainly to technological, agronomical, economic, environmental, and social issues. The non-linear process adopted was used to collect data and information in the informal part of the event and it is important to emphasize that it is not possible to set standard processes and systems in participation contexts, since each mechanism should be adapted to the group that expresses it. Usually, the results of responses of our projects were more farmers’ awareness of the adoption of technologies, and reports tailored for each project.
Questionnaires were usually designed on the basis of a need analysis made before surveying farmers that took into account their needs in terms of economic and social aspects and project objectives, as listed before. Projects and surveys carried out in all partner countries were planned (France, Portugal, Spain, Greece, Italy) and at national level the diversity of the target groups investigated in terms of farm dimension and turnover, etc., was taken into account.
In the following paper, we are going to explain, based on exiting literature and practices, which approach is needed to introduce smart farming in wine farms mainly through four points of view. This method helps farmer (or the technicians, consultancy, etc.) to focus on introducing not only one technology but a set of innovation in the working system as the Multidimensional Method (agronomic), the Business model canvas (economic), the checking of the reliability of new technologies (technological), and then adjusting the production processes (management).
The four points try to simplify and categorize the complexity of the current farm activities. Indeed, these are no longer limited to applying recipes for a single purpose but must necessarily diversify. If they cannot diversify the products, they must diversify the activities, and the limits given by biotic and abiotic factors, as well as human and technological, can be summarized and described through the tools that we are going to describe in detail.
Once this method is defined and assessed, it is important to stress that in this way, more conscious decisions can be taken.
3. Understanding the Changes in Action: The Smart Agricultures Multidimensionality Method
Currently, precision agriculture and smart farming are not very diffuse, as shown by the EU Parliament report of 2016, “Precision Agriculture and the future of farming in Europe”. In this article, it was estimated that only 25% of EU farms use technologies applicable to smart farming and precision agriculture. This limited adoption can be caused by encountering some difficulties when proposing or adopting smart farming and precision agriculture. Those obstacles can be summarized in two focal points. Firstly, there is a lack of information on the advantages of applying smart farming instead of a traditional way of production [
23], as those advantages are not perceived [
24]. Secondly, the significant amount of technology and data collection necessary in smart farming can be challenging to manage.
The conventional way of thinking in agriculture, developed during the 20th century, transformed the agriculture system into an industrialized process that relies on external industrial input for fertilizer, plant protection product, and seeds [
2]. However, intensive agricultural practices and agricultural mechanization can have many environmental implications, such as soil erosion and loss of organic matter [
25,
26,
27,
28], excessive nitrogen application [
29], reduction of water reserve [
30], and excessive use of pesticides. In particular, the use of pesticides causes many environmental problems (water eutrophication, ecotoxicity, soil degradation, and acidification) [
31] and can negatively affect human health [
32]. Moreover, the agricultural sector affects climate change, producing approximately 13.5% of global greenhouse gas (GHG) [
33]. In particular, methane (CH
4, derived from anaerobic decomposition of organic matter or manure), nitrous oxide (N
2O, mainly due to synthetic fertilizer application), and carbon dioxide (CO
2, resulting from energy use in the farm and the carbon loss due to conventional or excessive tillage) [
34]. Specifically, in viticulture, GHG emission is caused by the production and distribution of fertilizers and pesticides, irrigation, pruning, tillage, and pesticide application energy usage, soil emissions, and crop residue management [
35], [
36]. Some studies [
37] show that machinery usage in viticulture accounted for more than 60% of the total warming potential of the wine production process.
In this context, precision viticulture and smart farming could improve the environmental behavior of the viticulture system. By adopting those two forms of management system, it is possible to implement economic, environmental, and social sustainability. Precision agriculture is a circular process which entails data collection, data analysis, decision-making in management, and evaluation of these decisions [
38]. In this way, it allows a reduction of agricultural inputs, obtaining the maximum yield and quality of produced grapes [
39]. By precisely measuring variations within a field and adapting the strategy accordingly, winegrowers can significantly increase the effectiveness of pesticides and fertilizers, and use them more selectively [
40]. Smart farming is a management concept using modern technology (Global Navigation Satellite Systems, soil scanning, data management, or Internet of Things technologies) to increase the quantity and quality of agricultural products.
The application of precision viticulture practices in vineyard field operations could contribute to the reduction of GHG emission thanks to:
On the other hand, these practices affect farm productivity by optimizing agricultural inputs producing higher or equal yields with a lower cost than conventional methods and reducing, potentially, the carbon foot print (CFP) of the process by one-quarter [
45]. Therefore, the application of smart farming permits to enhance the environmental, economic, and social sustainability of the farming production process. Moreover, precision agriculture and smart farming can give farmers the added value provided by practices that protect and maintain the natural and social environment [
46], that is perceived positively by customers and society [
47].
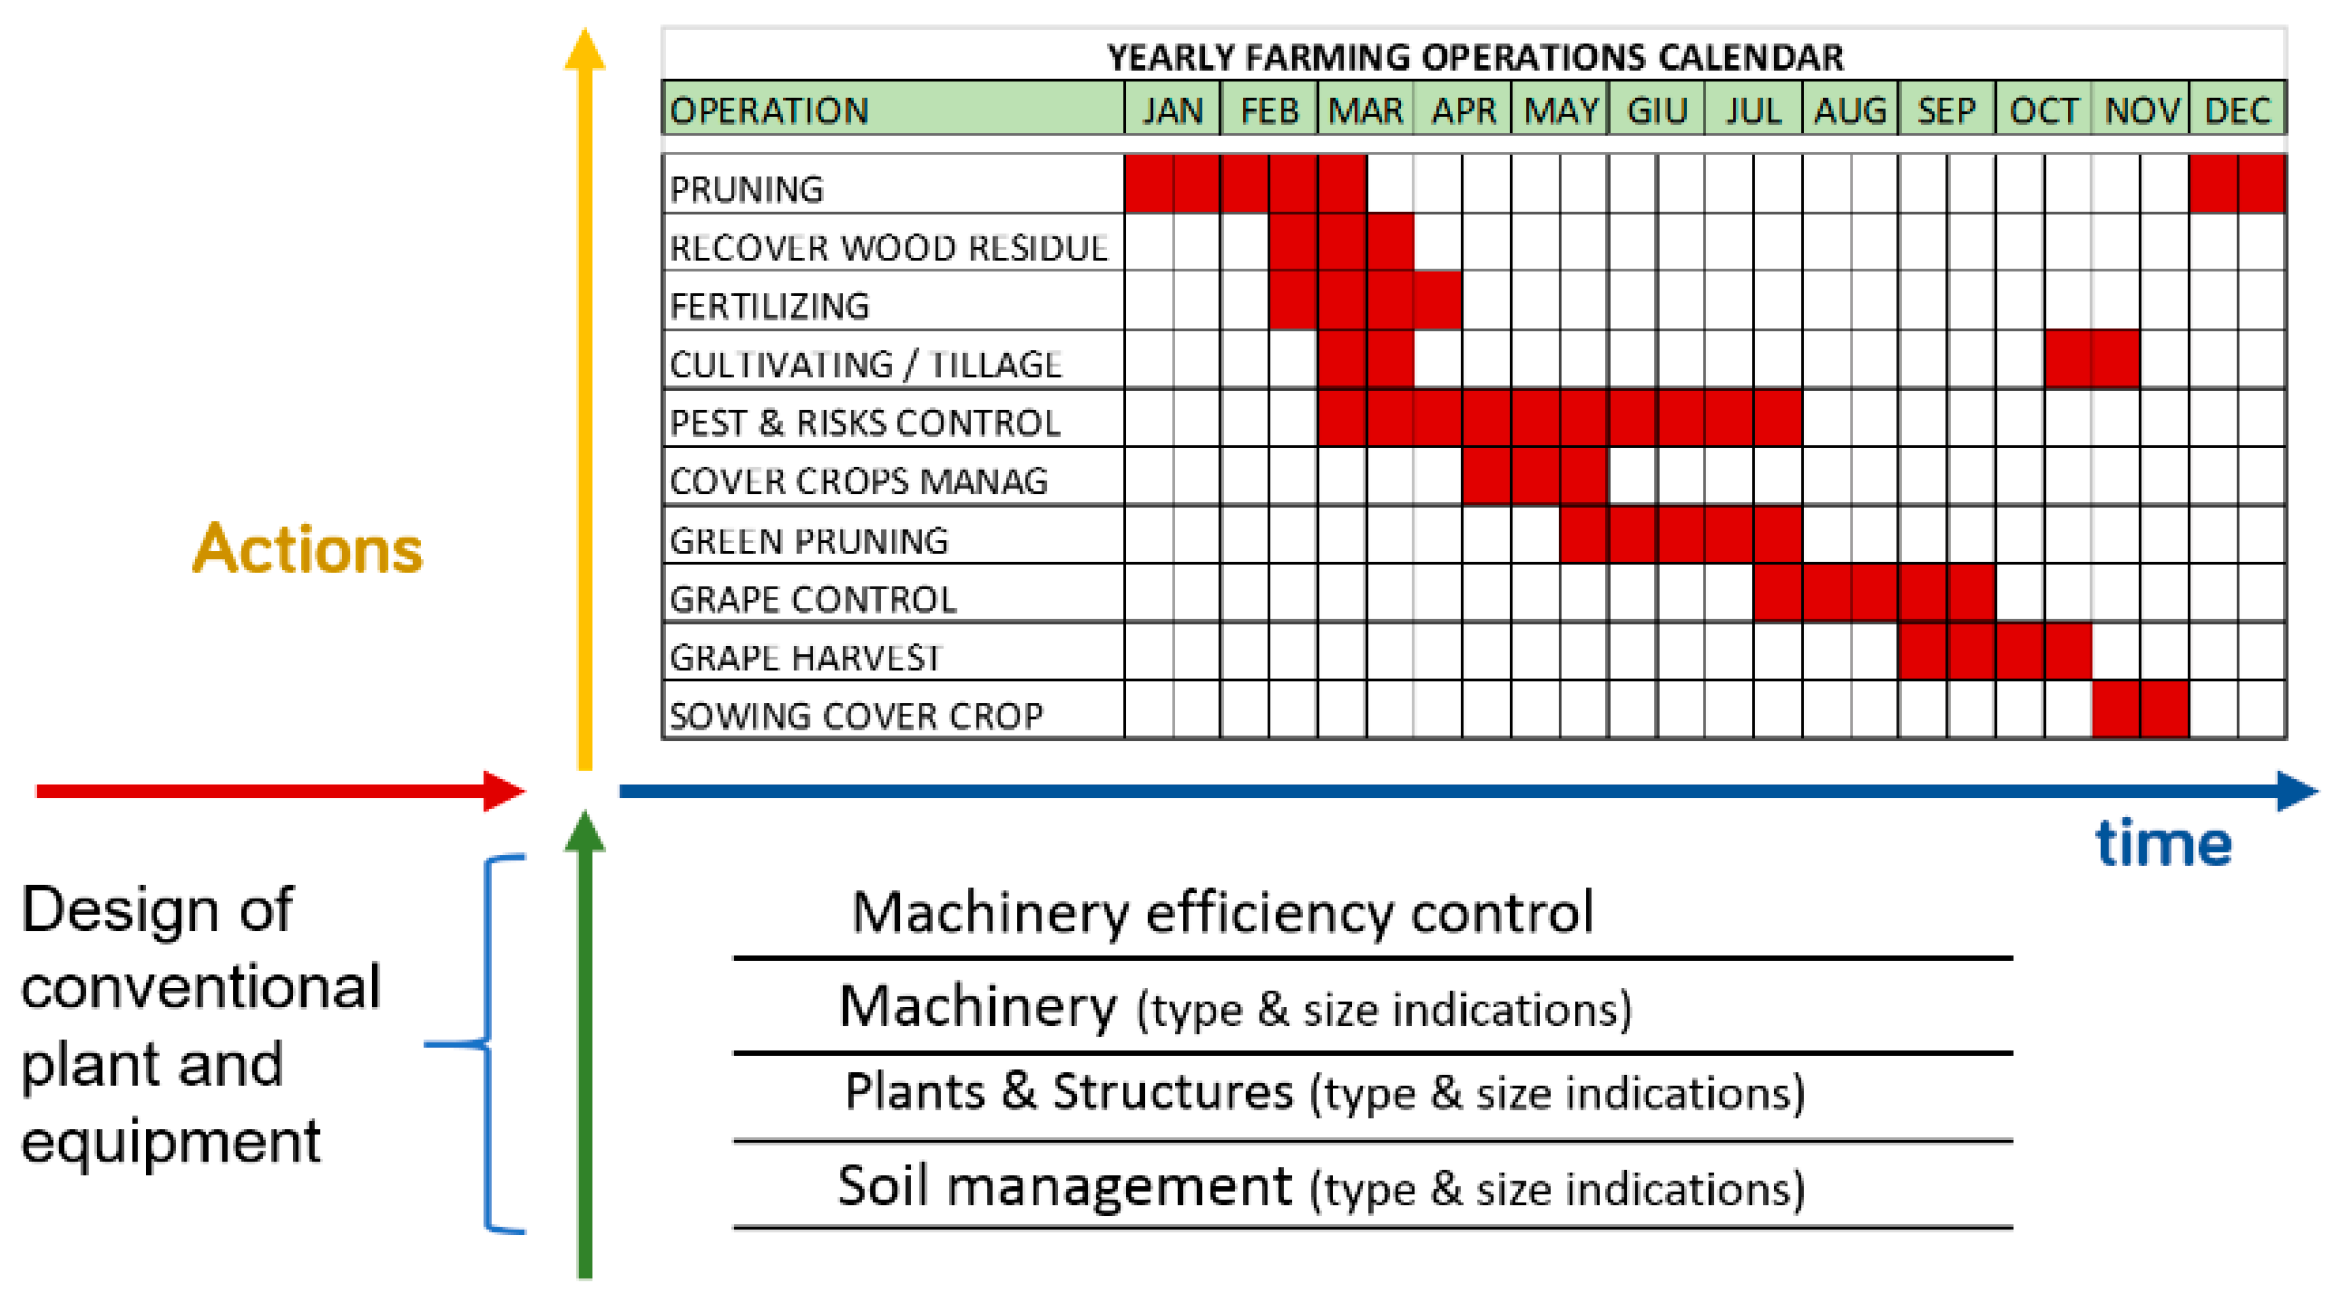
One of the critical elements in smart farming is data collection. The current information collection system in agriculture is based almost entirely on using the crop calendar (
Figure 1). The crop calendar helps to provide timely crop information. This tool gives details of planting cycles, sowing, and harvesting of locally adapted crops in different agro-ecological areas. It also provides information on the main agricultural practices [
48].
Nowadays, this system is no longer able to support the decision-making process of the farm efficiently. This lack of support is due mainly to the stillness and the lack of comprehensive information collected by this tool.
Technologies, such as sensors, drones, satellites, or intelligent software algorithms, are the primary sources of data in a farm. All information provided by these technologies can generate data, which can be combined and interpreted to give farmers a more comprehensive knowledge, necessary for the optimization of cultivation choices, work, time, and inputs [
24]. Therefore, in the smart farming approach, data collection is a more complex and inclusive process that leads to a multiple parametric-specific knowledge, enhanced by contest awareness and enabled by real-time events [
49], and a multidimensional approach to data and analysis.
The multidimensional analysis allows us to analyze and categorize several dimensions. Multidimensional data are data that record information related to several different units, called dimensions, for instance, soil, plants, weather, etc. Such a process can help decision-making and planning activities in farms [
50].
Therefore, in the methodology proposed here, agronomical choices and objectives (economic, environmental, and social sustainability), all cultivation drivers, and the knowledge needed to accomplish the objectives and use the drivers can be classified in “layers”. Risks linked to climate change are additional layers. Risks from climate change in viticulture (late frosts, drought, new pathogens) are to be considered as a key element in the decision-making process in farms. This is because the impact of climate change on crops and the unpredictability of those phenomenon limit farmers, work, and organization in a farm as well as the quality or the quantity of the final product [
51]. In creating those layers, there is a transition of knowledge from academic and experimental sources that integrate the previous deploy knowledge.
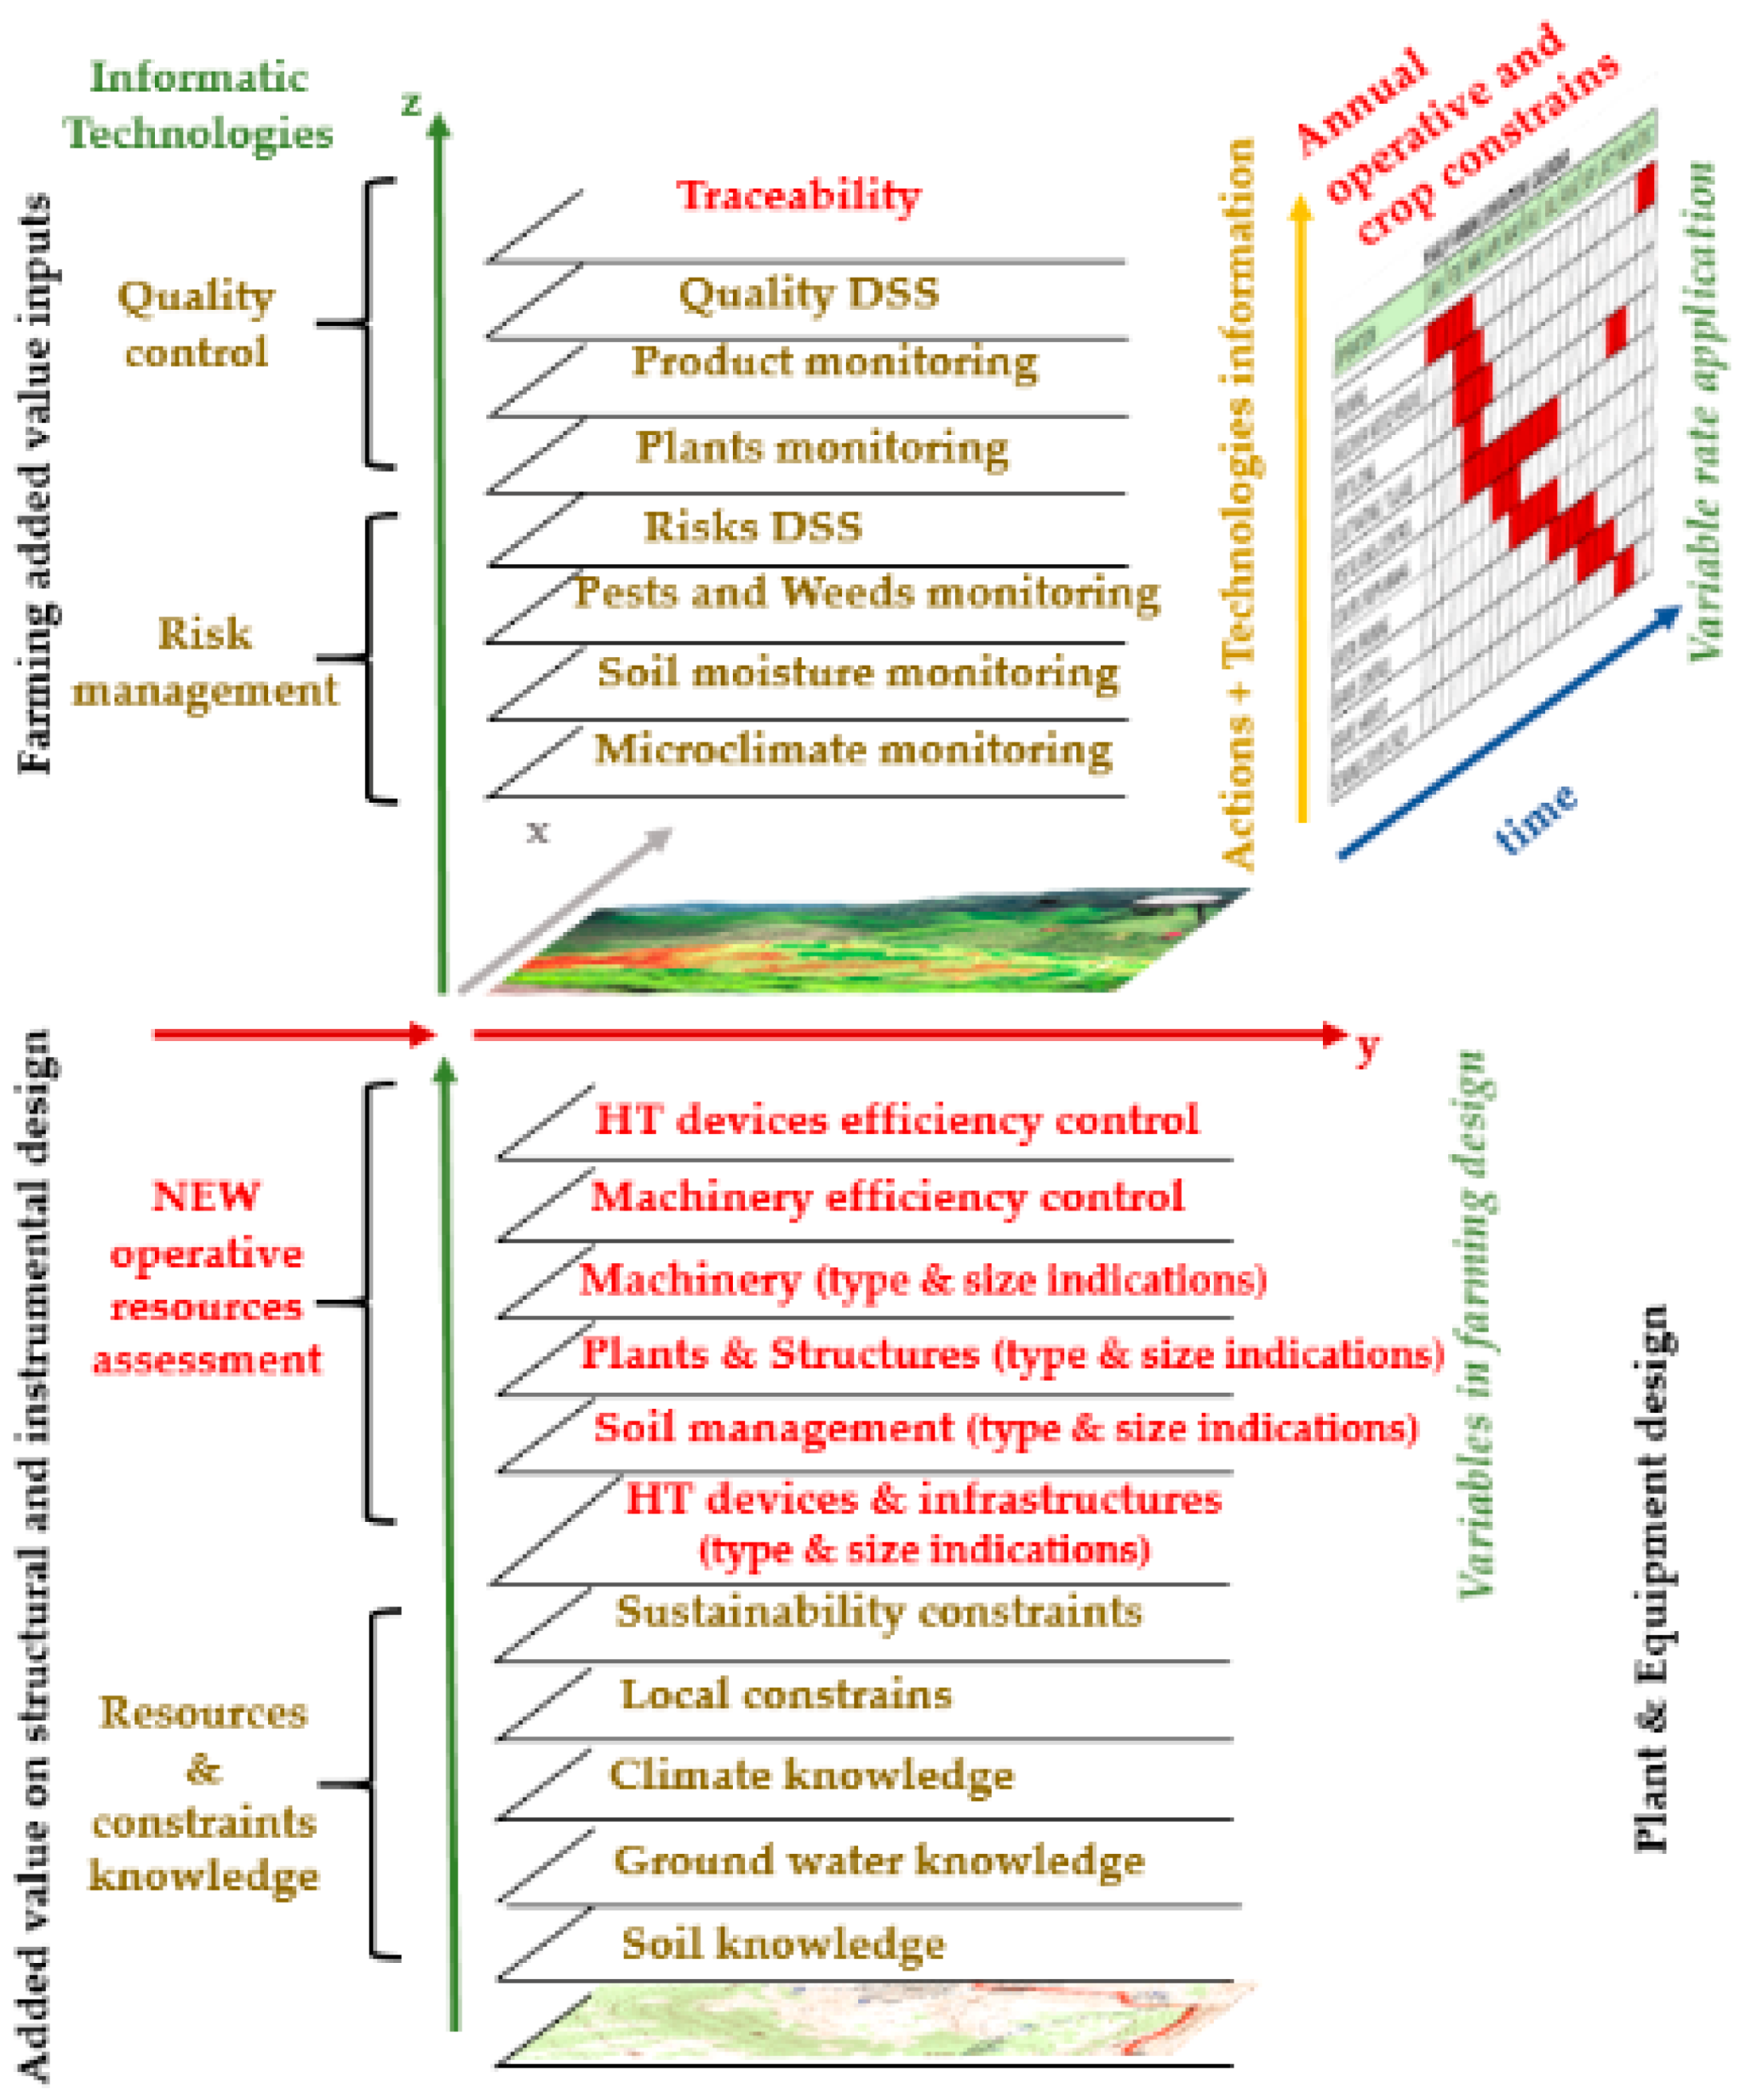
Referring to
Figure 2, those layers are distributed in hierarchical levels, with constraints and available resources at the bottom, and informatics/computing technologies at the top. Each layer and information contained in it must be site-specific and georeferenced. Site-specific information allows optimization of the decision-making process and makes it easy to apply precision agriculture and smart farming protocols.
Table 2 shows a reference sequence of layers.
As stated earlier, the multidimensional system developed here is based on thorough data collection through various technologies. Some of those technologies are Information and Communication Technologies (ICT), i.e., all techniques that allow storage and exchange of information [
52], such as peer-to-peer technologies, broadband. Such technologies are essential in creating some of the previously mentioned layers. The choice between different kinds and levels of technologies depends on various factors that are going to be analyzed in the next points of the presented methodology.
4. Identifying the Added Value of Smart Farming Processes
If paradigm shifts from a linear to a circular model are happening and the processes of farming are changing, the tools to identify the reliability of technologies should also be appropriate for the time and the sector. In the past, the farming model referred to the industrial production model, the linear model of production [
53]. Nowadays, starting or renewing a new business in agriculture needs an entrepreneurial approach and entrepreneurial tools that also consider social and environmental aspects. One of the main tools that can be used, when a farmer should approach its business, is the Business Model Canvas (BMC). As the creator, Osterwalder, says, “the Business Model describes the logic with which an organization creates, distributes and captures value.” [
54]. In smart farming this tool is not as well known as in other fields, even if it is strictly related to innovation. For this reason, the BMC is a necessary starting point for new businesses in agriculture and especially in smart farming. For instance, some studies refer to it being known that the current business models used by Climate Smart Agriculture (CSA) technological innovation providers are not optimized to meet current market demands and can, therefore, be seen as inhibiting the adoption and spread of CSA technological innovations [
55]. Other studies focused on the Business Model innovation, concluding that many barriers exist when farmers take agricultural business model innovation into consideration. Some obstacles depend on human factors, such as behaviors, backgrounds, and beliefs of individuals. Other barriers are more specific in nature and related to the environment of a given industry or business. Besides, many other obstacles are more abstract, such as government laws, supply chain place, and environment [
56]. Other authors point out that agricultural enterprise frameworks will protect their competitive advantages by developing and periodically renewing the business models canvases [
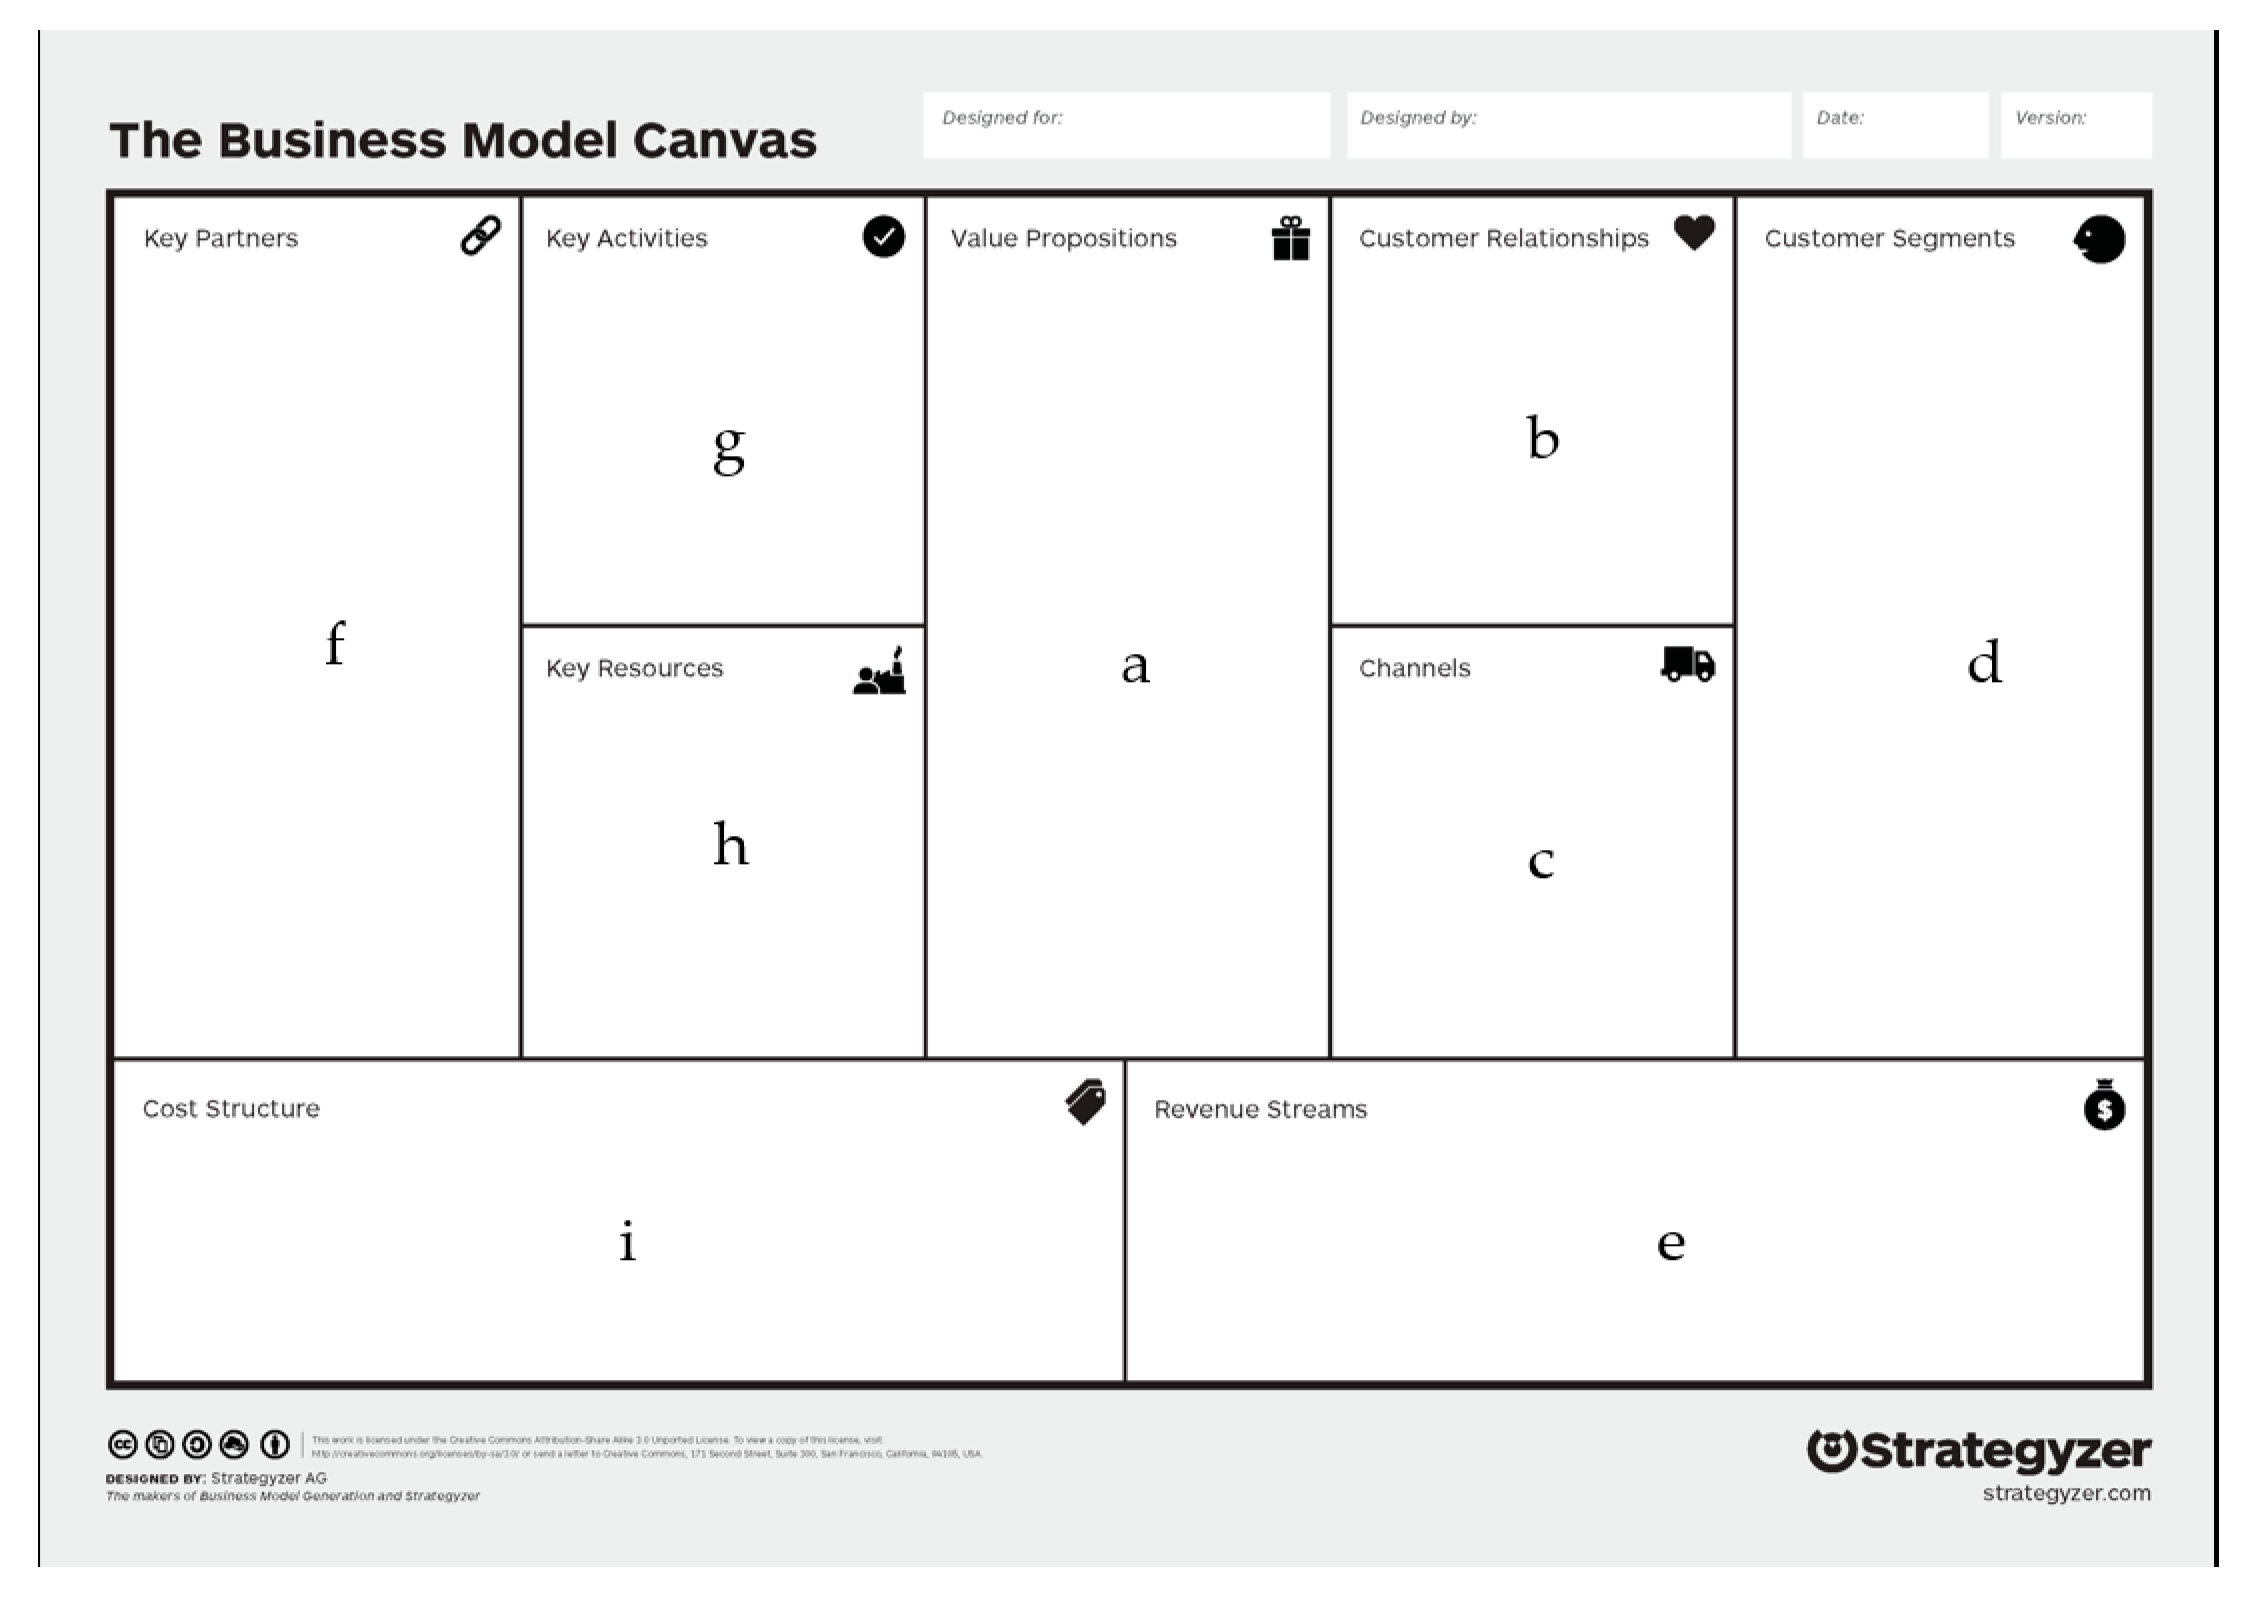
57]. By going into the detail of the canvas, a BMC is composed of nine blocks—the central one is the “value proposition”; on the right side, there are four blocks focused on customer relationships, customer segments, channels, and revenue streams, on the left side four blocks focused on activities, resources, partners, and costs (
Figure 3). In smart farming, BMC might be a tool to help enterprises to understand how to invest in PA to develop economically while also keeping an eye on social and environmental impact.
Depending on the sector and the aim to achieve, BMC has been widened both in terms of impact for circular economy approach [
58] and in terms of sustainability as in the case of the triple-layered Business Model Canvas [
59]. In all developed versions, the core of the canvas remains the value proposition and how all the blocks are linked with and for implementing it, giving added value. The value proposition for a farm considers something that should be offered, some market options included, and customer needs satisfied. Thus, a clear and well-articulated value proposition helps companies with value-added do the right things and do them well. Above all, it allows them to concentrate on offering and providing high value to their customers to ensure that they can profitably acquire and stay competitive in the market [
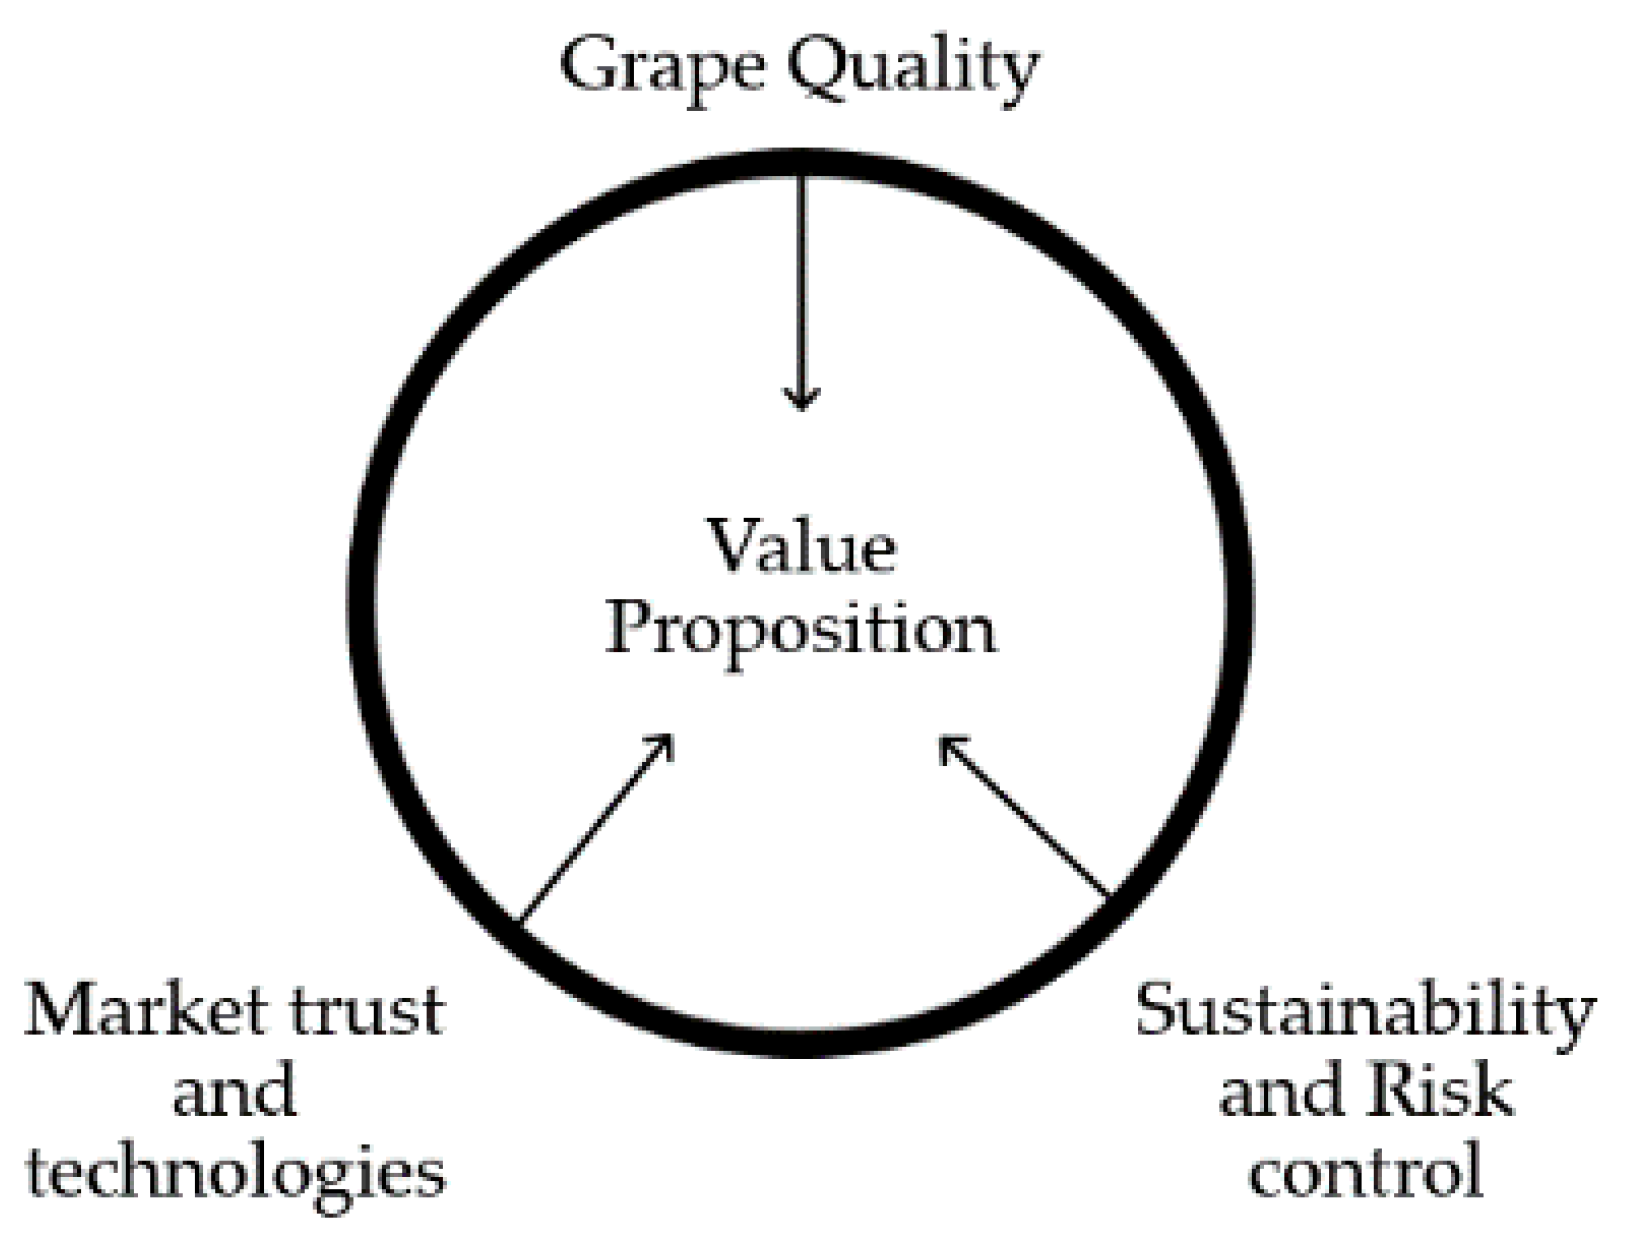
60]. Inside the smart farming approach, and in particular, taking as a practical example a winery, the value proposition is the link between what the farmer offers (grape and wine quality), what the customer needs (sustainability), what management needs in the light of climate change challenge (risk control), and market options (trust and technologies).
The value proposition, which contains the added value for which the company manages to maintain itself on the market, can be obtained with actions, practices, and technologies that must be assessed in terms of type, size, etc., as shown in
Figure 4. In risk control and product quality there are important monitoring tools (e.g., proximal and remote sensing) such as Decision Support Systems (DSS) combined with variable rate applications (VRA) that respond to particular needs.
Achieving sustainability objectives in agriculture, and consequently in viticulture, first requires specific actions. For instance, in open field cultivation, automatic driving allows you to avoid overlaps with savings in terms of time and costs, but also CO
2 emissions. The sustainability obtained is therefore not only in environmental terms but in its triple form. which also includes impacts on work and on service costs [
61].
In conclusion, BMC is a tool that could strongly help to highlight resources with added value, the right scale for technologies related to the business, activities, and key actors needed for upgrading a farm business. The introduction of the BMC tool enhances the evaluation of the farm business formula which has successfully implemented sustainable PA technologies. In addition, a new tool towards “smart farming” can be used to support companies that could invest in PA to expand economically, while at the same time reducing their environmental impact [
62]. The “left” side of a BMC (key actors, key activities, key resources, and cost structure) is the crucial part for a farmer who already applies or wants to introduce smart farming in their business, that occurs to check and evaluate the feasibility of the choice made in terms of maturity and effectiveness of the chosen technology. The effectiveness of BMC in agriculture was tested during the SPARKLE Erasmus+ project (
Table 1) combined with a “PA impact analysis” investigating drivers, barriers, benefits, and impact of PA technology adopted with the aim to drive consciously technological choices made by farmers. BMC was applied during the project on 20 farms (wine farms and others) in four different countries (Italy, Portugal, Spain, Greece). This application gave life to a training material [
63] for farmers, students, and other targets.
5. Verifying the Reliability of New Technologies
In order to verify the reliability of new technologies, the Technology Readiness Levels (TRL) tool can be a valid instrument to evaluate the technology maturity. The concept of TRL was introduced by the National Aeronautics and Space Administration (NASA) in the mid-1970s [
64]. This tool was designed to allow more effective assessment and communication regarding the maturity of new technologies, intended for use in a space mission (BSI Standards Publication Space Systems-Definition of the Technology Readiness Levels (TRLs) and Their Criteria of Assessment, 2013) [
65]. In subsequent years, the TRL has spread to other productive sectors, such as chemical, fossil energy, electric mobility infrastructures, and also in the United States Department of Defense. Recently, TRLs were also introduced by the European Commission for the evaluation of research projects in the Horizon 2020 program.
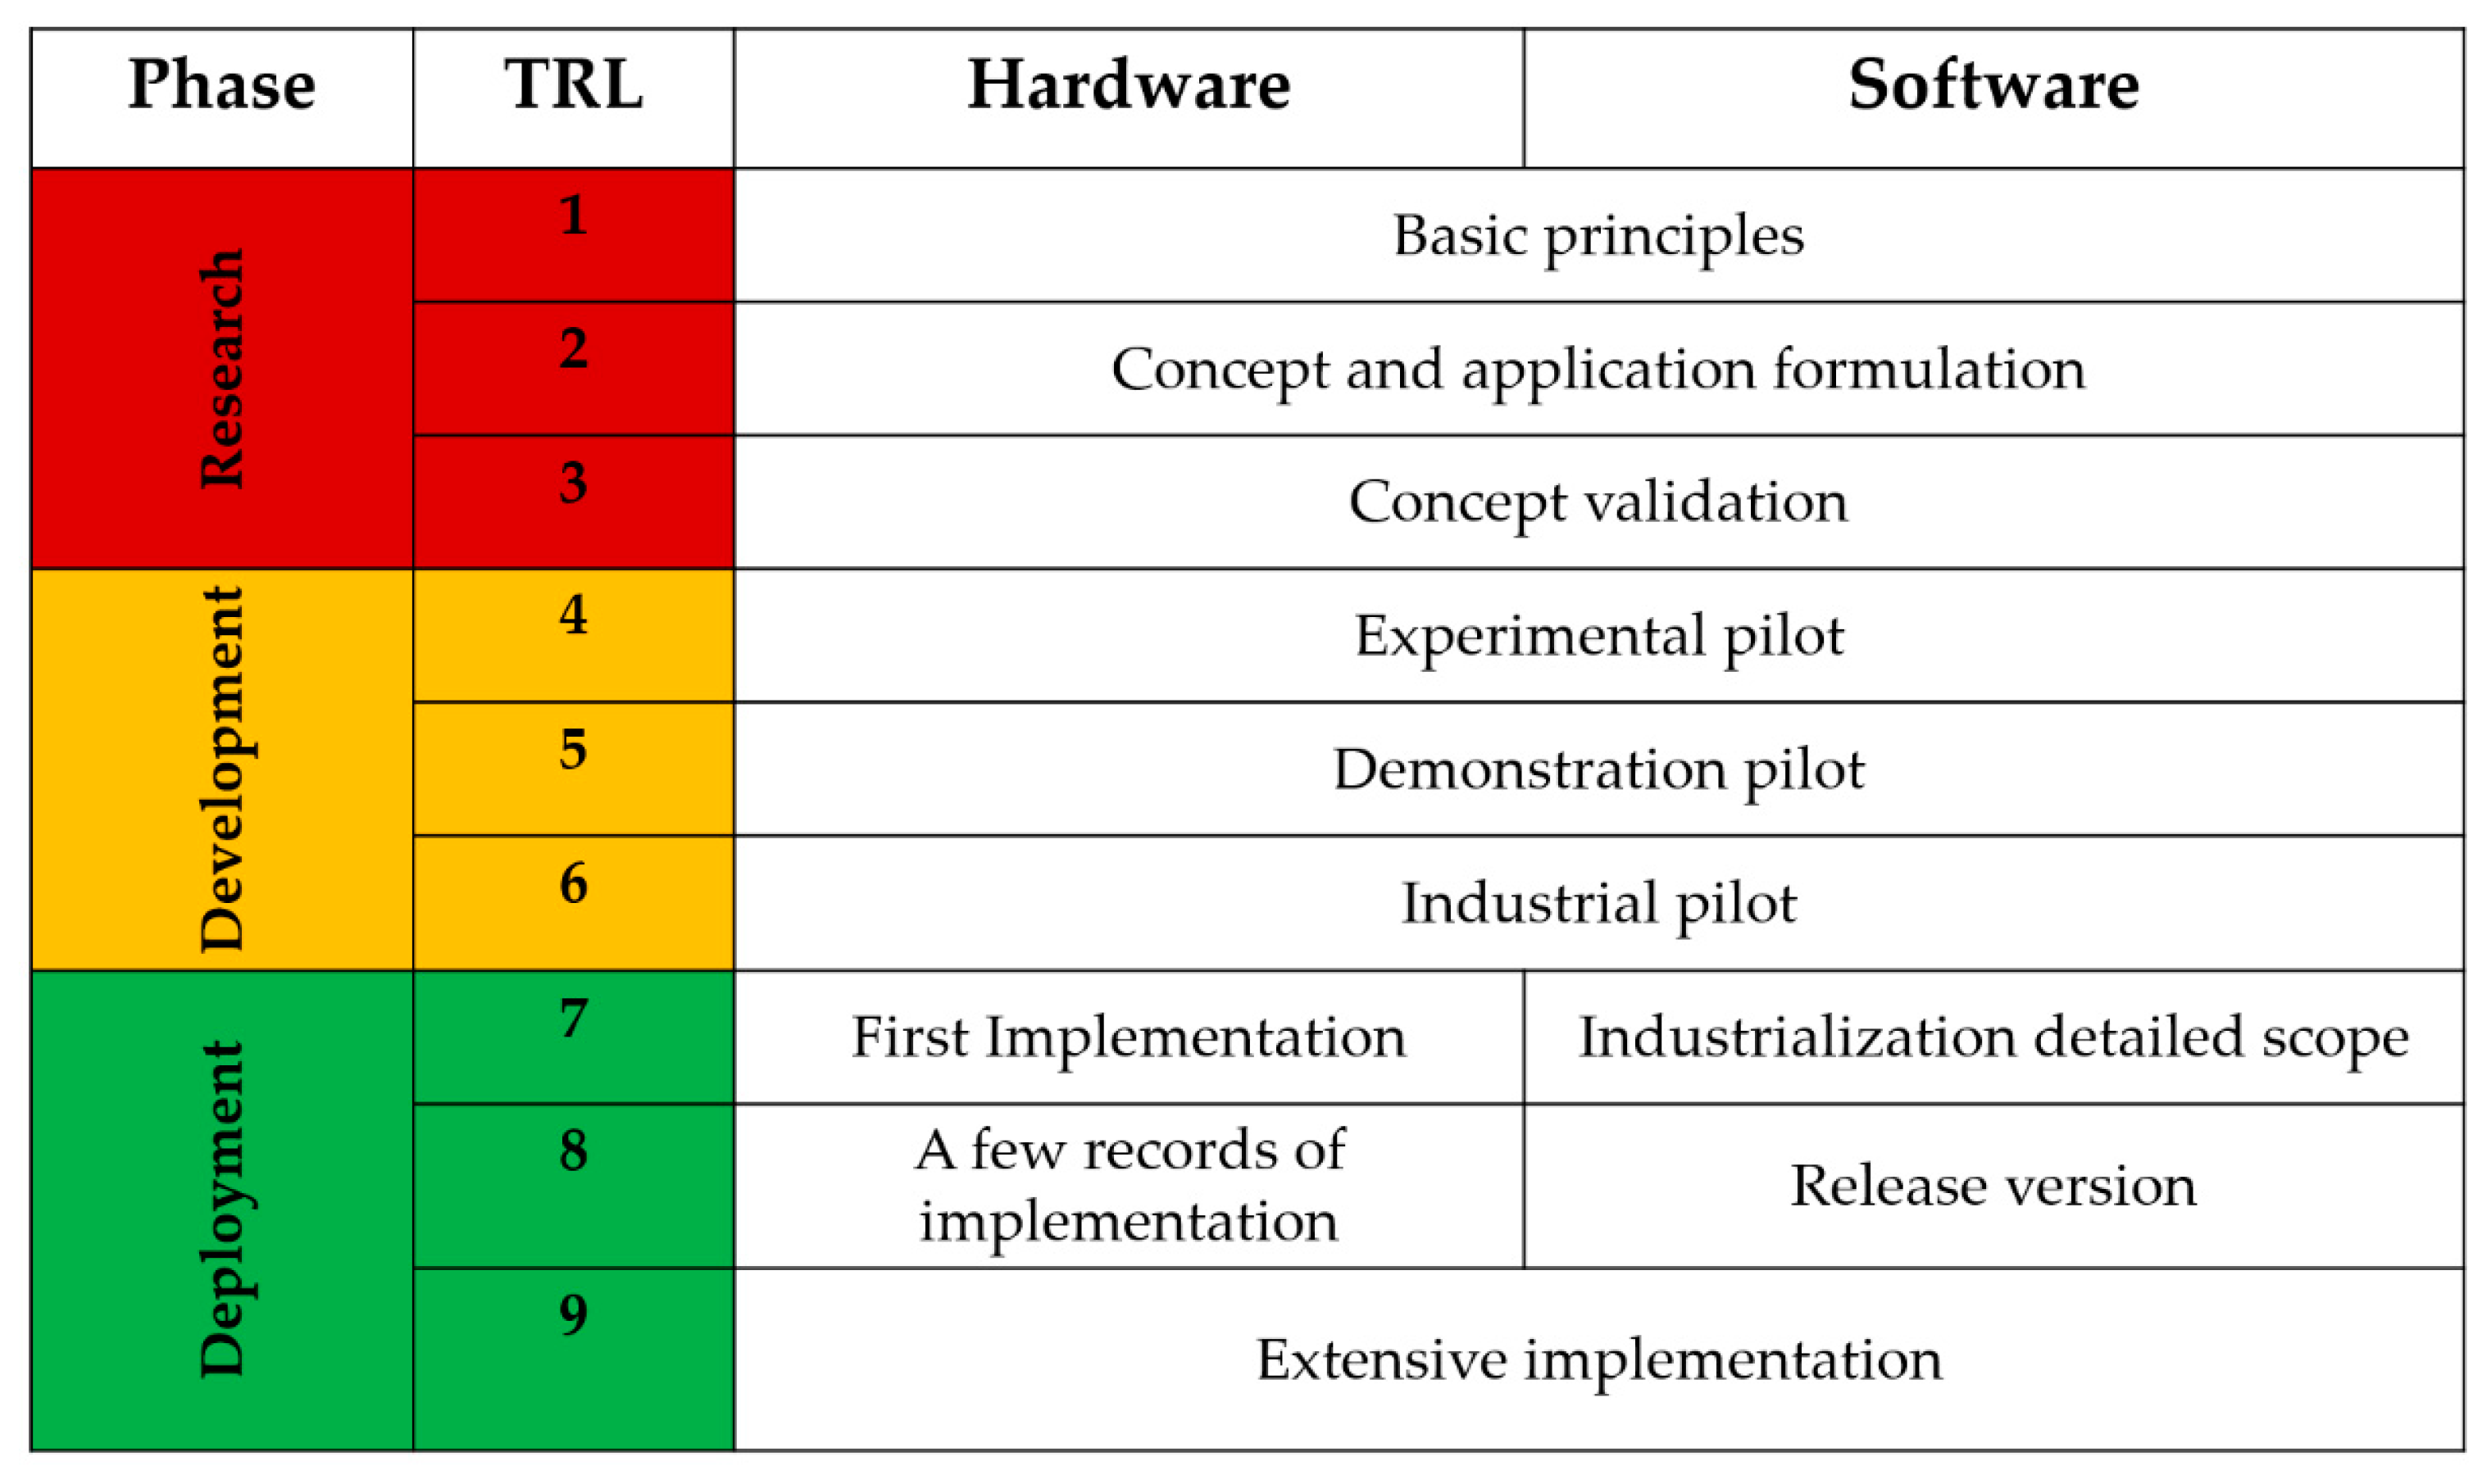
The TRL tool assigns a scalar level from 1 to 9 to describe how mature a technology is.
Figure 5 shows the technology maturity levels (adapted from the original NASA one), where level 1 is the lowest and level 9 the highest (BSI Standards Publication Space Systems—Definition of the Technology Readiness Levels (TRLs) and Their Criteria of Assessment) [
65,
66]. In particular, these levels describe, in a linear way, a whole production process, from the research phase to the development phase, to end with distribution.
This tool, born as a single technology evaluation method, has expanded to complex solutions, i.e., the set of technologies that make up a product [
66]. In this way, the TRL tool has spread to other communities, among which the agri-technology community has been recently added. Moreover, the TRL tool evaluates the technology maturity of a new product. Still, it does not take into account if this new product can turn into an innovation, defined as the whole of factors that make a technological solution adoptable in the production process [
67]. In the technological evolution of agriculture, the tractor is an historical example of a new product that has turned into an innovation of the entire agricultural system. This evolution has been possible thanks to the creation of a reliable chain of actors, such as retailers, maintainers/repairers, tire services, etc. Only in this way has tractor use become profitable and become a system innovation.
In order to evaluate the reliability chain of actors and infrastructures, the Market Readiness Levels (MRL) tool has been introduced [
68]. The MRL allows a technology readiness evaluation for commercialization and diffusion phases. This tool is based on a scale of 1 to 5, with 5 being the most diffused [
69].
In a European study, the TRL and the MRL of precision agriculture technologies were evaluated. To summarize the ample supply of new products, the technologies were gathered in six major categories (nanotechnology, yield, soil mapping, drones, sensors, autonomy). The results showed that lower TRLs were recorded in nanotechnology and autonomy technologies, respectively 3.2 and 2.1. Instead, higher TRL were shown in soil mapping with 8.1 and yield with 7.6. In the middle, there were drones (6.6) and sensors (6.1).
Moreover, the MRL results for the same six categories reflected the TRL values, related to the shorter MRL scale. In fact, the MRL showed for autonomy a value of 1.4, for nanotechnology 1.5, for sensors 3.5, for drones 4.1, for yield 4.6, and for soil mapping 4.8. These results show that the most advanced technologies, such as nanotechnology or autonomous vehicles, although they are useful in agriculture, are not developed due to a low MRL. So, this means that the reliability chain of actors and infrastructure is not yet sufficient [
69].
A recent market survey on Italian agriculture 4.0 conducted by the “Osservatorio Smart AgriFood” of the Polytecnic University of Milano has shown the Italian situation regarding precision agriculture and smart farming technologies. One of the most exciting survey sections showed the problems faced by the farms surveyed (≈300) in the introduction of new technologies in agricultural processes. Some of the most frequent answers, given by farmers, to this question, were “the malfunctioning of the solution”, “insufficient technical support”, and “lack of connectivity” in terms of lack of broadband connections [
70].
The first evidence highlights that some technologies have been brought to commercial use with low values of TRL, which means they do not work correctly. This is a common problem that concerns new technologies. As a matter of this, companies launch their products without an appropriate test and verification to stay ahead of the competition and the result is that a new technology with low TRL will probably go to fill the “Valley of Death” of technologies [
66].
The other two evidences underline how infrastructures around a new technology are not ready to welcome these new solutions. In this case, the MRL is too low to allow technologies to develop correctly. Therefore, if the infrastructure fails to grow in a short time, the new technology will quickly disappear. This risk is well described by Rogers in the “chasm phase” and more recently defined by Gartner Hype Cycle [
6,
71].
However, the major problem identified by farmers was the “lack of expertise”. They stated that it is difficult to find appropriate skills to support these new technologies in the labor market. This common response by farmers shows that there are some things lacking in the educational system at any level, both in high schools/universities and in the repairs sector. Another issue to consider is that the MRL tool does not fully evaluate the system innovation, because it does not take into account the educational system. Therefore, it is necessary to establish the third evaluation tool, the Local Ecosystem Readiness Levels (LERL). This tool is likely to resolve the lack of an instrument that permits to evaluate the readiness of the actors chain around a new technology at local level.
LERL contains two important terms: On the one hand, the noun “ecosystem” (apart from the biological context), which can be interpreted as a complex network and interconnection between multiple entities. In the agricultural technology context, an ecosystem can be described as an aggregate of independent entities and interrelated factors to allow a system innovation in the whole sector [
72]. Therefore, the ecosystem represents the linker between different actors and infrastructures of the technological chain. All actors must cooperate following the multi-actor approach to create a thriving and robust ecosystem [
73]. Notably, the chain is composed of providers of high-tech systems, services for hardware and software, services for ICT (Information and Communication Technology), consultants, human capital, educational system, and governance. Only with the network between all these actors can a new product become a part of system innovation. However, this is a necessary condition but not sufficient. On the other hand, the adjective “local” strongly correlates to the ecosystem which needs to exist not only in the macro-area but also in the local area. In fact, the Local productive Ecosystem is the physical services and expertise network that supports innovation. The existence of a place in a local area where subjects can create a new product, using it or repairing it, is the necessary and inclusive condition to enable the use of a new product effectively, and lay the groundwork for a system innovation.
Therefore, the LERL is a tool that permits to evaluate the maturity level of the local ecosystem and to establish at which point of the transformation road, from new product to innovation, a new technology is located. Moreover, the LERL tool assigns a scalar level from 1 to 5 to describe how mature a local ecosystem is.
Figure 6 shows the Local Ecosystem Readiness Levels, where level 1 is the lowest, and it represents the total absence of the ecosystem. Level 5 is the highest, and it establishes the complete saturation of it.
6. Adjust Production Processes: Scheduling of Adoption Procedures
The scheduling of adoption procedures is the last activity in the farm. A proper scheduling requires the reliability verification of the technology that should be introduced (TRL), the compliance with the “added value” required, the appropriateness of the support services and infrastructures (LERL), the compatibility among the several factors of the BMC (i.e., resources, actions, actors), and the operational adoption checking in the production process.
All of this has to be thought of in light of the increasingly competitive emerging markets, where viticulture has to face the challenge of enhancing quality in the face of climate change. Current management of vine production has a considerable environmental and social burden which cannot be sustained indefinitely [
36,
74,
75]. As a response to these critical questions, in other manufacturing sectors, new approaches such as design thinking are being adopted to rethink processes and products. The design thinking and the tools of “Lean Production” or “Lean Farming” may be endorsed as decision support tools also in the viticulture sector. The lean approaches, which are fundamentally anthropocentric, realistic, and firmly based on waste management, have been proven to be extremely compatible with companies sustainability policies and activities [
76]. Several studies have investigated and established the capability of managerial practices to improve organizational success. [
77]. Lean implementation has been noticeable across a diverse variety of economic sectors, contributing in many instances to increased economic performance and competitiveness [
78]. However, this should go hand in hand with changes in legislation and regulations, as well as needs from the diverse stakeholders to develop greater environmental and social responsibility [
79]. Farmers need to raise awareness of the environmental and social impact of their operations and to become more responsible for managing their businesses [
80]. The integration between the lean philosophy and environmental sustainable production has been extensively documented [
81,
82,
83,
84]. Piercy and Rich stated that though lean methods and sustainability strategies emerged and continued independently, they have been shown to be very complementary mechanisms [
85]. Recently, Reis posited the efficiency of lean and green systems in determining the level of maturity of lean and green integration, allowing benchmarking between organizations of the same industrial sector [
86]. In the viticulture sector, studies on the use of lean and green systems are almost non-existent. The meta-analysis of the available literature highlighted five main categories regarding the driving factors that determine sustainable organizational efficiency through the implementation of lean methods:
Knowledge and training between workers and managers;
Awareness of the operative context;
Organizational structure;
Technology and decision support;
Implementing and cyclical enhancement of the adoption procedure.
6.1. Knowledge and Training between Workers and Manager
In the viticulture sector, the decision-making process in farm management is affected by several variables which take into account the production protocols, the orographical constraints, the administrative rules, the end-users, and supply chain stakeholders, as already stated by Pla [
87]. The use of lean methods in smart farming cannot be separated by the overall knowledge in driving sustainable performance. Nevertheless, such knowledge, as stated by Wang Subramanian, must be collective for the subjects directly involved in the production process to allow an overall understanding of sustainability initiatives [
88]. The main categories of knowledge identified as important include:
knowledge on the environmental sustainability issues;
knowledge on the innovations and practices that would improve sustainable performance;
knowledge of the context in which the farm works;
knowledge on the stakeholders’ perceptions of value within the organization itself, between the subjects of the supply chain and by the customers.
In order to achieve a picture of knowledge level, we carried out a questionnaire on 26 wine farms located in central and northern Italy, taking into consideration business size class, orographic condition, and management model. The investigation was addressed to the worker and manager technicians who operate and manage the farms. The survey affected several focuses to achieve an overview of technical and economic issues and to understand what is lacking and needed. The general part of the questionnaire was devoted to the understanding of educational level. The results showed a low level among the workers and manager technicians which play active roles (
Figure 7).
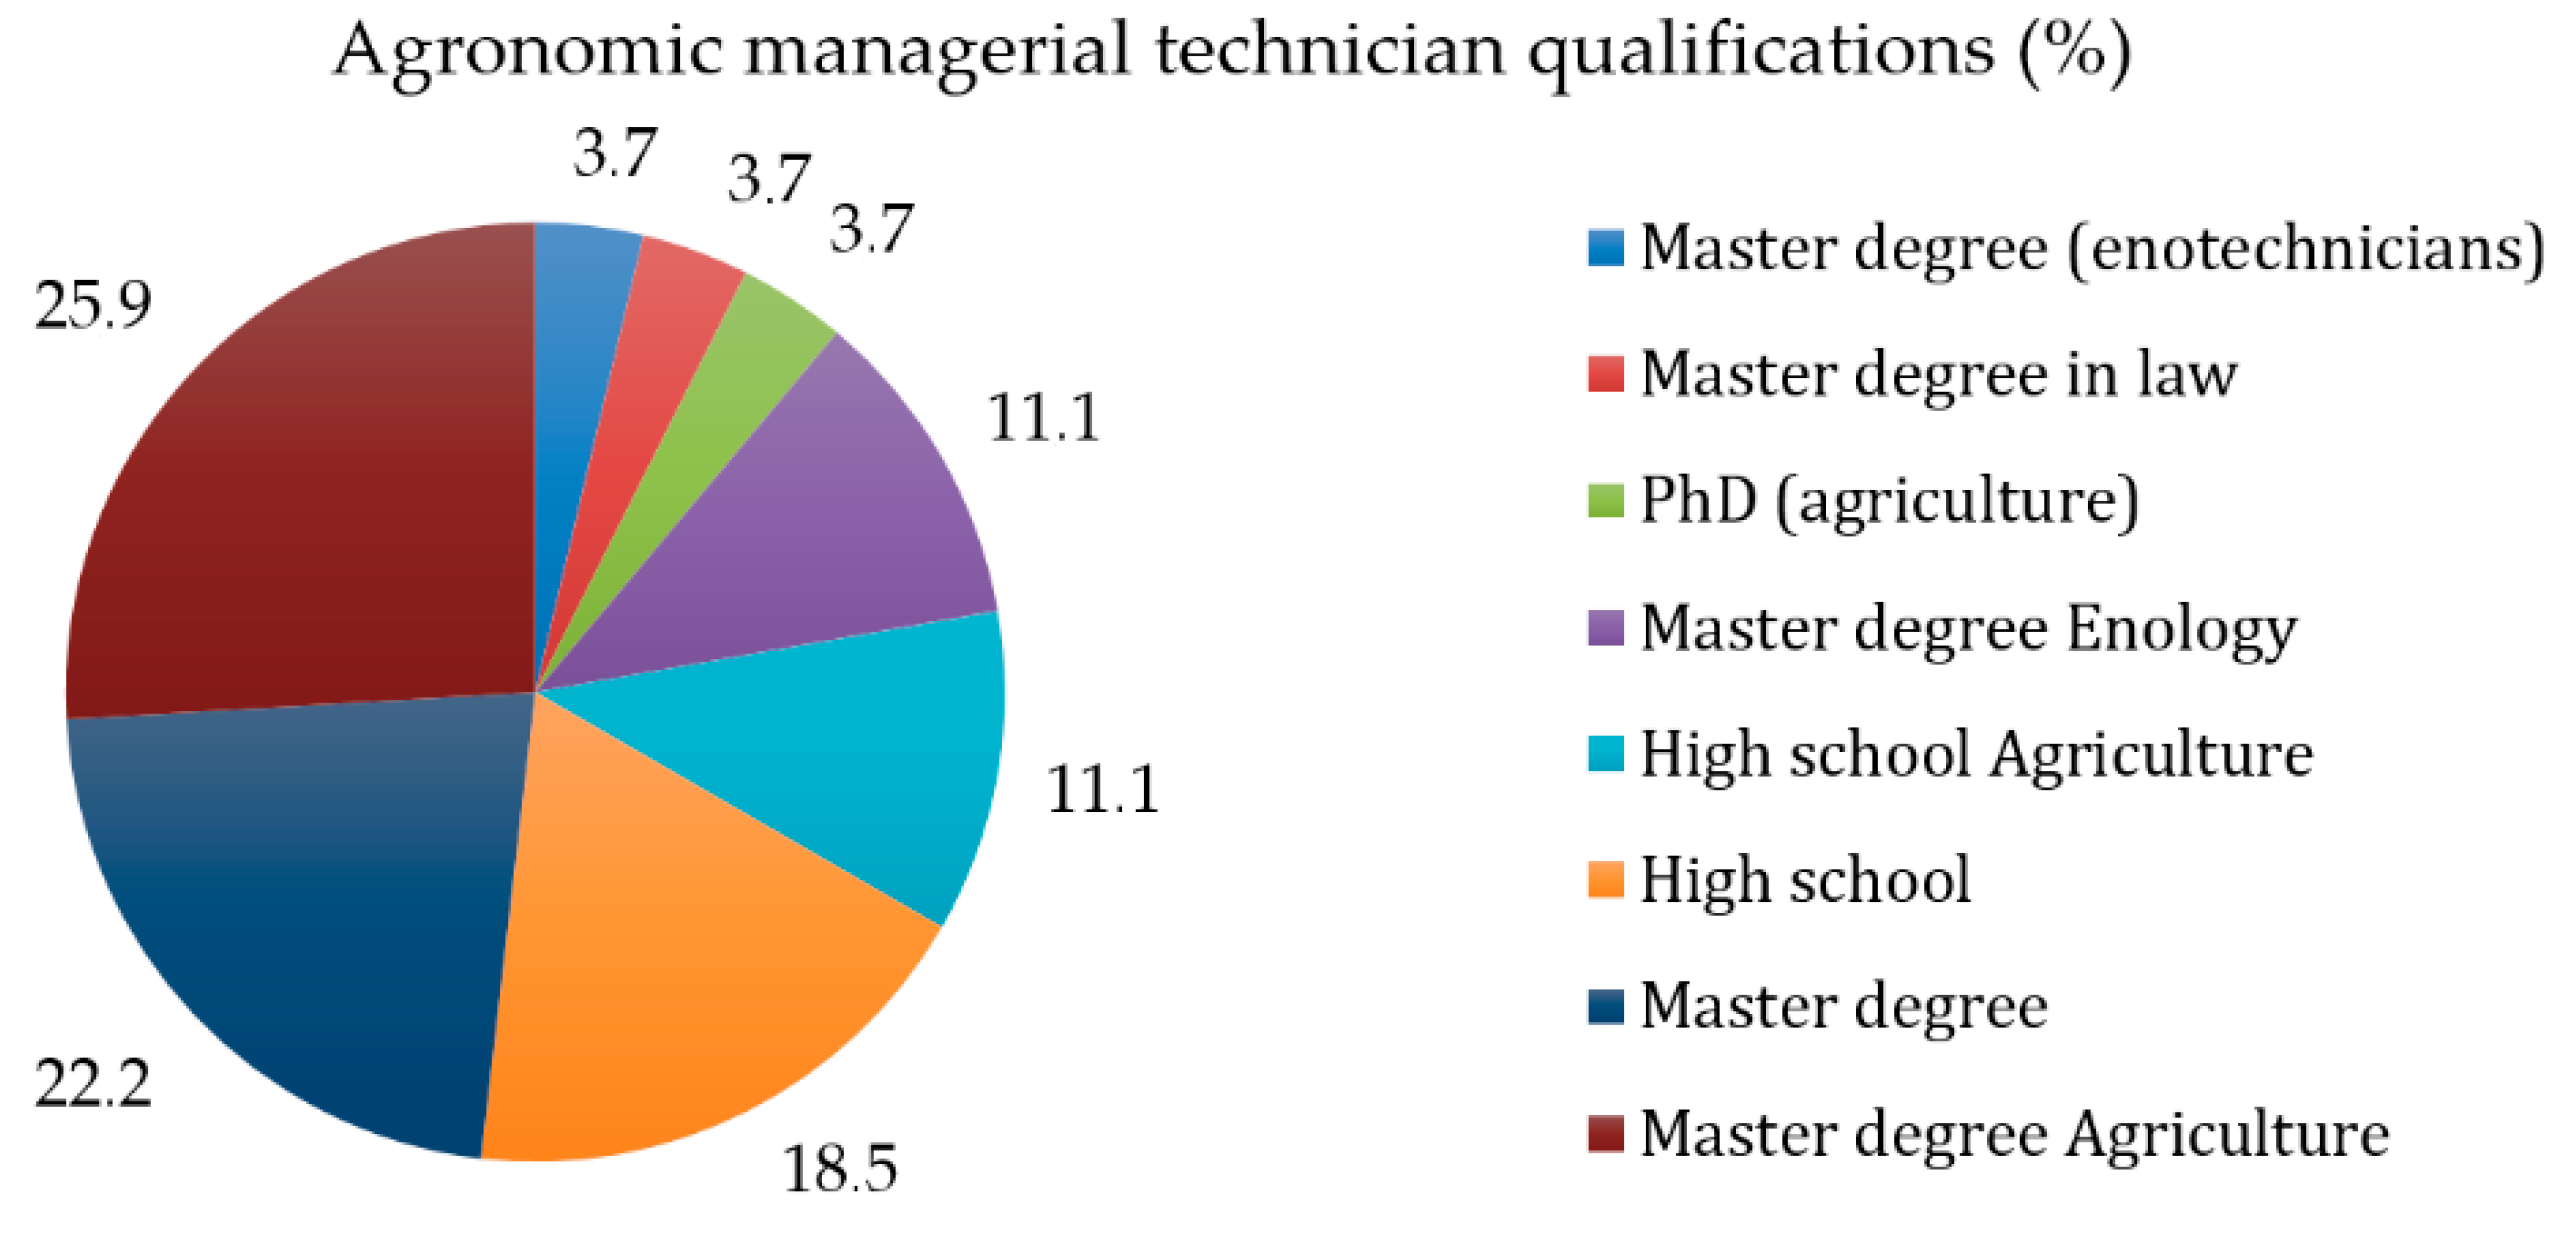
In particular, the highest level of qualification between workers was secondary school, with 43.2%, that is achieved at the age of 14. It represents the second cycle of studies of compulsory education in Italy. Secondary school lasts three years, usually from 11 to 14 years of age, as a continuation of primary school. The second most widespread qualification was high school, with 35.2%. It represents the education level following the attainment of the secondary school license. High school in Italy provides a great variety of addresses and includes various categories, which offer different preparations and professional outlets. Then followed the portion of operators with tertiary education, where the bachelor degree was 6.2%, the master’s degree graduates constituted 3.7%, and PhD 1.2%. It follows that the workers’ educational level is generally low or linked to experience accumulated over the years. With regard to the qualification of the technical managers, it was almost totally in agriculture sciences (
Figure 8). Inside this, it was possible to observe a secondary qualification step in oenology masters and oeno-technicians. Around 30% had high school qualification, of which 18.5% were in agriculture. None of the interviewed people had a degree in engineering sciences. This scenario may represent both a limit in future operational farm management and the propensity to introduce technological innovations, as a consequence of the lack of skills and knowledge in this topic. It follows that a low education level is attributed to low knowledge that affects the implementation of new management protocols and the propensity to the innovation.
Currently, in the wine farms, the training is usually of three types: (a) safety, (b) systematic preventive approach to food safety with hazard analysis and critical control points (HACCP), and (c) technical subjects. Both (a) and (b) are mandatory in Italy. Therefore, all subjects operating in the company, albeit in different forms that vary according to the risks to which they are exposed, are subject to periodic training and updating. Technical training, which represents the most responsible part of the increase in knowledge, is unfortunately often absent in small (<5 ha) and medium-sized companies (<50 ha) and sporadic in large ones (>50 ha). Specific courses are organized in the latter, aimed at operators on the use of machinery, on specific practices such as pruning.
The increase in knowledge for technical managers on specific subjects is often delegated to their will and curiosity. It is most widespread in small- and medium-sized companies where technical managers are also owners and therefore have greater interest in farm growth. In small companies, technical training is carried out through cooperatives, trade associations, and manufacturers that organize events in collaboration with the producers of the raw materials or technologies which sponsor their products. This approach represents both a limit to the openness to knowledge and a risk of spreading standardized practices that are not replicable and efficient in each operating context. The training of key staff with extensive and multi-disciplinary knowledge which provides a broad view of the production processes and consequently a better ability in problem-solving may ensure that workers work independently and competently. Skilled personnel are strategic for the viticulture sector, where productions are generally extensive and decentralized. Nevertheless, as posited by Pearce, the diffusion of knowledge and introduction of innovations also require the assistance of internal or external experts to the farm [
80]. The same approach should be followed in driving innovation and lean sustainability in grower operations. Training and development are key elements to the implementation of new practices and technology. Notwithstanding, as being supportive of lean and sustainable performance, these two activities are necessarily complementary, and the new technology cannot substitute good personnel [
89].
6.2. Awareness of the Operative Context
Another critical point for a proper introduction of lean is the context where it is applied. Many researches have shown that lean methods are applicable in a wide range of contexts [
90]. Anyway, the output outcomes of operational management activities are influenced by the context in which they are applied and must, therefore, be adjusted to the new scenario to achieve the desired results [
91].
The viticulture sector and more in general, the agriculture sector, is a highly dynamic and complex (e.g., high orographical, soil, wheatear variability) context. Additionally, environmental and economical elements of viticulture are becoming increasingly complicated and dynamic over time (e.g., climate change and stakeholders demands such as organic or biodynamic wine), aligning with the claim of Azadegan [
92] that manufacturers operate in ever more complex and volatile environments. A survey carried out by National Entity for Research and Training in Agriculture (ENAPRA) has highlighted for the Italian viticulture sector that complexities arise from the satisfaction of an ever more extensive and international demand from one country to another, with the maintenance of high-quality standards from year to year and secondly, as regards the high precision with which growers approach their grower operations [
93]. Another critical point is the family transition, as 90% of Italian wineries are family-owned. In this sense, in 28% of cases, the most reported criticalities are the non-interest of the owners’ heirs to continue the family entrepreneurial experience, in 27% the entrepreneur’s reticence to pass the baton, in 26% of cases the organization’s difficulties in accepting change, while 6% indicate the inability to leave management to external managers, and 5% the lack of entrepreneurial capacity of the emerging generation. The combination of complexity and dynamism factors of the wine sector makes the implementation of some lean practices more difficult. The changes in the production phases of the field and in the cellar transformation require continuous adaptations of the production protocols as a consequence of the annual variability that influences the quality of the harvest. Besides, in companies where innovations are introduced, learning times are required, which reconcile badly with the high intensity of some process phases, which need reduced execution times in order not to adversely affect quality. In light of the critical aspects of a sector in which the essential element of the production is a biological entity produced in a context subject to the variability of environmental factors, for a successful introduction of the lean method, a planning program in the medium term with concretely achievable objectives seems essential. This was confirmed by technical managers, who stated that on average, the technology adoption process requires at least three seasons to become fully operative.
6.3. Organisational Structure
The farm’s size, layout, and resources available and at the same time, the network of developed suppliers and customers which constitute the organizational structure may act as determinants in a farm’s ability to implement and sustain lean performance [
94,
95,
96]. The organization needs to motivate workers, concentrating on more organized and responsible behavior, using more appropriate equipment, pattern sequence, and parallel working. All of this should be done during the effective production process on an ongoing basis. Longoni stated that organizational structures should be designed to develop capabilities and mindsets between the several subjects of the farm to effectively achieve lean [
97].
Furthermore, another organizational aspect that must be considered for the proper introduction of the lean approach is the standardization of the geometries of the plants and management techniques. The regularity of the planting layout allows standardization of the settings of the machinery, a more efficient use of resources, and an optimization of the pathways by reducing downtime. Regular plants allow unvarying qualitative and quantitative yields and consequently a simplification of the transformation processes. The batches of grapes are qualitatively homogeneous, and the winemaking process is simpler to manage [
98]. Moreover, uniform planting layout allows to optimize and standardize management stages, such as crop protection, which are those with the highest frequency, economic and environmental incidence, and directly responsible for production. Although the standardization of geometries and techniques represents an element in favor of lean management, this must also consider the agronomic and “green” aspects. Lean and green integration must foresee and consider the possibilities offered by sustainable precision agriculture, which deals with biological variability in a differentiated way. The interviews conducted with the farmers highlighted that the operational adjustment of the intervention between plots was almost negligible because it is time-consuming (e.g., manual or mechanical settings). Such behavior is in favor of the lean but not the green approach. For instance, farmers posited that the crop protection in the viticulture is carried out with the same application rate of 250 L ha
−1 without taking into account the canopy growth stage. This technique is a simplification for analytical accountability and more generally from an organizational point of view, but the lack of adjustments between and within plots represent a “green” limit.
These assertions made by the growers and owners agree with the studies of Lapinski [
99], which demonstrated that lean sustainable performance may be improved through the proper design of the layout of the operating area.
Among the available tools which can support the lean and green organizational adoption, there is the WebGIS digital platform. WebGIS together with satellite and telemetry monitoring of yards is an essential element for economic and environmental accounting [
100]. In the short term, the WebGIS platforms allow managers to evaluate the progress of the execution of the works and directly or indirectly the process issues [
101,
102]. In the medium-long term it allows to obtain a database that can be used for the strategic planning of corrective managements actions, re-thinking production flow and investments.
6.4. Technology and Decision Support
Many studies stated that the process of lean adoption must be complementary to those that are technological. In this regard, Benner and Tushman indicated that lean process management integration within a company positively supports the organizational capacity for incremental technological innovation [
103]. Furthermore, Ward and Zhou claimed that technological innovation might improve the efficiency advantages of lean organizational systems [
104]. Regardless, the lean adoption has to face up to, on one hand, the compatibility of new technologies with existing systems and procedure, and on the other with the owners’ expectations to get back the invested capital in a short time. Pears has highlighted two fundamental factors that contribute to the introduction and diffusion of technological innovations in business contexts in which lean management is implemented: the first is the role of pilot case studies that large companies have. In fact, where capital and size are greater, economies of scale can be achieved. The technology in these scenarios goes through a testing phase that determines its success. Success stories can then be replicated on smaller farm scales. The second that emerged and is connected to knowledge is the presence of qualified personnel who, as previously reported, are a fundamental prerequisite. The diffusion of technologies involves minimal changes from an operational point of view (the machines work intelligently supporting the management of the workers), but is relevant from an organizational point of view (changing in settings, maps elaboration, implements configuration). Variable-rate technologies, decision support tools such as evolution models of the primary pathogens, and parasites require sensors and mathematical models that generate data and therefore, information. The latter must be accompanied by effective organizational processes and procedures in order to exploit their potential to implement more sustainable practices.
6.5. Implementing and Cyclical Enhancement of the Adoption Procedure
The practical adoption of innovation through lean methodologies, as highlighted in the previous paragraphs, includes assessments and preparation of all the process elements: structures, plants, tools, services, staff training, operational protocols. The lean process is articulated into several phases and is characterized by a continuous adaptation process. Lean has a wide collection of tools and concepts. There are several types of lean that can be profitably used individually, which makes it much easier to get started. However, the simultaneous use of multiple instruments determines a synergistic effect which leads to a greater increase in benefits compared to the adoption of a single instrument.
The Australian Grape and Wine Authority has focused this process in the wine sector. The results have been published in the guide entitled, “Lean guide: a primer on lean production for the Australian wine industry” [
92]. The guide highlights the usefulness of two methods, namely 5S workplace productivity and value stream mapping (VSM) [
105,
106]. The first eliminates waste that results from a poorly organized work area, while the VSM visually maps the flow of production. The VSM shows the current and future state of processes in a way that highlights opportunities for improvement. In particular, it exposes waste in the current processes and provides a roadmap for improvement through the future state. The tools presented indicate paths of continuous improvement of the production process through a cyclical sequence of stages: examine, identify, implement, assess, check of the feedbacks.
Dedicated to the optimization of the process in the cellar sector, the Australian lean guide represents a practical tool of great utility which, with the necessary adjustments, can also be transposed into farming, i.e., in the production of grapes.
Many of the phases which are performed in the vineyard are often repetitive (e.g., crop protection) and involve the use of resources such as men and machines like in the wineries. These factors inevitably determine a variability of operating outputs depending on workers’ skills, the technical efficiency of the mechanical means, and depending on the managerial skills of the agronomical technical manager. Obviously, in farming, the complexity is higher because we operate in an open environment where we are conditioned by external uncertainties (i.e., climatic factors and market conditions), crop characteristics, and cultivating scenarios. Decision-making in this uncertainty is a central issue to be resolved. It is, therefore, necessary to define specific operational protocols capable of responding precisely to the manifestation of critical and emergency scenarios typical of viticulture. These protocols can support farms in planning and forecasting production, also considering the evolution of the market trends. In general, farming chains require systematic analysis for the development of optimization at all stages. Mathematical models, data, and digitalization are a promising direction for seeking solutions to the farming issues.
7. Conclusions
The smart farming methodology originated from the systematic literature review and a non-linear process analysis gained in research projects aimed at testing or introducing innovative technologies in farms to increase sustainability understood in its three environmental, economic, and social components and the fulfilment of the regulations imposed by the European community. The proposal was modeled on the vine sector’s issues, which is facing a new management paradigm strongly affected by the use of digital technologies. The change taking place requires an overall re-thinking of the current management methods of wine farms and, more generally, agricultural ones. Greater awareness is needed in the adoption of innovations, as they require significant investments in capital and human resources so that they may bring an increase in competitiveness. At present, for our knowledge of the wine sector, there are no farms that have adopted the smart farming methodology in its entirety. In Italy, there are excellence cases where some of the above elements have been adopted mainly in order to solve critical issues or enhance a productive stage considered as a priority by individual companies, but not in an organic way on the entire business management process [
23]. In adopting the smart farming methodology, data collection is an essential stage. Database collections are a basic tool during the decision-making process and the organization of operation and work in farms. However, driving data is a complex process that requires knowledge and competences in order to acquire and interconnect all the information present or provided in farms. The information collected in a farm can come in different formats and sources. Mainly, in smart farming, information comes from technologies and monitoring. For those reasons, to understand the strategic importance of any information, in this methodology, the layer concept is provided. In the layer concept, all the information and all the data are classified and stratified in hierarchical levels, with constraints and available resources at the bottom, and informatics/computing technologies at the top, that gives the agri-entrepreneur an overall picture of their farm and a way to strategically use all the data and the information in the decision-making process. BMC tool application could help to focus on the value proposition of the farm and then to point out the technologies needed to bring added values for the farm outcomes. In agriculture, the TRL tool permits evaluation of the maturity levels both of one technology and of a set of technologies. This tool indicates innovative products’ (technology) readiness, but it does not indicate the development of the infrastructure related to the technology. That is why the MRL must integrate it. Indeed, this last tool can provide the degree of the technology readiness for commercialization and diffusion. However, even in this case, not all the variables that contribute to turning an innovative product in a system innovation are taken into account. It is in this perspective that the third evaluation tool (LERL) must be seen. This last indicator aims to evaluate the maturity level of the local ecosystem, i.e., the chain of infrastructures, actors, and formative system in each area or region. Moreover, the LERL may establish at which point of the transformation road, from innovative product to innovation, a new technology is located.
The increasing availability of agricultural technologies able to provide data requires an exact integration process. Tools such as the Business Model Canvas, the assessment of the TRL level and the restructuring of processes according to lean and, most recently, lean plus green methods, offer advantages that allow farms to acquire highly competitive margins.
The study carried out has made it possible to identify priority criteria that determine the success of smart farming, which can be summarized in the following points:
The agricultural progress in smart farming could offer huge possibilities to enhance quality and profitability for the future agripreneurs;
The enthusiasm for astonishing innovative products should be controlled, driving the whole entrepreneur process in a shared system of territorial rural innovation;
Variability in type of farm, age of actors, and infrastructure (i.e., broadband) should be taken into consideration, scaling the introducing technology in an innovative systems design of new shared, connected services like the territorial digital platform to process data for all sizes of entrepreneurial farms of a productive community;
It seems necessary to grow the diffused awareness of thinking in terms of added value, assess and allocate, prepare the change in the farming process and adopt, verify and tune-up through a lean-approach;
More and more appropriate is the High Tech and ITC cluster networks participation to be aware and joined with knowledge at global and local level.
The analysis showed that farmers are too often viewed only as a source of knowledge to be used by researchers rather than as an active participant in rural territory development, management, and transformation choices in participatory processes.
In our experience, if projects are carried out with careful participatory processes, project objectives could change and implement during the process. The results of the “Oenosmart” project [
18] are one of the sets of results confirming our experience. First of all, the system of European public funding, in this case an EAFRD, can economically stimulate the farmers to adopt PA technologies and “smart” solutions. By providing a trustworthy loan system, the EAFRD allows investment that, in other condition, are perceived by the farmers as not possible or not worthy. So, public funding is an essential base for PA and smart farming adoption. A second result concerns DSS use. As a matter of fact, in the project, the creation of a DSS system allowed the farms to verify themselves, permitting an optimization of the choice for PA adoption and to remodel the farm in a “smart” way, both in field operation and farm management. Indeed, the Oenosmart DSS provided the farmers with a comprehensive instrument for smart farming implementation. Another element deduced from the Oenosmart project is need and impulse to connectivity and sharing information between the farmer, other farmers, and other actors (providers, consultants, etc.). The Oenosmart project started as a weather data collection platform inside the farms of a defined territory (Montalcino, Tuscany, Italy). Beginning with this platform, the farmers understood the importance of data sharing. Little by little, Oenosmart led to the creation of a localized net of agricultural actors that share data, information, and experience on technologies. As an unexpected result, a platform born for weather forecasting evolved into a localized ecosystem, giving access to more data and real-time information to farmers and between farmers.
The findings suggest relevant implications, such as the need to raise awareness of precision agriculture and smart farming tools and encourage the dissemination of information aimed at reducing the degree of perceived complexity, in light of the Common Agricultural Policy Reform post 2020. Based on the conclusion and statements of this study and the opportunity of framework implementation in real wine farm cases, the logical and natural evolution of this research aims to the on-farm validation of the multidisciplinary approach. The next step will be the evaluation of the effectiveness of the method, which may be quantified with economic, environmental, and social impact indicators. Finally, this will open the question of how and which technologies are the most profitable for a given production scenario, because technologies are individually adaptable and cannot be standardized.

 ,
, 


