1. Introduction
Rapid urbanization is expected to emerge in developing countries in the next several decades, reflected in the number of urban inhabitants exceeding 60% of the world’s population by the year 2030 [
1]. The rise of population density and urban sprawl is expected to cause a dramatic increase in buildings and paved impermeable surfaces. As increasing stress is placed upon urban nature and the ecosystem, the reduction of green covers and degradation of water bodies eventually will raise the heat island phenomenon and anthropogenic energy consumptions in urban areas [
2,
3]. Meanwhile, multiple problems and threats for urban areas are likely to happen due to climate change, such as heat stress, extreme precipitation, inland and coastal flooding, landslides, air pollution, drought, and water scarcity [
4]. The provision of a comfortable open space in urban environments has become a major challenge in people’s quality of life.
Urban nature has been widely recognized as an important part of urban infrastructure providing a variety of ecosystem functionalities and services, contributing to sustainable urban development [
5]. Findings of empirical investigations have indicated that the presence of natural areas and green infrastructures in cities has the potential to fend off the adverse challenges on vulnerable urban environments and positively affects the life quality of inhabitants [
6,
7,
8,
9,
10,
11]. Consequently, investigations on people’s comfort perception related to urban nature and green infrastructure grows steadily [
12,
13,
14,
15]. It is well documented that exposure in green space is associated with numerous health benefits [
16,
17,
18,
19,
20,
21].
Urban wetland park, known as an ecological infrastructures and an important component of urban green space system, benefits the residents in reducing the damage caused by floods, replenishing water supplies, improving water and air quality, cooling the atmosphere, and promoting human comfort and wellbeing [
22,
23,
24,
25]. However, driven by anthropogenic pressures, wetlands have rapidly dwindled and replaced by constructed living spaces and excavated water holding facilities for runoff capture [
26]. Due to a process of continuous deterioration caused by urban growth, the wetlands adjacent to urban or peri-urban areas may never return to their natural statuses. In the context of environmental perturbation, a paradigm of wetland rehabilitation is supposed to shift and prioritize the functions and values for providing ecological benefits and urban open-space amenities [
27,
28,
29]. The conservation policies for wetlands should be not only feasible but also socially acceptable [
30]. Besides the ecological value [
31,
32], a great potential in the use of green space is emphasized, as the wetland park provides opportunities for physical activities, enjoyment of nature, and social interaction for inhabitants and visitors [
33]. The importance of human-nature interaction for individual psycho-physiological restoration from daily stress through the exposure to green space in wetland parks is acknowledged for enhancing wellbeing [
34,
35].
Although the benefits of urban green space are well known, strong incentives are still needed for improving the quality of urban wetland parks, referring to participants’ attitude toward urban green space, environmental satisfaction, and comfort perception. Attitudes toward urban green space, which can be represented by manifest items through questionnaire-based surveys, implies people’s preference and need in green and natural environments. Human comfort and environmental satisfaction are key indicators in assessing the quality of environments [
36]. To assess the quality of wetland parks from the participants’ perspective, we need to improve our knowledge on how people experience and perceive the environments [
37]. It has been evidenced that various physical attributes and management of green spaces are associated with people’s comfort, environmental perception, and satisfaction [
14,
38]. This study delves into this rather complex issue by theoretically exploring the hierarchical structure regarding the relationships between perceived quality and the latent theoretical constructs in terms of attitude toward urban green space, environmental satisfaction, and comfort perception. We aim to broaden the understanding of the individual’s various perceptions in a wetland environment and gain new insights into the quality of wetland parks in different dimensions. The study on wetland park quality may offer significant steps towards changing the wetland park to be more livable and encourage inhabitants spend more time doing outdoor activities in green space.
2. Conceptual Framework
There are many theoretical constructs which can be meaningfully conceptualized at a higher-order of abstraction [
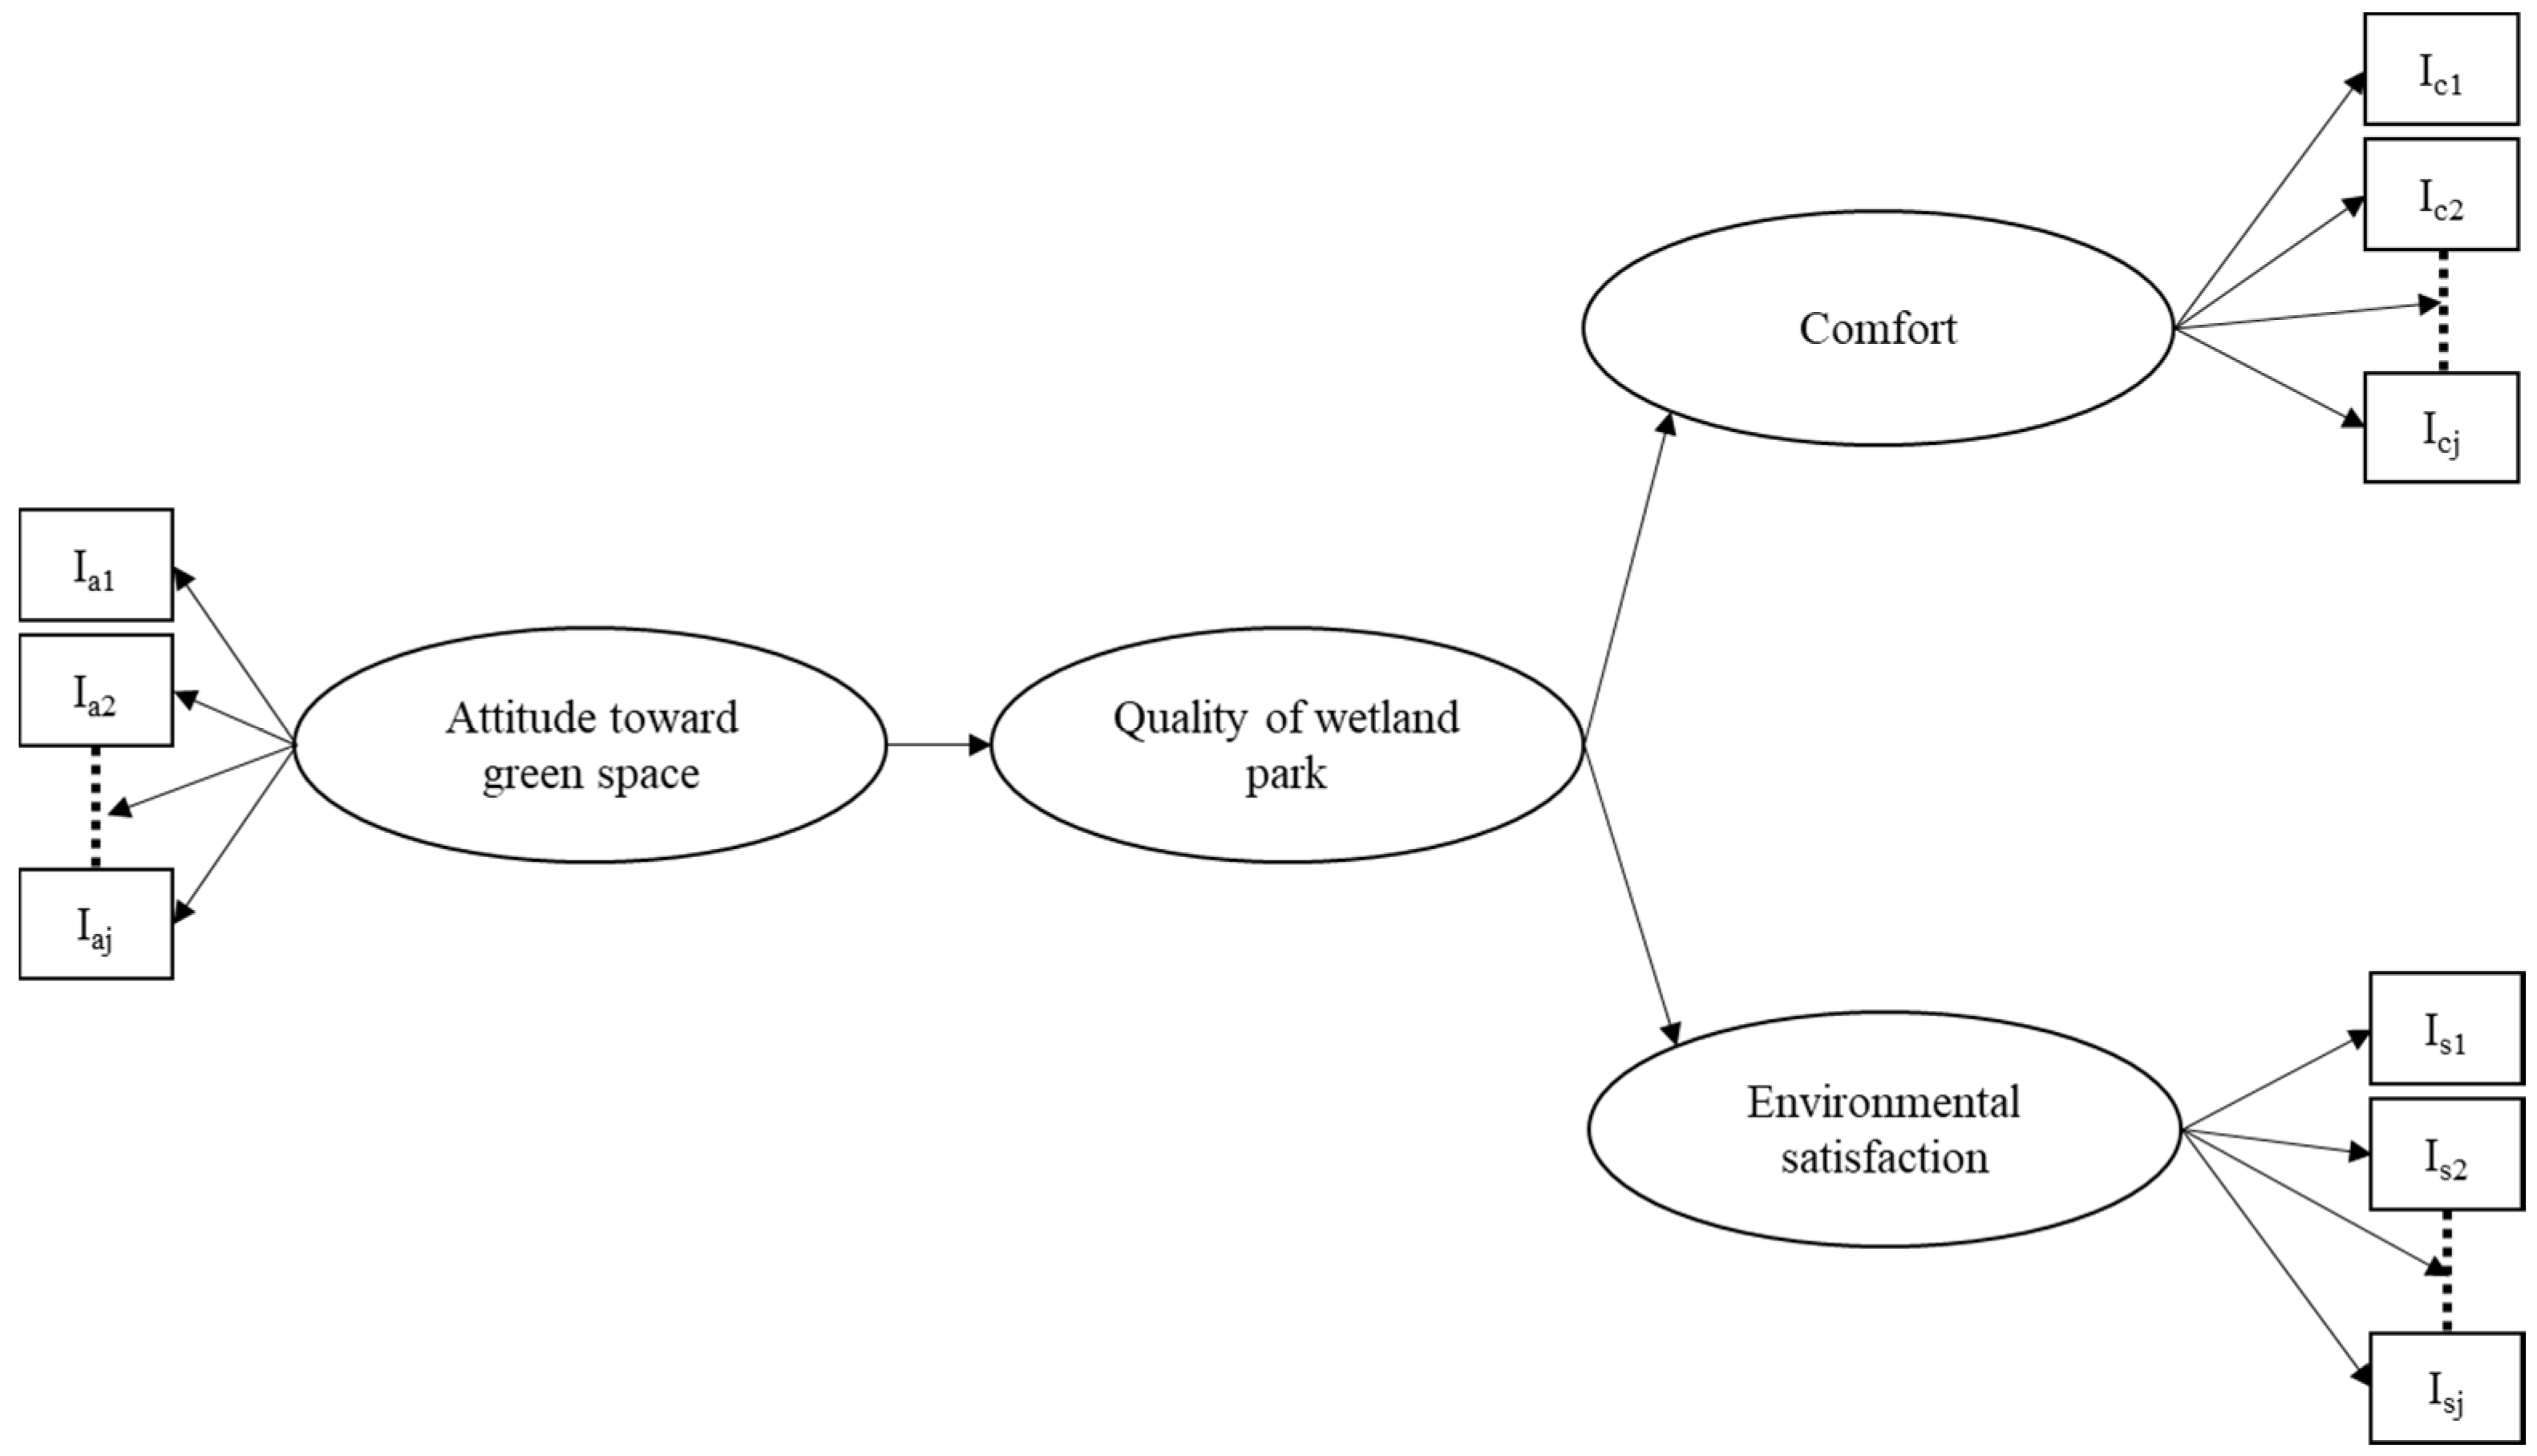
39]. As a joint product of various features of the environment interacting with individuals’ relevant psychological process, the appreciation of quality is directly associated with meeting people’s needs and making people comfortable. In the context of human-nature interaction, the quality of a wetland park can be conceptualized as a composite of two dimensions such as people’s comfort perception and environmental satisfaction, which are presumed at the first-order level of abstraction inferred from measured variables. Meanwhile, the perceived quality of a wetland park is influenced by the first-order theoretical construct of attitude toward green space. The second-order model is posited to estimate the relationships between the first-order latent variables and measured variables, and the second-order latent variables and the first-order variables. A second-order factor structural equation modeling would be the most feasible approach which can represent such a hierarchical structure, that implies the association between a second-order factor and the measured variables (manifest items surveyed) is mediated by the first-order factors.
The proposed conceptual framework is depicted in
Figure 1. It orients the studies on human-nature interaction in urban wetland parks, which serves ultimately the purpose to build the concepts of attitude, comfort, and satisfaction regarding wetland environment as three first-order theoretical constructs, represented by latent variables. Variables in rectangles denoted by
,
, and
are vectors of measured variables of theoretical constructs. Subsequently, evaluations of the first-order latent variables are aggregated to form the second-order construct of perceived quality of wetland parks.
As a complex multi-dimensional construct, attitude toward green space is influenced by an individuals’ personal characteristics and the context [
40,
41]. However, measuring individual attitudes toward urban green spaces has received scarce coverage in the environment and planning literature [
42]. Attitude is not directly measurable, therefore inferred indicators are commonly used to construct the attitude measurements through manifest items in questionnaire surveys [
40]. Likert items with agree or disagree options are usually applied to operationalize the attitude construct. The challenge of measuring people’s attitude is how to select representative items.
Environmental satisfaction involves the subjective evaluation on the features and settings of a given environment, which indicates how much the given environment meets the needs of people [
36]. As a general construct, environmental satisfaction in our conceptual framework is represented by the subjective evaluations regarding various environmental features of wetland parks, including noise, air quality, aesthetics, diversity of plants, facilities, barrier-free settings, number of trees, hygiene and insect conditions.
Human comfort is the integrated perception based on various microclimatic variables and environmental stimuli that is related to individuals’ socio-demographics, behavioral, and psychological factors [
43,
44,
45,
46]. The scope of comfort has been broadened from just physiological sensation to a cognitive activity where individuals make a holistic judgment based on the surrounding environment. Individuals participate in activities in wetland parks with their own purposes and expectations and are able to adapt to the changed environment to some extent. On the other hand, an individual’s adaptation can be promoted or delimited by opportunities and constraints of wetland parks in terms of physical and social contexts. Comfort is constructed as a latent variable indicated by multiple indicators, such as thermal sensation and perceptions of wind velocity, solar radiation and humidity.
It is important to realize that individuals’ preferences, expectations, and perceptions with respect to various features are related to the quality of wetland parks. Environmental factors constraining one person might facilitate another person and vice versa. Theoretical construct of quality of a wetland park represents the integrated evaluation on subjective perceptions of wetland parks in this conceptual framework. Here, the quality of wetland parks is treated as a latent variable of interest, which is conceptualized by the theoretical construct of comfort and satisfaction represented also as latent variables. Natural experiences are linked to the improved comfort perception [
6,
7,
47,
48]. However, to assess the quality of wetland parks, it is not sufficient to describe only whether the environment is comfortable or not, it is more important to understand people’s attitude and satisfaction related to the various features of wetland parks.
3. Methodology
3.1. Study Area
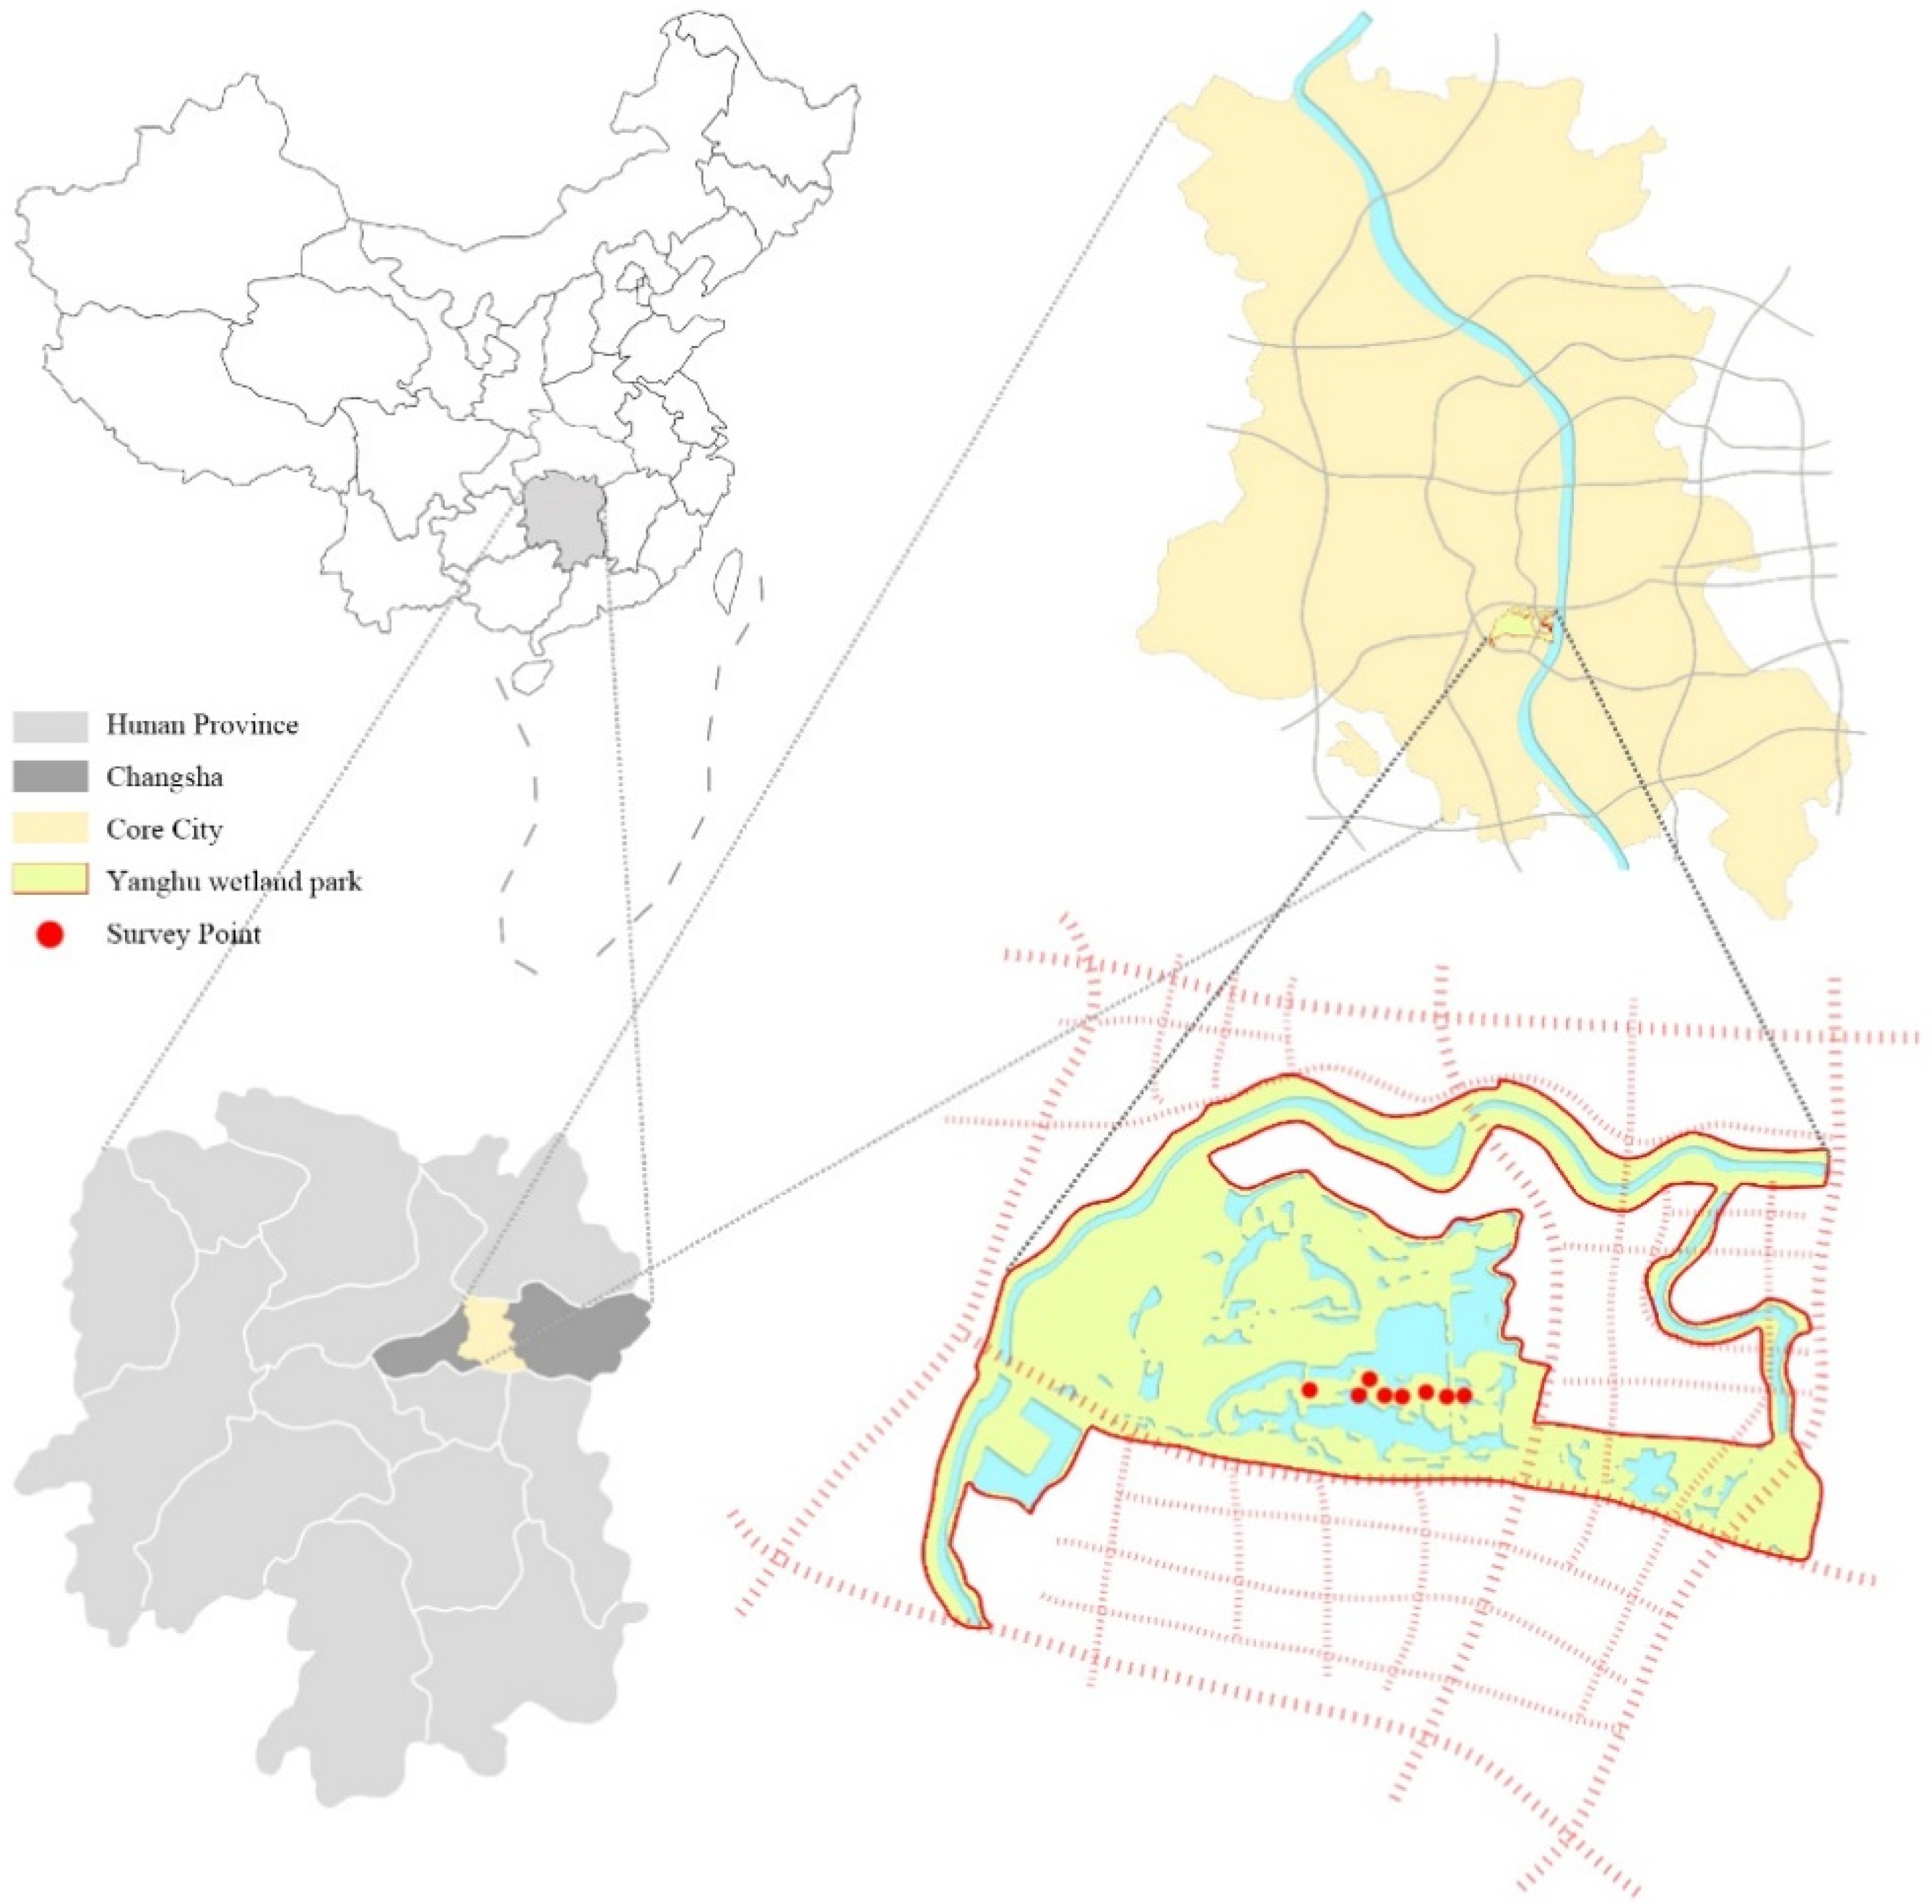
Yanghu wetland park is located in the southwest of Changsha (see
Figure 2), a large city with a population more than 3 million in the central south of China [
49]. Changsha is the capital and most populous city of Hunan province. The city has a humid subtropical climate (Cfa) [
50], featuring warm spring, hot summer, cool autumn and cold winter. In recent years, the urban area has been rapidly sprawling towards its periphery.
As they have experienced unprecedented economic growth, cities in China experienced sharp air pollution and environmental deterioration, which increases inhabitants’ awareness and demand of protection for urban green amenities and better access to natural landscapes [
51]. From the perspective of lending direct supports to people’ quality of life, the restoration of wetlands in urban and peri-urban areas provides open spaces for physical, recreational, and social activities for residents and improves local microclimate and counteracts the negative environmental stimuli [
52]. In recent years, nationwide developments of urban wetland parks have been launched in many cities in China, as a part of the sponge city programs for urban water management in order to manage stormwater and hydrological systems, in the context of urbanization and the urban water crisis [
53]. In this context, Yanghu wetland park was established based on a natural river wetland and an artificial wetlands in 2010, which is bordered by Jin River on the south and east, south Xiaoxiang Avenue on the west and Yanghu Avenue on the north, covering an area of 478.7 hectares [
54].
Yanghu wetland park is nourished by surface runoff waters, precipitation, and underground waters. The wetland areas in the park cover 170.3 hectares, which consists of natural river wetlands and artificial wetlands. The proportion of wetland areas coverage in the entire park and the ratio of different types of wetlands are shown in
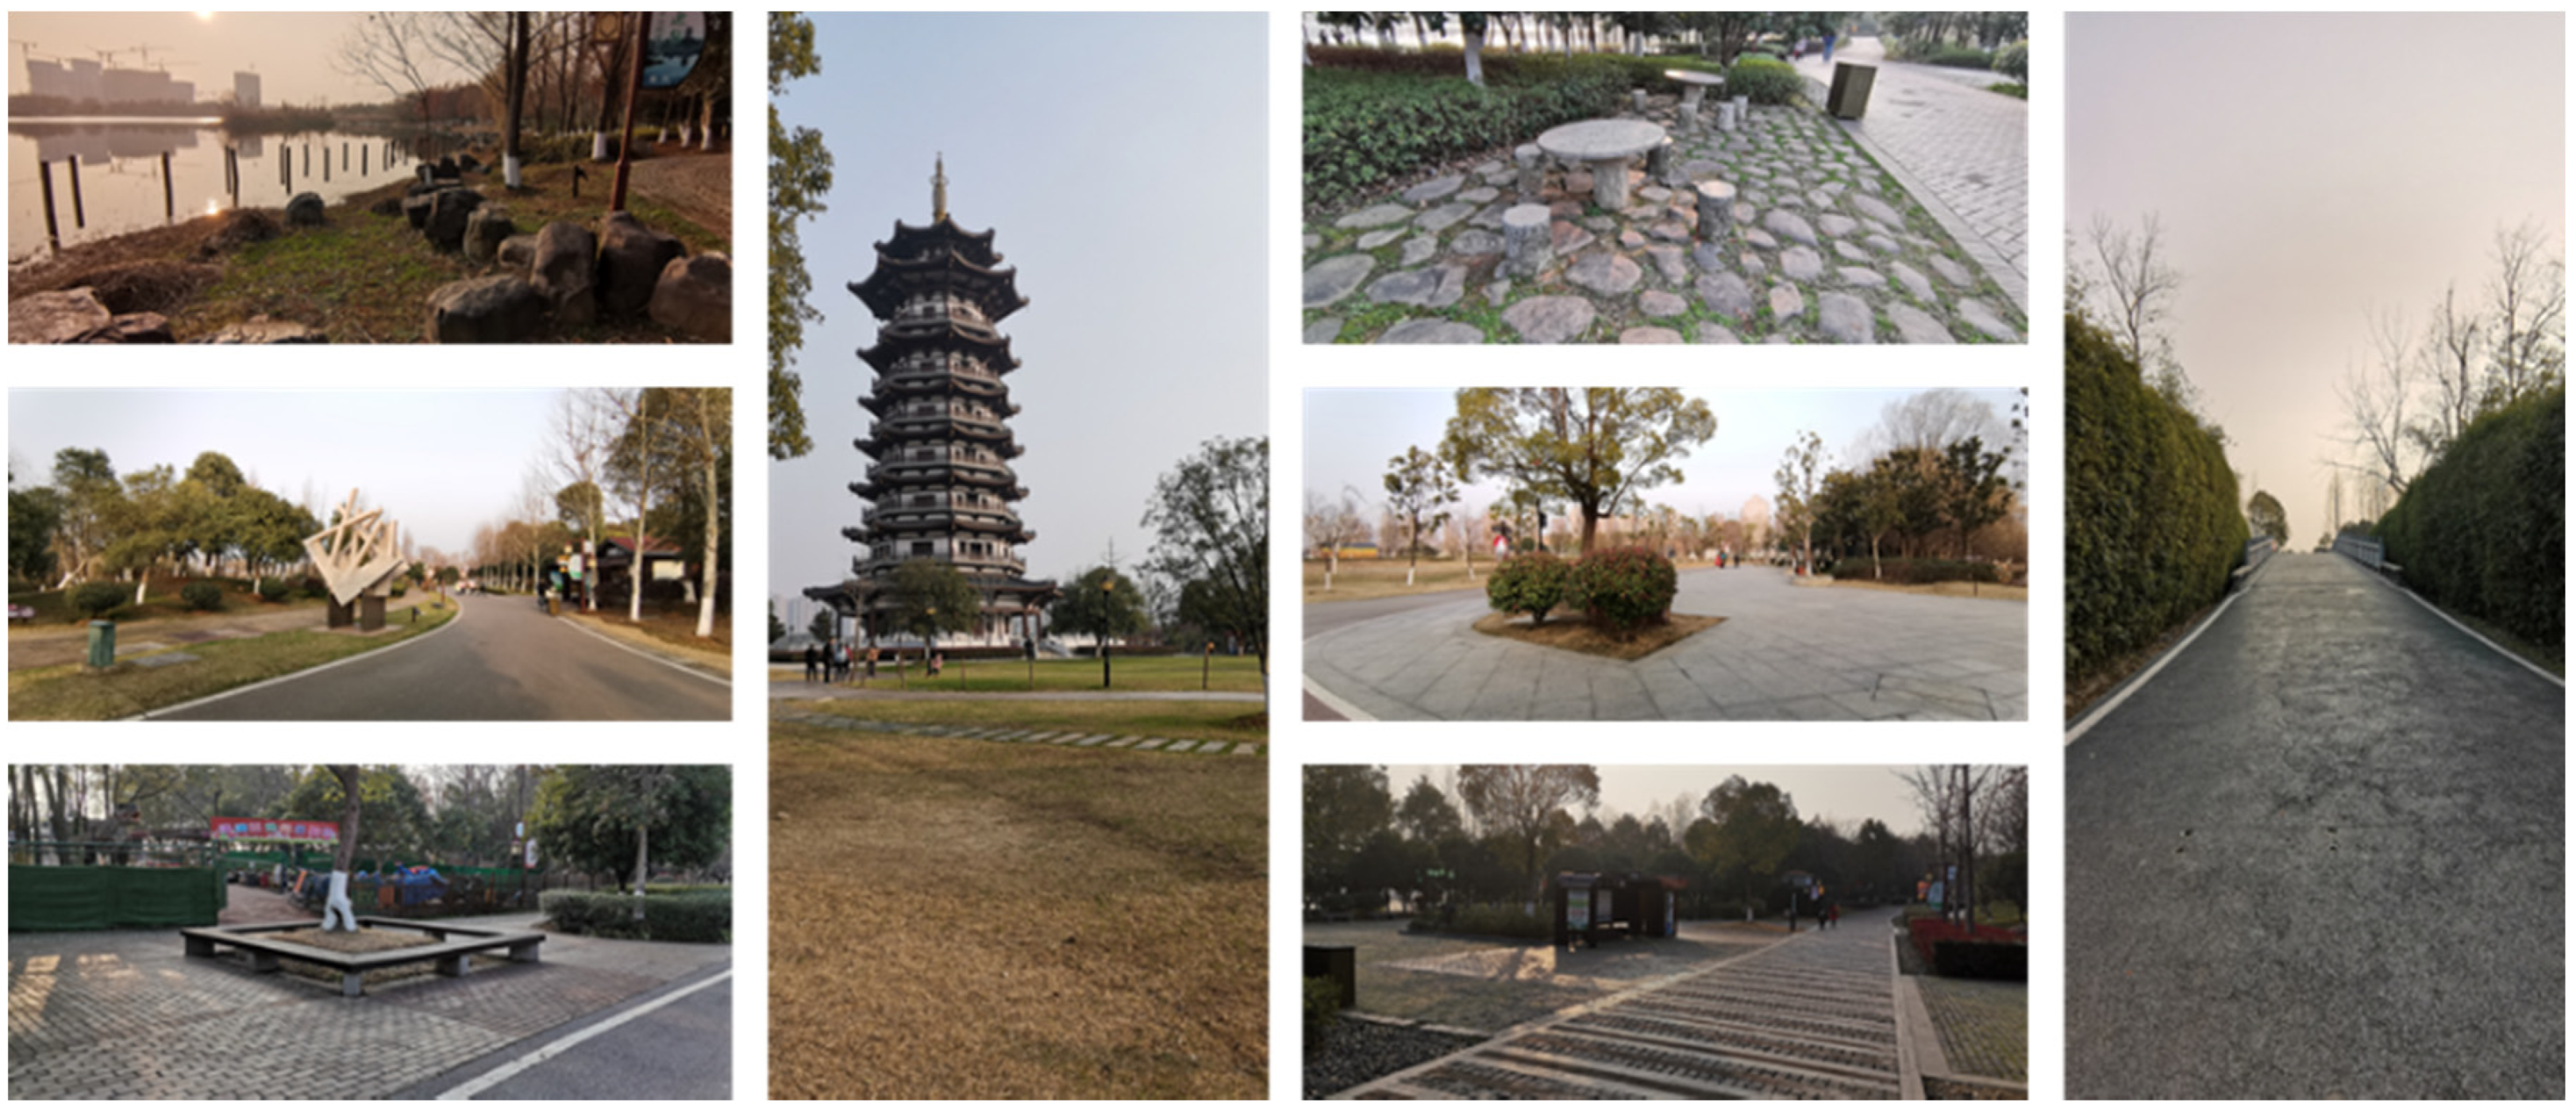
Figure 3. The pool areas in the park covers 116 hectares and the river in the park covers 53.4 hectares. Besides the water areas, green space covers 281.3 hectares. The studied plots are distributed in the central park area nearby the waterfront, where artificial interventions were exerted to facilitate the participation of walking, rest, leisure, social and physical activity. The scenes of different studied spots are shown in
Figure 4.
3.2. Questionnaire and Survey
For the purpose of this study, a three-part questionnaire was developed. The first part of the questionnaire includes questions about respondent’s demographical characteristics, socio-economic status, dwelling conditions, transportation modes and time, and behavioral factors related to the visit of wetland parks. The second part of the questionnaire collects information of respondents’ attitudes toward urban green spaces. The identically constructed attitudinal questions were asked, with responses given using a five-point Likert scale with anchor ends of strongly disagree and strongly agree. The last part of the questionnaire focuses on the respondent’s perceptions of microclimate and evaluations of various features of wetland parks, which pertains to participants’ comfort and satisfaction. For the perceptions of microclimate and environmental features, questions are posed with responses of seven-point scales. The questionnaire form applied in surveys are in Chinese. According to the privacy rules, no trackable personal information was obtained.
The survey was carried out in Yanghu urban wetland park with the assistance of university students. Before the field work, students were trained in the procedures and etiquette of conducting surveys. From 19th October to 24th November 2019, a team of student research assistants started randomly inviting the participants in sampled plots to join in the questionnaire interviews. At the beginning of each survey, it required a research assistant to introduce and explain the survey purpose to the participants. On average, the survey takes about 10 min to complete. In the end, the survey successfully interviewed thousands of respondents face-to-face and obtained 936 effective samples for further studies.
3.3. Second-Order Factor Structural Equation Modeling
Structural equation modeling (SEM) is a general statistical modeling method widely used in social and behavioral sciences to test and evaluate multivariate causal relationships, which can be viewed as a combination of factor analysis and regression or path analysis [
55,
56,
57]. SEM differs from other modeling methods since it estimates the direct and indirect effects on hypothetical causal relationships. Unlike the regression model with a single equation that has a single dependent variable and multiple explanatory variates, SEM has a number of equations with several explanatory variables in each of them. The dependent variables in one equation of SEM might be an independent variable in another equation.
The variables in SEM are classified as endogenous and exogenous variables. Exogenous variables can only be independent variables, but endogenous variable can appear as an independent variable in one equation and an independent variable in another equation. The variables in SEM are also divided as latent and measured variables. Latent variables are factors that are important to the model which we cannot obtain from dataset, while measured variables are collected and saved in dataset [
58].
The SEM is segmented into two parts, the measurement model and the structural model. The measurement model specifies the relationship between latent construct and its manifest items, while the structural model specifies the relationships between latent constructs. The second-order SEM is posited, which inherently consists of a measurement model that specifies the relationship between the manifest items and their respective first-order latent variables, and the first-order latent variables related to the second-order latent variable(s), and a structural model that delineates links between latent variables. The second-order model recognizes the contribution and retains the idiosyncratic nature of each first-order construct, and treats such constructs as facets of the second-order construct [
39]. The coefficients of the relationship between first-order construct and its second-order construct and thus the statistical contribution of each first-order construct can be estimated. The quality of a wetland park is conceptualized as a second-order composite of first-order theoretical constructs such as individuals’ comfort and environmental satisfaction. The SEM also specifies the influence of first-order latent variable of attitude toward green space on perceived quality of wetland parks.
Once model identification has been established, the model estimates then proceeds. Statistically, the SEM is estimated by comparing two variance-covariance matrices. If the closest estimate of the implied variance-covariance matrix with vector
of model parameters (
) to the estimated population variance-covariance matrix (
) is found, the model is fit to the data. Regarding the function
, the most commonly used minimization criterion is maximum likelihood (ML), which is expressed as:
where
is the number of measured variables and
denotes the sample size. The derivation of ML estimator assumes that all measured variables come from a multinormal distribution.
To examine the fit of a hypothesized model, various goodness-of-fit indexes are used in this study. The comparative fit index (CFI) [
59] provides a measure of complete covariance in the data, which ranges from 0 to 1. A higher CFI value indicates a better fit. As evidence of adequate fit, the value of CFI should be equal or greater than 0.90. The root mean squared error of approximation (RMSEA) [
60] is a measure of the estimated discrepancy between the population and model-implied population covariance matrices per degree of freedom. RMSEA is an index where 0 indicates the perfect fit and higher values means a lack of fit. If the value of RMSEA is equal or less than 0.06, the model is adequate fit. The standardized root mean square residual (SRMR) [
60] is a measure of the average of standardized fitted residuals. A value smaller than 0.08 indicates a good fit.
4. Results and Discussion
4.1. Descriptive Statistic Results
According to the results of descriptive statistical analysis (
Table 1), varieties are found among samples according to the demographic characteristics, socio-economic status, and dwelling conditions. Males account for 46% of the respondents which is a little less than female respondents. Significant percentages of respondents are in the 16–30-year and 31-45-year age groups. More than half of the sampled population is married. Over two-thirds of the respondents received college degrees or higher education. More than half of the respondents are employed, and the other half involves students and other types of jobs (e.g., freelancer, entrepreneur, etc.). Regarding monthly income denominated by Chinese Yuan (CNY), 52.8% of respondents earn less than 5000 CNY including over one-third of respondents with no independent income. Compared with the per-capita monthly income in Changsha (about 4233 CNY) [
61], income of more than 15,000 CNY is relatively high. According to the statistical results, respondents belonging to this income category only account for 4.8% of the entire sampled population. The overwhelming majority of respondents are residents, still, 5.3% of respondents are visitors from outside the city. The dwelling condition relates to the ownership and size of residences. Accordingly, residential ownerships are generally classified into “rent” and “purchased,” which are split fifty-fifty. Respondents owning their house mostly live with a partner or other family members.
The transportation-related factors are important to outdoor experiences, which may further influence people’s satisfaction and comfort with outdoor activities [
44]. As shown in
Table 2, only 6.3% respondents visiting the Yanghu wetland park are living less than 500 m from the park. More than half respondents traveled more than 2.5 km for visiting the wetland park. Apparently, the wetland park attracts many local visitors who live in the neighborhood far away from the park. As for transportation modes, 17.8% respondents came to the park by foot and 8.5% respondents rode bikes to the park. The respondents who take public transportation accounts for 35.6% of the sample. The rest of the respondents used taxi, cars hailed online, or a private car. The time people spent on the road from dwelling to the park is mostly shorter than 45 min.
Based on the results shown in
Table 3, the main purposes for visiting the wetland park are walking, resting, and social and recreational activities, which accounts for 44.8%, 17.6%, and 24.5% respectively. Some 6.5% of respondents came to the park for physical activities and the other 6.6% respondents came for other purposes. Regarding the time spent on outdoor activities, most respondents spent less than 2 h in outdoor environments and less than 1 h in the wetland park. Some 14.6% respondents visited the wetland park for the first time, 38.8% respondents visited the wetland park a few times in a year, and 28.8% respondents came to the wetland park several times per month. More frequent visits have been taken by 9.8% respondents, who went to the park many times per week. Moreover, 8% respondents visit the park almost every day.
4.2. Estimation Results of the Second-Order Factor SEM
The significant test results of indexes for goodness-to-fit are shown in
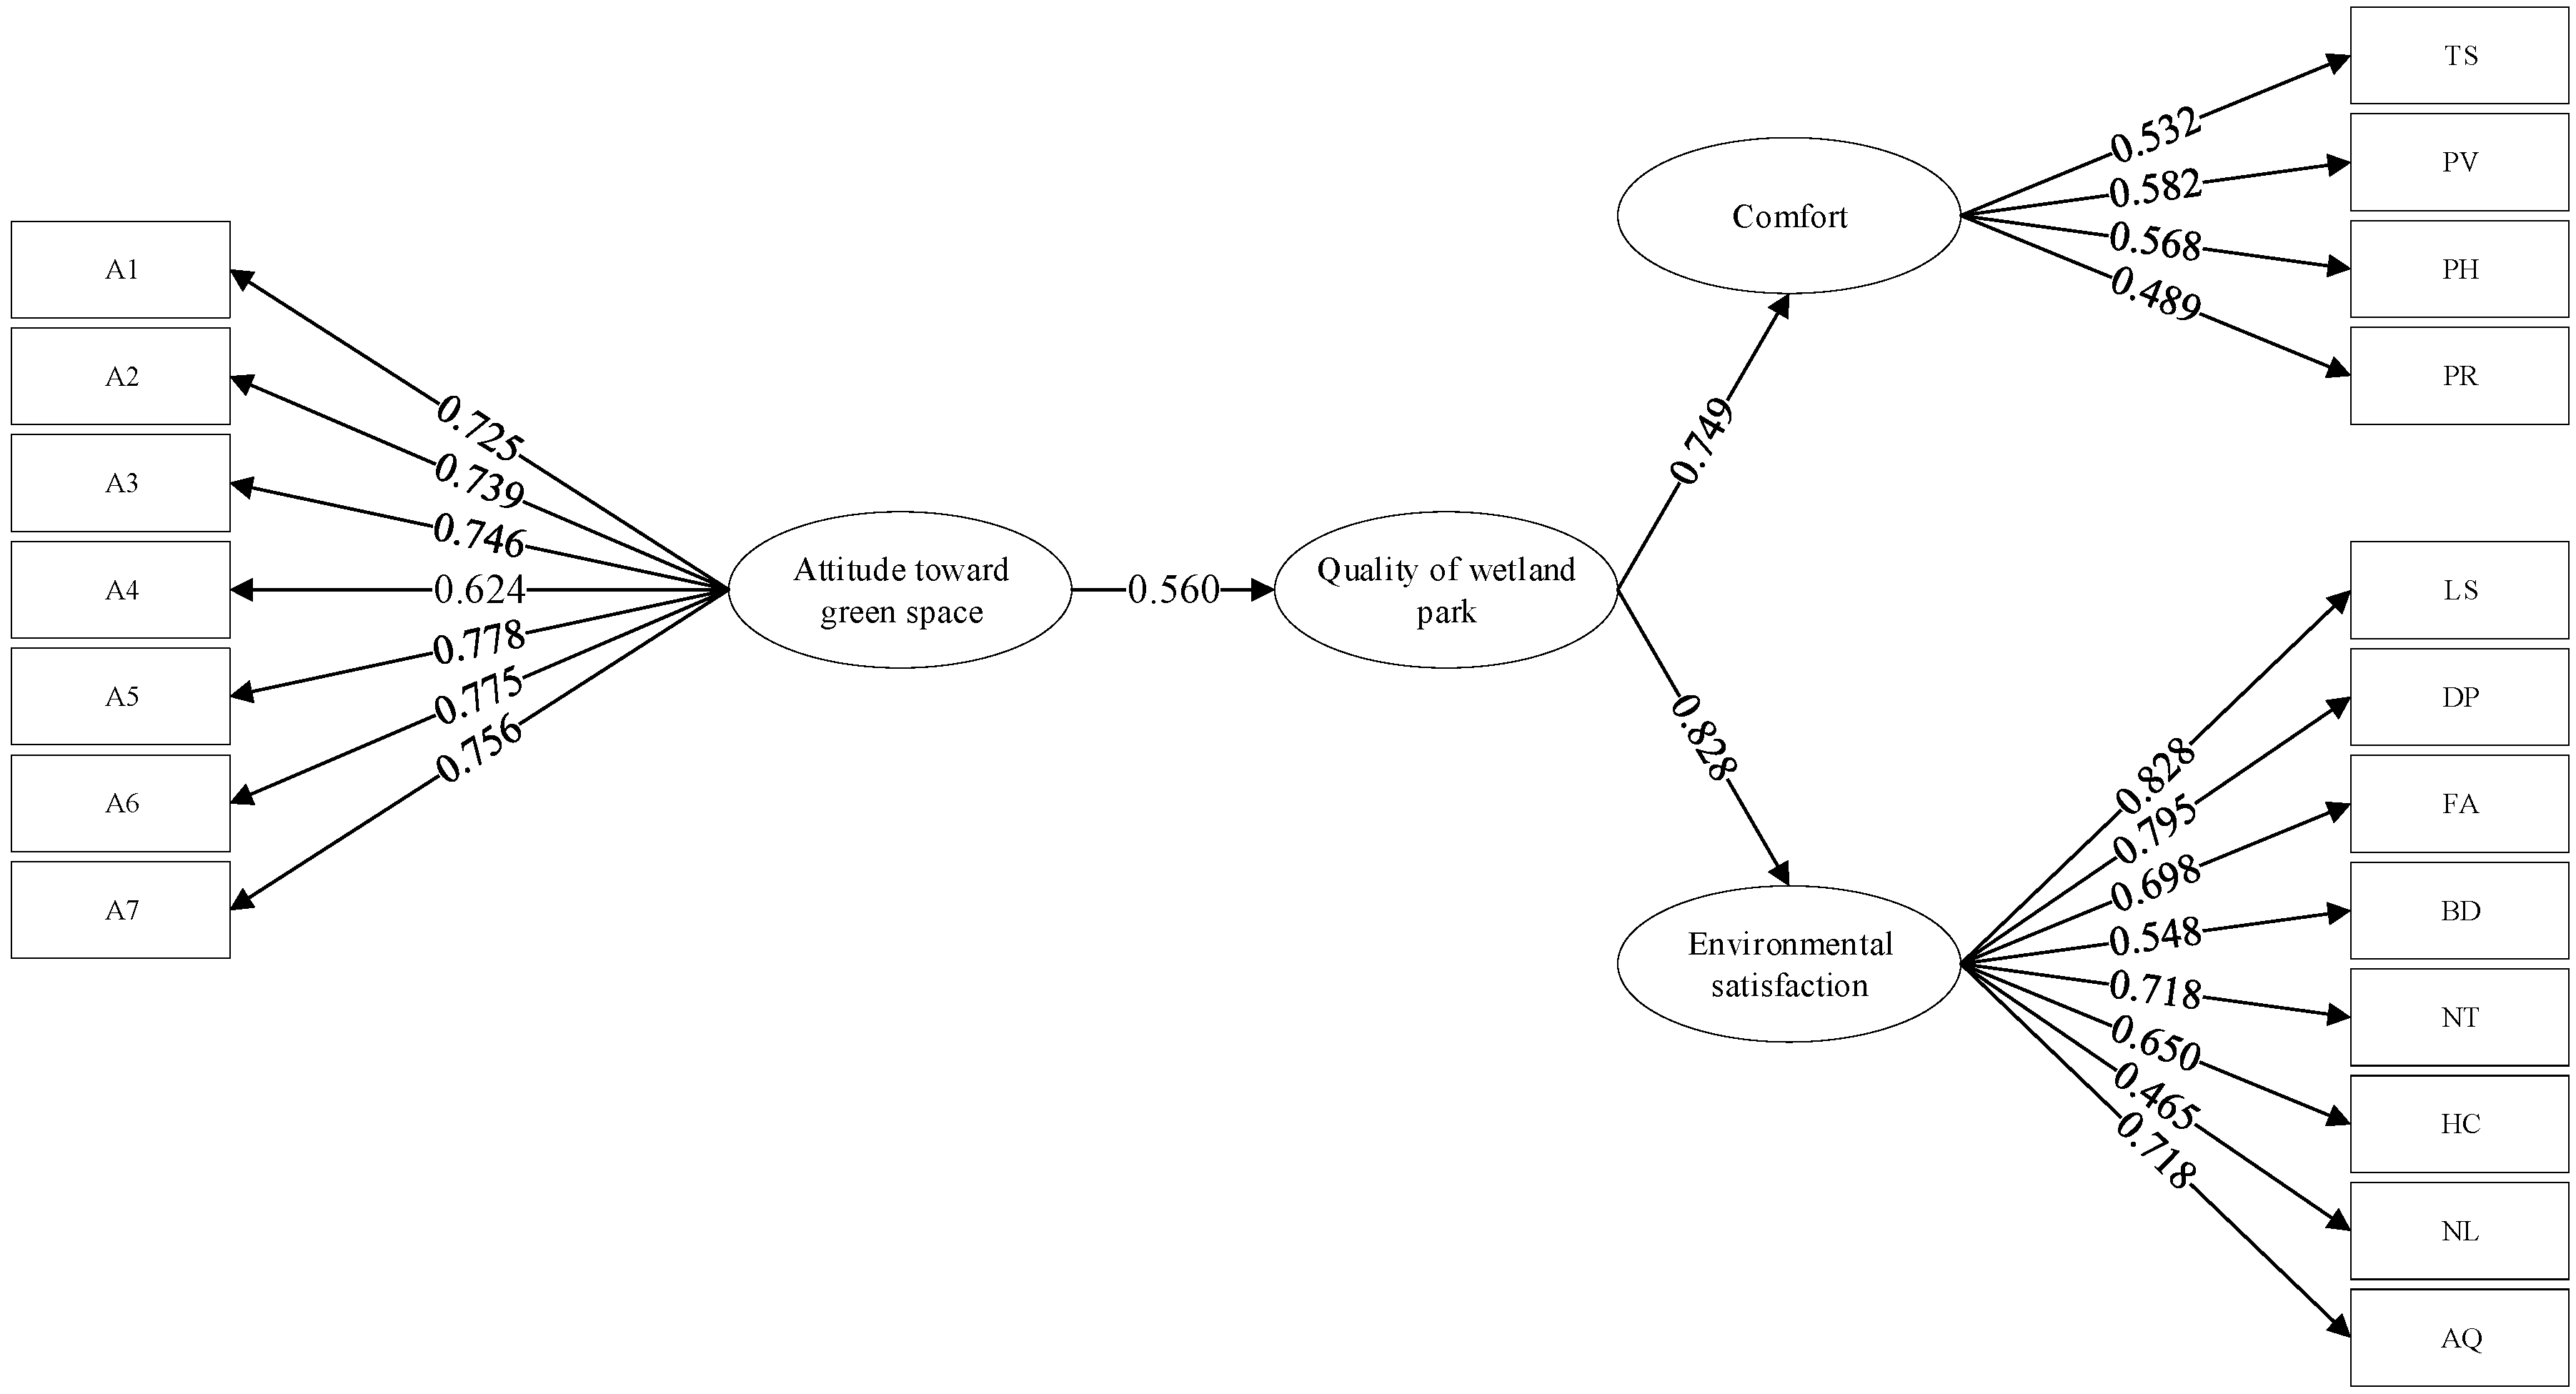
Table 4, which provides an evidence of a good fit model. The structure of estimated second-order factor SEM is depicted in
Figure 5. The acronyms of exogenous variables are explained in
Table 5. According to the results shown in
Table 6, all measured variables have statistically significant relationships with their latent variables. Notice that the loadings of the first-order latent variables to the second-order latent variables exceed 0.70 that are substantive and statistically significant, which indicates the quality of the wetland park contributes to comfort (coefficient = 0.749,
p-value = 0.000) and environmental satisfaction (coefficient = 0.828,
p-value = 0.000). This points out a very strong relationships between perceived quality of the wetland park and comfort and environmental satisfaction, which attests to the convergent validity of theoretical construct of quality of wetland parks meaningfully conceptualized through second-order modeling. Based on the hypothetic conceptual framework, the structural model where quality of wetland park is specified as the dependent variable and the first-order latent variable, namely attitude toward green space, is presumed to affect the second-order factor. The result of the coefficient regarding this relationship is 0.560, which attests to the effects of attitude toward green spaces on perceived quality of wetland parks is rather potent.
To our knowledge, the loading of the relationship between comfort and specific perceived microclimatic impact is highly dependent on the contexts. The factor loadings regarding the comfort range from 0.490 to 0.582. Although the difference of loadings for each measured variable is small, the perceived wind velocity has the strongest correlation with comfort among measured variables. We noticed that the green space in wetland park may reduce the wind velocity which gives people pleasant feeling thereby producing more comfort. As the field experiment was carried out in the end of autumn, the loading of association between thermal sensation and comfort is 0.532, thus, the wetland’s cooling effects probably loss its weight in comfort assessment.
The measured variables, including the evaluation of landscape aesthetic, diversity of plants, number of trees, and air quality, are highly correlated with environmental satisfaction, since their factor loadings exceed 0.7. The measured variables of facility, hygienic condition and barrier-free design concern amenities and management of wetland parks, which are associated with environmental satisfaction with a loading of 0.698, 0.650, and 0.550, respectively. To some extent, the quality of wetland parks can be indirectly derived from the aspects related to the items with high weight of loading, which reflects that participants patronize and spend some time in the wetland park for encountering nature and experiencing the beauty of landscapes. The lowest loading of 0.465 is related to the association of perceived noise level and environmental satisfaction. One possible reason is that the noise disturbance has been lower in the environments of wetland parks compared with other circumstances in urban public spaces. Based on the data, the perceived environmental acoustic level is skewed towards quiet and stabilized. The manifest items involve questions on environmental benefits provided by urban green space, preference of outdoor activity in green spaces, and management of green space. The results show that the loadings for common variances of each manifest item in the form of questions explained by attitude toward green spaces are significantly large and most of them are higher than 0.7.
5. Conclusions
This study focuses on developing a theoretical framework for evaluating the perceived quality of wetland parks in urban areas. Based on the data obtained from surveys in Yanghu wetland park, a set of variables forms a reliable instrument to conceptualize the first-order latent variables regarding attitudes toward green spaces, comfort, and environmental satisfaction of people. Thus, we hypothesized that the quality of wetland parks is a higher-order theoretical construct conceptualized by individuals’ comfort and environmental satisfaction as having two dimensions and influenced by individuals’ attitude toward urban green spaces. According to the estimation results of the proposed second-order factor SEM, the hypotheses of second-order hierarchical structure has been verified.
So far, there has been a rather limited amount of research concerning quality of wetland parks that addresses comprehensive analysis on latent constructs with various dimensions of respondents’ psychological factors. To the best of our knowledge, the present study is the first to relate comfort and environmental satisfaction to the quality of wetland parks and emphasizes the role of human-nature interactions in assessing the quality of wetland parks. Perceived measures even without correspondent objective measurements are essential since perceptions are the basis for people’s evaluation.
From the perspective of urban planning and management, the complexity of second-order construct indicates that improving quality of environment is beyond the efforts on physical settings, which should fully consider users’ various needs and perceptions. The present work provides a step towards a user-centered approach to studying human-nature dynamic interactions and establishing interdisciplinary criterion for assessing the quality of environment. Although this study focuses on the perceived quality of Yanghu wetland park in Changsha, the conceptual framework and approaches of data collection and modeling are feasible to be generalized in other wetland parks in various forms in different regions and countries. Certainly, the calibrations on measured variables are required, depending on the local environmental and cultural contexts and residents’ demographic and socio-economic characteristics. The perceptions may differ from person to person; however, the analysis in this study is limited to the average perceived quality of wetland parks of the entire sampled population. Further studies are expected to include the analysis on physical features of environment in wetland parks and the potential heterogeneity among visitors.

 ,
, 


