Article

Impact on City Bus Transit Services of the COVID–19 Lockdown and Return to the New Normal: The Case of A Coruña (Spain)

by
Alfonso Orro
1,*,
Margarita Novales
1,
Ángel Monteagudo
1,
José-Benito Pérez-López
2 and
Miguel R. Bugarín
1
1
Group of Railways and Transportation Engineering, Department of Civil Engineering, ETS Ingenieros de Caminos, Canales y Puertos, Universidade da Coruña, Campus de Elviña, 15071 A Coruña, Spain
2
Group of Railways and Transportation Engineering, Department of Economics, Facultad de Economía y Empresa, Universidade da Coruña, Campus de Elviña, 15071 A Coruña, Spain
*
Author to whom correspondence should be addressed.
Sustainability 2020, 12(17), 7206; https://0-doi-org.brum.beds.ac.uk/10.3390/su12177206
Submission received: 12 August 2020 / Revised: 27 August 2020 / Accepted: 31 August 2020 / Published: 3 September 2020
(This article belongs to the Section Sustainable Transportation)

Abstract

:
The COVID–19 pandemic led to restrictions on activities and mobility in many parts of the world. After the main peak of the crisis, restrictions were gradually removed, returning to a new normal situation. This process has impacted urban mobility. The limited information on the new normal situation shows changes that can be permanent or reversible. The impact on the diverse urban transport modes varies. This study analyzes the changes in transit ridership by line, the use of stops, the main origin–destination flows, changes in transit supply, operation time, and reliability of the city bus network of A Coruña. It is based on data from automatic vehicle location, bus stop boarding, and smart card use. Data from the first half of 2020 were compared to similar data in 2017–2019, defining suitable baselines for each analysis to avoid seasonal and day of week effects. The impact on transit ridership during the lockdown process was more significant than that on general traffic. In the new normal situation, the general traffic and the shared bike system recovered a higher percentage of their previous use than the bus system. These impacts are not uniform across the bus network.

1. Introduction

1.1. Context and Literature Review

In December 2019, an unknown type of pneumonia was detected in Wuhan City, People’s Republic of China [1]. The new disease was named COVID–19, and the virus that caused it was designated as SARS–CoV–2 [2]. After a fast spread of the virus to 20 other countries, the WHO (World Health Organization) Director–General declared on 30 January 2020 that the COVID–19 outbreak constituted a Public Health Emergency of International Concern [3].
On 21 February, there were 47 confirmed cases in the WHO European Region [4]. On 13 March, Italy, France, and Spain were the European countries where the virus had struck the hardest, with 17,660 confirmed cases and 1268 deaths in Italy, 3640 infections and 79 deaths in France, and 2965 infections and 235 deaths in Spain [5]. The pandemic evolution led to lockdowns within these countries: starting on 10 March in Italy [6], although with partial lockdowns in the North of the country prior to 10 March; on 15 March in Spain [7]; and on 23 March in France [8]. On 17 March, the European Union closed all its external borders for nonessential travel to contain the virus spread [9].
A wide range of papers have already been published on the spread of COVID–19 and mobility; some focus on the effect of travel bans in the spread of the virus [10,11,12,13]. Other papers study the relation between international travel and the spread of the virus [14,15].
Several mobility data sets have been used to study the effects of COVID–19 related lockdowns on mobility patterns. These data sets are based, in general, on aggregated and anonymized data from mobile phones. Google reports about mobility during the pandemic [16] refer to changes in mobility, related to baseline days, representing a normal value for that day of the week, given as median value over the five weeks from 3 January to 6 February 2020. Values are assigned per category: retail and recreation, with a maximum drop of baseline of 96% in Spain and 95% in the Galician region; supermarket and pharmacy, a decrease of 90% in Spain and 94% in Galicia; park, 90% and 86%, respectively; transit stations, 92% for both; workplace, 92% and 88%, respectively; and residential visits, 3% and 4%, respectively. Apple mobility trend reports [17] are based on user requests to location services across the world, using as baseline 13 January 2020. The minimum percentage of mobility during the whole lockdown for Spain by mode was driving, 10.93%; transit, 7.04%; and walking, 5.82%. At the national level, the Spanish National Statistics Institute [18] also shared information about changes in mobility, based on data obtained from 80% of Spanish mobile phones. They compared the latest information with data from 18 to 21 November 2019. Finally, the Spanish Ministry of Transportation, Mobility and Urban Agenda published data about the effect of COVID–19 on mobility, using the period from 14 to 20 February 2020, as seen in [19]. For the province of A Coruña, the maximum decrease in passenger-kilometer was 93.05%, on 10 April 2020.
Nevertheless, there are not many papers related to the effects of lockdown or COVID–19 outbreak on mobility and even less on the most sustainable modes of transport. Pepe et al. [20] analyzed a large-scale dataset on de-identified, geo-located smartphone users to assess the impact on mobility during the Italian lockdown. Beria and Lunkar [21] used data provided by the Facebook Data for Good program to assess information on mobility at a regional and provincial level for Italy. Fraiberger et al. [22] studied changes in mobility in Colombia, Mexico, and Indonesia, uncovering differences in mobility reduction between wealth groups, also using smartphone location data. Bonaccorsi et al. [23] also observed differences in mobility changes depending on each municipality’s fiscal capacity in a study based on mobility data provided by Facebook. Schlosser et al. [24] analyzed mobile phone data to determine mobility changes in Germany, detecting not only a reduction but also structural changes in the mobility network. Pullano et al. [25] measured mobility patterns alterations due to lockdown, on both local and country scales for France, also using mobile phone trajectories.
Although a strict lockdown had not been declared for all of the United States, Klein et al. [26] studied commuting and individual mobility during the COVID–19 outbreak, using mobility data from the Cuebiq Data for Good initiative. Lee et al. [27] also focused on the United States, using mobile device location data, detecting an increasing number of people staying at home after the national emergency declaration on 13 March. Gao et al. [28] detected a decrease in mobility and increased median stay-at-home time using smartphone location-derived aggregated mobility data.
Yabe et al. [29], also using anonymized mobile phone data, analyzed the temporal changes in mobility behavior, social contact rates, and their correlations with the transmissibility of COVID–19 in Tokyo. Galeazzi et al. [30] conducted a comparative study of mobility patterns in France, Italy, and the United Kingdom, based on geolocalized data from Facebook users, detecting a massive reduction in long-range connections, and differences based on the initial mobility structure of each country.
As can be seen in the previous paragraphs, most of the existing papers are mainly based on mobile phone data and mobility changes that have been studied at the national or regional level. Aloi et al. [31] approached it differently, studying the effect of lockdown on urban mobility in Santander (Spain) city, using data collected from traffic counters, public transport ITS (Intelligent Transportation Systems), environmental sensors, and videos from traffic control cameras.
This paper is based on data from transit records about Automatic Vehicle Location, the number of passengers boarding at each stop, and smart card operations. With these data, a detailed analysis in changes of stop demands, origin–destination flows as well as operation speeds, travel times, and reliability can be performed. In this paper, a comparison of the impact of lockdown and, more importantly, the recovery process on the general traffic, bus, and shared bicycle system is presented. There is a risk that the COVID–19 crisis could lead to a loss of use of sustainable modes, which would be a setback for the stimulus given in recent decades.
The case study focuses on the transit services of A Coruña, a mid-sized city located in the province with the same name, in the autonomous region of Galicia, Northwest of Spain. Some singularities raise the interest of the case: Spain was one of the countries with the highest death rate per inhabitant attributed to COVID–19 in the period from March to June 2020, and one of the strictest lockdowns in the world was imposed in this country. Galicia was a relatively mildly affected area and the first region in Spain to complete the reopening process and move to the so-called new normal.

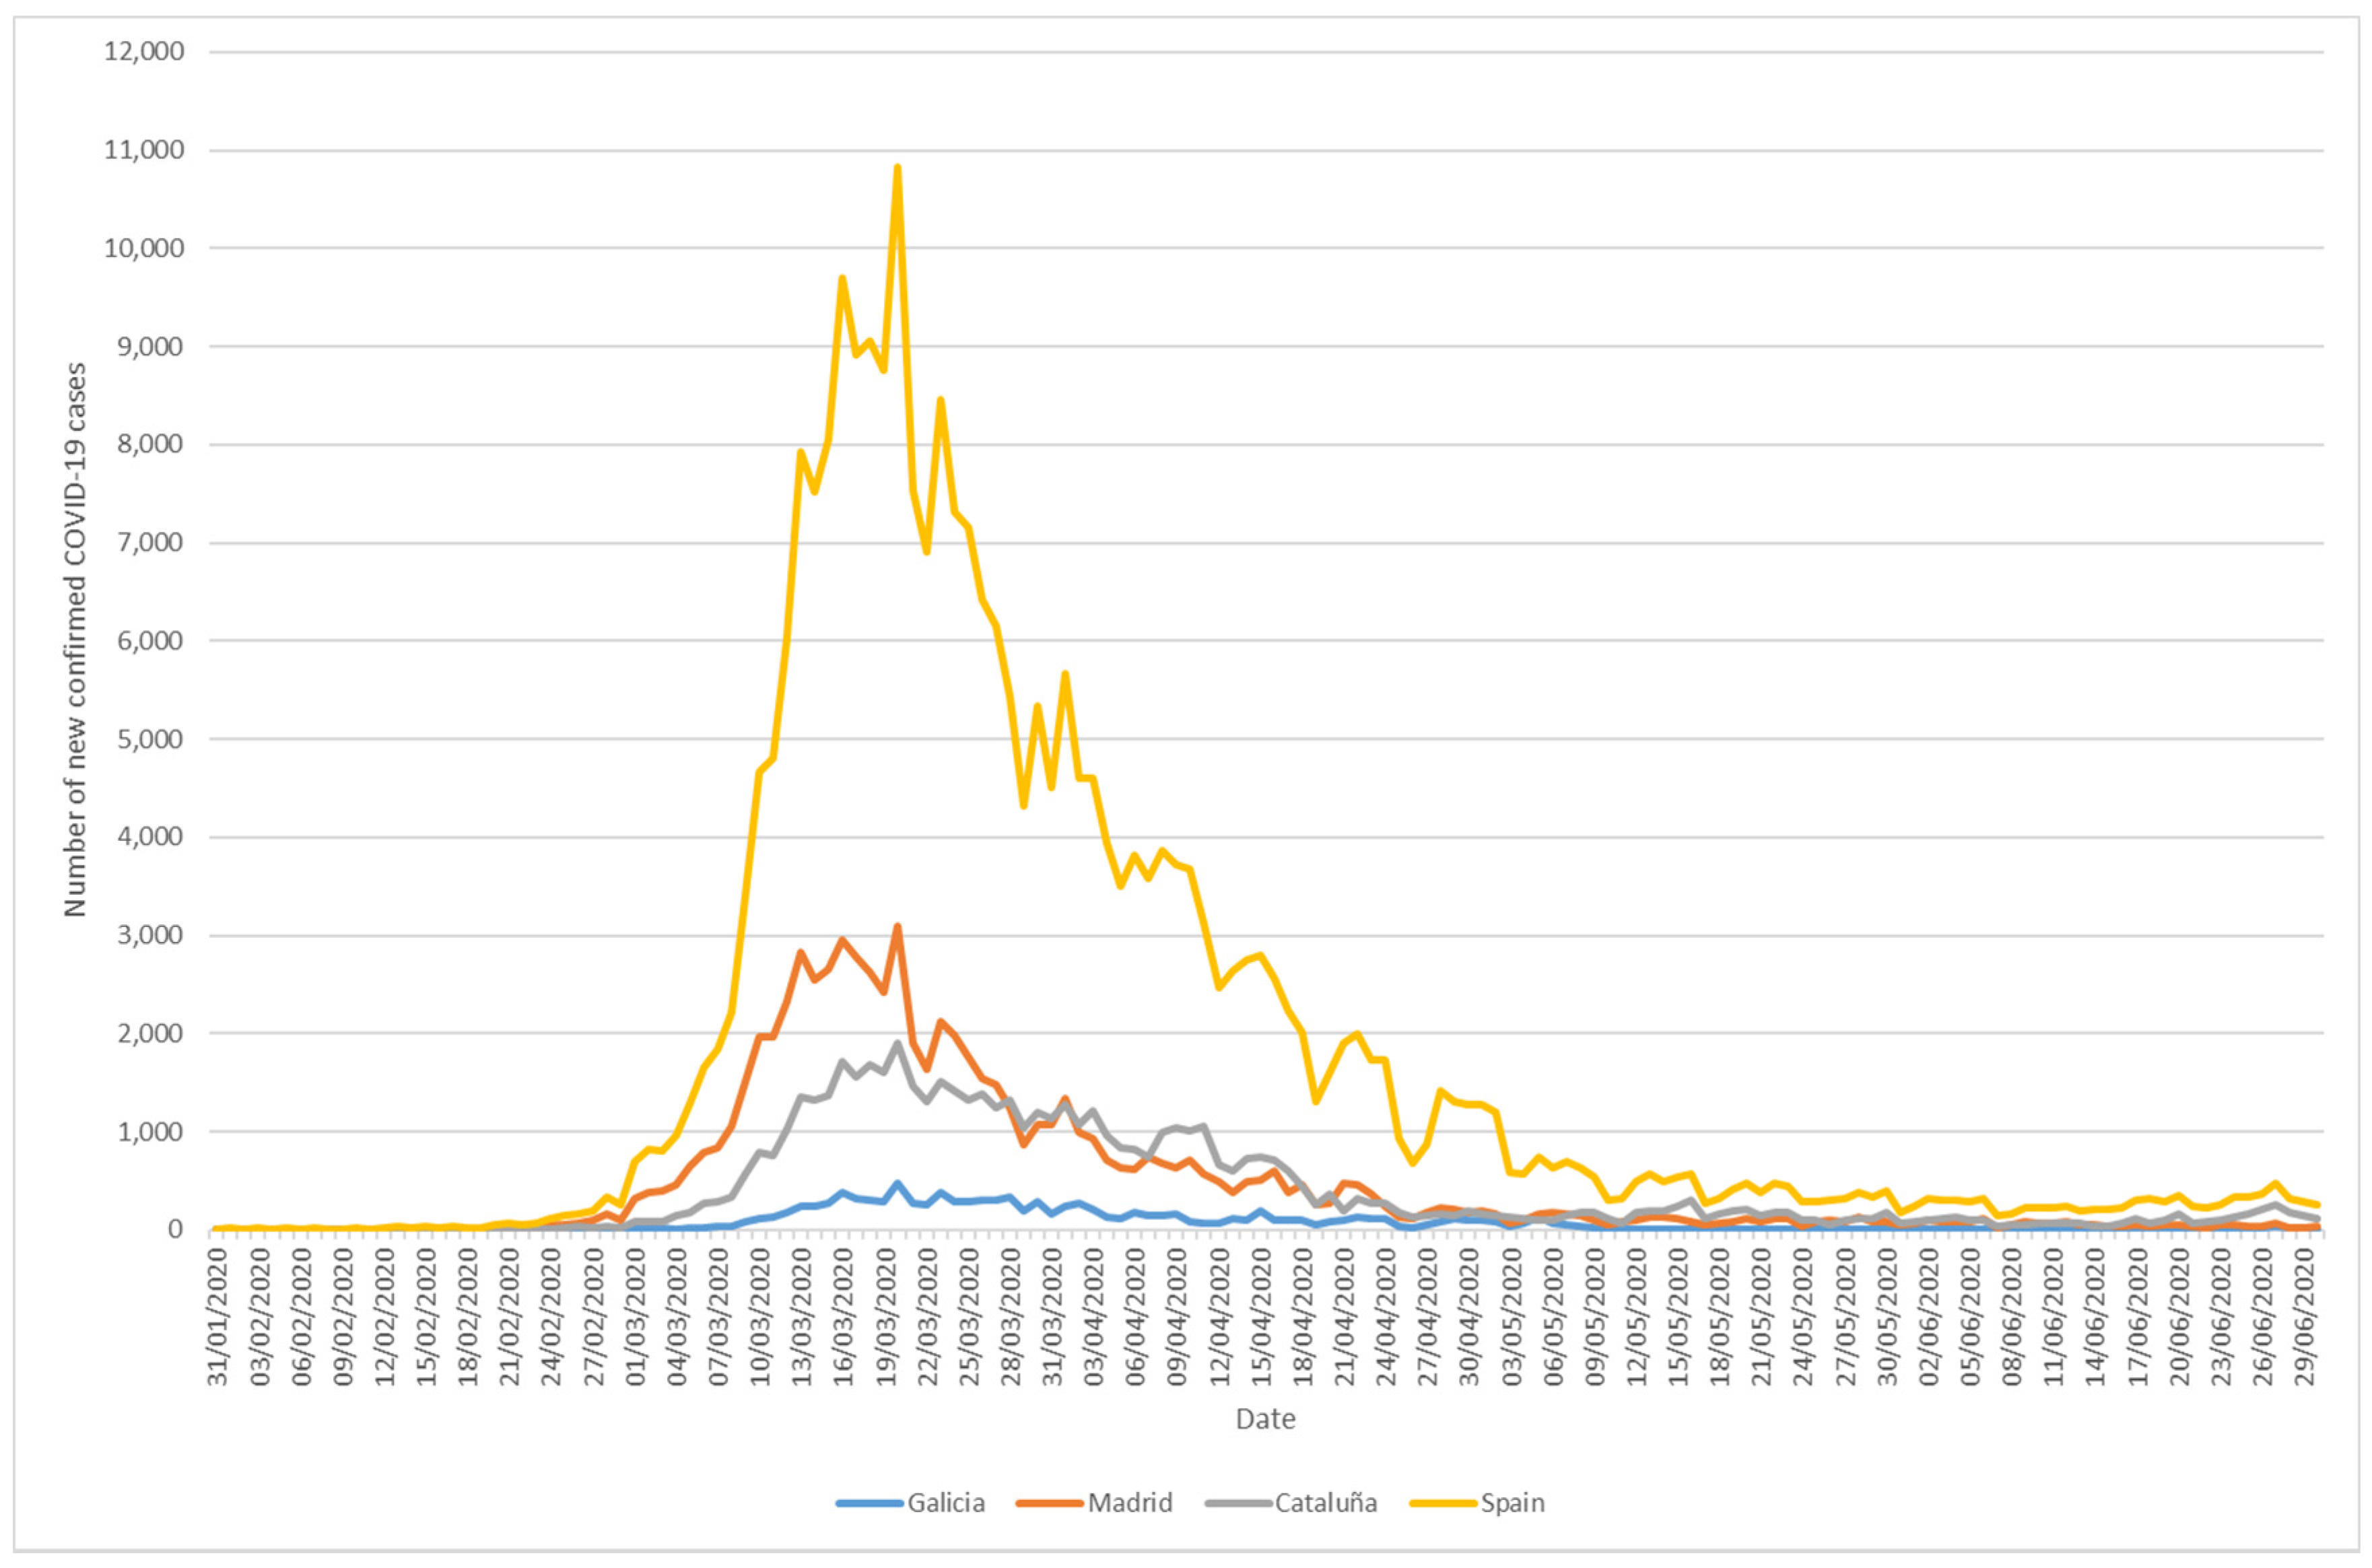
1.2. The Process of Lockdown and Reopening in Spain and Galicia

On 31 January 2020, there were eight confirmed cases of COVID–19 in Spain, increasing to 1841 on 29 February. During the first days of March, there was a dramatic peak, reaching 38,956 active cases on 13 March. The distribution among autonomous regions was not even, with Madrid Community ahead (16,329 cases, 42%), followed by Catalonia (6235, 16%). Galicia had 963 confirmed cases (2.5%) at the time. Figure 1 shows the spike of newly confirmed COVID–19 cases in Spain and in these 3 of the 17 existing autonomous regions. Among Galician provinces, A Coruña was hit with the most cases (42.0%), followed by Pontevedra (28.6%), Ourense (18.5%), and Lugo (10.9%).
This critical situation forced the Spanish Government to establish a quarantine or lockdown to reduce the spread of the virus and flatten the curve in an effort to avoid the collapse of the healthcare system. The timeline of the lockdown and reopening was as follows:
13 March: The President announced the declaration of “State of Alarm”, which allowed the government to limit some rights, including mobility. Initially, the country was in lockdown for 15 days starting 14 March [7], but it was extended several times [33,34,35,36,37,38], finally lasting until 20 June 2020.
15 March: Following the State of Alarm declaration, strict mobility restrictions were imposed with the exception of attendance to work, buying groceries and essential goods, and a few other activities [7]. Remote working was advised where possible [39]. Nonessential shops, including bars, restaurants, nightclubs, cinema theatres, museums, libraries, hair and beauty salons (since 18 March), and churches were closed [7]. The passenger transport supply for state competence services was reduced to at least 50% of the usual [7].
28 March: An even severer lockdown was imposed, which was enforced from 30 March to 9 April, partially coinciding with Easter Week. Only essential workers could travel to work. A recoverable paid leave was mandatory for nonessential workers who could not work remotely [40]. Since 9 April, the situation returned to something similar to the period from 15 to 28 March.
28 April: The plan for returning to the “new normal” was announced by the Government, implementing 4 phases where restrictions were lifted gradually. In general, each phase (0 to 3) would last two weeks, although it could be adjusted by the Regional Government (with the approval of the Spanish Government) if the evolution of COVID–19 cases was favorable.
For each consecutive phase, new activities were allowed. For example, in phase 0, some establishments started to open again, such as hair and beauty salons, take away restaurants, dentists, optical shops, or physiotherapy centers. Professional services and retail trade centers with areas less than 400 square meters reopened to the public with limited capacity, except businesses in malls and shopping centers without independent access [41]. Individual outdoor sports were allowed, as well as walks in a radius of 1 km around the place of residence, for a maximum period of an hour [42]. In phase 1, only bars’ terraces could open with a limited 50% capacity, while churches started to officiate mass with 30% of venue capacity, and outdoor sports were allowed at specific hours, depending on the person’s age; retail trade centers could open an area less than 400 square meters, except locals in malls and shopping centers without independent access [43]. In phases 2 and 3, restaurants could open their indoor areas with a minimum distance of 2 m between tables. All retail trade centers and malls could open with limited capacity [44,45]. Face masks were mandatory during the whole period, both indoors and outdoors, whenever a minimum distance of 2 m could not be guaranteed [46].
Concerning mobility, only journeys inside provinces’ territory were allowed [43,44]. The wearing of face masks was mandatory when using public transportation. From phase 1 onwards, city bus transport systems had a limited capacity: every other seat could be occupied, and a maximum of 2 passengers per square meter was allowed for standing passengers. This capacity was increased to every seat, keeping the same reference value for standing passengers on 6 June [47].
Galicia entered phase 0 on 4 May, phase 1 on 11 May, passed to phase 2 on 25 May, and to phase 3 on 8 June. Finally, on 15 June, it was the first Spanish autonomous region to reach the “new normal”. The new normal is characterized by the lifting of restrictions on mobility and the number of people meeting at home. The use of face masks is still mandatory when a minimum distance of 1.5 m in public spaces cannot be guaranteed for people who do not live in the same household [48]. Nevertheless, remote work is still recommended where feasible, and in-person classes are not resumed at universities and schools, with the exception of final-year High School students, who could attend classes on a voluntary basis from 25 May to 5 June. In terms of transit supply, it should be adapted as demand increases, considering the restrictions that apply, as discussed in the previous paragraph [48].

2. Case Study Description: A Coruña and Its Mobility

According to the Spanish National Statistics Institute [49], the extensive metropolitan area of A Coruña consists of 11 municipalities with an area of 749.91 km2, a population of 415,144 (year 2017), an average age of 45.6 years, and 168,242 households with an average of 2.45 inhabitants per household. The unemployment rate was 12.9% in 2018. Trade and services provide employment for 82.4% of the employees. The municipality of A Coruña, on the other hand, has an area of 37.69 km2, with a population of 245,711 inhabitants in 103,063 households, and an average of 2.36 inhabitants per household (2019). The unemployment rate was 11.9% in 2018, while trade and services provided employment to 89.4% of the employees in 2018.
Main figures in relation to mobility are included in [50] for 2017. In the metropolitan area of A Coruña, an average of 2.5 trips per person per day were made. In the municipality of A Coruña, 46.5% of the mobility was conducted by walking, 18.2% by transit (bus), and 35.4% by private motorized transport. The average travel time for motorized trips within the municipality was 22 min for transit and 15 min for private transport. Regarding travel motives, 29.3% were work trips, 29.1% leisure trips, 4.5% study trips, 4.6% were related to health care, 19.3% were shopping trips, and 13.2% for other motives. The percentage of captive transit riders was 15.5%.
The city bus network of A Coruña consists of 22 regular lines, plus a special service to the university, as well as a night line that operates only on weekends. The number of stops is approximately 460, although active stops change each year. The total ridership of the network was 21,735,460 passengers in 2017, increasing to 21,890,790 in 2018, and reaching 23,003,516 in 2019.
In the city of A Coruña, a set of sustainability-oriented policy measures has been implemented over recent decades. The measures applied have been: parking charges (since 1989), public transportation infrastructure (with bus lanes that have been implemented and removed in different periods), bicycle infrastructure (with a relevant extension in last years), bicycle-sharing system, real-time passenger information for bus transit, etc. Several technical documents related to sustainable mobility have been redacted through the last ten years, although the lack of political continuity has not allowed a consistent implementation of a complete set of measures. In consequence, no dramatic changes in mobility and emissions have been accomplished so far. Some new measures are in study or implementation in 2020, such as speed limit reduction (implementation of 30 km/h general limit in the city, except for the main arterial roads and avenues) and new bus lanes.
The impact of these measures on traffic-related air pollution (TRAP) in A Coruña has not been thoroughly studied (see [51] for a suggested protocol). There are two complete stations for air quality measures dependent on the local council, one of them theoretically oriented to TRAP, although it is located in one of the main parks of the city (Santa Margarita). The main urban station dependent on the state government has been closed during recent months due to civil works. It is well established that transport policy measures can be related to carbon emissions and other pollutant emissions such as nitrogen oxides (NOx), carbon monoxide (CO), and particulate matter (PMx), among others (for example see [52] for a general review of indicators, and [53] for road pricing schemes influence on CO2).

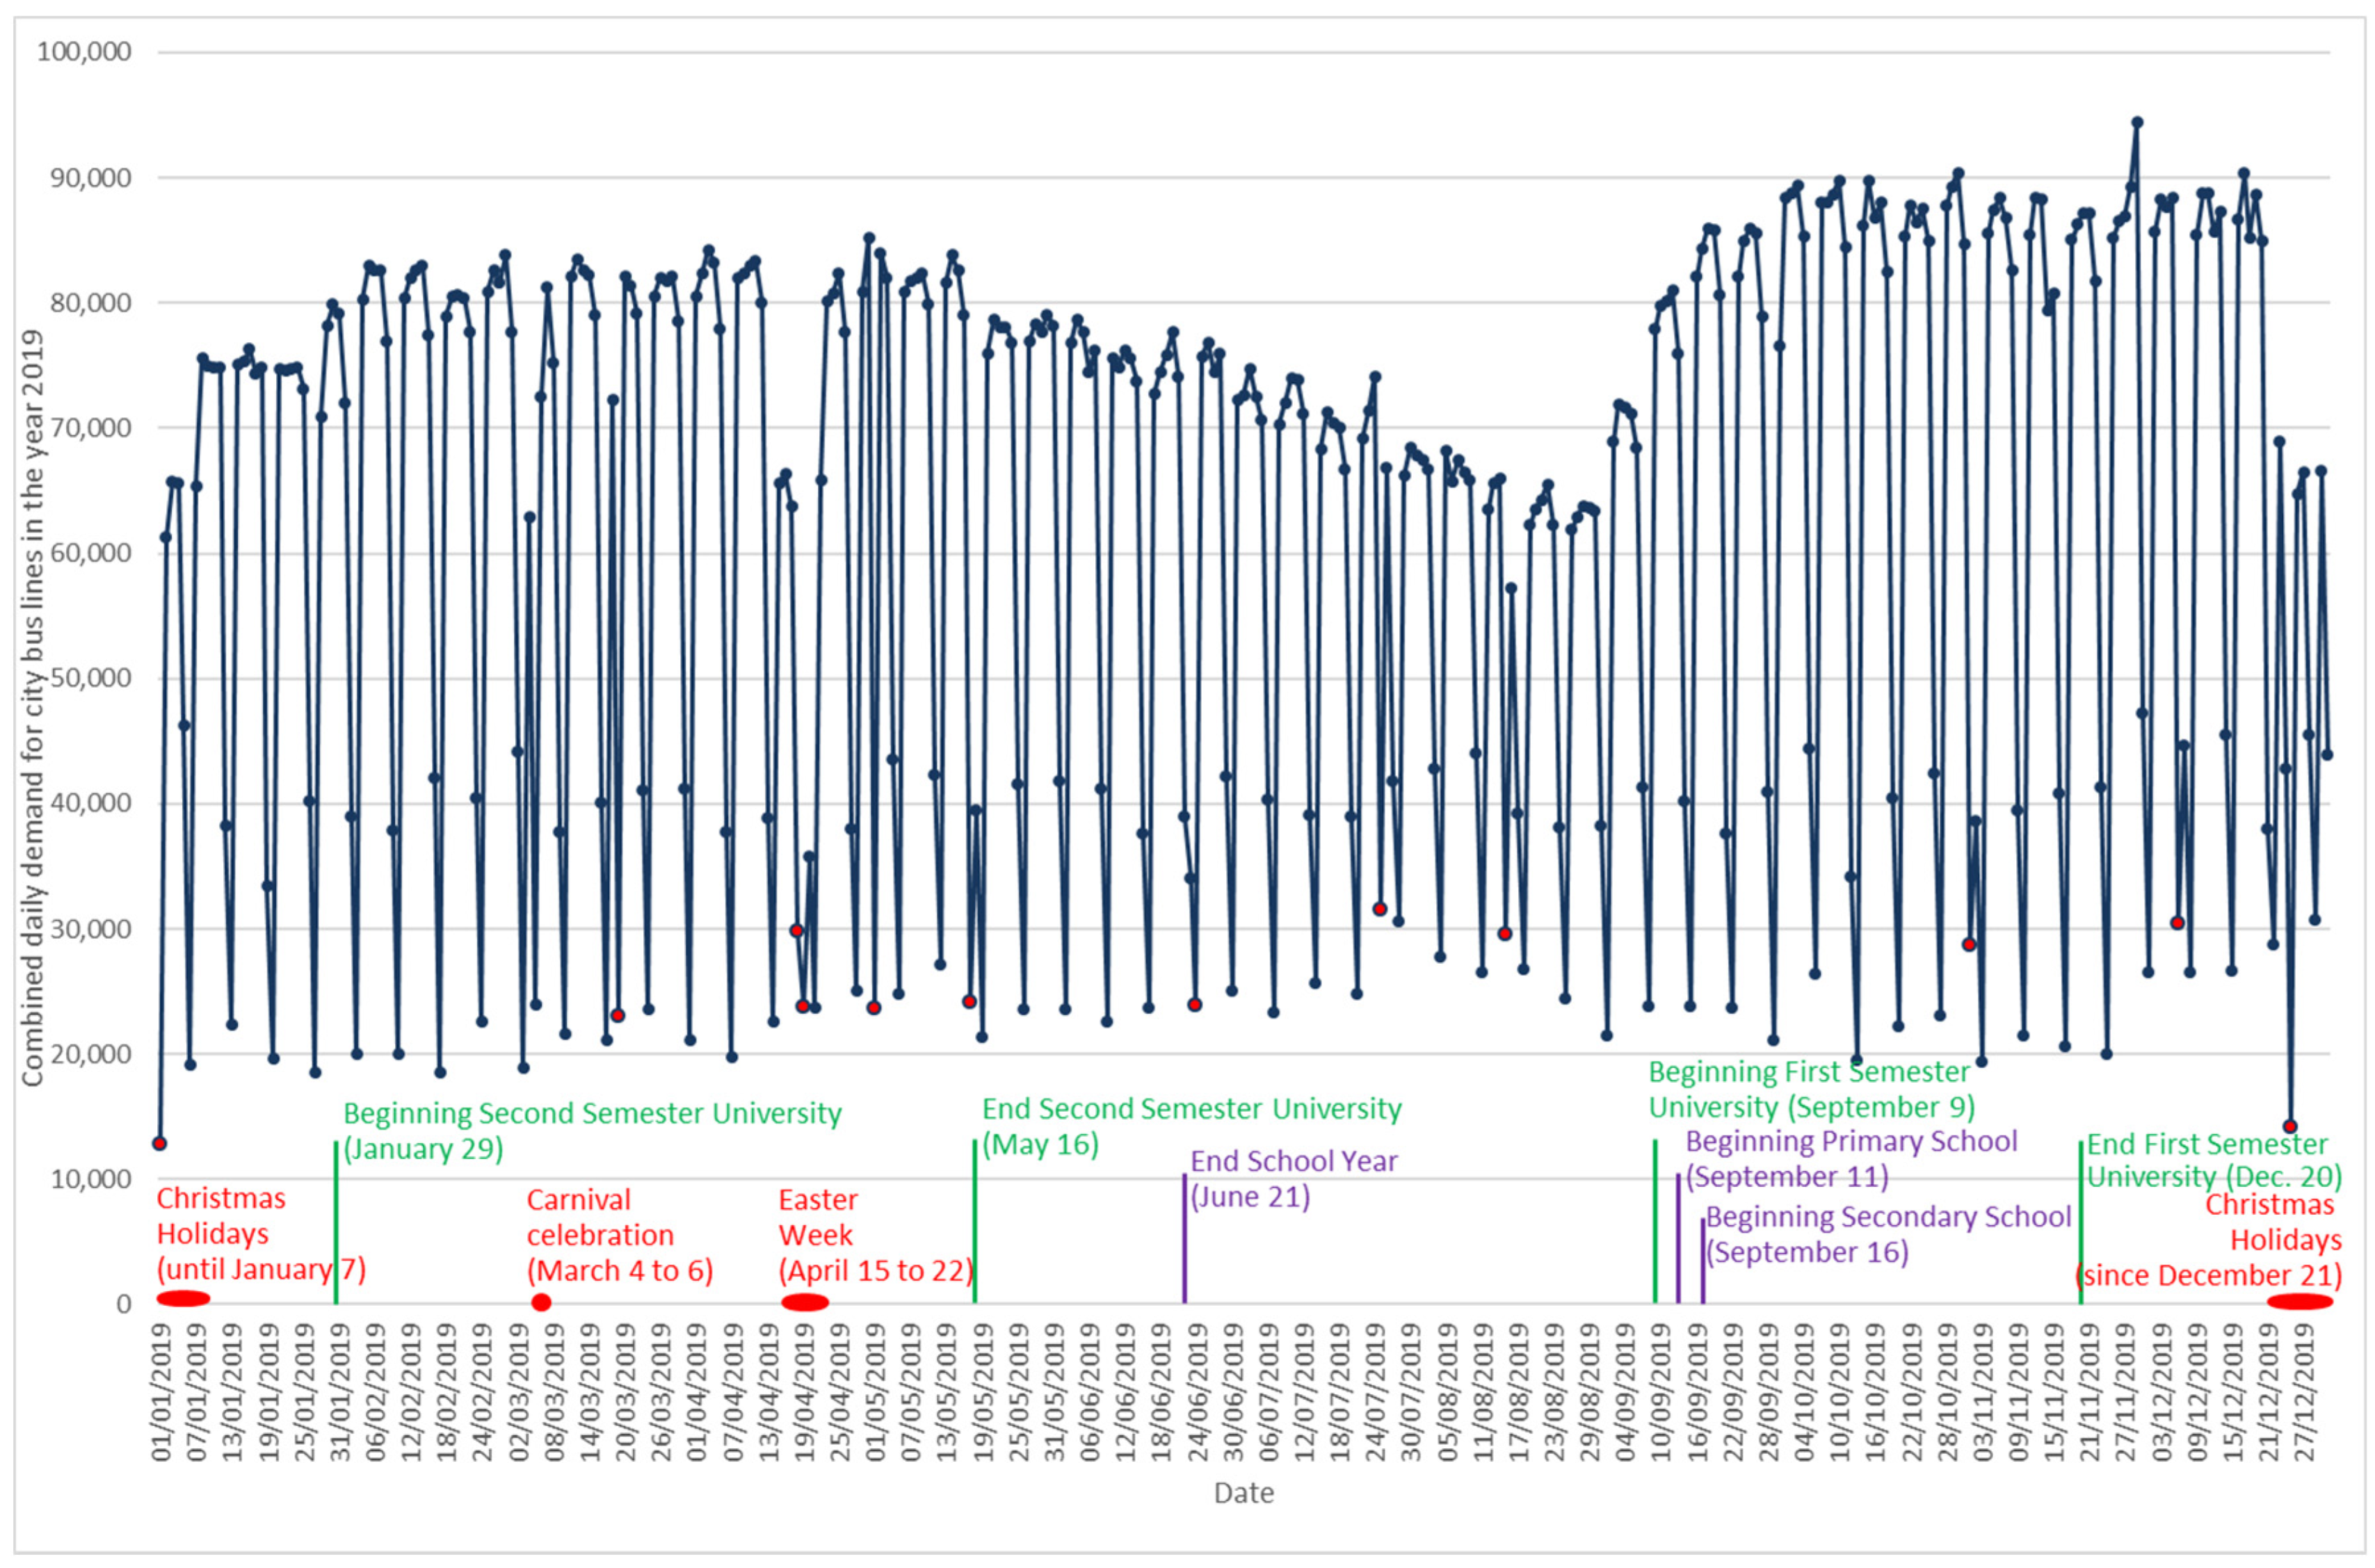
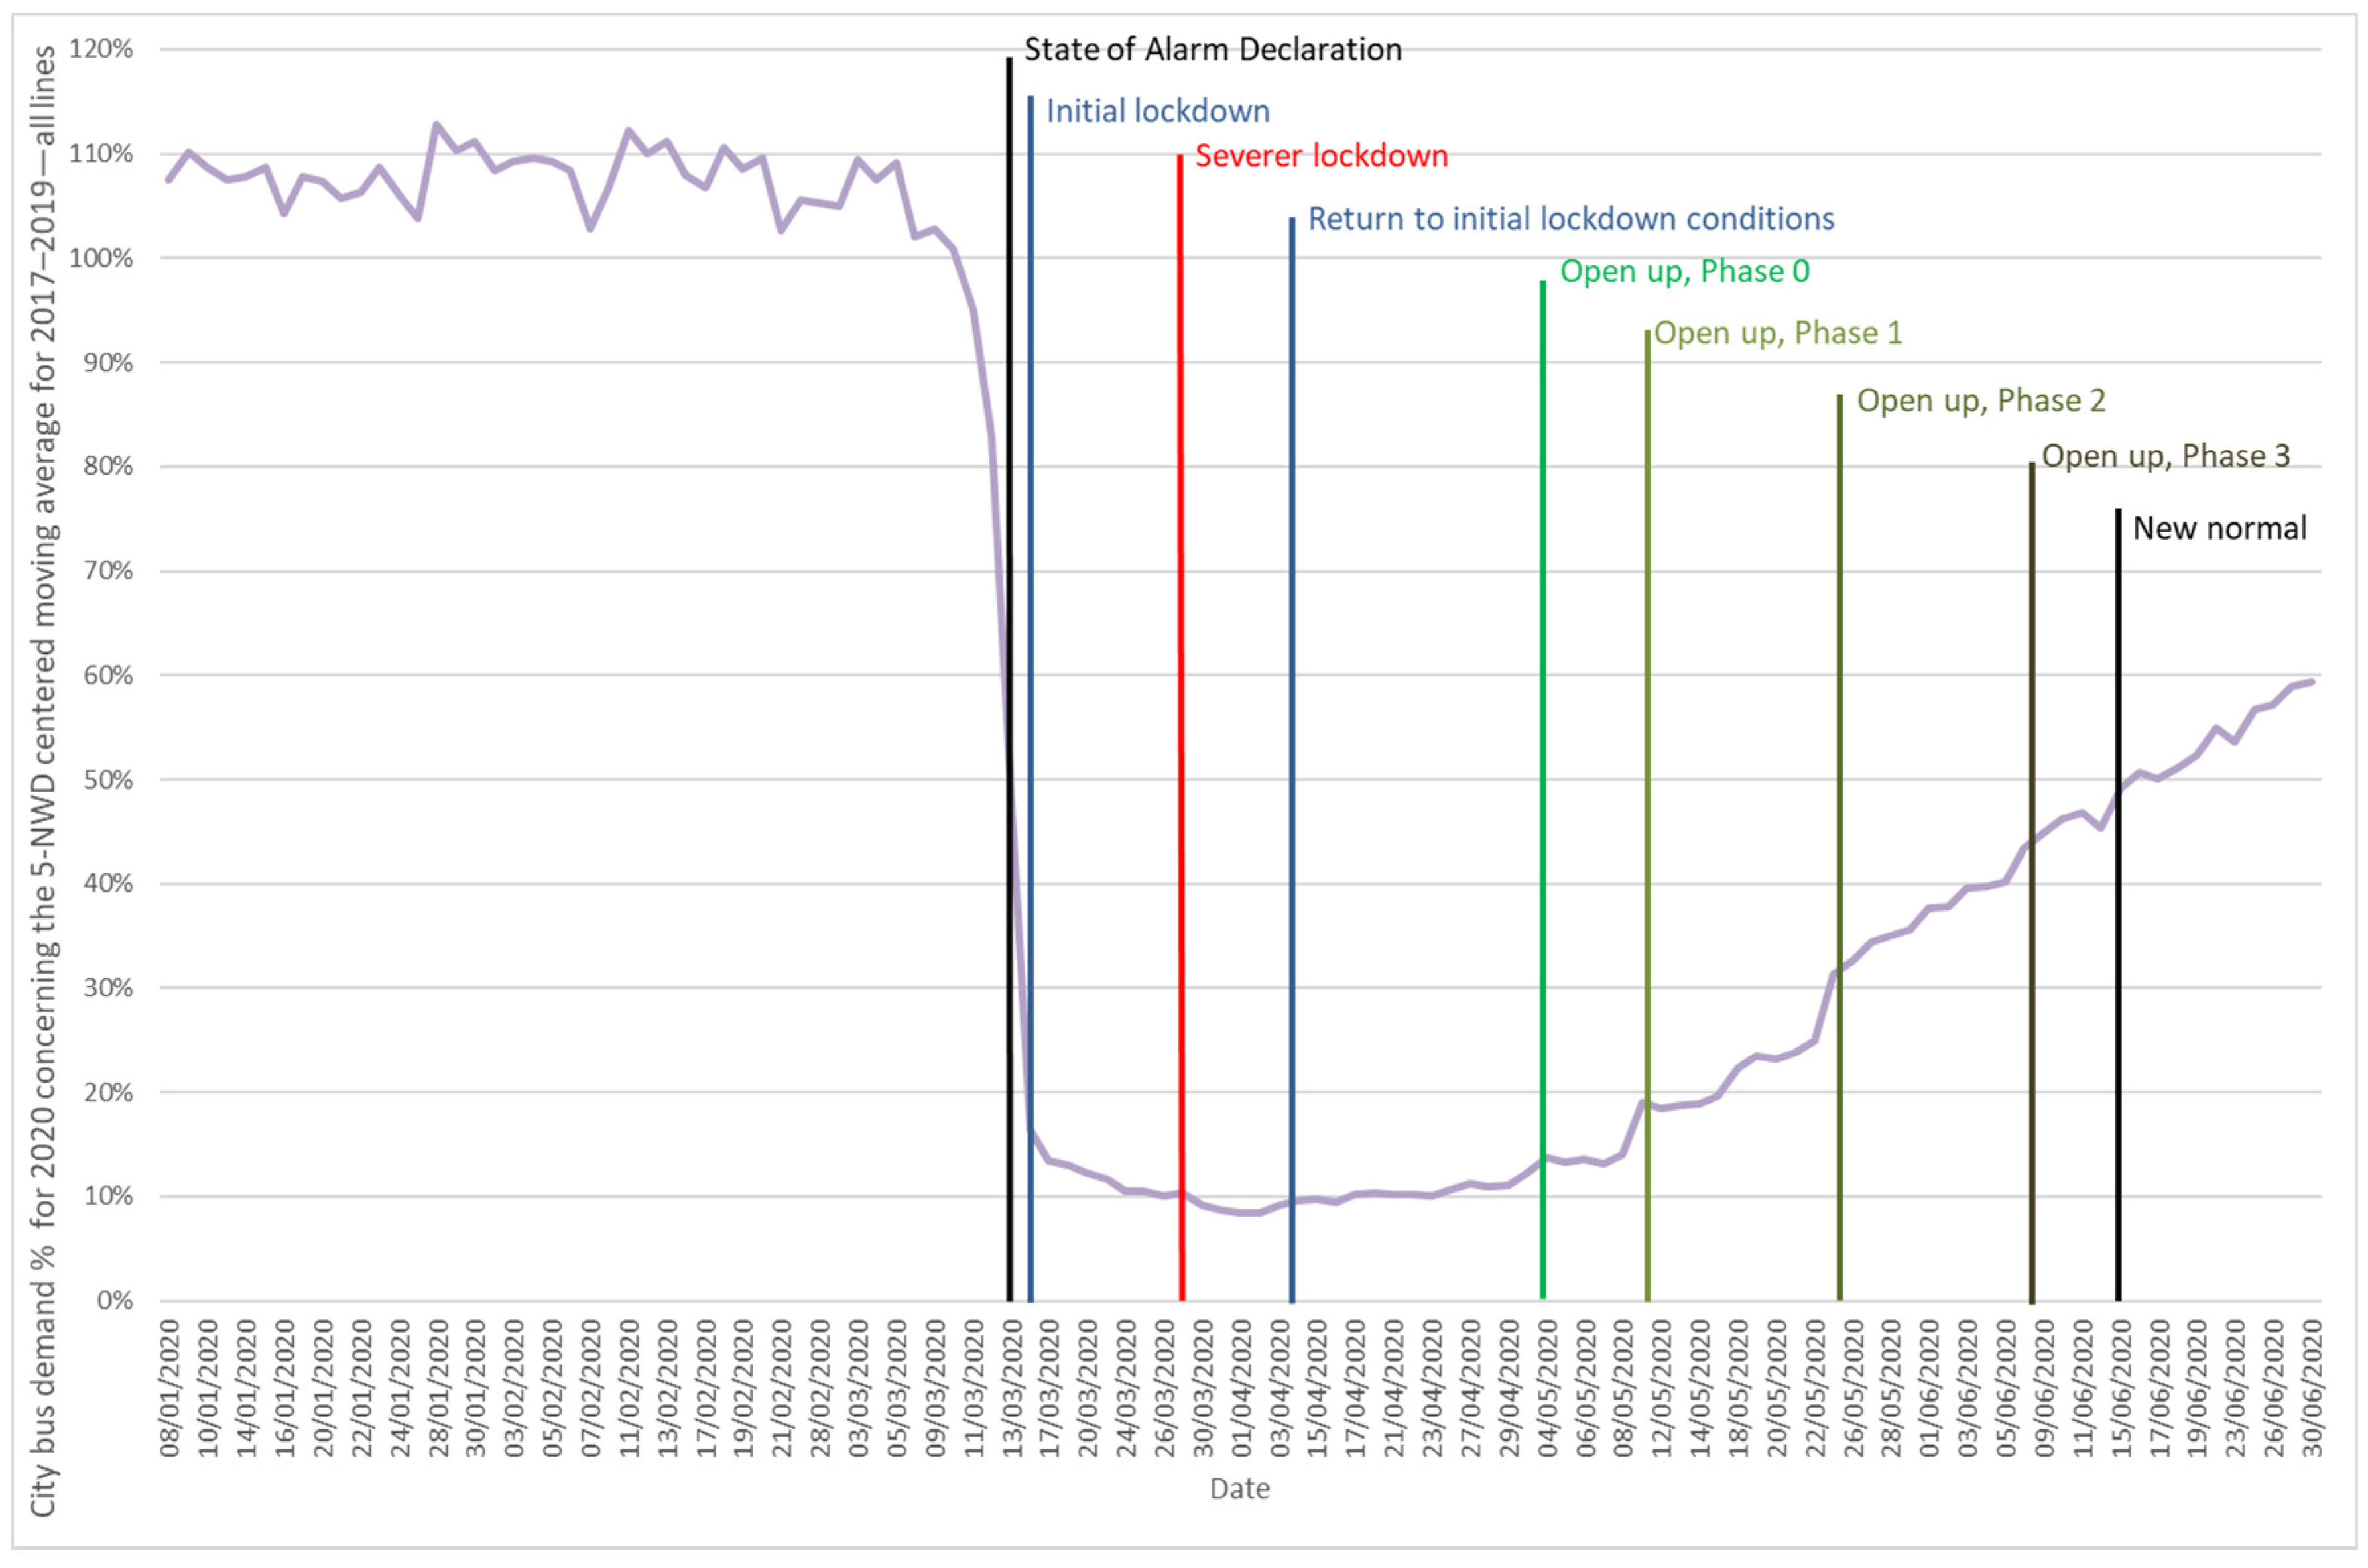
2.1. City Bus Network Demand
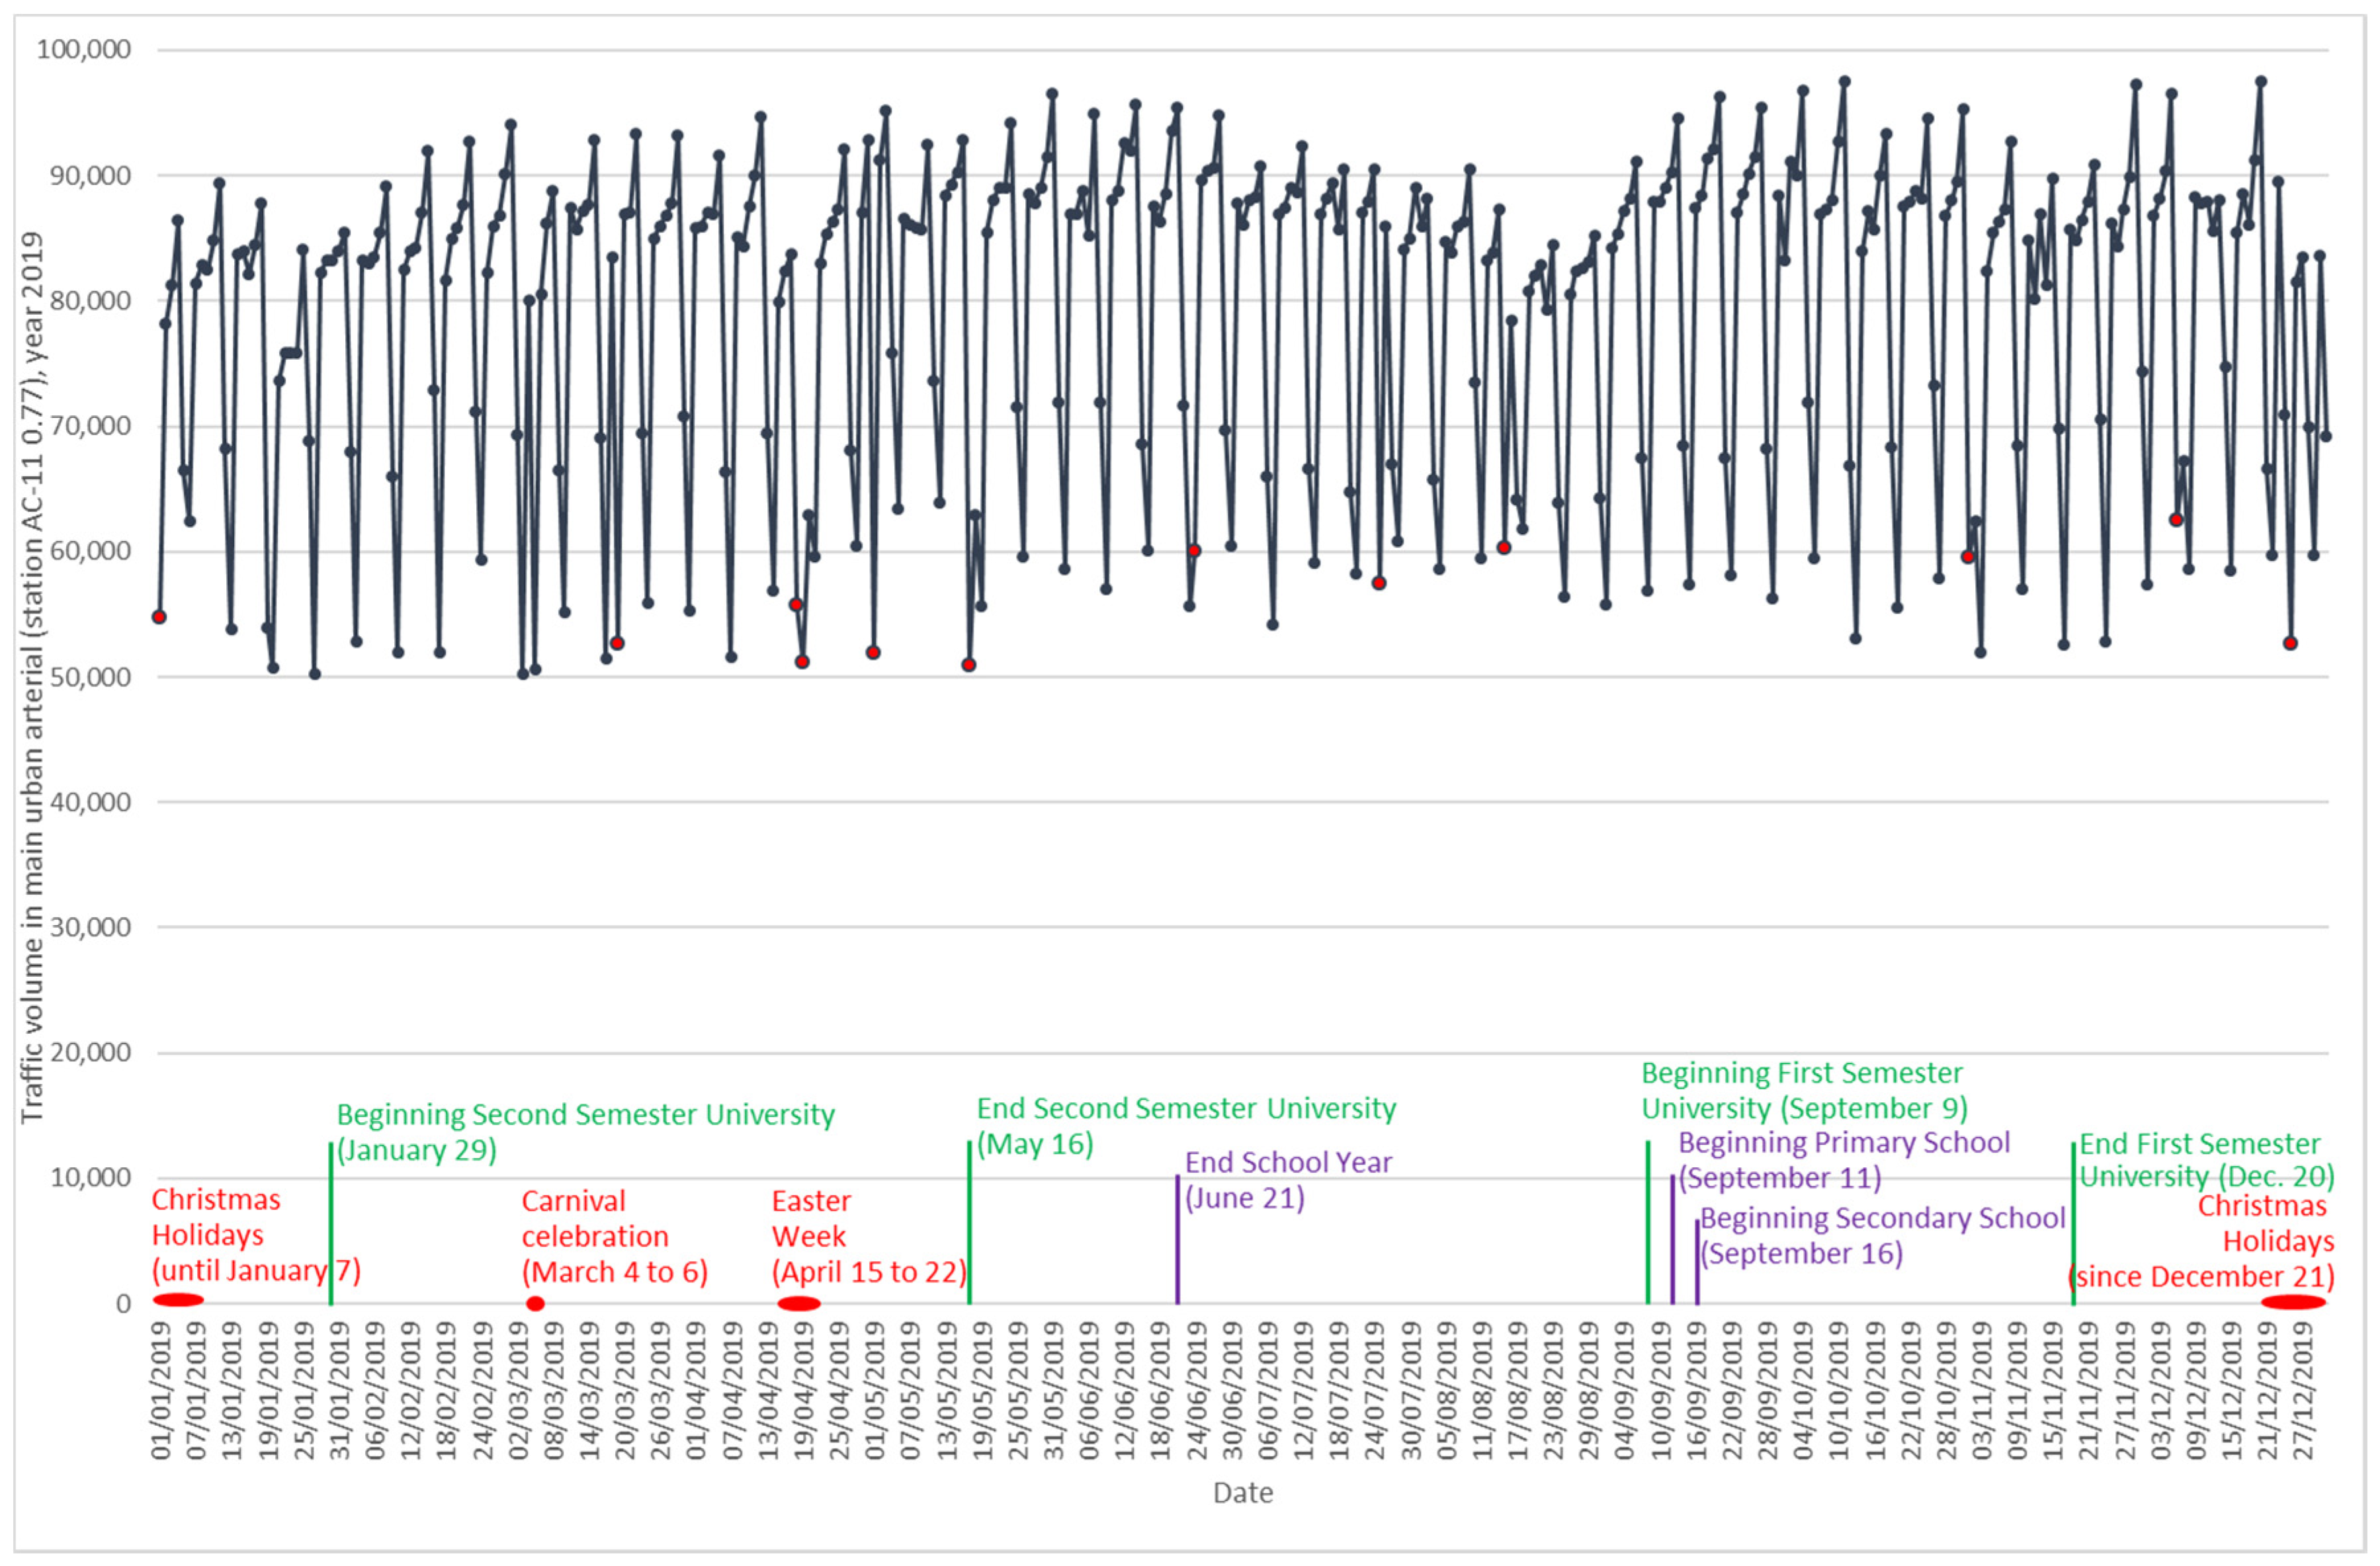
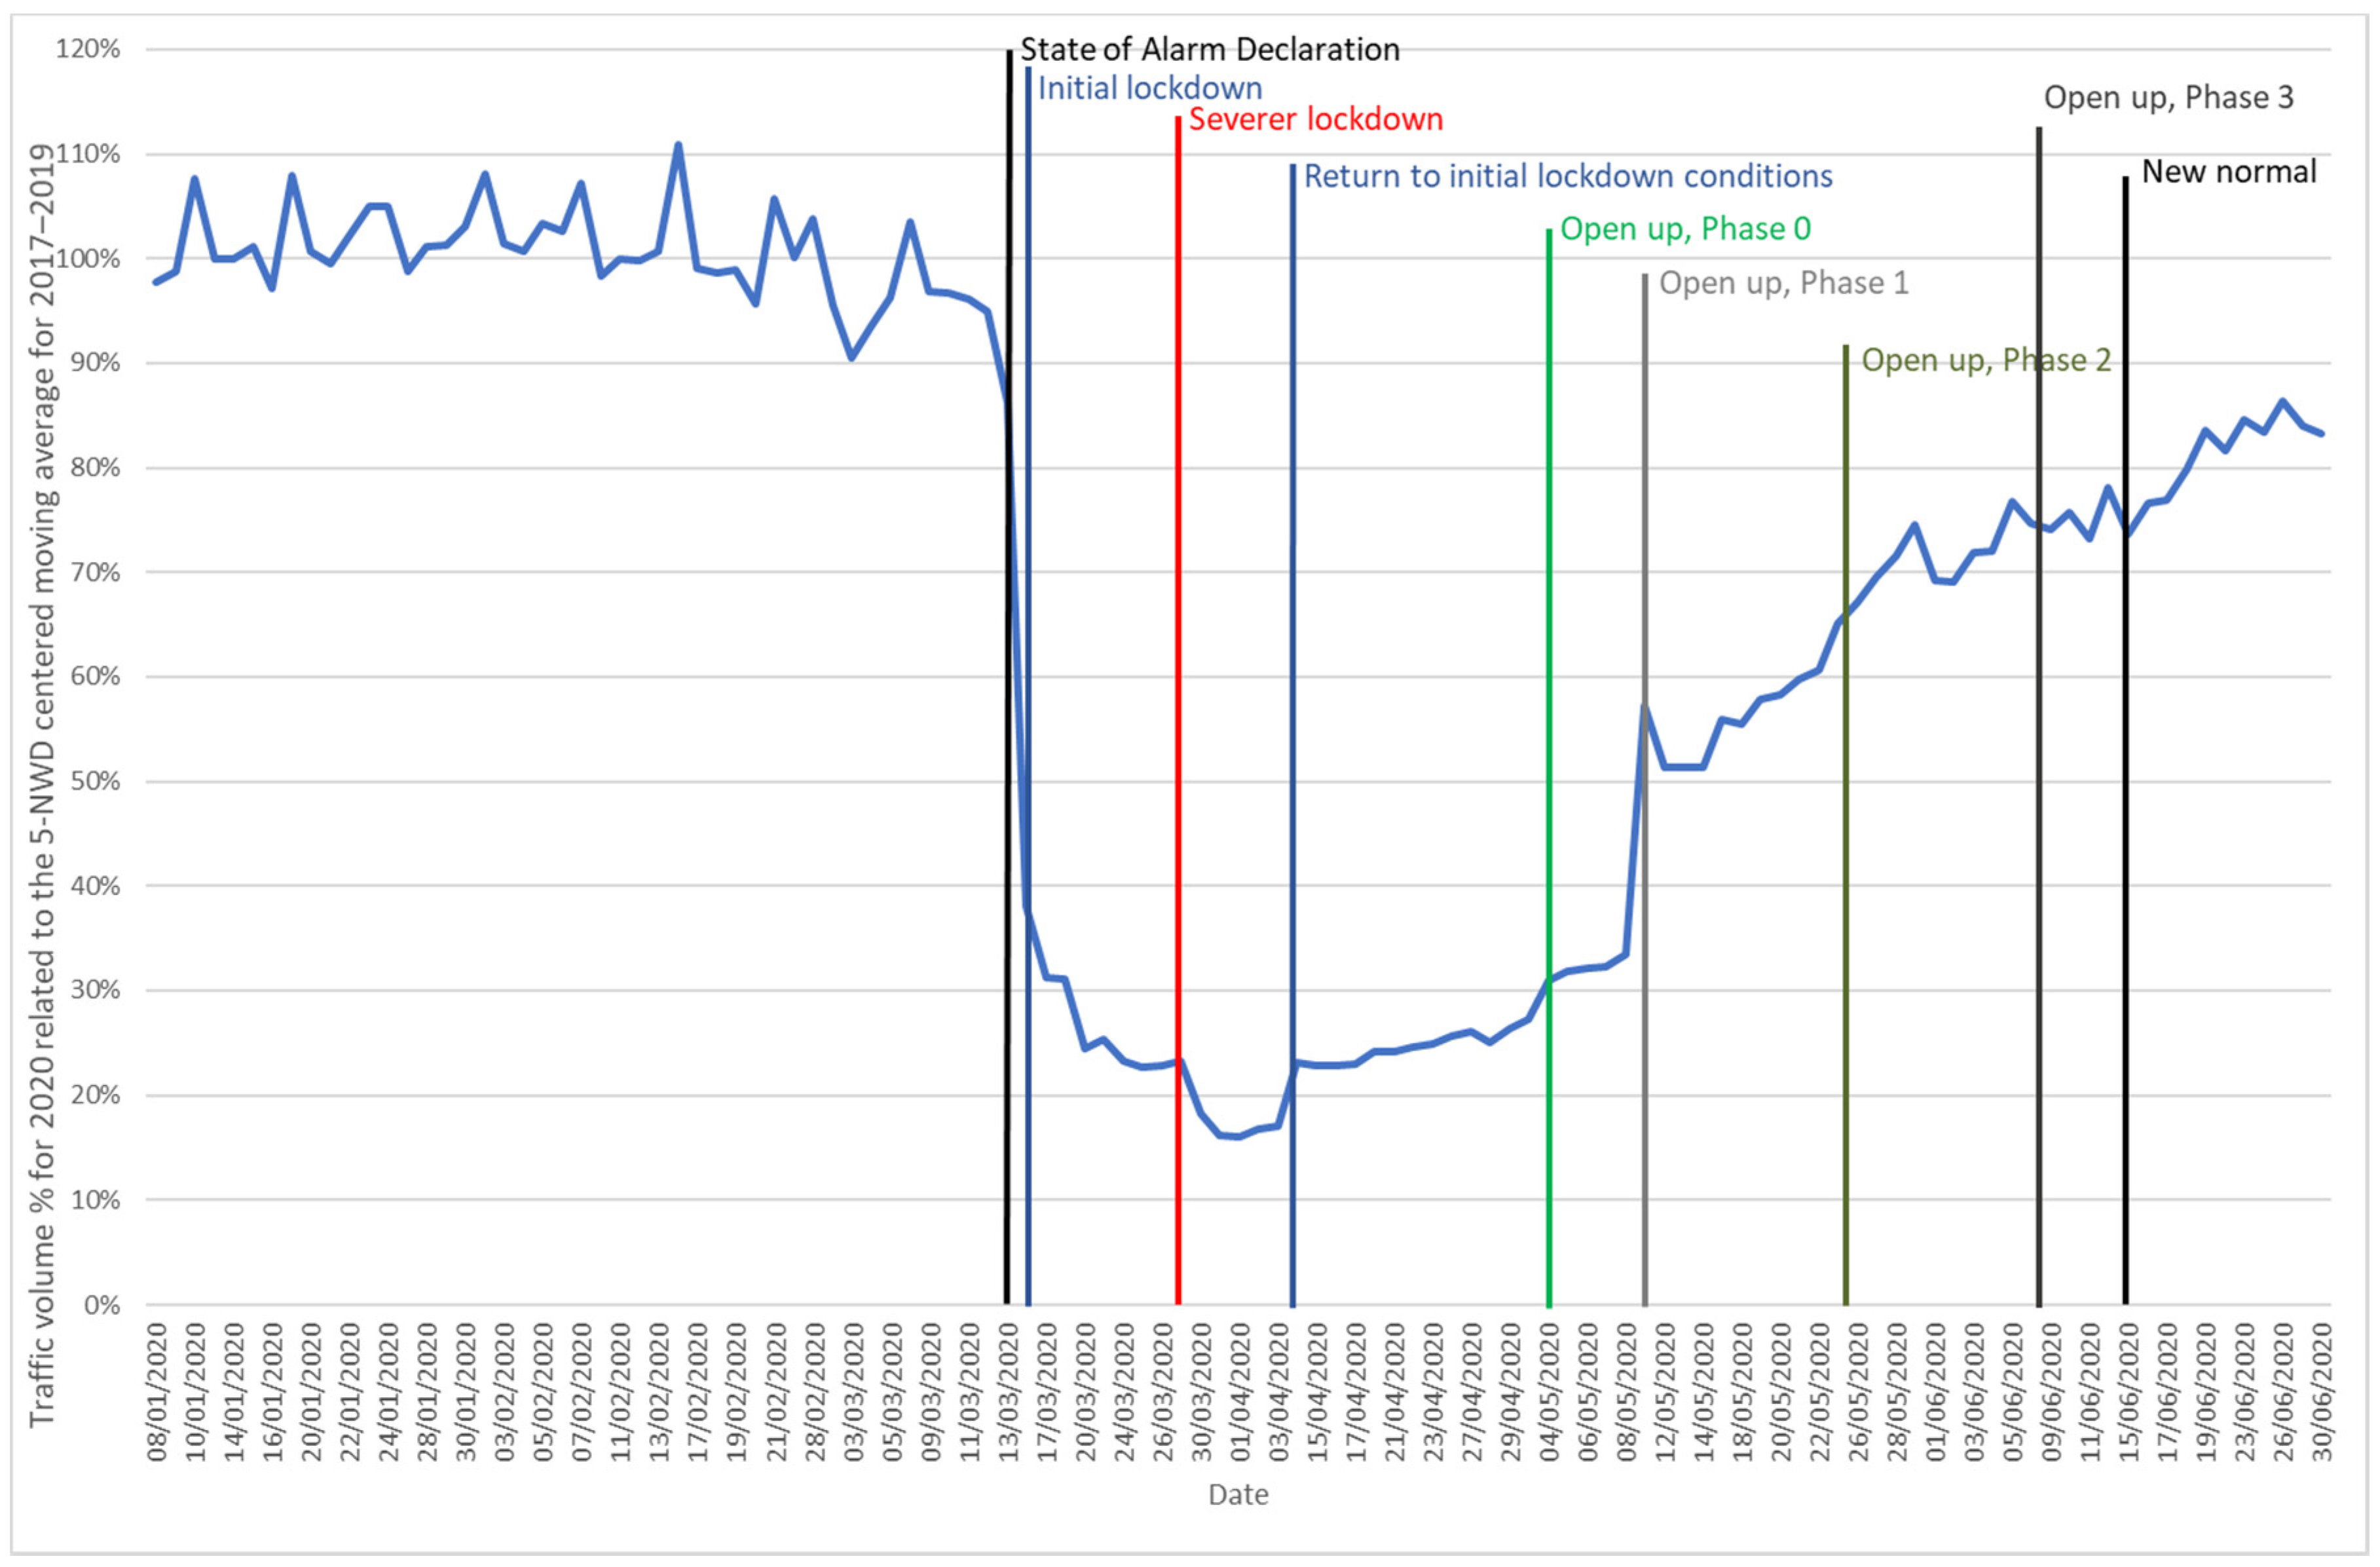
Figure 2 shows the evolution of city bus lines’ total ridership during the year 2019. This figure shows the usual weekly trend, with Saturdays’ demand dropping to values around 50% of the weekdays’ average, and Sundays and bank holidays (the last ones marked with a red dot) about 30%. The school year beginning and end are identified at the bottom of the graph, as well as each university semester period and holiday seasons along the school year (Christmas, Carnival, and Easter). An important ridership decrease was observed during holiday seasons and during the summer. In summer, this decline started around mid-May (end of the second semester at the university) and continued steadily until reaching the minimum values in August, without a noticeable effect of the end of school year. This behavior is usual in Spanish transit systems, as August is the preferred holiday month for most workers. The summer and holidays ridership decrease is coherent with the trip purposes stated in the user survey of the city bus system: 41.7% were work trips and 25.1% study trips [54].

2.2. Traffic Volume

Figure 3 shows the total traffic volume (outwards and inwards) during 2019 in the main arterial road of the city of A Coruña (station located at kilometer 0.77 of road AC–11). The usual weekly trend was also observed in this figure, although with weaker variations than those of the city bus network demand. Traffic volume decreased to around 80% of weekday values for Saturdays and around 65% for Sundays or bank holidays. A decrease in traffic volume was also present in summer, especially in August, although it was not as important as the decrease in bus ridership. The decline in traffic volume at weekends during the summer was less accentuated than that of other seasons, probably due to daily trips to the beaches outside the city and the tourist and leisure traffic.

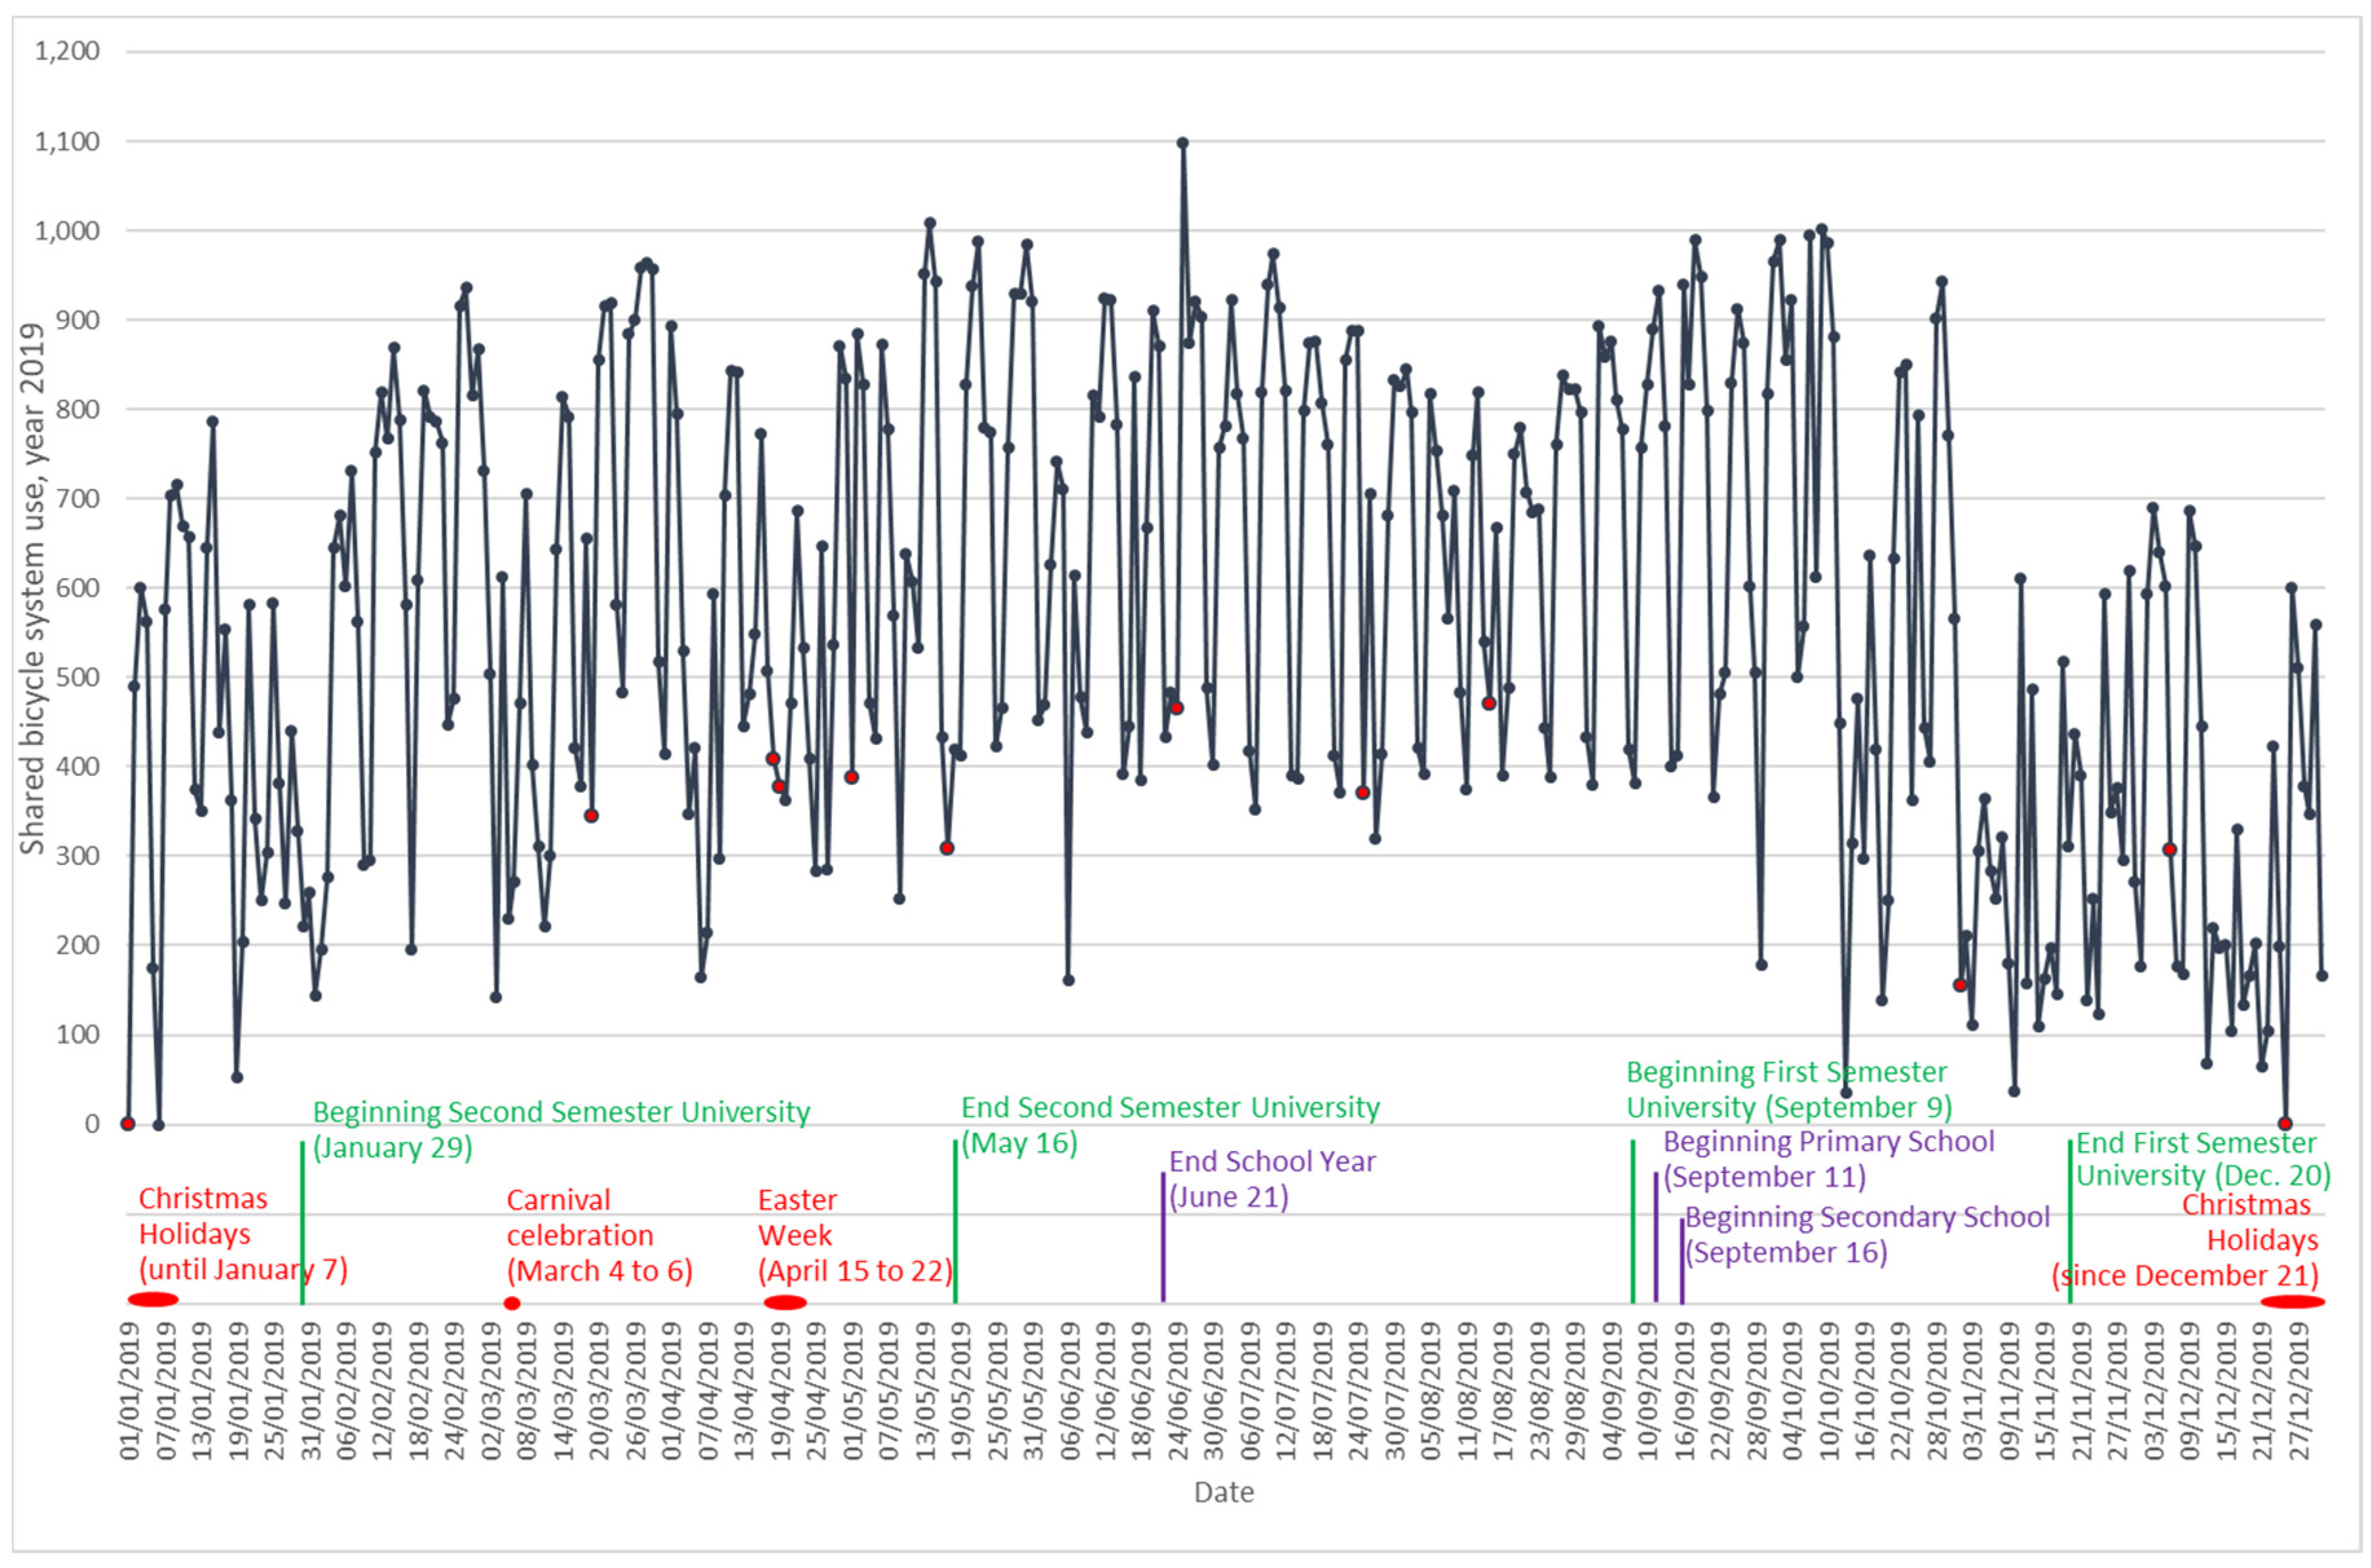
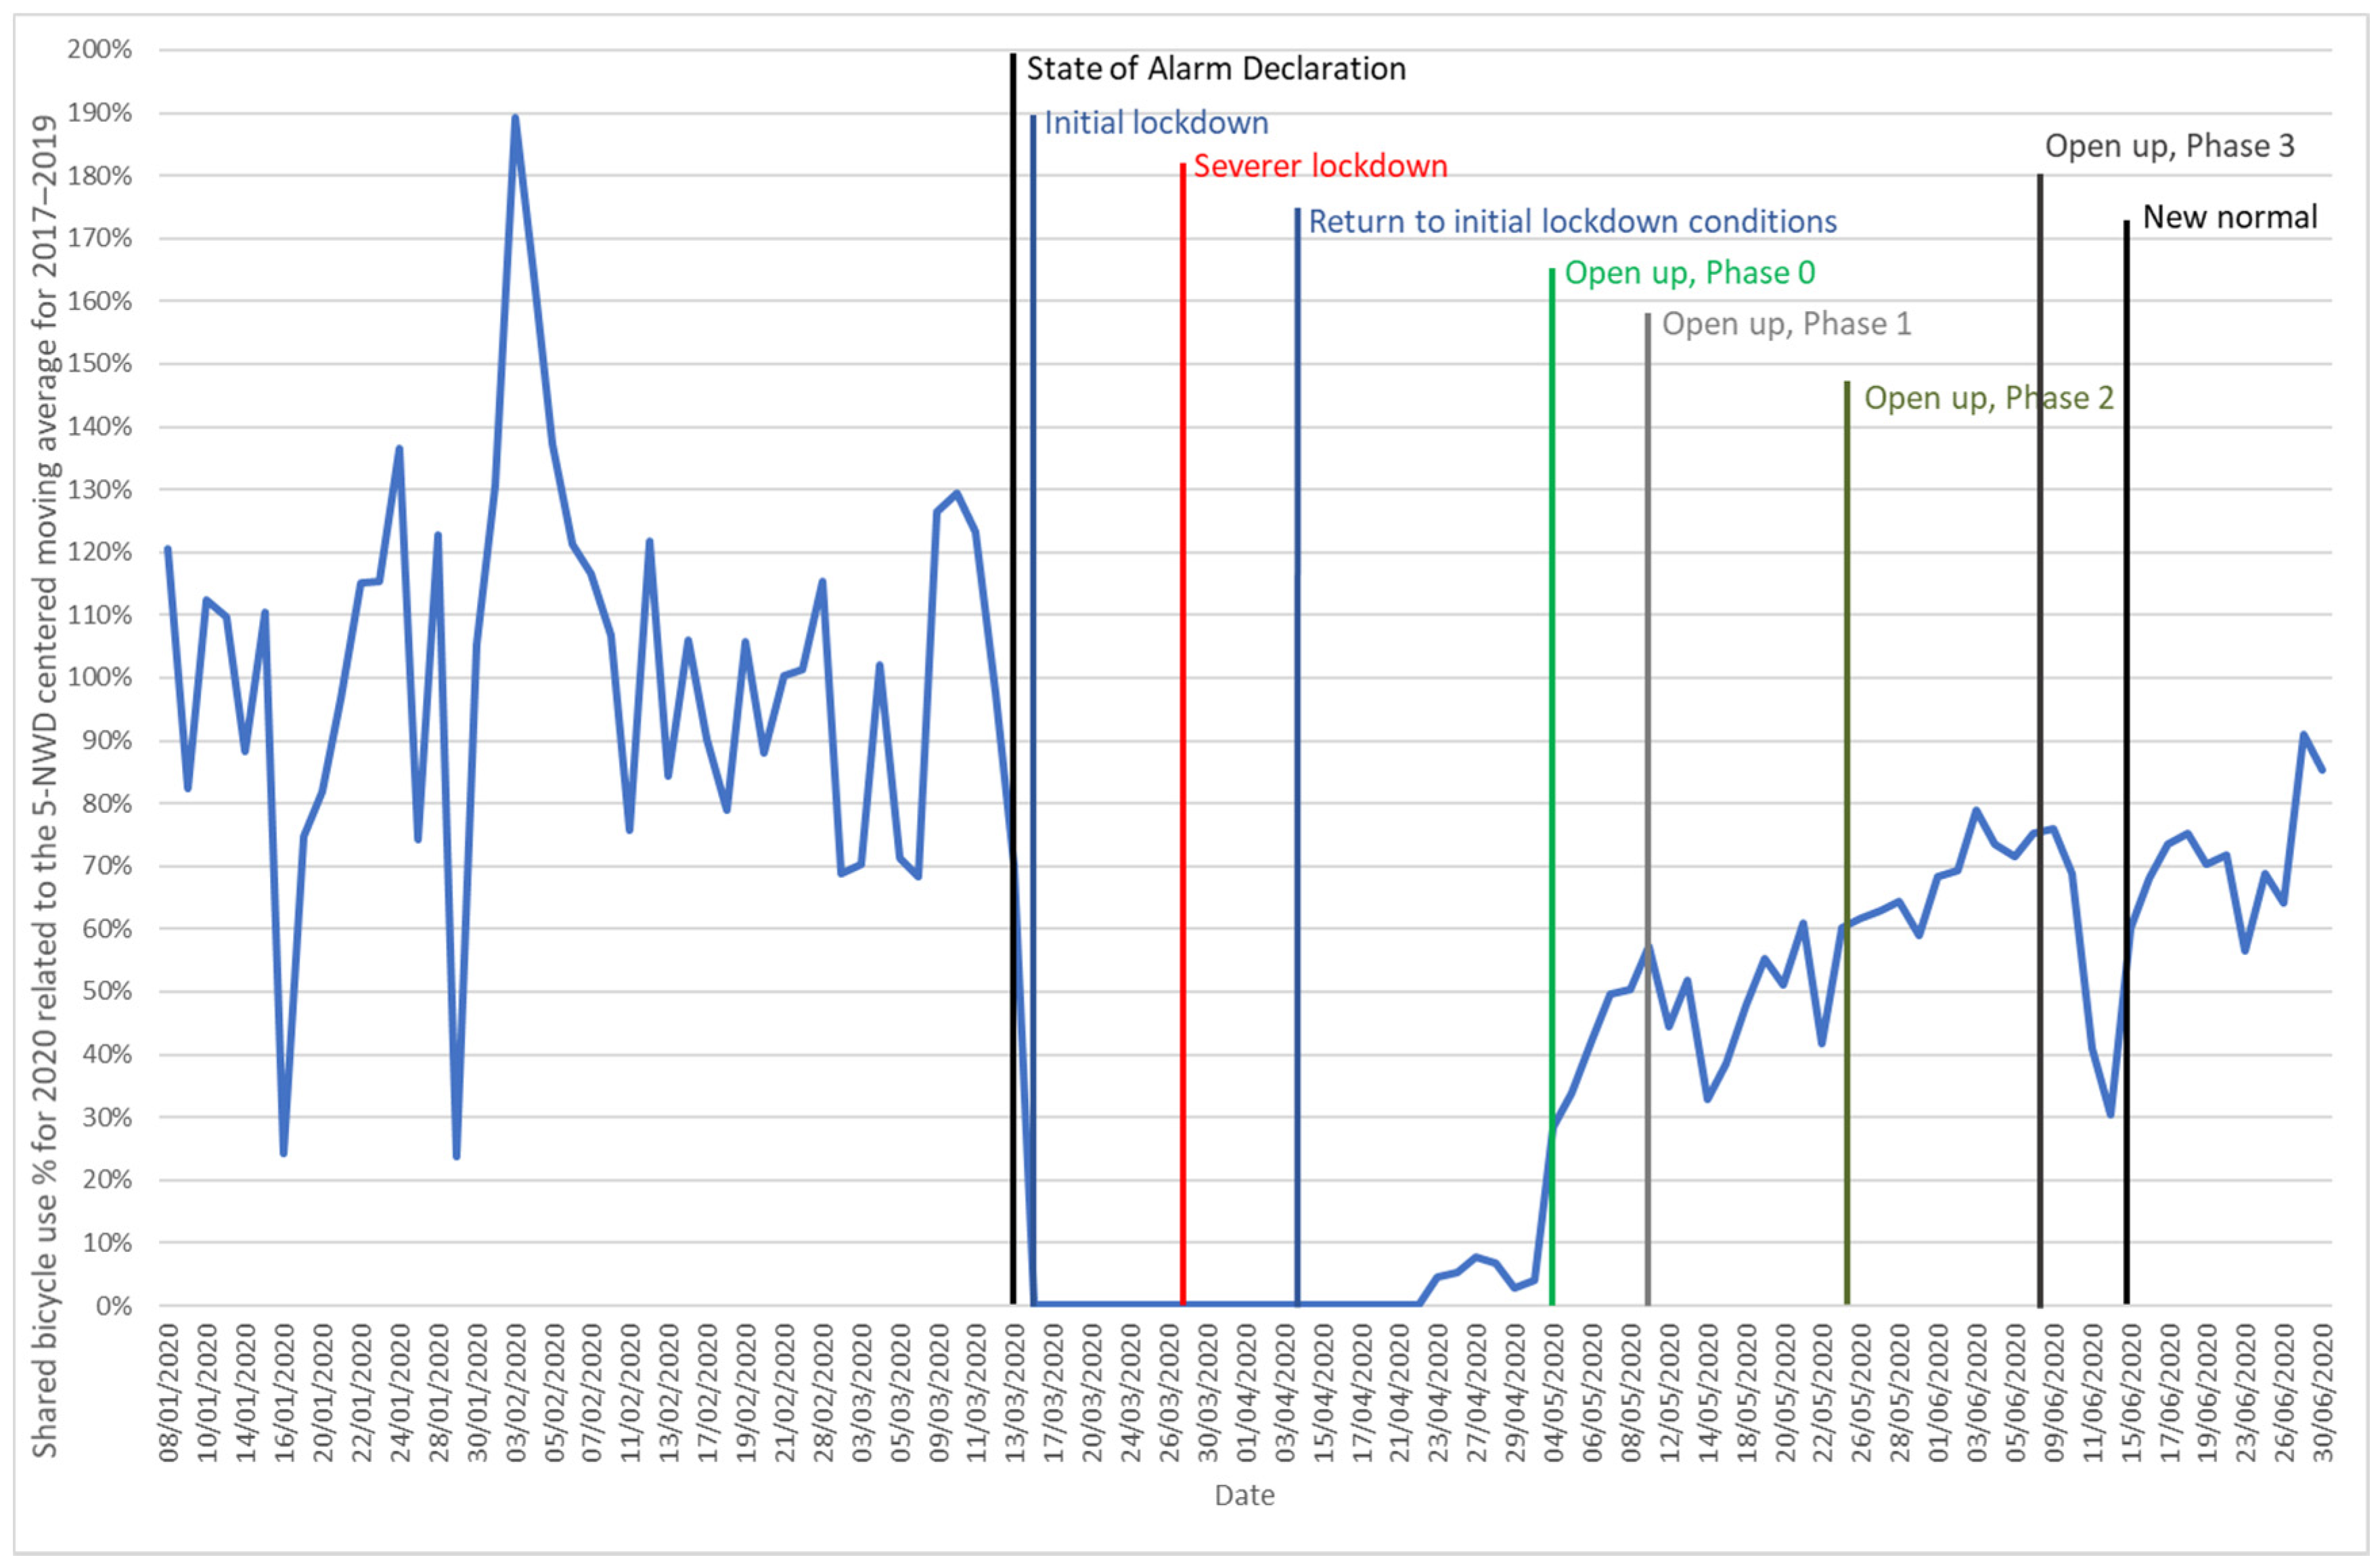
2.3. Shared Bicycle Use

In A Coruña, there is a bicycle-sharing system called Bicicoruña, managed by the company Empresa Municipal Vivenda, Servizos e Actividades S.A.U. (EMVSA). The bicycle share in the city’s urban mobility is still low, but it has experienced a relevant increase over the last few years. On the one hand, because of the bicycle-sharing system, and on the other hand, due to the new bicycle infrastructures being built. Figure 4 shows the number of uses of the Bicicoruña system in 2019, as a small sample of bicycle use in the city. In this case, even though a weekly pattern could still be observed, variations among days were proportionally more important than those for traffic volume. This can be due to weather effects, as A Coruña is a rainy city, and some of the shared bicycle users may choose other modes on wet days [55].

3. Materials, Methods, and Results

3.1. City Bus Ridership Evolution

Figure 5 compares the combined ridership for the whole city bus network in 2020 with data from the years 2017 to 2019.
The comparison was made considering normal working days (NWD) only. For the purpose of this paper, NWD is defined as days from Monday to Friday, excluding bank holidays, when educational establishments are open (that is, not considering educational short breaks either); however, the period after the school year end was included. This avoided the effect of the observed demand fluctuation due to weekends and exceptional days or holidays (as Easter) in the evaluation.
In Figure 5, for each day in 2020, a 5-NWD centered moving average (an average of the number of passengers for the five centered NWD) was calculated for years 2017, 2018, and 2019. The mean of these values for the three years was then calculated. The value presented in Figure 5 compared the demand of each day in 2020 with the thee-year 5-NWD centered moving average for 2017–2019. Making the comparison with a 5-NWD equivalent period, centered on 2020 calendar days, avoided, on the one hand, the effect of the seasonal variations on the evaluation (summer days of 2020 will be compared to the average value for an equivalent summer period of years 2017–2019), and on the other hand, other day of week effects besides the weekend.
Only five NWD are presented in the figure for the “severer lockdown” period, as the week from 6 to 12 April 2020, was the Easter Week.
Figure 5 shows how, just after the State of Alarm Declaration, the demand plummeted and remained around 10–16% of the 2017–2019 reference values during the initial lockdown, with a minimum of 8–9% in the severer lockdown, and remaining around 10–12% during the rest of the lockdown.
The decrease in the use of public transit was already noticeable a few days before the State of Alarm declaration, probably as a result of the concern of a part of the population due to the news from Madrid, the capital of Spain, where the virus stroke was more fierce and where the schools closed on 11 March. News from Italy may have also had an impact, as its Government imposed the lockdown on 10 March [6]. It is noteworthy that on 13 March in-person teaching activities were suspended at the university in Galicia, though schools were still open on the day with the recommendation not to send the children if parents had an option to care for them (by the decision of the government of the autonomous region). It is worth mentioning that the demand in January and February was appreciably higher than the average of the previous years.
During the reopening process, the demand started to increase slowly but steadily, with total compared ridership values around 13–14% in phase 0 (when the changes on allowed mobility were minimum), increasing from 18 to 25% in phase 1, from 31 to 40% in phase 2, and from 43 to 45–47% in phase 3. Finally, during the first weeks of the new normal period, demand rose from 49% up to 59% on 30 June. The value is coherent with the reports on the Moovit platform [56] for other Spanish cities for 30 June (values ranged from a drop in demand of 52.8% for Tenerife to 9.6% in Bilbao).

3.2. Traffic Volume Evolution

Figure 6 shows the evolution of traffic volume at the same station described in a previous section, located in the main arterial road of the city of A Coruña. The trend was similar to that of city bus ridership, but with a lower decline during the lockdown period and faster recovery during the reopening process and new normal period. During the initial lockdown, traffic volume declined initially to 38% of the 5-NWD centered moving average for 2017–2019, reaching 23% before the severer lockdown, when it bottomed to 16–18%. After that, traffic volume started to increase from 23 to 27% during the rest of the lockdown, increasing from 31 to 34% during the reopening phase 0, then to 65% during phase 1, reaching 77% on phase 2 and 3, and approximately 85% in relation to the equivalent period of 2017–2019 at the end of June. It is noteworthy that parking fees on the city streets were suspended from 16 March to 18 May.
A 100% comparative traffic volume was not yet achieved in the new normal, probably due to several factors, including: the decrease in tourism related to the fear still existing among the population; the increase in unemployment associated with the economic crisis caused by the pandemic; the decision to delay the reopening of some businesses by taking advantage of exceptional labor conditions established by the government; and the maintenance of virtual working for some of the population, combined with less use of kindergartens and elderly care centers. The number of unemployed people in the municipality of A Coruña increased from 16,951 to 18,904 from January to June of 2020, while it decreased during the same period the reference years [57].

3.3. Shared Bicycle Use Evolution

Figure 7 shows the evolution of shared bicycle use in the city. The comparison of the number of uses for each NWD in 2020 in relation to the 5-NWD centered moving average for 2017–2019 is indicated. Before the lockdown, there were days (for example 3 February) with values much higher than the reference value, which could be due to the lack of rain during this period in 2020, contrary to 2017–2019, with significant rain in the reference period. The service was canceled since the beginning of the lockdown until 23 April [58], explaining the 0 values for these dates. Finally, after the service continuation, demand increased to approximately 50% during phase 1, 70% during phase 2, and up to 91% and 85% for the two last days of the studied period. The significant drop around 11 and 12 June may be associated, again, with weather conditions, as one of the meteorological stations of the city (Torre de Hércules) registered 6.3 and 5.6 l/m2, respectively, for these dates [59].

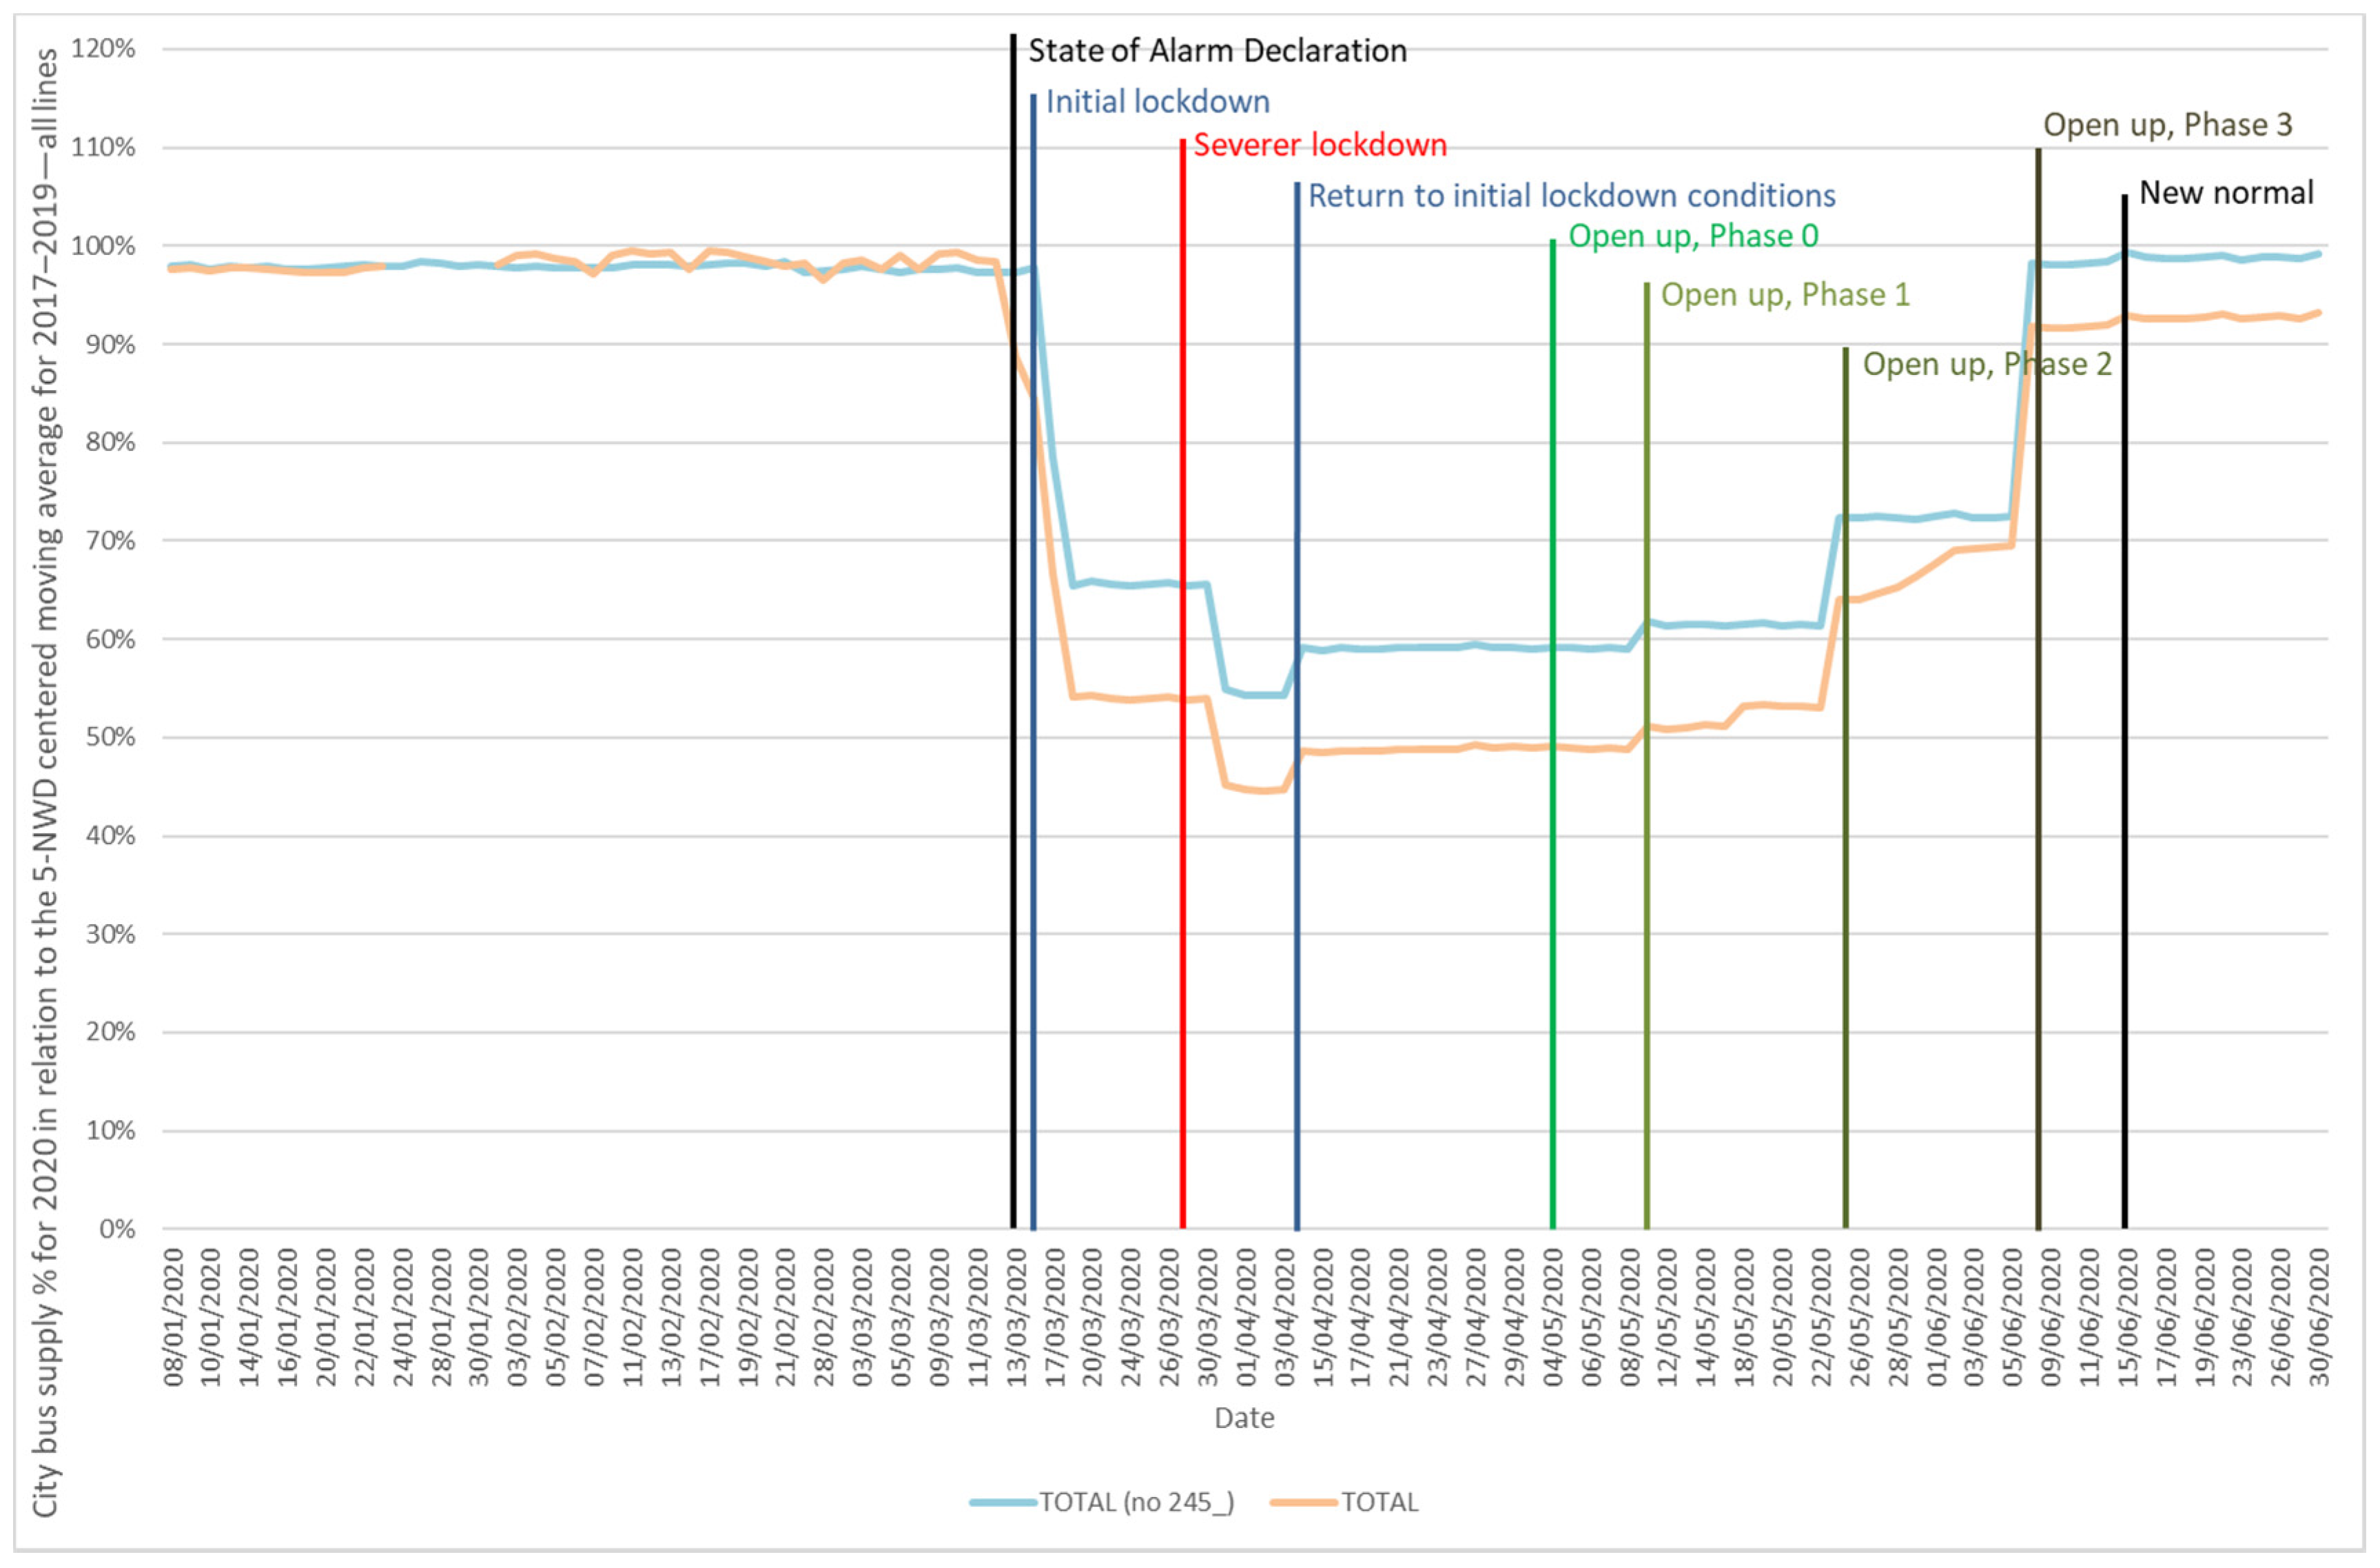
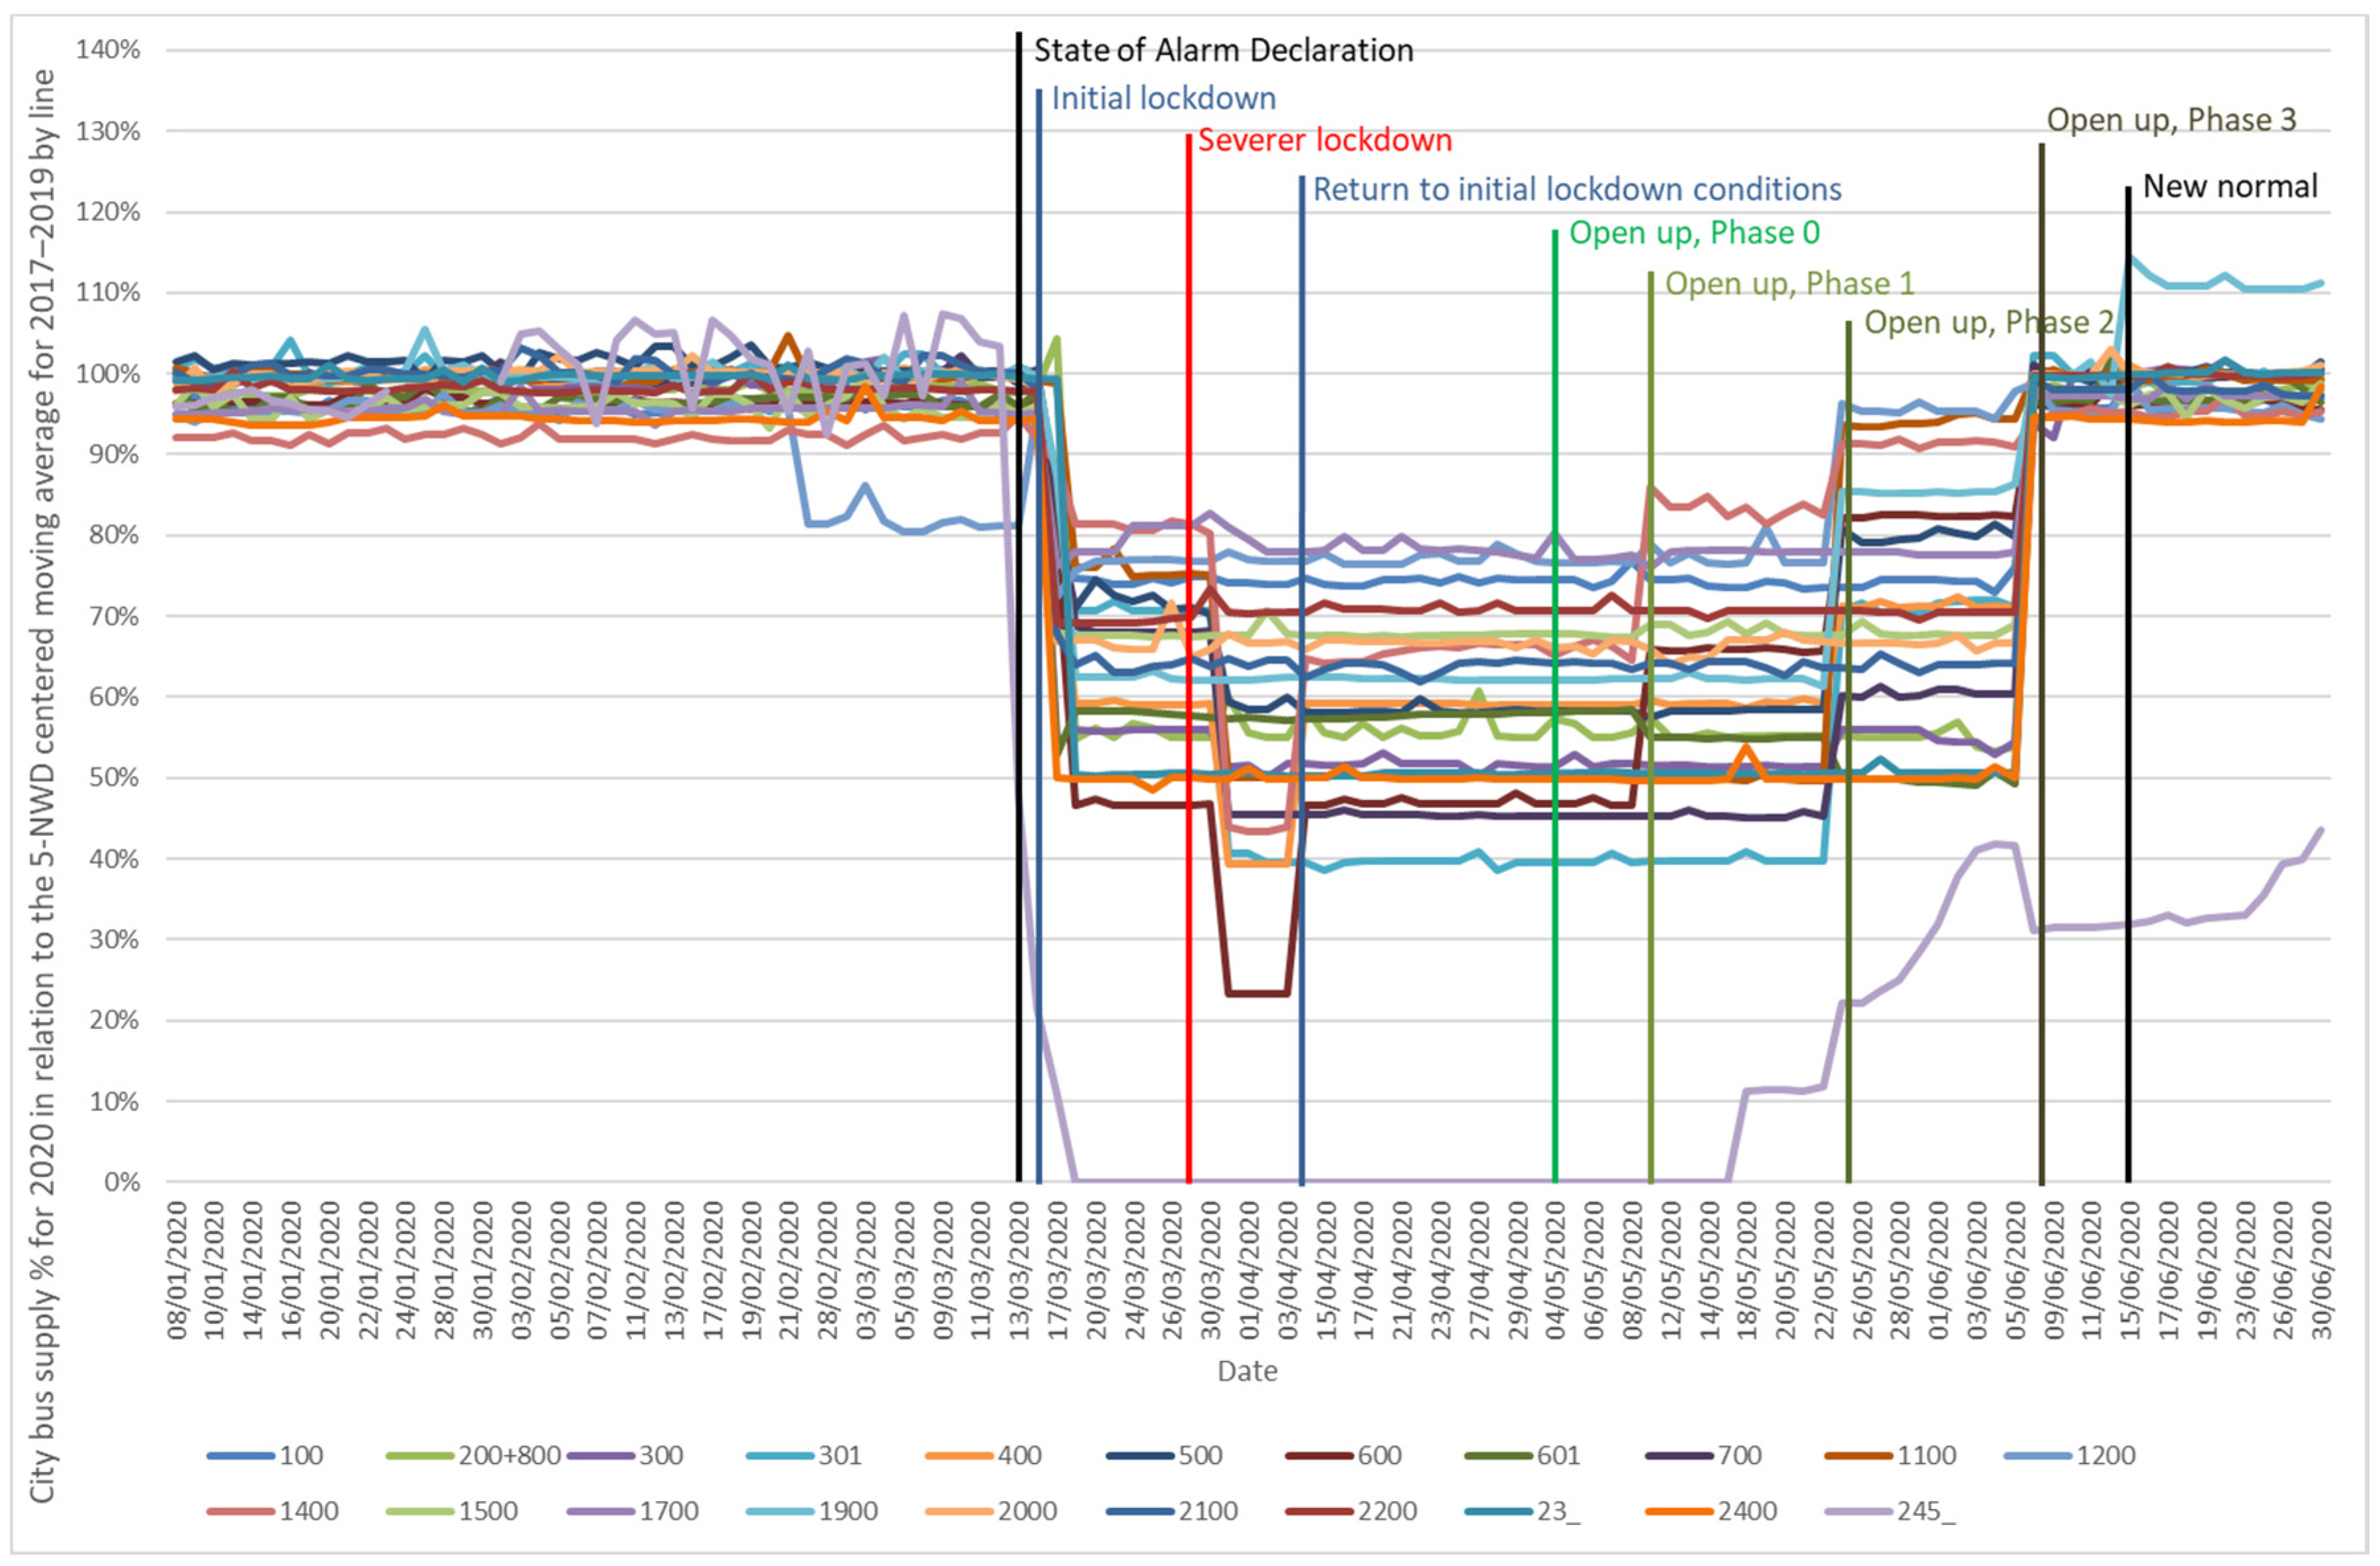
3.4. Changes in City Bus Supply During the Lockdown and Reopening Process

The city bus transit supply was reduced several times during the lockdown to adjust to the ridership and mobility decrease and then recovered during the reopening process. The company’s supply changes were appropriately announced through its website, social media, and newspapers [60,61,62,63].
Figure 8 shows the combined city bus network supply compared to the 5-NWD centered moving average during 2017–2019. It shows both the information for the whole network (TOTAL), and without considering the line to the university (TOTAL (no 245_)). It was considered important to include this second graph, as university teaching activities were suspended during the lockdown. This led to the first cancellation of the line until the middle of Phase 1 and to an offer of about 30% thereafter, which reduced the network’s total supply value.
Excluding the service to the university, the Figure shows how the offer decreased to approximately 65% during the initial lockdown, dropping to approximately 54% during the severer lockdown, and stabilizing at approximately 59% during the second phase of normal lockdown. After the reopening, it grew to 61,73,98 and 99% during Phases 1, 2, 3, and the new normal, respectively. Thus, the supply during the new normal period (excluding the line to the university) was the same as the supply before the lockdown: approximately 99% of the reference value. The values taking into account the 245_ line to the university were slightly lower, as can be seen in the graph. An analysis of the effect of removing the university line data in demand was also performed, but the impact on the curve in Figure 5 and Figure 9 is almost negligible.

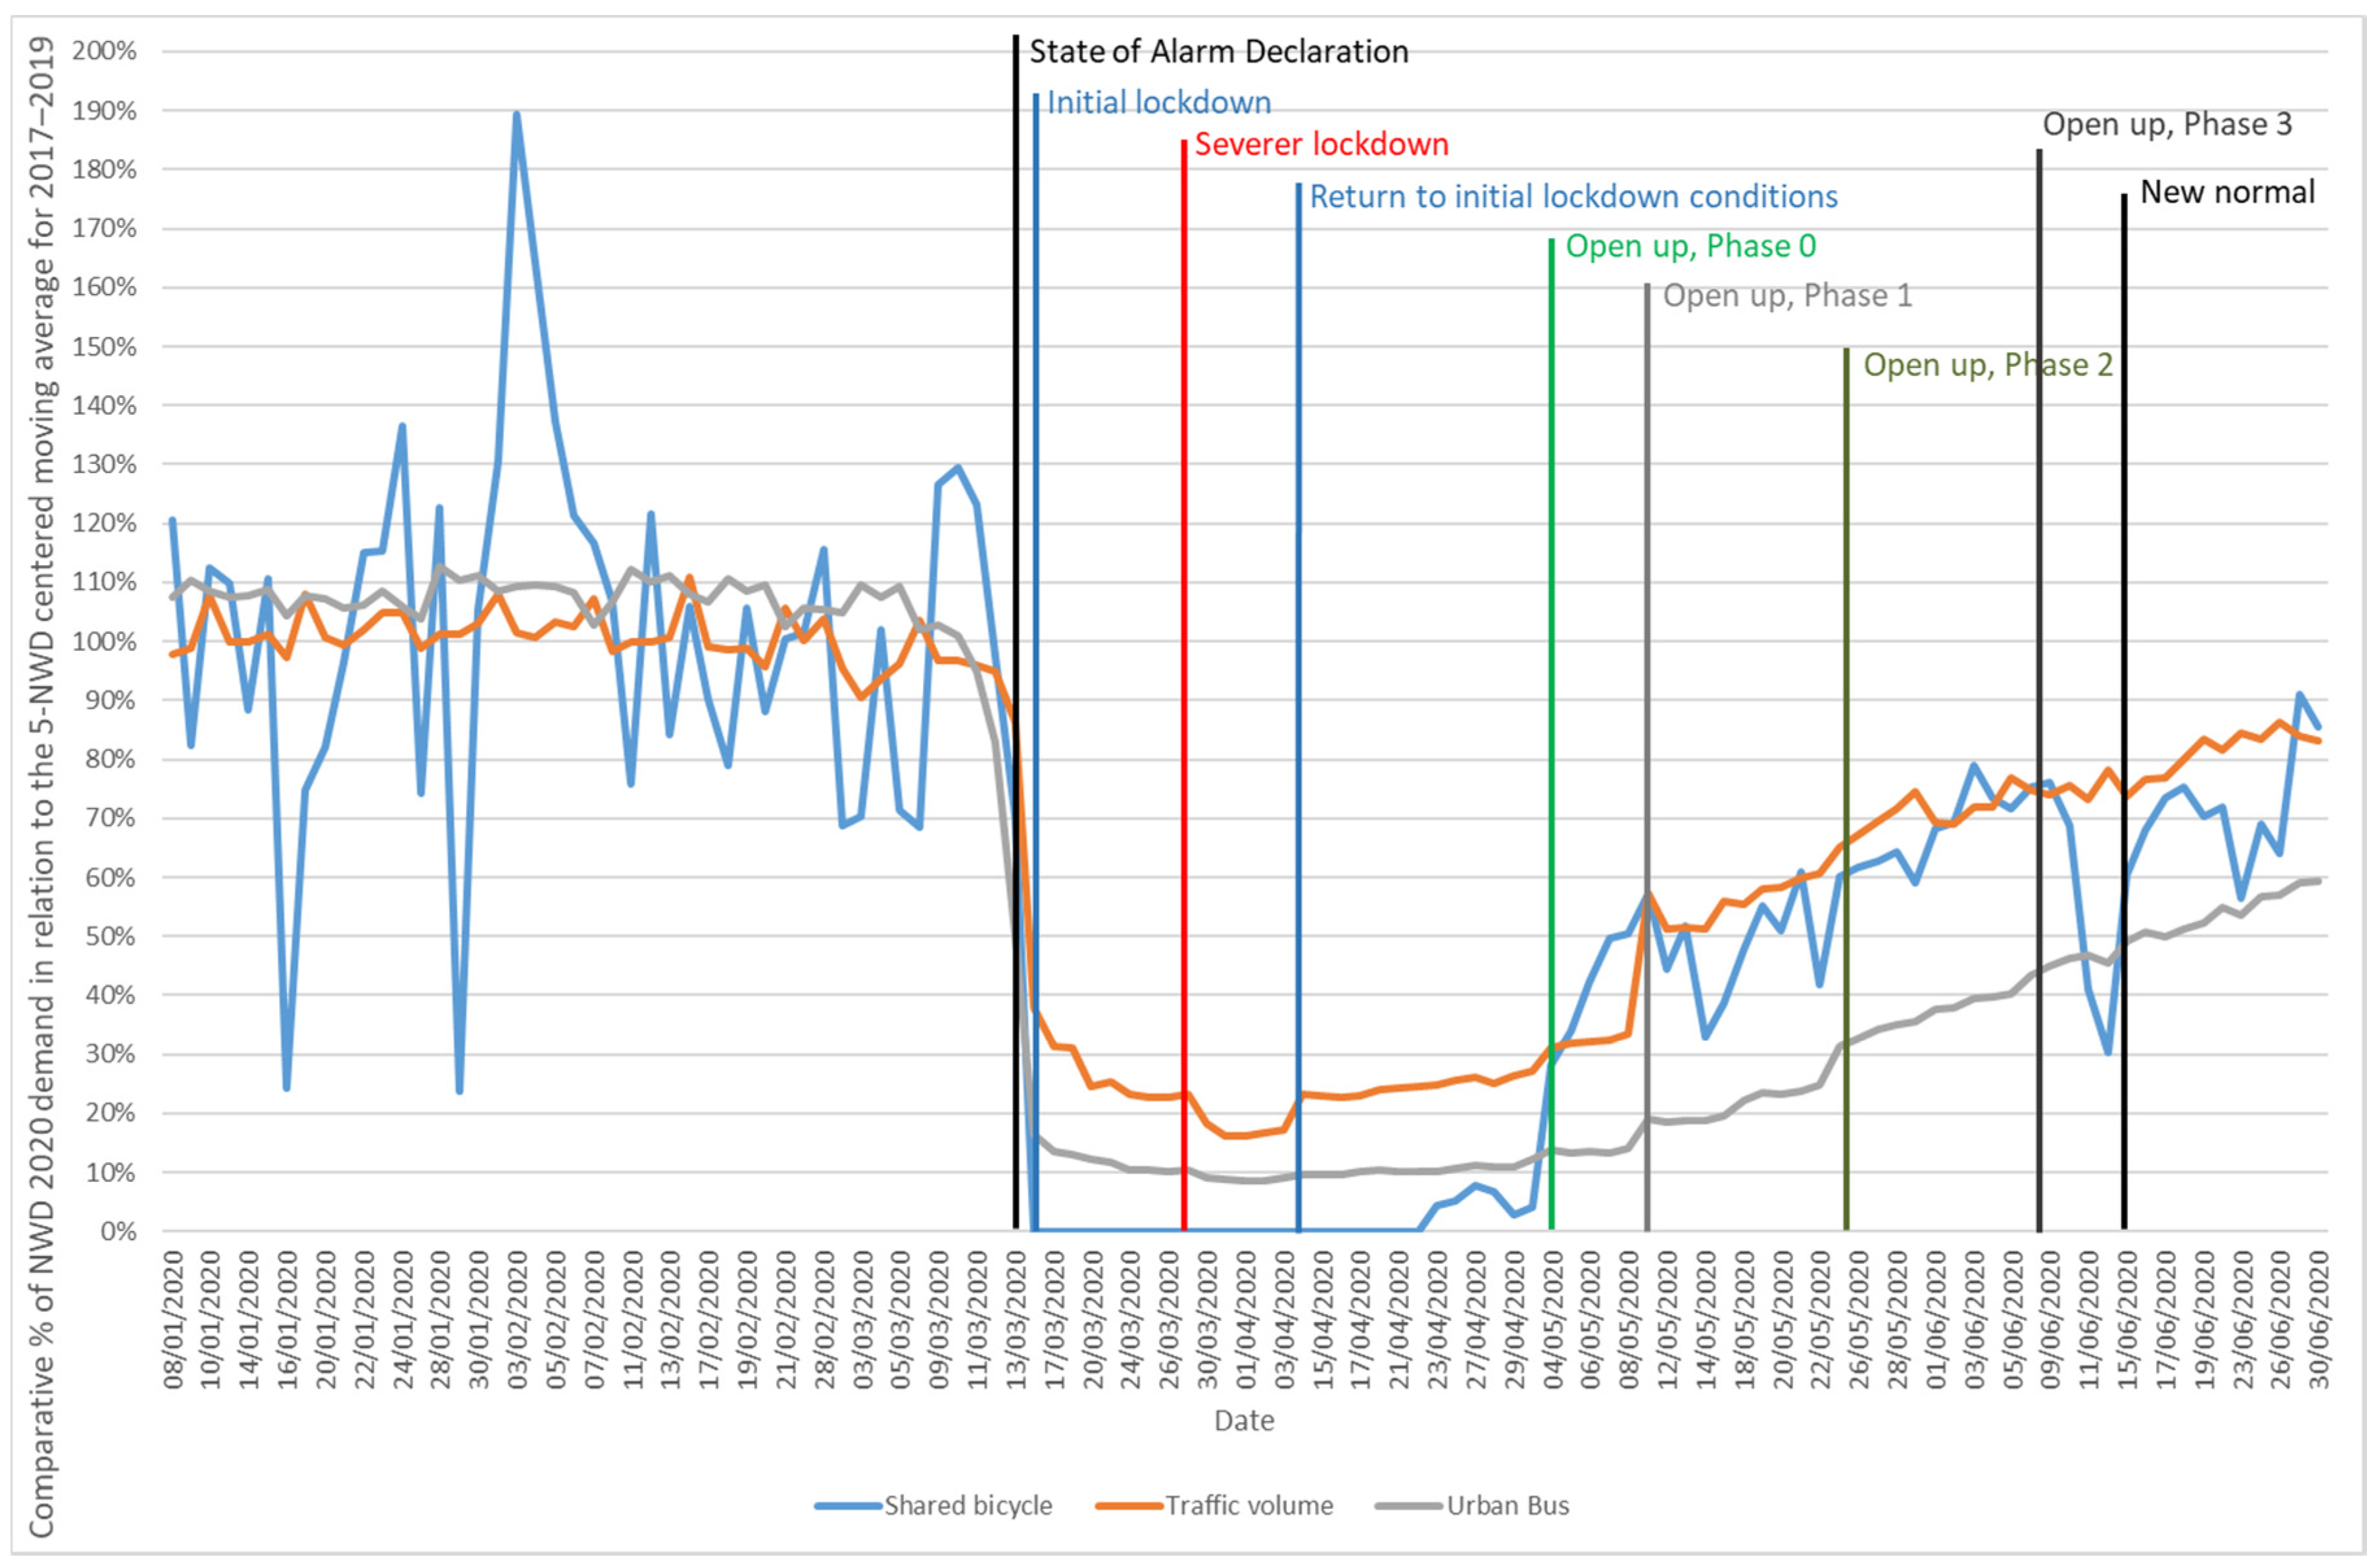
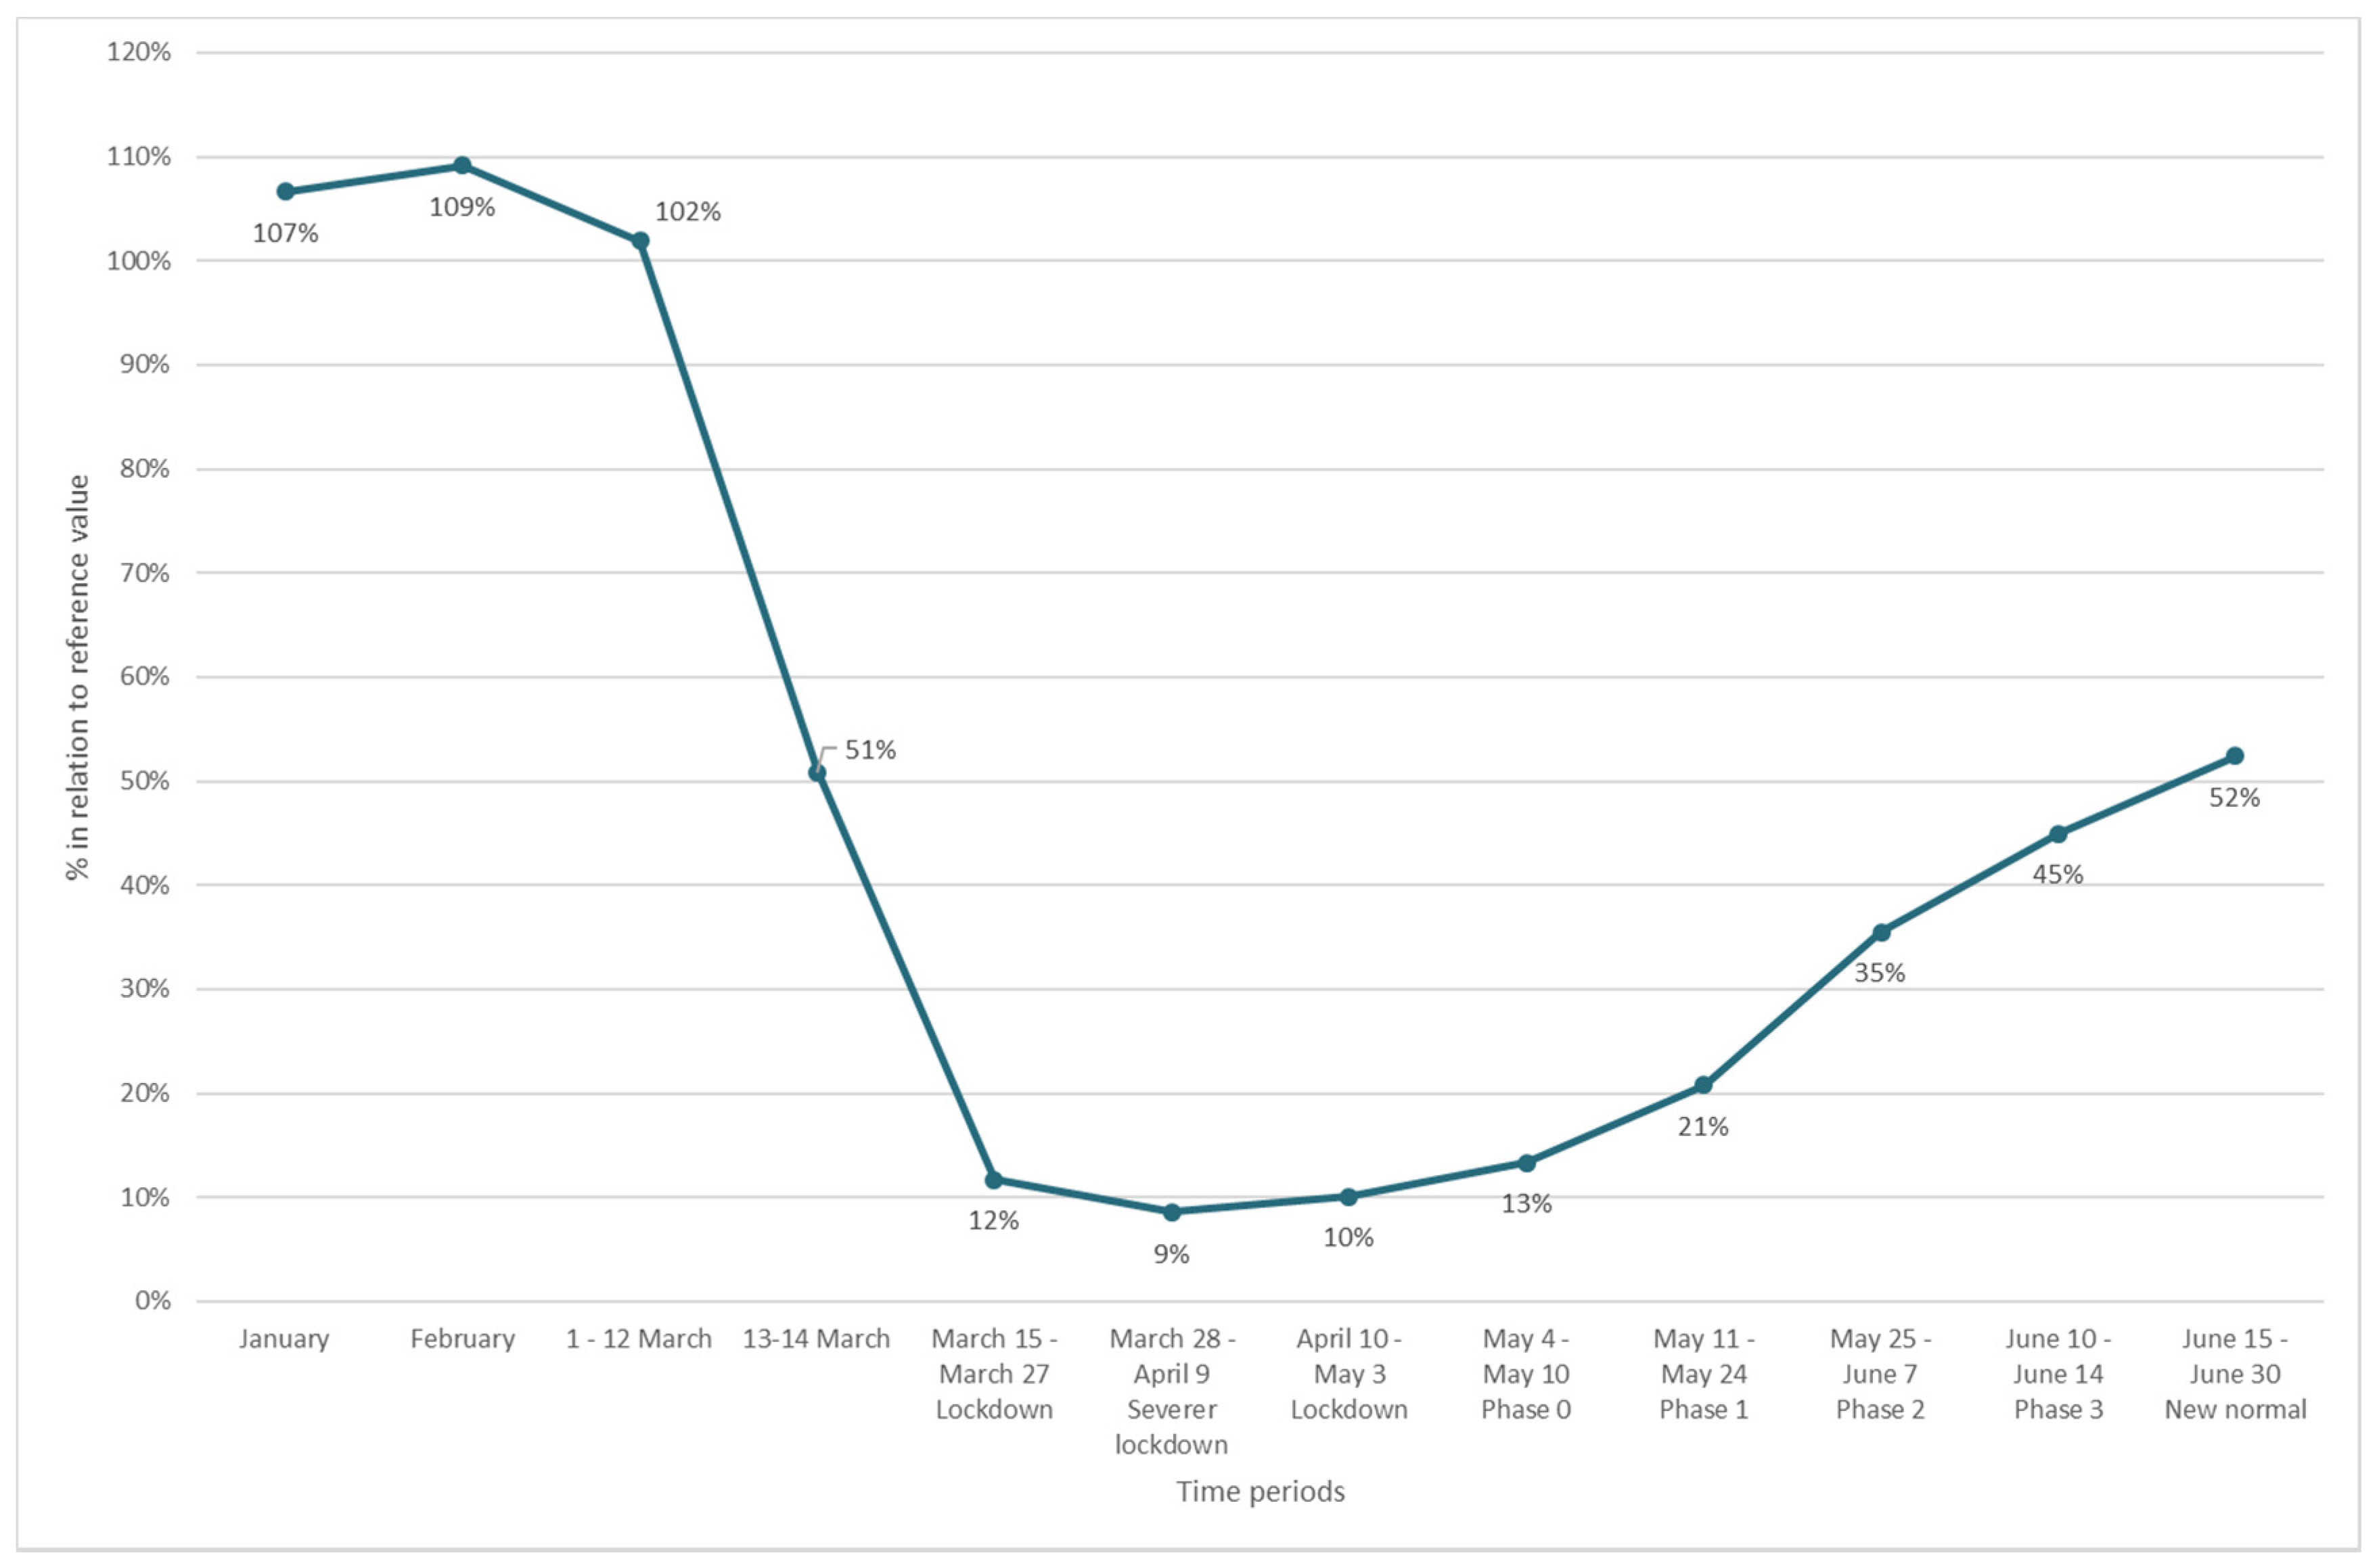
3.5. Comparative Evolution by Modes

Figure 9 shows the comparative evolution of demand by mode for the first half of 2020. The information is the same as that shown in Figure 5, Figure 6 and Figure 7, but it was presented to highlight the differences among modes. During lockdown, bike sharing disappeared and bus demand percentage was about a half of that for general traffic. Figure 9 clearly illustrates the rapid recovery for shared bicycle services and traffic volume during Phase 0 and thereafter (even though there are lower isolated values associated with weather conditions). The recovery of demand for city buses has a similar slope but not the steep step during Phase 0 of the reopening process when there was an increased demand for shared bicycle and larger traffic volumes. The final recovery value for bus services was much lower than for traffic volume on the same date, probably due to the fear of contagion when using transit.

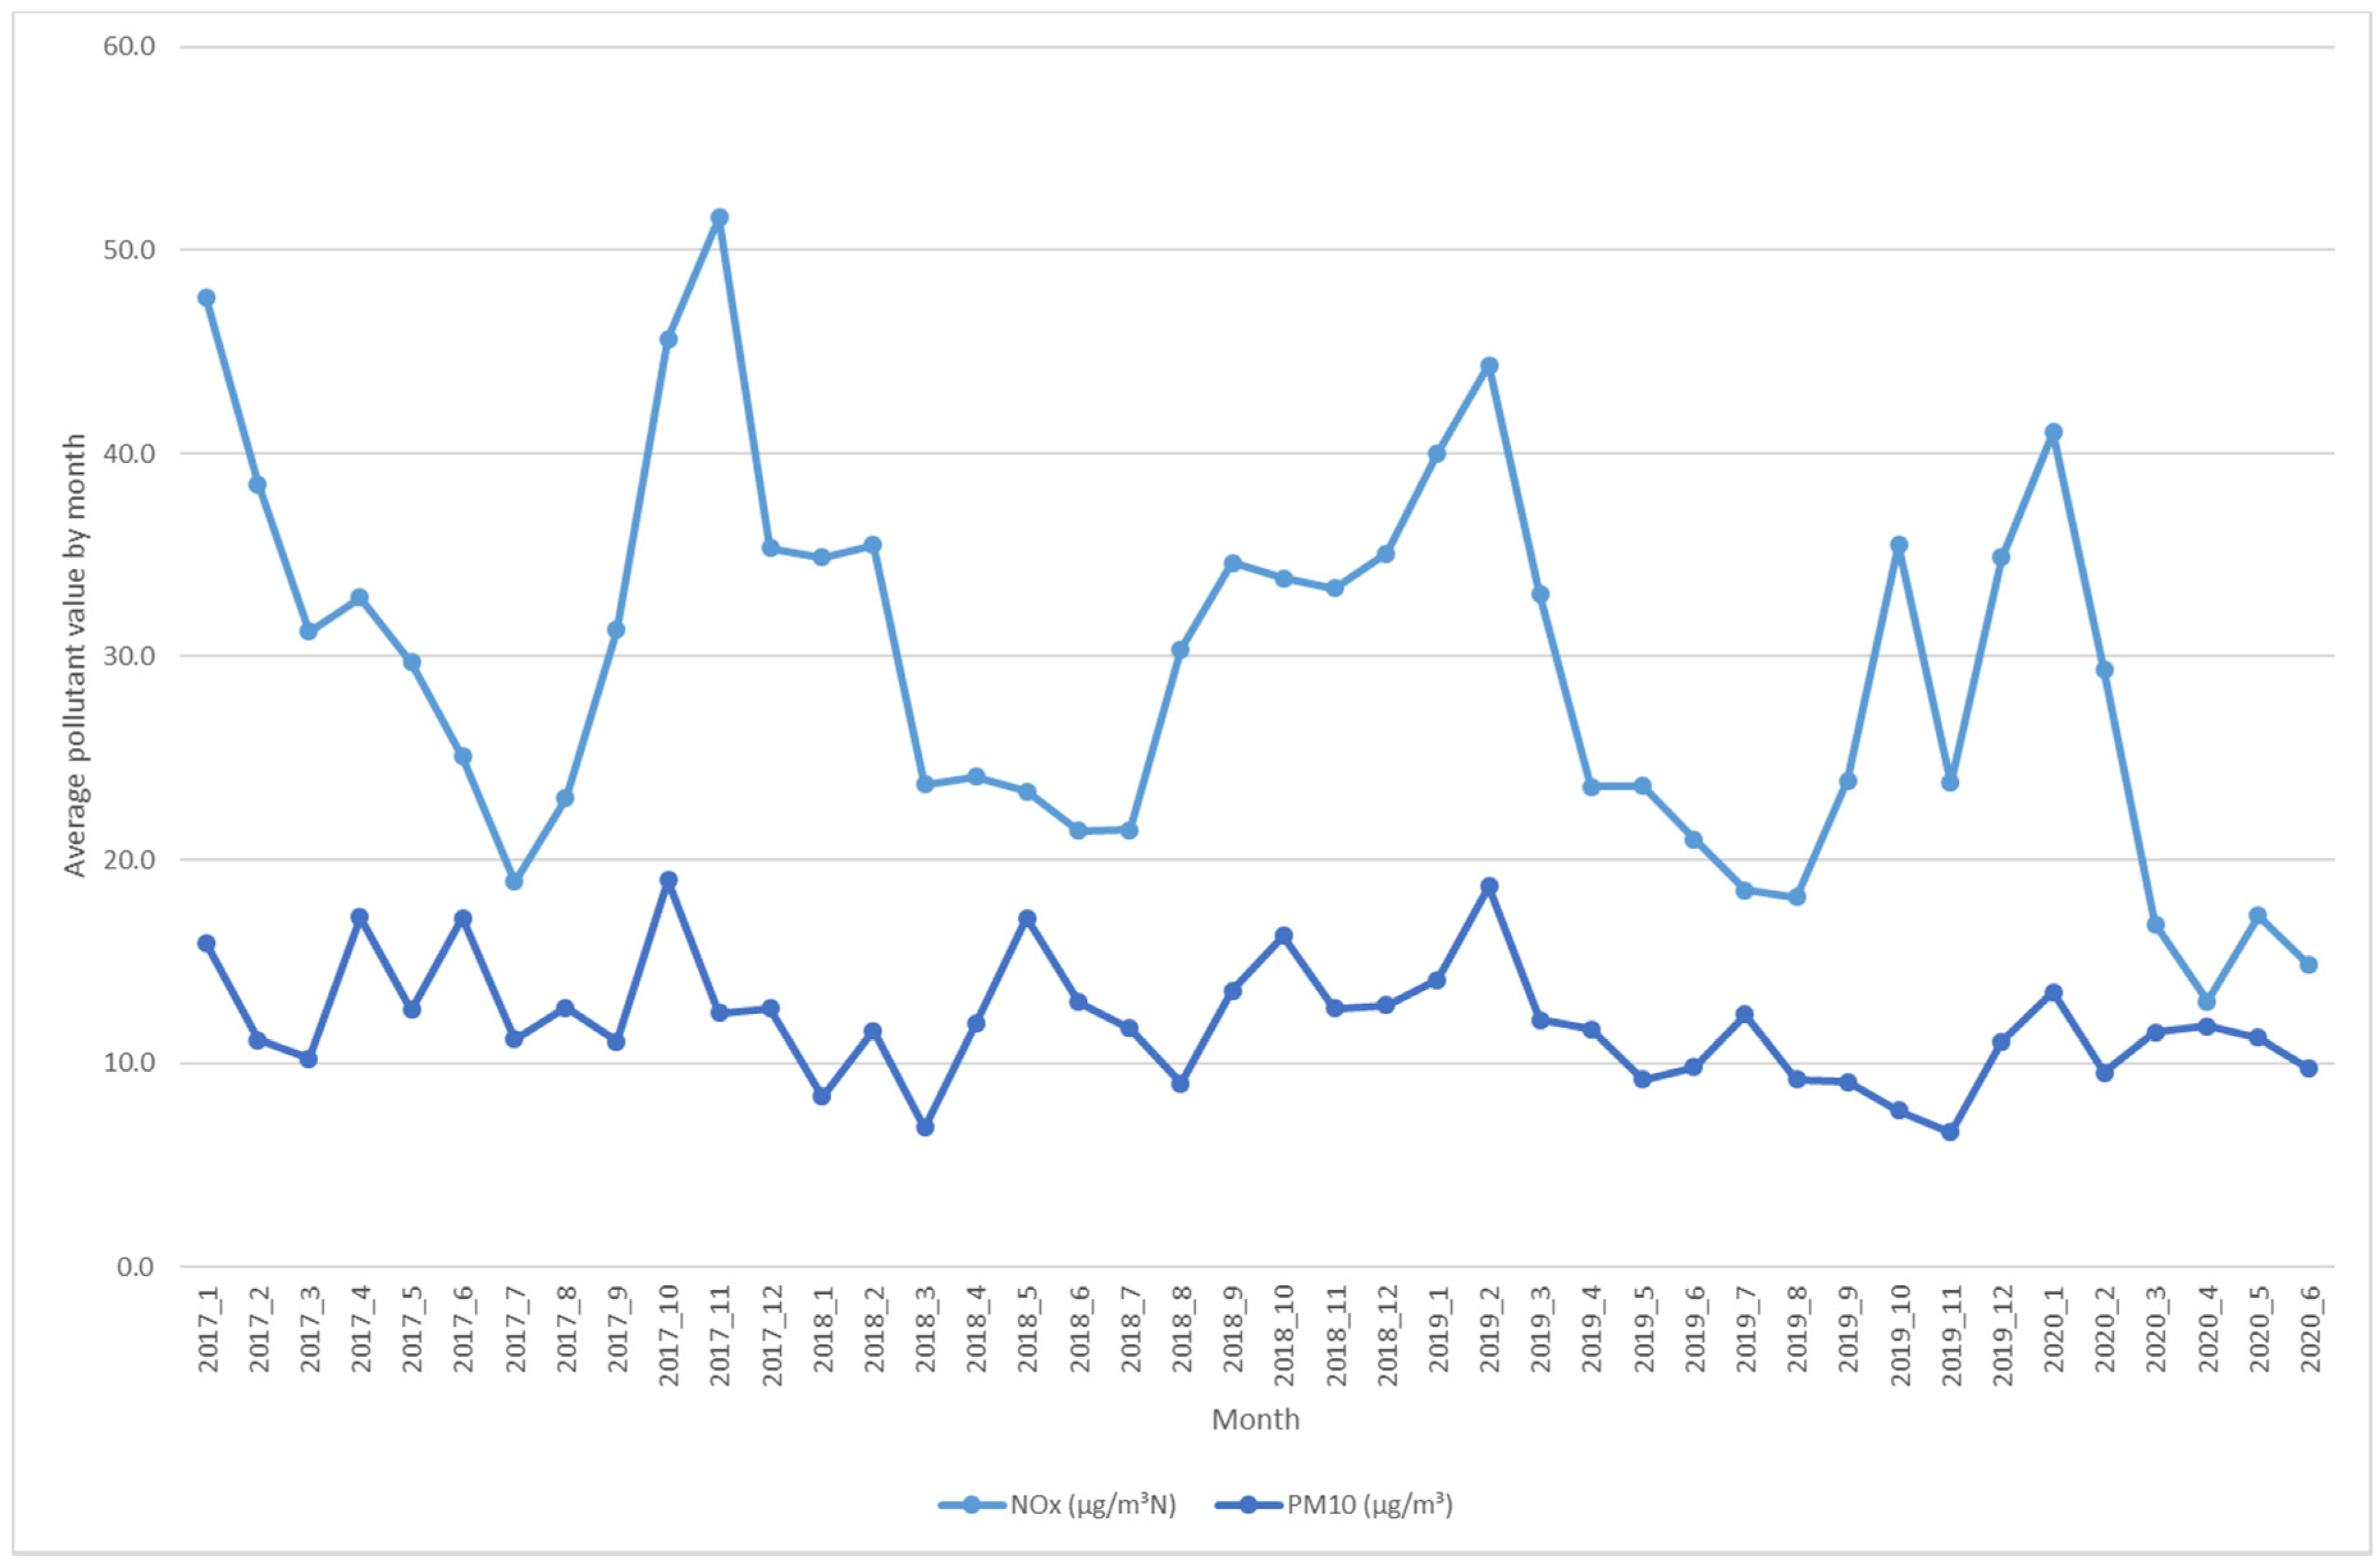
3.6. Evolution of Main Pollutants

Figure 10 shows the evolution of the monthly average concentration of NOx and PM10 from January 2017 to June 2020 in Santa Margarita station [64]. The results showed a relevant reduction in NOx during the COVID–19 lockdown; the values for March to June 2020 were the lowest of the series. The April value was 13.0 g/m3N, while the minimum value before lockdown was 18.2 g/m3N (values for NO2 were 10.1 and 12.8 g/m3N, respectively). Nevertheless, no clear effects could be observed for particulate matter. These results are coherent with those presented in a general study for main cities in Spain developed by the Spanish Goverment: mean NO2 value of 12 g/m3 for April with a previous minimum of 21 g/m3 in TRAP stations, and no clear reduction for PM10 [65]

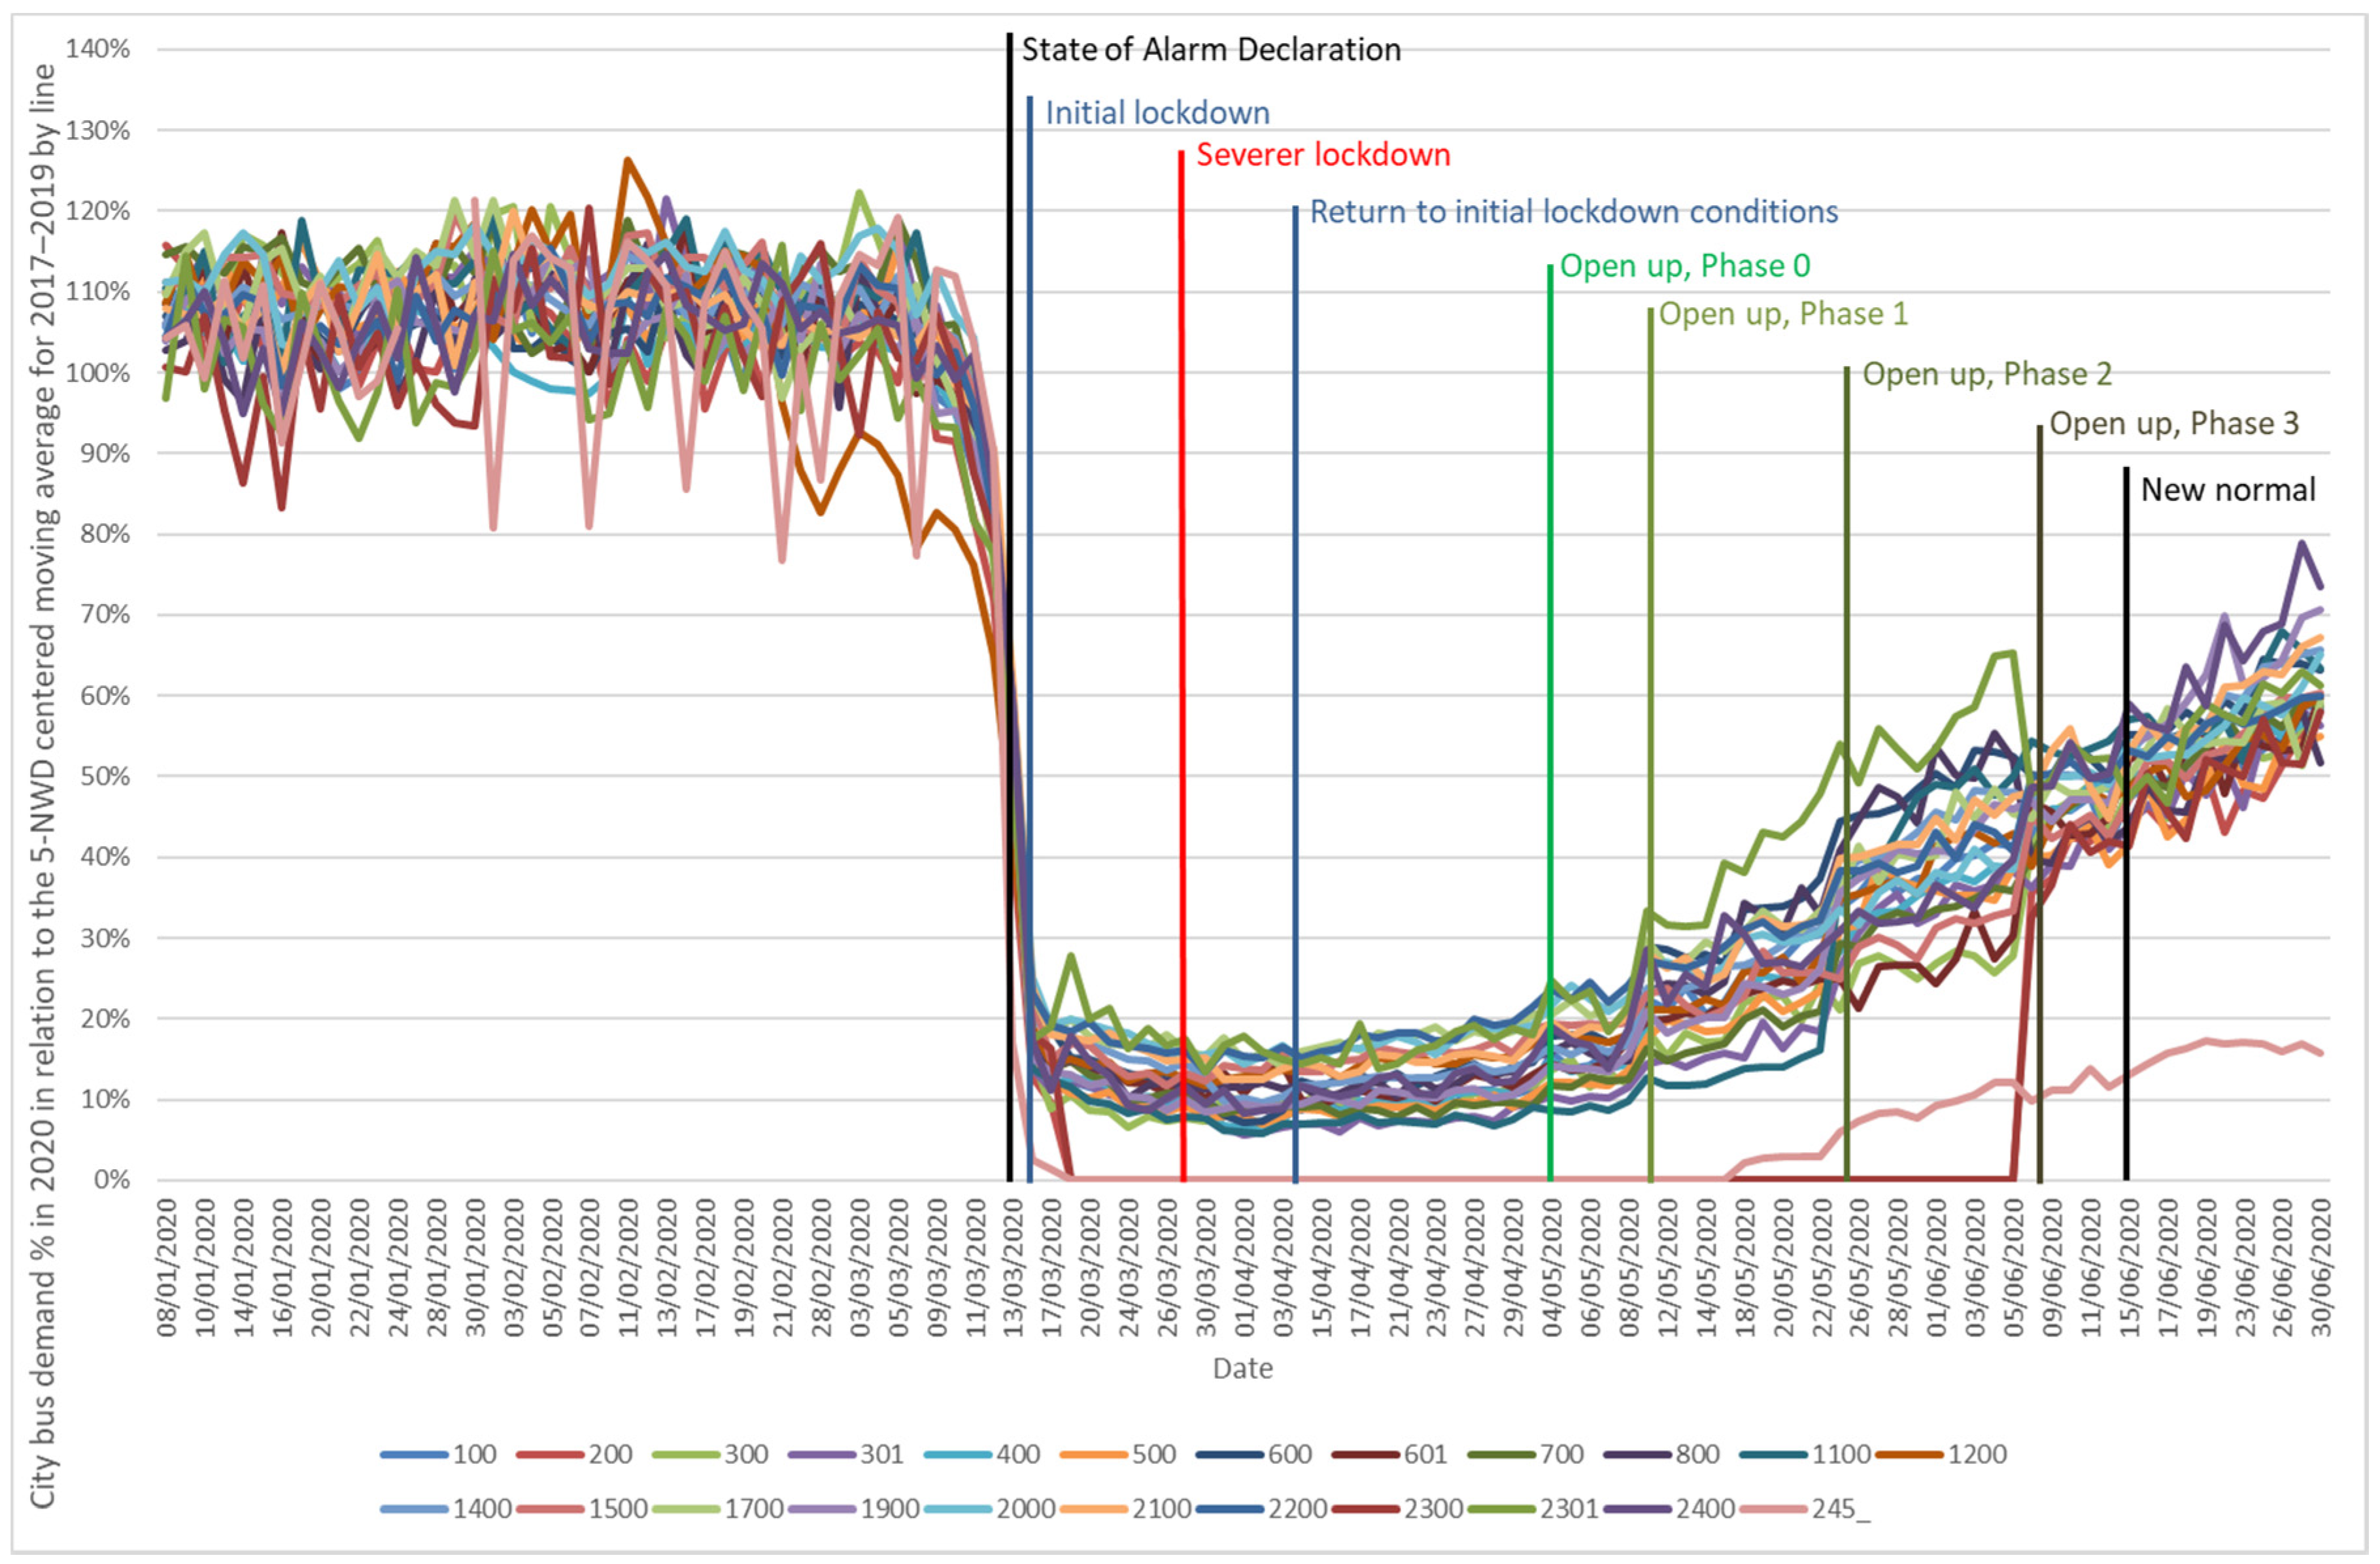
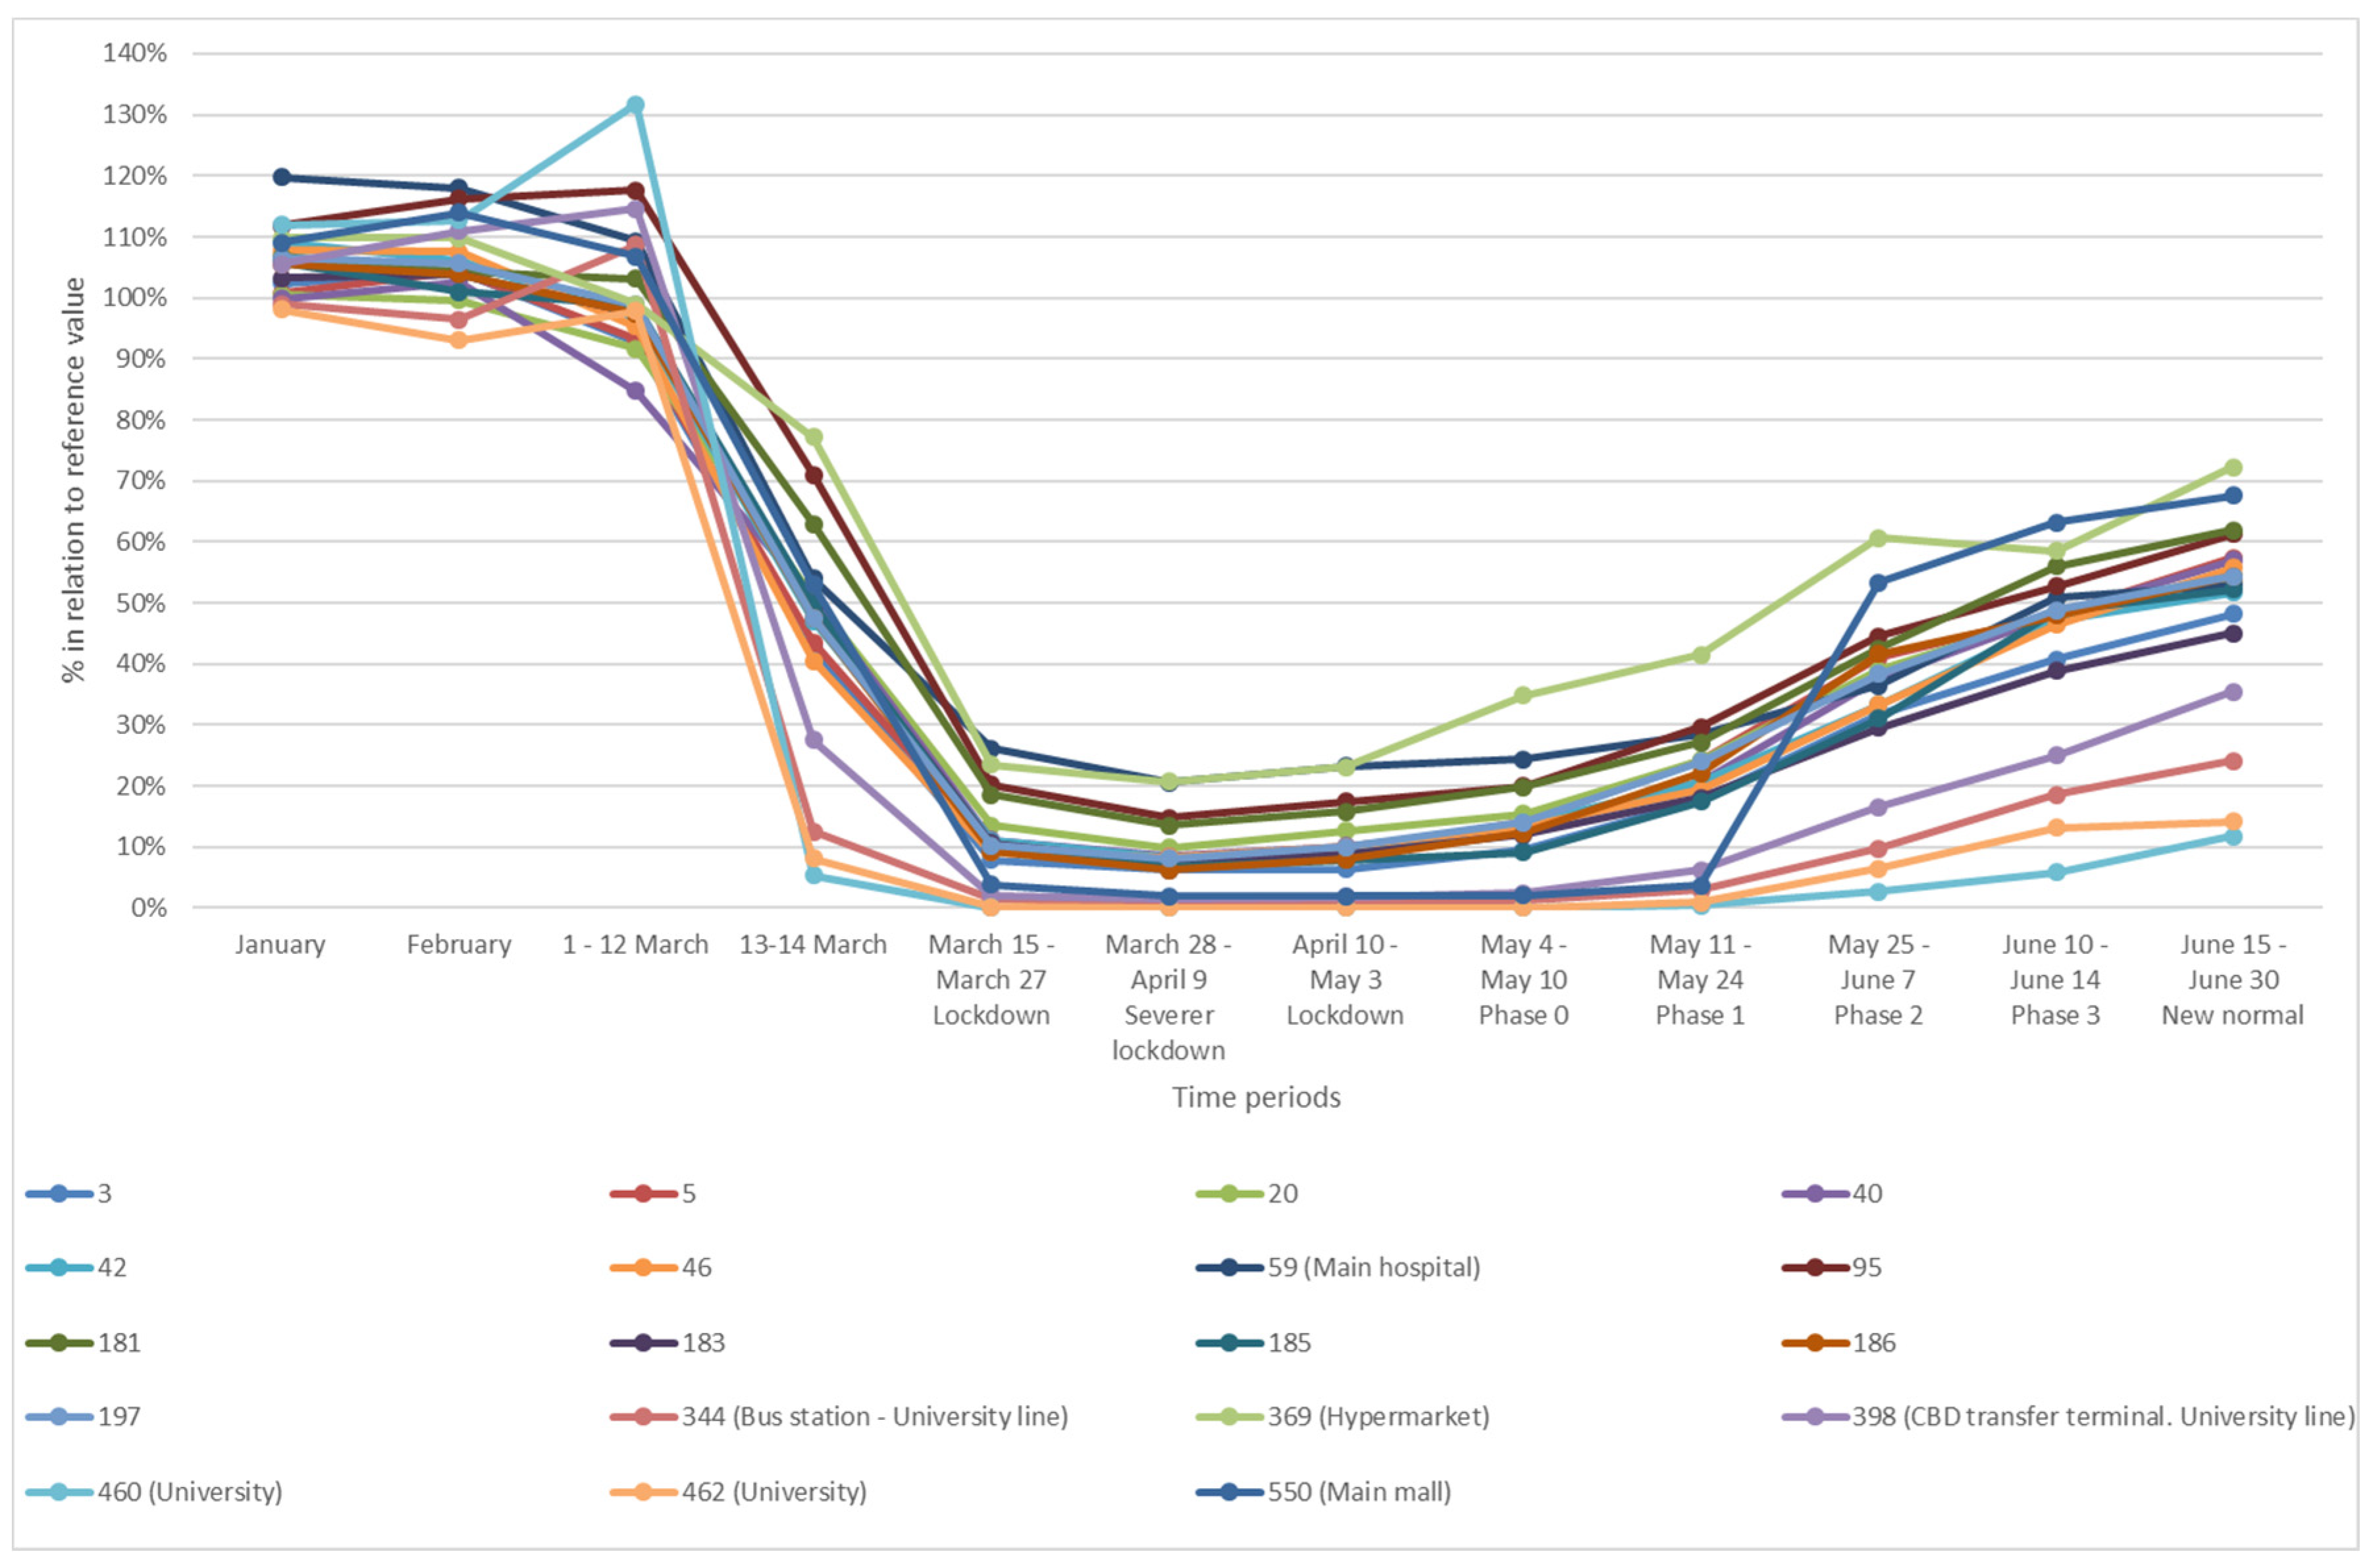
3.7. Detailed Analysis of City Bus Services

Table 1 shows the ridership evolution of each city bus line from 2017 to 2020, for both the whole and the first half of the year, without including the night line. It can be observed how the number of passengers plummeted in the first half of 2020 compared to 2019 (the total figure for the first six months of the year decreased by about 43.4%). The table shows that most lines had a ridership decline between 39 and 46%, except for lines 200, 2300, and 245_, where the drop was 52–56%. The number of each line is the one used in the company’s database, not the commercial one (for example, number 100 corresponds to line 1, while numbers 2300 and 2301 are lines 23 and 23A).
For a more detailed picture of lines ridership behavior, Figure 11 compares the demand of each city bus line with the 5-NWD centered moving average for years 2017 to 2019. In order to understand the behavior of some lines in this figure, the following clarifications need to be made:
(1)
Lines 2300 and 2301 have the same route, except for a short branch at the end of the line, to serve a specific small residential area. Since the beginning of the lockdown until the start of phase 3, line 2300 was canceled and only line 2301 was in service, which explains why its ridership level grew faster than that for the other lines, as it is absorbing the demand of two lines.
(2)
The same applies to lines 200 and 800, with line 800 making a detour at the end of the route to serve one of the public city hospitals. Only line 800 was in service since the beginning of lockdown to phase 3, which led to an increase in ridership of this line, which is absorbing line 200 ridership as well.
(3)
Line denoted as 245_ is a special service to the university campus. It was canceled a few days after the lockdown began, until the middle of phase 1. This explains the lack of passengers during this period. After that, the demand grew at a much lower rate than that of the other lines, since the university was not open for educational activities, and part of research and administrative personnel had not yet returned to in-person work. In the previous period, peaks of reduced demand were due to the Friday effect in comparison with mean weekday behavior considered in previous years’ averages. There was a significant reduction in university lectures on Fridays in A Coruña.
(4)
Line 1200 was affected by street works from 21 February, and this is why it presents a drop in demand in the weeks prior to lockdown.
Figure 11 shows how, just after the State of Alarm Declaration, the demand of every bus line plummeted to values in the range from 6–7% (line 301) to 19–20% (line 2200). This low level of demand remained almost invariable until the reopening process began. The effect of the more severe lockdown was almost imperceptible at each line level. The decrease in the use of public transit was already noticeable a few days before the State of Alarm declaration, due to the reasons already mentioned.
During the reopening process, the demand started to increase slowly but steadily, in the same way that was shown for the whole network demand, but with an appreciable dispersion among lines. Regardless of the previously indicated lines (2300, 2301,200, 800, and 245_), the maximum range of variation was 15.7% during Phase 0, expanded to 21.4% in Phase 1, 27.4% in Phase 2, 18% in Phase 3, and reached 27.6% during the last days of the new normal period. These ranges are similar to the previous situation in January (23.6%) and February (23.9% without line 1200).
Figure 12 shows the comparison of 2020 supply by line, in relation to the 5-NWD centered moving average for 2017–2019. In this figure, some lines are presented jointly: lines 200 and 800 (as 200+800) as well as 2300 and 2301 (as 23_), due to their similar routes and the cancellation of one of them during the lockdown and part of the reopening period.
The figure shows that the supply decrease was not homogenous throughout the whole network. Lines over 65% supply during the whole period were 1200, 1500, 1700, 2000, and 2200, which serve the main public hospital in the city, in addition to line 100. On the other hand, line 600 had values of about 47% during the lockdown until Phase 1 (dropping to 23% during the severer lockdown), reaching 66, 82, and 96%, respectively, in Phases 1, 2, and 3 together with the new normal during the reopening phase. Finally, of course, line 245_ (university) was canceled during the initial lockdown until the middle of Phase 1, growing in different steps to values of about 40% at the end of June.
Line 1200 dropped to values around 80% of the usual supply before the lockdown, due to the above-mentioned works on one of the main streets of its route, but it reached a value around 96% in the new normal period. The line 1900 new normal supply was a little higher than usual (around 110%), probably because it serves one of the closer beaches outside the city.

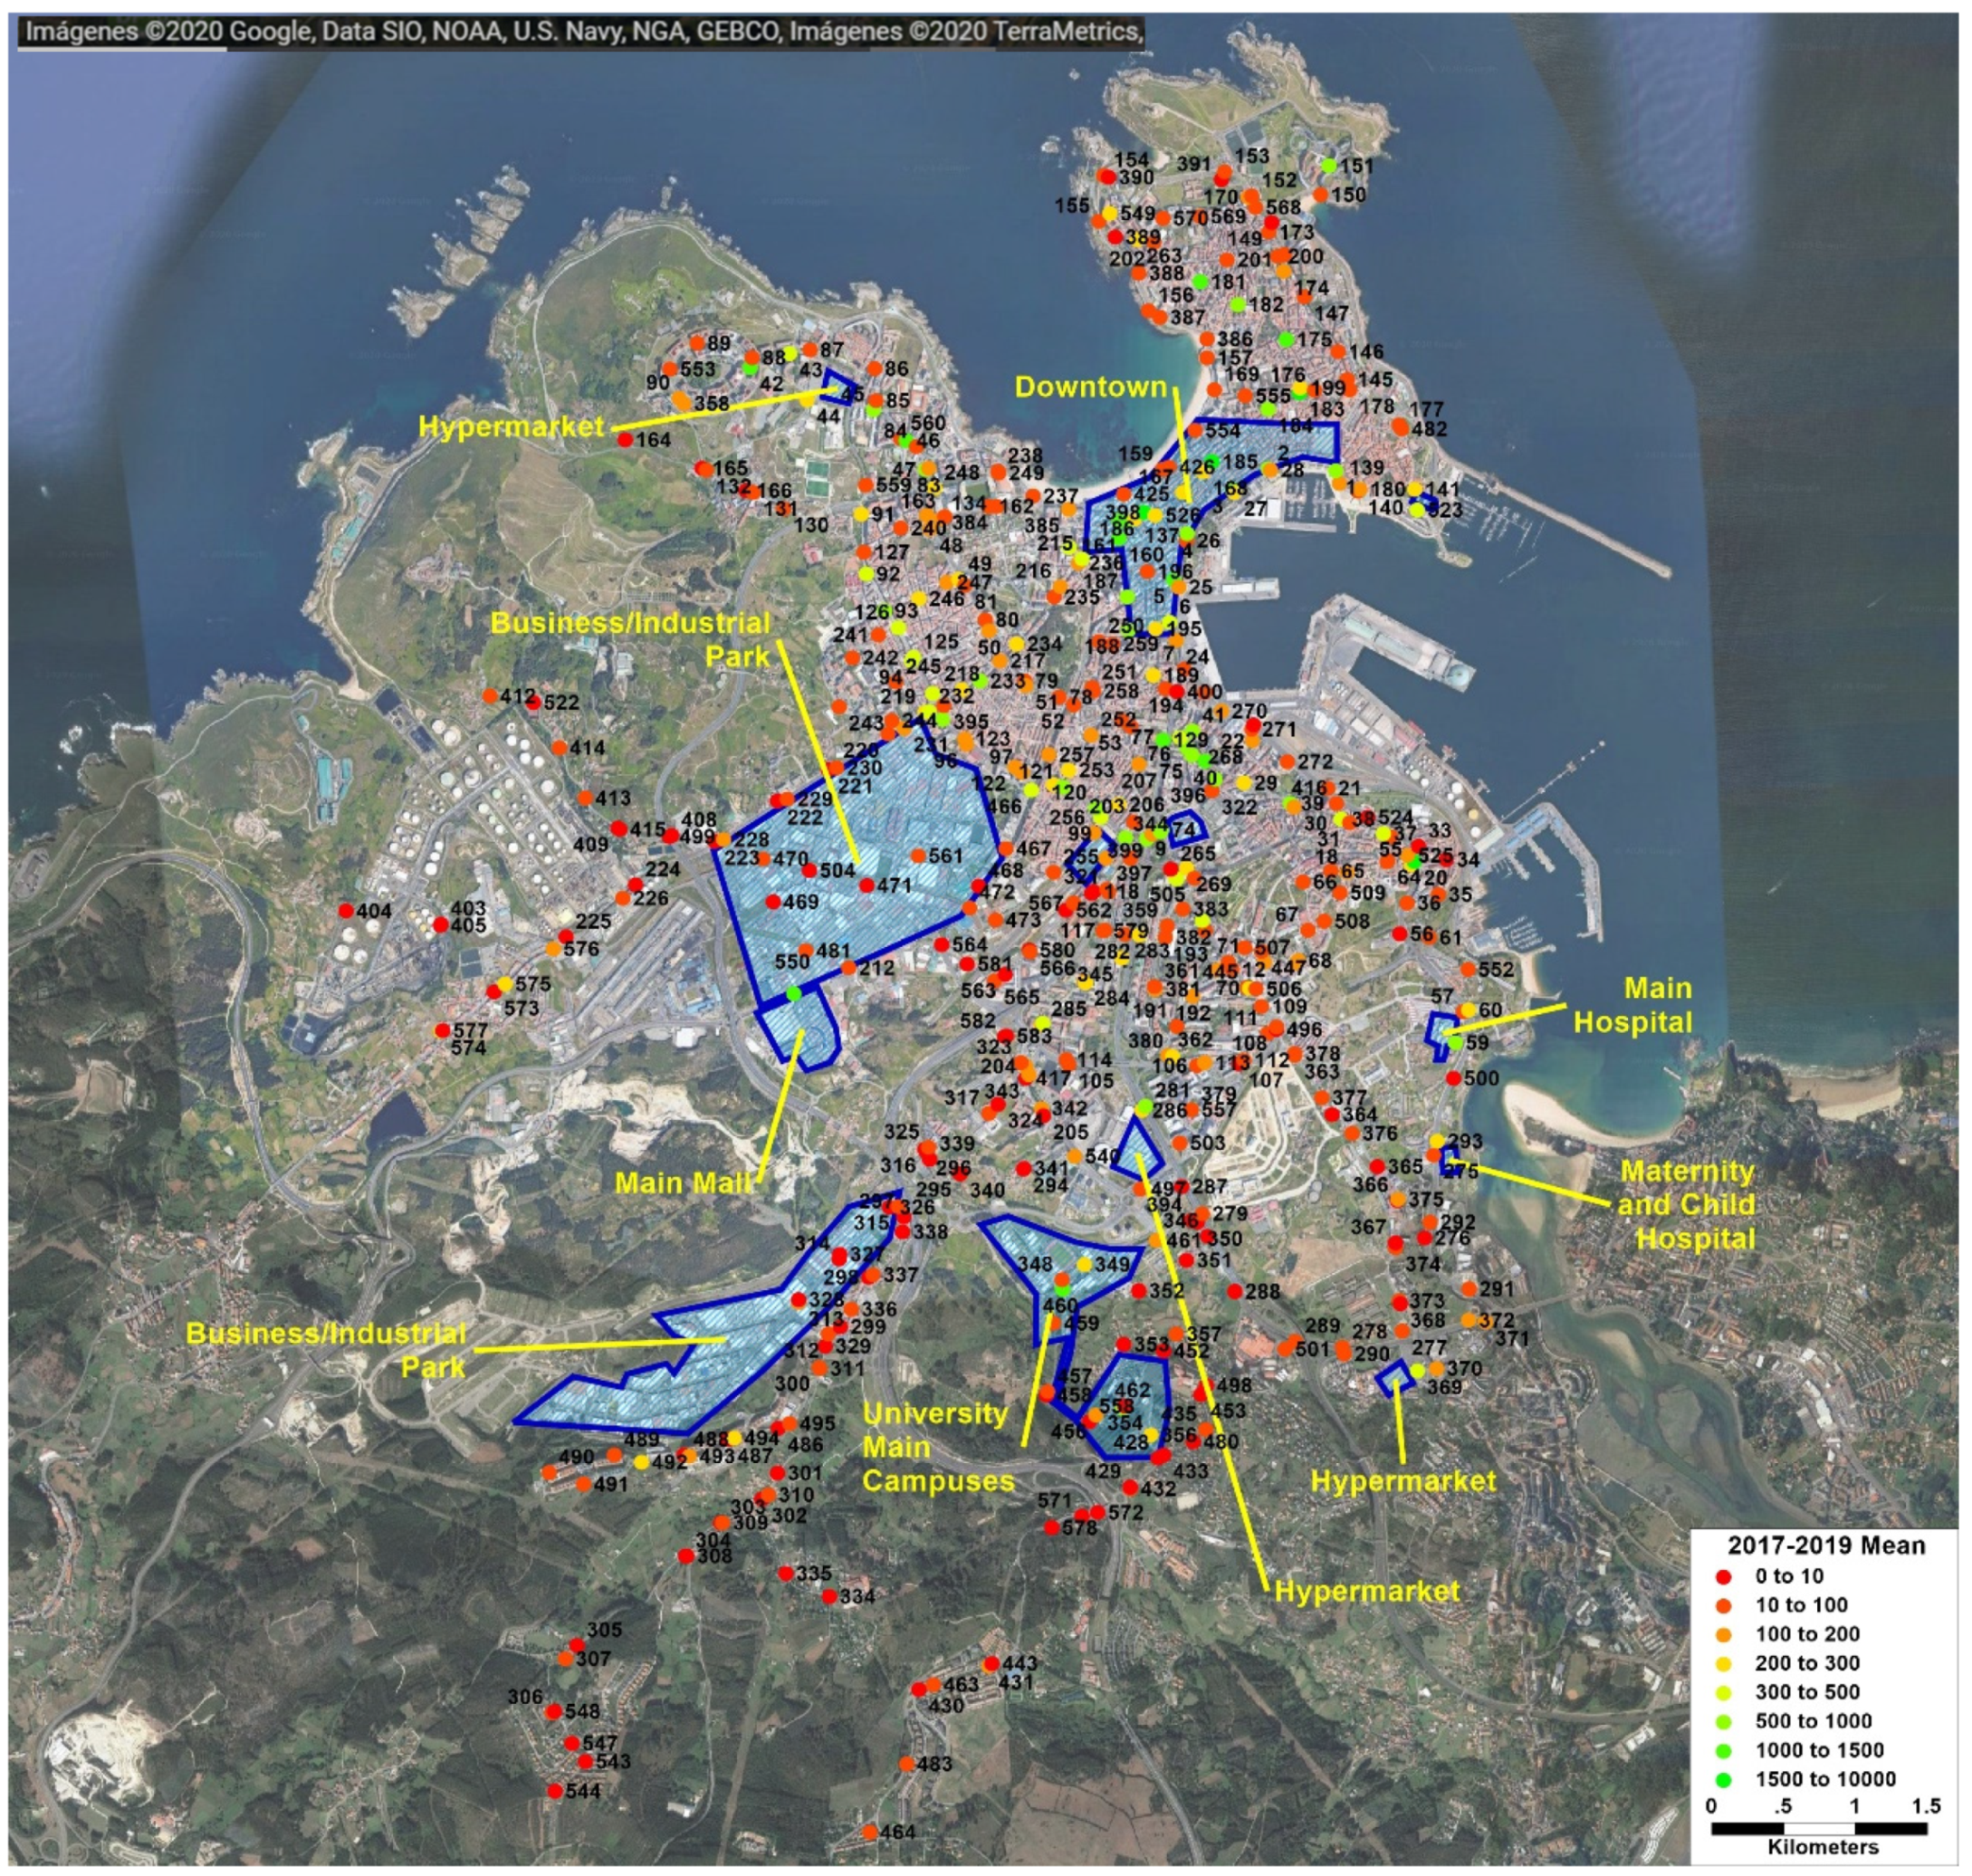
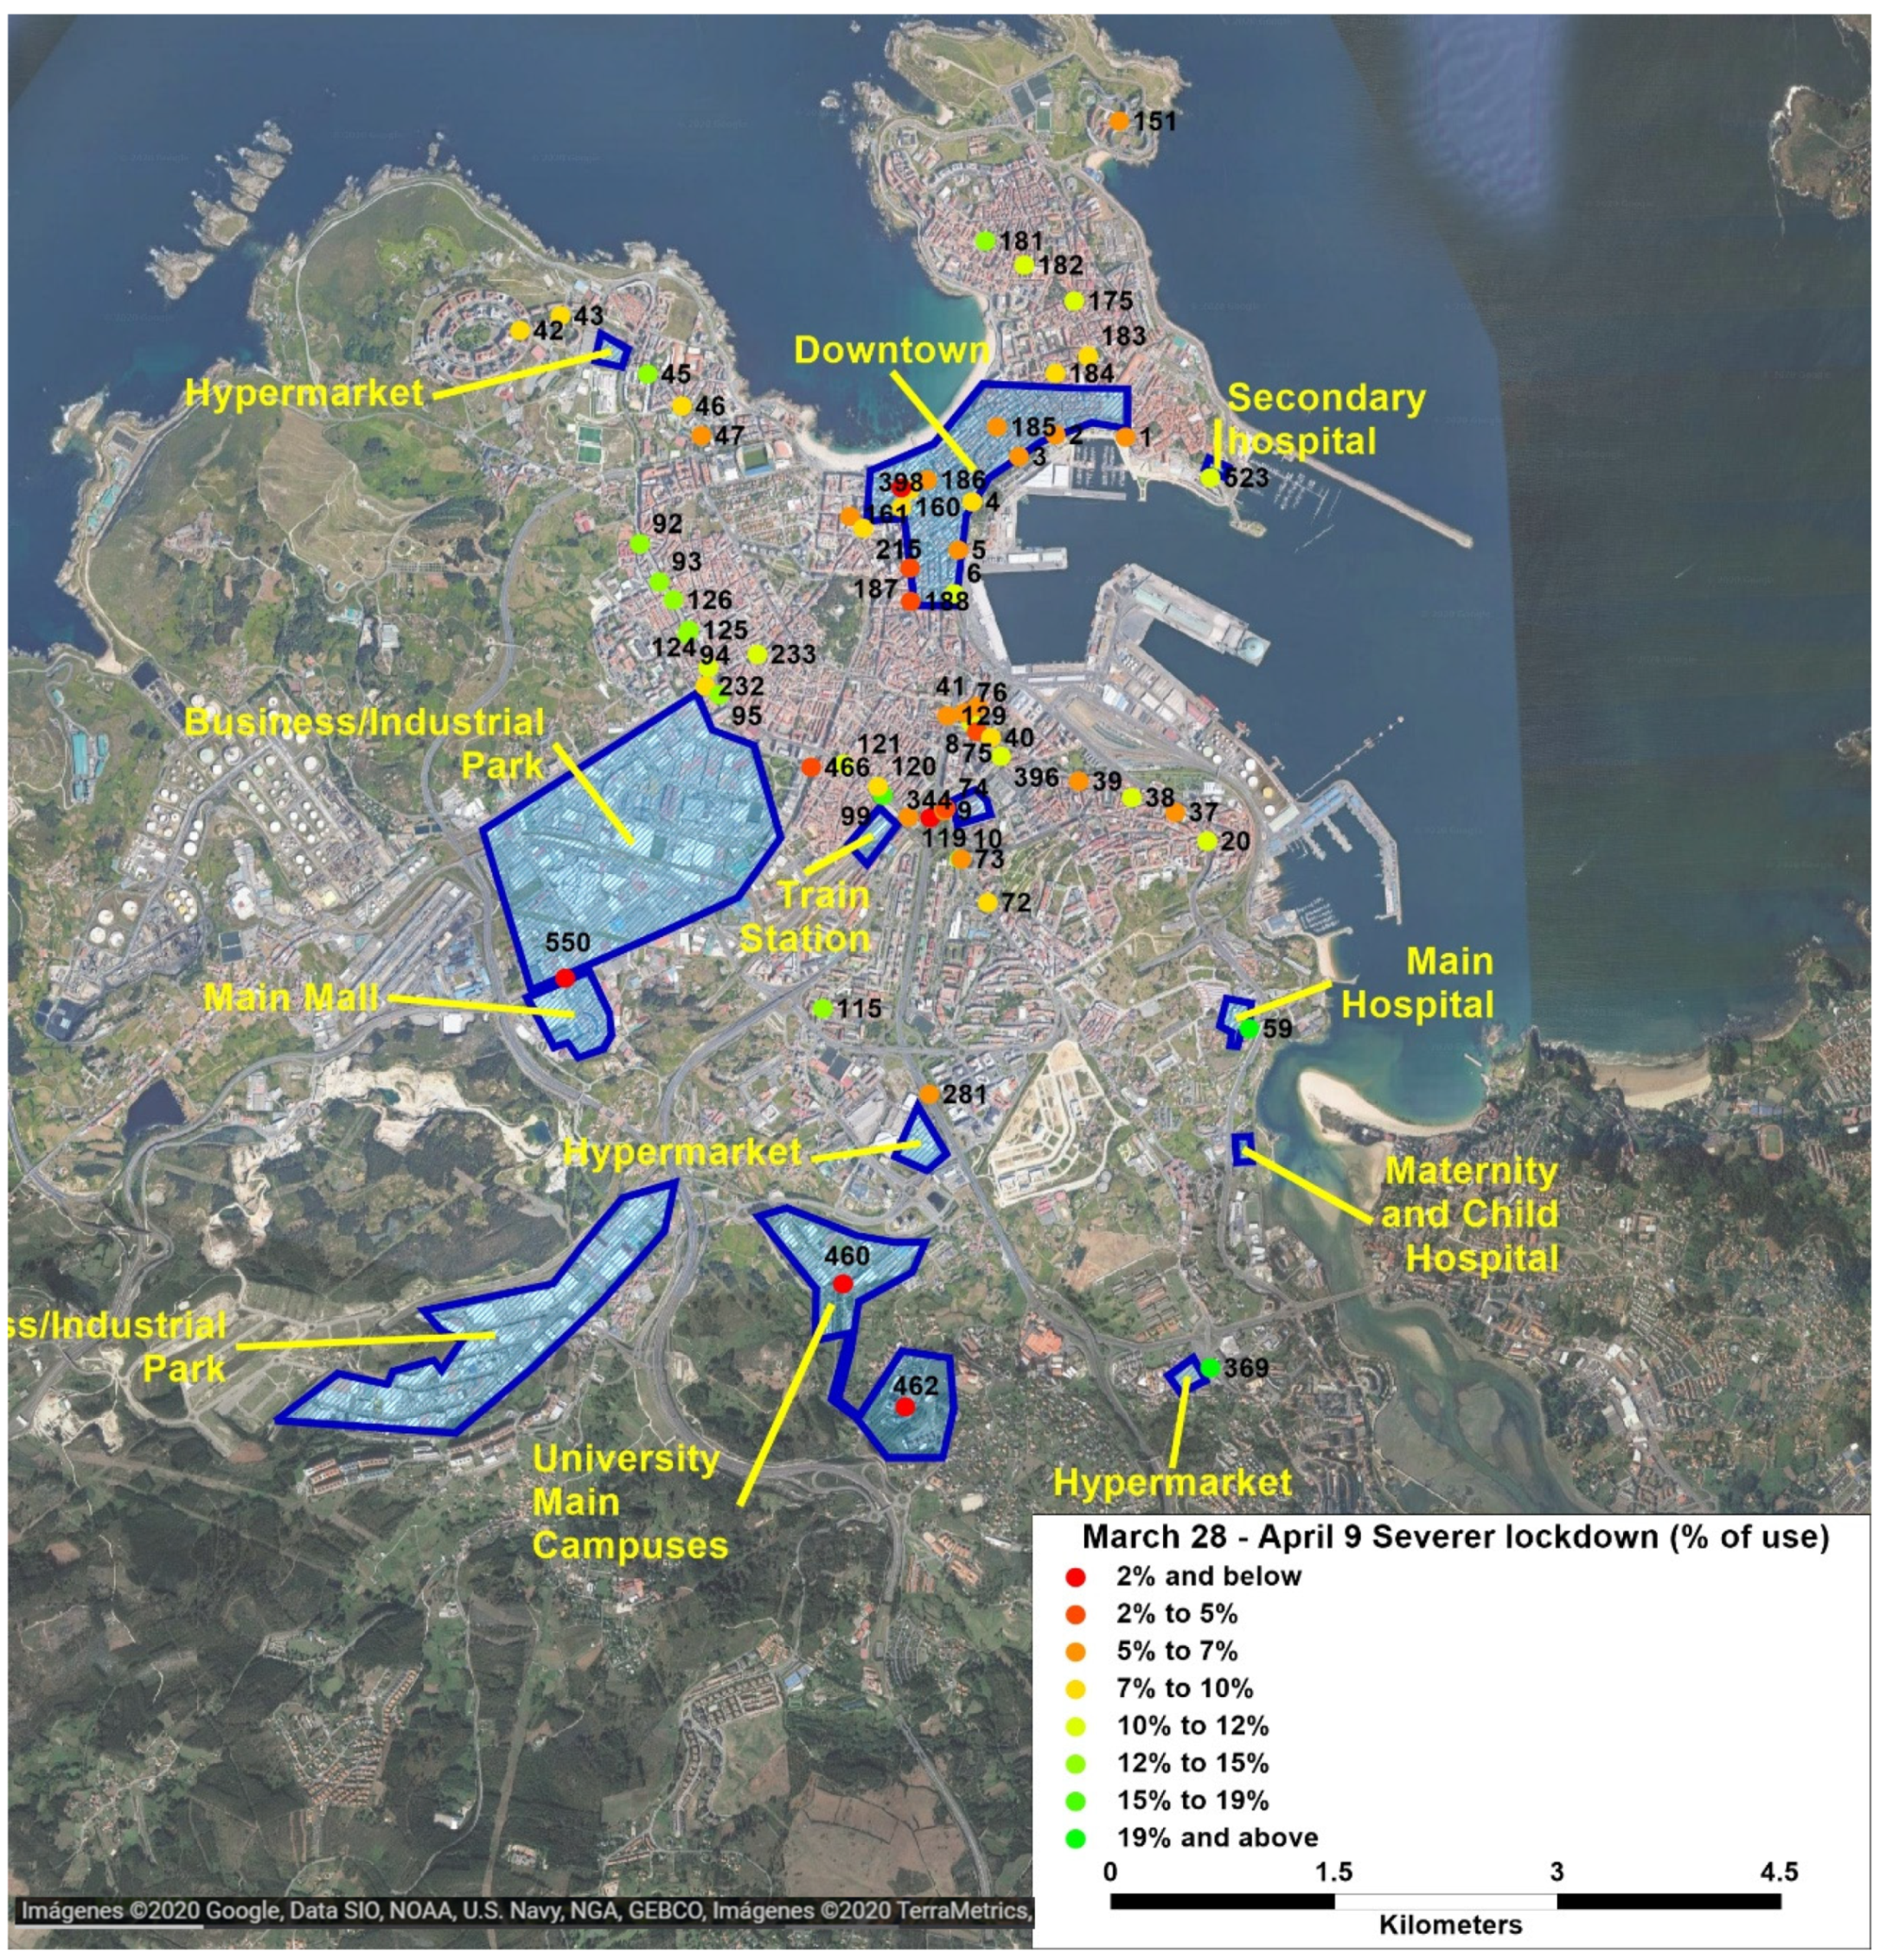
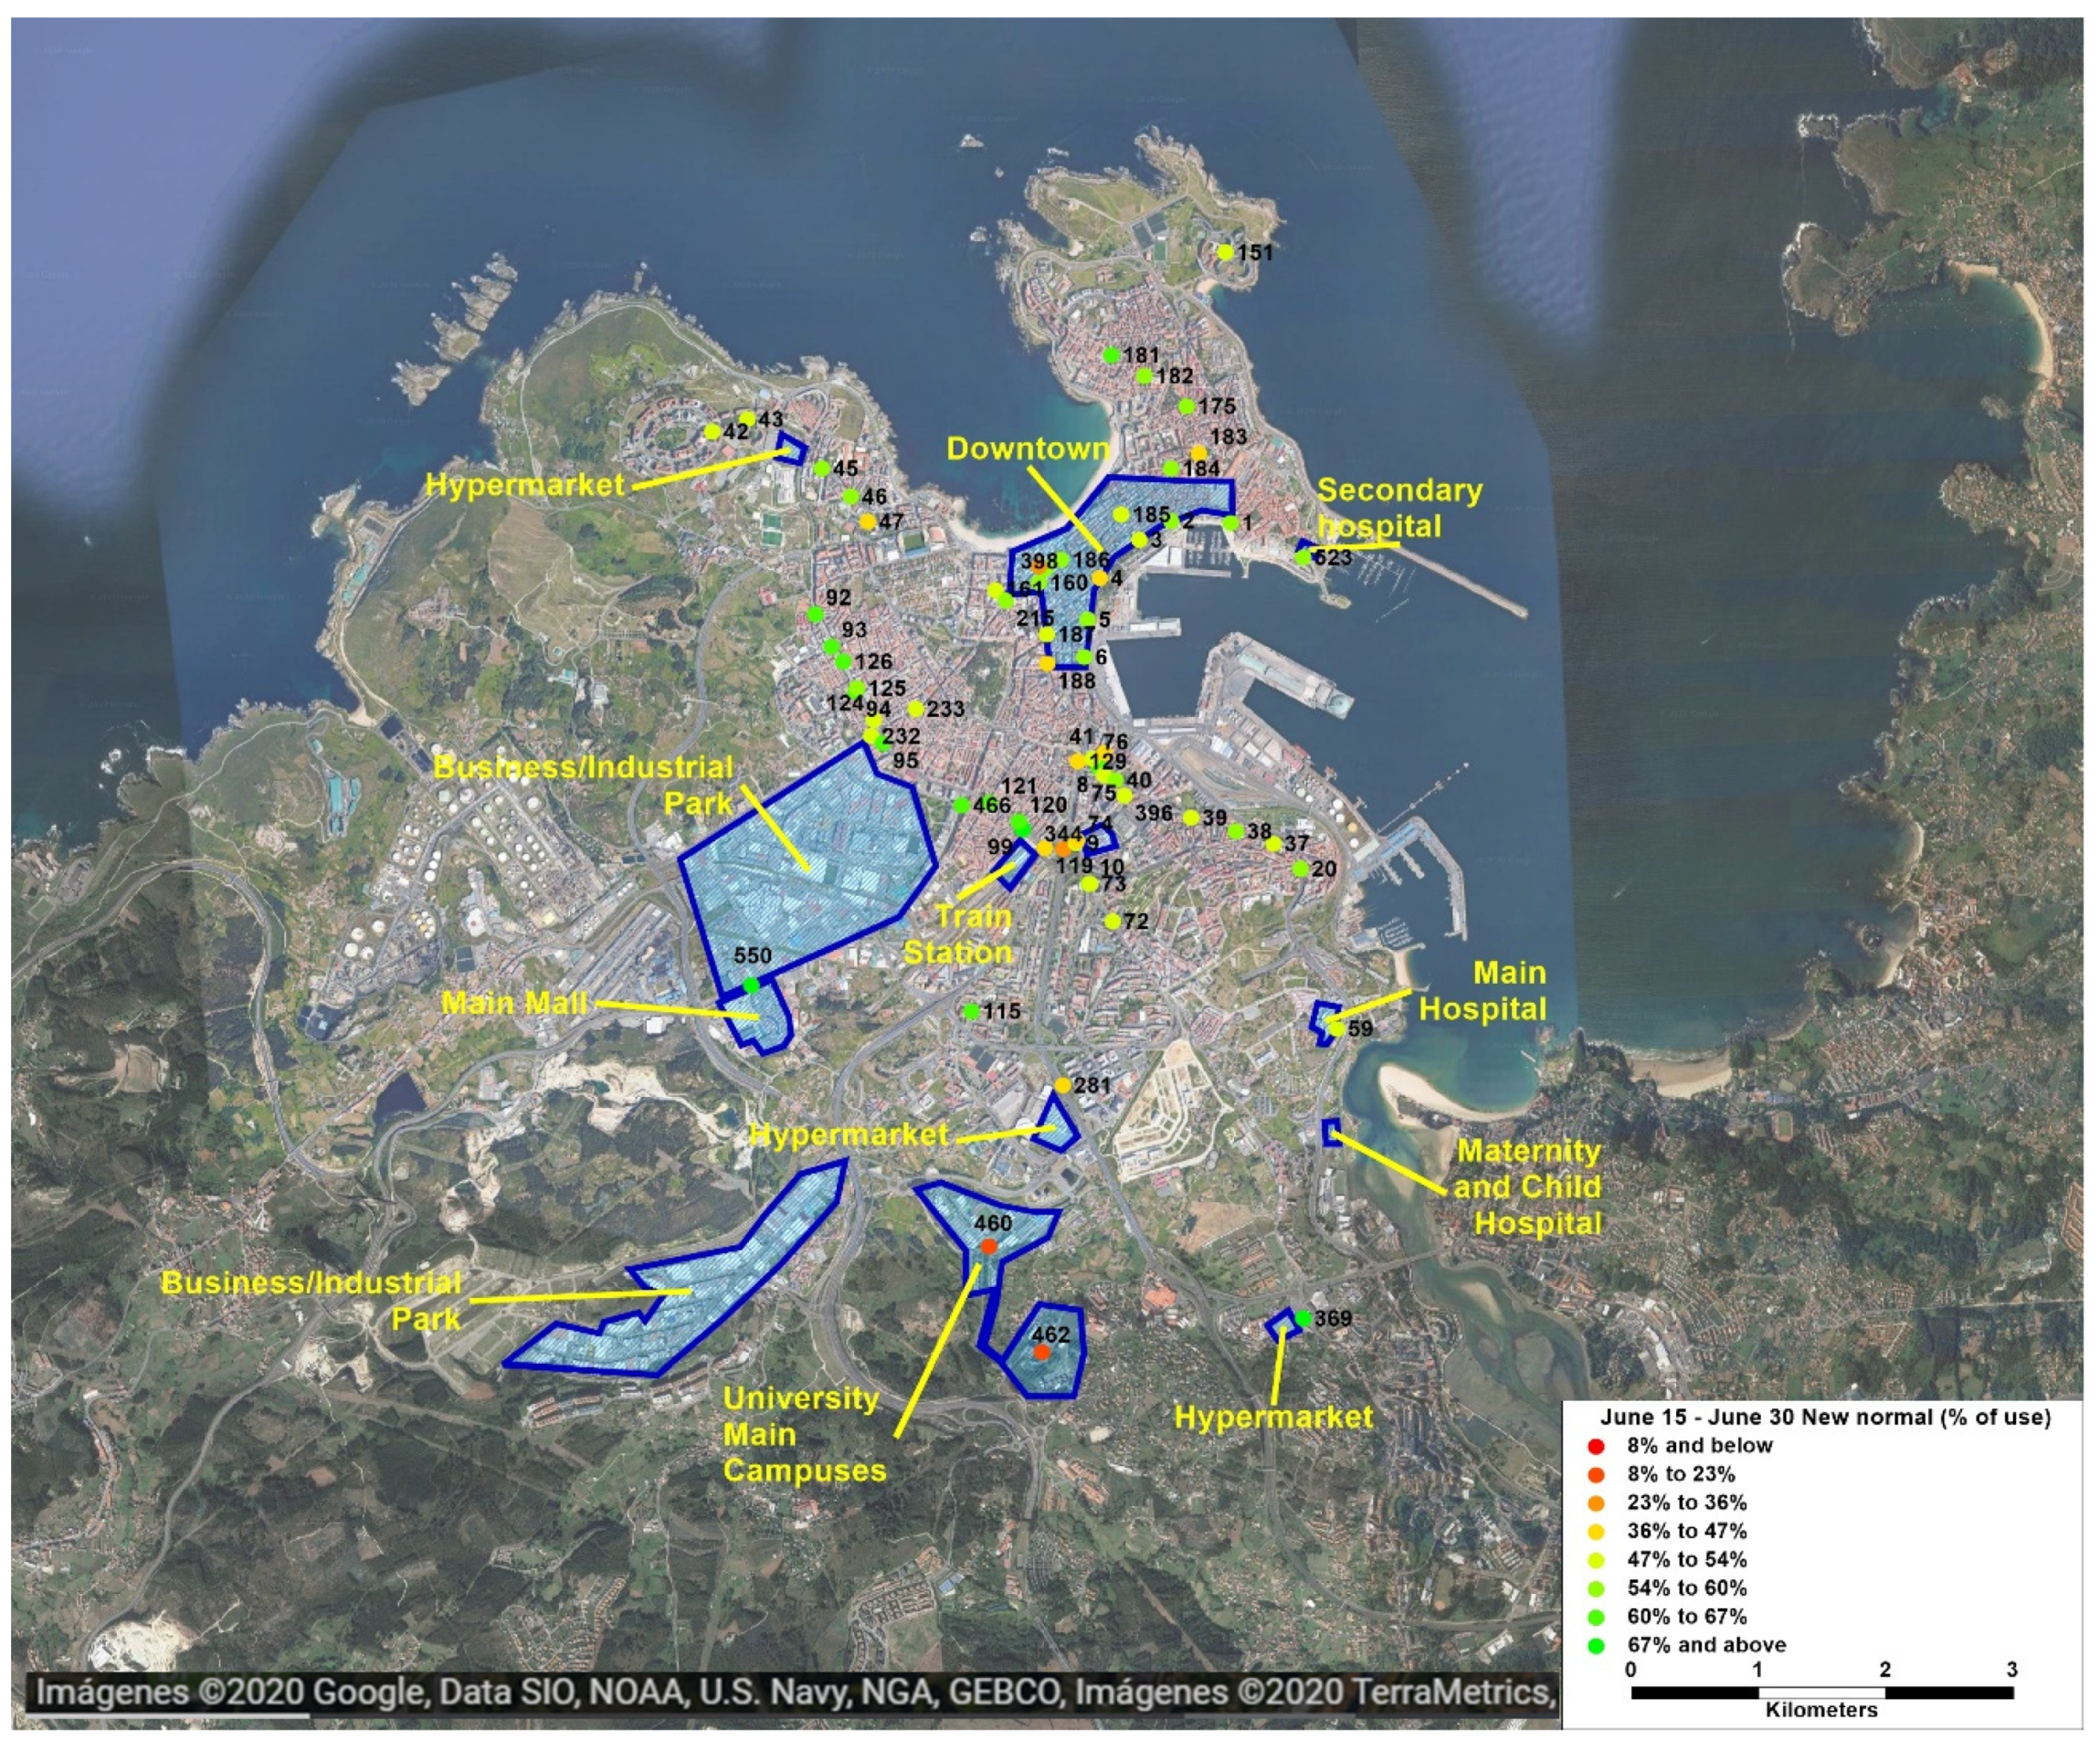
3.8. Analysis of Use of Urban Bus Stops

Although the process affected all stops in the city, there were relevant differences among their demand variation for the different phases of the lockdown and reopening process. In the first half of 2020, there were 464 active stops in A Coruña. After accounting for stops with historical data of previous years, 454 stops were analyzed. A total of 23% of the stops had less than 10 average daily users in NWD for the 2017–2019 period; 63% between 10 and 300 users and 14% over 300 users. Most analyses focused on stops with more than 300 average NWD daily users in 2017–2019 to avoid problems due to insufficient data. Days with unusual conditions, such as works on a street affecting stops during short periods, were not considered in the average calculation. The location of each stop in the city is presented in Figure 13, with a color code reflecting its use in the reference period. Several relevant areas of the city are also shown in the image.
The first half of 2020 was divided into twelve time periods, considering only NWD. Figure 14 shows the 2020 NWD average use percentage in comparison to the reference values, for the most demanded stops. As expected, it showed an analogous behavior to the general ridership curve. The focus of this section was to analyze the differences between stops.
Two periods were selected for detailed analysis. The stops that were more affected by changes in mobility patterns were studied during the severer lockdown. The stops’ recovery was analyzed in the new normal period.
Figure 15 shows the average use percentage in the severer lockdown for the same set of stops. On the one hand, the stops less affected by the lockdown (demand over 15%) were related to the main hospital (#59, 21%), main ring outside CBD (#95, 15%), train station (#99, 17%), and one hypermarket (#369, 21%, only some sections are open for basic needs). On the other hand, most affected stops (demand under 2%) were associated with the university (#460 and #462: 0%) and its line (#398 and #344: 1%) or the main mall (#550, 2%). The activities of these areas (in-person teaching or work at the university, nonessential purchases) were not allowed or were highly reduced in this period. Stops in downtown and other commercial areas of the city presented low use. Other areas of the city with a lower proportion of white-collar jobs and commercial or banking activity presented an intermediate use.
Figure 16 shows the same analysis for the new normal period. The two stops with the worst recovery (#460:12% and #462:14%) were in the university main campuses, which is coherent with the circumstances of activity in the university (virtual exams for most of the subjects, virtual working for some of the employees). The other two stops with 24% (#344) and 36% (#398) of 2017–2019 demand were also part of the university line and were related to transfers to that line from interurban and city lines, respectively (#344 is very close to the interurban bus station, while #398 is the university line terminal at the city center and the main hub for city lines).
The stops with better recovery among the ones analyzed were #99 (67%), located in a zone outside CBD near the Train Station, #550 (Main Mall, 68%), and #369 (Hypermarket, 72%). These figures are less than those for general traffic recovery.
The evolution curves for a selection of stops are shown in Figure 17. It includes all stops over 1000 NWD average users in 2017–2019, in addition to some of the stops highlighted in this section. There was a group of stops with similar behavior among them (#3, #5, #20, #40, #42, #46, #95, #181, #183, #185, #186, and #197). Again, the stops associated with the university line (#344, #398, #460, and #462) were under the average for the whole period. The Main Mall stop (#550) suffered an important reduction during lockdown but a remarkable recovery since reopening in Phase 2. The Main Hospital stop (#59) was among the less affected by the lockdown but remained among the average after Phase 1. The stop associated with a hypermarket presented the best performance (#369). The peak of stop #460 (university) in the 1–12 March period could be due to NWD around Carnival break and March the 8th bank holiday in previous years, which are not holiday days exactly, but university activity is reduced.

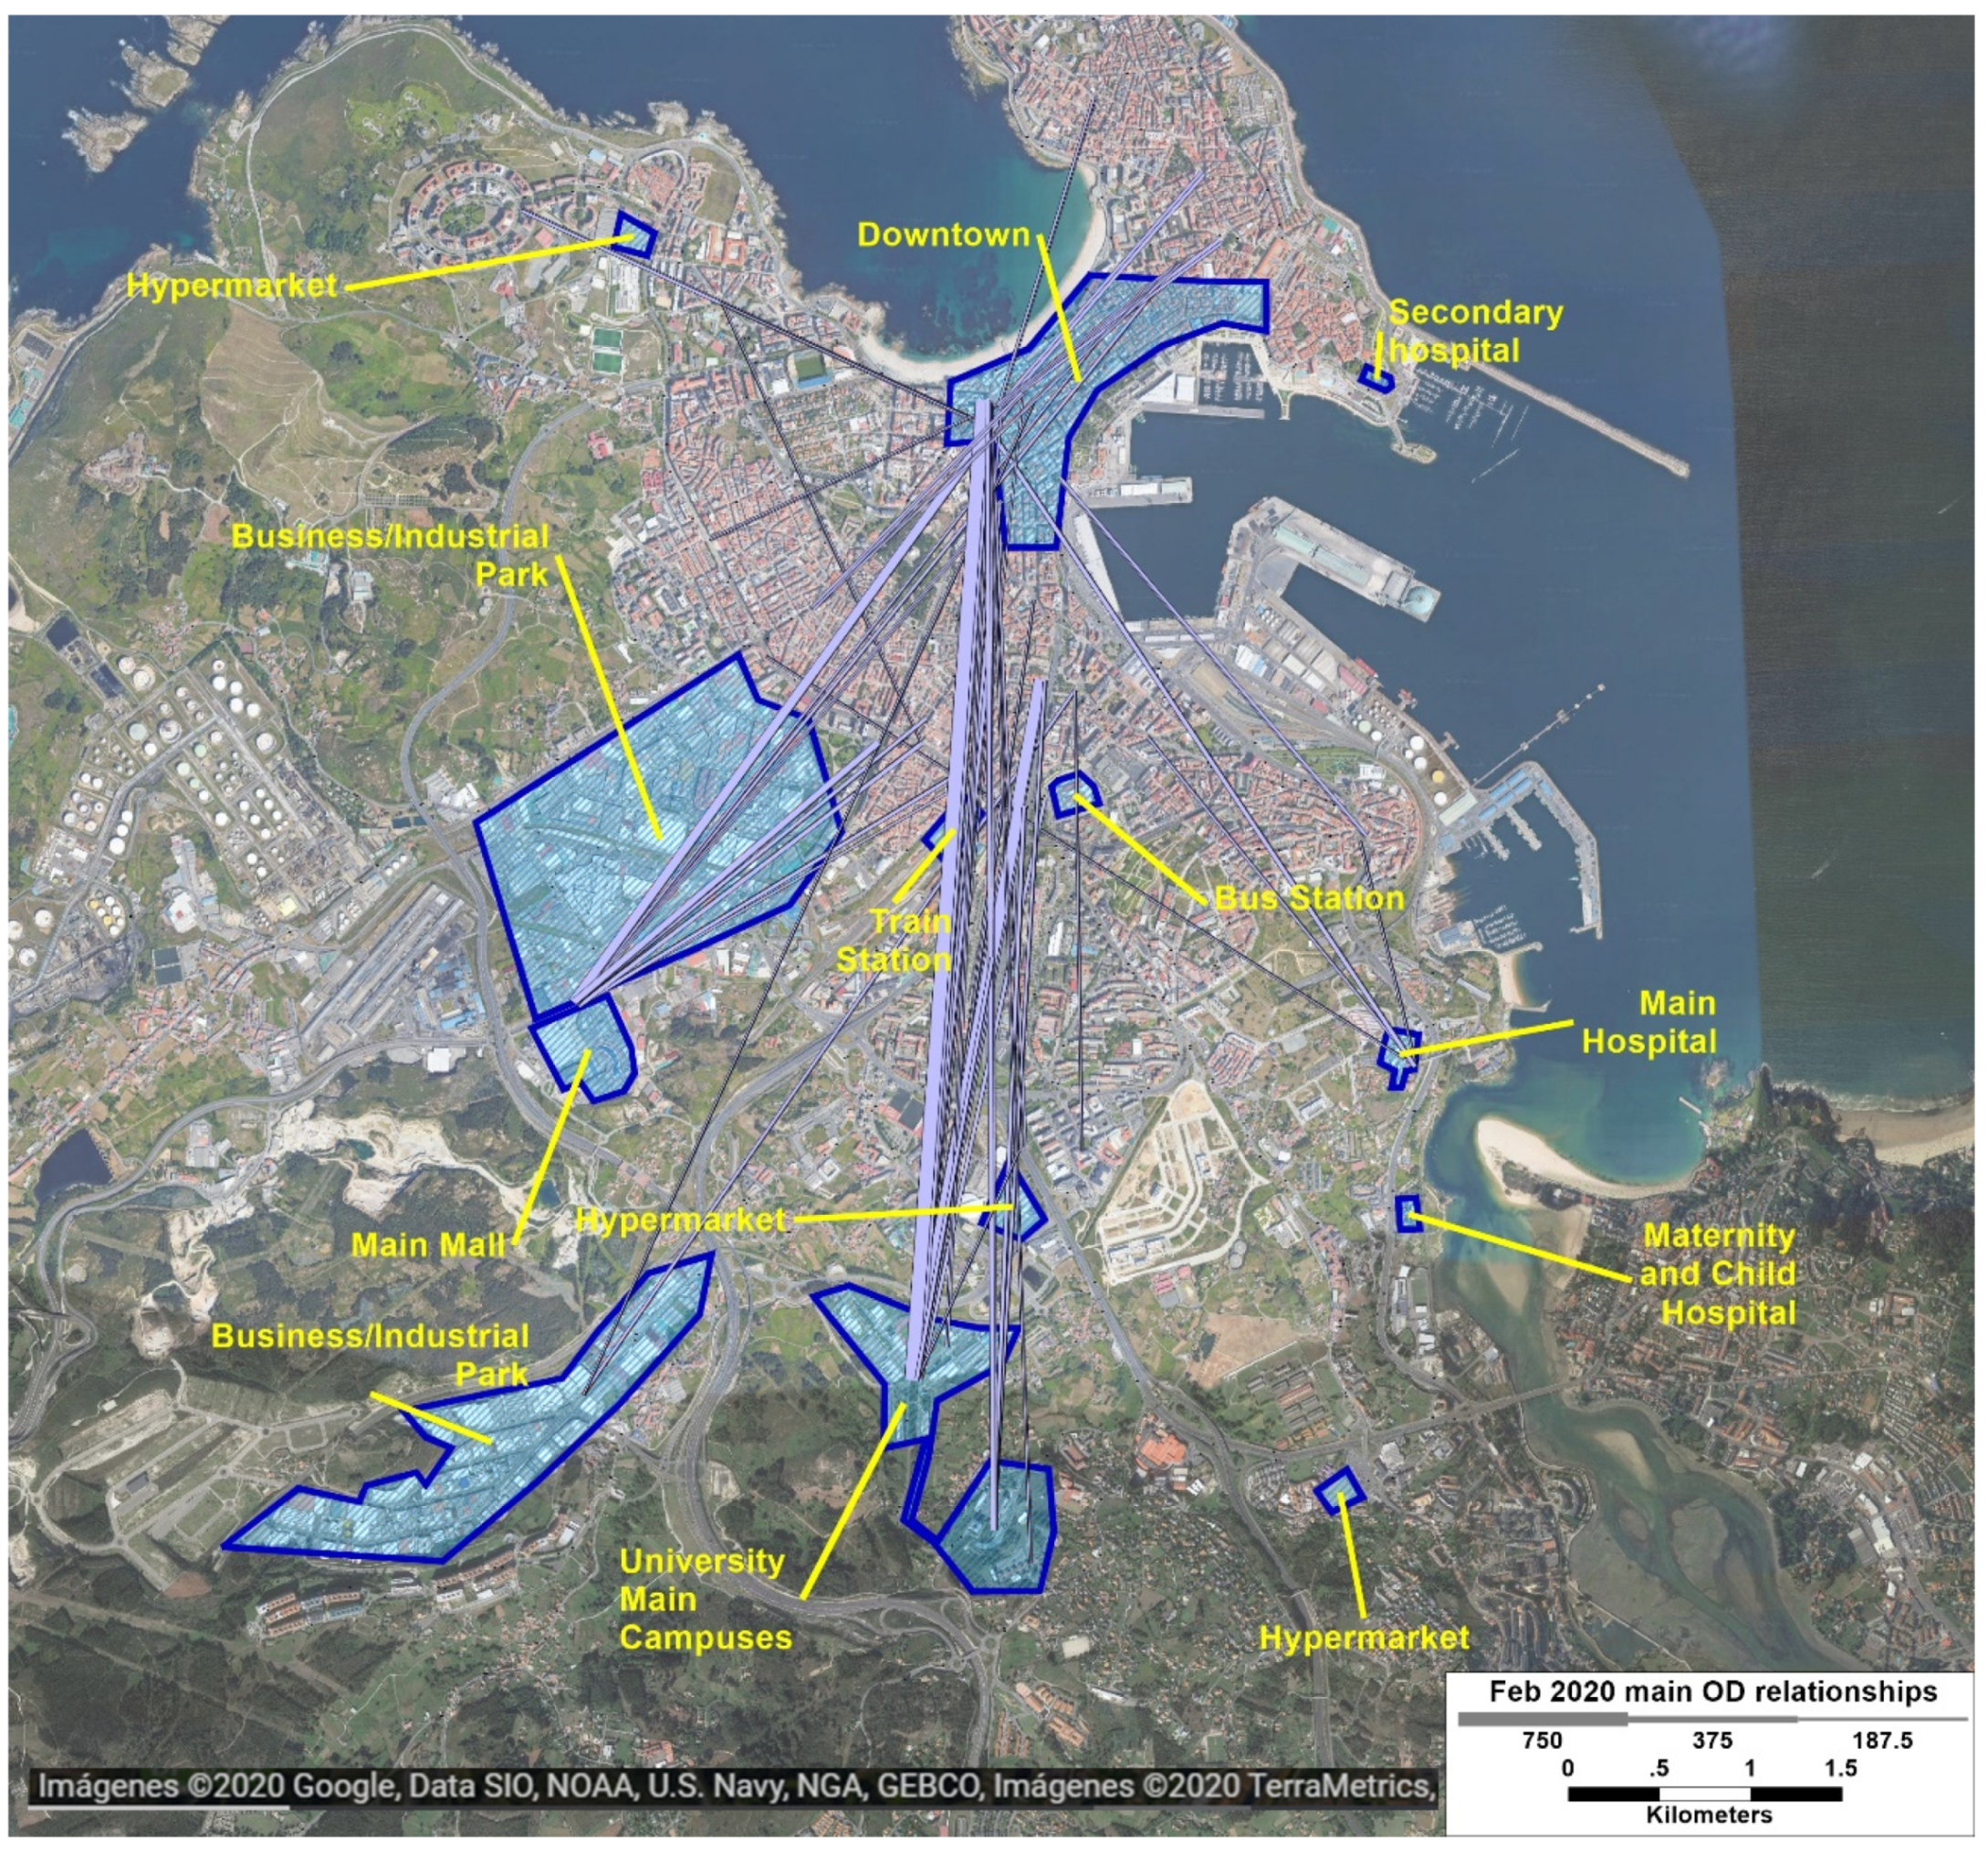
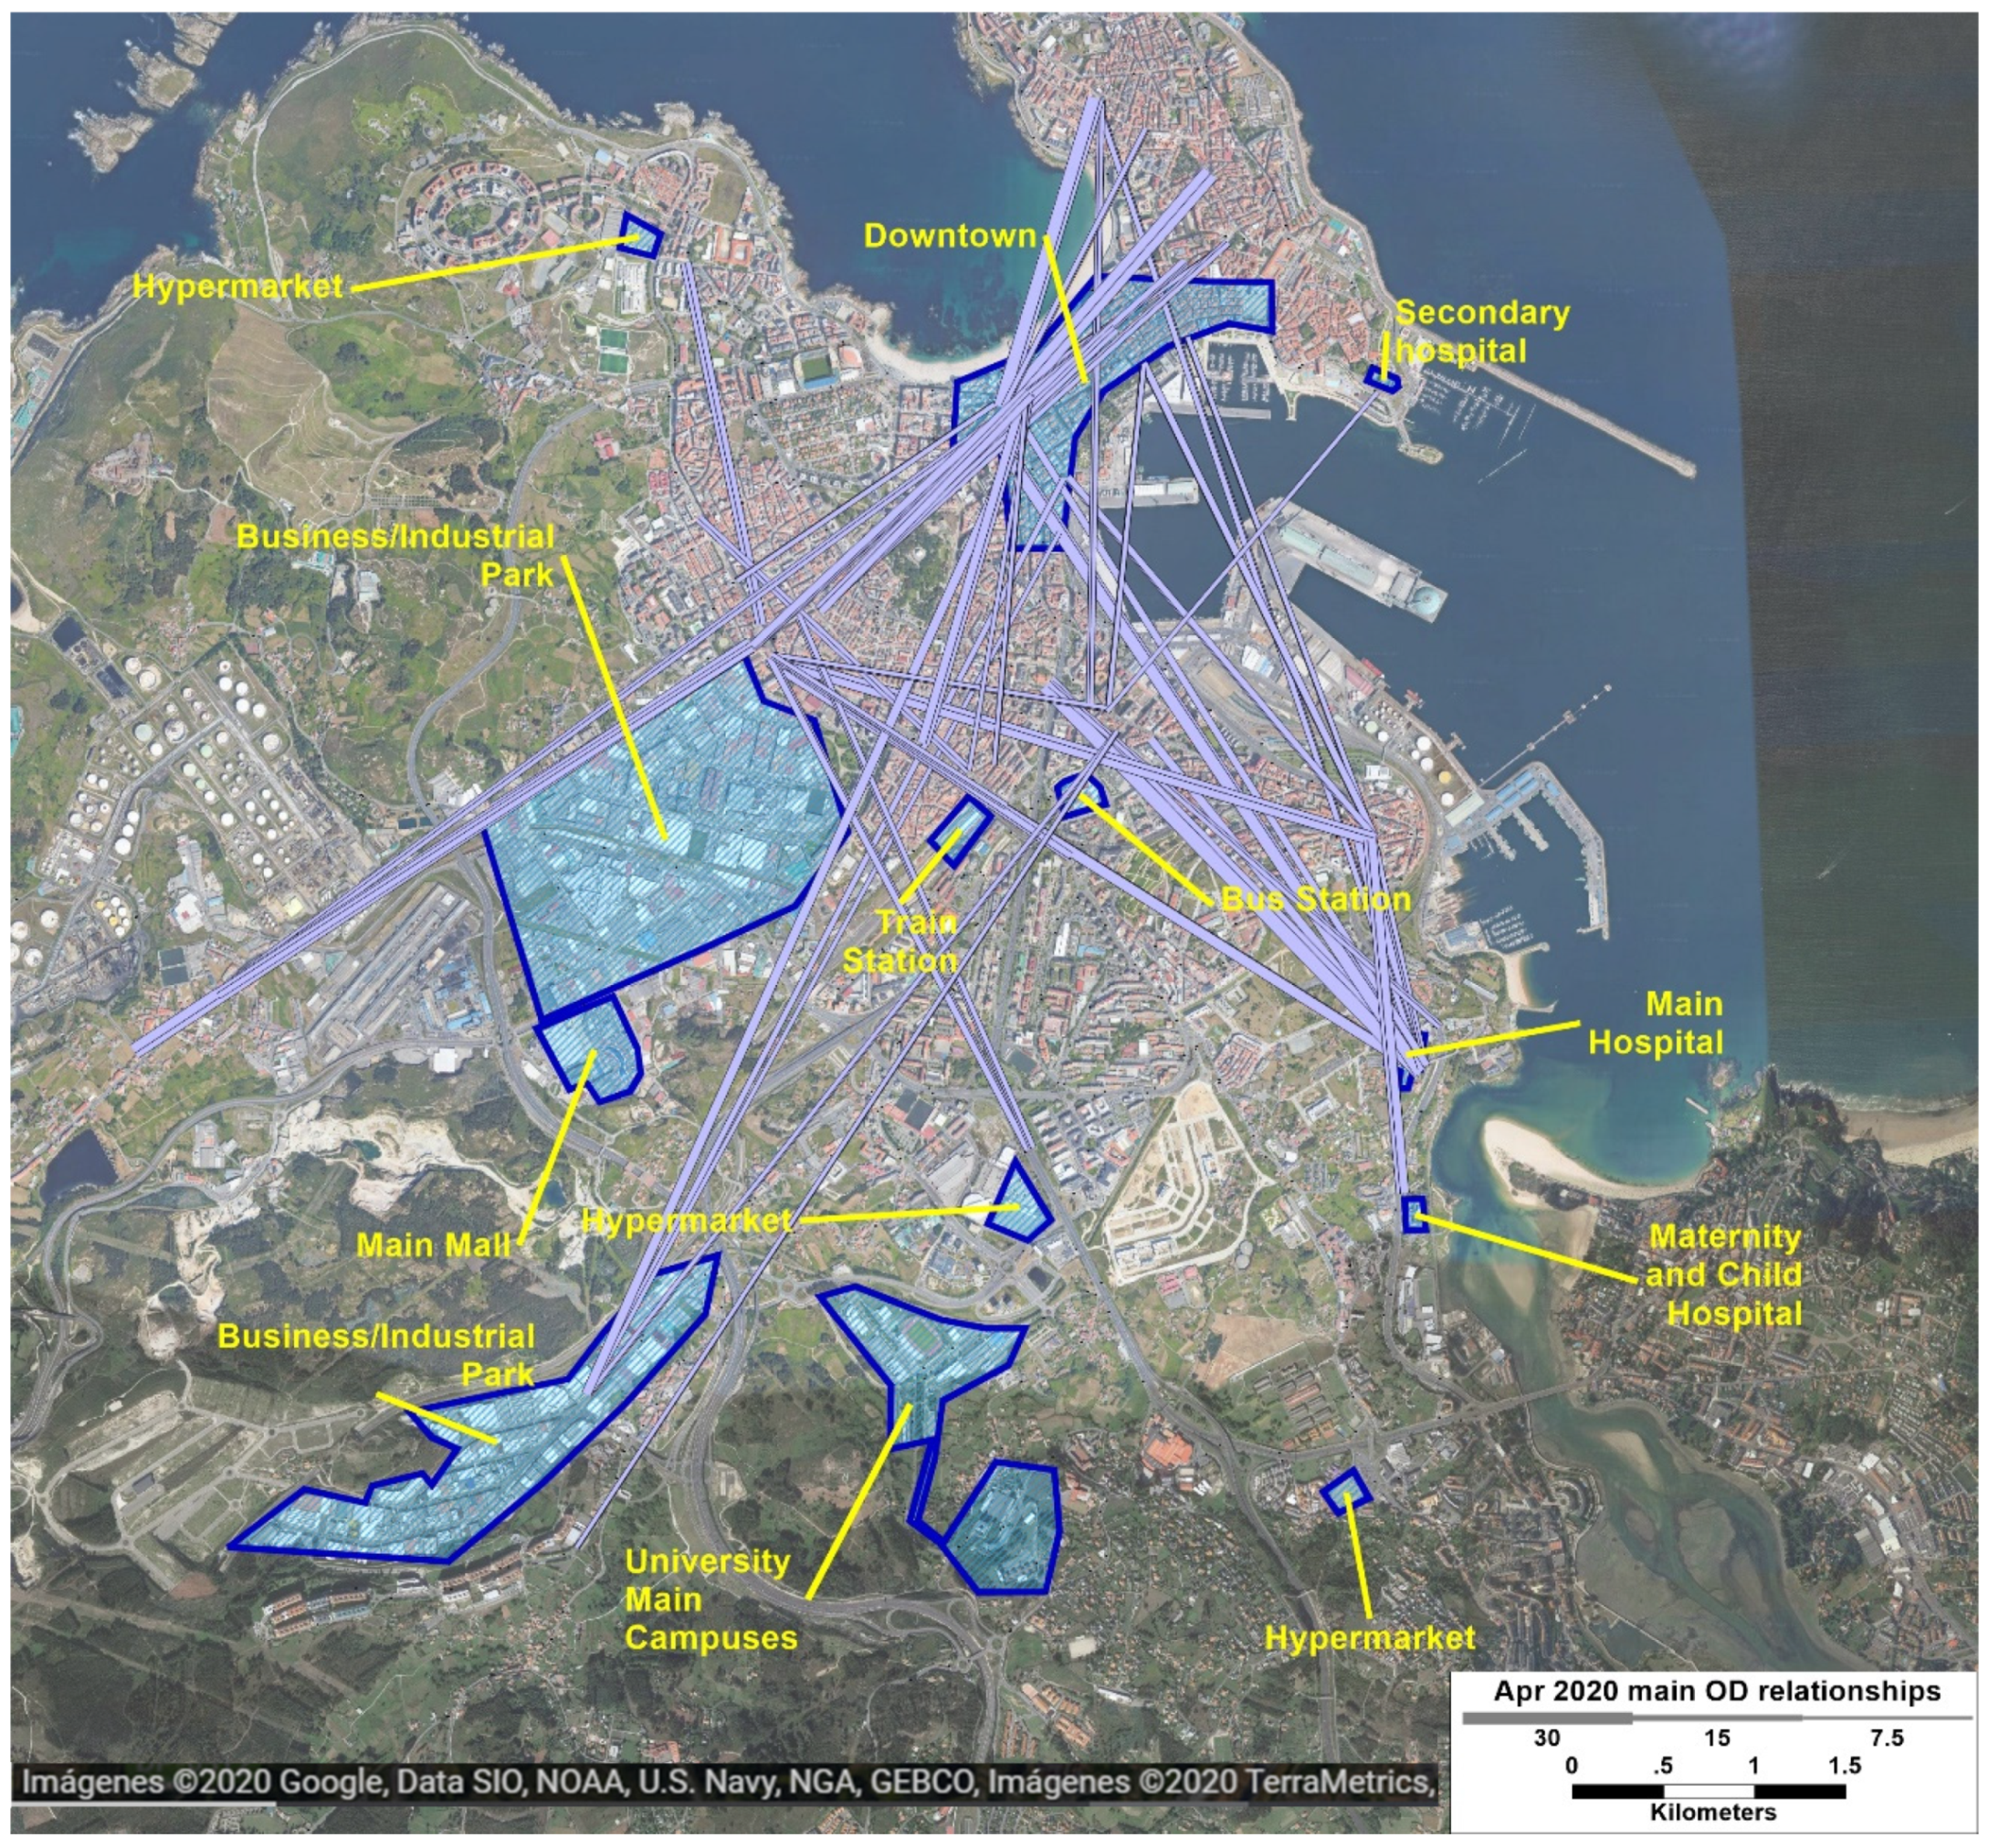
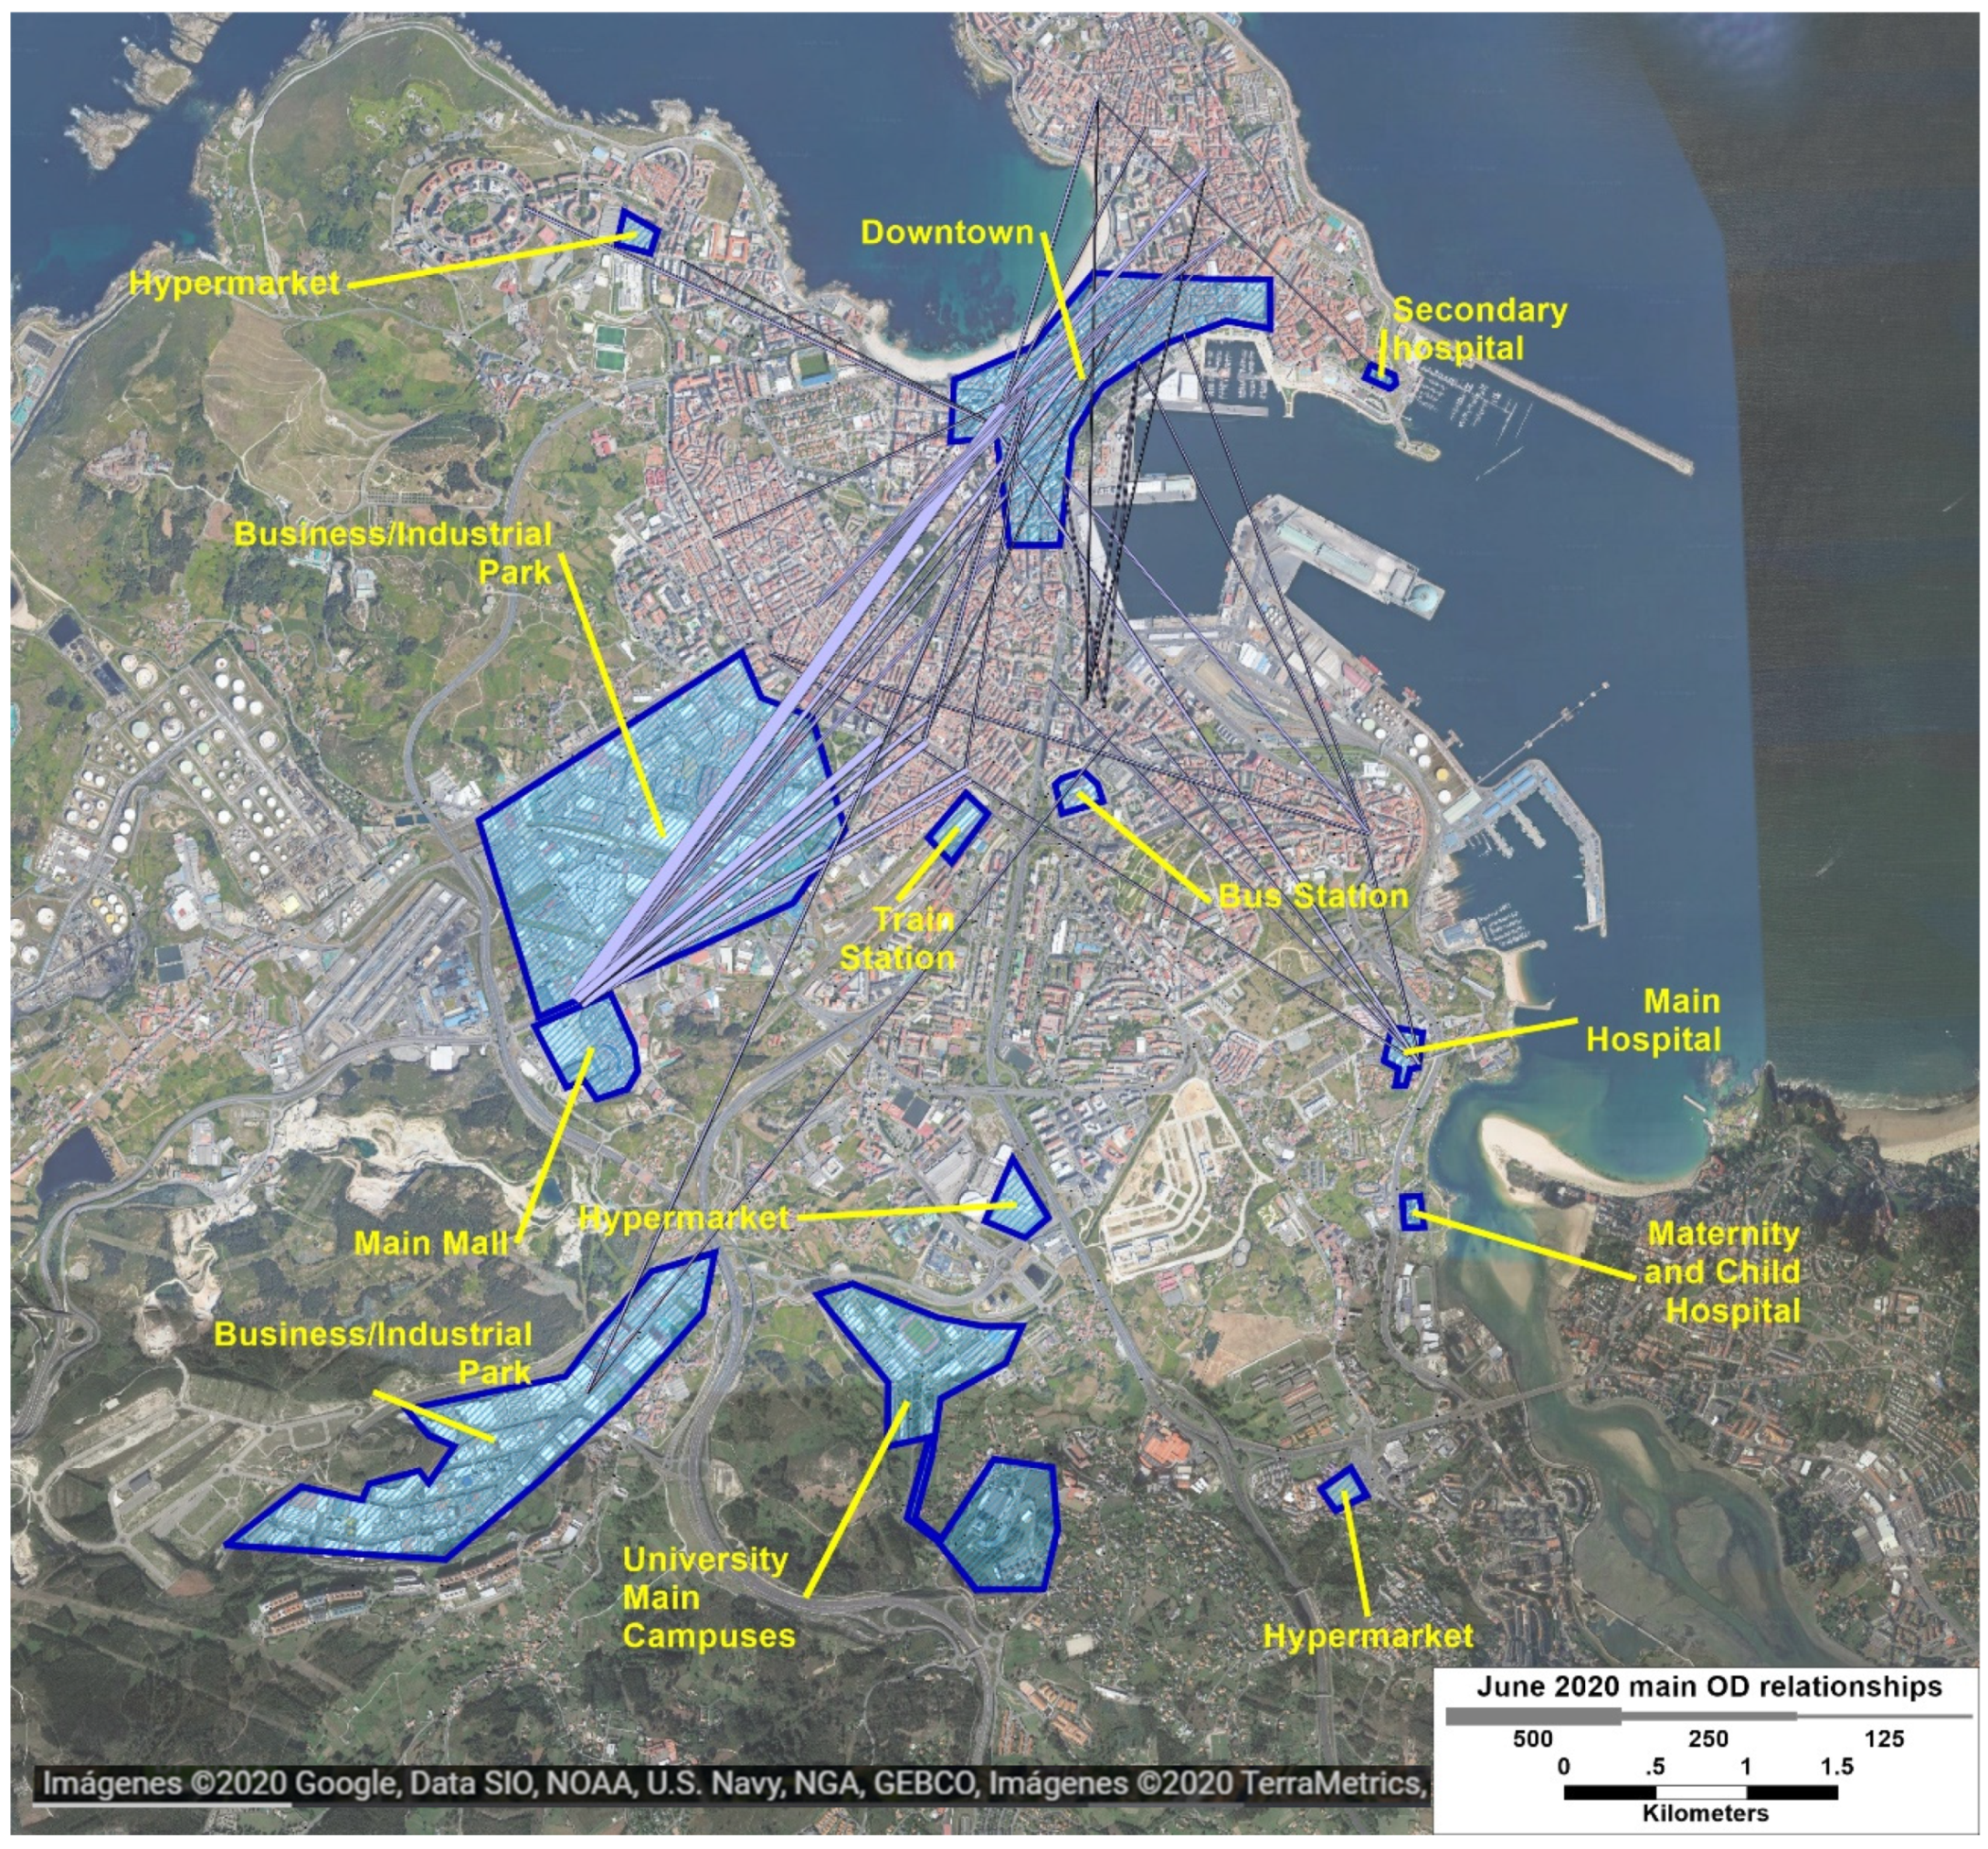
3.9. Analysis of Evolution of Main Transit Flows

The crisis also had an impact on origin–destination (OD) flows across the city. The daily average OD relationships were estimated from smart card information for NWD in February, April, and June 2020. These months characterized the situation previous to the COVID–19 outbreak, the lockdown, and the progressive transition to the new normal situation. Users with two validations for different stops on the same day accounted for 15.9% of the total number of users in February 2020, 21.0% in April 2020, and 16.1% in June 2016. These two validation users were taken as a sample of the whole user population at a stop level to estimate total flows. This sample could be biased due to the different penetration of smart cards among users and the differences in mobility patterns between those who have or do not have a smart card. However, since the criterion was homogeneous throughout the three periods analyzed, it was considered a suitable approximation to the OD evolution.
The 0.025% larger values for each period were considered for the graphical representation of these flows as the main OD relationships. They accounted for 52 of a total of 208,849 OD pairs in February, with 100 or more average daily trips. Only 4.8% of the pairs had more than 1 average daily trip in this month. As stated in previous sections, during April 2020, there was a drastic reduction in mobility, and only 0.99% of the OD pairs had 1 or more daily average trips. Relationships with 10.7 or more average trips represented the percentage considered (0.025%). In June 2020, a significant recovery of mobility was achieved, and 2.86% of the matrix cells had 1 or more trips. The 0.025% threshold represented 42.1 daily trips in this month.
Figure 18 shows the main OD relationships in February 2020, representing the usual situation in the city. Main flows connect downtown and the train and bus stations area with university main campuses and the main mall of the city. There are relevant flows to the main hospital, connections of the neighborhoods with the city center and trips to the Business/Industrial Park in the South. The biggest flow of 750.5 daily average trips links the city center (stop #398 in Figure 13) with the university (stop #460).
Figure 19 presents the situation during the lockdown. The normal situation’s main flow practically disappeared as malls were closed, and in-person activities were canceled at the university. As stated in previous sections, the university line that serves stop #460 was canceled during the whole month. The most important flow in April was 34.2 daily average trips to the main hospital (stop #129–stop #59), which amounted to 35.7% of the trips in this relationship in February 2020. The flows were minor and spread across the city, with relevant participation of the main hospital.
Figure 20 shows the situation in June, comprising the last phases of the reopening and the beginning of the new normal. The reopening of the main mall made it the destination of the largest flows. The highest value was 401.6 average daily trips from stop #186 (downtown) to #550 (main mall), amounting to 80.9% of the February value. The University remained with virtual working and exams (mobility to the university usually decreases in June as students only attend exams during this month). In any case, the flow between stops #398 (downtown) and #460 (university) was 23.8 average daily trips, while in June 2019, it was 252.1. The hospital remained a relevant attractor of trips but with a much lower relative weight: #129–#59 daily trips were 55.0 (57.5% of the February value).

3.10. Impact on Bus Operations

The process also affected bus operations. Supply reductions led to an increment in headways and, consequently, in waiting times. Conversely, general traffic and demand reduction led to improvements in travel time and reliability that are analyzed in this section.
Figure 21 shows a comparison of the daily average journey time means throughout all lines, in relation to NWD average value for January 2020. In this case, the comparison in relation to the 2017–2019 5-NWD centered moving average did not seem appropriate, because traffic conditions differ significantly along years, with an effect on journey times. It was checked that journey time did not differ appreciatively along the year for lines that were not affected by works or other events.
The figure shows how the journey time mean started to decrease a few days before the initial lockdown (probably due to the same reasons as for the demand decline stated previously), stabilizing around a value of 75% until Phase 1, and then increasing to a value of around 93–94% at the end of June. The decrease in journey time during the lockdown was due to the decline in traffic (less congestions led to faster trips) and ridership (less demand led to lower dwell time at each stop). Journey time has not reached a 100% value due to the fact that traffic volume, and especially ridership, have not yet undergone a full recovery.
Figure 22 is also related to journey time, and in this case, it presents the daily average standard deviation of journey time throughout all lines, in relation to the average standard deviation for January 2020 NWD. It is an indicator of bus reliability, which is an important factor in mode choice. The figure shows how the standard deviation (that is, the variability) of journey time decreased to values around 70% in comparison to January, during the lockdown until Phase 1 of the reopening, increasing again steadily until around 90–95% in the new normal. The decrease in the variability of journey time was due to the traffic volume and ridership decline.

4. Discussion and Conclusions

The COVID–19 pandemic has profoundly affected human lives. Mobility suffered large impacts during lockdown processes that are well worth studying. It is even more important to analyze and understand the recovery of mobility during the reopening process and the new normal period to forecast the future evolution and needs for transport policies and planning. Plenty of efforts have been made in recent decades to promote public transportation, but the path towards sustainable mobility can be jeopardized by the fear of contagion when using transit.
To perform a fair comparison of urban mobility during the lockdown, reopening process, and the new normal period, a careful definition of baselines was established. These baselines are based on the centered moving average for several equivalent days in the three previous years to avoid seasonal and day of week effects that could be present in other studies.
Several conclusions can be drawn from the analysis of the detailed data of transit use in the city of A Coruña. The impact on use of transit during the lockdown process was larger than that on general traffic, coherently with the process observed in other cities. Bus use values were 8–16% of those related to the equivalent period of 2017–2019, while general traffic values were 23–38% of previous ones in the same time frame. This can be due to several reasons, such as fear of contagion, reduced traffic jams, suspension of fees for parking on streets, and easier to find parking spaces. The reduction in supply during this period could also have affected ridership, but this may have been partially offset by a reduction in travel times and improvements in reliability.
The process of reopening in Spain was developed in four phases until returning to the new normal situation. The recovery of transit use was lower than that for general traffic and shared bicycles, as expected due to the tendency to avoid crowded conditions and close-range contacts with unknown people. In the new normal situation, at the end of June 2020, general traffic and shared bikes had risen to around 85%, while transit reached only about 60% of the use in the previous reference period. At that moment, bus supply had completely recovered, and travel time and reliability were higher than usual. This change in modal share is relevant despite the better attributes of the transit system.
The impact on city bus demand is not uniform across stops and OD flows, but it is of concern for sustainable mobility achievement. Detailed analysis by lines shows differences in the impact of lockdown and reopening situations. Ridership during the lockdown process plummeted to a range from 6 to 20% of reference values for the different lines. Nevertheless, except for special cases due to specific changes in supply, the range of variation during the reopening process and new normal period remains analogous to that of the previous situation, despite differences in the supply between lines.
Differences in use are larger at the stop level, and they are related to activities near the stop location, as expected. During the severer lockdown period, stops in malls and universities practically disappeared, and stops in downtown and other commercial areas presented low use. Conversely, stops associated with the main hospital and essential purchases, presented a lower impact, maintaining values in the range of 15 to 21%. In the new normal period, important differences remain in relation to the period before the COVID–19 outbreak. Stops associated with hypermarkets and the main mall in the city regained about 70% of previous use, while those related to the university line remain between 12% for campus stops and 36% for other stops with significant university activity. Nevertheless, even the stops with better figures present values clearly below the general traffic recovery, which is a flawless indicator of the problem’s relevance for sustainable mobility. The analysis of OD flows allows the identification of changes in mobility patterns along the studied period, reinforcing the conclusions of the stop analysis.
Although these main trends are expected, it is relevant to present accurate values of reduction and recovery, that will allow future comparison across different cities in order to research differences and possible strategies to improve transit recovery.
There is a need for research to associate impacts on mobility with specific activities and users to better adjust future policy measures to promote the return to public transportation. In addition, restoring confidence in transit is critical to improve sustainable mobility from now on. On the one hand, adequate information campaigns about COVID–19 related measures should be implemented. On the other hand, findings about the real risk of public transport use should be disseminated among citizens.

Author Contributions

Conceptualization, A.O. and M.N.; methodology, M.N. and A.O.; software, Á.M., M.N. and A.O.; validation, A.O., M.N., Á.M., M.R.B. and J.-B.P.-L.; formal analysis, M.N. and A.O.; investigation, A.O., M.N., Á.M., M.R.B. and J.-B.P.-L.; resources, A.O. and M.N.; data curation, Á.M., J.-B.P.-L., M.N. and A.O.; writing—original draft preparation, M.N. and A.O.; writing—review and editing, M.N. and A.O.; visualization, A.O. and M.N.; supervision, M.R.B., M.N. and A.O.; project administration, A.O. and M.N.; funding acquisition, A.O. and M.N. All authors have read and agreed to the published version of the manuscript.

Funding

This paper was partially funded as part of the research project “Experimental analysis and modeling of the influence of stops, transfers and right–of–way in bus systems”, with reference RTI2018–097924–B–I00 MCIU/AEI/FEDER, UE.

Acknowledgments

Authors thank Compañía de Tranvías de La Coruña, Concello da Coruña, Dirección General de Tráfico, Empresa Municipal Vivenda, Servizos e Actividades S.A.U. for providing the data needed to prepare this paper.

Conflicts of Interest

The authors declare no conflict of interest.

References

  1. Sun, J.; He, W.-T.; Wang, L.; Lai, A.; Ji, X.; Zhai, X.; Li, G.; Suchard, M.A.; Tian, J.; Zhou, J.; et al. COVID-19: Epidemiology, Evolution, and Cross-Disciplinary Perspectives. Trends Mol. Med. 2020, 6, 483–495. [Google Scholar] [CrossRef] [PubMed] [Green Version]
  2. Gorbalenya, A.E.; Baker, S.C.; Baric, R.S.; de Groot, C.; Dorsten, A.A.; Gulyaeva, B.L. The species severe acute respiratory syndrome-related coronavirus: Classifying 2019-nCoV and naming it SARS-CoV-2. Nat. Microbiol. 2020, 5, 536–544. [Google Scholar] [CrossRef] [Green Version]
  3. World Health Organization. COVID 19 Public Health Emergency of International Concern (PHEIC). Global Research and Innovation Forum: Towards a Research Roadmap. 2020. Available online: https://www.who.int/publications/m/item/covid-19-public-health-emergency-of-international-concern-(pheic)-global-research-and-innovation-forum (accessed on 23 July 2020).
  4. Spiteri, G.; Fielding, J.; Diercke, M.; Campese, C.; Enouf, V.; Gaymard, A.; Bella, A.; Sognamiglio, P.; Moros, M.J.S.; Riutort, A.N.; et al. First cases of coronavirus disease 2019 (COVID-19) in the WHO European Region, 24 January to 21 February 2020. Eurosurveillance 2020, 25, 2000178. [Google Scholar] [CrossRef] [PubMed] [Green Version]
  5. World Health Organization. WHO Coronavirus Disease (COVID_19) Dashboard. 2020. Available online: https://covid19.who.int/ (accessed on 23 July 2020).
  6. Governo Italiano, Dpmc 9 Marzo 2020, Registrato Alla Corte dei Conti il 9 Marzo 2020 Ufficio Controllo Atti P.C.M. Ministeri Della Giustizia e Degli Affari Esteri e Della Cooperazione Internazionale, reg.ne n. 421. Available online: http://www.governo.it/it/articolo/firmato-il-dpcm-9-marzo-2020/14276 (accessed on 23 July 2020).
  7. RD 463/2020, de 14 de Marzo, Por el Que se Declara el Estado de Alarma Para la Gestión de la Situación de Crisis Sanitaria Ocasionada Por el COVID-19. Boletín Oficial del Estado, 14 de Marzo de 2020, Number 67. Available online: https://www.boe.es/buscar/pdf/2020/BOE-A-2020-3692-consolidado.pdf (accessed on 23 July 2020).
  8. Décret 2020-293du 23 Mars 2020 Prescrivant Les Mesures Générales Nécessaires Pour Faire Face à L’épidémie de Covid-19 Dans le Cadre de L’état D’urgence Sanitaire. JORF 0072 du 24 Mars 2020, Texte n° 7. Available online: https://www.legifrance.gouv.fr/affichTexte.do?cidTexte=JORFTEXT000041746694&categorieLien=id (accessed on 23 July 2020).
  9. European Commission. Travel and Transportation during the Coronavirus Pandemic. 2020. Available online: https://ec.europa.eu/info/live-work-travel-eu/health/coronavirus-response/travel-and-transportation-during-coronavirus-pandemic_en (accessed on 23 July 2020).
  10. Costantino, V.; Heslop, D.J.; MacIntyre, C.R. The effectiveness of full and partial travel bans against COVID-19 spread in Australia for travellers from China. medRxiv 2020. [Google Scholar] [CrossRef] [Green Version]
  11. Yu, W.; Keralis, J. Controlling COVID-19: The Folly of International Travel Restrictions. Health Hum. Rights J. 2020. Available online: https://www.hhrjournal.org/2020/04/controlling-covid-19-the-folly-of-international-travel-restrictions/ (accessed on 23 July 2020).
  12. Malmberg, H.; Britton, T. Inflow restrictions can prevent epidemics when contact tracing efforts are effective but have limited capacity. medRxiv 2020. [Google Scholar] [CrossRef] [Green Version]
  13. Nowrasteh, A.; Forrester, A.C.; How, U.S. Travel Restrictions on China Affected the Spread ofCOVID-19 in the United States. Working Paper No. 58, CATO Institute. 2020. Available online: https://0-www-jstor-org.brum.beds.ac.uk/stable/pdf/resrep24847.pdf?acceptTC=true&coverpage=false (accessed on 23 July 2020).
  14. Linka, K.; Peirlinck, M.; Costabal, F.S.; Kuhl, E. Outbreak dynamics of COVID-19 in Europe and the effect of travel restrictions. Comput. Methods Biomech. Biomed. Eng. 2020, 23, 710–717. [Google Scholar] [CrossRef] [PubMed]
  15. Gunthe, S.S.; Patra, S.S. Impact of international travel dynamics on domestic spread of 2019-nCoV in India: Origin-based risk assessment in importation of infected travelers. Glob. Health 2020, 16, 1–7. [Google Scholar] [CrossRef] [PubMed]
  16. Google. COVID-19 Community Mobility Reports. 2020. Available online: https://www.google.com/covid19/mobility/ (accessed on 23 July 2020).
  17. Apple. COVID-19 Mobility Trends Reports. 2020. Available online: https://www.apple.com/covid19/mobility (accessed on 23 July 2020).
  18. Instituto Nacional de Estadística. Evolución de la Movilidad Por Ambito Geográfico Durante el Estado de Alarma Por COVID-19. 2020. Available online: https://www.ine.es/covid/covid_movilidad.htm (accessed on 23 July 2020).
  19. Ministerio de Transporte, Movilidad y Agenda Urbana. Gobierno de España. Análisis de la Movilidad en España Durante el Estado de Alarma. 2020. Available online: https://www.mitma.gob.es/ministerio/covid-19/evolucion-movilidad-big-data (accessed on 23 July 2020).
  20. Pepe, E.; Bajardi, P.; Gauvin, L.; Privitera, F.; Lake, B.; Cattuto, C.; Tizzoni, M. COVID-19 outbreak response: A first assessment of mobility changes in Italy following national lockdown. medRxiv 2020. [Google Scholar] [CrossRef] [Green Version]
  21. Beria, P.; Lunkar, V. Presence and Mobility of the Population during Covid-19 Outbreak and Lockdown in Italy. Working Paper, MPRA Paper No. 100896, Posted 10 June 2020. Available online: https://mpra.ub.uni-muenchen.de/100896/1/MPRA_paper_100896.pdf (accessed on 23 July 2020).
  22. Fraiberger, S.P.; Astudillo, P.; Candeago, L.; Chunet, A.; Jones, N.K.W.; Khan, M.F.; Lepri, B.; Lozano Gracia, N.; Lucchini, L.; Massaro, E.; et al. Uncovering Socioeconomic Gaps in Mobility Reduction during the COVID-19 Pandemic Using Location Data. Preprint. 2020. Available online: https://arxiv.org/pdf/2006.15195.pdf (accessed on 23 July 2020).
  23. Bonaccorsi, G.; Pierri, F.; Cinelli, M.; Flori, A.; Galeazzi, A.; Porcelli, F.; Schmidt, A.L.; Valensise, C.M.; Scala, A.; Quattrociocchi, W.; et al. Economic and social consequences of human mobility restrictions under COVID-19. Proc. Natl. Acad. Sci. USA 2020, 117, 15530–15535. [Google Scholar] [CrossRef] [PubMed]
  24. Schlosser, F.; Maier, B.F.; Hinrichs, D.; Zachariae, A.; Brockmann, D. COVID-19 Lockdown Induces Structural Changes in Mobility Networks—Implication for Mitigating Disease Dynamics. Preprint. 2020. Available online: https://arxiv.org/pdf/2007.01583.pdf (accessed on 23 July 2020).
  25. Pullano, G.; Valdano, E.; Scarpa, N.; Rubrichi, S.; Colizza, V. Population mobility reductions during COVID-19 epidemic in France under lockdown. medRxiv 2020. [Google Scholar] [CrossRef]
  26. Klein, B.; LaRock, T.; McCabe, S.; Torres, L.; Privitera, F.; Lake, B.; Kraemer, M.U.G.; Brownstein, J.S.; Lazer, D.; Eliassi-Rad, T.; et al. Assessing Changes in Commuting and Individual Mobility in Major Metropolitan Areas in the United States during the COVID-19 Outbreak. Northeastern University. Network Science Institute. 2020. Available online: https://uploads-ssl.webflow.com/5c9104426f6f88ac129ef3d2/5e8374ee75221201609ab586_Assessing_mobility_changes_in_the_United_States_during_the_COVID_19_outbreak.pdf (accessed on 23 July 2020).
  27. Lee, M.; Zhao, J.; Sun, Q.; Pan, Y.; Zhou, W.; Xiong, C.; Zhang, L. Human Mobility Trends during the COVID-19 Pandemic in the United States. Preprint. 2020. Available online: https://arxiv.org/ftp/arxiv/papers/2005/2005.01215.pdf (accessed on 23 July 2020).
  28. Gao, S.; Rao, J.; Kang, Y.; Liang, Y.; Kruse, J. Mapping County-Level Mobility Pattern Changes in the United States in Response to COVID-19. Available online: https://ssrn.com/abstract=3570145 (accessed on 2 April 2020).
  29. Yabe, T.; Tsubouchi, K.; Fujiwara, N.; Wada, T.; Sekimoto, Y.; Ukkusuri, S.V. Non-Compulsory Measures Sufficiently Reduced Human Mobility in Tokyo during the COVID-19 Epidemic. Preprint. 2020. Available online: https://arxiv.org/pdf/2005.09423.pdf (accessed on 23 July 2020).
  30. Galeazzi, A.; Cinelli, M.; Bonaccorsi, G.; Pierri, F.; Schmidt, A.L.; Scala, A.; Pammolli, F.; Quattrociocchi, W. Human Mobility in Response to COVID-19 in France, Italy and UK. Preprint. 2020. Available online: https://arxiv.org/pdf/2005.06341.pdf (accessed on 23 July 2020).
  31. Aloi, A.; Alonso, B.; Benavente, J.; Cordera, R.; Echániz, E.; González, F.; Ladisa, C.; Lezama-Romanelli, R.; López-Parra, A.; Mazzei, V.; et al. Effects of the COVID-19 Lockdown on Urban Mobility: Empirical Evidence from the City of Santander (Spain). Sustainability 2020, 12, 3870. [Google Scholar] [CrossRef]
  32. Ministerio de Sanidad. Evolución de Enfermedad Por el Coronavirus (COVID-19). Available online: https://datos.gob.es/es/catalogo/e05070101-evolucion-de-enfermedad-por-el-coronavirus-covid-19 (accessed on 23 July 2020).
  33. RD 476/2020, de 27 de Marzo, Por el Que se Prorroga el Estado de Alarma Declarado Por el Real Decreto 463/2020, de 14 de Marzo, Por el Que se Declara el Estado de Alarma Para la Gestión de la Situación de Crisis Sanitaria Ocasionada Por el COVID-19. Boletín Oficial del Estado, 28 de Marzo de 2020, Number 86. Available online: https://www.boe.es/buscar/act.php?id=BOE-A-2020-4155 (accessed on 23 July 2020).
  34. RD 487/2020, de 19 de Abril, Por el Que se Prorroga el Estado de Alarma Declarado Por el Real Decreto 463/2020, de 14 de Marzo, Por el Que se Declara el Estado de Alarma Para la Gestión de la Situación de Crisis Sanitaria Ocasionada Por el COVID-19. Boletín Oficial del Estado, 11 de Abril de 2020, Number 101. Available online: https://www.boe.es/buscar/doc.php?id=BOE-A-2020-4413 (accessed on 23 July 2020).
  35. RD 492/2020, de 24 de Abril, Por el Que se Prorroga el Estado de Alarma Declarado Por el Real Decreto 463/2020, de 14 de Marzo, Por el Que se Declara el Estado de Alarma Para la Gestión de la Situación de Crisis Sanitaria Ocasionada Por el COVID-19. Boletín Oficial del Estado, 25 de Abril de 2020, Number 115. Available online: https://www.boe.es/buscar/doc.php?id=BOE-A-2020-4652 (accessed on 23 July 2020).
  36. RD 514/2020, 8 de Mayo, Por el Que se Prorroga el Estado de Alarma Declarado Por el Real Decreto 463/2020, de 14 de Marzo, Por el Que se Declara el Estado de Alarma Para la Gestión de la Situación de Crisis Sanitaria Ocasionada Por el COVID-19. Boletín Oficial del Estado, 9 de Mayo de 2020, Number 129. Available online: https://www.boe.es/buscar/doc.php?id=BOE-A-2020-4902 (accessed on 23 July 2020).
  37. RD 537/2020, 22 de Mayo, Por el Que se Prorroga el Estado de Alarma Declarado Por el Real Decreto 463/2020, de 14 de Marzo, Por el Que se Declara el Estado de Alarma Para la Gestión de la Situación de Crisis Sanitaria Ocasionada Por el COVID-19. Boletín Oficial del Estado, 23 de Mayo de 2020, Number 145. Available online: https://www.boe.es/buscar/act.php?id=BOE-A-2020-5243 (accessed on 23 July 2020).
  38. RD 555/2020, 5 de Junio, Por el Que se Prorroga el Estado de Alarma Declarado Por el Real Decreto 463/2020, de 14 de Marzo, Por el Que se Declara el Estado de Alarma Para la Gestión de la Situación de Crisis Sanitaria Ocasionada Por el COVID-19. Boletín Oficial del Estado, 6 de Junio de 2020, Number 159. Available online: https://www.boe.es/buscar/act.php?id=BOE-A-2020-5767 (accessed on 23 July 2020).
  39. RDL 8/2020, 17 de Marzo, de Medidas Urgentes Extraordinarias Para Hacer Frente al Impacto Económico y Social del COVID-19. Boletín Oficial del Estado, 18 de Marzo de 2020, Number 73. Available online: https://www.boe.es/buscar/act.php?id=BOE-A-2020-3824 (accessed on 23 July 2020).
  40. RDL 10/2020, 29 de Marzo, Por el Que se Regula un Permiso Retribuido Recuperable Para Las Personas Trabajadoras Por Cuenta Ajena Que no Presten Servicios Esenciales, Con el Fin de Reducir la Movilidad de la Población en el Contexto de la Lucha Contra el COVID-19. Boletín Oficial del Estado, 29 de Marzo de 2020, Number 87. Available online: https://www.boe.es/buscar/act.php?id=BOE-A-2020-4166 (accessed on 23 July 2020).
  41. Orden SND/386/2020, de 3 de Mayo, Por la Que se Flexibilizan Determinadas Restricciones Sociales y se Determinan Las Condiciones de Desarrollo de la Actividad de Comercio Minorista y de Prestación de Servicios, Así Como de Las Actividades de Hostelería y Restauración en Los Territorios Menos Afectados Por la Crisis Sanitaria Ocasionada Por el COVID-19. Boletín Oficial del Estado, 3 de Mayo de 2020, Number 123. Available online: https://www.boe.es/buscar/doc.php?id=BOE-A-2020-4791 (accessed on 23 July 2020).
  42. Orden SND/370/2020, de 25 de Abril, Sobre Las Condiciones en Las Que Deben Desarrollarse Los Desplazamientos Por Parte de la Población Infantil Durante la Situación de Crisis Sanitaria Ocasionada Por el COVID-19. Boletín Oficial del Estado, 24 de Abril de 2020, Number 116. Available online: https://www.boe.es/buscar/act.php?id=BOE-A-2020-4665 (accessed on 23 July 2020).
  43. Orden SND/399/2020, de 9 de Mayo, Para la Flexibilización de Determinadas Restricciones de Ambito Nacional, Establecidas Tras la Declaración del Estado de Alarma en Aplicación de la Fase 1 del Plan Para la Transición Hacia Una Nueva Normalidad. Boletín Oficial del Estado, 9 de Mayo de 2020, Number 130. Available online: https://www.boe.es/buscar/doc.php?id=BOE-A-2020-4911 (accessed on 23 July 2020).
  44. Orden SND/414/2020, de 16 de Mayo, Para la Flexibilización de Determinadas Restricciones de Ambito Nacional Establecidas Tras la Declaración del Estado de Alarma en Aplicación de la Fase 2 del Plan Para la Transición Hacia Una Nueva Normalidad. Boletín Oficial del Estado, 16 de Mayo de 2020, Number 138. Available online: https://www.boe.es/buscar/doc.php?id=BOE-A-2020-5088 (accessed on 23 July 2020).
  45. Orden SND/458/2020, de 30 de Mayo, Para la Flexibilización de Determinadas Restricciones de Ambito Nacional Establecidas Tras la Declaración del Estado de Alarma en Aplicación de la Fase 3 del Plan Para la Transición Hacia Una Nueva Normalidad. Boletín Oficial del Estado, 30 de Mayo de 2020, Number 153. Available online: https://www.boe.es/buscar/act.php?id=BOE-A-2020-5469 (accessed on 23 July 2020).
  46. Orden SND/422/2020, de 19 de Mayo, Por la Que se Regulan las Condiciones Para el uso Obligatorio de Mascarilla Durante la Situación de Crisis Sanitaria Ocasionada Por el COVID-19. Boletín Oficial del Estado, 20 de Mayo de 2020, Number 142. Available online: https://www.boe.es/buscar/act.php?id=BOE-A-2020-5142 (accessed on 23 July 2020).
  47. Orden TMA/384/2020, de 3 de Mayo, Por la Que se Dictan Instrucciones Sobre la Utilización de Mascarillas en los Distintos Medios de Transporte y se Fijan Requisitos Para Garantizar Una Movilidad Segura de Conformidad Con el Plan Para la Transición Hacia Una Nueva Normalidad. Boletín Oficial del Estado, 3 de Mayo de 2020, Number 123. Available online: https://www.boe.es/diario_boe/txt.php?id=BOE-A-2020-4789 (accessed on 23 July 2020).
  48. RDL 21/2020, 9 de Junio, de Medidas Urgentes de Prevención, Contención y Coordinación Para Hacer Frente a la Crisis Sanitaria Ocasionada Por el COVID-19. Boletín Oficial del Estado, 10 de Junio de 2020, Number 163. Available online: https://www.boe.es/diario_boe/txt.php?id=BOE-A-2020-5895 (accessed on 23 July 2020).
  49. Instituto Nacional de Estadística, Áreas Urbanas Funcionales: Coruña, A. Available online: https://www.ine.es/ss/Satellite?L=es_ES&c=INESeccion_C&p=1254735110672&pagename=ProductosYServicios%2FPYSLayout&param1=PYSDetalleFichaSeccionUA&param3=1259944561392&_charset_=UTF-8&cid=1259944592664 (accessed on 23 July 2020).
  50. Concello da Coruña, Enquisa de Mobilidade da Area Metropolitana da Coruña 2017. Informe de resultados.
  51. Sanchez, K.A.; Foster, M.; Nieuwenhuijsen, M.; May, A.D.; Ramani, T.; Zietsman, J.; Khreis, H. Urban policy interventions to reduce traffic emissions and traffic-related air pollution: Protocol for a systematic evidence map. Environ. Int. 2020, 142, 105826. [Google Scholar] [CrossRef] [PubMed]
  52. Guillis, D.; Semanjski, I.; Lauwers, D. How to Monitor Sustainable Mobility in Cities? Literature Review in the Frame of Creating a Set of Sustainable Mobility Indicators. Sustainability 2016, 8, 29. [Google Scholar] [CrossRef] [Green Version]
  53. Cavallaro, F.; Giaretta, F.; Nocera, S. The potential of road pricing schemes to reduce carbon emissions. Transp. Policy 2018, 67, 85–92. [Google Scholar] [CrossRef]
  54. Compañía de Tranvías de La Coruña. Encuesta de Satisfacción a Usuarios del Transporte Urbano de A Coruña. Informe de resultados. January 2019. Available online: http://www.tranviascoruna.com/encuesta-satisfaccion-2018/ (accessed on 23 July 2020).
  55. Lodeiro, O.; Orro, A.; Martínez-Pardo, A.; Pérez-López, J.B.; Novales, M. Influencia de la meteorología en la utilización del sistema de bicicleta pública en A Coruña. In Proceedings of the XIII Congreso de Ingeniería del Transporte, Gijón, Spain, 6–8 June 2018. [Google Scholar]
  56. Moovit. Impact of Coronavirus (COVID-19) on Public Transit Usage. 2020. Available online: https://moovitapp.com/insights/en/Moovit_Insights_Public_Transit_Index-countries (accessed on 23 July 2020).
  57. Sevicio Público de Empleo Estata (SEPE). Datos Estadísticos de Paro Registrado y Contratos Por Municipios. Available online: http://www.sepe.es/HomeSepe/que-es-el-sepe/estadisticas/datos-estadisticos/municipios/2020/enero.html (accessed on 23 July 2020).
  58. EMVSA (Empresa Municipal Vivenda, Servizos e Actividades S.A.U.). Servizo Público de Aluguer de Bicicletas de Uso Público Municipal. Asunto: Reinicio do Servizo. Available online: http://www.emvsa.es/images/files/Reinicio%20servicio%20BiciCoruna.pdf (accessed on 23 July 2020).
  59. Meteogalicia. Histórico da Rede Meteorolóxica. Available online: https://www.meteogalicia.gal/observacion/estacionshistorico/historico.action?idEst=10157 (accessed on 23 July 2020).
  60. Compañía de Tranvías de La Coruña. Comunicado: Proceso de Reducción del Servicio (COVID-19). 16 March 2020. Available online: https://www.tranviascoruna.com/proceso-reduccion-servicio-covid19/ (accessed on 23 July 2020).
  61. Compañía de Tranvías de La Coruña. Nueva Reducción del Servicio de Transporte Urbano RDL 10/2020 28 Marzo. 30 March 2020. Available online: https://www.tranviascoruna.com/nueva-reduccion-servicio-transporte-urbano-rdl-102020-28-marzo/ (accessed on 23 July 2020).
  62. La Opinión A Coruña. El Bus Urbano de A Coruña Incrementa su Servicio Hasta Situarse al 70% del Habitual. 23 May 2020. Available online: https://www.laopinioncoruna.es/coruna/2020/05/23/bus-urbano-coruna-incrementa-30/1504262.html (accessed on 23 July 2020).
  63. La Opinión A Coruña. Los Buses Urbanos y los Taxis Recuperan la Totalidad de su Servicio Desde Mañana. 7 June 2020. Available online: https://www.laopinioncoruna.es/coruna/2020/06/07/buses-urbanos-taxis-recuperan-totalidad/1508011.html (accessed on 23 July 2020).
  64. Coruña Sostenible. Calidad del Aire. Datos de la Red de Vigilancia. Available online: http://coruna.es/infoambiental/es/calidad-del-aire/red-de-vigilancia.html (accessed on 27 August 2020).
  65. Subdirección General de Aire Limpio y Sostenibilidad Industrial del Ministerio Para la Transición Ecológica y el Reto Demográfico, 2020. Informe de Indicadores de Calidad del Aire Durante el Estado de Alarma Debido al COVID-19. Available online: https://www.miteco.gob.es/images/es/indicadores_covid_tcm30-510603.pdf (accessed on 27 August 2020).
Figure 1. New confirmed COVID–19 cases in Galicia, Madrid, Cataluña regions, and the whole country, February to June 2020. Source: data from the Spanish Healthcare Ministry [32].
Sustainability 12 07206 g001
Figure 2. Combined daily demand for city bus lines in the year 2019.
Sustainability 12 07206 g002
Figure 3. Traffic volume in main urban arterial (station AC–11 0.77) in year 2019.
Sustainability 12 07206 g003
Figure 4. A Coruña’s shared bicycle system use in year 2019.
Sustainability 12 07206 g004
Figure 5. City bus demand percentage for 2020 concerning the 5-normal working day (NWD) centered moving average for 2017–2019—all lines.
Sustainability 12 07206 g005
Figure 6. Traffic volume percentage for 2020 related to the 5-NWD centered moving average for 2017–2019.
Sustainability 12 07206 g006
Figure 7. Shared bicycle use percentage for 2020 related to the 5-NWD centered moving average for 2017–2019.
Sustainability 12 07206 g007
Figure 8. City bus supply percentage for 2020 in relation to the 5-NWD centered moving average for 2017–2019—all lines.
Sustainability 12 07206 g008
Figure 9. Comparative percentage of NWD 2020 demand in relation to the 5-NWD centered moving average for 2017–2019, for shared bicycles, traffic volume, and city bus.
Sustainability 12 07206 g009
Figure 10. Evolution of month average value of NOx and PM10 in Santa Margarita station.
Sustainability 12 07206 g010
Figure 11. City bus demand percentage in 2020 in relation to the 5-NWD centered moving average for 2017–2019 by line.
Sustainability 12 07206 g011
Figure 12. City bus supply percentage for 2020 in relation to the 5-NWD centered moving average for 2017–2019 by line.
Sustainability 12 07206 g012
Figure 13. Average NWD daily use at each stop for 2017–2019.
Sustainability 12 07206 g013
Figure 14. NWD stop average use percentage for 2020 in relation to NWD mean for 2017–2019, for the most demanded stops (mean 2017–2019 > 300).
Sustainability 12 07206 g014
Figure 15. NWD stop average use percentage for 2020 in relation to mean for 2017–2019 during NWD of the severer lockdown period. Most demanded stops (mean 2017–2019 > 300).
Sustainability 12 07206 g015
Figure 16. NWD stop average use percentage for 2020 in relation to mean for 2017–2019 during new normal period. Most demanded stops (mean 2017–2019 > 300).
Sustainability 12 07206 g016
Figure 17. NWD stop average use percentage for 2020 in relation to mean 2017–2019. Selected stops (mean 2017–2019 > 1000 and singular ones).
Sustainability 12 07206 g017
Figure 18. Main origin–destination (OD) average NWD daily flow in February 2020 (prior to the COVID–19 outbreak).
Sustainability 12 07206 g018
Figure 19. Main OD average NWD daily flow in April 2020 (lockdown).
Sustainability 12 07206 g019
Figure 20. Main OD average NWD daily flow in June 2020 (end of reopening and new normal).
Sustainability 12 07206 g020
Figure 21. Daily average journey time mean throughout all lines. Base 100% NWD average for January 2020.
Sustainability 12 07206 g021
Figure 22. Daily average journey time standard deviation throughout all lines. Base 100% average standard deviation for NWD of January 2020.
Sustainability 12 07206 g022
Table 1. Ridership evolution of bus lines from year 2017 to 2020.
Line2017201820192020
TotalFirst 6 MonthsTotalFirst 6 MonthsFirst 6 MonthsIncreaseTotalFirst 6 MonthsFirst 6 MonthsIncreaseTotalFirst 6 MonthsFirst 6 MonthsIncrease
100849,402431,409824,272405,808−5.93%846,366420,4133.60%238,121−43.36%
200476,645237,628449,555222,776−6.25%463,576228,4642.55%107,726−52.85%
300404,581204,300419,327201,639−1.30%434,370213,4345.85%119,908−43.82%
301714,066353,082726,264358,9651.67%746,605372,8683.87%205,896−44.78%
4001,847,264925,7851,771,951885,490−4.35%1,787,451900,8061.73%502,892−44.17%
5001,144,536561,2841,155,467558,113−0.56%1,196,817591,5365.99%319,526−45.98%
6001,575,958796,5421,581,079787,405−1.15%1,620,137813,7603.35%483,066−40.64%
601520,776262,555526,817260,705−0.70%541,328269,9313.54%153,870−43.00%
7001,313,167656,5281,351,995666,9211.58%1,439,935710,0136.46%393,269−44.61%
800503,351256,019480,235233,415−8.83%489,988242,2513.79%142,149−41.32%
11001,841,742878,8571,942,156922,8575.01%2,010,772968,2494.92%549,301−43.27%
12001,076,662543,8661,107,951562,8283.49%1,140,293581,2403.27%334,768−42.40%
14002,533,8091,276,0712,593,7381,298,7621.78%2,657,4331,357,9164.55%794,433−41.50%
1500720,602365,733738,318376,5772.97%734,066373,600−0.79%229,241−38.64%
1700514,115258,015506,686251,771−2.42%524,438262,2184.15%159,771−39.07%
19001,121,207545,5451,085,843531,033−2.66%1,184,141552,0263.95%313,277−43.25%
2000793,807399,134800,460397,696−0.36%820,686412,6813.77%254,261−38.39%
2100748,216376,915775,878380,3940.92%790,227405,0406.48%238,185−41.19%
2200839,416426,920824,797408,738−4.26%837,208424,3093.81%260,056−38.71%
2300159,17977,314162,10477,9180.78%160,88781,6144.74%36,018−55.87%
2301153,26173,794154,45774,8651.45%154,06377,3213.28%44,446−42.52%
2400323,688157,851327,680157,292−0.35%329,450165,5745.27%94,035−43.21%
245_1,541,345806,5511,529,721788,933−2.18%1,558,466792,0340.39%376,600−52.45%
Total21,716,79510,871,69821,836,75110,810,901−0.56%22,469,30311,217,2983.76%6,350,815−43.38%
Night line is not considered in this table.

