Perception and Drivers of Financial Constraints for the Sustainable Development
by
 ,
,
Tamara Teplova
1, 
Tatiana Sokolova
1,
Mariya Gubareva
2,3,*,
Kristina Galenskaya
1 and
Andrey Teplov
1 1
Department of Financial Market Infrastructure, Faculty of Economic Sciences, National Research University Higher School of Economics, 109028 Moscow, Russia
2
Department of Economics and Finance, ISCAL—Lisbon Accounting and Business School/Instituto Politécnico de Lisboa, 1069-035 Lisbon, Portugal
3
SOCIUS/CSG—Research in Social Sciences and Management, 1200-781 Lisbon, Portugal
*
Author to whom correspondence should be addressed.
Sustainability 2020, 12(17), 7217; https://0-doi-org.brum.beds.ac.uk/10.3390/su12177217
Submission received: 2 August 2020
/
Revised: 21 August 2020
/
Accepted: 28 August 2020
/
Published: 3 September 2020
(This article belongs to the Special Issue Bank Management, Finance and Sustainability)
Abstract
:Financial market imperfections constrain firms’ ability to obtain funds. This is especially true for the former communist bloc countries. However, the restrictions on access to financing and the attitudes of management in these geographies remain overlooked by academic research and represent an important obstacle on the roadmap to sustainable development. The objective of this paper is to fill this gap by analyzing the impact of ownership structure, institutional environment development, and debt market profile on the perception of financial constraints by the representatives of corporate top management from 28 countries of the former communist bloc. Our analysis spans over the period 2002–2013. We apply the probit and Heckman models to investigate nonlinear and multicast effects of the considered factors. We evidence that during the crisis and post-crisis periods, foreign ownership alleviates the restrictions on access to financial resources. We also discuss the role of state ownership. We find that the volume of local currency bond market has a nonlinear U-shape relationship. Our results are useful for policy makers focused on sustainable development of the former communist economies by means of improving access of businesses to financing.
1. Introduction
A policy of transition to market economy and to sustainable development was conducted within the former communist bloc. Many countries of Eastern and Southern Europe chose the way of consequent accession to the EU, as well as international capital flow liberalization and dynamic privatization of national property. Russia, Belarus, and a range of Asian countries carried out a restrictive policy of foreign capital cash flow in order to maintain the government control over the largest enterprises. The key feature of the countries in the sample under our consideration is the incompleteness of the transit process from a centrally planned to market economy. Due to the lack of independence of many companies, especially large ones, when many decisions are based on directives (government recommendations) and viability is ensured by subsidies and various forms of state support, there is a high risk of political and economic crises (example of 2020—Belarus). Sovereign democracy is a very fragile structure that can turn into a collapse for many companies when a totalitarian leader changes. Such highly probable events can further increase barriers to financial resources, both at the state level (sanctions) and at the firm level. The move towards sustainable development could be set back many years.
The financial markets of the former communist bloc have poor financial depth, a hypertrophied or small national banking sector, a gap in regulating measures, and weak protection of investors’ rights. Diverse imperfections of financial markets constrain firms’ ability to obtain funds. The imperfections lead to high transaction costs and high cost of capital. Empirical research on firm financial reporting data supports this underlying theory. The issues of perception of factors that are barriers to sustainable development are less studied. This perception is determined not only by the characteristics of firms (size, government support, company’s age, etc.), but also by the institutional environment and the degree of development of the country’s financial system as a whole.
Nevertheless, different countries of the former communist bloc are characterized by different share of state participation in the economy as well as different extent of foreign participation (Figure A1, Figure A2 and Figure A3, Appendix A), government support, business experience, and the degree of institutional development.
To what quality of the institutional environment (laws and law enforcement, combating corruption) is absolutely important to smooth out financial tensions and sustainable growth and development is an open question [1]. Research on emerging markets shows that the recognition of the importance of institutions grows as an economy grows [2]. We are contributing to the study of this issue through the prism of perception (awareness) of this value in the eyes of top management along the transition period from the communist ideology and planned economy to the sustainable market-driven development of the firms.
Our research is motivated by the search for the answers to the following questions. (i) What is the role of the state and foreign investors in overcoming financial constraints? (ii) How does ownership structure and business experience of the firm help to overcome restrictions to access financing? (iii) What is the perception of financial barriers by top managers, who are often the owners and/or founders of businesses, especially in the Soviet bloc countries? (iv) Is the role of the institutional environment important in smoothing out the problems of access to financial resources? (v) What factors should be considered by investors and other market participants in order to understand the possible roadmap towards sustainable economic development?
Our study on the perception of financial constraints using the sample of Soviet bloc countries sheds light on the processes taking place in transit economies and gives tips to regulators and policy makers since it compares the influence of diverse factors, such as ownership structure, institutional environment, and debt market profile, during the three following time intervals: period of growth (2002–2007), crisis (2008–2009), and the post-crisis period of tightening banking regulation and easing monetary policy. We account for nonlinearity and multicativity.
We contribute to the empirical literature in several ways. First, we consider a sample of 28 post-communist countries (Figure A1, Figure A2 and Figure A3, Appendix A). In these geographies, an easy access to financing is a necessary condition for stable investment growth and economic development. We document that in the considered transition economies, the government still plays an important role (Figure A2). It influences strategic decisions and investment policies of large firms. Transition economies are characterized by relatively low quality of institutional environment and by relatively high levels of corruption. However, in most such economies, the share of foreign capital and multinational corporations gradually increases. Another problem is related to the underdeveloped stock and bond markets, resulting in difficulties for corporations to issue equity instruments and corporate bonds, and causing diverse economic agents to increase the volume of bank credits. Nonetheless, the investigation of financial constraints, ownership structure, and different financing sources in developing countries has received limited attention in the literature. This paper fills this gap. In particular, as far as we know, there are no papers that analyze the relationship between the development of the corporate bond market and the level of financial constraints. Hence, overcoming financial constraints is one of the key issues to enable progress along the path of sustainable economic growth in the long run.
Second, we directly measure financing constraints based on the Business Environment and Enterprise Performance Survey (BEEPS) survey dataset [3]. Majority of the previous papers uses the data of financial statements and identify the financial constraints indirectly [4,5,6,7]. Our study registers the perception of financial constraints by top managers. Our survey is based on straightforward questions regarding the existence of financial constraints (like [8,9]). In addition, we directly measure the existence of financial constraints. However, the collected answers certainly contain several elements of subjectivity and are influenced by the social and cultural diversity of the countries. The original methodology of our research on Heckman model (Heckprobit) allows us to identify the peculiarities of financial constraints perception in different countries, being applied to the abovementioned survey dataset.
Third, we use advanced econometric methods that take into account the specifics of the employed data. Unlike most previous studies, we consider nonlinear and multiplicative impacts of different factors on financial constraints. To test the hypotheses, we use both the simple probit model and the model with a system of equations where the possibility to face financial constraints is regulated by the availability of bank credits. Heckman’s model is applied for specification of the system of equations.
Fourth, we compare two periods to analyze the financial constraints of firms: before the global financial crisis and after, following previous research (see, e.g., [3]), which documents that business cycles have an impact on firms funding. We demonstrate that economic growth, i.e., high GDP growth, is associated with less financial constraints and vice versa and focuses on changing the perception of financial difficulties after the crisis.
The rest of the paper is organized as follows. Section 2 presents the literature overview and develops a set of research hypotheses. Section 3 provides the model specification and describes the methodology to study the nonlinear and multiplicative effects of different factors on financial constraints. Section 4 surveys the stylized facts regarding the former communist bloc countries and presents the sample descriptive statistics. Section 5 provides our empirical results and discusses their implications. Section 6 concludes the paper.
2. Literature Overview and Hypotheses Development
The long list of literature shows that imperfections in financial markets create restrictions on access to financial resources and thus adversely affect enterprises and the economy as a whole. Among such shortcomings in financial markets could be distinguished the government interventions ([5,9,10,11,12]; and the references therein). The degree of hardship related to financing opportunities, in general, depends on a set of firm characteristics, such as size, age, credit rating, export orientation, concentration of ownership, and membership in industry associations, among others ([13,14,15,16,17]; and the references therein).
In general, the research on determinants of financial constraints could be systematized into the four following directions. The first is related to the studies of the role of public sector. For example, Ref. [8] investigated the influence of state ownership on firm’s financial constraint and addressed the impact of country-level corruption on accessibility to corporate financing. Analyzing the cross-country sample, which consists of more than 8000 firms from 81 countries, the authors concluded that both state ownership and low corruption make financial constraints decrease. The most recent study [17] also evidences that the low level of corruption, developed legal system, and advanced property rights result in lowering of the level of financial constraints experienced by small- and medium-sized enterprises (SMEs) from 28 Eastern European and Central Asian countries.
Ref. [16] investigated the influence of internal cash flow, access to external finance, and government connections on the investment rate for the case of the Chinese manufacturing firms. They found that the sensitivity of the investment rate is an adequate indicator of financial constraints. The authors evidenced that the investment rate of state-owned firms is not sensitive to cash flows, i.e., such firms have minor obstacles to access financing if compared to foreign and non-state-owned domestic firms.
In their turn, Ref. [12] demonstrated that the influence of state ownership on firm’s cost of debt and financial indicators is mixed. On one hand, the government can force state-owned firms to realize projects according to political goals, which may negatively influence their profitability and increase risk. On the other hand, the government provides guarantees in case of a potential default.
The second stream of the literature on financial constraints is related to the foreign ownership impact. For instance, Ref. [9] investigated how Foreign Direct Investments (FDI) influence financial constraints of Chinese firms. The results showed that domestic private firms, unlike state-owned ones, suffer from financial constraints. Investment decisions of private firms are affected by debt burden and cost of capital, while foreign investment reduces financial obstacles.
In this stream of literature, it is also worth mentioning the research by [5], who found a causal relationship between FDI and the decreasing sensitivity of the investment cash flow for the 3500 US manufacturing firms from 1988 to 2012. The multiplicative impact of cash flow and FDI presence on the investment rate is significantly negative.
Additionally, Ref. [6] studied the impact of foreign acquisitions and ownership on financial constraints of Chinese corporate entities. The authors concluded that foreign-owned firms face obstacles to obtain funding. It is explained by the fact that dominating state-owned banks make preferences to state-owned firms in credit allocation.
The third line of the studies on financial constraints is focused on the influence of debt choice. The main gap in this line of research is associated with the limited analyses of the role of corporate bond markets, while most of the literature is dedicated to the investigation of the bank and trade credits influence on financial constraints. For example, Ref. [7] analyzed the investment activities of Japanese firms with large publicly traded debt (corporate bonds) during the global financial crisis of 2008. It was found that firms with close bank-firm relationships are less financially constrained and have low borrowing costs.
Ref. [18] examined the interrelationship between bank lending constraints and alternative external finance: trade credit, informal lending, non-banking loans, market financing, and state grants, for a sample of SMEs from 11 European countries. The authors revealed that credit-rationed firms tend to use trade credit and, in a lesser degree, informal lending or loans from other companies. Self-rationing firms are more likely to use informal lending. There is no statistical evidence that bank-constrained SMEs apply for or use market finance (debt or equity).
The author of [19] investigated the influence of debt level and debt maturity on corporate investment for the Vietnamese listed firms from 2010 to 2016. The author showed that the debt level significantly reduces investment expenditures. State-owned and equitized firms have less financial constraints.
The fourth direction of research on financial constraints considers the impact of the quality of institutional environment and the level of development of national financial market ([8,20]).
To the best of our knowledge, there are no papers analyzing the influence of development of the bond market on financial constraints at the firm level. We fill this gap by tracking the depth of national debt market in corporate bonds segment while also simultaneously gauging the development of bank crediting to the private sector. We also address the technical challenge of how to measure them and present our solution.
Regarding this measurement issue, we recommend for advance reading an overview by [21] on the literature related to measuring financial constraints. One stream of literature uses the data of financial statements and identifies the financial constraints indirectly—by means of sensitivity of investment costs to diverse factors [4,5,7,11].
Alternative approach to assess financial constraints is based on the data survey, including straightforward questions of financial constraints existence ([8,9]). We follow this direct technique to determine the existence of financial constraints, enhancing it with the elements allowing to reduce subjectivity and account for possible exposure to social and cultural diversity of the countries. We consider an original binary variable, which describes the obstacle to finance obtained from company surveys.
Previous studies prove that state participation in the capital of a company removes financial constraints because the government provides implicit guarantees and can bail out firms in case of a potential bankruptcy [8]. Ref. [16] arrived at a similar conclusion for the companies where the state is involved in CEO appointment. Ref. [4] showed that obtaining state subsidies enables to reduce barriers for financing. In case of possible default, the state may act as a guarantor of the funds.
However, Ref. [12] argued that the influence of state ownership on firm’s cost of debt and financial indicators is mixed. On one hand, the government provides guarantees in case of a potential default. However, this can only affect strategically important companies. For small businesses, support may not be available. On the other hand, the government can force state-owned firms to realize projects according to political goals, which negatively influence their profitability and increase risk. Empirical research [12] has shown that state ownership, in general, increases the cost of debt, but during financial crisis it reduces the cost of debt. It could be assumed that with a change in the macroeconomic situation, the role of the state changes. In our study, we compare the influence of the state in the capital structure before and after the global financial crisis.
We empirically test three groups of hypotheses, which shed light on the factors that determine the perception of financial constraints. The first group of hypotheses concerns the structure of equity capital and the role of government support:
Hypothesis 1.
State ownership is negatively perceived by top management and does not ease financial constraints. Top management assumes the state as inefficient owner. In the presence of bank loans, the state acts as a guarantor for credit risk.
Hypothesis 2.
The provision of state subsidies helps to overcome financial constraints. Subsidies improve the financial state of the company. It is fundamentally important during the period of crisis, and, in coordination with banks, allows for alleviating difficulties in attracting financing.
The role of foreign ownership is not obvious. Ref. [5,6,9] for the US and Chinese markets found that it is easier for the companies with foreign capital in the ownership structure to obtain the access for financing. Foreign capital is able to provide global expansion with cheaper sources of financing. Ref. [6] concluded that after foreign acquisition, the financial constraints of target firms are reduced, and R&D expenditures and productivity of target firms increase after foreign acquisition. However, on the other hand, totalitarian states are bothered by the presence of foreign capital. In a number of countries, there are restrictions on the entry of foreign capital into a number of industries and strategically significant enterprises (Russia, Belarus). Ref. [22] analyzed firms’ financing (formal and informal), but did not discover what determines the firm’s access to financing when legal institutions are undeveloped. The impact of controlling owner on financing decisions remains underexplored.
Hypothesis 3.
Foreign ownership is important for removing financial constraints. The perception of the benefits of a foreign investor changes with the changing external environment after crisis. The presence of a foreign investor changes the perception of the state as an additional barrier in attracting financial resources. To remove financial constraints, the help of foreign capital is important precisely in the period of crisis. Foreign capital assumes control functions in the case of state participation in the ownership structure.
The second group of hypotheses follows the direction of research on the influence of debt choice.
As previous studies have shown [23], the financial system (bank-based or bond-market-based) is critical to providing companies with financial resources. Most researchers investigate the influence of bank credits and trade credits, while the analysis of the role of corporate bond markets is very limited. Ref. [18] analyzed the interrelationship between bank lending constraints and alternative external finance: trade credit, informal lending, non-banking loans, market financing, and state grants, for a sample of SMEs from 11 European countries. The 2008 financial crisis significantly changed the financial sector regulation policies. This affected the perception of financial constraints on access to financial resources. Ref. [24] showed that for the pre-crisis period, the higher competition among the banks and entrance of foreign-owned banks, the weaker financial constraints. Ref. [23] confirmed the hypothesis that the strengthening of the market power of banks in Europe after the crisis generated more financial constraints.
Hypothesis 4.
The role of the development of the banking system changes over time. The role of bank loans changed during the crisis. The volume of bank credit to the private sector has nonlinear effects on access to financial resources.
Hypothesis 5.
The volume of local currency (LCY) corporate bond market has nonlinear effects on access to financial resources.
We suggest that banking sector development tends to increase interbank competition, reduce the cost of debt, and improve service quality. As a result, the exposure of credits tends to grow. Bond market has a similar influence on reducing barriers for financing. The development of various segments of debt market can be quite advantageous due to the fact that in order to realize investment projects, the companies are able to substitute successfully one source of financing for another [7]. At the same time, a high level of debt burden at the firm level may increase the barriers for financing and facilitate the reduction of investments costs of the company [19]. Therefore, we can expect that the optimal level of development of debt sector reduces the barriers for financing for the national companies, which in turn contributes to the movement towards sustainable development.
As far as the authors know, nowadays there are no papers analyzing the influence of the development of the bond market on financial constraints at the firm level. We measure the financial depth of national debt market by the level of development of bank crediting to the private sector and corporate bonds segment. The impact of the quality of the institutional environment and the level of the development of the national financial market on financial constraints was considered by [8]. We expand this line of research by introducing control over the factors of financial market development.
The companies, which operate in the countries with low quality of institutional environment, face high agency costs and barriers for financing [2,25]. Index of Economic Freedom may have a nonlinear impact, because it is calculated based on a wide range of components, which influence differently on the barriers for financing (protection of investor rights, investment freedom, tax freedom, corruption freedom, etc.).
Research prior to the crisis has clearly highlighted the positive role of institutions [1,26]. However, the crisis has slightly changed the assessment, especially for major emerging markets, such as China (see [2]).
The third group of hypotheses assesses the role of the institutional environment:
Hypothesis 6.
Such factors as political stability, government effectiveness, the quality of regulation, the rule of law, and corruption control reduce constraints for financing.
Hypothesis 7.
Index of Economic Freedom (IEF) Heritage Foundation has a nonlinear impact on the barriers for financing.
3. Model Specification
Ref. [21] presented an overview on the literature related to measuring financial constraints. We consider an original binary variable, which describes the obstacle to finance obtained from company surveys. Unlike previous researches, the focus of our research is on post-communist countries. An originality of our research is that we analyze nonlinear and multiplicative effects of different factors on financial constraints.
To test the abovementioned hypotheses, we apply random models: simple probit model and Heckman’s model.
We test probit models expressed by Equations (1) and (2):
where are coefficients before explanatory variables, are explanatory variables. Further details could be found in Appendix E.
The average marginal effects are calculated according to the formula:
Considering the possible sample bias due to self-selection, we formulate different specifications of binary choice model of Heckman (heck-probit).
The Heckman model in general form is the following:
Outcome:
with the following selection condition:
Obstacle = 1 if y* > 0; = 0 otherwise,
yi*(outcome) = βXi + ui1, where ui1~ N(0;1),
Select:
where β is the coefficient for the explanatory variable, Xi are independent variables, I = 1, …, N is the number of independent variables, ui1 and ui2 are random errors, yi*(outcome) is the obstacle to access to finance, yi*(select) is an attribute of a loan or a credit line in the last year.
Have_credit = 1 if y* > 0; = 0 otherwise,
yi*(select) = (βXi + ui2> 0),
ui2~ N(0; 1), corr(ui1; ui2) = ρ,
Descriptions of the dependent and explanatory variables are given in Appendix E.
4. Stylized Facts and Sample Descriptive Statistics
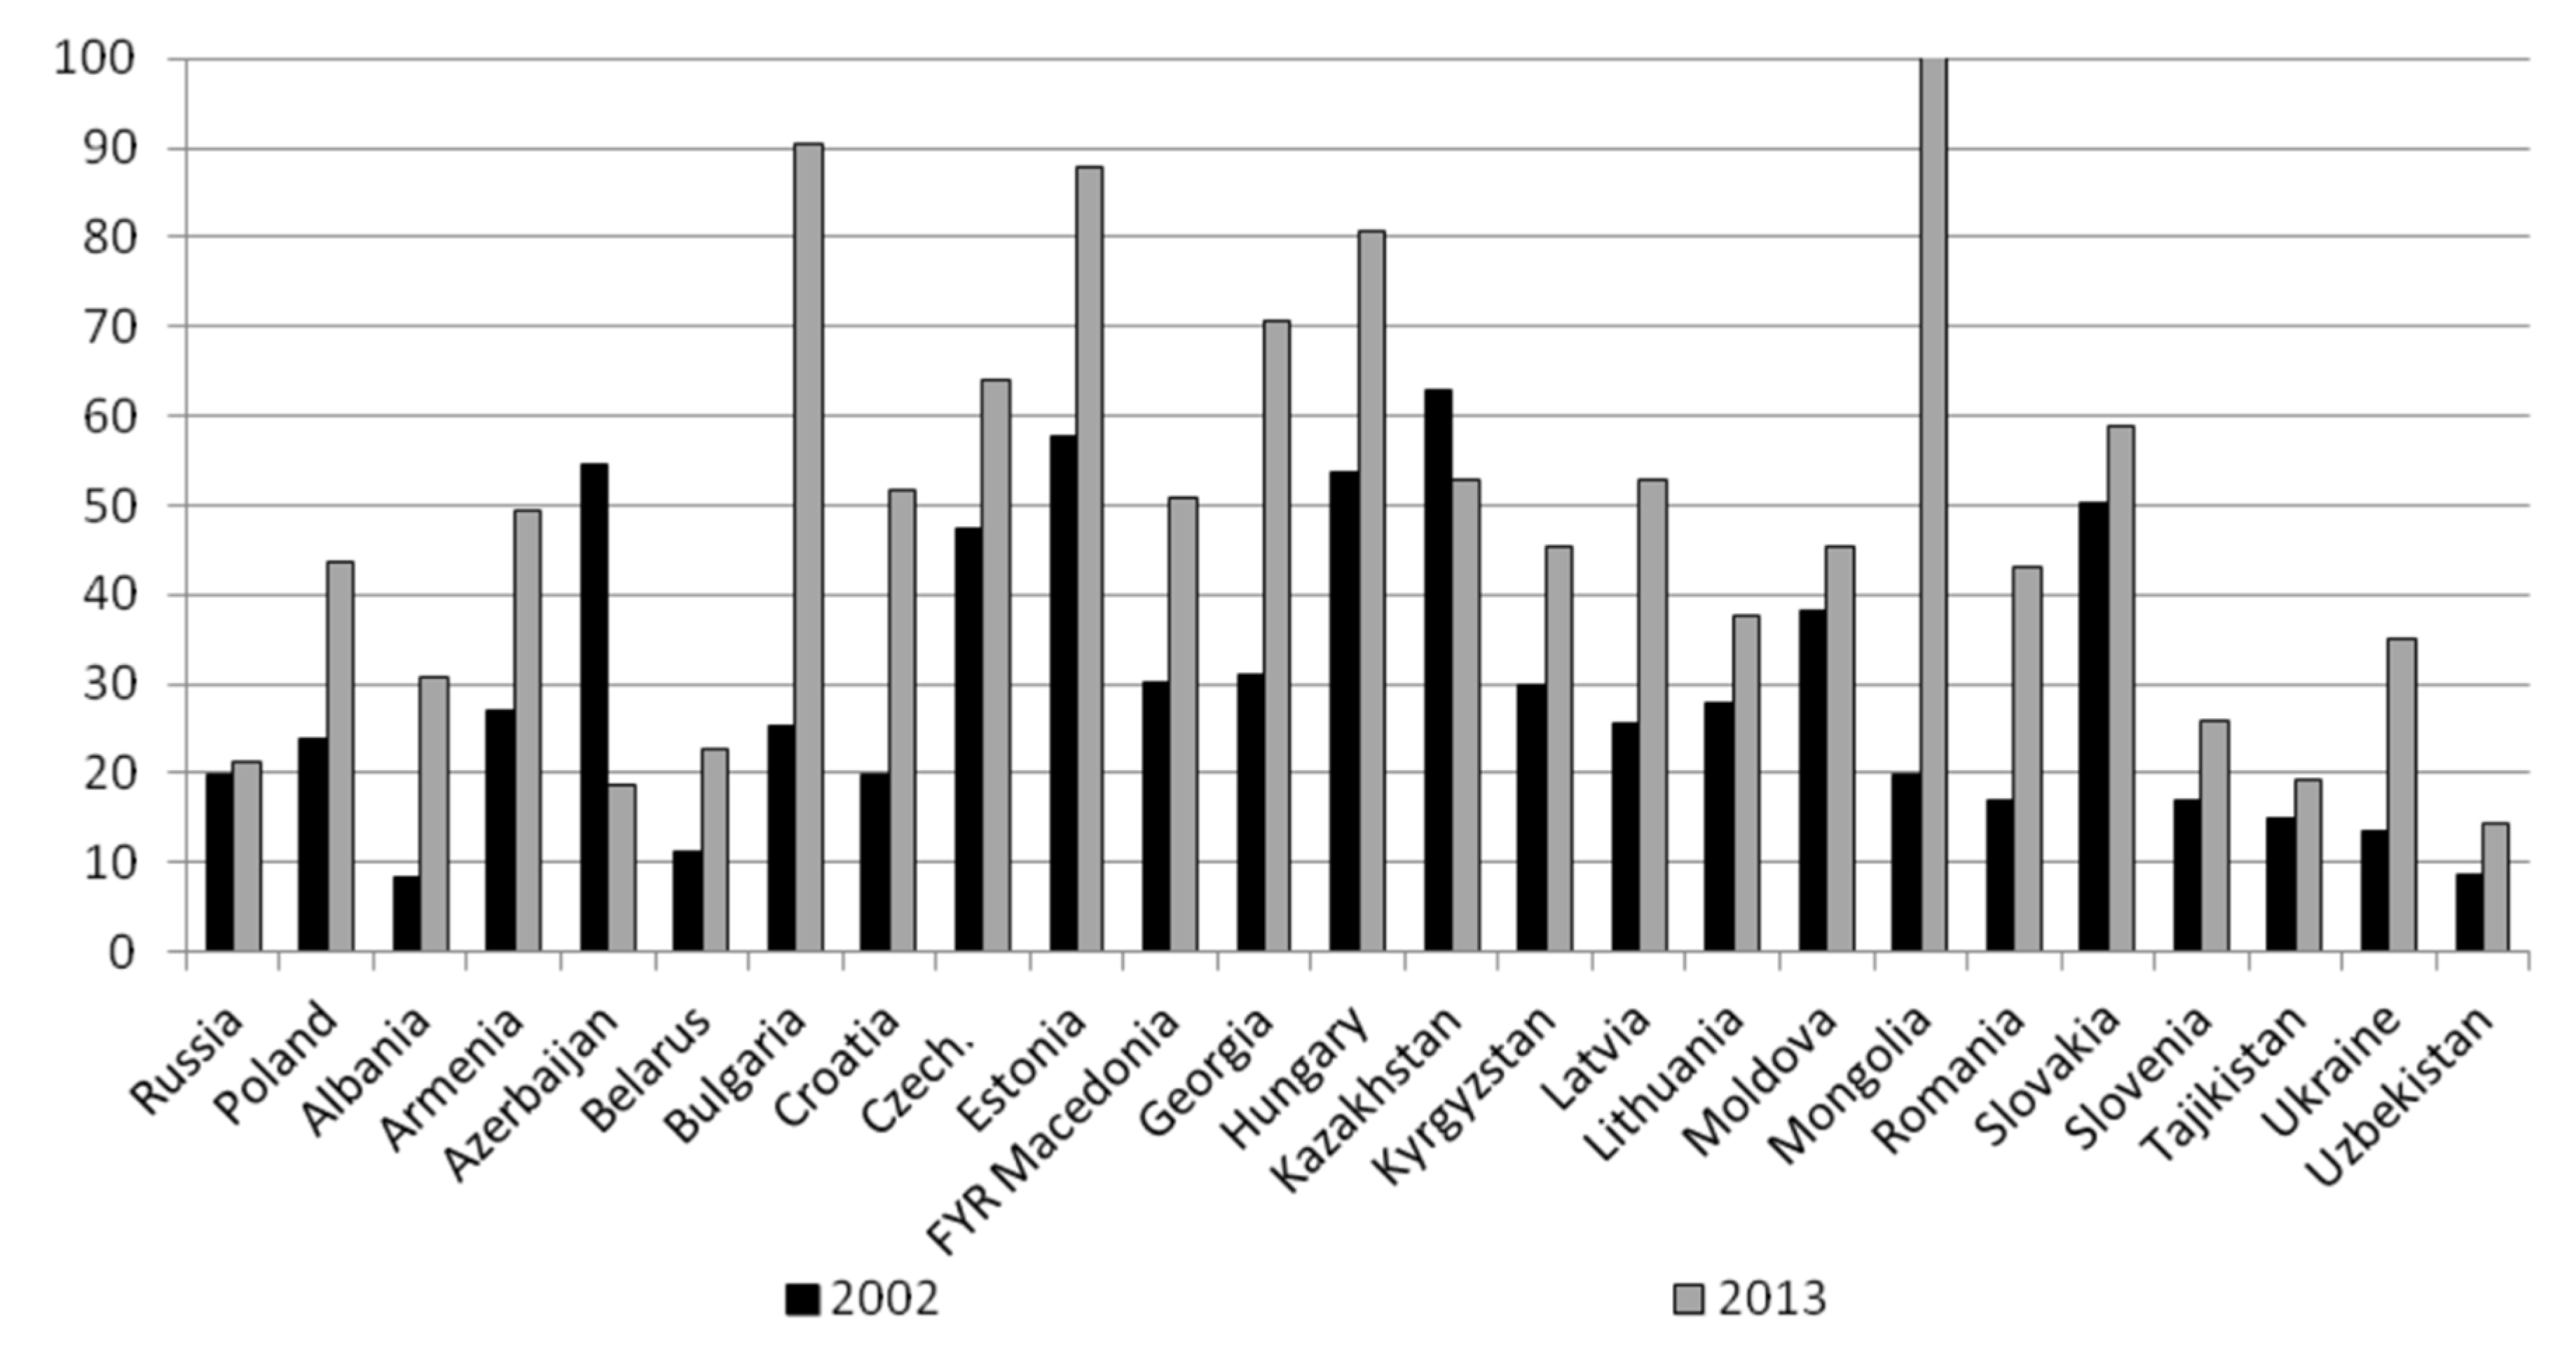
The former communist bloc is essentially different regarding the policy of transition to market economy. In Appendix A, the figures show significant progress since the 1990s. Figure A1 demonstrates the dynamics of the accumulated amount of foreign direct investment (% GDP) from 1995 to 2015 and presents the list of countries in our sample. In 1995, in the large majority of the considered countries, excluding Hungary and Estonia, the FDI stock did not exceed 15% of GDP. In subsequent years, a number of small countries proactively followed the policy of liberalization of foreign participation in economy and as a result, the FDI stock moved beyond 40% of GDP in 2015 for the half of the considered countries, and in some countries (Bulgaria, Estonia, Georgia, Mongolia), 80% of GDP (Figure A1). On the contrary, in countries such as Russia, Tadzhikistan, and Uzbekistan, foreign investments were strictly regulated and limited, and as a result, the FDI stock in these countries did not reach 30% of GDP (Figure A1 and Appendix A for the sampling period of the survey).
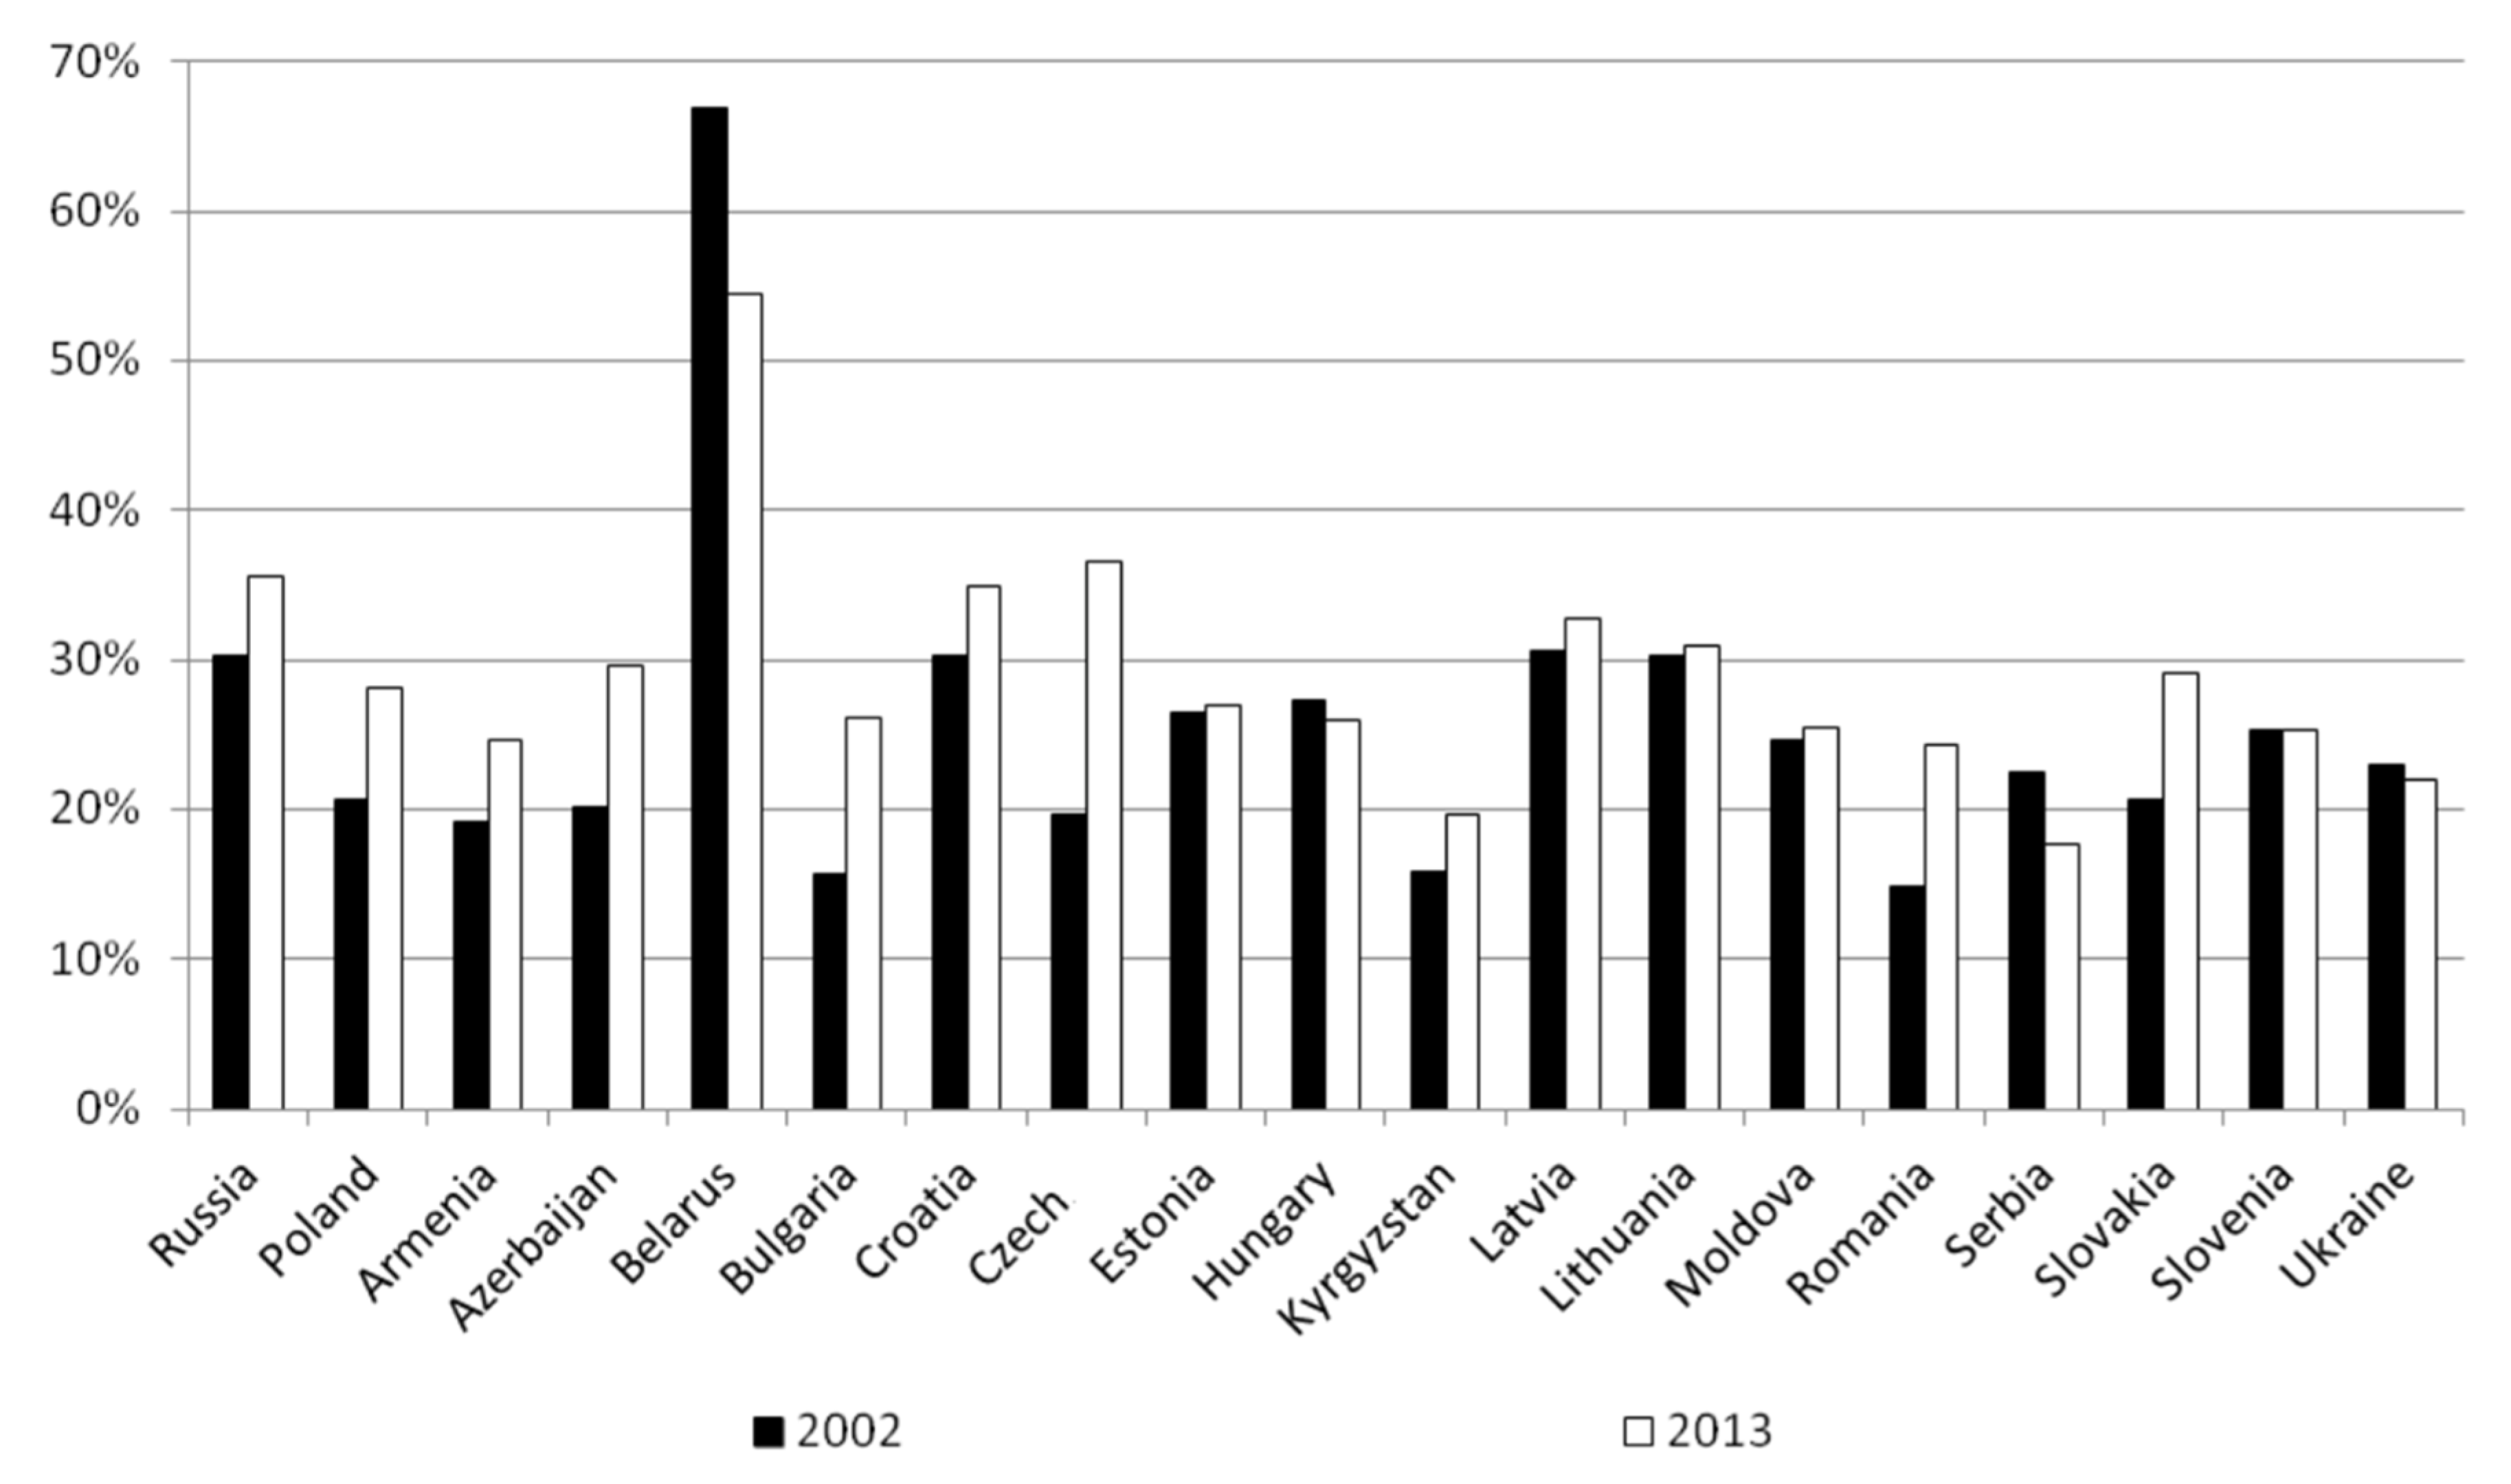
In general, in accordance with the sample of the considered countries, the most significant reducing of the share of the public sector took place between 1995 and 2005: the median share of the employed in the public sector was 41.2% in 1995, in 2005—25.1%, in 2015—26%, practically corresponding to the level of 2005 (Appendix A). Nevertheless, the share of employed in the public sector is essentially different over the countries. Thus, in 2005 in Belarus the share of employed in the public sector was 66.5%; in Russia, Lithuania, and Latvia was 30–32%; in Estonia, Slovenia, Poland, and Moldova was 25–26%; and in Albania, Kirghizia, and Armenia only 16–18% (Figure A2).
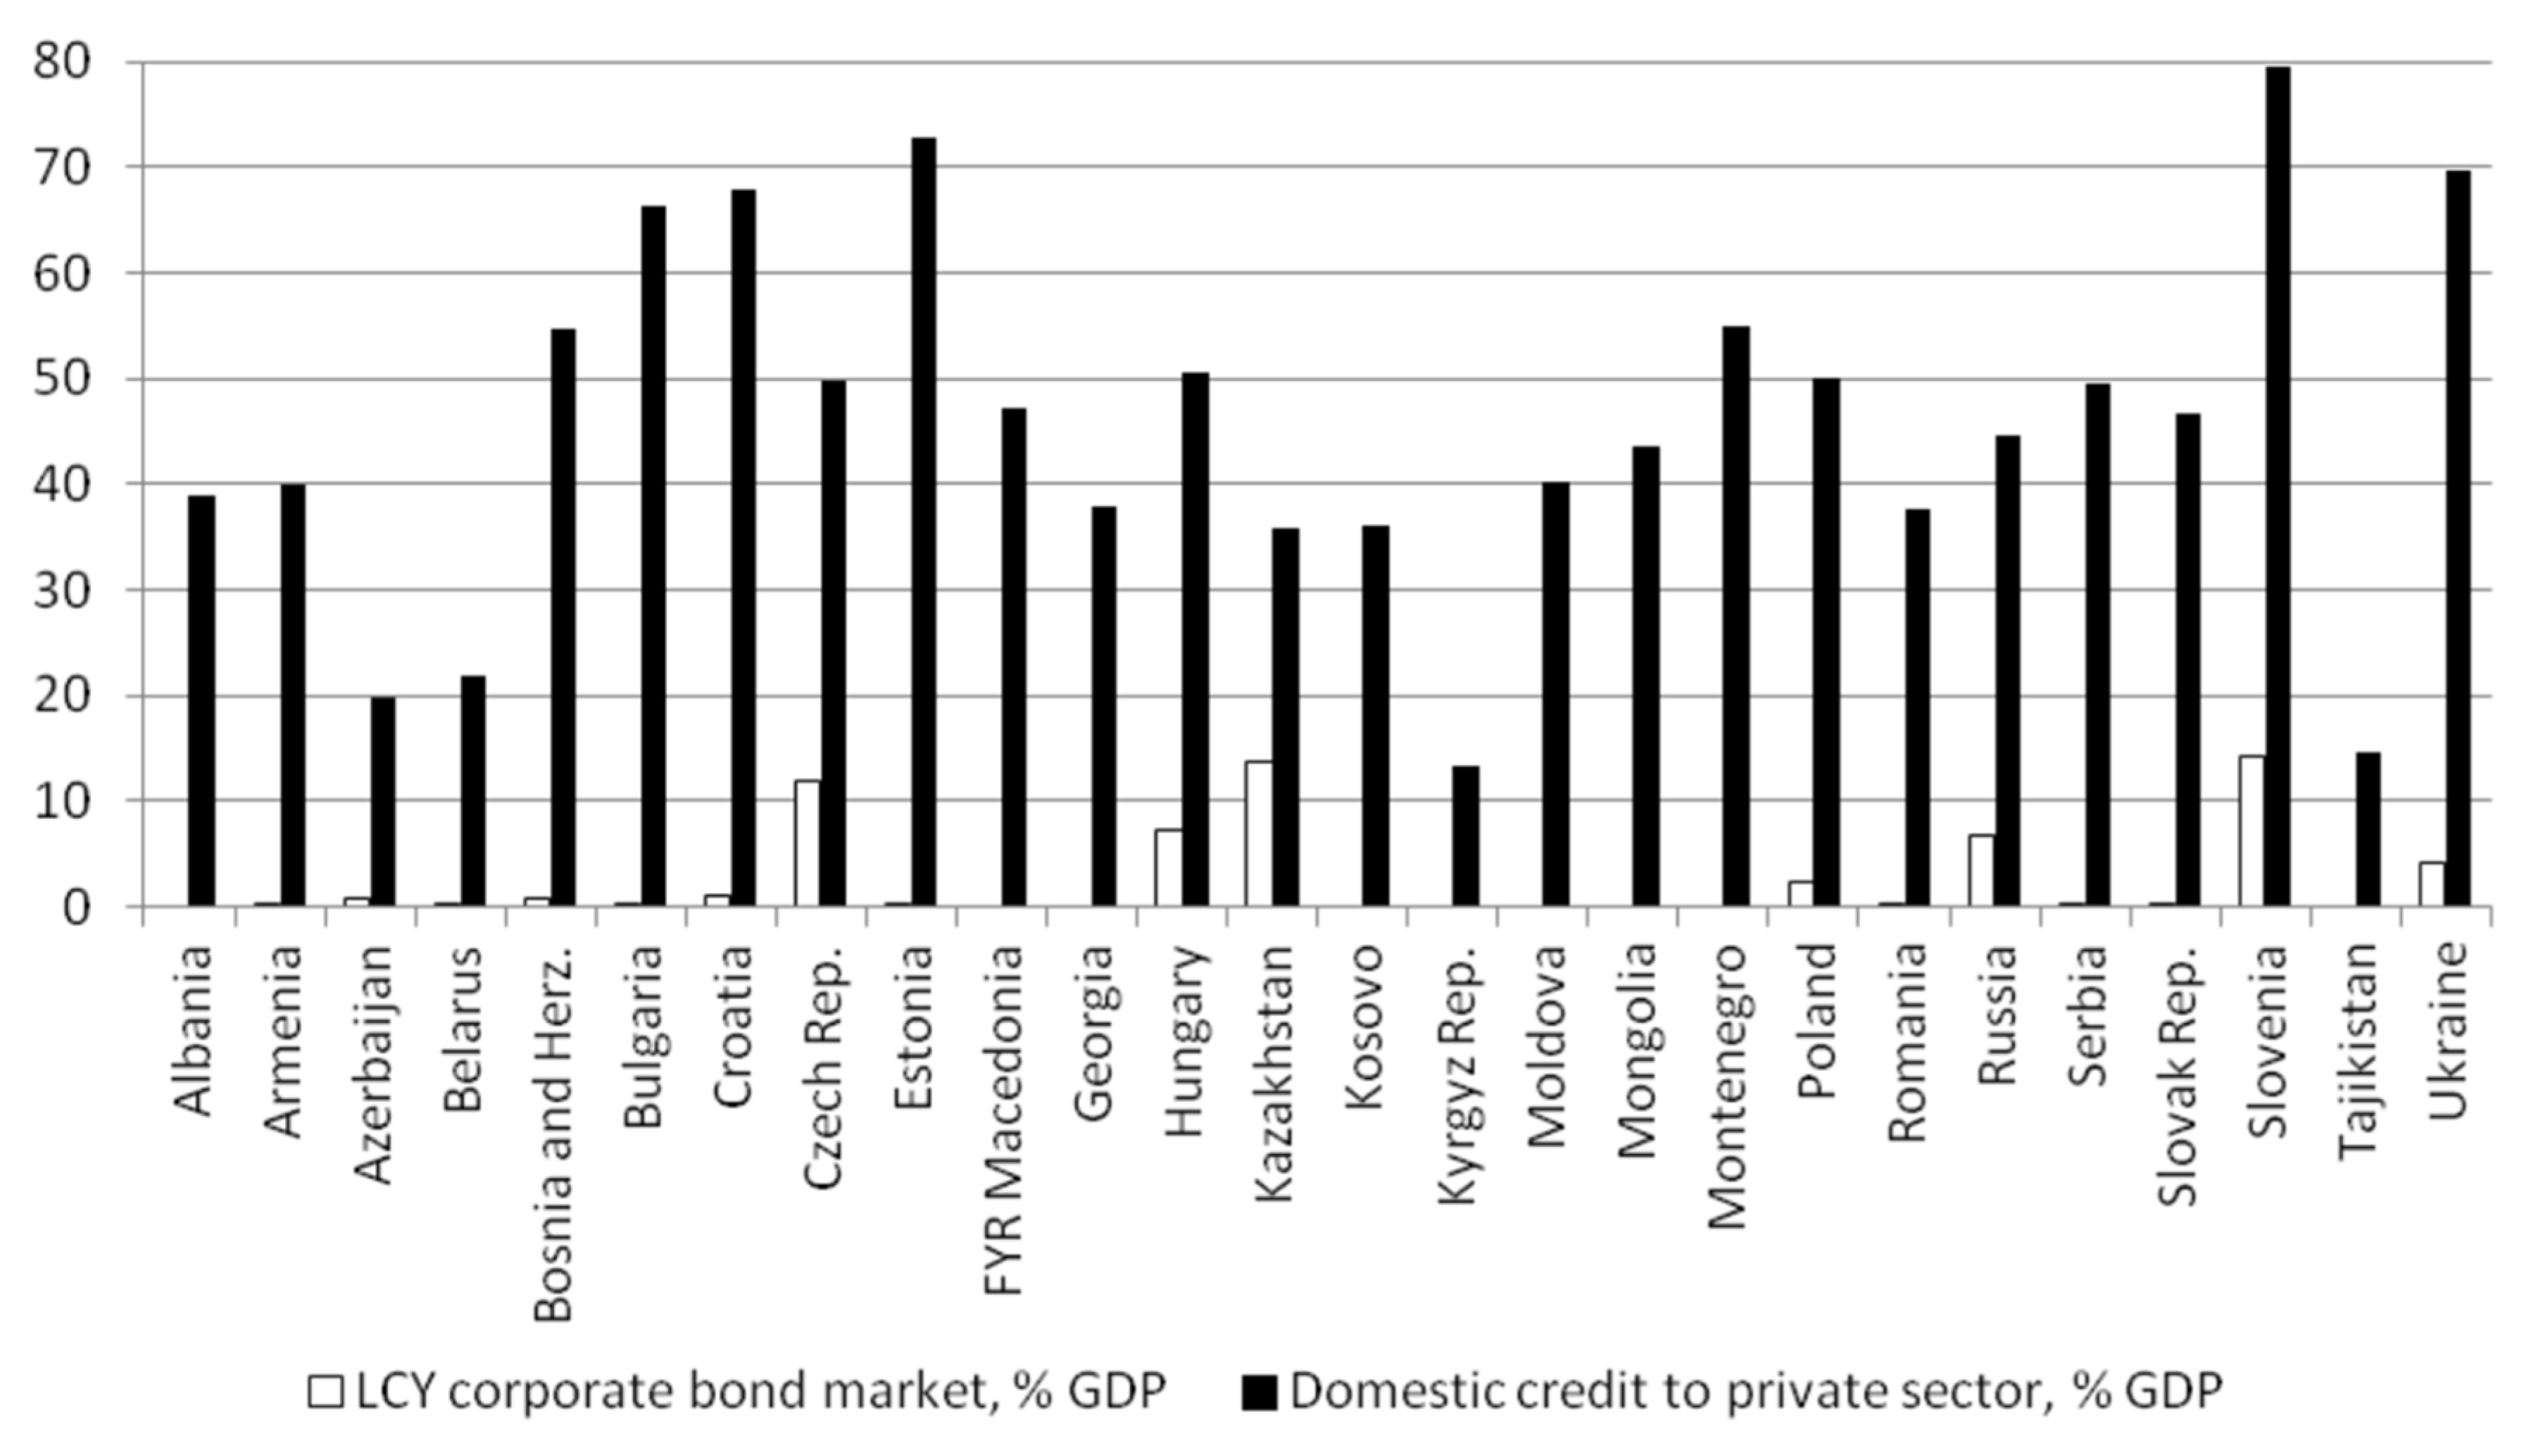
There are significant cross-border differences in indicators of debt market growth (bank-based or bond (market)-based) (Figure A3). Thus, in 2012, the amount of bank credits provided to the private sector in Bulgaria, Croatia, Estonia, Slovenia, and Ukraine exceeded 60% of GDP, and in Azerbaijan, Kirghizia, Tadzhikistan it did not reach even 20% of GDP (Figure A3). For all former communist bloc the amount of bank crediting is prevalent in comparison with the amount of local currency corporate bonds outstanding (Figure A3). The opening of the stock market took place between 1989 and 1995 (Appendix B, Table A1) in the vast majority of the former communist bloc. As for Armenia, Azerbaijan, Bosnia and Herzegowina, Kirghizia, Serbia, and Tadzhikistan, the stock market did not appear until 2000. The starting date of issuance of corporate bonds is different as well (Appendix B).
There are significant cross-border differences in the quality of institutional environment (Appendix B), caused by distinct state policy in the framework of granting political and economic freedom.
In previous studies, there is no consensus about the best measure of financial constraints [27,28]. A popular approach [4,5,16] is the indirect measurement based on the analysis of the sensitivity of investment expenditures to cash flow. Such indirect methods are not without disadvantages, and over the last years there were critical papers showing the deficiency of popular metrics of financial constraints through investment activities. For example, [29] found that for US firms the sensitivity ‘investment-cash flow’ is not a reliable indicator. We introduce a binary dummy reflecting the level of financial constraints. We form a representative sample (more than 32,000 observations) from different sources ([3,30,31]), including firm-level and county-level data.
We study 28 countries that were formerly part of the USSR and the Council for Mutual Economic Assistance (CMEA), which operated before 1991. Our research is based on the survey data of the private sector “EBRD-World Bank Business Environment and Enterprise Performance Survey (BEEPS)” (see [32]). The CMEA was an intergovernmental economic organization that advocated non-market economic relations. After the collapse of the CMEA and the USSR, the breakaway countries began to implement market reforms with varying degrees of intensity. The reforms affected both the state presence in the economy, state support, and access to the foreign capital markets. In different countries, the financial sector was formed according to different strategies. We supplemented the sample with indicators of the development of financial markets and institutional environment.
This sample may be useful as for the companies—better understanding of the business environment and for the regulatory authority—to implement reforms in order to facilitate the effectiveness of private business operations. The data is represented as a spatial sampling at a representative level. The sample includes 28 countries of the former communist bloc (Southern and Eastern Europe, Asia) (Appendix D).
The initial number of observations is 32,236, of which 9948 are observations conducted between 2002 and 2007, 9504during the crisis period (2008–2009), and 12,784during the post-crisis period (from 2011 to 2013).
In respect to the number of employees, the companies with a number of employees varying between 5 and 19 persons are placed in the category of small enterprises, from 20 to 99 to medium, and more than 100to a large one. The small and medium enterprises represent, respectively, 47.4% and 35.7% of the sample. The large corporations represent 16.9%.
One of the multiple focuses of our study is centered at the ownership structure (state and foreign) and the governmental support.
In Table 1, the presence or absence of foreign owners is compared with the estimation of obstacles to access to finance made by the executives of the considered companies. From Table 1, without taking into account the influence of other factors, it follows that companies with foreign capital benefit from the absence of barriers to financial resources. Our further econometric calculations should confirm this conclusion, taking into account a number of other factors and with the multiplicative influence of state property.
Table 2 shows the balance of the state participation in the ownership structure and company’s assessment regarding the availability of financial resources. Based on Table 2, we conclude that companies with state ownership are more confident in access to financial resources. Confidence has been built up since 2005. The question of how much this perception changes when other factors are taken into account is the next stage of our study using the Heckman model.
The relationship among state subsidies, the structure of debt instruments used, and concerns expressed by top managers about access to funding based on the survey are shown in Appendix C. Table A2 and Table A3 are constructed similarly to Table 1 and Table 2.
According to Table A2 (Appendix C), the presence of state subsidy is observed both when estimating the access to finance as a serious barrier and in case if financing is not considered as a problem. It follows from Table A2 (Appendix C) that firms with and without government support equally felt the presence of financial constraints. The situation changed during the crisis, but after the crisis it returned to its previous level. It can be assumed that support is important precisely during a crisis. In other periods, the role of the state as an assistant is not important for companies. It is more important not to interfere. To what degree is important the role of the state as an arbiter and protector of the interests of entrepreneurs and investors, we analyze considering the introduction of institutional development indices by country.
Since financial constraints may be regarded in different ways depending on whether the company took on credits or opened a credit line last year, further analysis of financial constraints is conducted under control of bank’s relations. Table A3 (Appendix C) shows the statistical relationship between bank crediting and the access to financing our sample. It should be noted that for the period of 2002–2007 the data is not presented, as there are no mutual observations of two variables. In other words, if the company answered the question whether the credit was received last year, it would be few answers regarding the estimation of access to finance, and vice versa. For this period, we use the probit model.
Let us consider the period 2008–2013. In accordance with descriptive analysis, for the companies with no credits or open credit lines for the last year, the access to finance is not considered as a serious barrier (63%), rather than for those in which crediting is considered as a form of borrowing (37%).
The descriptive analysis of data is not able to give a full recognition of diversity and individual features of the given companies, i.e., it does not demonstrate the whole picture of dependence of access to finance on availability of crediting.
Table 3 and Table A5 (Appendix D) demonstrate the descriptive statistics for variables of the sample for two periods of time: from 2002 to 2007 and from 2008 to 2013. The number of country observations is demonstrated in Table A4 (Appendix D).
The descriptive statistics show that the sample contains no startups and no 100-year-old companies. The average age of 25 years corresponds to the period of the beginning of soft reforms in the economy. The firms in the sample got younger after the crisis (Table 3).
Our sample does not include completely state-owned companies; for most companies, the state does not even have a blocking stake. However, there are companies in the sample with a share close to the control. The position on foreign presence is similar. The presence of foreign capital decreased after the crisis.
The share of the state in the ownership structure is inversely proportional to the degree of development of a financial system (share of bonds and bank credits) and indicators of the institutional environment (legislative protection, etc.). Before the crisis, the share of foreign participation in the ownership structure was negatively correlated with the share of the state. After the crisis, the statistical significance of this negative relationship disappeared.
The level of development of the bond market (market-based financial system) is closely related to economic freedom (IEF).
It follows from Table 4 and Table 5 that a significant high correlation is observed only between institutional variables when a variable is taken into account separately for both the pre-crisis and crisis periods. Furthermore, in the study, such explanatory variables were not simultaneously included in the same model specification.
5. Empirical Results
Table 6 shows the average marginal effects for heckprobit models for the period from 2008 to 2013. Wald test shows that the model is well specified. All covariates are significant. Null hypothesis of correlation of equation errors of outcome and selection is rejected. We conclude that the heckprobit model is considered more appropriate than the simple probit model. Our choice is determined by the presence of bias influence of given factors on difficult access to finance, for the reason whether the company has credits or open credit lines. Robustness check for the period from 2008 to 2013 was realized by testing the simple probit models for the set of variables previously included in heckprobit models. In general, the signs and directions of influence of the variables coincide, excluding the variable of state subsidies (Table 6). Appendix E shows the average marginal effect for probit models for the period from 2002 to 2007.
For the years 2008–2013 (Table 6), if there is a foreign participation, it reduces the possibility that companies consider the access to finance as a serious barrier. During the crisis period, the sign of this variable is negative as well. Thus, the presence of foreign investor reduces agent costs, and companies go through less financial constraints. Our results show that during the crisis and post-crisis periods, the presence of foreign capital is considered by top managers as a positive factor for removing constraints. This conclusion coincides with the results obtained by [5,9]. For the years 2002–2007 (Table A6, Appendix E), the dependence is inverse: an increase in barriers for financing on the national market is observed provided that foreign participation is available. The pre-crisis period was characterized by the high rates of economic growth, in general, and of financial sector, in particular. Under these circumstances, the presence of foreign investor gave no significant advantages. Moreover, foreign investors were not aware of internal markets features of economies in transition or the established practice of law enforcement. Hereby, we explain the positive sign with foreign capital variables (foreign_ownership, have_foreign_owner). During the crisis, under conditions of liquidity shortage, the presence of direct foreign investor became significant and it is probably related with the availability to access foreign sources of financing. The direction of influence is changed (Hypothesis 3 is accepted).
State participation in capital is considered by top managers as a barrier for financing (Hypothesis 1 is accepted). Upon state share growth in ownership structure in the pre-crisis period (2002–2007) and during the crisis, there is a possibility that access to finance will be a serious barrier for the company. This conclusion coincides neither with the results by [8] for 81 countries nor [16] regarding Chinese market, but it corresponds with the results obtained by [12]. We explain the fact that top management assumes the state as an inefficient owner as follows: poor experience in managing enterprises in the market economy environment, and implementation of political and social purposes are the highest priorities. During the post-crisis period, the statistical significance of the state share in ownership structure is not high.
The use of multiplicative variables in the model allowed us to come to an original conclusion: if the structure of equity capital has both state and foreign participants, it will reduce the probability of financial constraints. This relationship is stable for both time periods. This conclusion is in compliance with the results by [5,6,8,9,16], which analyzed state and foreign participation in the ownership structure on a standalone basis. We attribute this to the positive effect as the foreign owner controls over weak state management (Hypothesis 3 is accepted). Management considers such kind of control as a favorable factor for company development.
Throughout the years 2002–2013, state subsidies significantly reduce barriers for financing, especially a positive effect appears during the crisis. This conclusion coincides with the results obtained by [4] for the Italian market. Thus, from the top managers point of view, the benefit of state participation in companies is to provide financial support, but the state is unable to ensure effective decision-making or assistance in attracting external sources of financing. Moreover, state-sponsored companies, which obtain subsidies, are unable to take full advantage of this financial support (Hypothesis 2 is accepted). The management of these companies considers these subsidies as additional barrier factors. Probably, the state by means of subsidies provision is trying to mitigate adverse effects of non-economic decisions, but company management considers this support in a negative way. Subsidies do not overcome the fact that political and social interests of the state prevail over economic ones.
If we consider simple probit models (Table 6), the variable of state subsidies will change the direction of influence and will have the low statistical significance. However, under the bank credit control, this variable becomes significant and its influence on the barriers for financing is negative. We conclude that for the companies, which attract financing, state subsidies are important in terms of removing barriers, the fact of subsidy obtaining has a positive effect in coordination with banks (Hypothesis 2 is accepted).
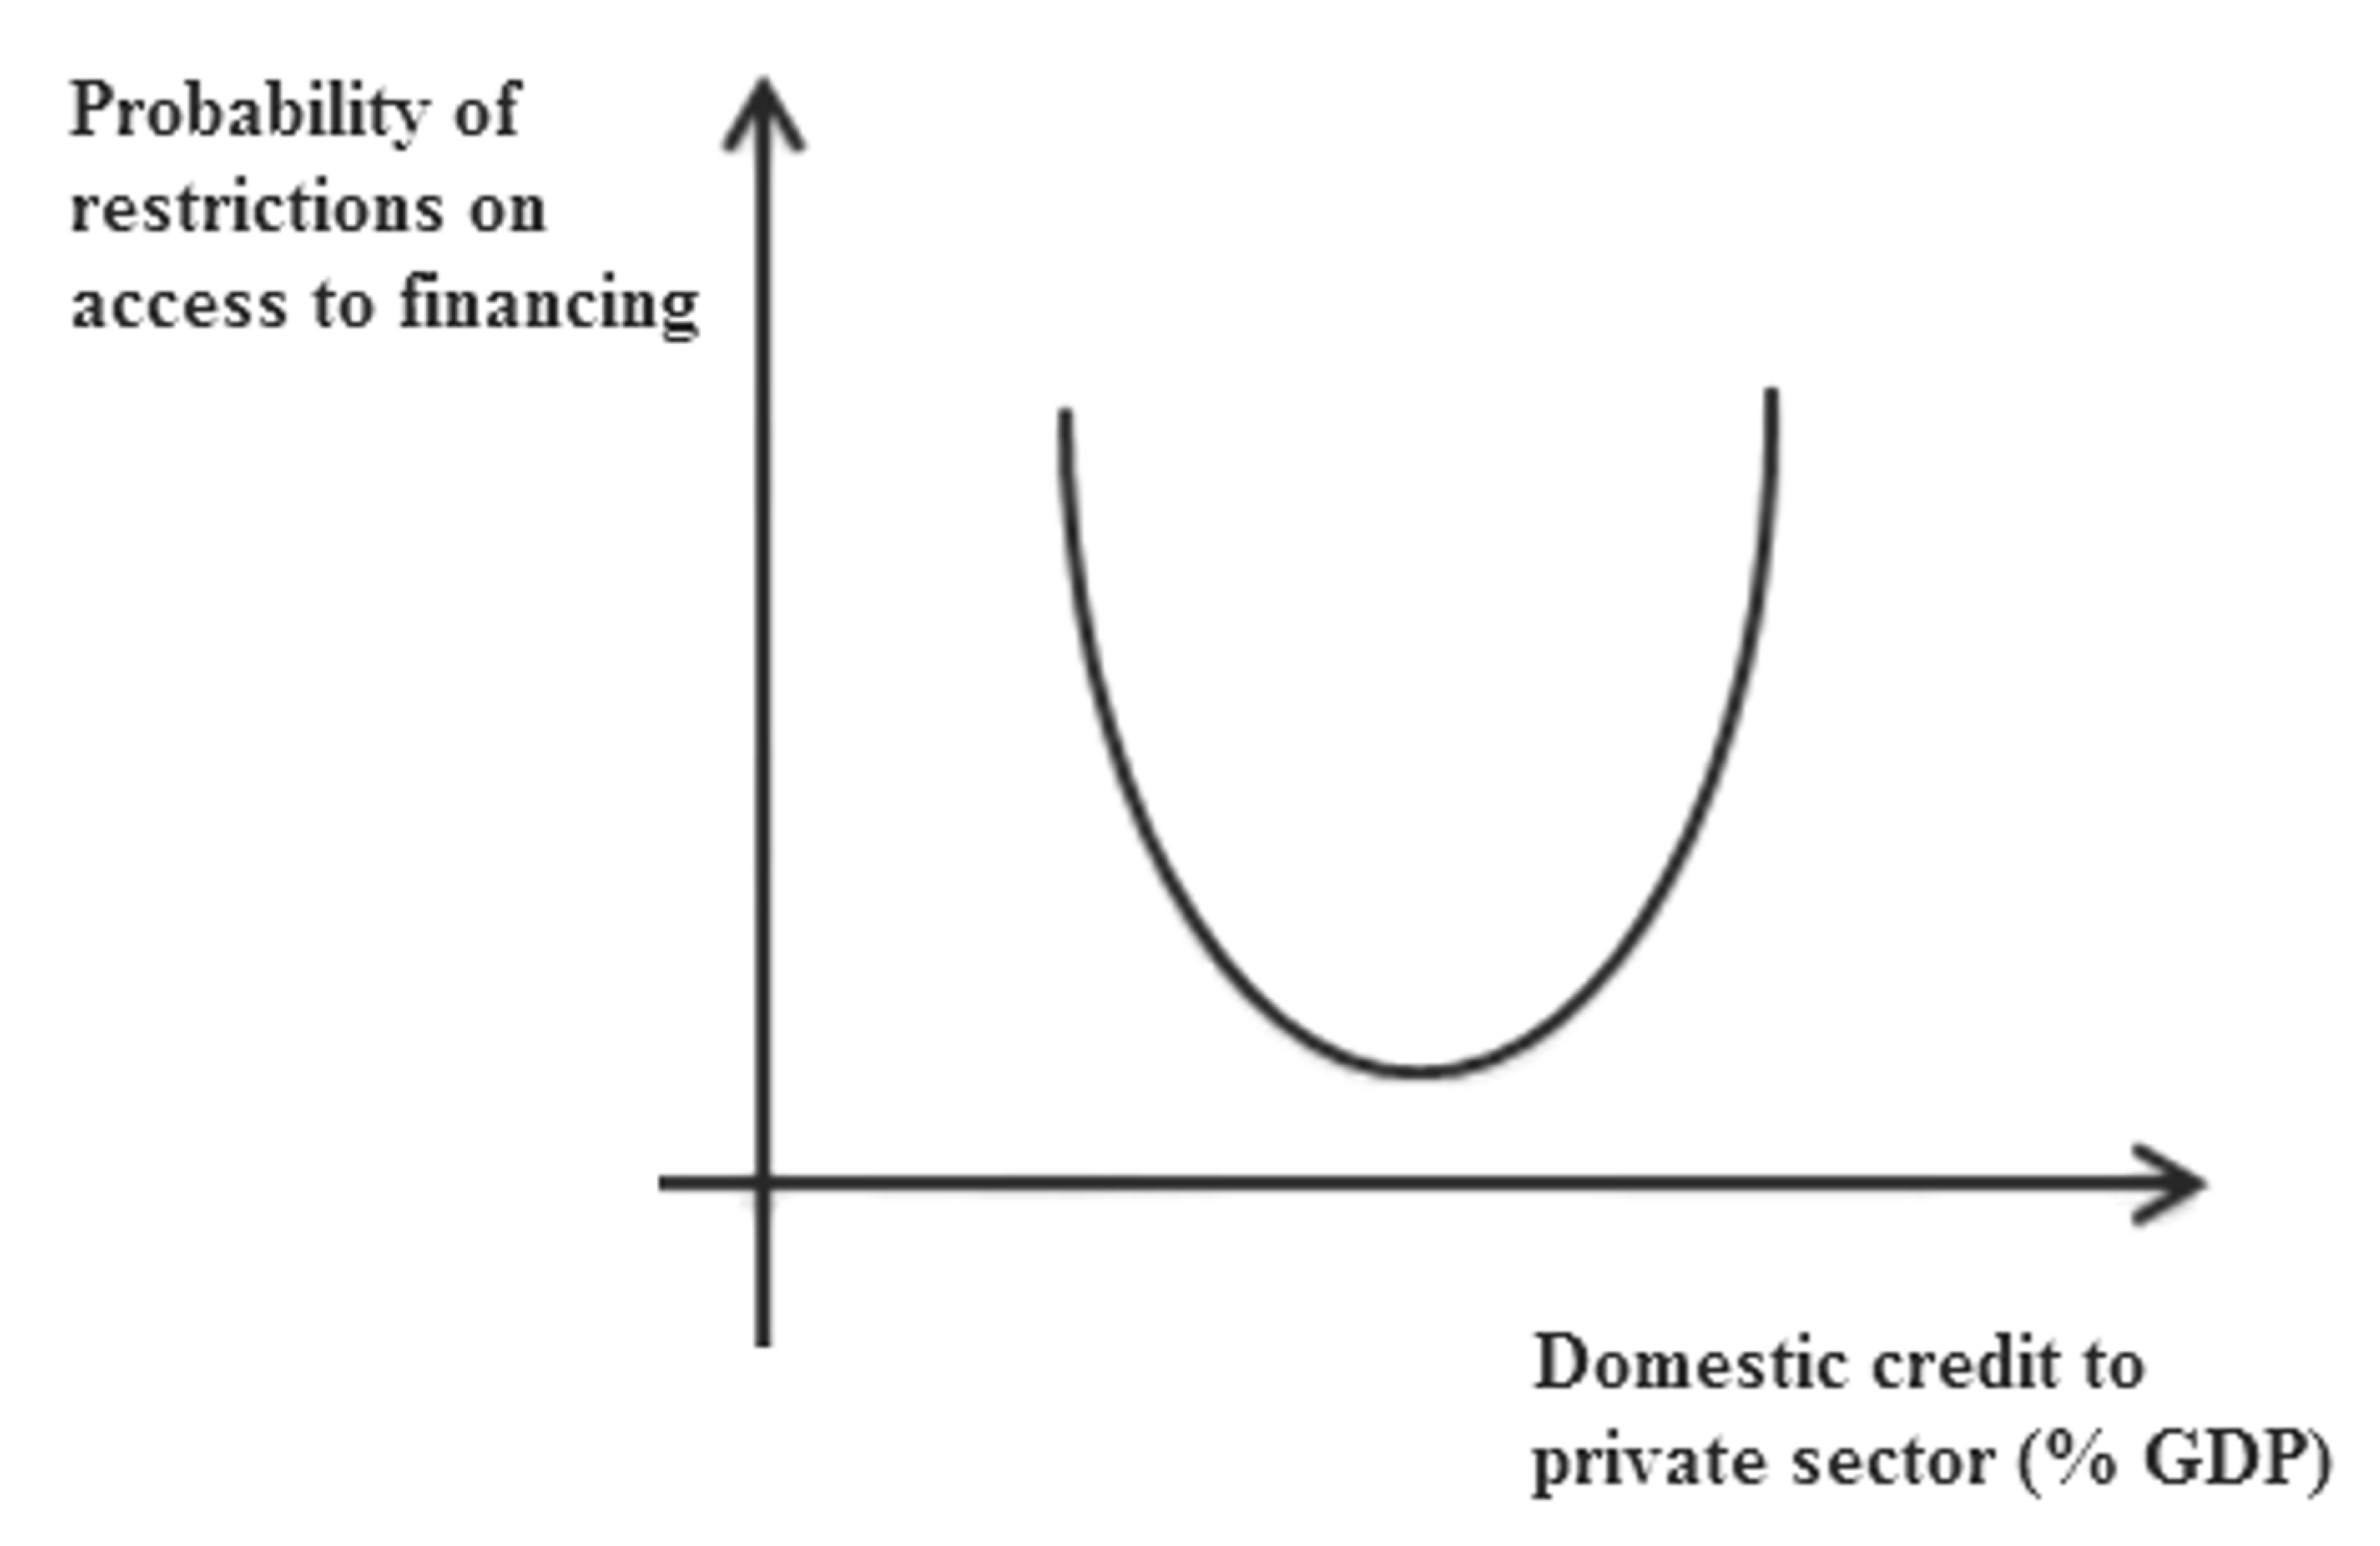
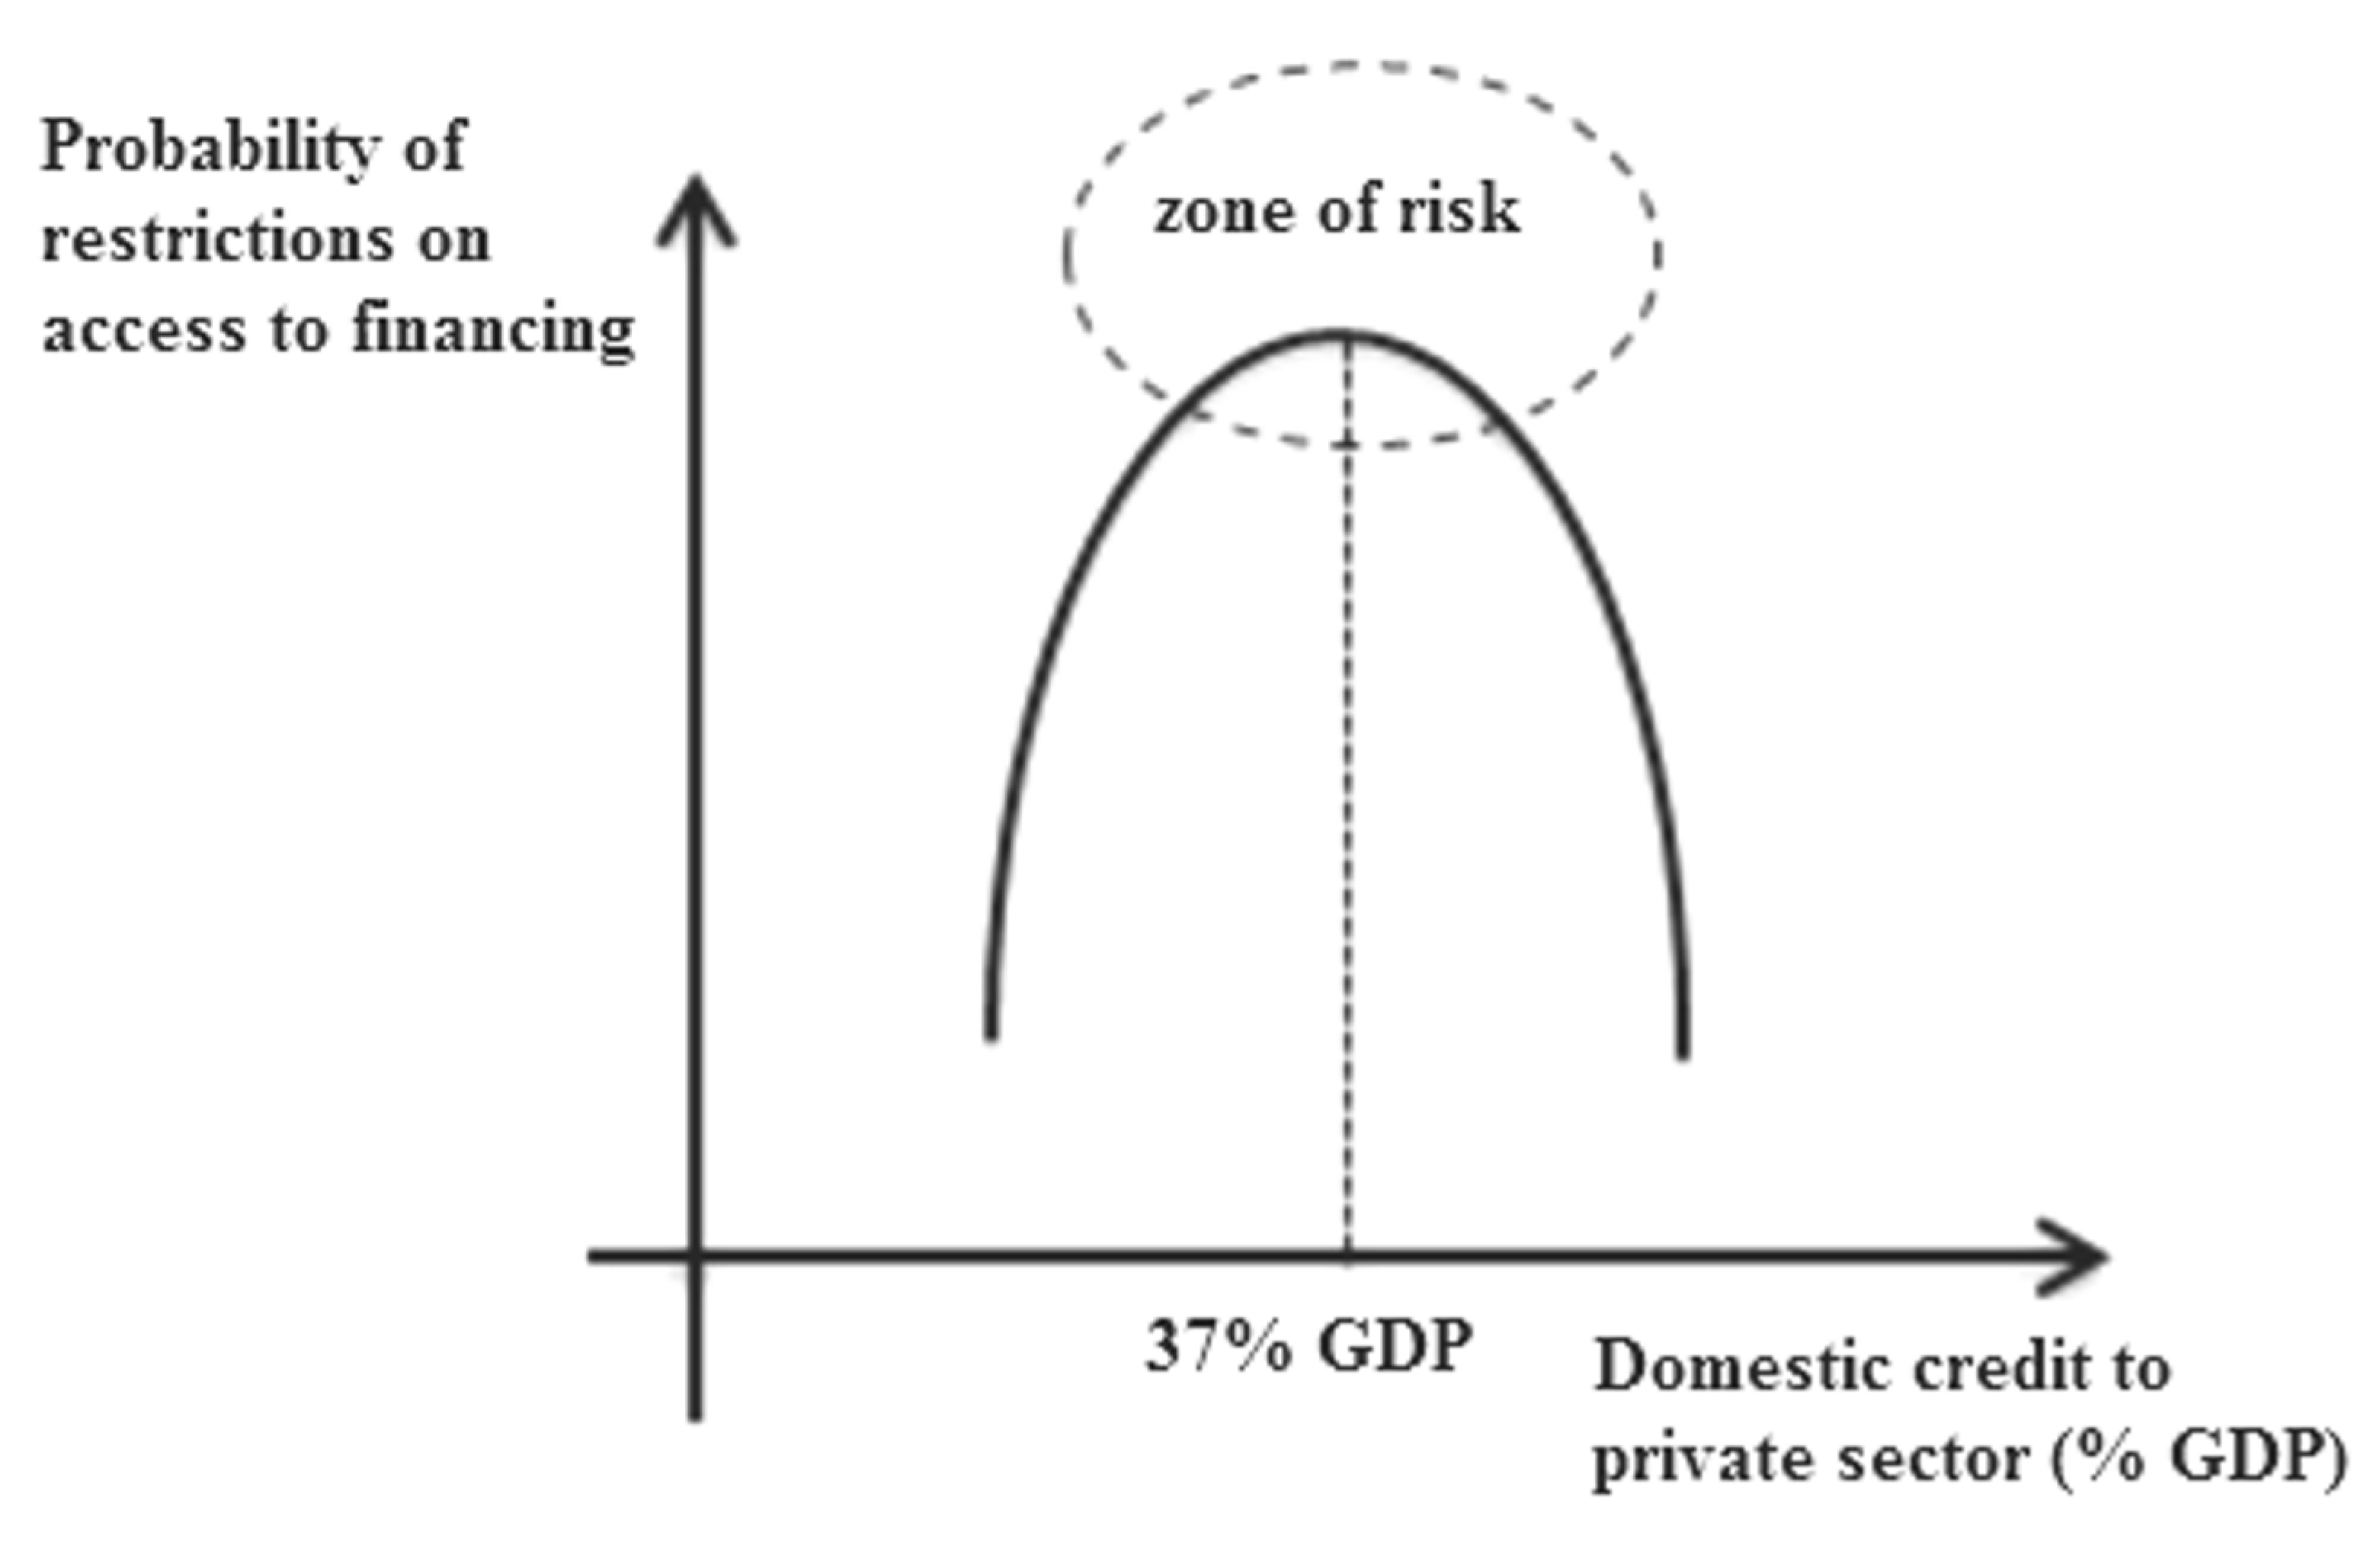
For the group of hypotheses of significance of financial market development, we obtained the following results. During the period of 2002–2007, the variable of bank credit to private sector (% of GDP) demonstrates a U-shape relationship on the probability of barriers existence (parabola, branches up, Figure 1 below). This figure and the four following figures below are given only for clarity and provide a schematic representation of the quadratic relationship between the variables. They are based primarily on the signs of the regression coefficients. The presented coordinates of the apexes of the parabolas are calculated based on the values of the regression coefficients.
It was easier to get the access to finance for the countries with more developed banking sector, but up to a certain development level of this sector. A highly developed banking sector (in % of GDP) was understood as an additional barrier. We explain this paradox as follows: the role of regulatory exposure was enhanced. The developed banking sector even before the crisis of 2008–2009 had been the object of more intensive state supervision and regulating, and the companies experienced this effect as well.
We obtained an original conclusion concerning the change in the role of the developed bank crediting during the crisis period (Hypothesis 2). The low volume of bank crediting shows that the companies are forced to find financial resources beyond the national market. Especially, it deals with small countries where the companies with foreign participation have the opportunity to enter global debt markets or take advantage of trade credit. During the crisis, a developed financial sector is considered to reduce the barriers for financing. Even when losing liquidity during the crisis, a strong banking sector will help to attract financing. The companies with poorly developed national market are placed at a difficult situation. During the crisis, the resources are reduced rapidly and tend to be deficient for the companies. The companies consider it as an increase of financial constraints. Thus, bank credit during financial crisis period demonstrates U-shape-like relationship (parabola with flex point at the level of 37% of GDP, Figure 2 below). During the post-crisis period (2010–2013), the growth level of bank credit is no longer significant.
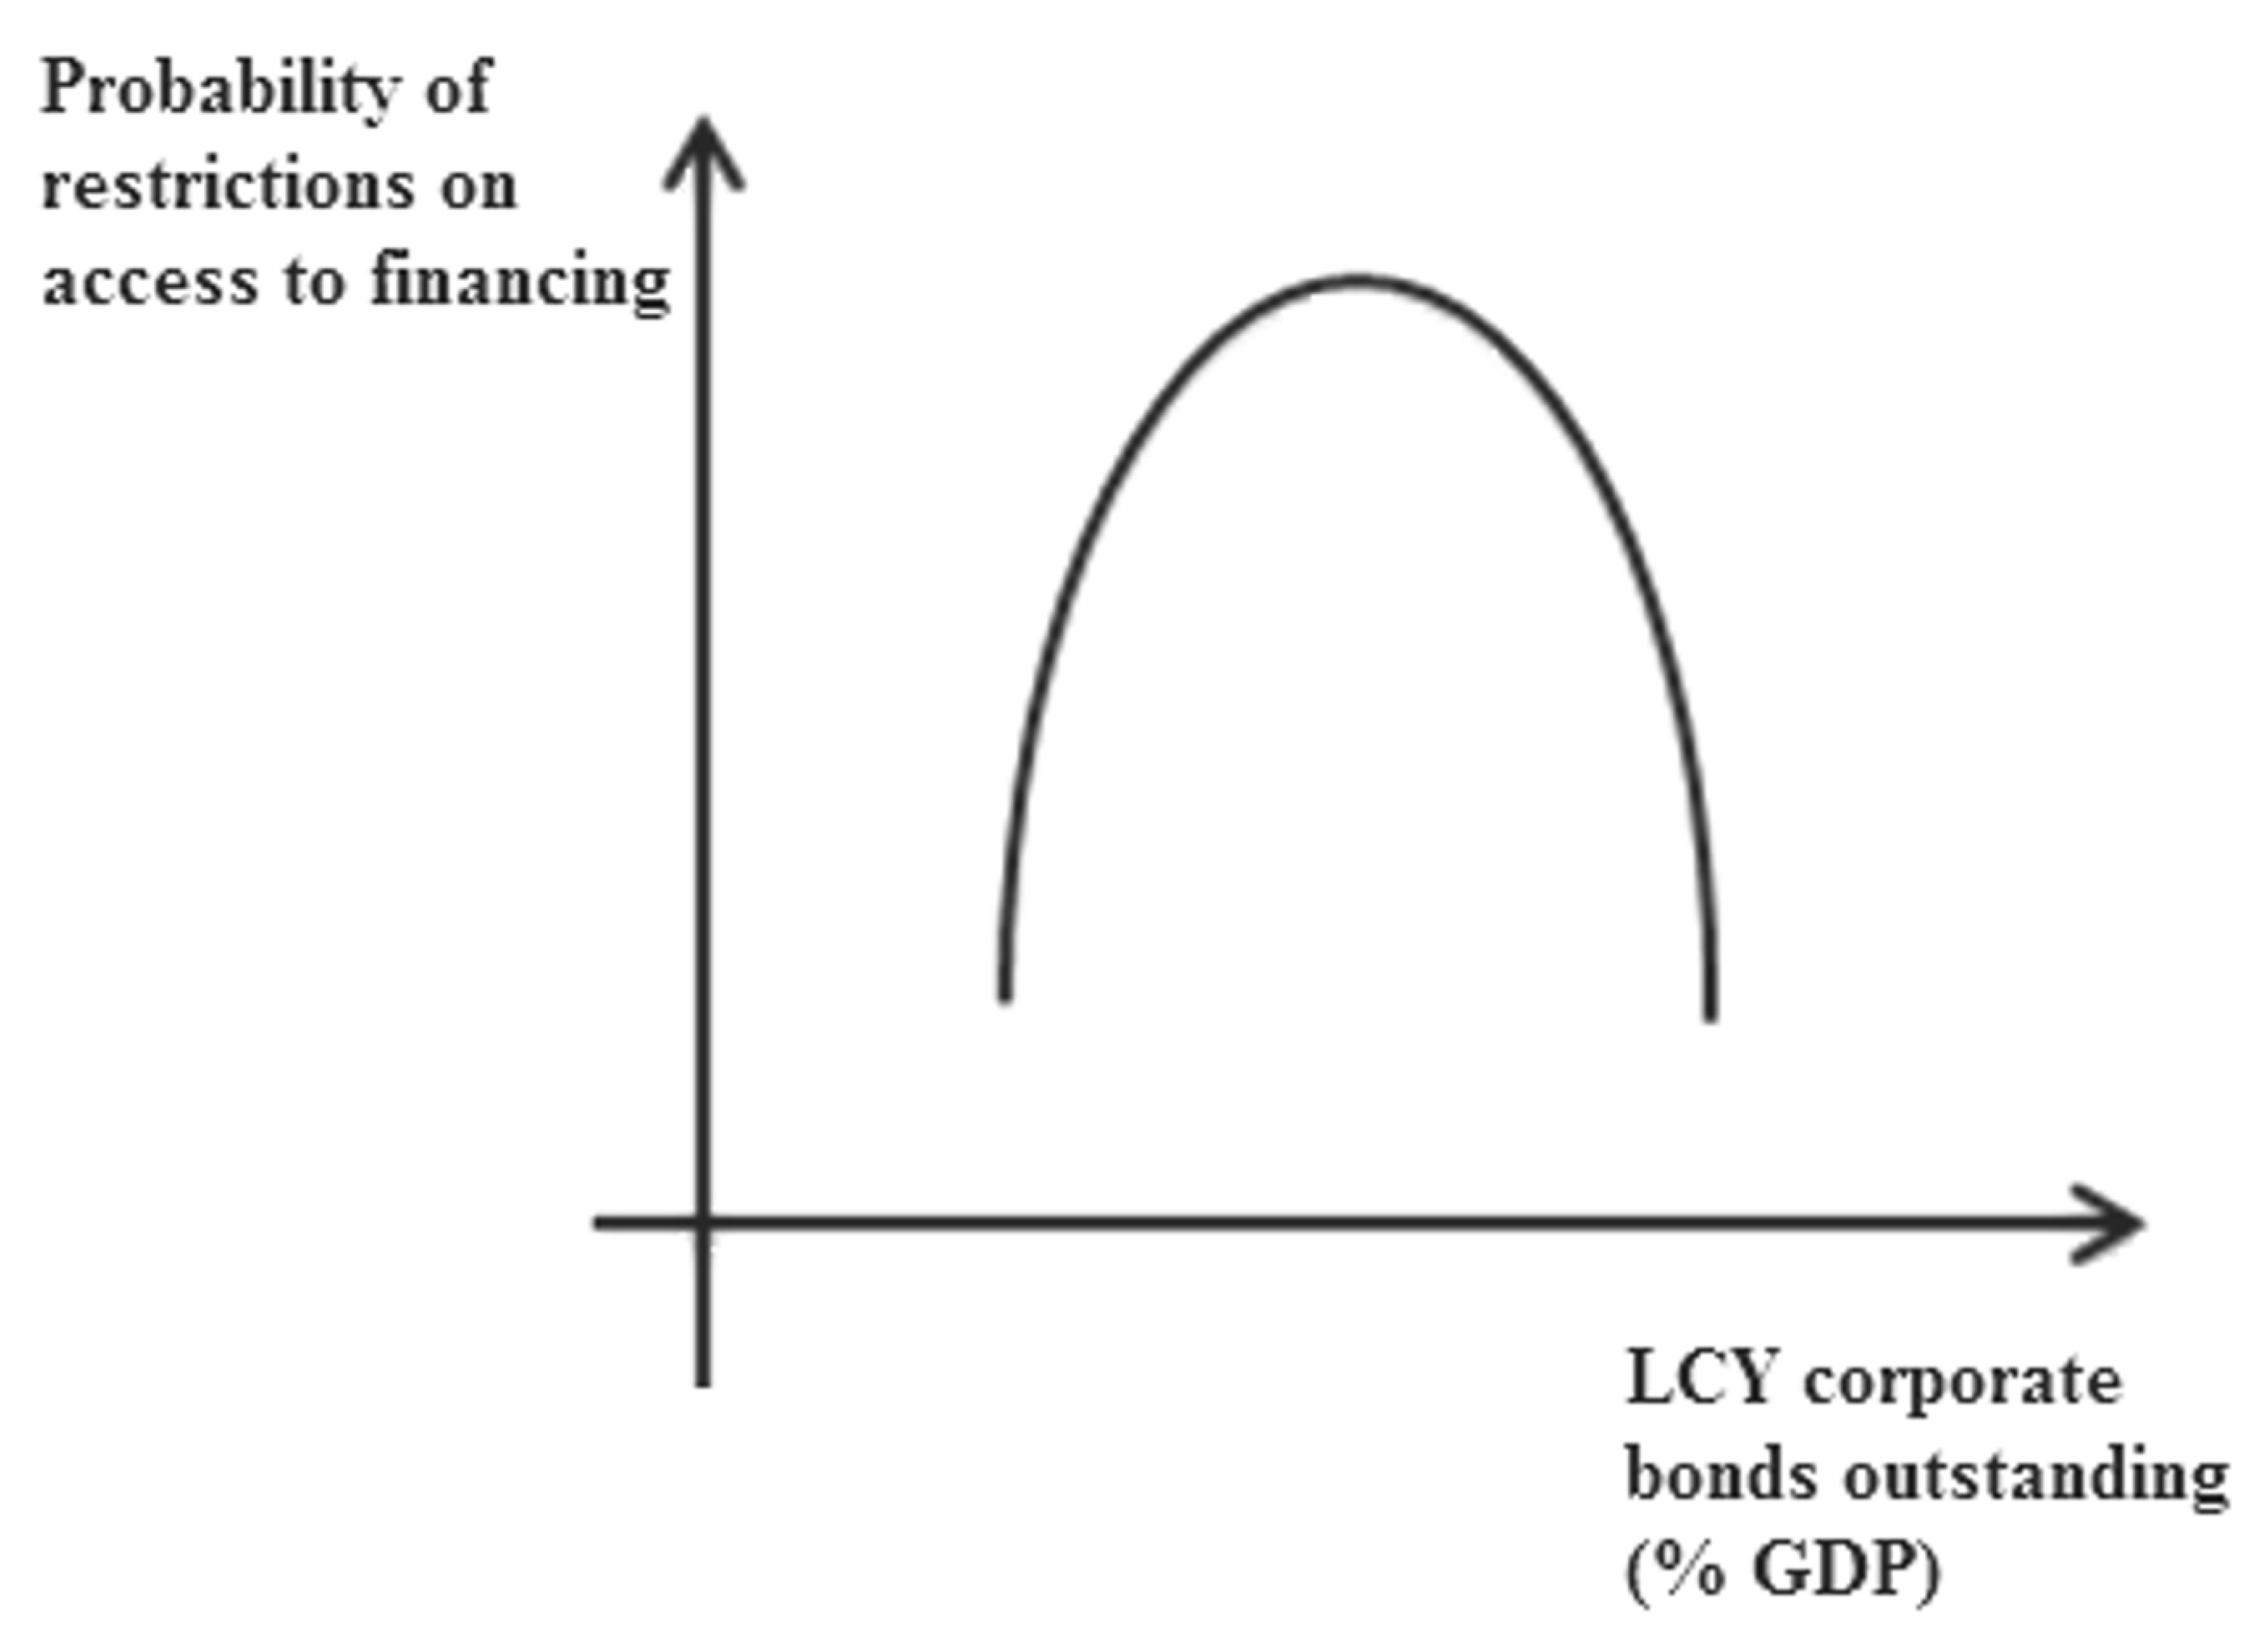
We obtained original conclusions concerning the influence of financial depth of financial sector in economy. The financial depth was measured by the extent of development of national publicly traded debt market (corporate bond market). During the pre-crisis period, a developed bond market tends to reduce barriers to access to finance. The insufficient development of bond market is not perceived by top management as a problem, probably because the companies attract financing by means of bank crediting and other sources. For the countries with an average level of bond market development, the companies note the presence of barriers. We explain it as follows: when the bond market is not developed sufficiently, only large companies may take its advantages. Their share in the sample is insignificant; therefore, for the majority of the market participants, the access to this source of financing is considered as valuable. The large companies withdraw liquidity from this sector of financial market (Figure 3 below).
The similar nonlinear impact of the development of bond market (parabola, branches down) was observed during the crisis period, besides for 96% of the companies the barriers for attracting finance are increased in the bond market (Hypothesis 5 is accepted). The bond market turns to be more enclosed concerning financial resources availability: during the crisis period, the bond market is less available for the companies while the bank crediting remains more stable. Our conclusion coincides with that of [7] for the Japanese market.
During the post-crisis period (2010–2013), the direction of influence is changed for the opposite one (parabola, with branches going up). During this period, the banking sector of European countries began to experience enormous regulatory burden.
We note that during pre-crisis, crisis, and post-crisis periods, the variable of developed financial market (multiplicative variable of the bank crediting and bond market) showed the negative effect on barriers. The companies of the countries with developed financial sector succeeded.
For the group of hypotheses of institutional factors, we identify the significance of rule variables. During the period of 2008–2013, when the rule-of-law index increases, the probability that access to finance is regarded as a serious barrier, decreases, i.e., the rule variable of all the institutional variables shows the significance of the institutional environment. During the pre-crisis period, the influence of institutional factors (including rule variables) is insignificant.
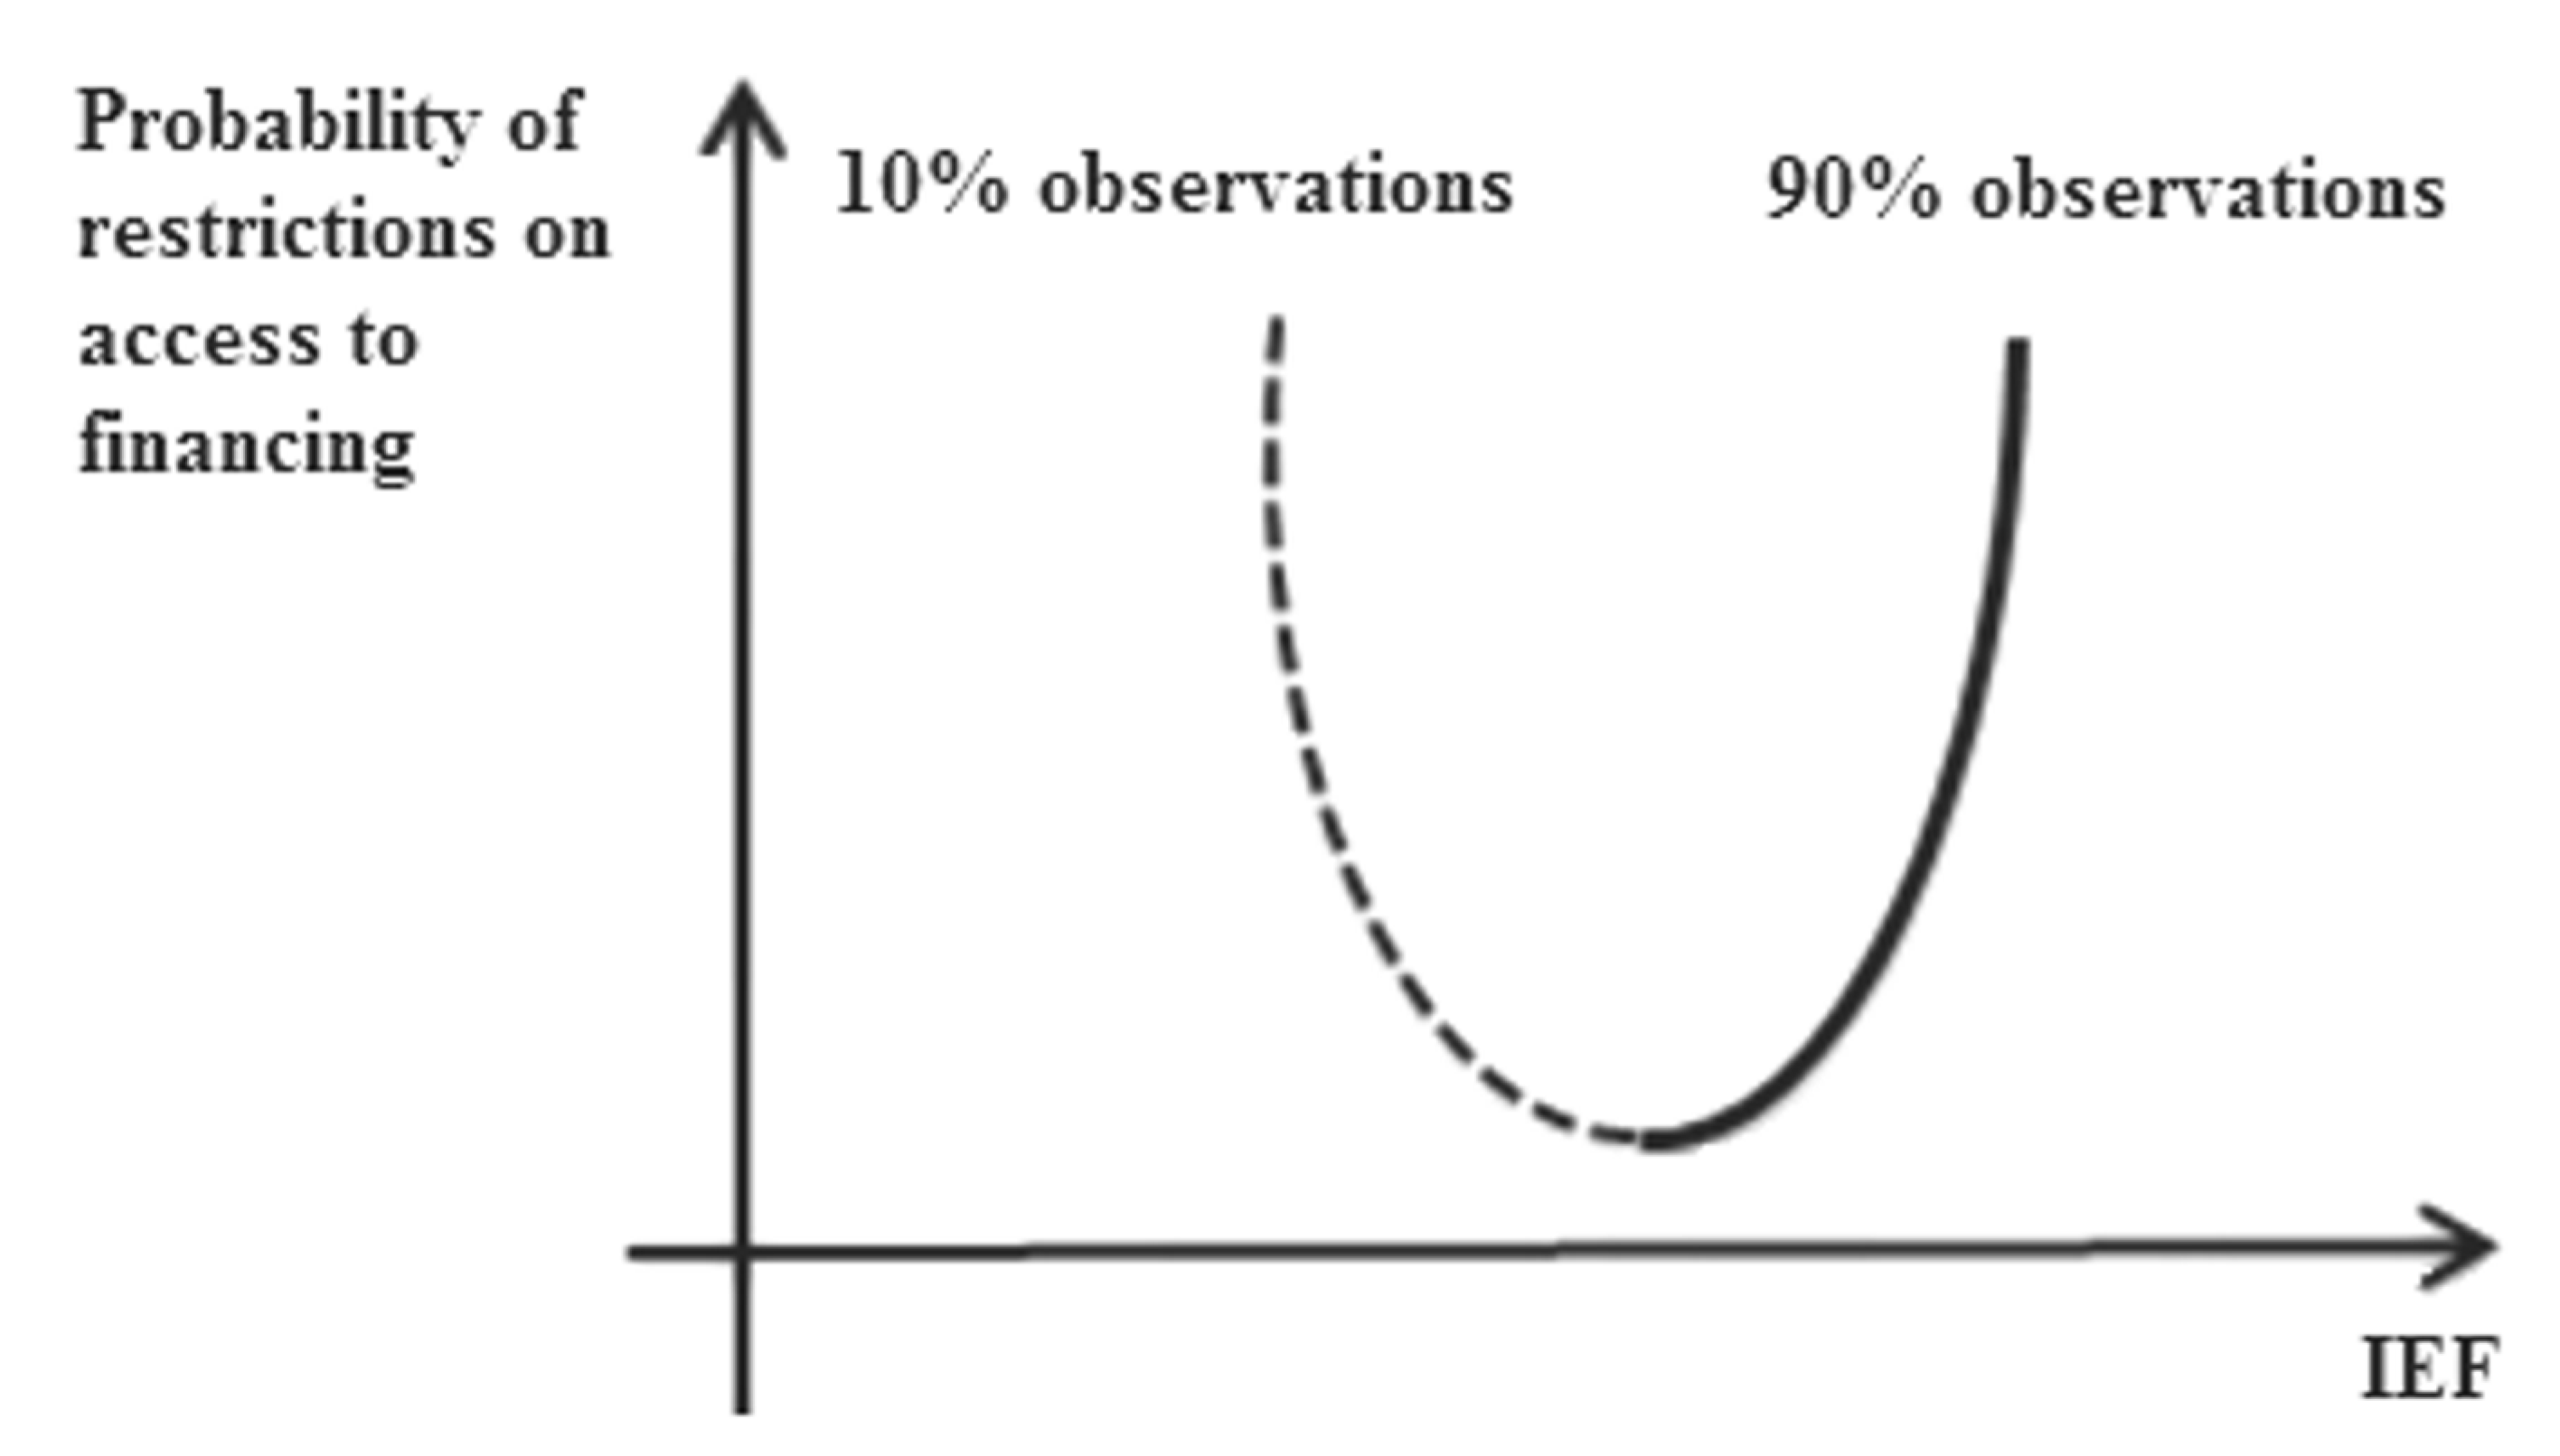
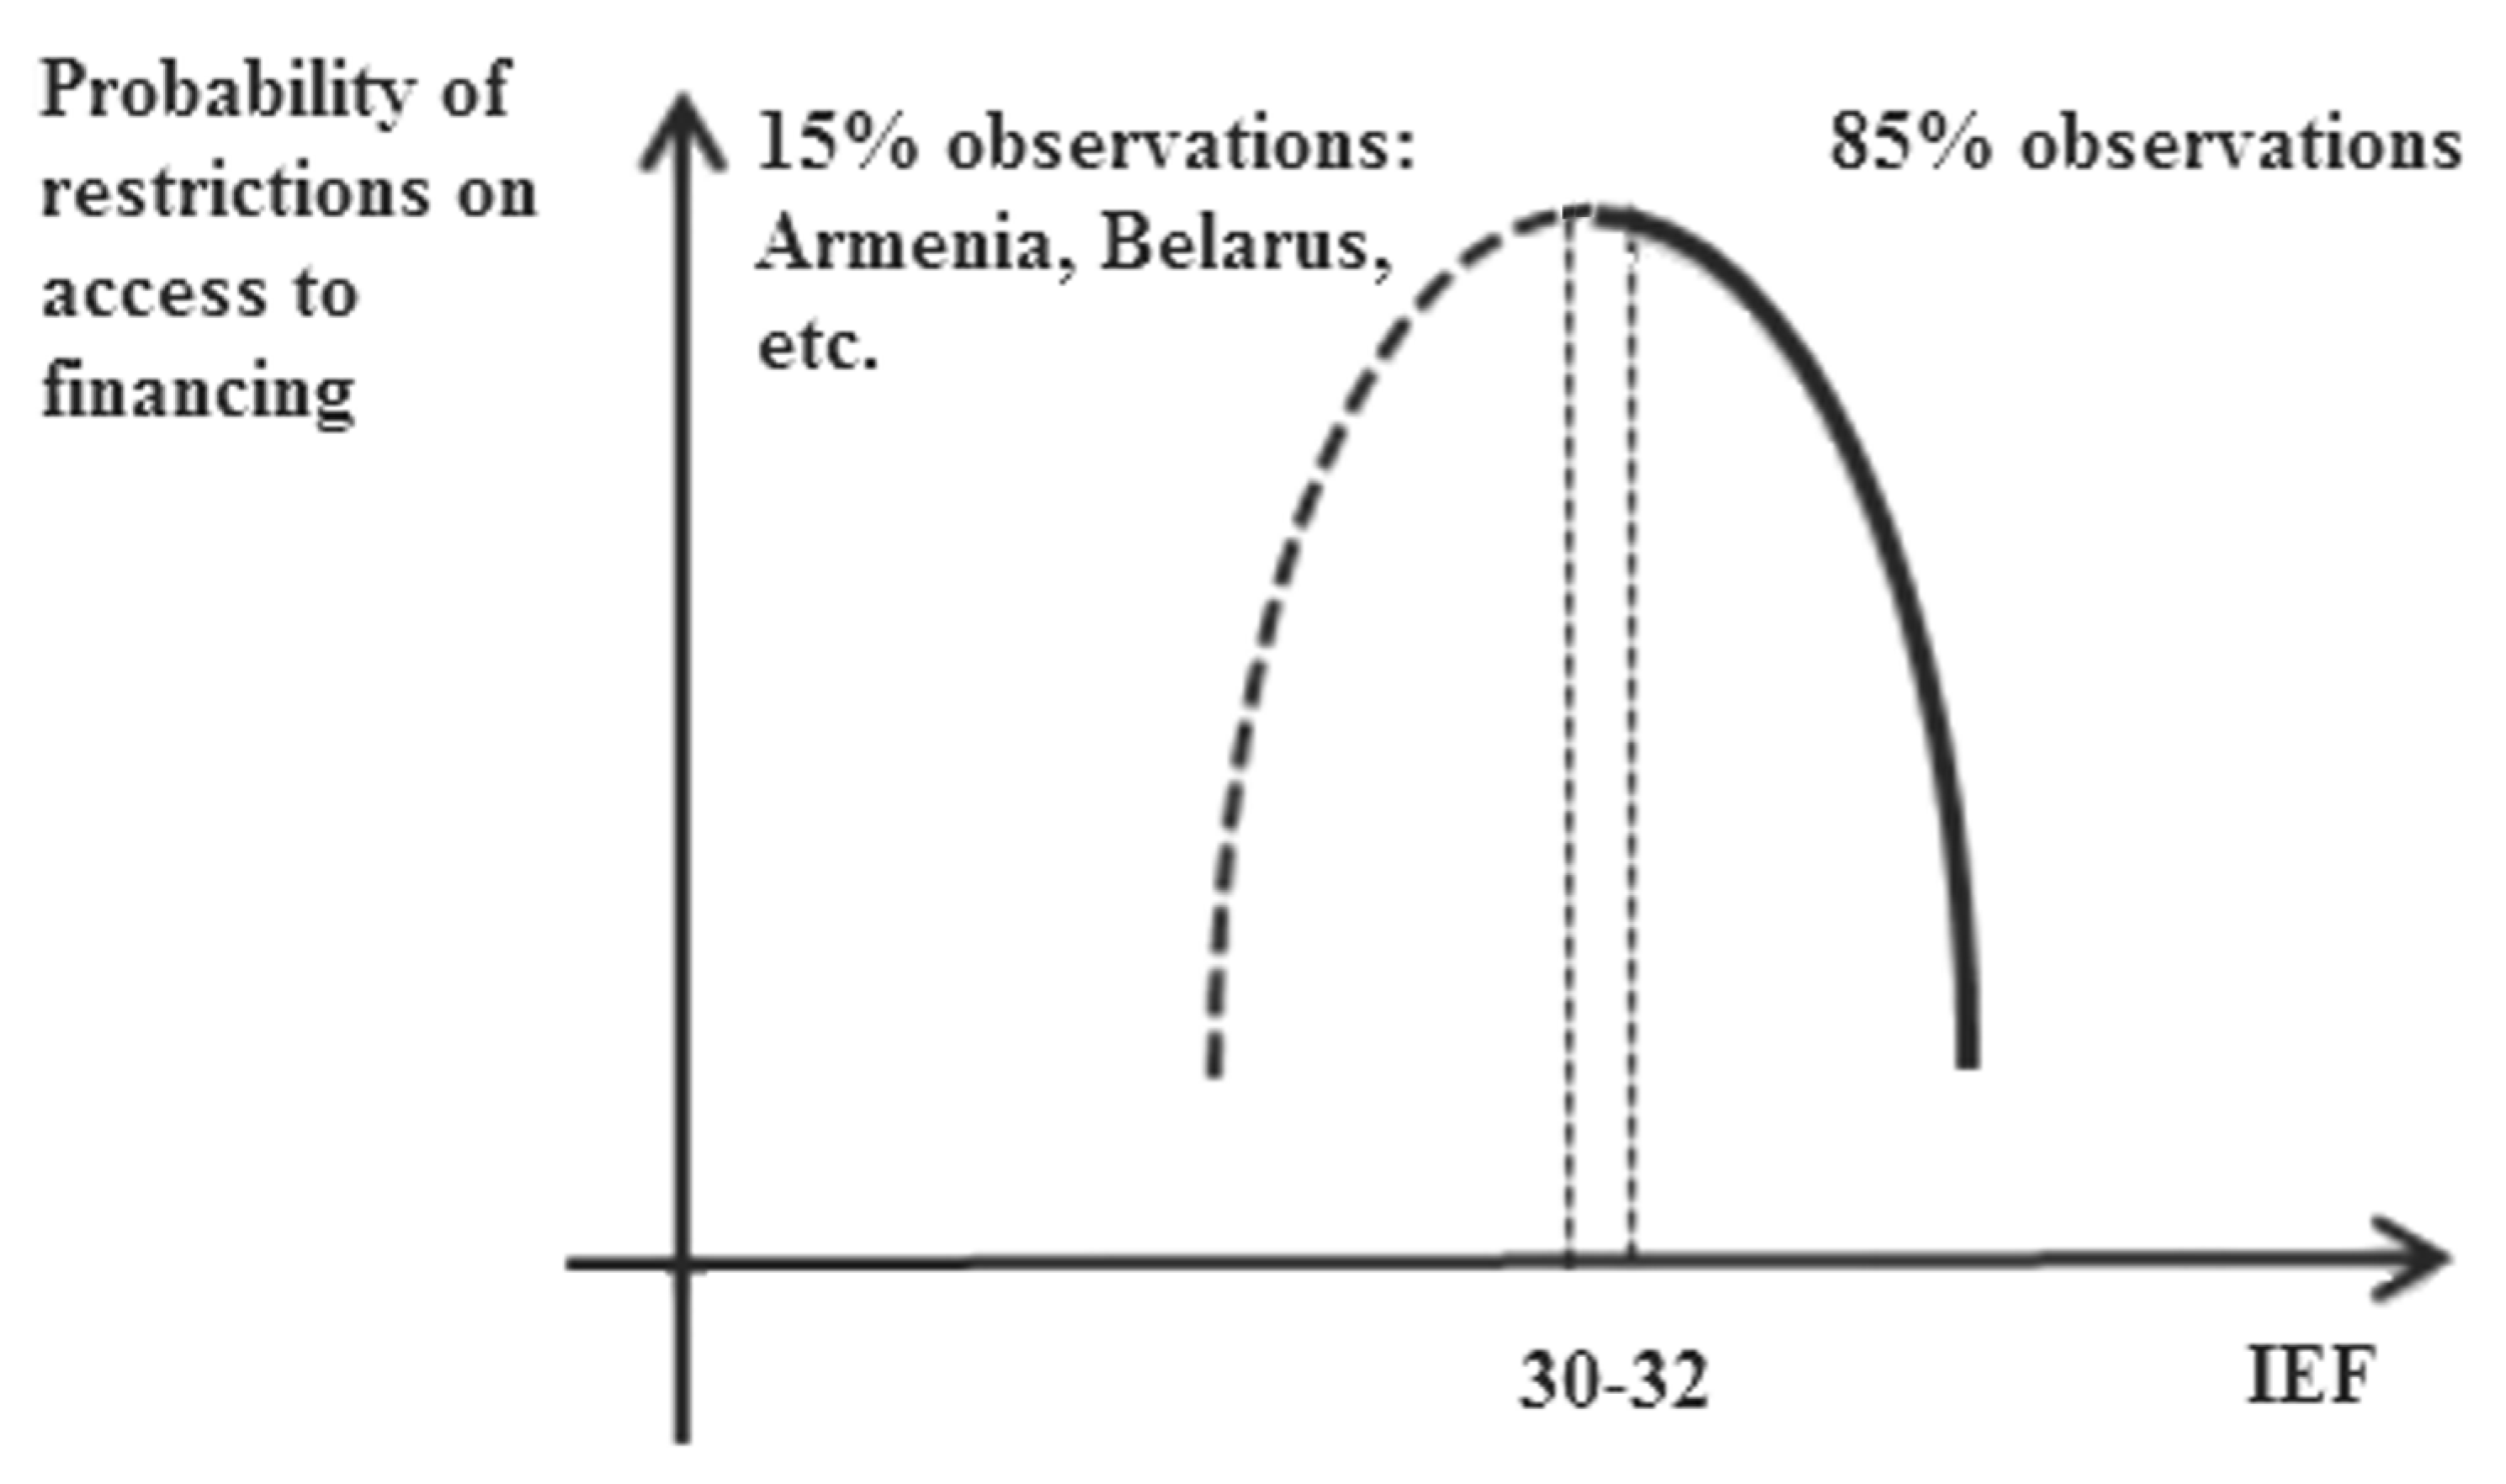
Concerning the Index of Economic Freedom (IEF) variable, we obtained a very interesting result: during the pre-crisis and post-crisis periods, the perception of institutional standards by top managers was different. If in the pre-crisis period, for most of the countries the increase of IEF was perceived as a negative factor for attracting finance (Figure 4), during the crisis period, the direction of influence of institutional environment changed to the opposite (Figure 5). In 2002–2007, the high standards of IEF were regarded by managers as extra costs for the company.
Along with the change of economic situation, when the number of effective investment projects decreased, it became more difficult to compete for consumers due to decreasing consumer purchasing power, and the value of game rules, market transparency, liberalization of capital flow increased (Figure 5). It should be noted that this effect is not observed for all countries. The factor of IEF demonstrates a nonlinear U-shape relationship: parabola with branches down, flex point is identified at the level of 30–32 (Figure 5, Hypothesis 3 is accepted). For a smaller part of observations (15%) between 2010 and 2013 for Armenia, Belarus, Bosnia and Herzegovina, Bulgaria, FYR Macedonia, Georgia, Kazakhstan, Kyrgyz Republic, Moldova, Mongolia, and Romania when IEF is increased, barriers for financing also increased. Large countries, such as Russia, Poland, etc., stand to gain from quality improvement of institutional environment. Simple probit models for the period of 2008–2013 also show nonlinear impact (parabola, branches down, Table 6).
The results for the pre-crisis period (2002–2007) show that for European companies it is easier to get access to finance in comparison with Asian ones. This dependence is true for both Russia and parts of Europe. During the crisis and post-crisis periods (2008–2013), European companies also found it easier to get access to finance than Asian ones from our sample. However, for the Russian companies the situation is changed: the barriers for financing are growing significantly.
Control variable “firm’s age” demonstrates U-shape relationship for both time periods. In general, the older the company, the easier the access for finance. This conclusion coincides with the results obtained by [4]. However, after 30 years of age (the companies which had run on the market before market-type reforms in the considered countries), it is possible that the dependence is changed to the opposite (it should be noted that less than 4% of the sample was subject to this inverse dependence). Probably, the companies in which activity had started before the period of market-type reforms, failed to adjust to new realities.
6. Conclusions
Financial constraints have been duly addressed in the academic literature as an important barrier for sustainable development. However, the restrictions on access to financing and the attitudes of management in the former communist countries have been overlooked by the previous studies. Moreover, financial constraints experienced by businesses in these geographies represent an important obstacle on the roadmap to sustainable economic development. Our paper fills this gap in the literature by analyzing the impact of ownership structure, institutional environment development, and debt market profile on the perception of financial constraints by the representatives of corporate top management from 28 countries of the former communist bloc.
This paper contributes to the sustainable economic development literature by proposing the original methodology based on the Heckman model to study the nonlinear and multiplicative impacts of diverse factors during the pre-crisis, crisis, and post-crisis periods in the former communist bloc countries. The advantage of our methodology is the use of heckprobit model, which allows us to consider the equation system when the probability of financial constraints is regarded together with the probability of obtaining bank credits and credit facilities. Our approach allows for such variable as a subjective perception of problems by management to be controlled by objective factors of access to financial resources.
The hypotheses of our study have found empirical confirmation. The results obtained according to the heckprobit model led to original conclusions regarding the complex influence of a large set of factors. We emphasize the significance of state ownership and governmental support, foreign ownership, level of credit market development (bank credit and bond market), and the quality of institutional environment.
We built up a panel based on the survey that allowed to identify the perception of financial constraints by the top management of the companies. We demonstrate that: (1) agent relations with owners in the framework of Index of Economic Freedom (IEF) standards (protection of minorities rights, etc.) are perceived by managers as additional financial difficulties; (2) the role of various owners in handling company’s influences decision making processes and, therefore, the cash flows of the companies.
We provide the evidence that during the crisis and post-crisis periods, the presence of foreign owner makes the restrictions on access to financing decrease. If the ownership structure has boththe state and foreign participants, the probability of financial constraints is also reduced. The foreign investor is considered by top managers as an efficient supervisor.
For the pre-crisis period, we find that with the relatively poor development of the bank sector, the increase of volume of bank credit reduces the barriers for financing. During financial crisis, the influence of bank credit is reversed (parabola, branches down). We explain this effect as follows: banks begin to manage risks carefully; particularly, they increase the requirements for borrowers. However, since 2008 onwards, it is more difficult for companies to work with banks as the banks adversely impacted by the crisis begin to manage risks more carefully, particularly increasing the scrutiny level and the requirements for borrowers.
The bond market is perceived by the companies as less favorable for removing barriers to access to finance. Only a few companies are able to take advantages of this financial sector. During the pre-crisis period, only some large companies by means of national bond market are solving their funding necessities, but for the majority of medium and small companies the bond market was unavailable due to cost inefficiencies of scale. During the crisis period, access to the bond market becomes even more complicated. We reveal the nonlinear impact of the bond market. However, we find that when the financial sector is developed (bank credit and corporate bond segment), the barriers to access financing are reduced significantly.
We have shown the process of change in the perception of financial constraints after the crisis for companies from the countries of the post-Soviet sample. During the periods of 2008–2013, with the increase of the rule-of-law index, the restrictions on access to financing are considerably reduced. Nonlinear impact is identified by means of index of economic freedom (IEF). We explain it by the fact that a lot of not homogenous components determine the IEF. For example, the IEF considers simultaneously both the protection of investor’s rights and investment freedom. It is also worth mentioning that minor institutional improvements are perceived by top managers as difficulties related to the “unnecessary” losses of administrative resources, etc. However, we evidence that an elevated level of institutions’ development gives an opportunity for harvesting significant benefits in terms of gradual eliminating of barriers to access financing, which is a necessary condition for sustainable economic growth. Finally, our findings demonstrate that growing IEF is capable of erasing obstacles to corporate funding sources, as the overall sustainable business climate depends upon the overall level of trust in the society.
Last but not least, looking forward to the future research, we acknowledge that the main limitations of the present study are the limited time elapsed by the observation period, as well as the inhomogeneity of the data due to the different levels of the economic development of the considered countries. Therefore, as a continuation of this investigation, which spans over the global financial crisis, we envisage the following steps expanding the covered historical period over the COVID-19 fueled crisis and the recovery from it. A more country-specific focus of conclusions will be our priority during the continuation of this line of research.
Author Contributions
Conceptualization, T.T., T.S., and M.G.; methodology, T.T. and T.S.; software, K.G. and A.T.; validation, T.T., T.S., and M.G.; formal analysis, T.T. and T.S.; investigation, T.T., T.S., M.G., K.G., and A.T.; resources, T.T.; data curation, T.T., T.S., K.G., and A.T.; writing—original draft preparation, T.T. and T.S.; writing—review and editing, M.G.; visualization, T.T. and M.G.; supervision, T.T.; project administration, T.T.; funding acquisition, T.T. All authors have read and agreed to the published version of the manuscript.
Funding
This research was funded by the framework of the Academic Fund Program at the National Research University Higher School of Economics (HSE), grant number 18-05-0007; by Russian Academic Excellence Project “5-100”; by FCT, I.P., the Portuguese national funding agency for science, research and technology, under the Project UIDB/04521/2020; and by the Lisbon Polytechnic Institute (IPL) as part of the IPL/2020/MacroRates/ISCAL project. The APC was funded by the National Research University Higher School of Economics (HSE).
Conflicts of Interest
The authors declare no conflict of interest. The funders had no role in the design of the study; in the collection, analyses, or interpretation of data; in the writing of the manuscript, or in the decision to publish the results.
Appendix A
Showing the changes by 2015 relative to 1995, we wanted to emphasize how much the situation in the economies of the countries under consideration has changed (it has not changed uniformly, in the results we emphasize the differences in Eastern Europe and Asia in the perception of restrictions and the factors determining them). Our empirical analysis is based on a slightly narrower time horizon (2002–2013) due to the availability of BEEPS data ([3]). The 1995–2015 statistics show really striking changes and they could not but affect the perception of events, processes and decision-making by top managers of companies.
Figure A1.
Foreign Direct Investments (FDI) stock (% GDP) for post-communist countries, 2002 and 2013. Source: [33].
Figure A1.
Foreign Direct Investments (FDI) stock (% GDP) for post-communist countries, 2002 and 2013. Source: [33].

Figure A2.
Share of employed in the public sector (% of the total number of employed persons) for post-communist countries, 2005–2015. Source: [33], Authors’ calculations.
Figure A2.
Share of employed in the public sector (% of the total number of employed persons) for post-communist countries, 2005–2015. Source: [33], Authors’ calculations.


Appendix B

Table A1.
Post-communist countries: development of financial markets and institutional variables.
| Country | Foundation of Stock Exchange (after 1989) | Issuance of First Corporate Bonds | Rule of Law | IEF | ||
|---|---|---|---|---|---|---|
| 2002 | 2013 | 2002 | 2013 | |||
| Russia | 1991 | 1994 | −0.84 | −0.78 | 48.7 | 51.1 |
| Poland | 1991 | 1992 | 0.71 | 0.82 | 65.0 | 66.0 |
| Albania | 1996 | −0.76 | −0.52 | 56.8 | 65.2 | |
| Armenia | 2001 | 2005 | −0.42 | −0.34 | 68.0 | 69.4 |
| Azerbaijan | 2000 | 2004 | −0.91 | −0.72 | 53.3 | 59.7 |
| Belarus | 1998 | 2017 | −1.34 | −0.90 | 39.0 | 48.0 |
| Bosnia and Herzegovina | 2001 | −0.66 | −0.15 | 37.4 | 57.3 | |
| Bulgaria | 1991 | −0.03 | −0.10 | 57.1 | 65.0 | |
| Croatia | 1991 | 2002 | −0.15 | 0.29 | 51.1 | 61.3 |
| Czechia | 1993 | 1993 | 0.86 | 1.04 | 66.5 | 70.9 |
| Estonia | 1994 | 0.82 | 1.20 | 77.6 | 75.3 | |
| FYR Macedonia | 1995 | 2007 | −0.55 | −0.20 | 58.0 | 68.2 |
| Georgia | 1999 | 2005 | −1.06 | −0.01 | 56.7 | 72.2 |
| Hungary | 1990 | 1993 | 0.98 | 0.58 | 64.5 | 67.3 |
| Kazakhstan | 1993 | 1998 | −1.14 | −0.69 | 52.4 | 63.0 |
| Kyrgyzstan | 2000 | 2013 | −0.81 | −1.11 | 51.7 | 59.6 |
| Latvia | 1993 | 0.34 | 0.77 | 65.0 | 66.5 | |
| Lithuania | 1993 | 0.45 | 0.84 | 66.1 | 72.1 | |
| Moldova | 1994 | 2018 | −0.60 | −0.37 | 57.4 | 55.5 |
| Mongolia | 1991 | 2001 | 0.18 | −0.38 | 56.7 | 61.7 |
| Montenegro | 1993 | 0.29 | 0.05 | 46.6 | 62.6 | |
| Romania | 1995 | 2003 | −0.26 | 0.13 | 48.7 | 65.1 |
| Serbia | 2003 | 2010 | −0.86 | −0.33 | 46.6 | 58.6 |
| Slovakia | 1991 | 1993 | 0.32 | 0.48 | 59.8 | 68.7 |
| Slovenia | 1989 | 1998 | 0.99 | 1.00 | 57.8 | 61.7 |
| Tajikistan | 2015 | 2017 | −1.19 | −1.25 | 47.3 | 53.4 |
| Ukraine | 1991 | 2001 | −0.81 | −0.80 | 48.2 | 46.3 |
| Uzbekistan | 1994 | 1999 | −1.48 | −1.23 | 38.5 | 46.0 |
Source: [34].
Appendix C
Table A2.
State subsidies and access to financing.
| Restrictions on access to Financing | State Subsidies | ||||||||
|---|---|---|---|---|---|---|---|---|---|
| 2002–2007 | 2008–2009 | 2011–2013 | |||||||
| No | Yes | Total | No | Yes | Total | No | Yes | Total | |
| No | 7359 | 645 | 8004 | 6174 | 579 | 6753 | 9506 | 777 | 10283 |
| (92%) | (8%) | (100%) | (91%) | (9%) | (100%) | (92%) | (8%) | (100%) | |
| Yes | 1789 | 147 | 1936 | 2550 | 201 | 2751 | 2307 | 194 | 2501 |
| (92%) | (8%) | (100%) | (93%) | (7%) | (100%) | (92%) | (8%) | (100%) | |
Source: [3], Authors’ calculations.
Table A3.
Loans and obstacle to financing.
| Obstacle Is Access to Financing | Have a Line of Credit or Loan from a Financial Institution | |||||
|---|---|---|---|---|---|---|
| 2008–2009 | 2011–2013 | |||||
| No | Yes | Total | No | Yes | Total | |
| No | 3641 (54%) | 3112 (46%) | 6753 (100%) | 7075 (69%) | 3208 (31%) | 10283 (100%) |
| Yes | 1356 (49%) | 1395 (51%) | 2751 (100%) | 1340 (54%) | 1161 (46%) | 2501 (100%) |
Source: [3], Authors’ calculations.
Appendix D
Table A4.
Number of observations in 2002–2013.
| Country | Periods | Total | ||
|---|---|---|---|---|
| 2002–2007 | 2008–2009 | 2011–2013 | ||
| Albania | 0 | 52 | 300 | 352 |
| Armenia | 0 | 364 | 351 | 715 |
| Azerbaijan | 0 | 351 | 381 | 732 |
| Belarus | 0 | 234 | 344 | 578 |
| Bosnia and Herz. | 0 | 342 | 346 | 688 |
| Bulgaria | 0 | 257 | 355 | 612 |
| Croatia | 8 | 97 | 353 | 458 |
| Estonia | 357 | 256 | 257 | 870 |
| FYR Macedonia | 350 | 345 | 340 | 1035 |
| Georgia | 366 | 343 | 352 | 1061 |
| Hungary | 835 | 280 | 112 | 1227 |
| Kazakhstan | 789 | 513 | 541 | 1843 |
| Kosovo | 0 | 164 | 195 | 359 |
| Kyrgyz Rep. | 365 | 231 | 257 | 853 |
| Latvia | 373 | 261 | 313 | 947 |
| Lithuania | 395 | 265 | 228 | 888 |
| Moldova | 506 | 343 | 330 | 1179 |
| Mongolia | 0 | 345 | 117 | 462 |
| Montenegro | 26 | 107 | 121 | 254 |
| Poland | 1372 | 449 | 476 | 2297 |
| Romania | 816 | 437 | 525 | 1778 |
| Russia | 1053 | 1113 | 3960 | 6126 |
| Serbia | 500 | 368 | 332 | 1200 |
| Slovak Rep. | 364 | 252 | 166 | 782 |
| Slovenia | 169 | 274 | 264 | 707 |
| Tajikistan | 179 | 335 | 276 | 790 |
| Ukraine | 576 | 774 | 904 | 2254 |
| Uzbekistan | 549 | 352 | 388 | 1289 |
| Total | 9948 | 9504 | 12784 | 32236 |
Source: [3], Authors’ calculations.
Table A5.
Descriptive statistics (2002–2007).
| Variable | Obs | Mean | Std.Dev. | Min | Max |
|---|---|---|---|---|---|
| obstacle | 9948 | 0.1947 | 0.3960 | 0 | 1 |
| age | 9948 | 25.245 | 8.6524 | 16 | 45 |
| foreign_ownership | 9948 | 10.4187 | 27.9541 | 0 | 100 |
| have_foreign_owner | 9948 | 0.1376 | 0.3445 | 0 | 1 |
| gov_ownership | 9948 | 10.3729 | 29.3156 | 0 | 100 |
| have_foreign_gov_owners | 9948 | 0.00814 | 0.0899 | 0 | 1 |
| ief | 9948 | 48.2418 | 20.0879 | 0 | 75.2 |
| rule | 9948 | −0.2753 | 0.6885 | −1.189 | 0.975 |
| Europe | 9948 | 0.7740 | 0.4182 | 0 | 1 |
| Russia | 9948 | 0.1059 | 0.3077 | 0 | 1 |
| domestic_credit | 9948 | 20.5159 | 14.9621 | 0 | 68.164 |
| developed_bond_market | 8335 | 0.8203 | 0.3840 | 0 | 1 |
| bond_market | 8335 | 1.3633 | 1.8373 | 0 | 5.848 |
| gov_subsidies | 9940 | 0.0797 | 0.2708 | 0 | 1 |
Appendix E
Table A6.
Description of variables.
| Variable | Description | Source | Sign | Reason for Consideration |
|---|---|---|---|---|
| obstacle | Dependent variable - barriers to access to finance, characterizing its availability and cost. It is based on the variable k30 (Source: [3]). If k30 = 0 (no obstacle to finance), 1 (minor obstacle) or 2 (moderate obstacle), than obstacle = 0 (no severe obstacle to finance). If k30 = 3 (major obstacle) or 4 (very severe obstacle), than obstacle = 1 (severe obstacle to finance). | [3], authors’ calculation | ||
| Explanatory variables | ||||
| foreign_ownership | Share of a foreign owner in the ownership structure | [3] | − | [5,6,11] show that firms with foreign capital in the ownership structure have an easier access to finance |
| have_foreign_owner | Dummy of existence of a foreign owner in the ownership structure: 1—yes, 0—no | − | ||
| gov_ownership | State share in the ownership structure | − | [8,16] reveal that state participation in the ownership structure reduces financial barriers | |
| have_gov_ owner | Dummy of existence of a state share in the ownership structure: 1—yes, 0—no | − | ||
| have_foreign_gov_owners | Dummy of simultaneous existence of a foreign and state share in the ownership structure: 1—yes, 0—no | − | Both state and foreign participation in the ownership structure allows reducing barriers to access to finance ([5,8,11,16]) | |
| gov_subsidies | Dummy variable: 1—if over the last three years this firm received any state subsidies, 0—otherwise | − | [4] show that state subsidies help to reduce barriers to access to finance | |
| domestic_credit | Domestic credit to private sector (% GDP) | [31] | − | The influence of development of the debt market can be twofold: on the one hand, companies from developing countries use more debt as a source of financing, compared with companies from developed countries ([19,31]). Consequently, the development of the debt market facilitates the removal of barriers to access to finance. On the other hand, a high level of debt burden can increase barriers to access to finance and reduce investment costs ([19]). |
| domestic_ credit2 | Square of domestic_credit | + | ||
| bond_market | Volume of outstanding local currency (LCY) corporate bond market (% GDP) | [30] | − | |
| bond_market2 | Square of bond_market | + | ||
| developed_ bond_market | Dummy: 1—if an outstanding LCY corporate bond market (% GDP) is more than median, 0—otherwise | − | ||
| ief | Heritage Foundation’s Index of Economic Freedom: 0—minimum, 100—maximum | Heritage Foundation | − | Firms operating in countries with poor quality of institutional environment face higher agency costs and barriers to access to finance ([25]) |
| ief2 | Square of ief | +/− | ||
| rule | Rule of law: −2,5—minimum,+2,5—maximum | [31] | − | |
| polit_stab | Political stability: −2,5—minimum, +2,5—maximum | |||
| regul_quality | Regulatory quality: −2,5—minimum, +2,5—maximum | |||
| corrupt | Control of corruption: −2,5—minimum, +2,5 - maximum | |||
| gov_effect | Government effectiveness: −2,5—minimum, +2,5—maximum | |||
| Control variables | ||||
| age | Age of a company, years | [3] | − | [4] show that barriers to access to finance are higher for young firms. |
| age2 | Square of age | +/− | ||
| Europe | Dummy variable of companies from European countries: 1—a European country, 0—otherwise | Authors’ calculations | − | In general, for the sub-sample of European countries the quality of the institutional environment is better and level of capital flows liberalization is higher. It contributes to the development of financial markets and facilitates access to finance. |
| Russia | Dummy variable of Russian companies: 1—a Russian country, 0—otherwise | + | In Russia, there are significant barriers to foreign investment, the quality of institutions is lower than in Eastern Europe, in the period under review interest rates are high. We expect that these factors increase the barriers to access to finance | |
| crisis | Dummy variable of the global financial crisis of 2008–2009: 1—the period of the financial crisis, 0—otherwise | Authors’ calculations | + | During the global financial crisis in 2008 there were processes of capital withdrawal from developing countries, and a policy of toughening regulation of the banking sector was carried out. As a result, we can expect the growth of financial constraints |
| Multiplicative variables | ||||
| dom_credit_develop_bond | domestic_credit * developed_bond_market | [30,31], authors’ calculations | +/− | |
| dom_credit2_develop_bond | domestic_credit2 * developed_bond_market | |||
| foreign_ownership_in_crisis | foreign_ownership * crisis | [3], authors’ calculations | ||
| foreign_owner_in_crisis | foreign_ownership*crisis | |||
| gov_ownership_in_crisis | gov_ownership * crisis | |||
| gov_subsidies_in_crisis | gov_subsidies * crisis | |||
| gov_subsidies_ownership | gov_subsidies*gov_ownership | |||
| gov_subsidies_have_gov_ owner | gov_subsidies*have_gov_owner | |||
| domestic_credit_in_crisis | domestic_credit * crisis | [31], authors’ calculations | ||
| domestic_credit2_in_crisis | domestic_credit2 * crisis | |||
| bond_market_in_crisis | bond_market * crisis | [30], authors’ calculations | ||
| bond_market2_in_crisis | bond_market2 * crisis | |||
| dom_credit_develop_bond_in_crisis | domestic_credit * developed_bond_market * crisis | [30,31], authors’ calculations | ||
| dom_credit2_develop_bond_in_crisis | domestic_credit2 * developed_bond_market * crisis | |||
Table A7.
Results for probit models for the period from 2002 to 2007. Average marginal effects.
| (1) | (2) | (3) | (4) | (5) | (6) | (7) | |
|---|---|---|---|---|---|---|---|
| foreign_ownership | 0.0002 (0.0002) | - | - | - | - | - | 0.0002 (0.0001) |
| have_foreign_owner | - | 0.02 * (0.013) | - | - | - | - | - |
| have_foreign_gov_ owners | - | −0.09 * (0.052) | - | - | - | - | - |
| gov_ownership | - | - | 0.0003 ** (0.0002) | - | - | - | - |
| have_gov_owner | - | 0.042 *** (0.015) | - | - | - | - | 0.025 * (0.014) |
| gov_subsidies | −0.042 ** (0.02) | - | - | −0.035 * (0.02) | −0.025 (0.019) | −0.029 (0.02) | - |
| gov_subsidies_ ownership | - | - | - | 0.001 *** (0.0003) | 0.001 *** (0.0003) | 0.001 *** (0.0003) | - |
| gov_subsidies_have_ gov_owner | 0.104 *** (0.03) | - | - | - | - | - | 0.044 * (0.025) |
| domestic_credit | - | - | - | - | −0.009 *** (0.001) | - | - |
| domestic_credit2 | - | - | - | - | 0.0001 *** (0.00002) | - | - |
| bond_market | 0.035 *** (0.011) | 0.034 *** (0.01) | 0.034 *** (0.01) | 0034 *** (0.011) | - | - | - |
| bond_market2 | −0.008 *** (0.002) | −0.007 *** (0.002) | −0.007 *** (0.002) | −0.007 *** (0.002) | - | - | - |
| dom_credit_develop_ bond | - | - | - | - | - | −0.009 *** (0.002) | - |
| age | −0.006 * (0.004) | −0.006 (0.004) | −0.006 (0.004) | −0.006 (0.004) | −0.002 (0.004) | −0.003 (0.004) | −0.005 (0.004) |
| age2 | 0.0001 * (0.0001) | 0.0001 (0.0001) | 0.0001 (0.0001) | 0.0001 (0.0001) | 0.00003 (0.0001) | 0.0001 (0.0001) | 0.0001 (0.0001) |
| ief | - | - | - | - | - | - | −0.003 *** (0.001) |
| ief2 | - | - | - | - | - | - | 0.0002 ** (0.00001) |
| rule | 0.007 (0.008) | 0.006 (0.008) | 0.007 (0.008) | 0.007 (0.008) | - | 0.005 (0.009) | - |
| Europe | −0.115 *** (0.012) | −0.114 *** (0.012) | −0.115 *** (0.012) | −0.115 *** (0.012) | −0.026 * (0.014) | −0.061 *** (0.013) | - |
| Russia | −0.046 *** (0.017) | −0.047 *** (0.017) | −0.047 *** (0.017) | −0.047 *** (0.016) | 0.012 (0.016) | −0.019 (0.018) | - |
| Log likelihood | −4042.76 | −4046.80 | −4050.09 | −4044.47 | −4014.84 | −4023.55 | −4822.65 |
| Number of obs | 8327 | 8335 | 8335 | 8327 | 8327 | 8327 | 9940 |
| Preudo R2 | 0.0151 | 0.0148 | 0.0140 | 0.0146 | 0.0219 | 0.0197 | 0.0160 |
Note: significance levels: ***—1%; **—5%; *—10%.
References
- Demirgüç-Kunt, T.B.A.; Levine, R. Law and Firms’ Access to Finance. Am. Law Econ. Rev. 2005, 7, 211–252. [Google Scholar] [CrossRef]
- Li, J.; Han, Q.; Liu, P.; Zhang, J. Institutional Quality, Financial Friction, and Sustained Economic Growth: The Case of China. Emerg. Mark. Financ. Trade 2019, 1–24. [Google Scholar] [CrossRef]
- The Business Environment and Enterprise Performance Survey (BEEPS) 2002–2013 Database. Available online: http://ebrd-beeps.com/panel-data/beeps-iv-v/ (accessed on 1 February 2019).
- Love, I. Financial Development and Financing Constraints: International Evidence from the Structural Investment Model. Rev. Financ. Stud. 2003, 16, 765–791. [Google Scholar] [CrossRef] [Green Version]
- Colombo, M.G.; Croce, A.; Guerini, M. Is the Italian Government effective in relaxing the financial constraints of high technology firms? Prometheus 2012, 30, 73–96. [Google Scholar] [CrossRef]
- Wang, M. Does foreign direct investment affect host-country firms’ financial constraints? J. Corp. Financ. 2017, 45, 522–539. [Google Scholar] [CrossRef]
- Chen, Y.; Hua, X.; Boateng, A. Effects of foreign acquisitions on financial constraints, productivity and investment in R&D of target firms in China. Int. Bus. Rev. 2017, 26, 640–651. [Google Scholar]
- Uchino, T. Bank dependence and financial constraints on investment: Evidence from the corporate bond market paralysis in Japan. J. JPN Int. Econ. 2013, 29, 74–97. [Google Scholar] [CrossRef] [Green Version]
- Haider, Z.A.; Liu, M.; Wang, Y.; Zhang, Y. Government ownership, financial constraint, corruption, and corporate performance: International evidence. J. Int. Financ. Mark. Inst. Money 2018, 53, 76–93. [Google Scholar] [CrossRef]
- Chen, R.; El Ghoul, S.; Guedhami, O.; Wang, H. Do state and foreign ownership affect investment efficiency? Evidence from privatizations. J. Corp. Financ. 2017, 42, 408–421. [Google Scholar] [CrossRef]
- Hericourt, J.; Poncet, S. FDI and credit constraints: Firm-level evidence from China. Econ. Syst. 2009, 33, 1–21. [Google Scholar] [CrossRef] [Green Version]
- Stiglitz, J. Markets, market failures and development. Am. Econ. Rev. 1989, 79, 197–203. [Google Scholar]
- Borisova, G.; Fotak, V.; Holland, K.; Megginson, W.L. Government ownership and the cost of debt: Evidence from government investments in publicly traded firms. J. Financ. Econ. 2015, 118, 168–191. [Google Scholar] [CrossRef] [Green Version]
- Hadlock, C.J.; Pierce, J.R. New Evidence on Measuring Financial Constraints: Moving Beyond the KZ Index. Rev. Financ. Stud. 2010, 23, 1909–1940. [Google Scholar] [CrossRef]
- Lin, C.; Ma, Y.; Malatesta, P.; Xuan, Y. Corporate ownership structure and the choice between bank debt and public debt. J. Financ. Econ. 2013, 109, 517–534. [Google Scholar] [CrossRef] [Green Version]
- Kawk, Y.M. Corporate Social Responsibility and Financial Constraints: Evidence from Korean Firms. Glob. Bus. Financ. Rev. 2015, 20, 15–26. [Google Scholar] [CrossRef] [Green Version]
- Cull, R.; Li, W.; Sun, B.; Xu, L.C. Government connections and financial constraints: Evidence from a large representative sample of Chinese firms. J. Corp. Financ. 2015, 32, 271–294. [Google Scholar] [CrossRef] [Green Version]
- Ullah, B. Financial constraints, corruption, and SME growth in transition economies. Q. Rev. Econ. Financ. 2020, 75, 120–132. [Google Scholar] [CrossRef]
- Casey, E.; O’Toole, C.M. Bank lending constraints, trade credit and alternative financing during the financial crisis: Evidence from European SMEs. J. Corp. Financ. 2014, 27, 173–193. [Google Scholar] [CrossRef]
- Phan, Q.T. Corporate debt and investment with financial constraints: Vietnamese listed firms. Res. Int. Bus. Financ. 2018, 46, 268–280. [Google Scholar] [CrossRef]
- Alquist, R.; Berman, N.; Mukherjee, R.; Tesar, L.L. Financial constraints, institutions, and foreign ownership. J. Int. Econ. 2019, 118, 63–83. [Google Scholar] [CrossRef]
- Silva, F.; Carreira, C. Measuring firms’ financial constraints: A rough guide. Notas Econ. 2012, 36, 23–46. [Google Scholar] [CrossRef]
- Ayyagari, M.; Demirgüç-Kunt, A.; Maksimovic, V. Formal versus Informal Finance: Evidence from China. Rev. Financ. Stud. 2010, 23, 3048–3097. [Google Scholar] [CrossRef] [Green Version]
- Ryan, R.M.; O’Toole, C.M.; McCann, F. Does bank market power affect SME financing constraints? J. Bank. Financ. 2014, 49, 495–505. [Google Scholar] [CrossRef] [Green Version]
- Clarke, G.; Cull, R.; Pería, M.S.M.; Sánchez, S.M. Foreign Bank Entry: Experience, Implications for Developing Economies, and Agenda for Further Research. World Bank Res. Obs. 2003, 18, 25–59. [Google Scholar] [CrossRef]
- Lopatta, K.; Jaeschke, R.; Tchikov, M.; Lodhia, S.K. Corruption, Corporate Social Responsibility and Financial Constraints: International Firm-level Evidence. Eur. Manag. Rev. 2016, 14, 47–65. [Google Scholar] [CrossRef]
- Beck, T.; Demirgüç-Kunt, A. Small and medium-size enterprises: Access to finance as a growth constraint. J. Bank. Financ. 2006, 30, 2931–2943. [Google Scholar] [CrossRef]
- Erel, I.; Jang, Y.; Weisbach, M.S. Do Acquisitions Relieve Target Firms’ Financial Constraints? J. Financ. 2015, 70, 289–328. [Google Scholar] [CrossRef]
- Khatami, S.H.; Marchica, M.-T.; Mura, R. Corporate acquisitions and financial constraints. Int. Rev. Financ. Anal. 2015, 40, 107–121. [Google Scholar] [CrossRef] [Green Version]
- Bloomberg Database. Available online: https://www.bloomberg.com/professional/solution/content-and-data/ (accessed on 1 February 2019).
- Worldbank Database. Available online: https://databank.worldbank.org/source/world-development-indicators (accessed on 1 February 2019).
- Chen, H.; Chen, S. Investment-cash flow sensitivity cannot be a good measure of financial constraints: Evidence from the time series. J. Financ. Econ. 2012, 103, 393–410. [Google Scholar] [CrossRef]
- United Nations Conference on Trade and Development (UNCTAD) Statistics Database. Available online: https://unctadstat.unctad.org/wds/ReportFolders/reportFolders.aspx?sCS_ChosenLang=en (accessed on 1 February 2019).
- World Federation of Exchanges. Available online: https://www.world-exchanges.org (accessed on 1 February 2019).
Figure 1.
Credit to private sector: probability of restrictions on access to financing before the global financial crisis.
Figure 1.
Credit to private sector: probability of restrictions on access to financing before the global financial crisis.

Figure 2.
Credit to private sector: probability of restrictions on access to financing during the financial crisis.
Figure 2.
Credit to private sector: probability of restrictions on access to financing during the financial crisis.

Figure 3.
Bond market: probability of restrictions on access to financing before the global financial crisis.
Figure 3.
Bond market: probability of restrictions on access to financing before the global financial crisis.

Figure 4.
Index of Economic Freedom (IEF): probability of restrictions on access to financing before the global financial crisis.
Figure 4.
Index of Economic Freedom (IEF): probability of restrictions on access to financing before the global financial crisis.

Figure 5.
IEF: probability of restrictions on access to financing after the global financial crisis.
Figure 5.
IEF: probability of restrictions on access to financing after the global financial crisis.

Table 1.
Foreign shareholders and access to financing.
| Restrictions on Access to Financing | Foreign Shareholders | ||||||||
|---|---|---|---|---|---|---|---|---|---|
| 2002–2007 | 2008–2009 | 2011–2013 | |||||||
| No | Yes | Total | No | Yes | Total | No | Yes | Total | |
| No | 6920 | 1091 | 8011 | 5989 | 764 | 6753 | 9525 | 758 | 10283 |
| (86%) | (14%) | (100%) | (89%) | (11%) | (100%) | (93%) | (7%) | (100%) | |
| Yes | 1659 | 278 | 1937 | 2522 | 229 | 2751 | 2362 | 139 | 2501 |
| (86%) | (14%) | (100%) | (92%) | (8%) | (100%) | (94%) | (6%) | (100%) | |
Source: [3], authors’ calculations.
Table 2.
State shareholders and access to financing.
| Restrictions on Access to Financing | State Shareholders | ||||||||
|---|---|---|---|---|---|---|---|---|---|
| 2002–2007 | 2008–2009 | 2011–2013 | |||||||
| No | Yes | Total | No | Yes | Total | No | Yes | Total | |
| No | 7042 | 969 | 8011 | 6495 | 258 | 6753 | 10067 | 216 | 10283 |
| (88%) | (12%) | (100%) | (96%) | (4%) | (100%) | (98%) | (2%) | (100%) | |
| Yes | 1647 | 290 | 1937 | 2612 | 139 | 2751 | 2469 | 32 | 2501 |
| (85%) | (15%) | (100%) | (95%) | (5%) | (100%) | (99%) | (1%) | (100%) | |
Source: [3], authors’ calculations.
Table 3.
Descriptive statistics (2008–2013).
| Variable | Obs | Mean | Std.Dev. | Min | Max |
|---|---|---|---|---|---|
| obstacle | 22288 | 0.2356 | 0.4244 | 0 | 1 |
| age | 22288 | 19.0918 | 8.0185 | 5 | 45 |
| foreign_ownership | 22288 | 6.0972 | 22.0663 | 0 | 100 |
| foreign_ownership_in_crisis | 22288 | 3.1937 | 16.2841 | 0 | 100 |
| have_foreign_owner | 22288 | 0.0848 | 0.2786 | 0 | 1 |
| gov_ownership | 22288 | 6.0972 | 22.0663 | 0 | 100 |
| gov_ownership_in_crisis | 22288 | 3.1937 | 16.2841 | 0 | 100 |
| have_foreign_gov_owners | 22288 | 0.00426 | 0.0651 | 0 | 1 |
| ief | 22288 | 48.6482 | 21.6003 | 0 | 77.938 |
| rule | 22288 | −0.3023 | 0.6104 | −1.338 | 1.2 |
| Europe | 22288 | 0.6664 | 0.4715 | 0 | 1 |
| Russia | 22288 | 0.2276 | 0.4193 | 0 | 1 |
| domestic_credit | 22288 | 39.3629 | 23.6383 | 0 | 88.094 |
| domestic_credit_in_crisis | 22288 | 19.3475 | 26.1341 | 0 | 88.094 |
| developed_bond_market | 22288 | 0.4938 | 0.5000 | 0 | 1 |
| bond_market | 22288 | 2.4756 | 3.3125 | 0 | 16.582 |
| bond_market_in_crisis | 22288 | 0.9130 | 2.3517 | 0 | 16.582 |
| crisis | 22288 | 0.4264 | 0.4946 | 0 | 1 |
| gov_subsidies | 22288 | 0.0786 | 0.2691 | 0 | 1 |
Table 4.
Correlation matrix (from 2002 to 2007).
| Age | foreign_ownership | gov_ownership | Ief | Rule | domestic_credit | bond_market | dom_credit_develop_bond | |
|---|---|---|---|---|---|---|---|---|
| age | 1 | |||||||
| foreign_ownership | −0.0813 *** | 1 | ||||||
| gov_ownership | 0.3882 *** | −0.1169 *** | 1 | |||||
| ief | 0.0162 * | 0.0381 * | −0.0212 *** | 1 | ||||
| rule | 0.095 * | 0.0409 *** | −0.0432 *** | 0.8286 | 1 | |||
| domestic_credit | −0.0468 | 0.0071 ** | −0.0505 | 0.5495 *** | 0.4612 *** | 1 | ||
| bond_market | −0.1262 *** | −0.0031 * | −0.0617 *** | 0.081 *** | −0.0666 *** | 0.3224 * | 1 | |
| dom_credit_develop_bond | −0.1124 | 0.0103 | −0.0426 *** | 0.1806 *** | −0.0096 *** | 0.5781 * | 0.6763 *** | 1 |
***, **, *—Statistical significance 1%, 5%, and 10%, respectively.
Table 5.
Correlation matrix (from 2008 to 2013).
| Age | foreign_ownership | foreign_ownership_in_crisis | gov_ownership | gov_ownership_in_crisis | Ief | Rule | domestic_credit | domestic_credit_in_crisis | dom_credit_develop_bond | dom_credit_develop_bond_in_crisis | bond_market | bond_market_in_crisis | |
|---|---|---|---|---|---|---|---|---|---|---|---|---|---|
| age | 1 | ||||||||||||
| foreign_ownership | −0.0003 | 1 | |||||||||||
| foreign_ownership_in_crisis | 0.0381 *** | 0.7122 *** | 1 | ||||||||||
| gov_ownership | 0.0984 * | −0.0208 * | −0.0115 | 1 | |||||||||
| gov_ownership_in_crisis | 0.0973 * | −0.0142 | 0.0007 * | 0.7426 * | 1 | ||||||||
| ief | 0.1036 *** | 0.0256 ** | 0.1106 ** | −0.0085 | 0.0278 * | 1 | |||||||
| rule | 0.1742 * | 0.1067 ** | 0.0597 * | −0.0868 * | −0.0687 | 0.06 | 1 | ||||||
| domestic_credit | 0.1439 * | 0.0274 * | 0.0729 | −0.0523 ** | −0.0203 * | 0.7045 | 0.262 | 1 | |||||
| domestic_credit_in_crisis | 0.2406 * | 0.0621 | 0.2162 ** | 0.0051 | 0.0674 | 0.3778 ** | 0.1835 *** | 0.4787 ** | 1 | ||||
| dom_credit_develop_bond | 0.0629 | −0.0364 | −0.0063 * | −0.0381 ** | −0.015 | 0.2615 *** | −0.0172 * | 0.6235 * | 0.2178 | 1 | |||
| dom_credit_develop_bond_in_crisis | 0.175 ** | 0.021 * | 0.1143 ** | 0.0091 *** | 0.0516 * | 0.1949 | 0.0908 *** | 0.3914 *** | 0.7231 ** | 0.5806 *** | 1 | ||
| bond_market | −0.02 | −0.0467 ** | −0.0397 *** | −0.0033 *** | 0.0274 ** | 0.1961 ** | −0.0986 | 0.4379 ** | 0.0517 ** | 0.7434 * | 0.3198 ** | 1 | |
| bond_market_in_crisis | 0.1159 *** | 0.0039 * | 0.0744 * | −0.0033 * | 0.0274 *** | 0.1554 * | 0.0075 | 0.2957 ** | 0.5648 ** | 0.4387 *** | 0.7706 * | 0.5268 ** | 1 |
***, **, *—Statistical significance1%, 5%, and 10%, respectively.
Table 6.
Results for heckprobit and probit models for the period from 2008 to 2013. Average marginal effects.
Table 6.
Results for heckprobit and probit models for the period from 2008 to 2013. Average marginal effects.
| Heckprobit Models | Probit Models | |||||||||||
|---|---|---|---|---|---|---|---|---|---|---|---|---|
| (1) | (2) | (3) | (4) | (5) | (6) | (7) | (8) | (9) | (10) | (11) | (12) | |
| foreign_ownership_ in_crisis | −0.0005 * (0.0003) | −0.0006 * (0.0003) | −0.0005 * (0.0003) | −0.0006 ** (0.0003) | −0.0005 * (0.0003) | - | - | - | - | - | −0.0007 *** (0.0002) | - |
| have_ foreign_ owner | - | - | - | - | - | - | −0.04 ** (0.018) | −0.038 ** (0.017) | −0.04 ** (0.018) | - | - | −0.0006 *** (0.0001) |
| have_ foreign_gov_owners | - | - | - | - | - | - | −0.121 * (0.069) | −0.121 * (0.067) | −0.121 * (0.072) | −0.171 *** (0.062) | - | −0.032 (0.045) |
| gov_ ownership _in_crisis | - | - | - | - | - | 0.001 * (0.0006) | - | - | - | - | - | - |
| gov_ subsidies | −0.119 *** (0.027) | −0.133 *** (0.026) | −0.136 *** (0.018) | −0.119 *** (0.025) | −0.146 *** (0.016) | −0.091 *** (0.023) | −0.092 *** (0.028) | −0.091 *** (0.024) | −0.087 *** (0.034) | −0.143 *** (0.023) | 0.0037 (0.011) | 0.025 * (0.015) |
| gov_subsidies_ in_crisis | - | - | - | - | - | −0.077 *** (0.029) | −0.072 ** (0.031) | −0.08 *** (0.03) | −0.051 * (0.031) | - | - | −0.046 ** (0.021) |
| gov_subsidies_have_ gov_owner | - | - | - | - | - | - | - | - | - | 0.111 *** (0.061) | - | - |
| domestic_credit_in_ crisis | 0.004 ** (0.002) | 0.0025 (0.002) | - | - | - | - | - | - | - | - | 0.0025 ** (0.001) | - |
| domestic_ credit2_in_crisis | −0.00005 ** (0.00002) | −0.00003 ** (0.00002) | - | - | - | - | - | - | - | - | −0.00003 *** (0.00001) | - |
| developed_bond_ market | 0.062 *** (0.015) | 0.042 *** (0.014) | 0.206 ** (0.087) | 0.077 *** (0.02) | - | - | - | - | - | - | 0.011 (0.008) | - |
| bond_ market | - | - | - | - | - | - | −0.008 * (0.005) | - | - | −0.008 (0.005) | - | −0.009 *** (0.003) |
| bond_ market2 | - | - | - | - | - | - | 0.0009 ** (0.0004) | - | - | 0.001 ** (0.0004) | - | 0.0009 *** (0.0002) |
| bond_ market_in_crisis | - | - | - | - | 0.009 * (0.005) | 0.024 *** (0.004) | - | 0.014 *** (0.006) | - | - | - | |
| bond_ market2_in_crisis | - | - | - | - | −0.001 * (0.0004) | −0.001 *** (0.0004) | - | −0.001 ** (0.0005) | - | - | - | - |
| dom_credit_develop_ bond | - | - | −0.006 * (0.004) | - | - | - | - | - | −0.003 *** (0.001) | - | - | - |
| dom_credit2_develop_bond | - | - | 0.00007 * (0.00003) | - | - | - | - | - | 0.00004 *** (0.00001) | - | - | - |
| dom_credit_develop_ bond_in_crisis | - | - | - | −0.0022 ** (0.001) | - | - | - | - | - | - | - | - |
| dom_credit2_develop_bond_in_ crisis | - | - | - | 0.00003 ** (0.00001) | - | - | - | - | - | - | - | - |
| crisis | 0.096 ** (0.046) | −0.018 (0.047) | −0.025 (0.026) | 0.008 (0.022) | −0.019 (0.023) | 0.023 ** (0.012) | 0.075 *** (0.016) | 0.053 *** (0.016) | 0.042 *** (0.016) | 0.062 *** (0.018) | 0.087 *** (0.025) | 0.124 *** (0.007) |
| age | −0.0067 *** (0.002) | −0.007 *** (0.002) | −0.006 *** (0.002) | −0.006 *** (0.002) | −0.007 *** (0.002) | −0.009 *** (0.002) | −0.009 *** (0.002) | −0.009 *** (0.002) | −0.008 *** (0.003) | −0.009 *** (0.002) | −0.0003 (0.001) | −0.0003 (0.001) |
| age2 | 0.0001 ** (0.00005) | 0.0001 ** (0.00005) | 0.00009 ** (0.00004) | 0.0001 ** (0.00005) | 0.0001 ** (0.00005) | 0.0001 *** (0.00004) | 0.0001 *** (0.00004) | 0.0001 *** (0.00004) | 0.0001 *** (0.00005) | 0.0001 *** (0.00004) | 0.00002 (0.00003) | 0.00002 (0.00003) |
| ief | - | 0.008 *** (0.001) | - | - | 0.0097 *** (0.001) | - | 0.009 *** (0.001) | 0.008 *** (0.001) | - | 0.009 *** (0.001) | 0.003 *** (0.0006) | 0.003 *** (0.0006) |
| ief2 | - | −0.0001 *** (0.00002) | - | - | −0.0002 *** (0.00001) | - | −0.0002 *** (0.00001) | −0.0001 *** (0.00001) | - | −0.0001 *** (0.00002) | −0.0001 *** (0.00001) | −0.0001 *** (0.00001) |
| rule | −0.103 *** (0.01) | - | −0.101 *** (0.01) | −0.104 *** (0.01) | - | −0.093 *** (0.009) | - | - | −0.098 *** (0.009) | - | - | - |
| Europe | −0.074 *** (0.015) | −0.112 *** (0.015) | −0.079 *** (0.011) | −0.068 *** (0.016) | −0.107 *** (0.01) | −0.06 *** (0.012) | −0.091 *** (0.014) | −0.101 *** (0.013) | −0.05 *** (0.0144) | −0.094 *** (0.11) | −0.021 *** (0.008) | −0.012 * (0.007) |
| Russia | 0.045 *** (0.017) | 0.071 *** (0.017) | 0.063 *** (0.022) | 0.048 *** (0.018) | 0.081 *** (0.015) | 0.089 *** (0.015) | 0.121 *** (0.019) | 0.099 *** (0.015) | 0.126 *** (0.024) | 0.121 *** (0.019) | 0.053 *** (0.009) | 0.076 *** (0.010) |
| Wald Chi2() | 11/ 346.89 *** | 12/ 368.73 *** | 11/ 547.14 *** | 11/ 333.19 *** | 11/ 515.63 *** | 11/ 401.12 *** | 12/ 336.96 *** | 13/ 345.68 *** | 12/ 283.63 *** | 12/ 436.37 *** | 12/ 524.56 *** | 13/ 530.14 *** |
| Log pseudolikelihood | −19639.7 | −19670.2 | −19632.3 | −19632.5 | −19683.0 | −19475.7 | −19540.1 | −19469.1 | −19522.2 | −19545.6 | −11907.1 | −11904.3 |
| Number of obs | 22288 | 22811 | 22811 | 22811 | 22811 | 22811 | 22811 | 22811 | 22811 | 22811 | 22288 | 22288 |
| Censored obs | 13412 | 13412 | 13412 | 13412 | 13412 | 13412 | 13412 | 13412 | 13412 | 13412 | ||
| Uncensored obs | 8876 | 8876 | 8876 | 8876 | 8876 | 8876 | 8876 | 8876 | 8876 | 8876 | ||
| Wald test of indep. eqns. (rho=0): chi2(1) | 6.08 ** | 5.96 ** | 7.99 *** | 7.69 *** | 11.5 *** | 17.19 *** | 6.82 *** | 14.22 *** | 3.81 ** | 5.66 ** | ||
Note: Significance levels: ***—1%; **—5%; *—10%.
© 2020 by the authors. Licensee MDPI, Basel, Switzerland. This article is an open access article distributed under the terms and conditions of the Creative Commons Attribution (CC BY) license (http://creativecommons.org/licenses/by/4.0/).
Share and Cite
MDPI and ACS Style
Teplova, T.; Sokolova, T.; Gubareva, M.; Galenskaya, K.; Teplov, A. Perception and Drivers of Financial Constraints for the Sustainable Development. Sustainability 2020, 12, 7217. https://0-doi-org.brum.beds.ac.uk/10.3390/su12177217
AMA Style
Teplova T, Sokolova T, Gubareva M, Galenskaya K, Teplov A. Perception and Drivers of Financial Constraints for the Sustainable Development. Sustainability. 2020; 12(17):7217. https://0-doi-org.brum.beds.ac.uk/10.3390/su12177217
Chicago/Turabian StyleTeplova, Tamara, Tatiana Sokolova, Mariya Gubareva, Kristina Galenskaya, and Andrey Teplov. 2020. "Perception and Drivers of Financial Constraints for the Sustainable Development" Sustainability 12, no. 17: 7217. https://0-doi-org.brum.beds.ac.uk/10.3390/su12177217
Note that from the first issue of 2016, this journal uses article numbers instead of page numbers. See further details here.