1. Introduction
In recent years, human agricultural production and lifestyles have an important impact on the ecological environment [
1]. Agriculture, as the basis of social and economic development, occupies an irreplaceable proportion of economically underdeveloped regions [
2]. The impact of the current agricultural development pattern on the environment is widespread in most regions of China. At the same time, energy exploitation also causes certain damage to the ecological environment [
3] and continue to produce a series of effects, such as aggravating the depletion of resources, increasing the amount of pollution, and threatening human health in serious cases. When agricultural development and energy development co-exist, it has a more profound impact on regional ecological environment. As an important part of ecological environment protection, ecological security research is related to the evolution of the regional ecological environment and indirectly affects the development of the regional economic system [
4]. Therefore, how to measure the vulnerability of the local ecological environment is an urgent problem that needs to be solved. As a broad concept, ecological security needs to be defined in detail in specific research. Combining the characteristics of this study, we can determine that the ecological security of the study area is mainly reflected in its agricultural production. Sustainable agricultural development and its good cycle with the economy and the environment are conducive to improving the overall ecological security level. When assessing the ecological security of areas with agricultural development as the mainstay, we can focus on the index factors that affect agricultural production and present the ecological security status of the assessed area by calculating the ecological security index.
Ecological security research has been divided into many different directions in its increasingly mature development. The evaluation of the study area is often focused on the selection and improvement of evaluation methods and the establishment and optimization of evaluation models. For example, Hodson and Marvin [
5] proposed the direction of urban ecological security pattern research and pointed out its existing research difficulties and importance. Su et al. [
6] conducted a systematic diagnosis of the sustainable development of land ecological security in Shanghai, overcame the shortcomings of the current evaluation methods in terms of subjectivity and complexity, and established a catastrophic model of land ecological security evaluation. Huang et al. [
7] proposed the concept and system of an ecological footprint stress index based on ecological footprint, analyzed the ecological security of Shaanxi province, and proposed some measures to slow down the growth of ecological footprint. Hua et al. [
8] constructed the Dali Bai Autonomous Prefecture land ecological security evaluation index system and used the entropy method to comprehensively evaluate the land ecological security of Dali Prefecture. Li et al. [
9] developed a coupled ecological security assessment model to assess the level of ecological security of typical grasslands and used this model to conclude that ecological security in Inner Mongolia has been seriously threatened since 2005. Analyzing the concentration and distribution of specific pollutants can also assess the ecological security of the area. Liu et al. [
10] studied the distribution of phthalates (PAEs) in the surface sediment-porous water system of the Haihe River and assessed the impact of human activities on the aquatic ecosystem. Ma et al. [
11] assessed the impact of concentrated heavy metals in mining activities on soil microbiota. Sogbanmu et al. [
12] evaluated the seasonal effects of polycyclic aromatic hydrocarbons on fish in Lagos lagoon, Nigeria. Donkor et al. [
13] used the pollution index to assess the ecological risks of Cd, Zn, Pb, and As in the sediments of the Bilim River Basin.
Ecological security assessment is a key method for adaptation and mitigation of environmental degradation [
14]. Ecological security assessment can not only explore the ecological environment status of the assessed region but also clarify the regional ecological evolution trend and provide scientific suggestions for the prevention and control of ecological deterioration for local relevant departments, thus promoting the sustainable development of regional ecological environment and economic society [
15]. With the rapid development of economy and society, the demand for agricultural products and mineral resources is increasing [
16], resulting in increasingly prominent environmental problems. Ecological security changes in fast-developing areas are more flexible, and ecological security assessment research is indispensable. Therefore, the ecological security zoning in these areas is particularly important, and the changes in ecological security have a certain potential. The current research has certain defects in the monitoring of the ecological security zoning and cannot accurately reflect the characteristics of the regional changes.
Starting from the natural, social, and economic indicators, a selection of the main index factors affecting the ecological security [
17], this research built a suitable index system for ecological security evaluation of the Weibei region. Using the spatial principal component analysis (SPCA) method, the degree of ecological security analysis of classification and grading results of the Weibei region were evaluated quantitatively. The research results enrich the research on ecological security in the research region. The research content covers specific districts and counties in the Weibei area. The research emphasizes the importance of the ecological buffer zone to the development of ecological security and provides a theoretical reference for the comprehensive management of the local ecological environment.
2. Materials and Methods
2.1. Research Area
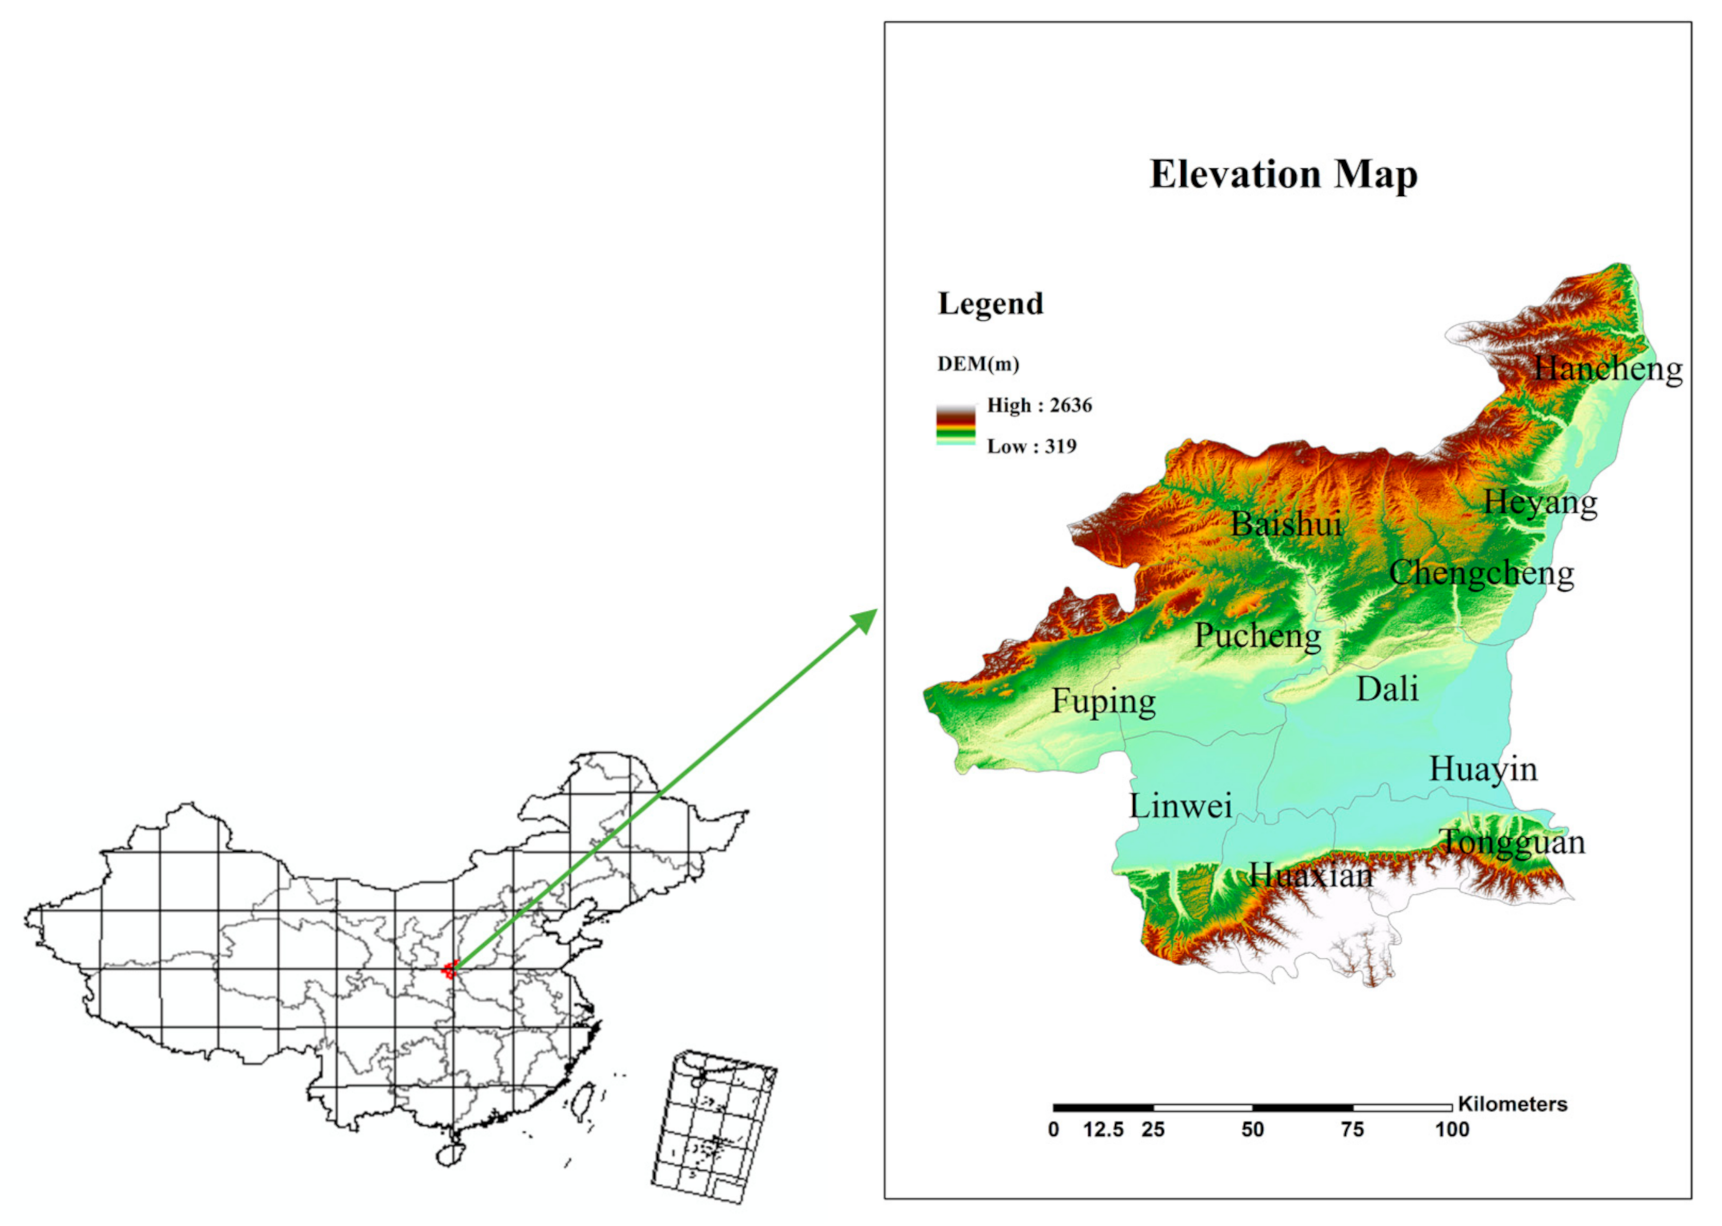
The Weibei area is located in the middle of the Yellow River Basin, the Guanzhong Basin abdomen. It is 182.3 kilometers long from north to south and 149.7 kilometers wide from east to west, with a total area of 13,100 km
2. The geological structure of the Weibei area is complex and the terrain varies greatly with an altitude of 330–2645 m. The lowest point is the alluvial plain at the lower reaches of the Wei River and Luo River. Loess tableland 500 m above sea level accounts for 43.9% of the total area. The region has a semi-humid and semi-arid monsoon climate in the warm temperate zone, with an average annual temperature of 11.5–13.6 °C and an annual precipitation of 508–608mm (
Figure 1). In addition, the region is located at the confluence of the Yellow River, Weihe River, and Luohe River, with abundant water resources. Therefore, its climatic conditions are suitable for agricultural development, and it is an agro-ecological advantage area in the region.
The Weibei region is also rich in mineral resources, especially the reserves of coal, molybdenum, and gold, and it is among the top 10 coal producing areas in China. This city agriculture foundation is good, development is fast, and it is a region affirming one of five main commodity grain bases. However, as an important buffer zone on the edge of the Loess Plateau, human activities have a greater impact on the environment, and there is currently little research on this subject.
2.2. Data Sources
We obtained the data needed for this study from different sources (
Table 1).
2.3. Construction of Ecological Security Evaluation Index System
Due to the differences of the selected index factors and the differences of the temporal and spatial evolution of regional ecology, ecological security presents different research results [
18]. Different indicators have different focuses, so researchers need to make appropriate choices according to the actual situation of the evaluation region, so as to make the research results of ecological security more in line with the ecological status and development trend of the evaluation region. This study combined with the “driving force response” mechanism to select indicators and comprehensively analyze the reasons and evaluation results of the regional ecological status quo. According to the quantitative research of regional ecological security index, natural index and social index are incorporated into the “cause” system, which means that most of the factors affecting regional ecological security are natural indicators and social indicators, while the economic index is included in the “result” system. The representation of economic indicators maps the impact of natural indicators and social indicators on regional development.
In this study, the characteristics of natural environment and natural stress factors in the Weibei region were taken into comprehensive consideration [
19]. Six indexes, namely average annual precipitation, average annual air temperature, average annual evaporation, sunshine duration, altitude, and slope, were selected to construct the natural origin index system. In combination with the development of human social activities in the Weibei region, the three indexes of reclamation rate, population density, and natural growth rate were selected to construct the index system of social causes [
20]. The economic development status and industrial form of the Weibei region were analyzed, and per capita GDP and agricultural/industrial output ratio were selected as economic cause indicators [
21] (
Table 2). The development of economy and society is closely related to the evolution of natural environment. By comprehensively considering and analyzing the influence degree of each system index factor, it is beneficial to scientifically present the sustainable development relationship between economy and society and environment.
The selection and determination of the above indicators are mainly based on two points: One is to comprehensively consider the natural ecological environment of the Weibei region and select conventional indicators from three aspects: nature, society, and economy. The second is to use principal component analysis to determine the extent of their impact on the ecological security of the study area by integrating data on these indicators in various years.
2.4. Application of Spatial Principal Component Analysis
The evaluation index system of ecological security contains different types of data. How to reflect the local ecological security situation more accurately through the data of the multi-index evaluation system is a problem faced by most research institutes. PCA can compress the original data set through the idea of dimensionality reduction. Since it is difficult to eliminate the correlation influence between evaluation indicators, it takes a lot of effort to select indicators, while principal component analysis can eliminate such correlation influence, so it is relatively easy to select indicators [
22]. In addition, when there are many rating indicators, most of the information can be retained. In the analysis of ecological security assessment, part of the principal components can be abandoned, and only a few principal components with large anterograde variance can be used to represent the original variables, thus reducing the calculation workload. In this study, since the study area covers multiple counties, the study of spatial changes can enhance the comprehensiveness of this study. We therefore adopted spatial principal component analysis, which is an improvement of principal component analysis and has the same principle. SPCA fully considers the characteristics of ecological safety evaluation on the basis of the application advantages of principal component analysis. The application of SPCA can reflect data in multiple dimensions in spatial changes, which is conducive to the combination of data quantification and analysis.
2.5. Calculation of Ecological Security Index
The calculation of the ecological security index is a direct manifestation of the ecological security status of the research area, and it is also the basis for analyzing the causes of ecological security changes. Due to the different dimensions of the data, the data need to be standardized before calculation. The original values were standardized in the following formula.
where
i is the evaluation unit,
Xi is the original value of
i, and
Xmax and
Xmin are the maximum and minimum values of
i.
On the basis of spatial principal component analysis, the dimensionality reduction of the data and the calculation of the ecological security index [
23] can be used to more comprehensively understand the state of health security in the corresponding region. The weights of principal component factors are obtained according to SPCA [
24]. The higher the ecological security index, the more stable the environment. The calculation formula of the ecological security index is as follows:
where
ESI is the ecological security index,
t is the contribution ratio of the principal component,
B is the principal component, and
m is the number of principal components retained.
As the characteristic values of different years are different, the calculation formulas of the ecological security index for 1997, 2006, and 2015 are as follows:
In the formulas, ESI1997, ESI2006, and ESI2015 represent the ecological security index; A1–A3 are the three principal components in 1997. Likewise, B1–B3 are the three principal components in 2006, and C1–C3 are the three principal components in 2015.
2.6. Ecological Security Zoning Method
The method of ecological security zoning should conform to the actual situation of the study area as much as possible. Reasonable and scientific zoning is an important reference for the accurate implementation of relevant departments.
The classification of ecological security [
25] is conducive to the study of regional ecological evolution characteristics. This study combined ArcGIS software and the natural breakpoint classification method for the ecological security of the Weibei area to make a reasonable classification, which was divided into five grades, from class I–V, representing the ecological security from low level to high level development (
Table 3). The specific division criteria are: I (0.96 < ESI ≤ 1.64), II (1.6 4< ESI ≤ 2.32), III (2.32 < ESI ≤ 3.00), IV (3.00 < ESI ≤ 3.679), V (ESI > 3.679).
3. Results
3.1. The SPCA Results
Through the selection of the ecological security index system, the 11 evaluation factors selected all represent the stable status of ecological security. According to the SPCA method, SPSS software was used to determine the three principal components. The cumulative contribution results of the PCs are shown in
Table 4.
3.2. Ecological Security Index and Its Distribution
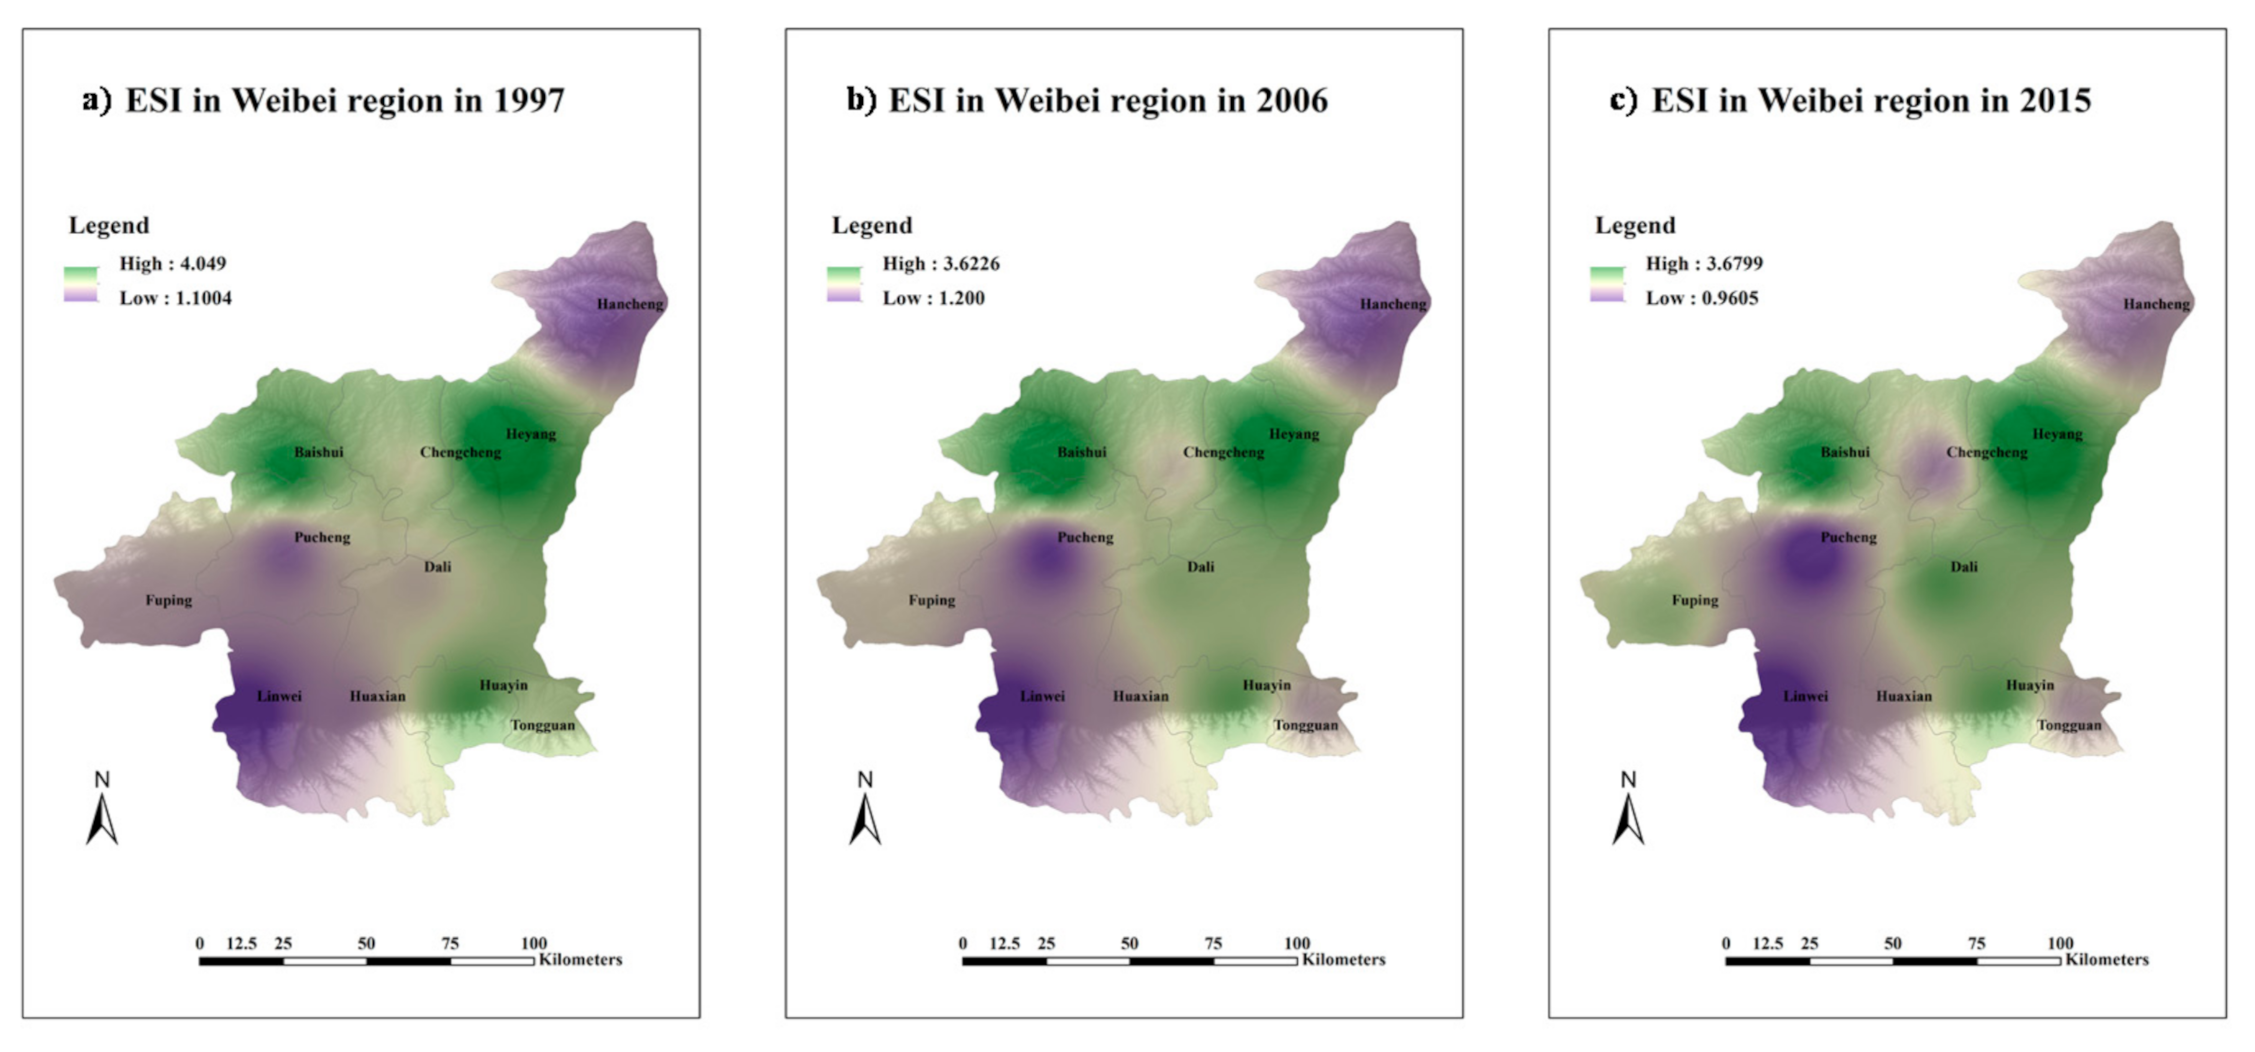
From 1997 to 2015, the ecological security indexes of counties and districts in the Weibei region changed to different degrees. As shown in
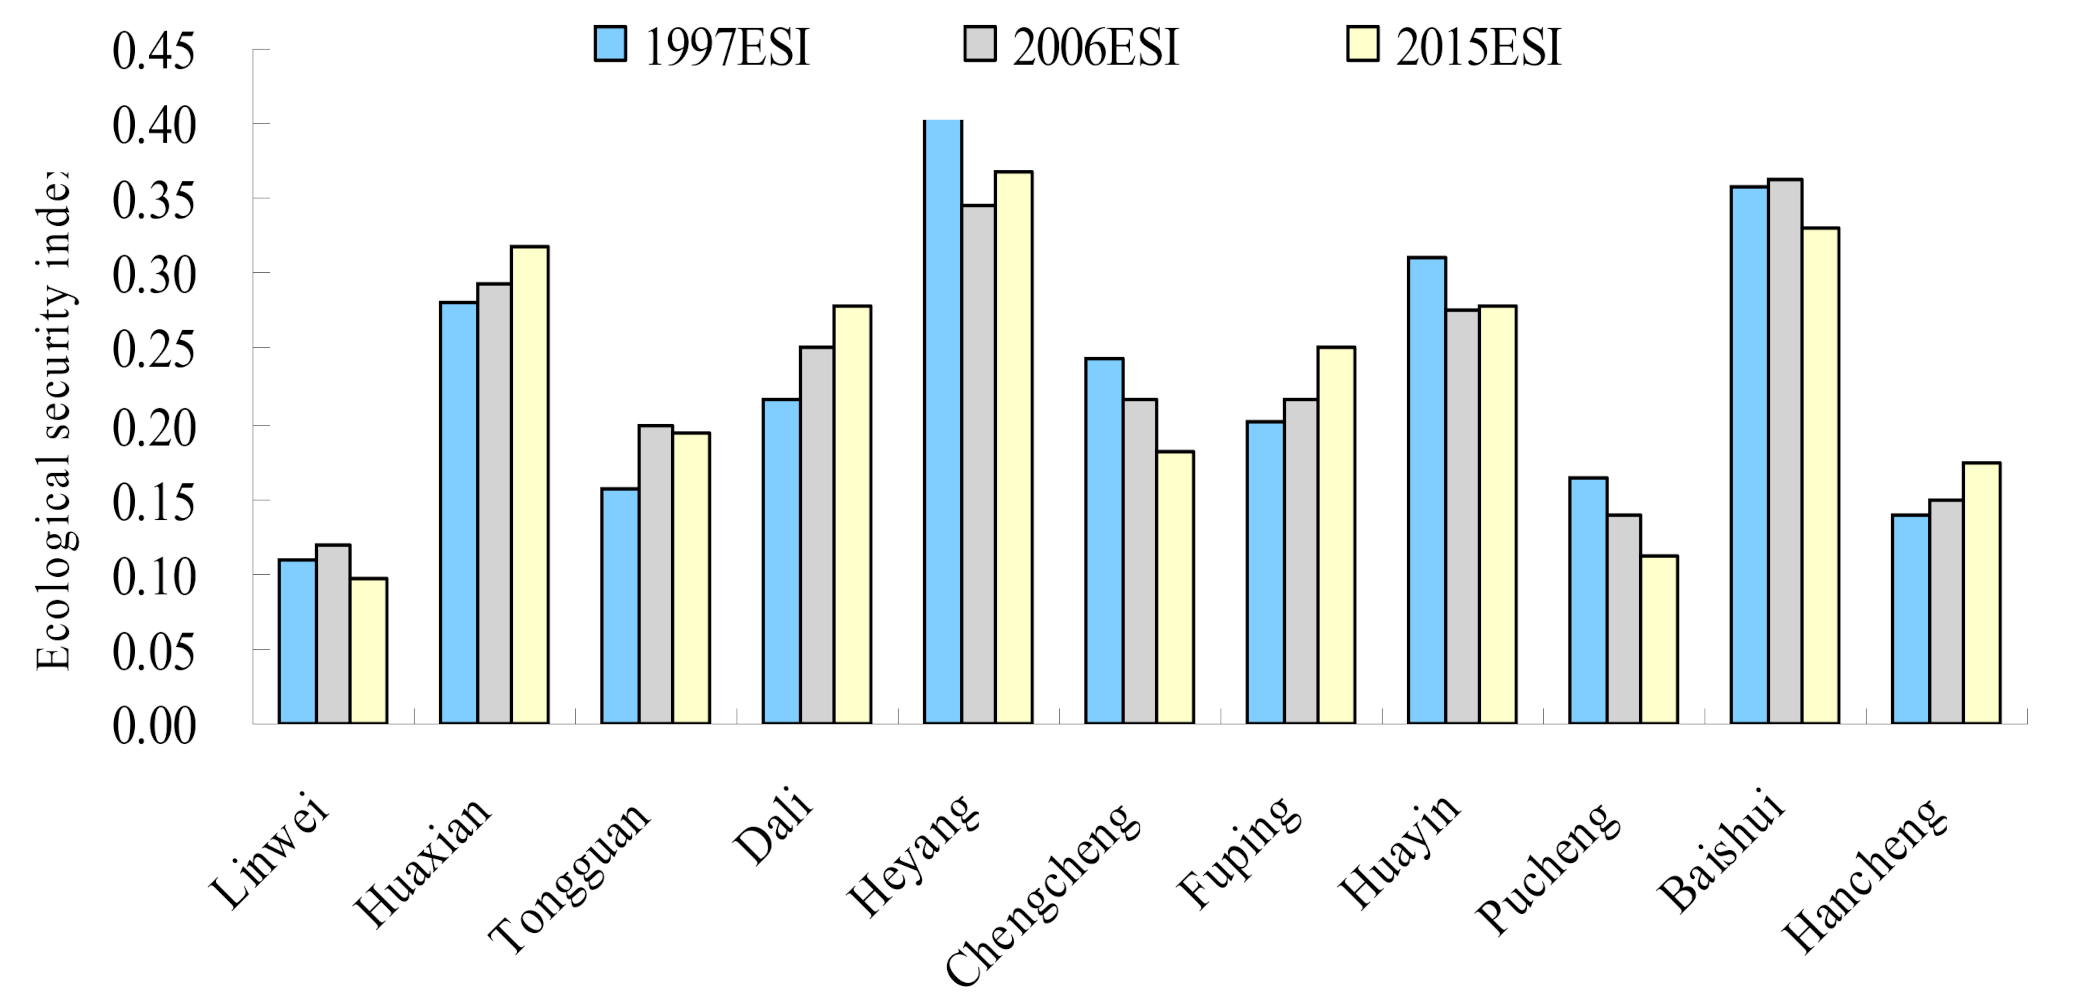
Figure 2, from 1997 to 2015, compared with these counties, the ecological security index of Linwei District was the lowest. As the political center of the Weibei region, the development of urbanization and the high concentration of industry have greatly impacted the local security system. In 1997, Heyang County had the highest ecological security index, but in subsequent years, Baishui County had the highest ecological security index. This was mainly due to the construction and development of many economic development zones and production bases, which increased the degree of local ecological vulnerability. At the same time, as shown in
Figure 3, the energy-security-oriented cities (Hancheng, Pucheng, Tongguan, etc.) had a significantly lower ecological safety index than cities dominated by the agricultural economy (Baishui, Heyang, etc.).
Based on the analysis of the ecological security index of 11 counties in Weibei, the ecological security index continued to decline in Tongguan County, Chengcheng County, and Pucheng County and continued to rise in Dali County, Fuping County, and Hancheng County (
Figure 3). Based on the interaction between the implementation of the policy and the economic development and construction, the areas with increasing ecological security index showed that the implementation of the policy greatly promoted the improvement of ecological environment quality. The regions with lower ecological security index showed that energy development and urbanization caused great disturbance to the ecological environment, leading to a higher and unstable degree of ecological vulnerability.
3.3. Zoning of Ecological Security and Trend of Index Changes
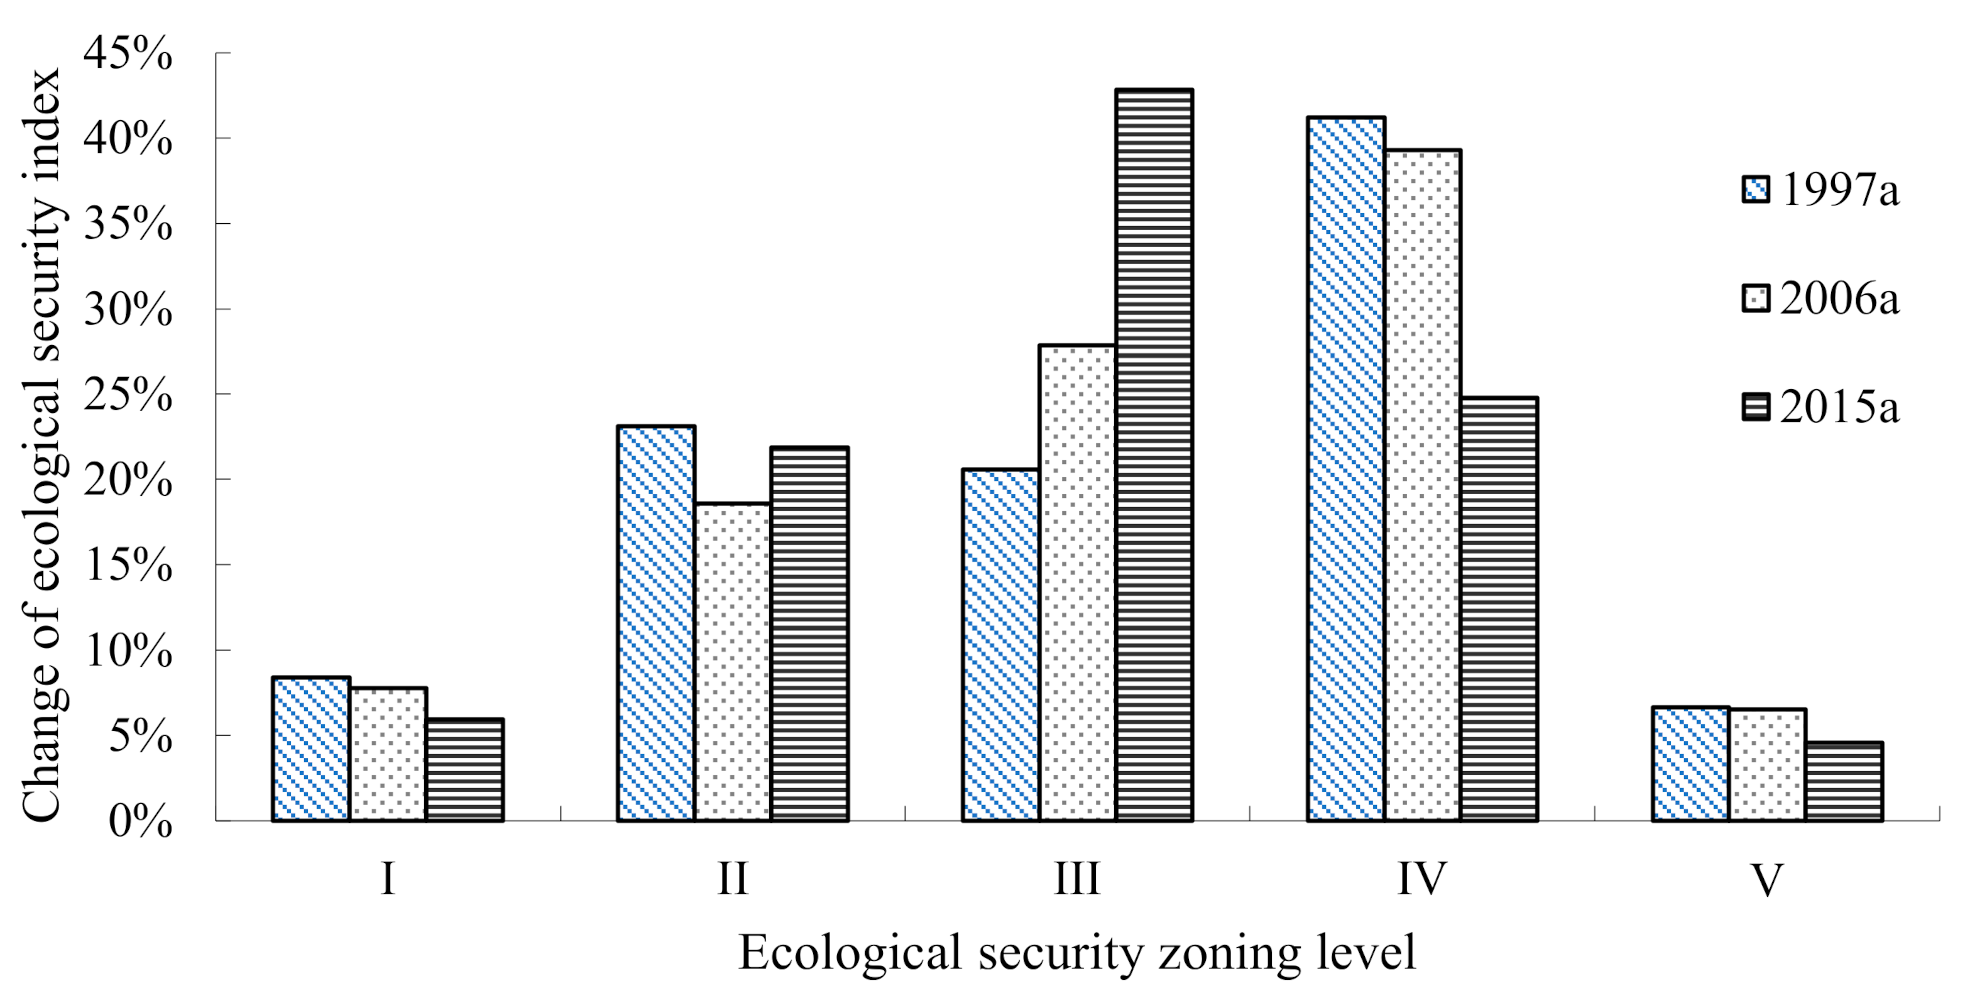
From 1997 to 2015, the characteristics of ecological security zoning changed significantly. Although the area of ecologically unsafe areas was small and decreased year by year, such as in region I, the area of ecological security areas also decreased year by year, such as in regions IV and V. At the same time, a large number of regions were transformed into intermediate buffer zones for ecological security, such as region III. The area occupied by region I decreased from 8.39% in 1997 to 5.95% in 2015. Region IV changed from 41.2% to 24.79%, and similar changes occurred in region V, from 6.66% to 4.57%. In contrast, the area occupied by region III changed from 20.61% to 42.84%. From 1997 to 2006, region IV occupied the largest area, while region III occupied the largest area in 2015. It could be seen from the change in area that the area of ecologically safe areas and unsafe areas was decreasing, and the area of ecological buffers was increasing year by year, showing that the uncontrollability of ecological security continued to increase (
Figure 4).
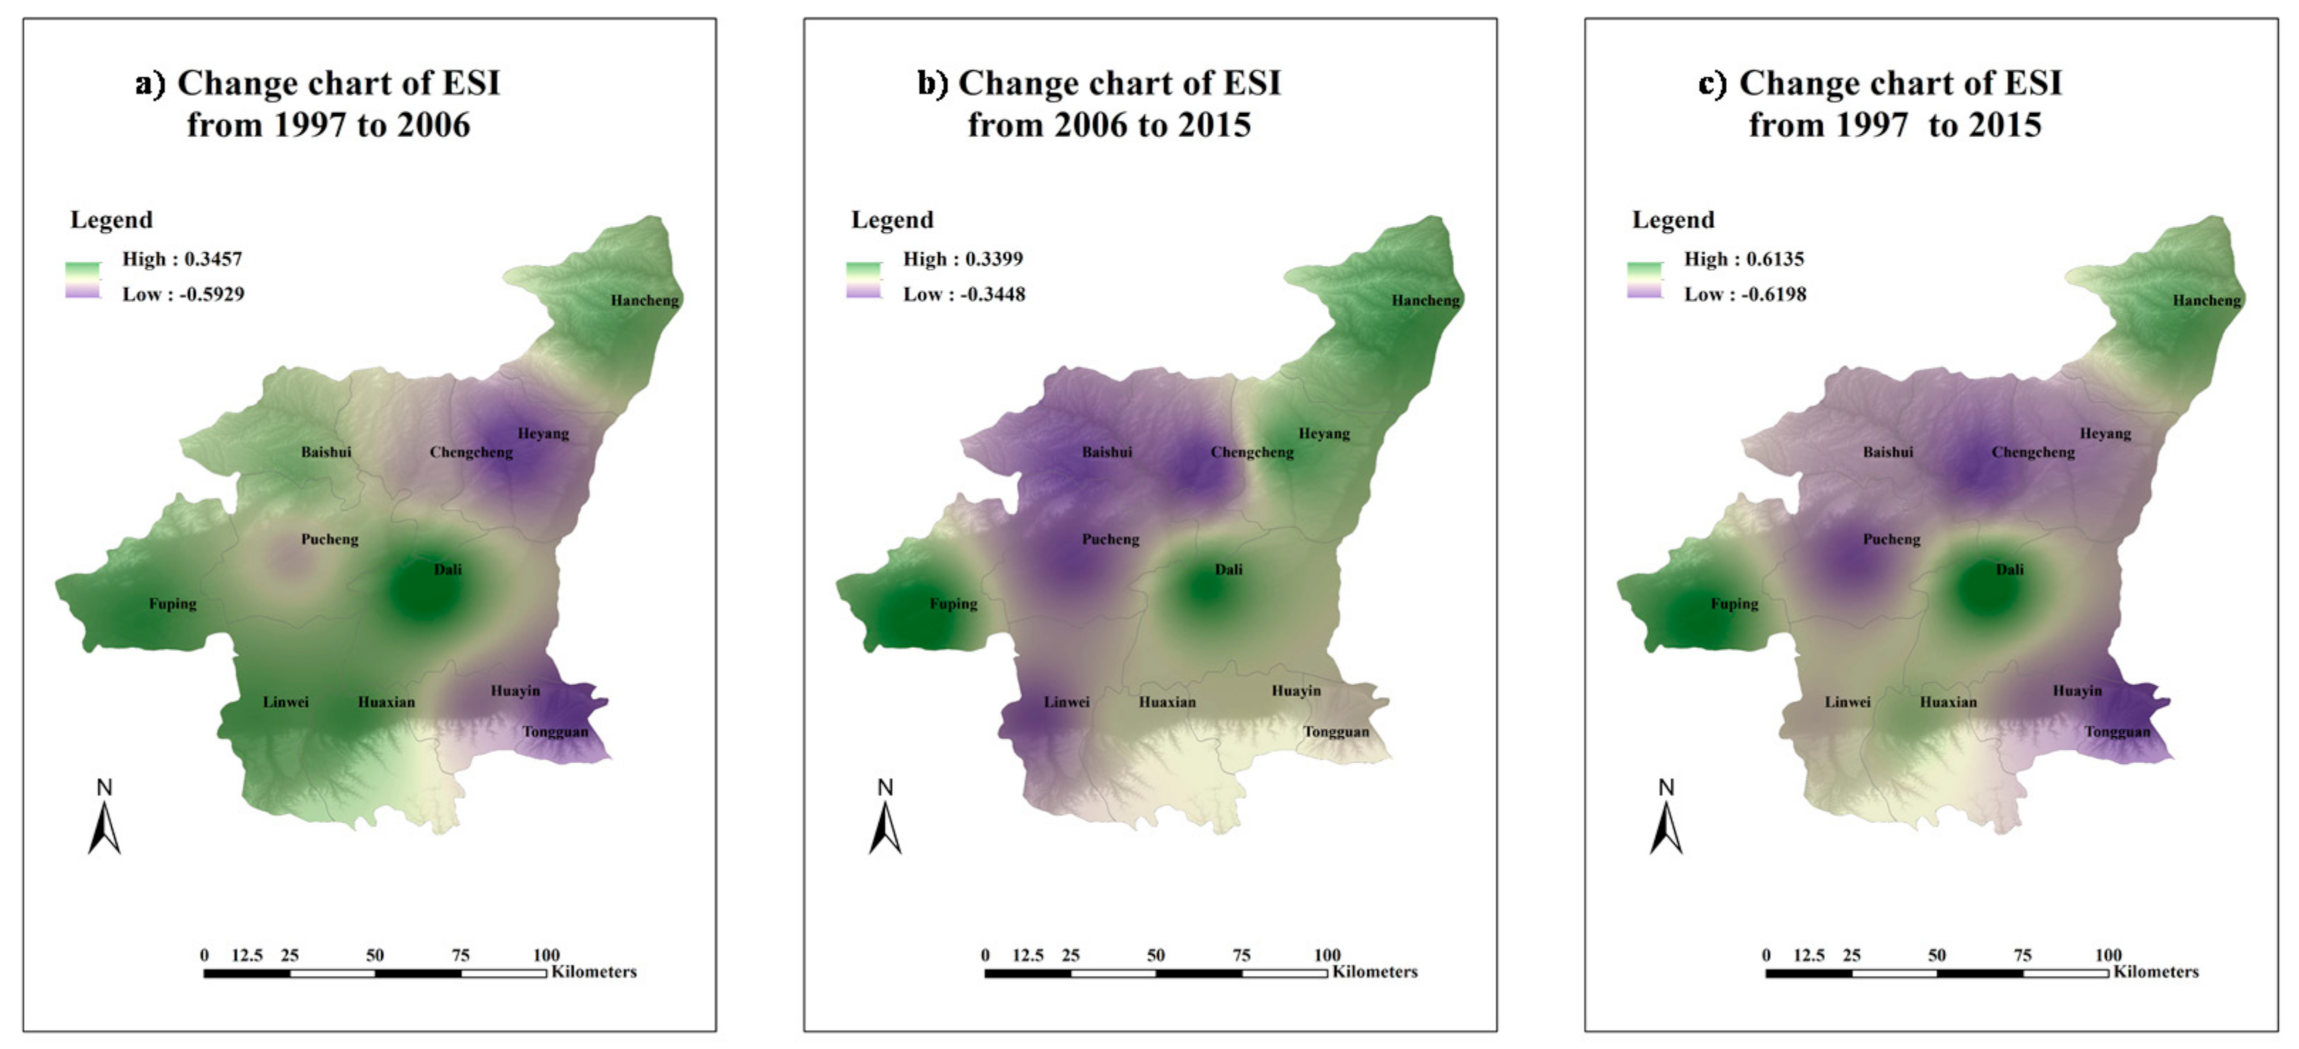
From 1997 to 2015, the ecological security index of most areas in the Weibei region decreased, indicating that the stability of the ecological environment decreased, and the ecological security index of only a few areas increased, such as Fuping County, Dali County, Hua County, and Hancheng City. During this period, the variation of different intervals was quite different (
Figure 5).
From 1997 to 2006, the ecological security index increased in most areas, except for Heyang County, Chengcheng County, Huayin City, and Tongguan County. There were both energy-oriented development areas and agriculture-oriented cities in these places. The reasons for this phenomenon were all related to the pattern of human economic development.
From 2006 to 2015, the areas where the ecological security index increased significantly decreased compared with the previous period, while the areas where the ecological security index decreased significantly increased, indicating that the stability of ecological security gradually decreased compared with the previous period. Areas with increased ecological security index were Hancheng County, Heyang County, Dali County, Hua County, and Fuping County; meanwhile, areas with decreased ecological security index were concentrated in the central part, such as Baishui County, Pucheng County, Linwei District, and Chengcheng County. There were both agricultural development cities and energy exploitation cities in these cities, where urbanization and economic development were the main reasons for this situation.
5. Conclusions
From 1997 to 2015, the safe area (region V) and the unsafe area (region I) in the ecological security zone both decreased significantly, while the ecological security buffer area (region III) increased year by year. The ecological security buffer zone had a large area, and its changes directly affected the stability of the whole region. Therefore, some areas that should not be ignored are still in an unstable state of ecological security. Local governments need to actively implement the policy of returning farmland to forests, effectively improving the ecological environment, promoting economic restructuring, and promoting the development of green industries.
From 1997 to 2017, Weibei showed changes of the ecological security index of different districts and counties, including Linwei, which maintained the lowest ecological security index. Among them, although the ecological security index of Tongguan County, Chengcheng County, and Pucheng County decreased year by year, the overall index value was still high. However, the ecological security index of Hua County, Fuping County, and Hancheng County showed an increasing trend year by year.
Changes in ecological security are mainly attributed to the following points: the development of urbanization, the concentration of industrial production, the construction of economic development zones, and the development of energy.
For the mixed development areas of agriculture and mining, the characteristics of ecological security changes were obvious, and uncontrollable factors were large. The change of ecological security buffer zone is one of the areas that should be paid more attention to in the future.


