Article

Improving Green Market Orientation, Green Supply Chain Relationship Quality, and Green Absorptive Capacity to Enhance Green Competitive Advantage in the Green Supply Chain

1
Department of Urban Industrial Management and Marketing, University of Taipei, Taipei 11153, Taiwan
2
Department of OMIS, Schulich School of Business, York University, 4700 Keele Street, Toronto, ON M3J 1P3, Canada
3
IT, Analytics, and Operations Department, Mendoza College of Business, University of Notre Dame, Notre Dame, IN 46556, USA
4
Joseph M. Katz Graduate School of Business and College of Business Administration, The University of Pittsburgh, Pittsburgh, PA 15260, USA
*
Author to whom correspondence should be addressed.
Sustainability 2020, 12(18), 7251; https://0-doi-org.brum.beds.ac.uk/10.3390/su12187251
Submission received: 25 July 2020 / Revised: 31 August 2020 / Accepted: 31 August 2020 / Published: 4 September 2020
(This article belongs to the Special Issue Supply Chain Management for Sustainable Development)

Abstract

:
This study examines the influences of market orientation, supply chain relationship quality, and absorptive capacity on competitive advantage in green supply chains. We examine the intensity of these relationships in a green supply chain context. This study aims to figure out the effects of green market orientation (GMO), green supply chain relationship quality (GRQ), and green absorptive capacity (GAC) on green competitive advantage (GCA) in a supply chain. We find a significant positive association between these constructs. It highlights the importance of antecedents such as GMO, GRQ, and GAC on improving GCA. We jointly investigate the effects of GMO, GRQ, and GAC on green supply chain competitive advantage. This study uses Process Macro 2.15 to test the mediation effect between GMO and GCA. The result shows that GRQ and GAC completely mediate the relationship between GMO and GCA and that the effect sizes are 0.11 and 0.20, respectively. This study also reruns the model to clarify whether competing models are better than our model. However, the performance of such a competing model is poor. Finally, we accept our model instead of the competing model. GMO and GRQ among team managers and employees appear to contribute positively to GCA. Although GAC does not directly influence GCA, GMO has a significant total effect on GCA when intervened by GRQ and GAC. The key contribution is that green market orientation, i.e., the employee culture and the emphasis on being environmentally responsible, is a key antecedent to GRQ, GAC, and GCA. Managerial implications of the findings are listed.

1. Introduction

The internet has played a significant role in facilitating collaboration between partners of the supply chain. The entire value chain including suppliers, their suppliers, customers, and their customers are typically connected to each other through web-based software applications like Enterprise Resource Planning. With the prevalence of online business amongst supply chain partners and utilization of tools such as online procurement and of independent trade exchanges, most firms are experiencing a significant shift in the e-commerce industry. Tools such as Electronic Data Interchange, internet, intranet, and extranet have made real-time information readily available to partners of a supply chain. The advanced information technology has significantly enhanced firms’ flexibility and capability. Information technology has enabled firms to sell more high-quality products at a reduced cost. For example, Dell uses virtual integration to implement its postponement strategy. The real-time internet-connection allows channel players in the supply chain to improve their efficiency and to develop competitive advantage. In recent times, this rampant shift to e-commerce is also observed in Asian countries.
The manufacturing industry has seen a significant emphasis on environmentally friendly products due to increasing pressure from consumers, environmental activists, and government regulations. The ubiquity of online customer shopping has put similar pressure on the e-commerce industry to embrace environmentally conscientious green supply chain practices. To meet customer requirements for environmentally friendly and sustainable products, firms must establish green-oriented management strategies, which emphasize environmental issues of sustainability [1]. Given environmental regulations and increasing liability for hazardous products, firms are ever more motivated to incorporate green supply chain practices into its operations. Manufacturers are eager to implement strategies such as reverse logistics and recycling to reduce environmental hazards and to reduce cost. It is curious whether firms that are able to effectively combine existing and newly acquired environmental knowledge have competitive advantage over its competitors in e-commerce. Environmental issues such as energy efficiency are gaining momentum. Numerous firms have complied with environmental regulatory standards by adopting the market-leading carbon trust standard and by attaching carbon footprint labels to their products. Environmental and consumer advocates believe in preserving the planet and in protecting the environment. When making decisions on green products, firms can implement sustainable development strategies to improve performance.
With the growth of e-commerce in most industries, the green market concerned with environmental protection and sustainability is growing [2,3]. Carefully addressing environmental issues and developing strategies may enhance green supply chain (SC) competitiveness [4]. The SC success heavily depends on efficient production and distribution. The problems are whether green market orientation (GMO), green supply chain relationship quality (GRQ), and green absorptive capacity (GAC) effectively help businesses to achieve green competitive advantage (GCA). With the rich literature in business-to-business supply chain relationships, we aim to understand the drivers of supply chain relational quality and its impact on firm’s competitive advantage.
This study aims to figure out the effects of green market orientation (GMO), green supply chain relationship quality (GRQ), and green absorptive capacity (GAC) on green competitive advantage (GCA) in a supply chain. Few studies have examined the relationships among GMO, GRQ, GAC, and GCA, and this study focuses on applying GRQ and GAC to fill research gaps in GMO theory. Compared with a previous study, our study provides different perspectives to improve GCA by increasing GRQ and GAC. The authors have examined the relationships in a green supply chain context. We introduce a nomological model demonstrating the direct effect of green market orientation (GMO) on green absorptive capacity (GAC), green supply chain relationship quality (GRQ), and green competitive advantage (GCA) and the impact of GRQ on GAC and GCA. Green market orientation (GMO) in a green context consists of service delivery, customer service, strategy implementation, competitive focuses, and product and service quality that are environmentally friendly [5]. Green absorptive capacity (GAC) focuses on the transfer, receipt, and application of existing as well as new environmental knowledge in the green supply chain context [6]. Green supply chain relationship quality (GRQ) focuses on supply chain (SC) members’ working relationship (e.g., trust, flexibility, and communication) with each other in a green SC [7]. Section 2 discusses the theoretical background, reviews the literature, and develops the hypotheses. Section 3 begins with the methodology, while Section 4 discusses the key results. We present the conclusions and implications in Section 5.

2. Materials and Methods

Market orientation is “an organizational culture focused on competitors, customers, and inter-functional co-ordination” [8]. This can be applied to green market-oriented firms that seeks to disseminate green knowledge with its supply chain partners. Therefore, green market orientation can lead to green absorptive capacity. For companies that make it a priority to manufacture green products, we postulate that they will be environmentally oriented and that they will be focused on achieving customer satisfaction when it comes to delivering green products, finally ensuring that their supply chain partners have similar green priorities.
Social exchange theory postulates that communication can lead to bonding between partners, which is symbolic of the trust shared between partners [9]. Green market orientation could cause supply chain partners to share green knowledge as they have similar strategic and competitive priorities to manufacture environmentally friendly products. The trust shared can enhance the ability to share green knowledge freely without fear of opportunism. Both knowledge sharing symbolized by absorptive capacity and trust symbolized by relationship quality can provide green competitive advantages to supply chain partners. The commitment-trust theory maintains that those networks characterized by relationship commitment and trust engender cooperation [10] (p. 34). Applying social exchange theory and trust-commitment theory [10], the study postulates that the depth of knowledge shared between trusting and committed partners will give them an added competitive advantage when manufacturing green products in comparison to their competitors. In this study, green knowledge is shared between employees and its supplier representatives to ensure environmental objectives are achieved.
A firm’s market orientation is its business philosophy for discovering and meeting customer needs or wants. It can be viewed as strategies and tactics made inter-functionally and inter-divisionally [11]. Jaworski and Kohli [12] believed that market orientation emphasizes certain market information-processing activities. Narver and Slater [8] regard MO as an organizational culture that creates continuous superior business performance, with three dimensions—competitor orientation, customer orientation, and inter-functional coordination—and two decision criteria—profitability and long-term focus. Although the fundamental functions of MO are the creation of activities and strategies [13], entrepreneurial culture [8], and environmental friendliness [14], MO is also indicative of the organizational culture. We argue that firms that have an organizational culture where employees care about the environment will be green supply chain focused and environmentally conscientious in their interactions with both customers and suppliers.
Deshpandé and Farley [5,15] maintained that market orientation is a “set of cross-functional processes and activities directed at creating and satisfying customers through continuous needs-assessment.” They developed a ten-item scale to assess market orientation by focusing on the relationship between the firm and its business partners. We adapt Deshpandé and Farley’s [5] definition and posit that green market orientation is a set of cross-functional green processes and activities directed at creating and satisfying customers through continuous assessment of green supply chain management and at assessing whether improved customer value is a priority. We also modify their variables (indicators) to evaluate market orientation in a green supply chain context.
To meet the needs of both customers and suppliers, a firm must assess its relationship quality (RQ). Previously, conceptualized and theoretically developed constructs (e.g., trust, commitment, satisfaction, adaptation, communication, etc.) have been applied to assess the quality of the relationship between the firm and its suppliers [7,16,17,18,19]. Trust and commitment are the most common and widely accepted dimensions of RQ. Morgan and Hunt [10] (p. 23) conceptualized trust as “confidence in an exchange partner’s reliability and integrity.” Commitment is what transforms the promise into reality and is “an enduring desire to maintain a valued relationship” [20] (p. 316).
Farrelly and Quester [21] conducted another study that found that market orientation has a positive effect on trust and commitment. Therefore, trust is an antecedent of buyer–supplier relationship and a key managerial competency [20,22,23]. The social exchange theory views such dyadic channel relationships as mutually satisfying [24], and resource dependence theory views trust as a key ingredient in sustaining a positive link between the supplier and buyer. Additionally, Morgan and Hunt [10] noted that trust could foster firm commitment and could reduce relationship conflict, which is reflected in a buyer–supplier relationship. When trust is shared in a relationship, suppliers are more committed to the success of a relationship. Trust and commitment thus can be posited to enhance the positive effect between market orientation and relationship quality.

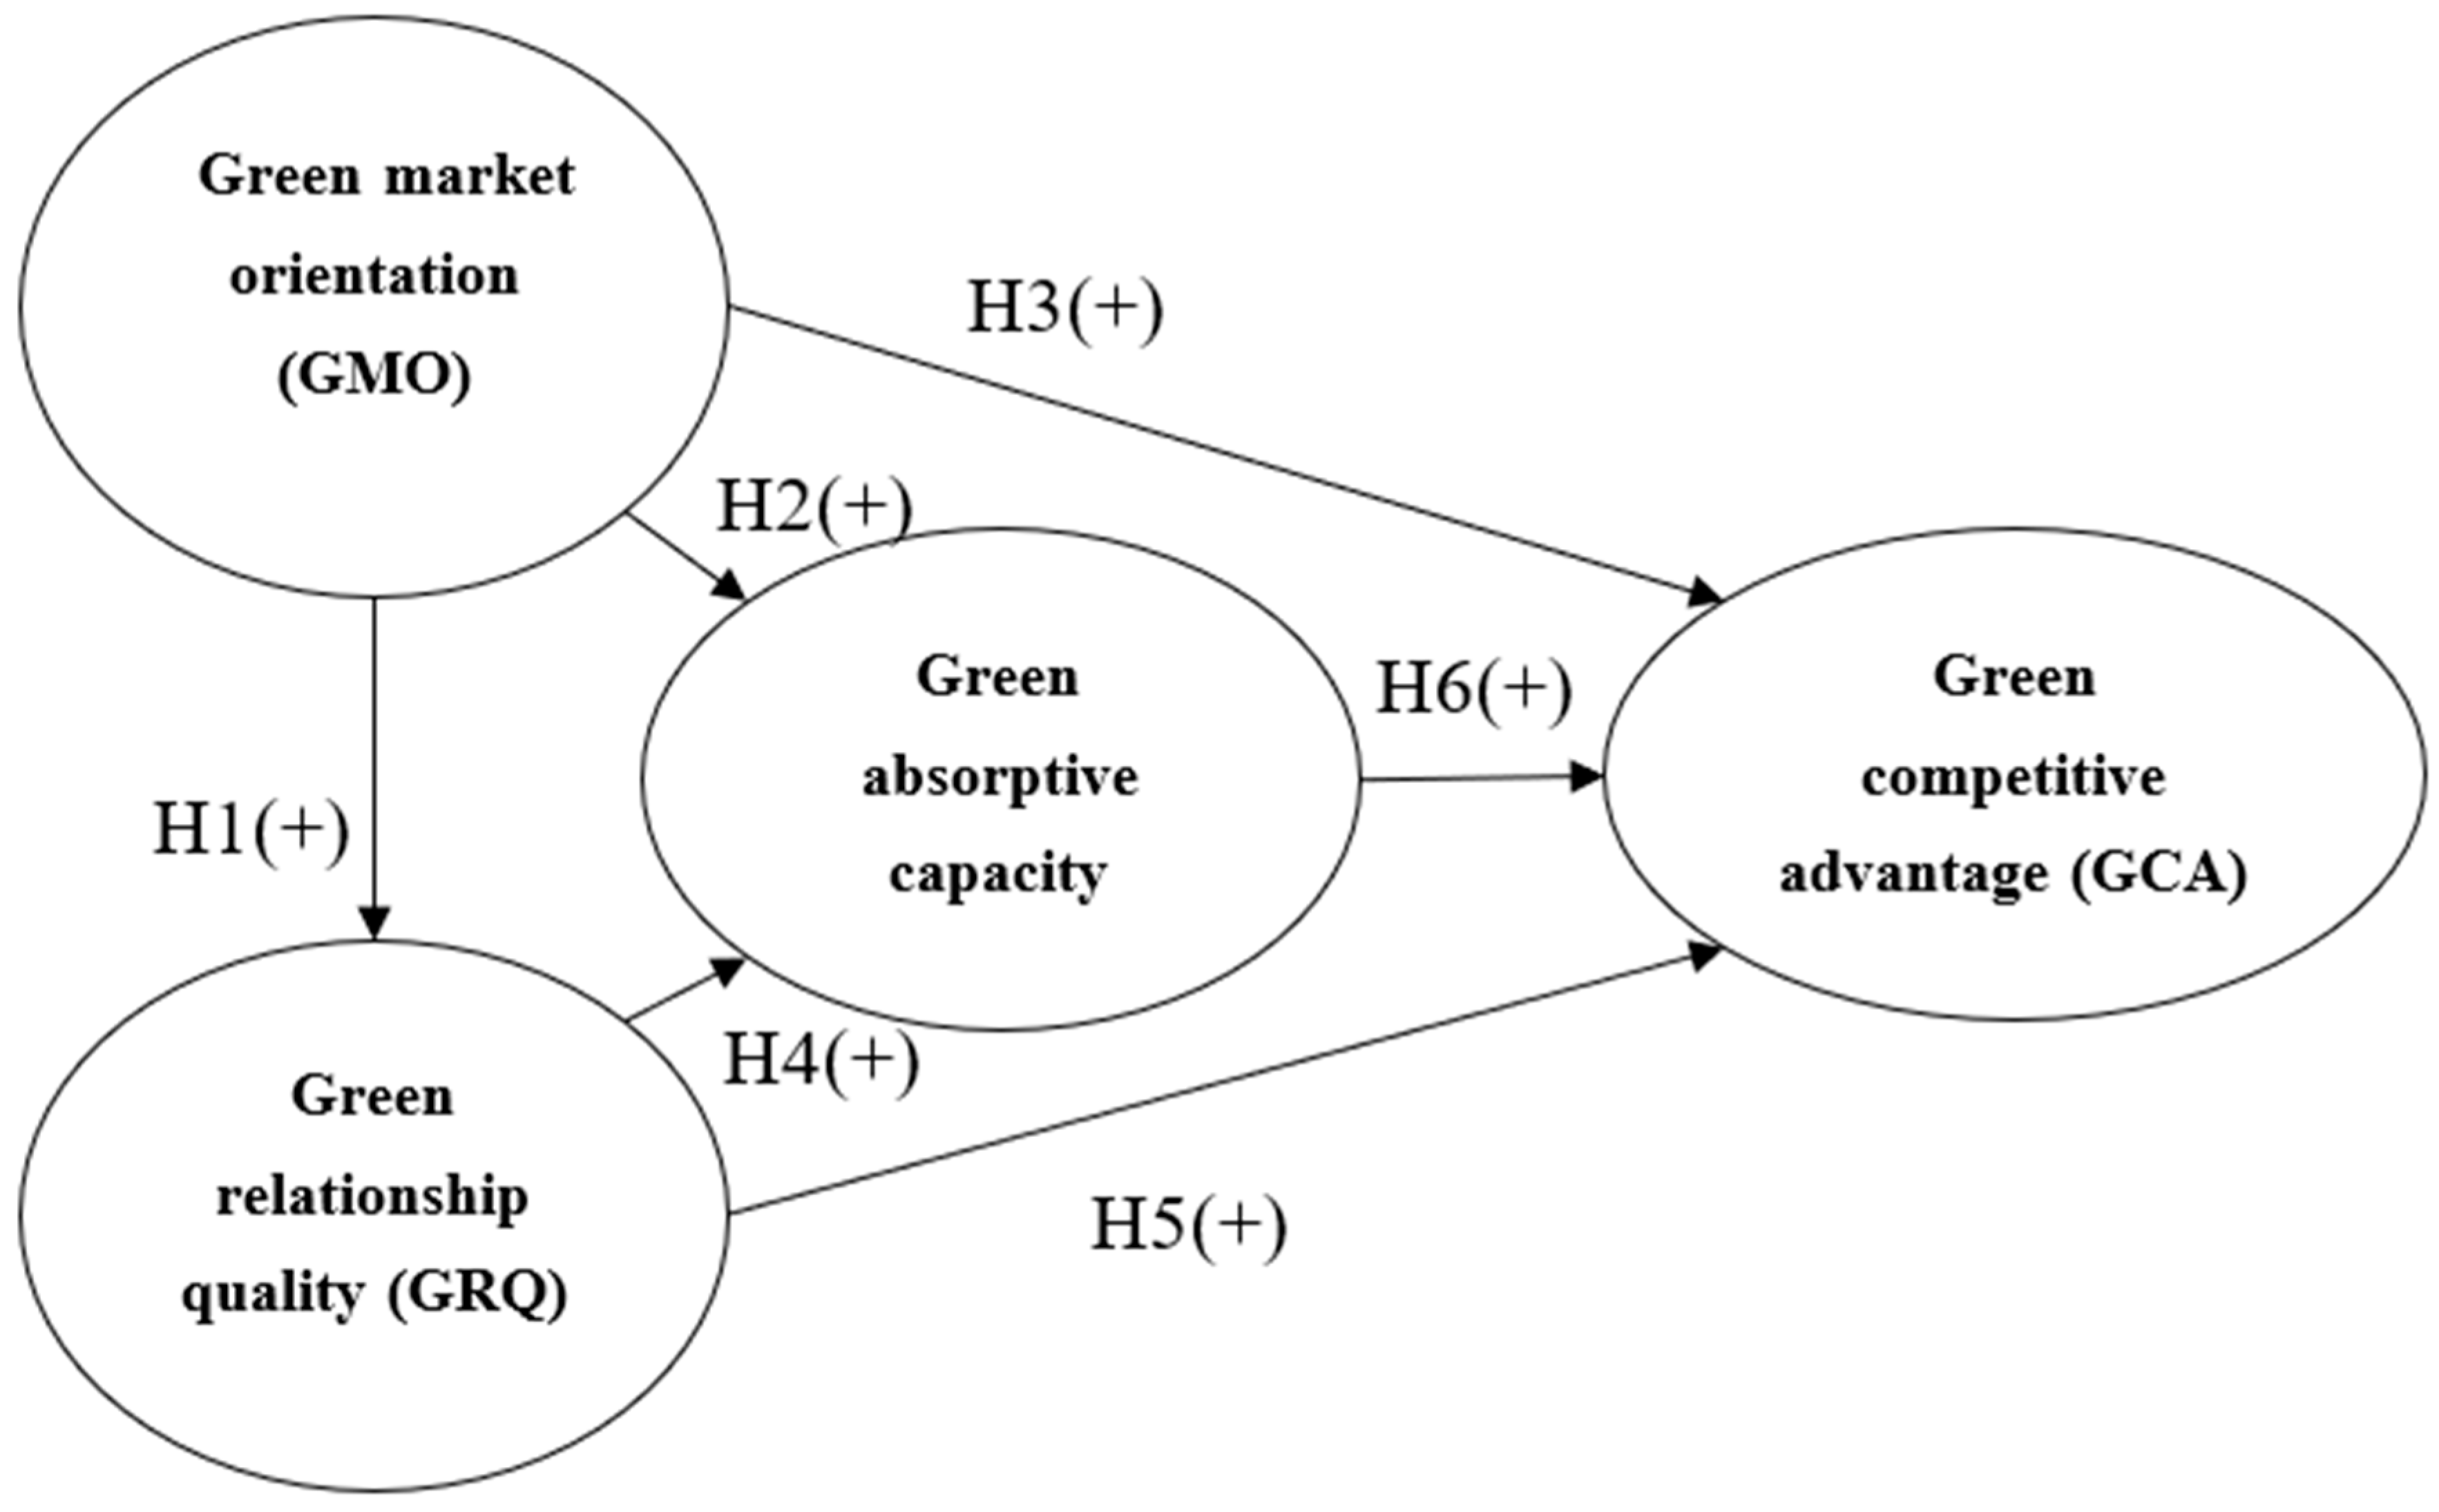
2.1. The Effect of Green Market Orientation (GMO) on Green SC Relationship Quality (GRQ)

GRQ comprises of trust and commitment [7,16,17,18,19]. We borrow Smith’s [7] definition and use GRQ to evaluate the relationship between the employees and the supplier representatives and examine the extent to which this helps meet the green needs/expectations. Zachariah et al. [25] found that collaboration between partners led to improved relationships. Employees maintaining a good relationship with their supplier representatives are expected to add value to the firm’s products and services. As green market orientation involves working collaboratively with customers, we posit that employees will work with supply chain partners with similar competitive and environmental priorities and that this will improve the relationship quality between the partners.
Li et al. [26] advocated that a green market orientation indicates that a firm steadily searches for and improves products, services, and environmental competencies to reach superior performance. In this regard, green market orientation (GMO), involving environmentally friendly processes and activities, requires employees to take responsibility to enhance customer relationships and values. Green market-oriented firms will emphasize achieving superior GRQ as it is a critical component in earning strategic green reputation in the industry. Thus, we posit that GMO often creates activities to support business partners in its green initiatives to achieve improved customer satisfaction and that it also improves the relationship between the supply chain partners. We thus hypothesized the following:
Hypothesis 1 (H1).
Green market orientation (GMO) positively influences green supply chain relationship quality (GRQ).

2.2. The Impact of Green Market Orientation (GMO) on Green Absorptive Capacity (GAC)

The meaning of absorptive capacity was first defined by Cohen and Levinthal [24] and further explored by Zahra and George [27] and by Daghfous [28]. Cohen and Levinthal [26] (p. 128) defined absorptive capacity as “the ability of a firm to recognize the value of new information, assimilate that information, and apply it to commercial ends.” Furthermore, Zahra and George [27], and Daghfous [28] maintain that the process and routines of knowledge transformation, assimilation, acquisition, and exploitation are key to an enterprise's absorptive capacity [27,29]. To survive and succeed, firms need to recognize new external knowledge and to apply it. Acquisition of this new knowledge can be implemented in every firm’s daily routines and processes [30]. This study borrows Chen et al.’s [6] (p. 7895) perspective of green absorptive capacity, namely “the ability to understand, communicate, combine, recognize, and commercialize environmental knowledge”. It encapsulates learning and application of knowledge and must be developed via the systematic knowledge processes of organizations to successfully create and maintain a green firm’s competitive advantage.
As GMO comprises of processes and activities that acquire environmental-oriented knowledge, we argue that employees with clear and definite green market orientation can more easily and effectively obtain and exploit green knowledge of the supply chain partners. Therefore, this study postulates that green market orientation will positively influence green absorptive capacity. Thus, we hypothesized the following:
Hypothesis 2 (H2).
Green market orientation (GMO) positively influences green absorptive capacity (GAC).

2.3. The Effect of Green Market Orientation (GMO) on Green Competitive Advantage (GCA)

Market orientation assumes that values and principles placed by the customer on environmental issues should be every employee’s responsibility within an organization. A green market orientation firm can manage and reconfigure information/knowledge to detect opportunities and to understand customer needs with the help of its employees. Narver and Slater [8] found that market orientation had a significant relationship with firm performance.
Li et al. [31] applied Liu et al.’s [32] market orientation (3 items) and assessed their effects on performance. They found that green market orientation improved business performance [31]. Kumar et al. [33] pointed out that early adoption of MO leads to a unique competitive advantage. Zhou et al. [34] examined the impact of both dimensions of market orientation, which consists of customer orientation and competitor orientation. They found that customer-oriented firms had a significant competitive advantage in areas of innovation and market differentiation in the global hotel industry [34].
Our study uses Chen et al.’s [6] (p. 7791) definition of GCA known as “the ability to obtain, integrate, alter, and exploit environmental knowledge.” Following Kumar et al. [33], we argue that firms with a culture of green market orientation can implement more environmentally friendly processes and activities, thereby increasing their capabilities in retaining key customers and obtaining higher profits. Lin and Ho [35] pointed out that it is imperative that small and medium-sized businesses develop green assets and environmental commitments to improve their GCA. We argue that, if a firm has an environmentally conscientious culture and employees are proactive about delivering environmentally friendly products to customers’ satisfaction, then it will provide them an added competitive advantage [36]. Thus, we hypothesized the following:
Hypothesis 3 (H3).
Green market orientation (GMO) positively influences green competitive advantage (GCA).

2.4. The Effect of Green Supply Chain Relationship Quality (GRQ) on Green Absorptive Capacity (GAC)

Transaction cost theory suggests that a firm's motivation for building relationships with each other is to access value added resources and to decrease the transaction costs associated with environmental and behavioral uncertainty [37,38,39]. Good supply chain relationships can reduce transaction costs [40] and can optimize firm performance [21,39]. Naudé and Buttle [20] stated that supply chain relationship quality is a higher-order construct which collectively incorporates trust, adaptation, communication, and cooperation behavior. Fynes et al. [24,41], based on social exchange theory, examined the effect of supply chain relationship quality on manufacturing performance. They defined supply chain relationship quality as “the degree to which both parties engaged in an active, long-term working relationship” [22] (p. 59) [42] (p. 341), and they operationalized this construct using scale items that measure adaptation, communication, cooperation, and trust.
Several studies have concentrated on the relationship quality between upstream and downstream SC members [43,44]. If the supplier delivers reliable products at the right time, it will improve the quality of the relationship. Similarly, Su et al. [45] defined supply chain relationship quality as a business relationship involving interactions between business partners in long-term exchange relationships inlaid within industrial networks. Lee [46] defined green SC relationship quality as trust, adaptation, communication, and cooperation between members in a green supply chain.
Crosby et al. [16] (p. 70) deemed that “trust is a confident belief that a salesperson can be relied upon to behave in a fair and just manner. With this confident belief of trust, the long-term interest of the customer will be served”. Thus, developing a confident feeling and ensuring that business partners meet the requirements are critical to business success. Positive relationship quality perceptions will assist in attaining transaction success.
With the upward trend in expenditures on green services and products over the past decades, relationship quality plays a crucial role as they develop, refine, and transform green knowledge into green competitive advantage. Green relationship quality comprising of trust and commitment will facilitate transfer of environmental knowledge between the firm’s employees and its supplier representatives as you want all channel partners to succeed in the environmental collaboration.
Morgan and Hunt [10] claimed that relationship quality is made of two elements: commitment and trust. Smith [7] expanded it to a nine-item scale for measuring supply chain relationship quality. Improved relationships enable efficient knowledge transfer. This study postulates that improved green supply chain relationship quality shared between a company’s employees and its’ supplier representatives will help to create and maintain green absorptive capacity. Thus, the next hypothesis follows:
Hypothesis 4 (H4).
Supply chain relationship quality (GRQ) positively influences green absorptive capacity (GAC).

2.5. The Effect of Green Supply Chain Relationship Quality (GRQ) on Green Competitive Advantage (GCA)

Supplier relationship management consists of managing and planning interactions with third-party vendors that supply materials and services. Supply chain members need to cultivate their relationship quality prudently and constructively to achieve competitive advantage. For example, Kraft Foods used “relationship segmentation analysis” to determine the best supplier relationship type [47]. Hughes [48] provided ten points to manage supplier relationship, which ranges from communicating, listening, and managing responses to suppliers to maintaining a good quality relationship with the supplier. Barney and Hansen [49] advocated that trust is a key precursor to achieving competitive advantage. Fynes et al. [42] discovered a positive relationship between supply chain relationship quality and design quality of electronic products in the manufacturing industry in Ireland. They postulated that supply chain relationship quality was a multidimensional construct represented by trust, commitment, cooperation, communication, adaptation, and interdependence [42]. Kulangara et al. [50] found that trust shared between buyer and a supplier improved a firm’s innovative capability, which is considered a competitive advantage. Employees that share good green SC relationship quality based on trust and commitment can effectively leverage their relationships with their suppliers to meet green requirements and, thus, to enhance their competitive capability. Therefore, the fifth hypothesis follows:
Hypothesis 5 (H5).
Green supply chain relationship quality (GRQ) positively influences green competitive advantage (GCA).

2.6. The Effect of Green Absorptive Capacity (GAC) on Green Competitive Advantage (GCA)

Zacharia et al. [51] found that there is a positive relationship between absorptive capacity and collaborative process competence, which led to positive relational and operational outcomes. Absorptive capacity is one ability that businesses can pursue to gain competitive advantage and to enhance their position in the market [27]. Knowledge acquisition and assimilation may be key to business success and can be applied to green supply chain collaborations.
GAC encourages firms to seek suppliers who make environmentally friendly routines and processes an important priority and to derive profit [52]. Chen and Chang [53] pointed out that the growing environmentalism has inspired environmentally conscientious managers to implement eco-friendly routines and processes to attain green competitive advantage. Green absorptive capacity (GAC) involving acquisition and application of environmental knowledge amongst firm’s employees is expected to improve a firm’s green competitive edge. Hence, we propose the final hypothesis:
Hypothesis 6 (H6).
Green absorptive capacity (GAC) positively influences green competitive advantage (GCA).

3. Results

The framework of this research is shown in Figure 1. Figure 1 lists positive correlations among green market orientation (GMO), green supply chain relationship quality (GRQ), green absorptive capacity (GAC), and green competitive advantage (GCA). We examine the proposed hypotheses through Structural Equation Modeling (SEM). All surveys were collected on a seven-point Likert scale ranging from 1 (strongly disagree) to 7 (strongly agree).

3.1. Measurement Scales

To measure green market orientation (GMO), we make use of Deshpandé and Farley’s [6] questionnaire to develop a ten-item scale to measure market orientation. For green supply chain relationship quality (GRQ), we borrow Smith’s [4] questions and modify them to nine items. In terms of green absorptive capacity (GAC), we use pre-developed scales from Chen et al. [6]. Finally, Green competitive advantage (GCA) is measured by adapting questions in Chen and Chang [53]. The construct and indicators (variables) are summarized in the Appendix A.

3.2. Data Collection and the Sample

This study employed two pretests to the questionnaire by asking various questions on GMO and GRQ to ensure content validity. First, we pretested the questionnaire through interviews with 10 part-time Master of Business Administration students with a minimum of three years of business experience. Feedback was sought about the format of the questionnaire and whether any questions were ambiguous or incomprehensible to them. Moreover, the questionnaire was sent to 20 full-time employees with at least three years of business experience.
This mailing list consisted of companies belonging to the Taiwan e-commerce yearbook. Taiwan’s e-commerce companies have enough resources to steadily invest in eco-friendly activities and to continue to increase their service capacity. Eco-protection and being environmentally friendly can yield huge opportunities for e-commerce firms and can provide competitive advantage. The respondents used in this study are employees who work in either manufacturing and wholesale companies and who conduct business with each other using B2B e-commerce in Taiwan. The respondents of the different constructs in this study are different to avoid common method variance (CMV) [54,55]. We promised anonymity, promised confidentiality, and requested honesty to the respondents to decrease social desirability bias [53]. Therefore, the respondents of green market orientation (GMO) and green relationship quality (GRQ) are operations managers; those of green absorptive capacity (GAC) and green competitive advantage (GCA) are managers of R&D departments (see Table 1). Questionnaires were sent to a total of 1280 employees in the following industries: wholesale trade, except for motor vehicles and motorcycles; motor vehicles, trailers, and semi-trailers; machinery and equipment; electrical equipment; computer, electronic, and optical products; and pharmaceutical, etc.
All survey items were collected in Chinese and then translated back in English. We conducted surveys in North, Central, and South Taiwan. The research assistants mailed surveys and asked the respondents to return the completed surveys within two weeks. The research assistants called each company, reminding them of the questionnaire to ensure an acceptable response rate. We also had a designated officer in each firm who made sure that responses were not duplicated and who collected two signatures per survey. The sampled companies were green supply chain focused. We told the respondents that the survey was green supply chain focused. We used key informant analysis. Informants are selected based on the knowledge of company’s supply chain functions [56]. R&D managers were more qualified to answer questions related to green absorptive capacity and green competitive advantage, while operations employees were more informed about green market orientation and green relationship quality. This was a green supply chain because the suppliers and manufacturers offered green products and services.
Fifty percent (640) of the questionnaires were sent to Operation Management employees, and the remaining 50% were sent to Research and Development (640) employees. Thus, a total of 1280 surveys were sent out. That led to a response rate of 43.75% (560 cases/1280 cases) answered by 560 pairs of OM and RD within the same company (total of 1120 persons). There were 1120 respondents and 560 matched pairs. OMs answered the survey on green market orientation and relationship quality, signed the document, and then sent it to the R&D employee who answered the survey on green absorptive capacity and green competitive advantage or vice versa. Therefore, one entire survey/case was filled by a pair of OM and R&D respondent (2 individuals). Whoever (OM or R&D) finished the survey first signed on the first column, and the matched pair signed on the second column. Therefore, each completed survey returned had 2 signatures (one signature from OM and one signature from R&D) (see Table 1 for more details). We used stratified sampling to reduce the overall variance of estimates. The variance in actual respondents with various levels of responsibility, education, and remuneration does not influence the final results [57].
Table 2 and Table 3 present the results of this study compared with those reported in the literature. Therefore, the concepts in this study are unique and do not overlap past studies. The majority of the model lists in Table 1 use green market orientation, supply chain relationship quality, and absorptive capacity as decision variables. This study associates appropriate variables to critical green competitive advantage to manage all measurements needed for green competitive advantage.

4. Discussion

This study used AMOS and LISREL 8.7 to test the hypothesized links and proposed research framework. Structural equation modelling (SEM) was used to examine both the measurement and the structural model for construct validity and significance of paths. The result of the squared multiple correlations revealed that most items met the threshold of 0.30 [59]. A split sample analysis was conducted where the 560 cases were split into half: 280 cases were used for the Exploratory Factor Analysis (EFA) in SPSS, and the remaining 280 cases were used for Confirmatory Factor Analysis (CFA) in LISREL. One item measuring green market orientation was dropped as the factor loading was 0.162, which was below the acceptable threshold value. The exploratory factor analysis suggested a uni-factor solution in each of the four constructs. The one-factor solutions cumulatively explained more than 60% of the variance, reducing concerns of common method bias. Finally, we conducted a CFA in the second half sample using LISREL based on the results from the EFA.

4.1. The Measurement Model

Table 4 lists the means, standard deviations, and correlation for all variables. Table 5 gives the factor analysis results. In the study, each construct can be classified into only one factor. We designed the questionnaire (items) and assessed the factor structure in accordance with the literature. Hence, we conducted reliability testing to ensure the measure of confidence. First, we measured the reliability by testing the loadings of every item of each construct. Table 6 displays the factor loadings on every item under each construct. Then, Cronbach’s α was computed to assess reliability. The resulting α coefficient of reliability of GMO was 0.943, of GRQ was 0.935, of GAC was 0.893, and of GCA was 0.949. Since, the Cronbach’s α coefficients for all four constructs exceeded 0.7 [60], the measurement of this study is acceptable in reliability.
For discriminant validity, the square root of the average variance extracted (AVE) of each construct must overtake the correlations between each model construct and others. We list the results in Table 4 which demonstrated that the constructs exhibited distinct psychometric properties and discriminant validity [60]. Discriminant validity is estimated by testing the square root AVE of each construct; GMO, GRQ, GSC, and GCA were larger than the squared intercorrelations among the scales. To establish construct reliability and validity, AVE should exceed 0.5 for each of the constructs and construct reliability should exceed 0.7 for all model constructs [61]. Table 7 lists the factor loadings, AVE, and construct reliability, and the analyses suggested that the AVEs of the four constructs were 0.60, 0.61, 0.58, and 0.65, respectively, which are all greater than 0.5 Consequently, the construct has acceptable convergent validity. The validity of the measurement model was estimated for convergent and discriminant validity; see Table 6. The results demonstrated acceptable reliability and validity.

4.2. Measurement Model Results

The model fit for the proposed structural model can be summarized as follows: Goodness of Fit Index (GFI) = 0.84, Root Mean Square Error of Approximation (RMSEA) = 0.057, Normed Fit Index (NFI) = 0.87, and Comparative Fit Index (CFI) = 0.95. According to these criteria, we found the model has satisfactory goodness of fit, as shown in Table 7.
In the measurement model and structural model test, the chi-square difference test is Chi-square = 147.83(3) > Chi-square = 11.34 at the 0.01 level of significance. Therefore, we proceeded with testing the hypothesized paths in the structural model. From path analysis, green market orientation (GMO) influenced green supply chain relationship quality (t = 14.53), thus supporting H1. GMO did not have a positive direct effect on green absorptive capacity (GAC) and green competitive advantage (GCA); thus, H2 and H3 are not fully supported. However, GMO had a significant total effect on GAC when intervened by green supply chain relationship quality (GRQ) (t = 13.62). Meanwhile, GRQ positively influenced GAC (t = 8.45) and GCA (t = 4.4), thus supporting H4 and H5. H6, which tested the relationship between GAC and GCA, also was not supported (see Table 8 for full results). GMO, GRQ, GAC, and GCA are positively correlated. GAC does not positively affect GCA. Therefore, this study hypothesizes that GCA positively affects GAC. We reran the model to clarify whether competing models are better than our model. As for hypothesis testing, it produces parameter estimates and goodness-of-fit indices which can be used for testing of assumptions, theory verification, or even comparison of competing models. We built a LISREL model to test our hypotheses, and then discussed the findings. This model exhibits unsatisfactory goodness-of-fit (see Table 9, Table 10 and Table 11). The overall fit measures of this study are as follows: χ2 = 1730.07, p < 0.05, GFI = 0.71, RMSEA = 0.1, NFI = 0.81, CFI = 0.84, Standardized Root Mean Square Residual (SRMR) = 0.13, Non-Normed Fit Index (NNFI) = 0.83, Parsimonious Normed Fit Index (PNFI) = 0.74, Hoelter's Critical N (CN) = 75.31, and χ2/df = 4.02. In the competing model, we find that GCA positively affects GAC. However, the performance of such a competing model is poor. Our model has good convergent and discriminate validity. Moreover, the satisfactory goodness-of-fit of our model indicates adequate reliability and validity. Eventually, we accept our model instead of the competing model.

5. Conclusions

This study aims to figure out the effects of green market orientation (GMO), green supply chain relationship quality (GRQ), and green absorptive capacity (GAC) on green competitive advantage (GCA) in supply chain. Analysis of these published empirical studies demonstrate that, firstly, green market orientation positively influences green relationship quality. However, green market orientation did not have a significant direct effect on green competitive advantage (GCA). This is in partial agreement with a previous study where market orientation provided a differentiation advantage but not an institutional advantage in the emerging Chinese economy [60]. Secondly, relationship quality positively influences green absorptive capacity (GAC) and green competitive advantage (GCA). Cooperation between employees and supplier representatives in terms of trust and commitment can help achieve green competitive advantage. Suppliers are critical to the competitive success of firms [62].
The key contribution is that green market orientation, i.e., culture within the organization itself and its emphasis on being environmentally responsible, is a key antecedent to GRQ, GAC, and GCA. The paper certainly highlights the fact that being environmentally conscientious involves influence of other critical components like the quality of relationship shared between supply chain partners. Gosling et al. (2017) [63] noted the importance of supply chain in the learning of sustainable practice but failed to test the importance of green supply chain relationship quality. If the relationship is good, it will help the supply chain partners to share environmental knowledge with each other without fear of opportunism.
The main strengths of this study are as follows. First, this study proposes and creates an integral model for green SC management with e-commerce data, providing critical strategies to enhance GCA. Even though past studies have looked at the effects of market orientation on relational capabilities and business performance [8,64,65], this study adds to the existing scholarly literature by examining the joint interrelationships between various constructs in a green supply chain context. Second, this study proposes and tests antecedents and outcome constructs as well as strategies for improving firms’ strategic decisions and green business research frameworks. Third, the contribution of GRQ to GCA is shown. The results suggest that quality of relationship is key to achieving GCA. GMO did not have a significant direct impact on GAC and GCA. This finding agrees with past studies in a non-green context [65,66,67,68]. However, GMO had a significant indirect effect (t = 5.69) and total effect (t = 10.81) on GCA. Kumar et al. (2011) [33] pointed out that early adoption of MO leads to unique CA. However, there is no literature evidence to support the positive effect between GMO and GCA. Chen et al. [69] pointed out that AC positively affects CA. However, there is no literature evidence to support the positive effect between GAC and GCA. That might be the reason why H2 and H6 are not fully supported. H2 was supported when GMO meditated by GRQ. GMO had a significant total effect on GAC. Since the results do not support H3, this study uses Process Macro 2.15 to test the mediation effect between GMO and GCA. The result shows that GRQ and GAC completely mediate the relationship between GMO and GCA, and the effect sizes are 0.11 and 0.20, respectively.
Even though GMO did not have a significant direct relationship with GAC, we observed that GMO had a significant indirect effect on green absorptive capacity (t = 8.14) and total effect on green absorptive capacity (t = 13.62). These results suggest that, when mediated by trust and commitment (GRQ), green market orientation positively impacts green absorptive capacity. The findings make logical sense as green market-oriented employees could be more agreeable to share new environmental knowledge when they have a trusting and committed relationship with each other.
We completely understand that sustainability, also known as the trip bottom line, advocates the profit, planet, and people aspect of a business. We have come to the same conclusion that supply chain is a constituent element of the economic systems in the sustainability framework [70]. This study is primarily focused on the environmental aspect of sustainability, and therefore, the term “green” is used more frequently in the paper. All constructs and scales aim to capture the green aspect of manufacturers and wholesalers. Regulations regarding environmental protection and green business solutions are vital to help companies meet global market requirements. There are three practical contributions from this investigation. First, companies wishing to improve their green competitive advantage should incorporate both green market orientation and improved relationship with key partners as their long-term strategies. This implies that companies will have to restructure their organizational culture to be more environmentally oriented. Another long-term strategy would be to have strong committed relationships with their suppliers who also value green supply chain practices. Second, this study contributes to practical managerial theories to cultivate green businesses in e-commerce. Third, developing green market orientation (GMO) and meaningful green relationship quality empowers firms to move to the next level of acquiring environmental knowledge from their key customers, to understand customer expectations, and to apply this knowledge to the existing processes in partnership with their supplier. The GMO model makes contributions to the environmental management literature by showing that green market orientation cannot achieve green competitive advantage alone; it is heavily dependent on combined effects of GRQ and GAC to achieve GCA. This shows that GRQ is a key indicator of GAC. GRQ enables firms to make breakthroughs by enhancing GAC and by eventually improving their GCA in creating environmentally friendly products.
The results shown in Table 8 indicate that green market orientation is important in obtaining the future of a firm to manufacture environmental products or services from a long-term perspective. Firms must select key green suppliers with a long-term perspective in mind to create and develop GRQ and GAC to enhance their GCA. For example, Herman Miller was one of the few companies in the furniture industry in the US that implemented green SC practices by switching from polyvinyl chloride material to environmentally friendly Thermoplastic polyurethanes material to manufacture arm pads for their chairs.
We believe this is a value-added contribution to the ongoing research of environmental management as this sheds light on the role of absorptive capacity to share green knowledge and quality of relationship as an antecedent to this sharing of environmental knowledge. Finally, future studies should focus on the antecedents and long-term consequences of green SC relationship quality. The results of this study suggest that green supply chain management enhances production efficiency, eventually facilitating the growth of e-commerce by attracting more environmentally friendly customers. Since the 1970s, numerous environmental laws and regulations have been enacted that have led to a push in eco-design of products. However, the e-commerce industry still lacks scientific systematic data for robust analysis of evaluating what works and what does not. The need for green market orientation remains given that most customers are moving towards online shopping, i.e., a shift to e-commerce. Finally, future studies should focus on the antecedents and long-term consequences of green supply chain relationship quality. Regarding antecedents, future research should examine exactly how green supply chain relationship quality dimensions are evoked by green market orientation.
The current study estimating green supply chain offers numerous possibilities with a view to developing future lines of research. The cross-sectional approach limits the ability to draw causal inferences about the findings. Longitudinal designs are needed to confirm our findings. Moreover, improved ways of sampling are needed to eliminate the problem of small sample size. Designs that involve ten firms can result in having small numbers in some cells, which limits the statistical power.

Author Contributions

Conceptualization, Y.-H.L. and J.S.; methodology, Y.-H.L.; software, Y.-H.L. and N.K.; validation, Y.-H.L. and N.K.; formal analysis, Y.-H.L. and N.K.; investigation, Y.-H.L.; writing—original draft preparation, Y.-H.L.; writing—review and editing, K.F. and N.K.; supervision, J.S.; project administration, J.S. All authors have read and agreed to the published version of the manuscript.

Funding

This research received no external funding.

Conflicts of Interest

The authors declare no conflict of interest.

Appendix A

Table A1. The items of the scales.
ConstructsItems
Green Market Orientation(1) Our business objectives are driven primarily by customer satisfaction.
(2) We constantly monitor our level of commitment and orientation to serving customer needs.
(3) We freely communicate information about our successful and unsuccessful customer.
(4) Our strategy for competitive advantage is based on our understanding of customers’ needs.
(5) We measure customer satisfaction systematically and frequently.
(6) We have routine or regular measures of customer service.
(7) We are more customer focused than our competitors.
(8) I believe this business exists primarily to serve customers.
(9) We poll end user’s at least once a year to assess the quality of our products and services.
(10) Data on customer satisfaction are disseminated at all levels in this business unit on a regular basis.
Green Supply Chain Relationship Quality(1) I can count on this representative to follow through on commitments.
(2) I respect this representative’s judgment.
(3) I think s/he would try to take advantage of our relationship.
(4) This is among the best supplier relationships that I’ve experienced.
(5) I have not been happy with this relationship.
(6) I believe we are both committed to this relationship.
(7) I have a strong sense of loyalty to this supplier.
(8) This representative is prepared to make short-term sacrifices to maintain our relationship.
(9) I believe we both view our relationship as a long-term partnership.
Green Absorptive Capacity(1) The organizational structure of the company has the ability to understand, analyze, and interpret information from external environmental knowledge.
(2) The company can communicate environmental knowledge across its units.
(3) The company has the ability to combine existing environmental knowledge with newly acquired and assimilated environmental knowledge.
(4) The company has the ability to recognize, value, and acquire external environmental knowledge that is critical to its operations.
(5) The company has the ability to successfully commercialize new external environmental knowledge.
Green Competitive Advantage(1) The company has the competitive advantage of low cost about environmental management or green innovation compared to its major competitors.
(2) The quality of the green products or services that the company offers is better than that of its major competitors.
(3) The company is more capable of environmental R&D and green innovation than its major competitors.
(4) The company is more capable of environmental management than its major competitors.
(5) The company’s environmental profitability is better.
(6) The growth of the company about green products or services exceeds that of its major competitors.
(7) The major competitors of the company cannot imitate its green products or services easily.
(8) The major competitors of the company cannot replace its distinctive position about environmental management or green innovation easily.

References

  1. Wu, K.J.; Tseng, M.L.; Vy, T. Evaluation the drivers of green supply chain management practices in uncertainty. Procedia Soc. Behav. Sci. 2011, 25, 384–397. [Google Scholar] [CrossRef] [Green Version]
  2. Adams, W.M. Green Development: Environment and Sustainability in the Third World; Routledge: London, UK, 2003. [Google Scholar]
  3. Hoejmose, S.; Brammer, S.; Millington, A. “Green” supply chain management: The role of trust and top management in B2B and B2C markets. Ind. Mark. Manag. 2012, 41, 609–620. [Google Scholar] [CrossRef]
  4. Li, S.; Ragu-Nathan, B.; Ragu-Nathan, T.S.; Rao, S.S. The impact of supply chain management practices on competitive advantage and organizational performance. Omega 2006, 34, 107–124. [Google Scholar] [CrossRef]
  5. Deshpandé, R.; Farley, J.U. Measuring Market Orientation: Generalization and Synthesis. J. Mark. Focus. Manag. 1998, 2, 213–232. [Google Scholar]
  6. Chen, Y.S.; Chang, C.H.; Lin, Y.H. The determinants of green radical and incremental innovation performance: Green shared vision, green absorptive capacity, and green organizational ambidexterity. Sustainability 2014, 6, 7787–7806. [Google Scholar] [CrossRef] [Green Version]
  7. Smith, J.B. Relationship quality in services selling: An Interpersonal Influence perspective. Psychol. Mark. 1998, 15, 3–21. Available online: https://0-onlinelibrary-wiley-com.brum.beds.ac.uk/doi/abs/10.1002/%28SICI%291520-6793%28199801%2915%3A1%3C3%3A%3AAID-MAR2%3E3.0.CO%3B2-I (accessed on 1 September 2020).
  8. Narver, J.C.; Slater, S.F. The effect of a market orientation on business profitability. J. Mark. 1990, 54, 20–35. [Google Scholar] [CrossRef]
  9. Blau, P.M. Exchange and Power in Social Life; Wiley: New York, NY, USA, 1964; p. 352. [Google Scholar]
  10. Morgan, R.M.; Hunt, S.D. The Commitment-Trust Theory of Relationship Marketing. J. Mark. 1994, 58, 20–38. [Google Scholar] [CrossRef]
  11. Shapiro, B.P. What the Hell Is ‘Market Orientation’? Harv. Bus. Rev. 1988, 66, 119–125. [Google Scholar]
  12. Jaworski, B.J.; Kohli, A.K. Market Orientation: Antecedents and Consequences. J. Mark. 1993, 54, 1–18. [Google Scholar]
  13. Deshpandé, R.; Farley, J.U.; Webster, F.E., Jr. Corporate Culture, Customer Orientation, and Innovativeness in Japanese Firms: A Quadrad Analysis. J. Mark. 1993, 57, 23–37. [Google Scholar] [CrossRef] [Green Version]
  14. Chen, Y.; Tang, G.; Jin, J. Linking market orientation and environmental performance: The influence of environmental strategy, employee's environmental involvement, and environmental product quality. J. Bus. Ethics 2015, 127, 479–500. [Google Scholar] [CrossRef]
  15. Deshpandé, R.; Farley, J.U. Understanding Market Orientation: A Prospectively Designed Meta-Analysis of Three Market Orientation Scales. In Developing A Market Orientation; Deshpandé, R., Ed.; Sage Publications: Thousand Oaks, CA, USA, 1999. [Google Scholar]
  16. Crosby, L.A.; Evans, K.R.; Cowles, D. Relationship quality in services selling: An Interpersonal Influence perspective. J. Mark. 1990, 54, 68–81. [Google Scholar] [CrossRef]
  17. Dwyer, F.R.; Oh, S. Output sector munificence effects on the internal political economy of marketing channels. J. Mark. 1987, 24, 347–358. [Google Scholar] [CrossRef]
  18. Kumar, N.; Scheer, L.K.; Steenkamp, J.B.E. The effects of supplier fairness on vulnerable resellers. J. Mark. Res. 1995, 32, 54–65. [Google Scholar] [CrossRef]
  19. Naudé, P.; Buttle, F. Assessing relationship quality. Ind. Mark. Manag. 2000, 29, 351–361. [Google Scholar] [CrossRef]
  20. Moorman, C.; Zaltman, G.; Deshpande, R. Relationships between providers and users of market research: The dynamics of trust within and between organizations. J. Mark. Res. 1992, 29, 314. [Google Scholar] [CrossRef]
  21. Farrelly, F.; Quester, P. The effects of market orientation on trust and commitment: The case of the sponsorship business-to-business relationship. Eur. J. Mark. 2003, 37, 530–553. [Google Scholar] [CrossRef]
  22. Katz, R.L. The Skills of an Effective Administrator. Harv. Bus. Rev. 1974, 9–10, 90–102. [Google Scholar]
  23. Katz, D.; Kahn, R. The Social Psychology of Organizations; Wiley: New York, NY, USA, 1978. [Google Scholar]
  24. Fynes, B.; de Búrca, S.; Mangan, J. The effect of relationship characteristics on relationship quality and performance. Int. J. Prod. Econ. 2008, 111, 56–69. [Google Scholar] [CrossRef]
  25. Zacharia, Z.G.; Nix, N.W.; Lusch, R.F. An analysis of supply chain collaborations and their effect on performance outcomes. J. Bus. Logist. 2009, 30, 101–123. [Google Scholar] [CrossRef]
  26. Cohen, W.M.; Levinthal, D.A. Absorptive capacity: A new perspective on learning and innovation. Adm. Sci. Q. 1990, 35, 128–152. [Google Scholar] [CrossRef]
  27. Zahra, S.A.; George, G. Absorptive capacity: A review, reconceptualisation and extension. Acad. Manag. Rev. 2002, 27, 185–203. [Google Scholar] [CrossRef] [Green Version]
  28. Daghfous, A. Absorptive capacity and the implementation of knowledge-intensive best practices. SAM Adv. Manag. J. 2004, 69, 21–27. [Google Scholar]
  29. Camisón, C.; Forés, B. Knowledge absorptive capacity: New insights for its conceptualization and measurement. J. Bus. Res. 2010, 63, 707–715. [Google Scholar] [CrossRef]
  30. Lane, P.J.; Lubatkin, M. Relative absorptive capacity and interorganizational learning. Strateg. Manag. J. 1998, 19, 461–477. [Google Scholar] [CrossRef]
  31. Li, Y.; Ye, F.; Sheu, C.; Yang, Q. Linking green market orientation and performance: Antecedents and processes. J. Clean. Prod. 2018, 192, 924–931. [Google Scholar] [CrossRef]
  32. Liu, H.F.; Ke, W.L.; Wei, K.K.; Gu, J.B.; Chen, H.P. The Role of Institutional Pressures and Organizational Culture in the Firm's Intention to Adopt Internet-Enabled Supply Chain Management Systems. J. Oper. Manag. 2010, 28, 372–384. [Google Scholar] [CrossRef]
  33. Kumar, V.; Jones, E.; Venkatesan, R.; Leone, R.P. Is market orientation a source of sustainable competitive advantage or simply the cost of competing? J. Mark. 2011, 75, 16–30. [Google Scholar] [CrossRef]
  34. Zhou, K.Z.; Brown, J.R.; Dev, C.S. Market orientation, competitive advantage, and performance: A demand-based perspective. J. Bus. Res. 2009, 62, 1063–1070. [Google Scholar] [CrossRef] [Green Version]
  35. Lin, C.Y.; Ho, Y.H. The influences of environmental uncertainty on corporate green behavior: An empirical study with small and medium-size enterprises. Soc. Behav. Personal. 2010, 38, 691–696. [Google Scholar] [CrossRef]
  36. Chang, C.-H.; Lin, M.-J.J. The relationships among CSR, proactive environmental consciousness, and green intellectual capital. In Proceedings of the Paper Presented at the Academy of Management (AOM) Annual Meeting, Montreal, QC, Canada, 6–10 August 2010. [Google Scholar]
  37. Williamson, O.E. The Economic Institutions of Capitalism; The Free Press: New York, NY, USA, 1985. [Google Scholar]
  38. Williamson, O.E. Comparative economic organization: The analysis of discrete structural alternatives. Adm. Sci. Q. 1991, 36, 269–296. [Google Scholar] [CrossRef] [Green Version]
  39. Williamson, O.E. Transaction cost economics and organization theory. In The Handbook of Economic Sociology; Smelser, N.J., Swedberg, R., Eds.; Princeton University Press: Princeton, NJ, USA, 1996; pp. 77–107. [Google Scholar]
  40. Dyer, J.H. Effective interfirm collaboration: How firms minimize transaction costs and maximize transaction value. Strateg. Manag. J. 1997, 18, 535–556. [Google Scholar] [CrossRef]
  41. Fynes, B.; Voss, C.; de Búrca, S. The impact of supply chain relationship dynamics on manufacturing performance. Int. J. Oper. Prod. 2005, 25, 6–19. [Google Scholar] [CrossRef]
  42. Fynes, B.; Voss, C.; de Búrca, S. The impact of supply chain relationship quality on quality performance. Int. J. Prod. Econ. 2005, 96, 339–354. [Google Scholar] [CrossRef]
  43. Fabbe-Costes, N.; Jahre, M. Supply chain integration gives better performance—The emperor’s new suit? Int. J. Phys. Distrib. Logist. Manag. 2007, 37, 835–855. [Google Scholar] [CrossRef]
  44. Fish, L.A. Supply Chain Quality Management. In Supply Chain Management—Pathways for Research and Practice; Aktas, D.Ö.a.E., Ed.; Intech: Rijeka, Croatia, 2011. [Google Scholar]
  45. Su, Q.; Song, Y.-T.; Li, Z.; Dang, J.-X. The impact of supply chain relationship quality on cooperative strategy. J. Purch. Supply Manag. 2008, 14, 263–272. [Google Scholar] [CrossRef]
  46. Lee, S.Y. Drivers for the participation of small and medium-sized suppliers in green supply chain initiatives. Supply Chain Manag. J. 2008, 13, 185–198. [Google Scholar] [CrossRef]
  47. Piercy, N.F.; Lane, N. Strategic Customer Management: Strategizing the Sales Organization; Oxford University Press: Oxford, UK, 2009. [Google Scholar]
  48. Hughes, J. Why Your Supplier Relationships Fail to Deliver Their True Value; Vantage Partners: Boston, MA, USA, 2005. [Google Scholar]
  49. Barney, J.B.; Hansen, M.H. Trustworthiness as a source of competitive advantage. Strateg. Manag. J. 1994, 15, 175–190. [Google Scholar] [CrossRef]
  50. Kulangara, N.P.; Jackson, S.A.; Jackson, S.A.; Prater, E.; Prater, E. Examining the impact of socialization and information sharing and the mediating effect of trust on innovation capability. Int. J. Oper. Prod. 2016, 36, 1601–1624. [Google Scholar] [CrossRef]
  51. Zacharia, Z.G.; Nix, N.W.; Lusch, R.F. Capabilities that enhance outcomes of an episodic supply chain collaboration. J. Oper. Manag. 2011, 29, 591–603. [Google Scholar] [CrossRef]
  52. Lichtenthaler, U. Absorptive capacity, environmental turbulence, and the complementarity of organizational learning processes. Acad. Manag. Ann. 2009, 52, 822–846. [Google Scholar] [CrossRef]
  53. Chen, Y.S.; Chang, C.H. Enhance environmental commitments and green intangible assets toward green competitive advantages: An analysis of structural equation modeling. J. Bus. Ethics 2013, 47, 529–543. [Google Scholar] [CrossRef]
  54. Boyer, K.K.; Verma, R. Multiple raters in survey-based operations management research: A review and tutorial. Prod. Oper. Manag. 2000, 9, 128–140. [Google Scholar] [CrossRef]
  55. Nancarrow, C.; Brace, I.; Wright, L.T. Tell me lies, tell me sweet little lies: Dealing with socially desirable responses in market research. Mark. Rev. 2001, 2, 55–69. [Google Scholar] [CrossRef]
  56. Campbell, D.T. The Informant in Quantitative Research. Am. J. Sociol. 1955, 60, 339–342. [Google Scholar] [CrossRef]
  57. Esfahani, M.S.; Dougherty, E.R. Effect of separate sampling on classification accuracy. Bioinformatics 2013, 30, 242–250. [Google Scholar] [CrossRef]
  58. Chen, Y.S.; Lin, Y.H.; Lin, C.Y.; Chang, C.W. Enhancement of Green Absorptive Ability, Green Dynamic Capacities and Green Service Innovation to Improve Firm Performance: an analysis of Structural Equation Modeling (SEM). Sustainability 2015, 5, 15674–15692. [Google Scholar] [CrossRef] [Green Version]
  59. Shea, J. Instrument relevance in multivariate linear models: A simple measure. Rev. Econ. Stat. 1997, 79, 348–352. [Google Scholar] [CrossRef] [Green Version]
  60. Murray, J.Y.; Gao, G.Y.; Kotabe, M. Market orientation and performance of export ventures: The process through marketing capabilities and competitive advantages. J. Acad. Mark. Sci. 2011, 39, 252–269. [Google Scholar] [CrossRef]
  61. Nunnally, J. Psychometric Theory; McGraw-Hill: New York, NY, USA, 1978. [Google Scholar]
  62. Fornell, C.; Larcker, D.F. Evaluating structural equation models with unobservable variables and measurement error. J. Mark. Res. 1981, 18, 39–51. [Google Scholar] [CrossRef]
  63. Gosling, J.; Jia, F.; Gong, Y.; Brown, S. The role of supply chain leadership in the learning of sustainable practice: Toward an integrated framework. J. Clean. Prod. 2017, 140, 239–250. [Google Scholar] [CrossRef]
  64. Zimon, D.; Tyan, J.; Sroufe, R. Implementing Sustainable Supply Chain Management: Reactive, Cooperative, and Dynamic Models. Sustainability 2019, 11, 7227. [Google Scholar] [CrossRef] [Green Version]
  65. Kohli, A.K.; Jaworski, B.J. Market orientation: The construct, research propositions, and managerial implications. J. Mark. 1990, 54, 1–18. [Google Scholar] [CrossRef] [Green Version]
  66. Smirnova, M.; Naudé, P.; Henneberg, S.C.; Mouzas, S.; Kouchtch, S.P. The impact of market orientation on the development of relational capabilities and performance outcomes: The case of Russian industrial firms. Ind. Mark. Manag. 2011, 40, 44–53. [Google Scholar] [CrossRef] [Green Version]
  67. Crittenden, V.L.; Crittenden, W.F.; Ferrell, L.K.; Ferrell, O.C.; Pinney, C.C. Market-oriented sustainability: A conceptual framework and propositions. J. Acad. Mark. Sci. 2011, 39, 71–85. [Google Scholar] [CrossRef]
  68. Matear, S.; Gray, B.J.; Garrett, T. Market orientation, brand investment, new service development, market position and performance for service organisations. Int. J. Serv. Ind. Manag. 2004, 15, 284–301. [Google Scholar] [CrossRef]
  69. Chen, Y.S.; Lin, M.J.; Chang, C.H. The positive effects of relationship learning and absorptive capacity on innovation performance and competitive advantage in industrial markets. Ind. Mark. Manag. 2009, 38, 152–158. [Google Scholar] [CrossRef]
  70. Rebs, T.; Brandenburg, M.; Seuring, S. System dynamics modeling for sustainable supply chain management: A literature review and systems thinking approach. J. Clean. Prod. 2019, 208, 1265–1280. [Google Scholar] [CrossRef]
Figure 1. Research framework.
Sustainability 12 07251 g001
Table 1. Descriptive statistics in terms of demographics (a) industrial sector; (b) demographics.
(a)
Job Titles of OM RespondentsFrequencyPercentage
Junior officer30053.57%
Professional18533.04%
Primary supervisor549.64%
General Manager162.86%
Executive50.89%
Missing00%
Total560100%
Job Titles of RD Respondents
Junior officer29151.96%
Professional19534.82%
Primary supervisor559.82%
General Manager162.86%
Executive30.54%
Missing00%
Total560100%
Annual Salary (in US$)
<10,00045740.8%
10,000–20,00032729.19%
20,001–30,00019016.96%
30,001–40,00011410.17%
40,001–50,000282.5%
50,001–60,00030.26%
>60,00010.09%
Missing00%
Total1120100
Gross sales (millions in US$)
<$100%
$1–$5110%
$5–$1000%
$10–$50330%
$50–$100110%
$100–$500220%
$500–$1 billion110%
>$1 billion220%
Missing00%
Total10100%
Industry
Pharmaceutical110%
Computer, electronic, and optical products110%
Electrical equipment220%
Machinery and equipment 220%
Motor vehicles, trailers, and semi-trailers220%
Wholesale trade, except for motor vehicles and motorcycles220%
Missing00%
Total10100%
Gender
Male25245%
Female30855%
Total560100%
Number of Employees
0–500440%
501–1000110%
1001–5000330%
more than 5000220%
Missing00%
Total10100%
(b)
CompanyISIC
Industry
SalesResponse RateRemarks
1BenQ Materials CorporationManufacture of computer, electronic, and optical products44.610,046North 1
2Far Eastern Department StoresWholesale trade, except for motor vehicles and motorcycles0.110,050North 2
3Value ValvesManufacture of machinery and equipment n.e.c.4.620,095North 3
4Delta ElectronicsManufacture of electrical equipment619.820,094North 4
5Excel Cell ElectronicManufacture of electrical equipment4.810,045Middle 1
6Rosta WheelsManufacture of motor vehicles, trailers, and semi-trailers5.210,050Middle 2
7Jui Li EnterpriseManufacture of motor vehicles, trailers, and semi-trailers12.510,047South 1
8Sino-American ElectronicsManufacture of machinery and equipment n.e.c.21.94019South 2
9Mercuries and AssociatesWholesale trade, except for motor vehicles and motorcycles5884020South 3
10STL TechnologyManufacture of basic pharmaceutical products and pharmaceutical preparations4.930,094South 4
Total 1280,560
Unit: U.S. million dollars (USD).
Table 2. Constructs.
ConstructsGreen Market OrientationGreen Supply Chain Relationship QualityGreen Absorptive CapacityGreen Competitive Advantage
Chen, Chang, and Lin (2014) [6] X
Chen, Lin, Lin, and Chang (2015) [58] X
Chang and Lin (2010) [36] X
Chen and Chang (2013) [53] X
Our paperXXXX
RemarksNew conceptNew concept
Table 3. Decision Variables.
ConstructsGreen Market OrientationGreen Supply Chain Relationship QualityGreen Absorptive CapacityGreen Competitive AdvantageOther
Chen, Chang, and Lin (2014) [6] X Green radical innovation, green incremental innovation green shared vision, green absorptive capacity, and green organizational ambidexterity
Chen, Lin, Lin, and Chang (2015) [58] X Green dynamic capabilities, green service innovation, and firm performance
Chang and Lin (2010) [36] XGreen competitive advantage and green intangible asset
Chen and Chang (2013) [53] XGreen competitive advantage, green intangible asset, environmental commitment, and environmental management
Table 4. Mean, standard deviation, and correlation coefficient.
ConstructsMeanStandard DeviationA.B.C.
A. Green Market Orientation5.4930.922
B. Green Relation Quality5.4000.8500.786 **
C. Green Absorptive Capacity5.3460.9170.778 **0.800 **
D. Green Competitive Advantage5.1370.9750.620 **0.648 **0.683 **
Note: ** p < 0.01.
Table 5. Factor analysis of this study.
ConstructsNumber of ItemsNumber of FactorsAccumulation on Percentage of Explained Variance
Green Market Orientation9171.105%
Green Supply Chain Relation Quality9165.813%
Green Absorptive Capacity5170.083%
Green Competitive Advantage8173.622%
Table 6. The item factor loadings and construct Cronbach α coefficients and average variance extracteds.
ConstructsItemsSquared Multiple CorrelationλCronbach’s αAVEThe Square Root of AVE
GMOGMO1
GMO2
GMO4
GMO5
GMO6
GMO7
GMO8
GMO9
GMO10
0.61
0.60
0.60
0.68
0.65
0.62
0.58
0.71
0.68
0.78 **
0.78 **
0.77 **
0.88 **
0.80 **
0.79 **
0.76 **
0.84 **
0.82 **
0.9430.920.959
GSCRQGRQ10.610.78 **0.9350.920.959
GRQ20.630.79 **
GRQ30.670.82 **
GRQ40.510.71 **
GRQ50.630.79 **
GRQ60.710.84 **
GRQ70.620.79 **
GRQ80.640.80 **
GRQ90.630.79 **
GACGAC1
GAC2
GAC3
GAC4
GAC5
0.62
0.63
0.63
0.59
0.63
0.78 **
0.79 **
0.79 **
0.77 **
0.79 **
0.8930.960.980
GCAGCA10.590.77 **0.9490.980.990
GCA20.700.82 **
GCA30.690.83 **
GCA40.630.79 **
GCA50.630.79 **
GCA60.720.85 **
GCA70.820.91 **
GCA80.820.90 **
Note: ** p < 0.01.
Table 7. Measures of overall model fit.
HypothesisMeasurement Model EstimatesResults
Absolute Fit MeasuresX2 Sig
SRMR < 0.08
RMSEA < 0.1
GFI > 0.80
No, 820.256
Yes, 0.042
Yes, 0.057
Yes, 0.84
Incremental Fit MeasuresAGFI > 0.80
NFI > 0.80
NNFI > 0.90
CFI > 0.90
RFI > 0.90
IFI > 0.90
Yes, 0.82
Yes, 0.90
Yes, 0.94
Yes, 0.95
No, 0.89
Yes, 0.95
Parsimonious Fit MeasuresPNFI > 0.50
PGFI > 0.50
X2/df < 5
CN > 200
Yes, 0.83
Yes, 0.73
Yes, 1.90
No, 164
Table 8. Effects of factors based on the structural equation modeling example.
PathCoefficients
Effectt-Value
GMO → GRQ
Direct Effect0.9214.53 *
Indirect Effect--
Total Effect0.9214.53 *
GMO → GAC
Direct Effect−0.13−1.20
Indirect Effect0.968.14 *
Total Effect0.8313.62 *
GMO → GCA
Direct Effect−0.23−1.47
Indirect Effect0.915.69 *
Total Effect0.956.24 *
GRQ → GAC
Direct Effect1.058.45 *
Indirect Effect--
Total Effect1.058.45 *
GRQ → GCA
Direct Effect1.284.40 *
Indirect Effect−0.33−1.60
Total Effect0.956.24 *
GAC → GCA
Direct Effect−0.31−1.70
Indirect Effect----
Total Effect−0.31−1.70
Note: * p < 0.5.
Table 9. The overall assessment of measurement model fit for the competing model.
Fit IndicesMeasurement Model EstimatesResults (FTB Output in LISREL 8.7)
Absolute fit measuresX2 SigNo, 1462.26
SRMR < 0.08Yes, 0.078
RMSEA < 0.1Yes, 0.093
GFI > 0.80No, 0.75
Incremental fit measuresAGFI > 0.80No, 0.71
NFI > 0.80Yes, 0.83
NNFI > 0.90No, 0.85
CFI > 0.90No, 0.86
RFI > 0.90No, 0.81
IFI > 0.90No, 0.87
Parsimonious fit measuresPNFI > 0.50Yes, 0.76
PGFI > 0.50Yes, 0.64
X2/df < 5Yes, 3.42
CN > 200No, 84.1
Table 10. The overall assessment of structure model fit for the competing model.
Fit IndicesStructural Model EstimatesResults (FTB Output in LISREL 8.7)
Absolute fit measuresX2 Sig1730.07
SRMR < 0.08No, 0.13
RMSEA < 0.1No, 0.1
GFI > 0.80No, 0.71
Incremental fit measuresAGFI > 0.80No, 0.67
NFI > 0.80Yes, 0.81
NNFI > 0.90No, 0.83
CFI > 0.90No, 0.84
RFI > 0.90No, 0.79
IFI > 0.90No, 0.84
Parsimonious fit measuresPNFI > 0.50Yes, 0.74
PGFI > 0.50Yes, 0.62
X2/df < 5yes, 4.02
CN > 200No, 75.31
Table 11. Effects of factors based on the competing model.
PathCoefficients
EffectEffect
GMO → GRQ
Direct Effect0.7311.59 *
Indirect Effect--
Total Effect0.7311.59 *
GMO → GCA
Direct Effect--
Indirect Effect0.559.78 *
Total Effect0.559.78 *
GMO → GAC
Direct Effect--
Indirect Effect0.5910.13 *
Total Effect0.5910.13 *
GRQ → GCA
Direct Effect0.7511.68 *
Indirect Effect--
Total Effect0.7511.68 *
GRQ → GAC
Direct Effect0.355.96 *
Indirect Effect0.458.03 *
Total Effect0.8112.29 *
GCA → GAC
Direct Effect0.68.99 *
Indirect Effect--
Total Effect0.68.99 *
Note: * p < 0.5.

