Urban Sustainability Evaluation Based on the DPSIR Dynamic Model: A Case Study in Shaanxi Province, China

1
Institute of Cultural and Tourism, Xi’an University, Xi’an 710065, China
2
Tourism Confucius Institute, Griffith University, Goldcoast 4217, Australia
3
Northwest Institute of Historical Environment and Socio-Economic Development, Shaanxi Normal University, Xi’an 710065, China
4
School of Tourism, Huangshan University, Huangshan 245021, China
5
School of Environmental and Geographical Sciences, Shanghai Normal University, Shanghai 200234, China
*
Author to whom correspondence should be addressed.
Sustainability 2020, 12(18), 7460; https://0-doi-org.brum.beds.ac.uk/10.3390/su12187460
Submission received: 29 July 2020
/
Revised: 5 September 2020
/
Accepted: 8 September 2020
/
Published: 10 September 2020
(This article belongs to the Collection Indicators, Assessment Tools, and Rating Systems for Mainstreaming Sustainability in Urban Planning and Development)
Abstract
:The sustainability of urban cities has been the focus of significant academic research in recent years and is emphasized in Goal 11 of the Sustainable Development Goals (SDGs). In this study, we adopted the Drive-Pressure-State-Impact-Response model (DPSIR) to promote a conceptual study of sustainable development index (SDI) to compare the different urban sustainable development status and try to find the factors that affect the urban sustainable development. The framework of indicators we used is mainly based on Goal 11 of the SDGs’ targets and indicators. We chose six cities in the Shaanxi Province of China and studied them from 2008 to 2018. The results show that: (1) the sustainable development of urban cities is greatly influenced by China’s national economic development plans and urban development strategies; (2) the economic growth and management level of authorities can significantly promote urban sustainability; (3) the urban sustainability of the six cities in Shaanxi Province showed a significant imbalance and this imbalance affected the overall development of the region; (4) compared with Guanzhong urban agglomeration, Shannan urban agglomeration is subject to the policy needs of environmental protection in the Qinling mountain area and its economic development is restricted; therefore, its urban sustainability is relatively low. Theoretical contributions are presented to assist in addressing these challenges and to support policies and initiatives that move these cities in China towards achieving SDG 11.
1. Introduction
In the past 30 years, developed countries have made numerous achievements in sustainable development. Their theory of sustainable development makes great contributions to the protection of resources, restoration of ecological environment, and improvement of living standards. Meanwhile, with the rapid social and economic development, developing countries have actively engaged in exchanges and cooperation in the field of sustainable development with developed countries, and try to seek pathways that protect the resources and population.
In 1987, the World Commission on Environment and Development (WCED) published its Brundtland report with the title ‘Our Common Future’ to define sustainable development as the ability to: “…meet the necessities of the present generation without harming the future generation’s capacity to meet their own” (WCED, 1987).
The United Nations (UN) has played an essential role, working to help many countries to improve their situation and conquer the current and future challenges to sustainable development. In 2012, the “Rio+20” conference (UN Conference on Sustainable Development, UNCSD) was held in Rio de Janeiro, which is considered a historical conference in the 21st century. In September 2015, with the ongoing achievement, the UN introduced a forward-looking approach: the Sustainable Development Goals (SDGs), to meet the increasingly serious opportunities and challenges in the field of global sustainable development [1]. The SDGs establish three aspects of framework arrangements: global economic growth, social equity, and ecological protection with a set of goals and targets to be achieved by 2030, serving as a continuous work (the Millennium Development Goals, MDGs) which was also approved by the UN in 2001 with a set of eight initiatives to make the world a better place to live by 2015 [2].
It is worth noting that the United Nations sustainable development goals pay the most attention to the issue of globalization and sustainable development problems. There are 17 universal goals, including recent urgent environmental, political, and economic challenges. The UN SDGs documents mainly focus on cities, energy, health, climate, and poverty eradication. The SDGs aim to reach a consensus among UN member states in the field of sustainable development, which is also an integral part of the 2030 Agenda, including 169 targets and various indicators that are integrated into 17 sustainable goals.
Cities can reflect both global economic development and environmental change, and as such, are playing an increasingly central role in the discourse for the application of sustainable development [3]. More than half of the world’s population now lives in urban areas [4], and by 2050 more than two-thirds of the world’s population is expected to be urbanized, which means both that urban population centers become a majority of the human population, and also increase the importance for urban sustainable development. Approximately 80% of the global gross domestic product (GDP) will be generated in cities [5], which is a significant contribution to human wealth, innovation, and cultural advancement [6]. On the other hand, cities are major sources of environmental pollutants and account for 67% consumption of global energy and 76% of greenhouse gas emissions. Cities are also becoming increasingly vulnerable to hazards brought about by climate change, the difficulties of poverty reduction, and a weakening resilience to natural disasters [7]. There are still nearly one-billion people in cities living in slums with poverty, inadequate infrastructure, and a lack of health and education services according to the UN habitat; therefore, the sustainable development of the city is as important as the sustainable development of the earth’s ecological environment. At the same time, for humanity to survive, urban sustainability evaluation can provide key guidance for urban development [8].
Many studies that evaluate urban sustainable development take into account several sources on SDGs, especially Goal 11 of the Sustainable Cities and Communities (SDGs), which addresses many issues involved in urban sustainability—opportunities for everyone and access to basic services, energy, housing, and transportation [9]. Goal 11 of the SDGs (SDGs-G11) framework also focuses on measuring the elements of housing and slum upgrading, sustainable transportation systems, air quality improvement, public green spaces, safety, tolerance, resilience, and sustainability in urban areas [10,11]. In terms of the SDGs application research, many scholars have chosen typical cities for SDGs application research and discussed the sustainable problems, including Bangalore, Cape Town, Gothenburg, Manchester, and Kisumu [12]; however, some of the researchers found that data selecting and missing problems provides a significant challenge [9]. Raheem chose Nigeria as an example to investigate the effects of spatial agglomeration of scarce urban resources on the health status of Ilorin residents [13]. Gao et al. sorted out some problems in establishing the evaluation system and models, such as the applicability and logical rationality of sustainability indicators. Finally, they pointed out that the implementation of SDGs was hard to achieve as a whole [14]. Cai et al. discussed the relationship between SDG-G3 (health and well-being) and SDG-G11 (sustainable cities and communities). The results show that too much attention and concern to global health and health indicators negatively impact urban development goals [15]. Arslan et al. selected part of the indicators from SDG-G11 to investigate the sustainability of environmental planning and energy consumption in three ancient cities [16]; however, almost all these studies focused only on the effects and impacts of single indicators and haven’t discussed the relationship between each indicator [9].
Depending on the numerous theories and case studies on the SDGs-G11, many scholars have made academics criticism on how to evaluate the urban sustainability by using the SDGs-G11. Xue yan Xu et al. stated that the research on urban sustainability was still in its early stage. The entropy method, the grey approach, the analytic hierarchy process (AHP), and the equal weighting method have been used in sustainability performance evaluation; however, the different index subsystems and criteria may lead the evaluation studies to be more complicated [9]. Klopp and Petretta indicated that the urban sustainability measurements could be tracked at a national level and further aggregated to regional scales, making city-level comparisons difficult [17]. Stafford-Smith et al. further proposed the SDGs implementation targets are largely silent about interlinkages and interdependencies which could leave open the possibility of perverse outcomes and unrealized synergies, and the assessment model should be built to solve these problems [18]. Almeida et al. thought that the SDGs-G11 evaluation work should not stay in the country level, the evaluation must draw lessons to develop an action framework to facilitate the implementation of SDG 11 at the local city level [19]. Despite numerous literature on issues related to SDGs, the SDGs is still a complex field where a large number of indicators already exist and stand for different purposes and agendas [15], but the evaluation methods cannot achieve a consensus methodology [17], there is still a shortage of studies that investigate this subject deeply through the description and assessment of the comprehensive sustainable development index [9]. From this perspective, we argue that the SDGs-G11 indicator framework is a useful tool for improving the sustainability of cities, especially under the different developing strategies. By conducting a comprehensive literature review of SDGs-G11 studies, we found that there are three main practical problems and gaps concerning the urban sustainability evaluation studies: (1) lack of a comprehensive urban sustainable evaluation model which can both assess the urban sustainability level and the driving mechanism of urban sustainable development; (2) the lack of strong and standard data collection institutions at the city level to support the evaluation model by adopting the SDGs indicators and formulas; (3) localization research at the city levels.
To bridge these gaps and solve these problems, this study aims to promote the concept of the Sustainable Development Index (SDI) at the city level by using a mature dynamic model, the Drive-Pressure-State-Impact-Response model (DPSIR), as an evaluation tool. To evaluate the model’s performance, we chose six important cities in the Shaanxi Province, which are located in the middle of China, to integrate the indicators under the framework of SDGs-G11 to evaluate the sustainability of the city. To make the data easily comparable, the data in this paper are all from China’s national statistical yearbook and related social and economic development bulletin. This paper also tries to systematically and scientifically explain the six cities’ urban sustainable status and characteristics in a long period which may be affected by the numerous external influencing factors.
2. Study Area
2.1. The Urbanization of Chinese Cities
Since its reform and opening up in 1978, China has shown a trend of rapid growth in social and economic development, with average annual GDP growth of nearly 10%. Meanwhile, the rapid social and economic development has also injected a strong impetus into China’s urbanization process, with the increasing urban population, China’s urbanization rate reached approximately 60.6% by the end of 2019 [20]. With the initiative of China’s “One Belt and One Road” national strategy and the acceleration of the western development process, especially the proposal of China’s ecological civilization construction, i.e., Shaanxi province, as one of the most important economic development and ecological protection areas in western China, there have been increasing demands for sustainable development and an eagerness to evaluate its sustainability [21]. At the same time, to better gather urban resources and improve urban efficiency, the development trend of China’s urbanization process has shifted from the single increase of urban population and the construction of public infrastructure to the development of urban agglomeration with node cities as the core. Urban agglomerations are crucial developing patterns for the future of China. In addition, the development and competition among modern cities no longer relies on the expansion and strength of a single city but the growth of urban agglomeration [22]; however, the acceleration of the urbanization process has also brought many problems, such as urban environmental pollution, the compression of urban ecological space, the decrease of residents’ happiness index, the aging of the population and the increase of the urban poor population, which have directly affected the sustainable development of Chinese cities [20].
2.2. The Background of Urban Development of Shaanxi in China
2.2.1. The Economic Development Policy of Shaanxi Province
The development of cities cannot be separated from the guidance of national policies. With the initiative of “One Belt and One Road” and “western development” strategy, the GDP of Shaanxi Province witnessed a significant growth from 817 billion yuan in 2009 to 2444 billion yuan in 2018 [23]; meanwhile, cities in western China, represented by Xi’an, have entered a period of rapid development with the average GDP growth rate of 11% in the past 10 years [24]. Under the guidance of the three Five-years Plans (Period I: the 11th Five-Year Plan, 2005-2010; Period II: the 12th Five-Year Plan, 2011–2015; Period III: the 13th Five-Year Plan), cities in western China have stepped forward from resource-oriented cities to sustainable development. From the perspective of location, Xi’an, Baoji, and Weinan on the north side of Qinling Mountain began to develop towards high-tech manufacturing, modern service industry, and cultural industry; the average tertiary industry proportion of the three cities had reached 44% in 2018 [23]. Hanzhong, Ankang, and Shangluo on the south side of Qinling Mountain began to develop towards ecological sustainability after extensive resource prohibition.
2.2.2. The Development of Sociodemographic Structure
Urban development in Shaanxi is similar to that of other city’s provinces. Faced with great opportunities and challenges of economic development, social problems are increasingly prominent. Affected by the acceleration of China’s urbanization process, the proportion of urban population is increasing in Shaanxi Province from 44% in 2009 to 58% in 2018 [23]; however, China’s one-child policy, which began in 1979, has kept the urban birth rate between 0.3% to 0.5% for a decade and the population aging rate had reached over 10% in 2018 [23], making the aging problem increasingly serious. Meanwhile, the urban population of Shaanxi increases year by year, especially in Xi’an city, the capital of Shaanxi Province. In 2018, the urban population of Xi’an had exceeded 7.3 million [24], accompanied by a large amount of household garbage and energy consumption, which also exerted great pressure on the sustainable development of the city.
2.2.3. Urban Environment Pollution and Resource Consumption
As an important leading province in western China, Shaanxi’s energy consumption increases year by year. As shown in Table 1, the annual electricity consumption had increased 2.4 times from 2009 to 2018, and the annual water consumption had increased 753 million tons during that period. With the large number of energy consumption, Shaanxi Province had faced a series of environmental problems, the production of industrial solid waste and industrial wastewater discharge had significantly increased. But as shown in Table 1, the industrial SO2 exhaust emissions had greatly decreased due to the large number of environmental protection facilities investment by the government.
2.3. The Study Area Selection
With the announcement of the UN SDGs, a large number of scholars have explored the concept, theory, framework, and sub-goals of the SDGs. For urban sustainability study, the purpose of SDGs-G11 is to make cities and human settlements inclusive, safe, resilient, and sustainable; however, most of the papers we investigated chose national level cases, and there are very few research papers that focused on the city level [25]. Cases were also concentrated in European, South American, and African countries. This could be due to the following reasons:
- National statistics of European countries are relatively open, and it is also not difficult to obtain continuous data for another statistical organization, which can provide a better spatiotemporal comparative analysis for the evaluation of SDGs.
- The main purpose of SDGs is to solve the survival and poverty problems in less developed countries and regions, which means that African and South American countries are often chosen as research regions.
- The difficulty of data collection at the city level is relatively high, which mainly depends on the solid statistical work and strong data collation ability of the social and economic statistics department.
Based on the above reasons, to enrich the target of sustainable development theory and case studies, we selected six cities in the Shaanxi Province of China as the main research cases of this study. The typical representative significance is as follows:
- As the portal and starting cities of China’s “One Belt and One Road” initiative, the sustainable development of cities can help promote China’s national image.
- The main Qinling Mountain range, known as the father mountain of China, is located in the middle of Shaanxi province. There is a huge contradiction between urban development and environmental protection. Urban development is restricted by social, economic, and ecological environment protection. The six cities selected in this paper are located in both the north and the south slope of the Qinling Mountains and their urban positioning, socio-economic development strategies, and environmental protection policies are greatly different, which provides an interesting case for the SDGs evaluation studies.
- Since 2010, China’s economy has shifted from unsustainable growth to sustainable growth. With the rapid development of urbanization, the sustainability of cities has attracted more and more attention from the government, residents, and scholars; therefore, for our research, we chose relevant socio-economic statistics from 2009 to 2018 and evaluated the sustainable development trajectory of the city through a longitudinal time comparison.
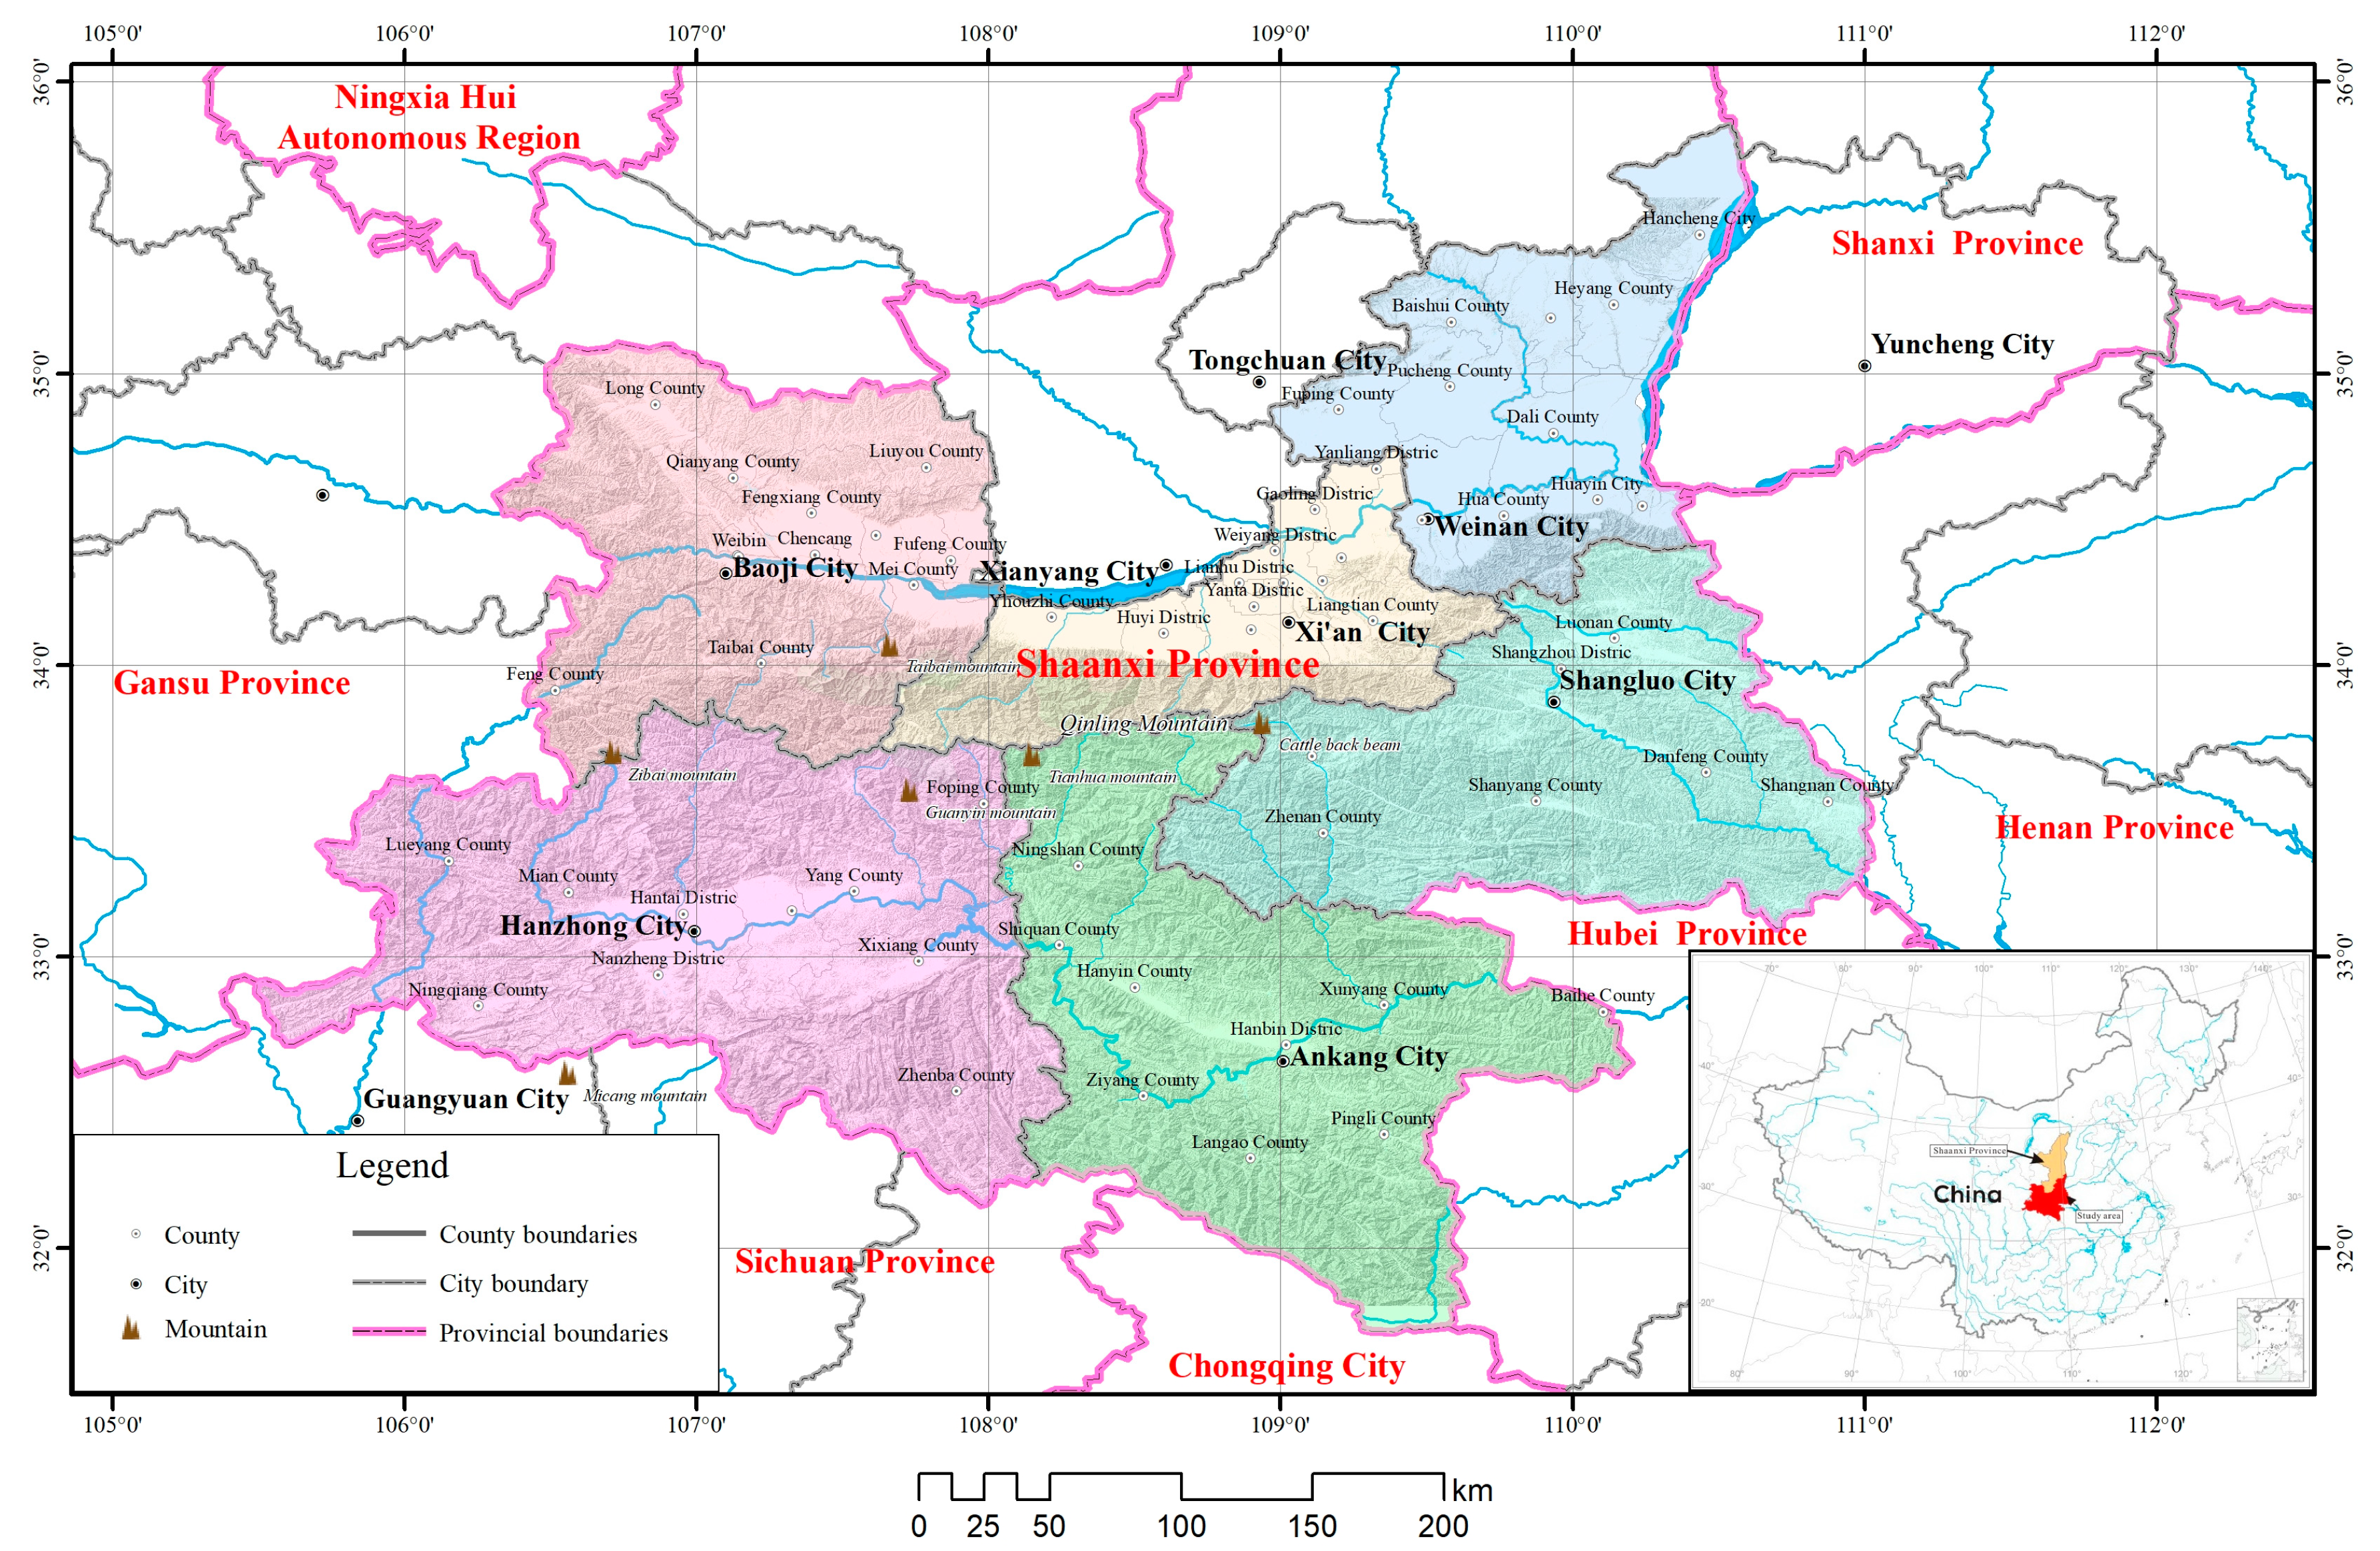
Figure 1 shows the location of the six cities in Shaanxi province in China: Xi’an, Baoji, Weinan, Hanzhong, Ankang, and Shangluo.
Since 2010, the speed of economic development in Guanzhong and Shannan urban agglomeration have been among the fastest in Shaanxi province. The annual GDP growth rate of the Guanzhong urban agglomeration was maintained at 10%, and its total annual GDP proportion in Shaanxi Province rose from 36% to 44% during 2010 to 2017. The annual GDP growth rate of the Shannan urban agglomeration was maintained at 12%, and its total annual GDP proportion in Shaanxi Province rose from 17% to 24% from 2010 to 2017 [23]. Meanwhile, one of the most important mountains in China, the China geographic dividing line, Qinling Mountains are located between Guanzhong and Shannan urban agglomeration. Therefore, the urban sustainability is affected by both the demands of economic development and environmental protection. Therefore, selecting these six cities can help in analyzing the urban sustainability balance point between economic development and environment protection in Shaanxi Province.
Xi’an is the capital city of Shaanxi province, with the city of Baoji and Weinan all located in the north slope of Qinling Mountain, the city of Hanzhong, Ankang, and Shangluo are located in the south slope of Qinling Mountains. Xi’an has higher social and economic development and has merged into the new first-tier cities of the year 2020 [26]. It is next to the north slope of Qinling Mountains, for its urbanization strategies and environmental problems, the conflict between economic development and environmental protection are becoming more prominent. Baoji and Weinan city are located on either side of Xi’an city, respectively. The main industries of these two cities are the primary and secondary industries. The three cities (Xi’an, Baoji and Weinan) are linked to a city cluster named “Guanzhong Urban Agglomerations”. On the south slope of the Qinling Mountains, there are three other cities (Hanzhong, Ankang, and Shangluo), which are linked to a city cluster called “Shannan Urban Agglomerations”, with a large quantity of mountain and freshwater resources. Due to the Middle Line South-to-North Water Diversion Project, the government of these three cities has the strictest environmental protection requirements, so the conflicts between urban development and natural resources protection have become one of the most significant factors affecting the urban sustainability. So, the questions of how to balance urban development and environmental protection, and how to evaluate the city prosperity have become key problems for the six cities.
To obtain more accurate index data, we used the data released to the public by the China National Bureau of statistics, Shaanxi Provincial Bureau of statistics and relevant urban statistical departments, including China Urban Development Statistical Yearbook, Shaanxi Provincial statistical yearbook, urban statistical yearbook, and the urban social development bulletin and environmental bulletin. In the absence of some statistical data, we visited the relevant statistical departments to correct and supplement the data.
3. Materials and Methods
3.1. An Introduction of the DPSIR Model
In 1993, the pressure–state–response model (PSR) was developed by the Organization of Economic Cooperation and Development (OECD). Because of the wide use of this model, the PSR model can struggle to explain some of the complex relationships in the field of social studies; therefore, the model was upgraded by the European Environmental Agency (EEA) to the DPSIR model to improve the explanation of systematic relationships [27] and has been used to evaluate the effectiveness of development policy through its multi-faceted analysis of competing social, economic, and ecological factors [28]. Many scholars such as Rogers and Borja attempted to construct an integrated evaluation model that could explain the mechanism of the coastal and marine ecosystem [29,30]. Sekovski (2012) pointed out that the DPSIR model must require the simultaneous consideration of societal, economic, and environmental information to understand the external societal and economic forces of change comprehensively and to evaluate the effects of environmental systems on human well-being [31,32]. The DPSIR model, which has been used to elucidate the environmental persistence issues in the sectoral scales [33,34], was then introduced to assess the relationship and interaction between the environment and social development. (i.e., Millennium Ecosystem Assessment Conceptual Framework Working Group, 2003) [35]. Thus, it can be seen that the theoretical and applied research of DPSIR model has been involved in the fields of environmental factor evaluation and ecosystem evaluation since its birth, and finally extends to the evaluation of social and economic development. However, DPSIR model also has some shortcomings, for instance, relying on strong data support; the final threshold range of evaluation results depends on individual cases, and it is difficult to grade the evaluation results [36,37].
In the field of sustainability, the advantage of the DPSIR model is that it can solve some kind of complex issues comprising various factors in pluralistic dimensions. With certain research targets, the DPISR model may construct a dynamic framework to gather different kinds of indicators at different levels [38]. With the widely-used sustainable theory, the sustainability assessment study needs more quantitative research methods; to this end, more indicators were integrated into the evaluation model [39], especially in the marine area. Unfortunately, very little specific results have been provided [32]. Sustainable urban research only establishes a framework by integrating some social and economic indicators; however, the indicators are separated, and there is still some argument over the indicator selection, as scholars cannot explain the relationship between each indicator very clearly [40]; therefore, the construction of a holistic evaluation model would greatly benefit the field of urban sustainability.
The DPSIR model can greatly benefit this field, as it can not only integrate the indicators but also explain the dynamic mechanism of urban sustainability from different perspectives, and can help city governor and decision-makers to regulate the urban cities sustainably.
3.2. The Framework of the DPSIR Model and Indicator System Based on the SDGs-G11
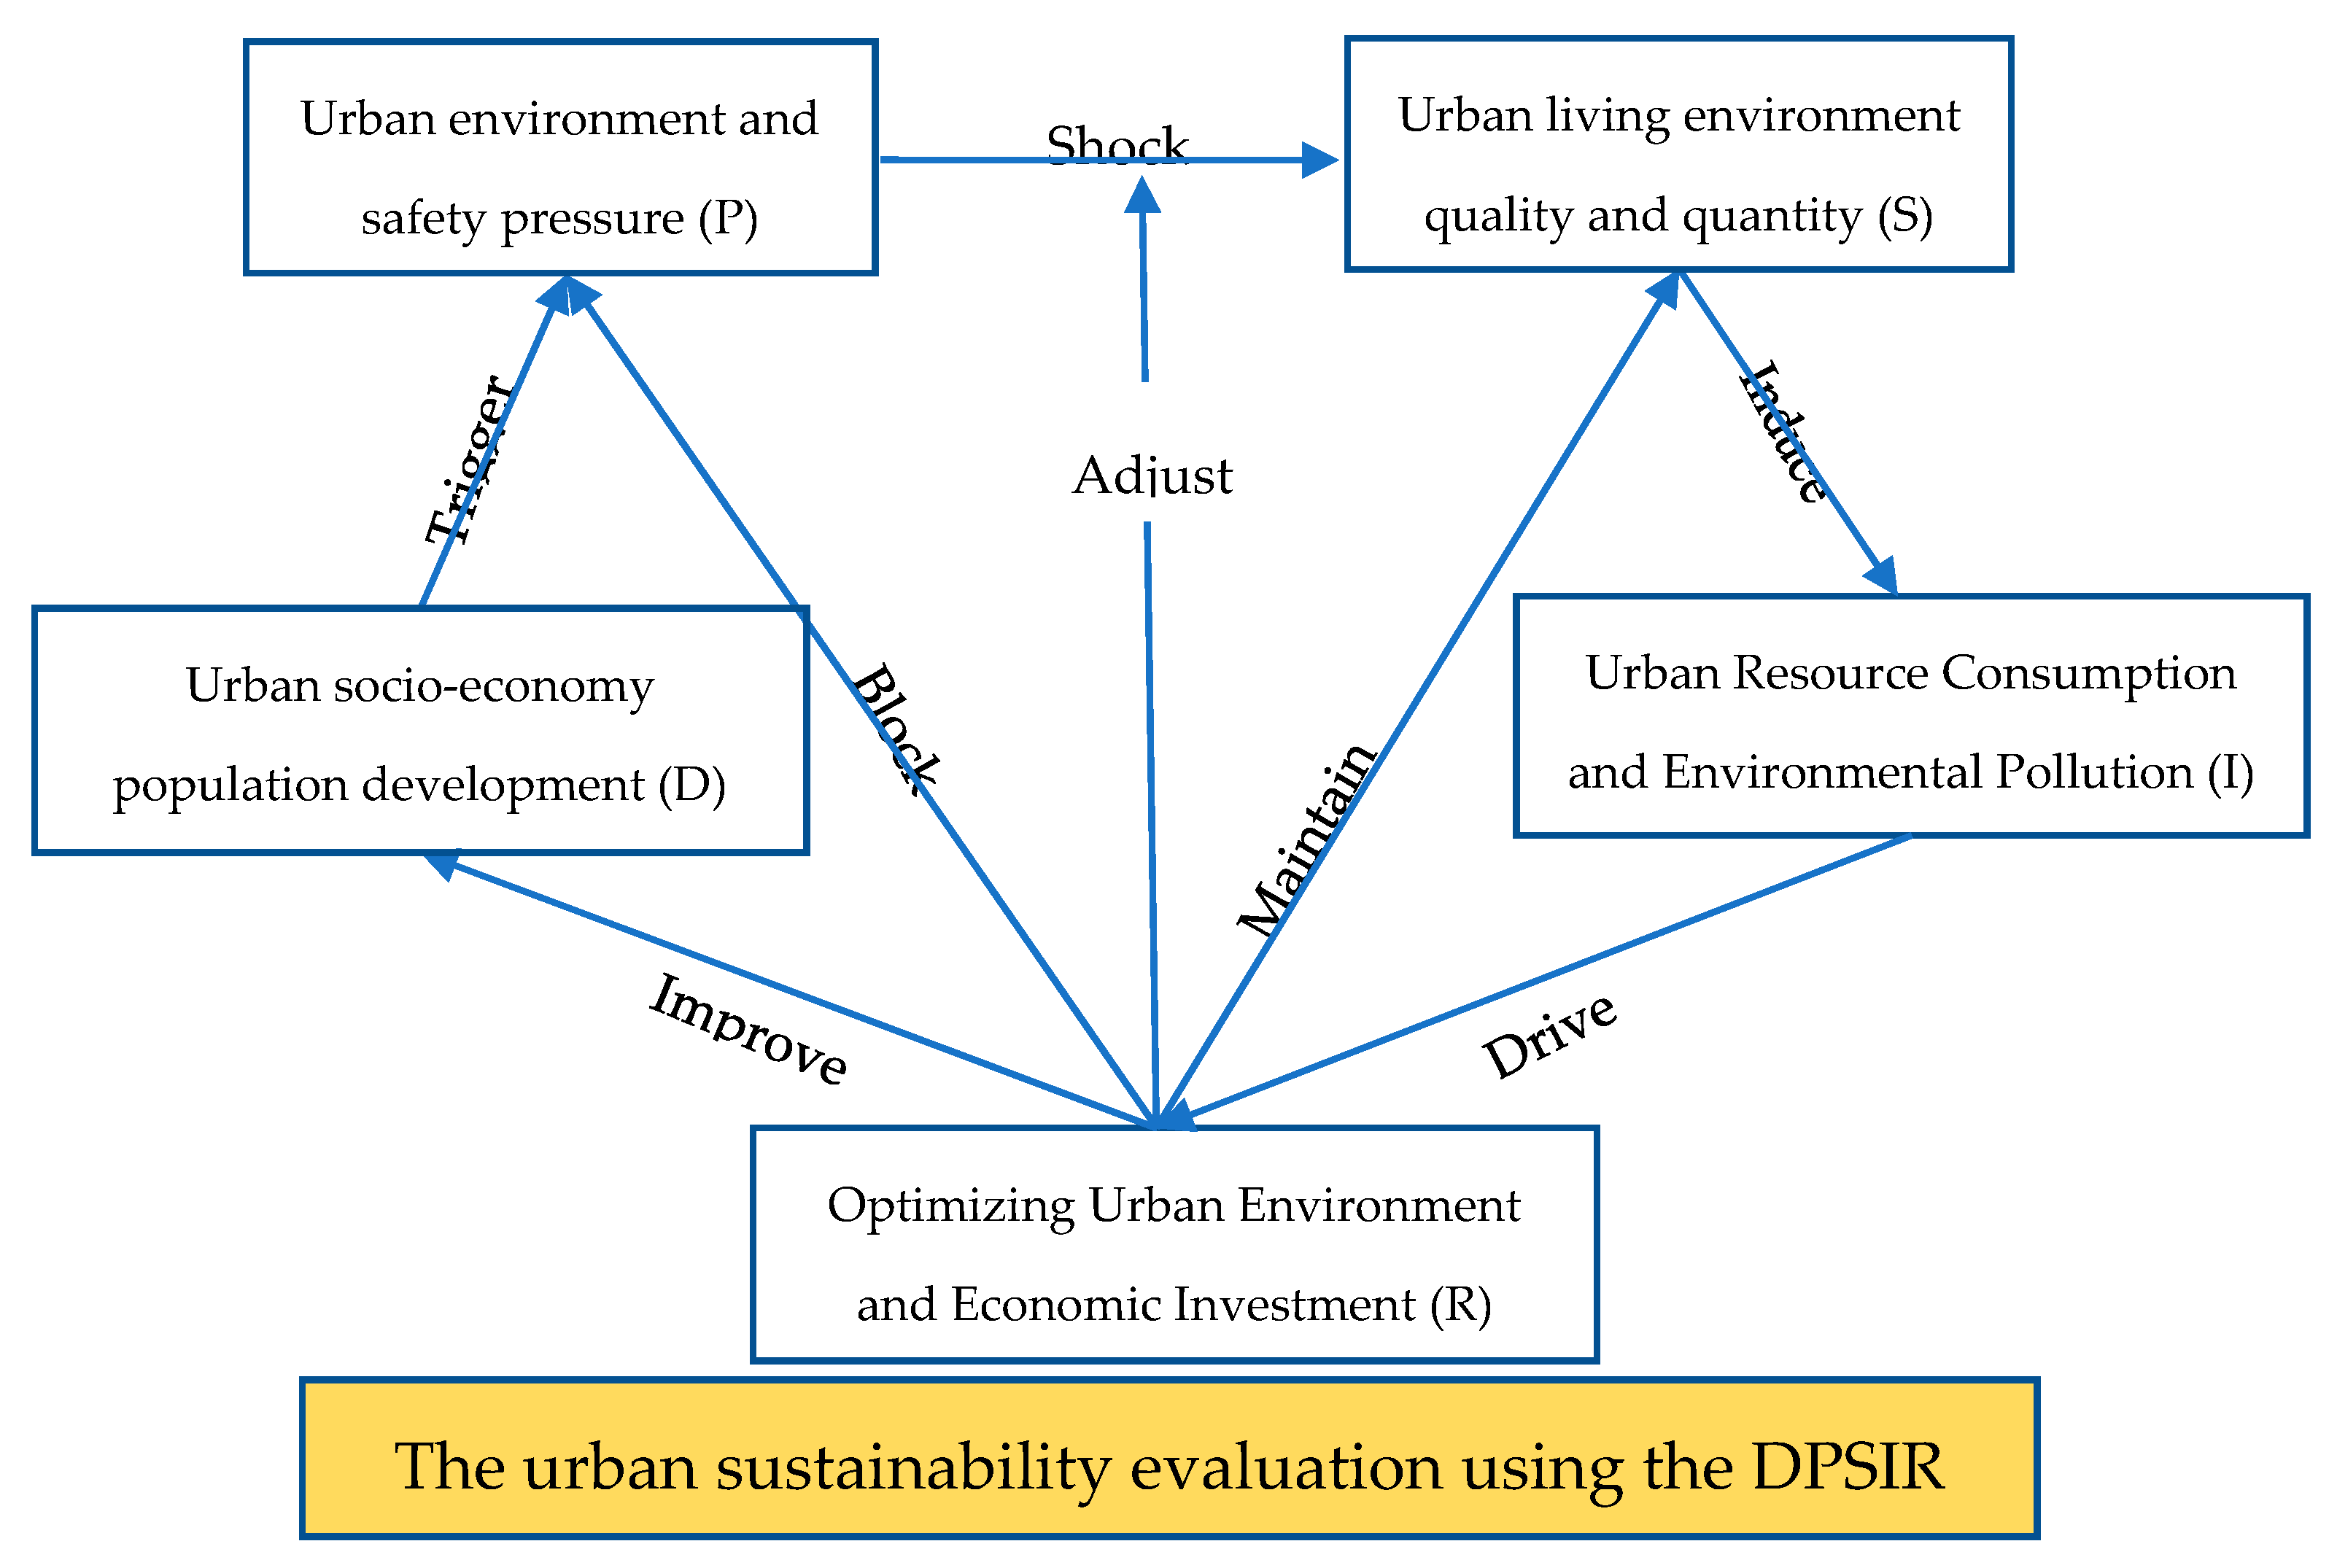
The DPSIR model is a dynamic model that demonstrates the internal relationship and influences between components [41]. By using the DPSIR model to evaluate sustainability, the model can integrate the sustainable indicators into different dynamic parts and can explain the interaction between each part (shown in Figure 2). The internal chains show that in the urban sustainable study, the main driving forces (D) of the urban sustainability is the development of society, economy, and population; the pressure (P) is the result of human activities on environment and safety; the state (S) is the urban environment and natural resources with the evolution of the urban development; the impact (I) is the impact of various human activities on the urban environment and natural resources, such as air pollution, water, and electricity consumption; the response (R) is the certain measures taken by the governors to respond to these changes, such as the investment to the environment protection and urban waste clearance rate and pollutant treatment technology improvement [42]. The model embodies a key concept of urban sustainable development with the urban evolution and countermeasures taken by the decision-making community [43]. The most significant advantage of the utilization of the DPSIR model in the field of sustainable evaluation research is that it highlights the relationship between the urban evolution pressure and the countermeasures by the five elements restraining and influencing each other.
Many previous scholars based the construction of the DPSIR indicators system on previous research results or experiences. These indicators vary according to different research cases and evaluation objectives, especially in the evaluation of sustainable development research fields such as sustainable utilization of water resources [44] and sustainable development of a coastal park or coastal zone [32]. These differences lead to controversy and in the continuity of the selection of model indicators when subsequent scholars use the DPSIR model based on subjective judgment; therefore, the UN SDGs carried out programmatic guidance, especially in the selection of indicators, which provides the basis for the effective follow-up of sustainable development research. In the study of sustainable urban development, SDGs-G11 gives clear requirements and guidance for urban sustainable development evaluation. In our research, depending on the sustainable development theory, we assessed sustainable development by using a mature dynamic model (the DPISR model) as an evaluation tool, which can not only more effectively evaluate the sustainability of cities, but also reduce the controversy in the selection of indicators (shown in Table 2).
3.3. The Determination of the Weight of the Indicator
The determination of the weight of the model indicators system can directly affect the evaluation results. According to the literature published by other scholars, there are two methods to determine the weight of the indicator: subjective weighting and objective weighting. The subjective weighting depends on the research experiences and advice of group experts, such as analytic hierarchy process (AHP) and expert scoring method [45]; the objective weighting always uses some kind of mathematical calculation, for example, the entropy weight method, principal component analysis, and the coefficient of variation method [46].
In this research, to make the weight calculation more reliable, the entropy weight method was chosen to empower each variable indicator. Then, the entropy weight of each indicator was calculated to make the weight more objective and reliable. Based on the data of the social statistics in six cities in Shaanxi Province from 2009 to 2018, we used the entropy method to determine the indicator weight that the smaller information entropy of one index indicates the larger difference between each index value, the more relevant information provided, the more important role an index plays in the comprehensive analysis, and evaluation, and thus the greater weight it should have and vice versa [47,48].
Because the units of social statistical data are different, it is necessary to determine the dimension of all data before calculating weight. The calculation principle of the entropy method is detailed in the following subsections [48].
3.4. The Calculation of the Index in the DPSIR Model
3.4.1. Standardized Treatment of Evaluation Index
Due to the inconsistency of unit dimensions, the evaluation factors in the DPSIR model have no comparability; therefore, for evaluation research, the judgment matrix must be standardized to eliminate the influence of different units and measures among indicators. The range standard method was used to evaluate the urban sustainable development of the six cities in Shaanxi Province. There are both positive and negative indicators in the model. The positive indicators are based on formula (1); negative indicators are based on Equation (2) [48]:
3.4.2. The Calculation of the Index Weight
Based on the discussion of index weight, we used the entropy method to determine the weight of each index. The calculation formula is as follows:
1 Definition of the information entropy
The information entropy Hi of the ith evaluation index can be defined as
among them, i = 1, 2, … m; j = 1, 2, … n
when fij ≤ 0, fijlnfij = 0, Kij is the value after the standardization
2 The calculation of the weight
According to the information entropy of the evaluation index, the obtained information entropy Hi is substituted into Equation (5) to further determine the weight value of each evaluation index. The results of the weight of each indicator are shown in Table 3.
among them, i = 1, 2, … m
3.4.3. The Construction of Sustainable Development Index (SDI)
The economic development and rapid urbanization of cities will accelerate the consumption of urban land, energy, and natural resources and also bring great pressure to the ecological environment, living space, and spatial comfort of urban residents; therefore, from the perspective of the DPSIR model, the driving force (D), pressure (P), and impact (I) are negatively correlated with urban sustainability. To better evaluate the urban sustainability, most of the state (S) indicators are positive, such as green park area per capita, urban landscaping rate, etc.
For the wide acceptance of sustainable theory, the government constantly adjusts the urban industrial structure and develops various management measures and programs, such as taking tertiary industries as pillar industries, promoting investment into environmental protection, education, social security, and health care, to make urban development more sustainable and make urban living spaces more comfortable and reliable. The response (R) indicators are positive to urban sustainability. Based on the analysis of the above index layer relationship, the sustainable development index model is established as follows:
among them, the D, P, S I, R are calculated as follows:
KDi is the quantized value of driving force index i, and WDi is the weight of KDi. i = 1, 2, 3 … n.
KPi is the quantized value of pressure index i, and WPi is the weight of KPi. i = 1, 2, 3 … n.
KSi is the quantized value of state index i, and WSi is the weight of KSi. i = 1, 2, 3 … n.
KIi is the quantized value of impact index i, and WIi is the weight of KIi. i = 1, 2, 3 … n.
KRi is the quantized value of response index i, and WRi is the weight of KRi. i = 1, 2, 3 … n.
4. Results
Based on the DPSIR model, after standardizing the dimension of each indicator, using the entropy method to determine the indicator weight and finally obtaining the component factor value and the comprehensive Sustainability Development Index (SDI) value of the six cities from 2009 to 2018, the results we analyzed were shown in the Section 4.1, Section 4.2, Section 4.3, Section 4.4, Section 4.5 and Section 4.6.
4.1. The Driving Force Index Analyzation
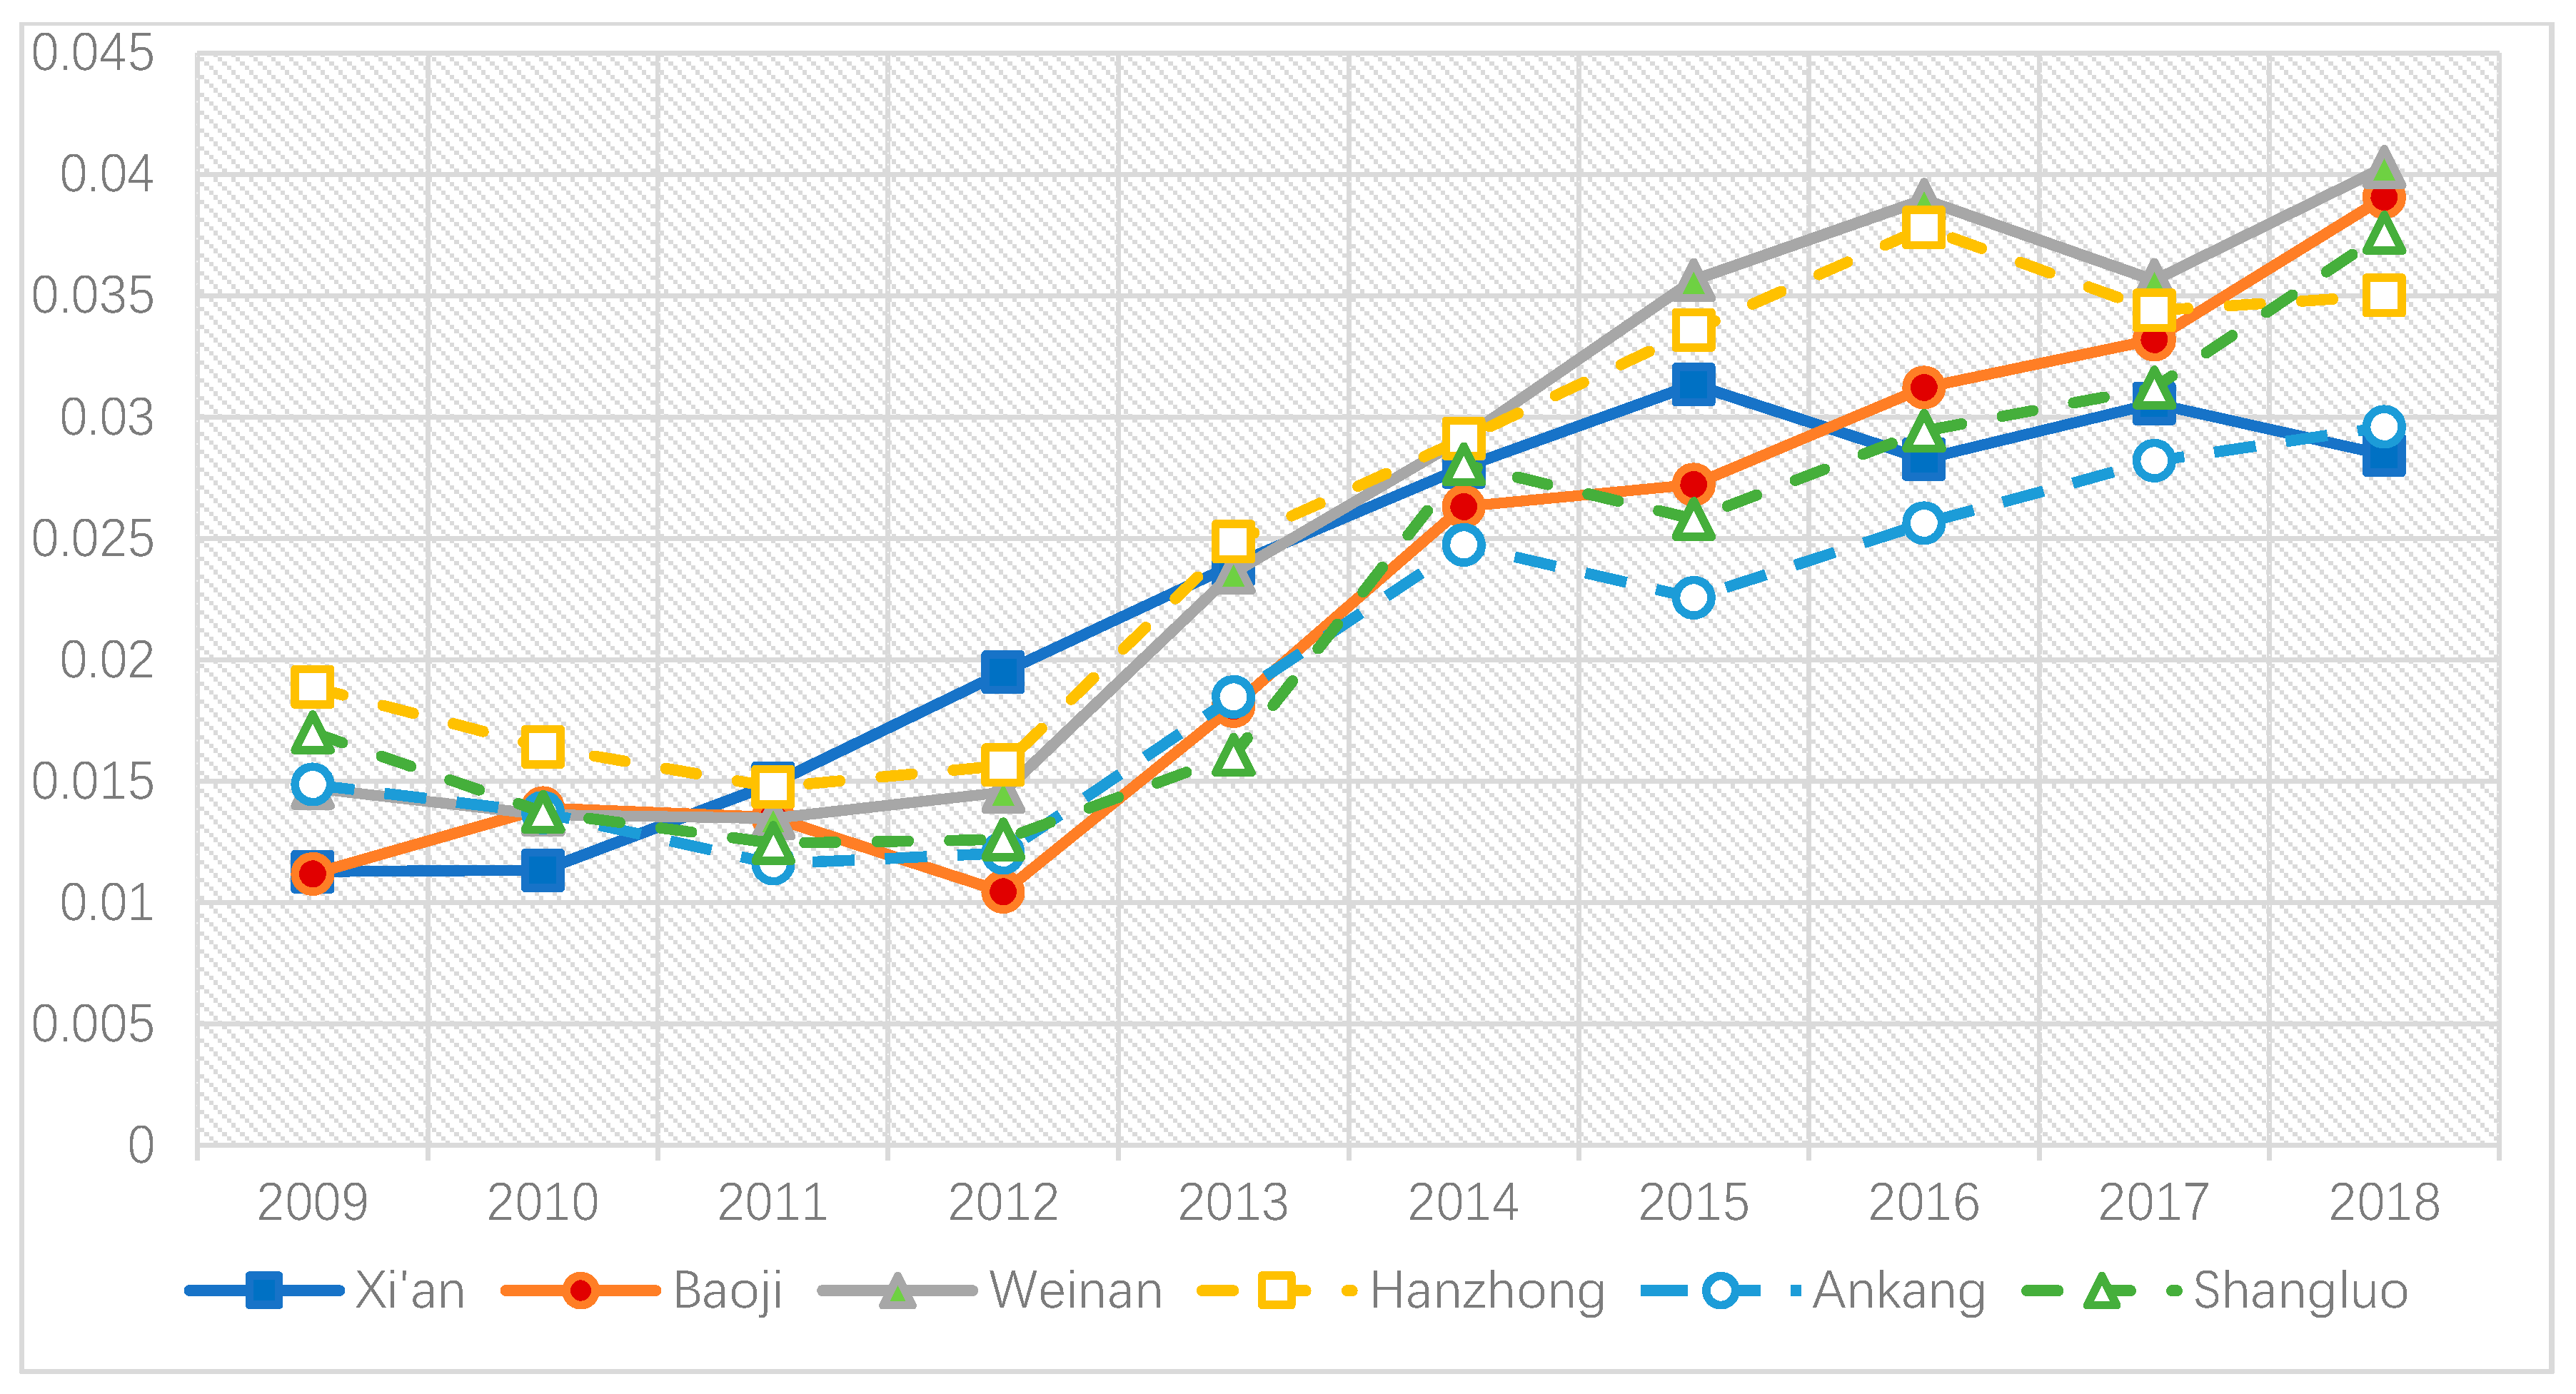
As shown by the urban sustainable development based on the DPSIR model, the economic development of a city directly drives its consumption of resources and makes the urban environment and safety pressure level up (Figure 2). For our research, three factors: natural population growth rate, GDP annual growth rate and urbanization rate were chosen as indicators for the driving force factor layer. Figure 3 shows that, from 2009 to 2018, the changes in the driving forces of the six cities in Shaanxi province can be divided into two stages. All cities besides Xi’an showed a significant downward trend in 2011 and 2012, and then the driving force of urban development generally showed a rising trend from 2013. Taking social and economic development factors into consideration, the main reason is that from 2011 to 2012, Shaanxi Province began to develop from resource-exporting cities to resource-conserving and high-tech intensive cities, and urban economic development has a direct impact on urbanization and GDP growth. Since 2012, China’s two-child policy has increased the natural growth rate of the population in six cities in Shaanxi. As the capital city of Shaanxi Province, the driving force of urban development of Xi’an has been increasing year by year since 2009 (0.01127 to 0.03134), gradually declined in 2016 (0.03134 to 0.02827) and then entered a period of the stable stage. Xi’an has been ranked among the top cities in the economic development of Shaanxi province; however, after 2015, it entered a stable period with relatively small changes in the growth rate of GPD, urban population and natural population growth rate.
4.2. The Pressure Index Analyzation
Based on the analysis of urban sustainable development of the DPSIR model (Figure 2), the pressure of urban development (P) is triggered by the driving force of urban development (D) and can block the response of government management (R). Figure 4 shows that the pressure of urban sustainable development generally presents a downward trend. This shows that under the premise of the continuous uprising driving force of urban development, the government has made great efforts in management and response, which ensures the stability of pressure in the process of sustainable development. In addition, according to the classification of urban agglomeration, the development pressure of Guanzhong city agglomeration (the total pressure value of the Guanzhong cities is 1.2795) is lower than that of Shannan city agglomeration (1.7843), which fully indicates that the Guanzhong city agglomeration responds more positively to the management strategy of urban sustainable development and effectively reduces the pressure.
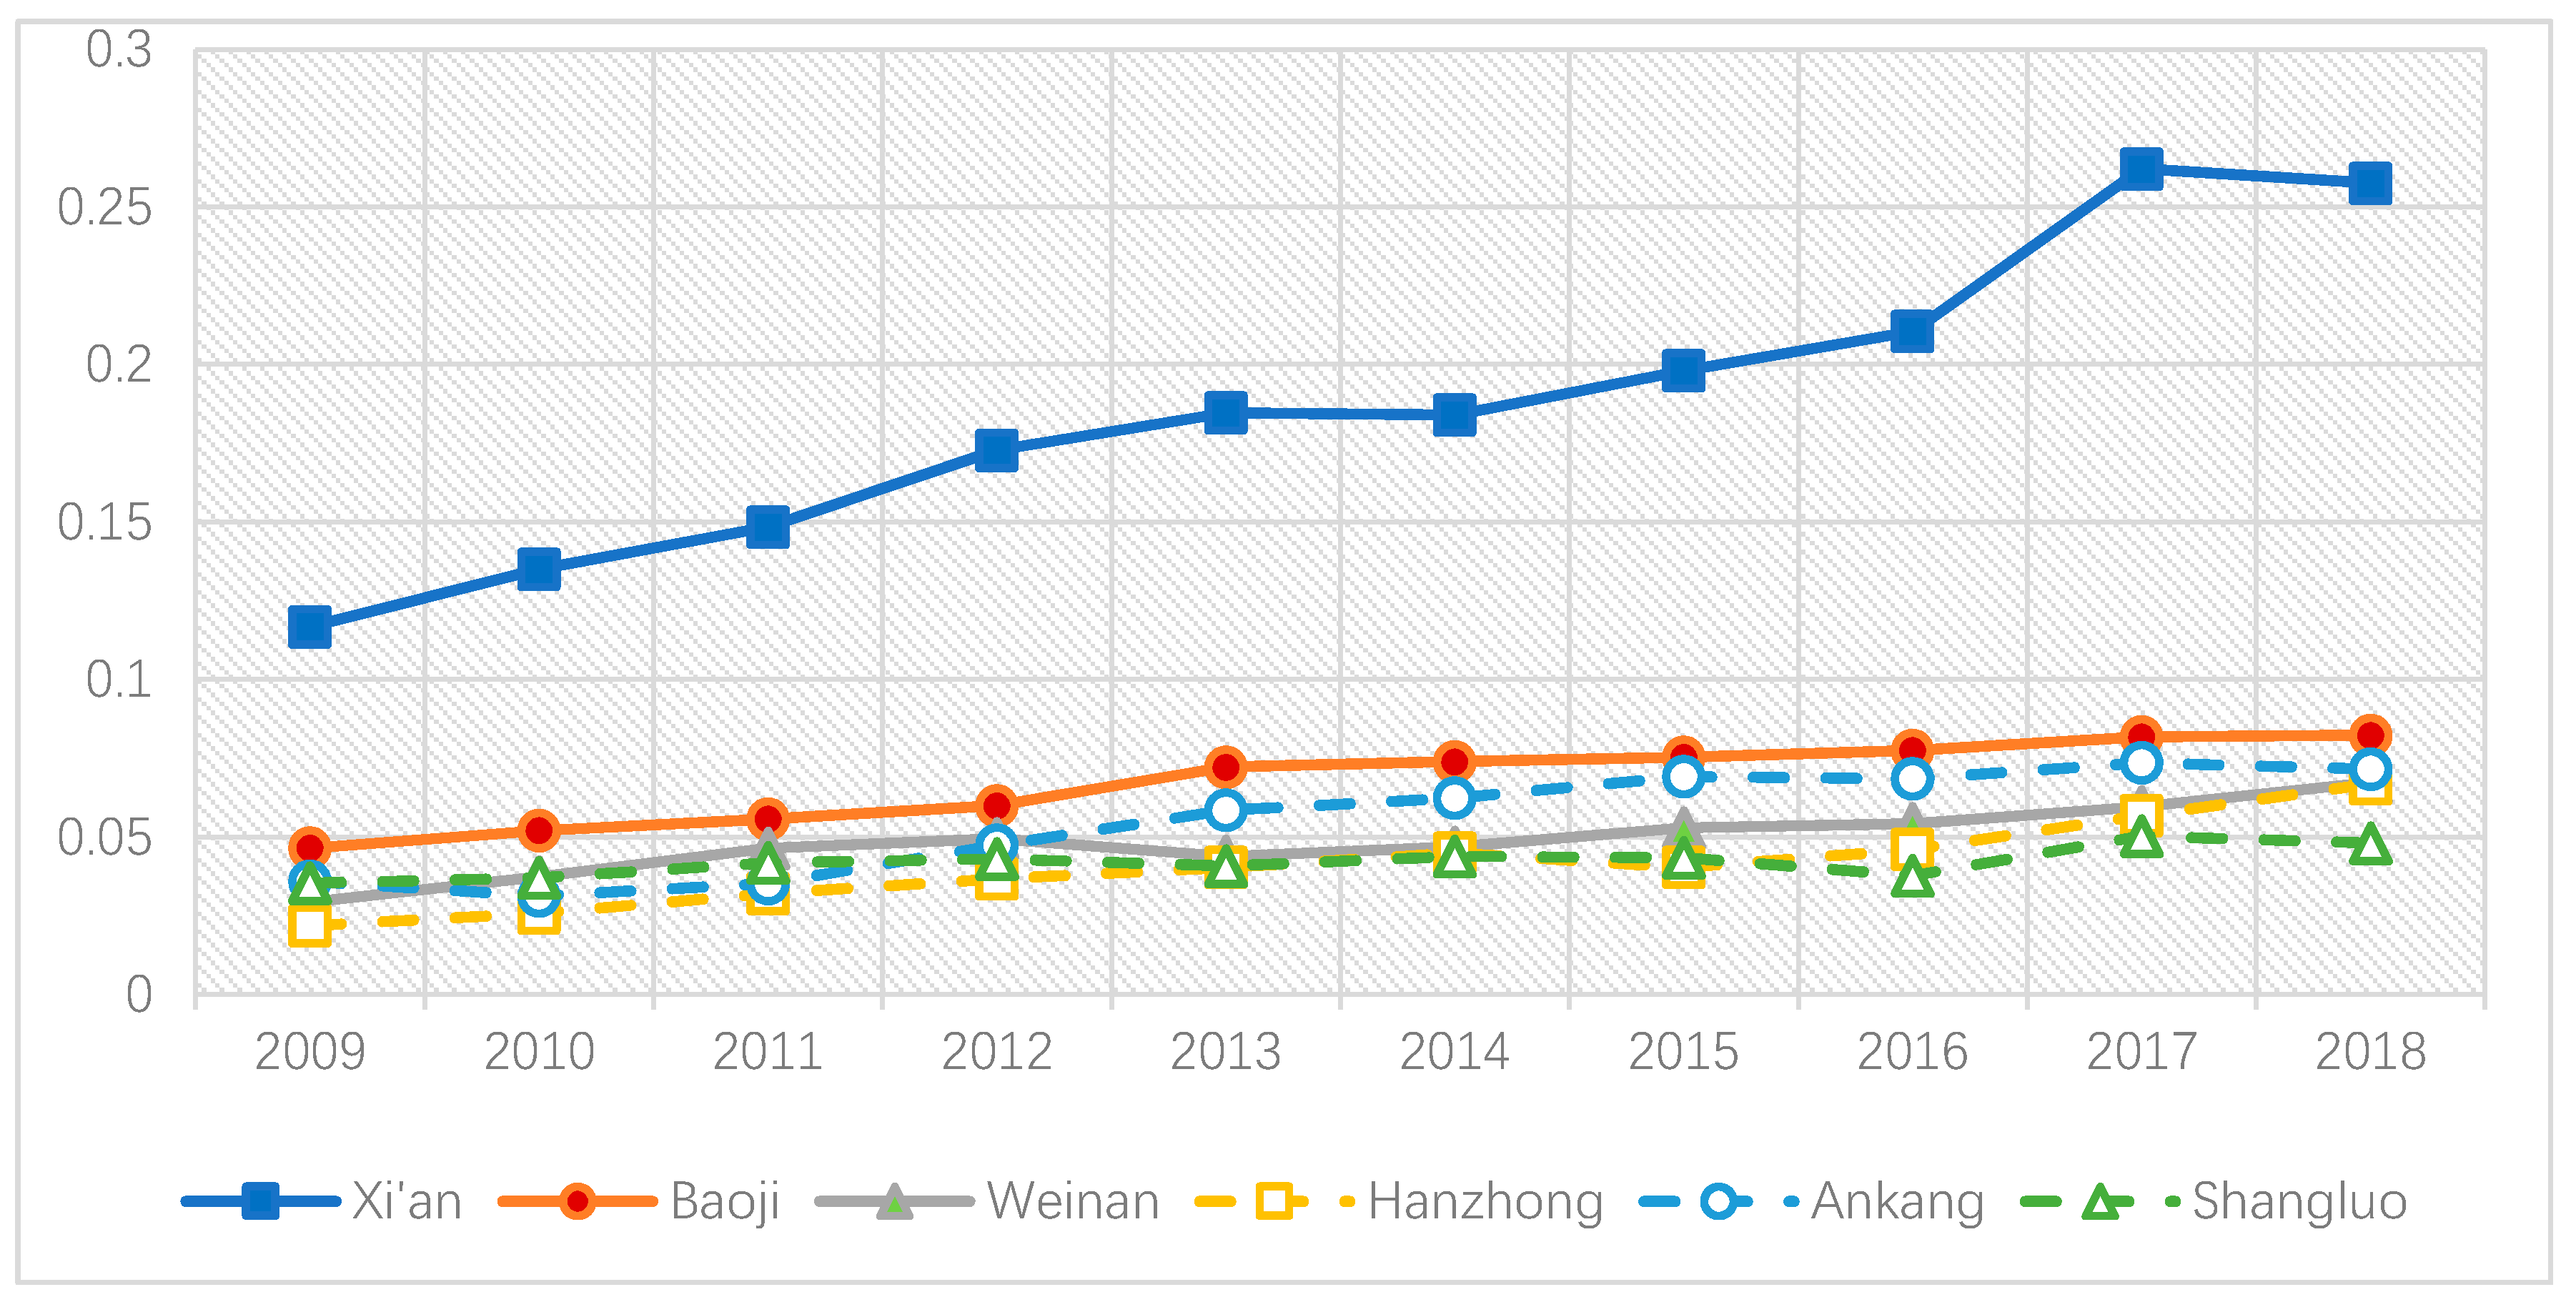
4.3. The State Index Analyzation
The state (S) of the urban sustainable development is shocked by the urban developing pressure (P) and maintained by the urban government managing response. Figure 5 shows that with the downward pressure on urban sustainable development, the state of sustainable development in all six cities is on the rise, indicating that the living environment and ecological environment of urban residents have been significantly improved. In particular, Xi’an is the capital city of Shaanxi Province, and its value of state (S) is significantly higher than that of the other five cities whit the average state index value is 0.1870, and the other five cities are 0.0677 (Baoji), 0.0488 (Weinan), 0.0413 (Hanzhong), 0.0554 (Ankang), 0.0422 (Shangluo), indicating that the sustainable development status of Xi’an is more advantageous than that of the other five cities. From the perspective of urban agglomeration, the Guanzhong city agglomeration (total state index value is 0.3035) is better than the Shannan city agglomeration (0.1389).
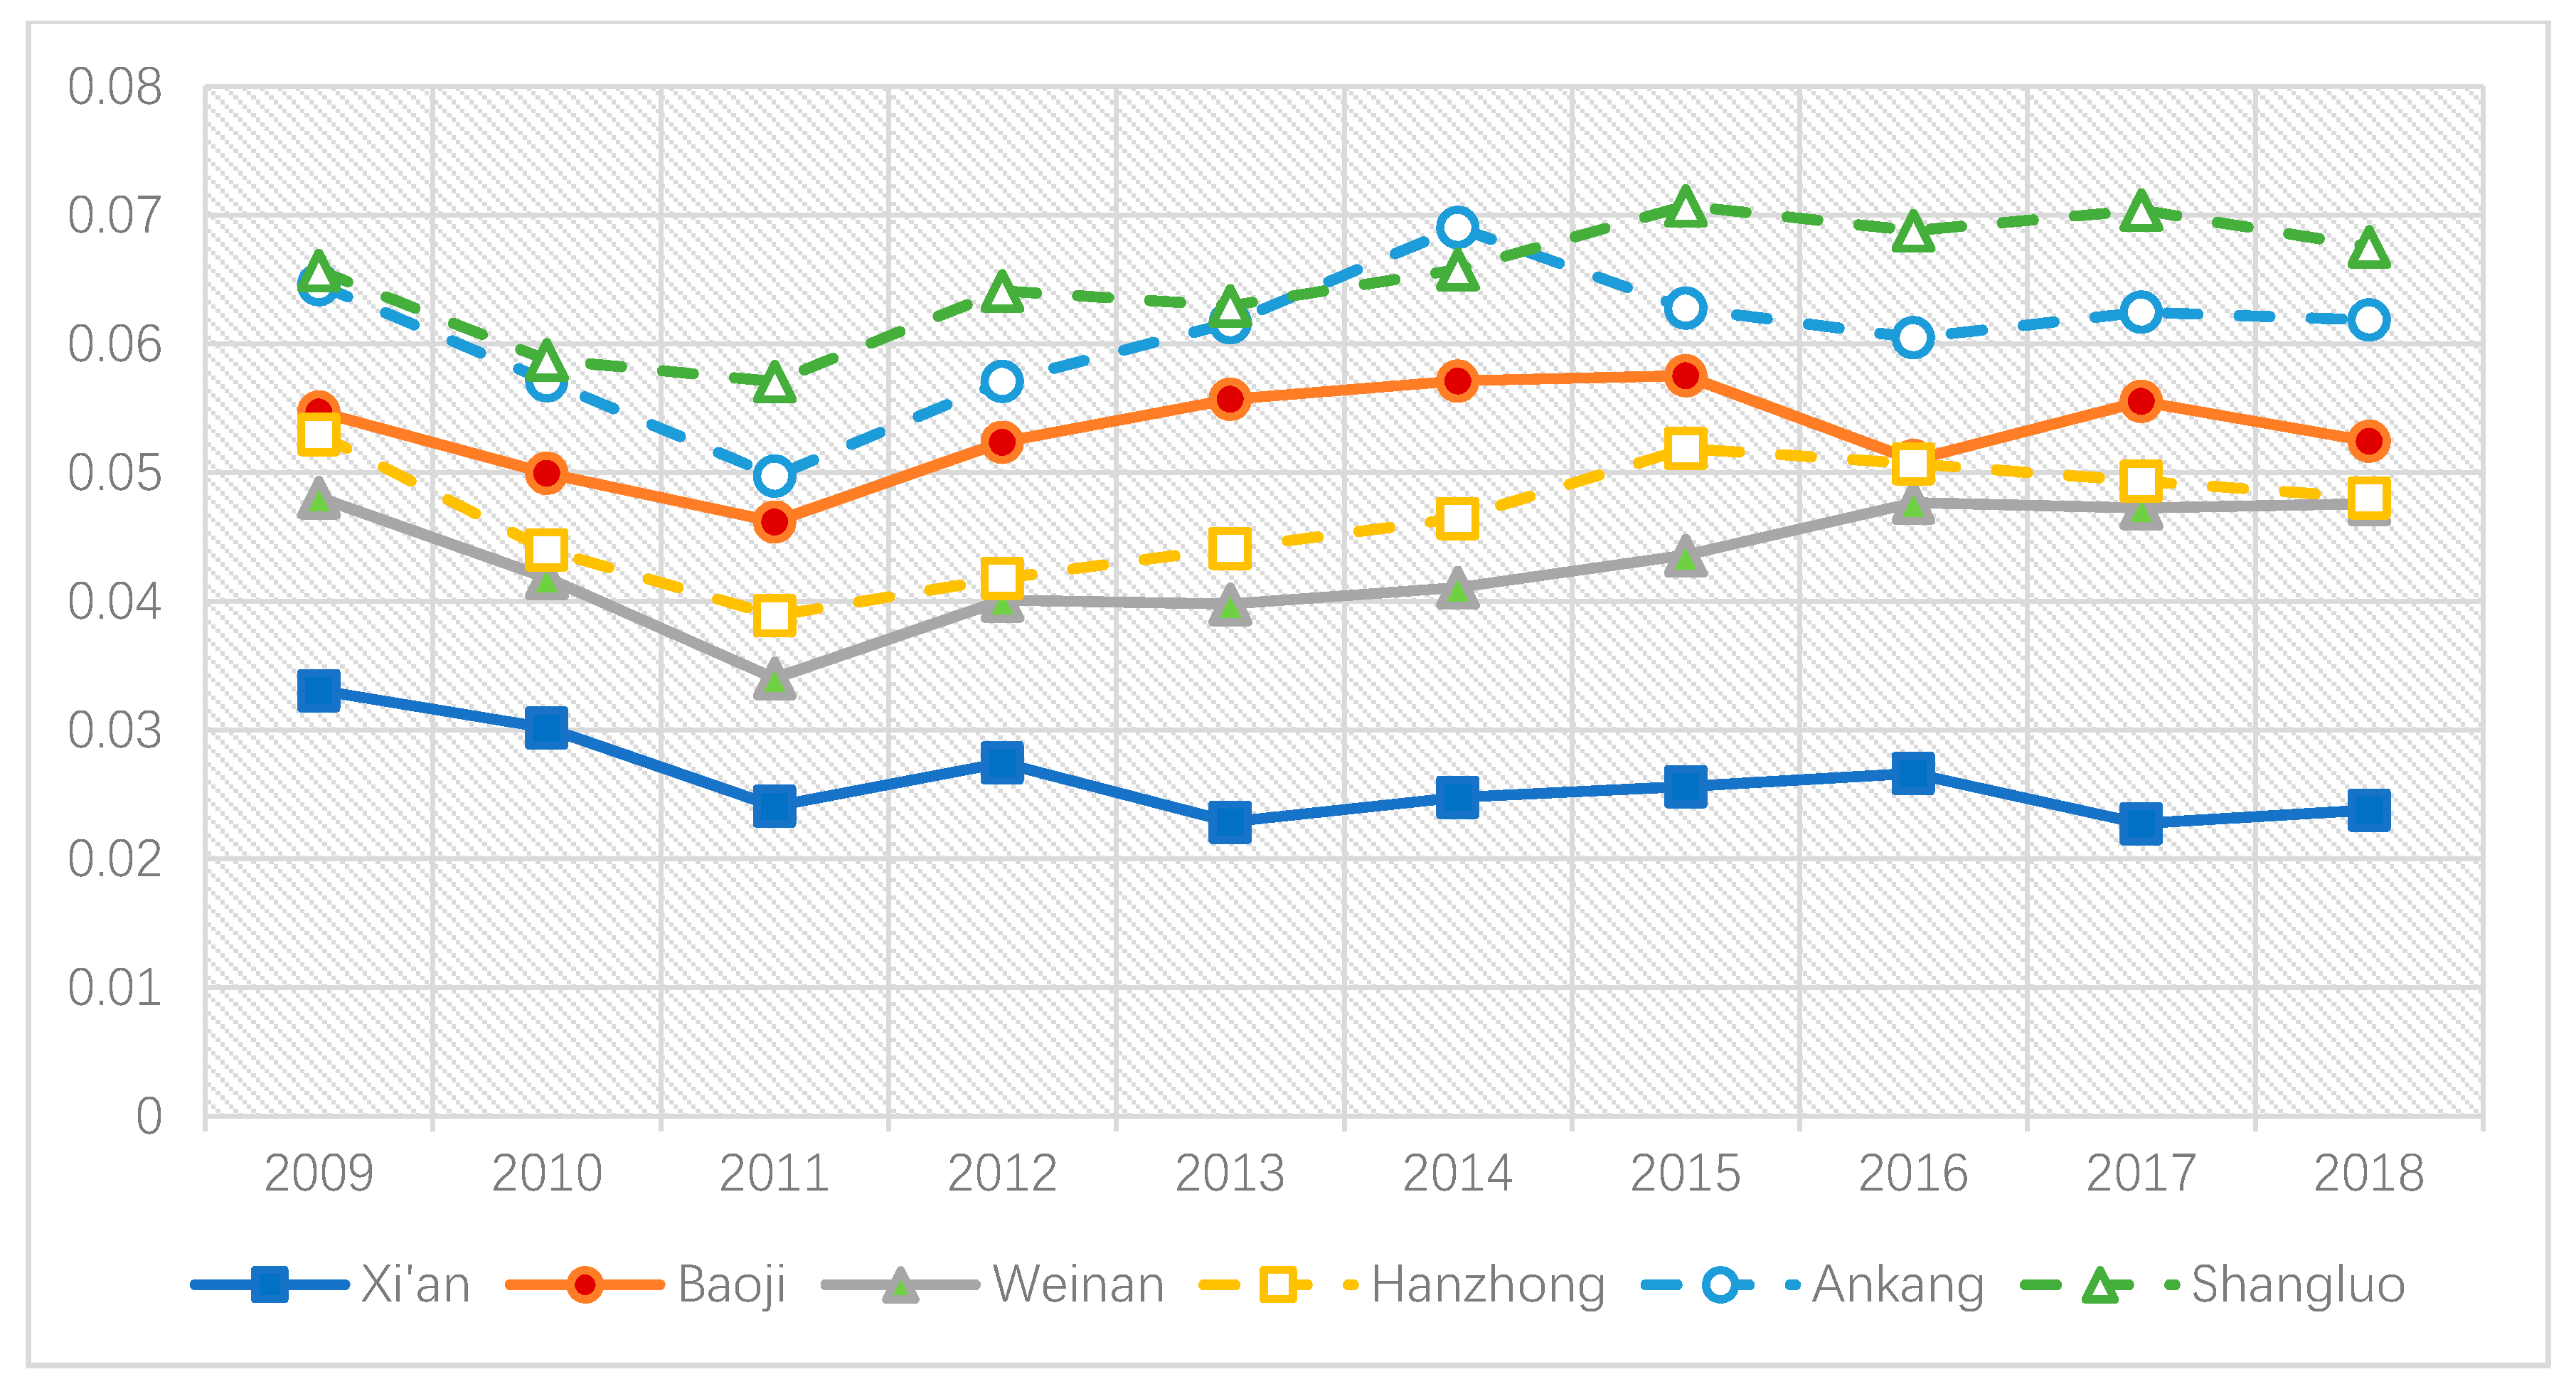
4.4. The Impact Index Analyzation
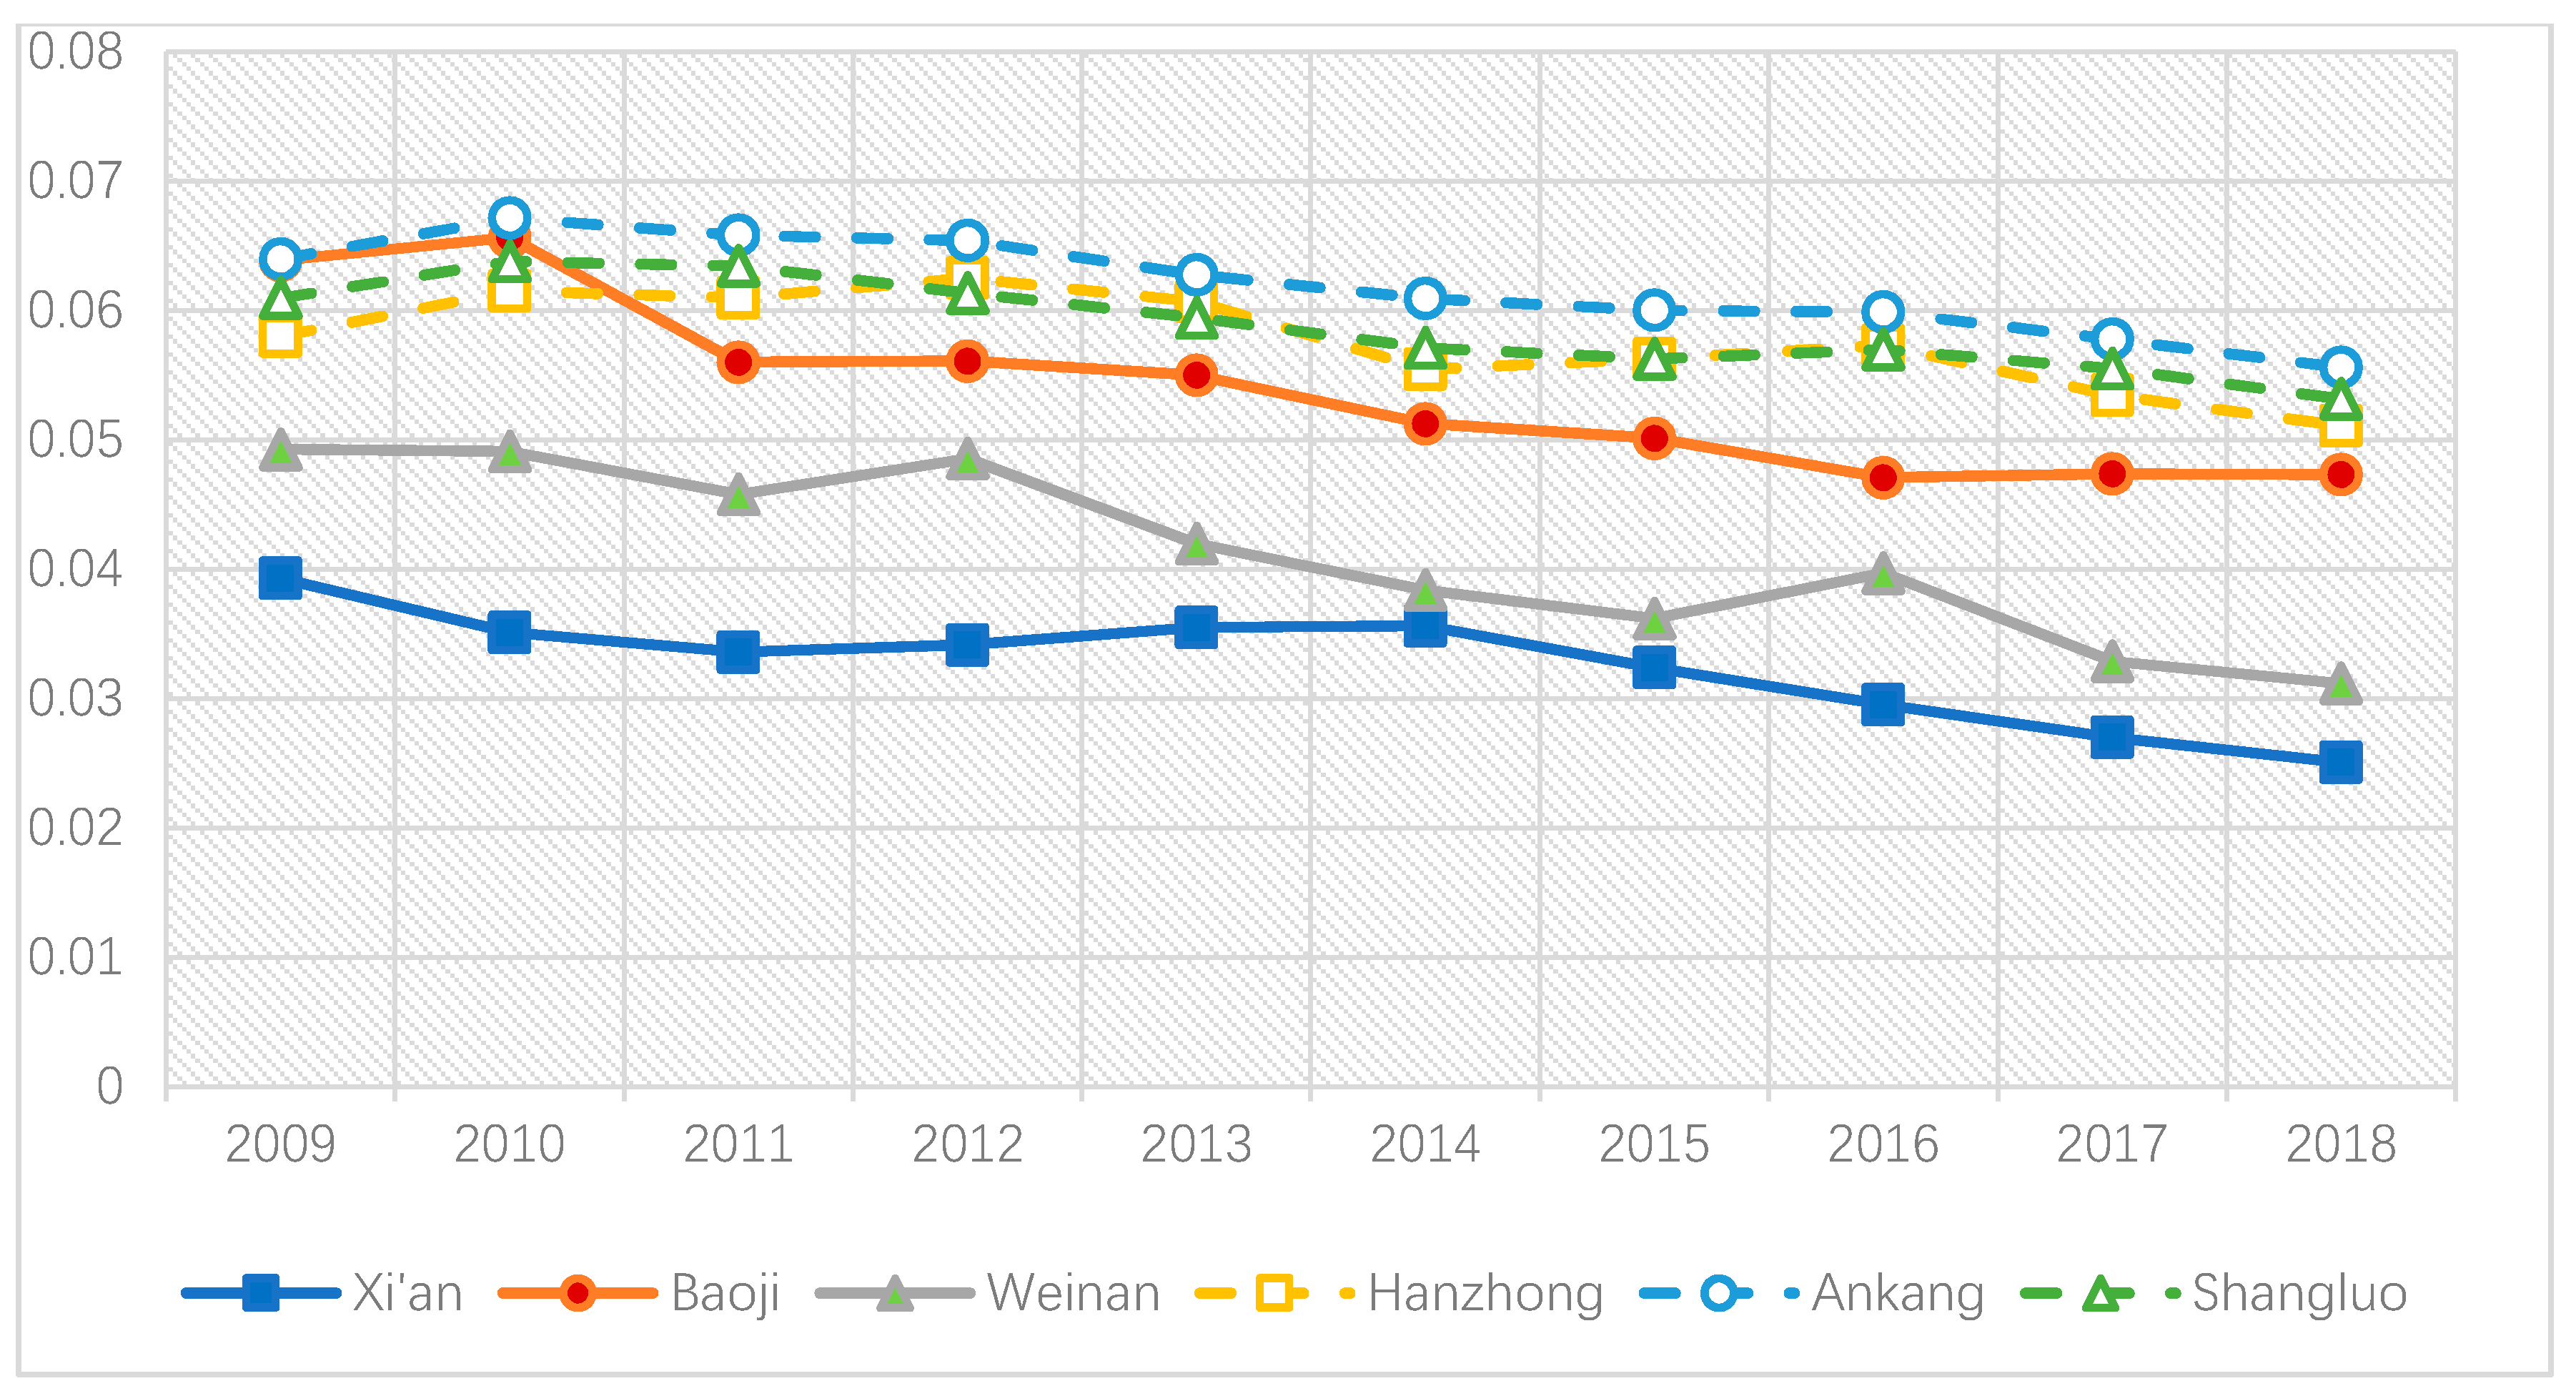
The impact factor of urban sustainable development is induced by the state of urban sustainability and is the driving force of the urban sustainable response factor. Figure 6 shows that the impact index (I) of Xi’an sustainable development was in a downward trend (from 0.0331 to 0.0238), which indicates that with the continuous optimization of urban governance and industrial structure, Xi’an’s energy consumption and developing impact on the environment gradually decreased. In the other five cities, the impact of urban sustainable development declined in 2011, then increased between 2014 and 2015, and then began to decline again. This shows that the five cities affected by China’s Five-Year plan, at the beginning of Period II, with the focus on urban industrial structure adjustment, the cities paid attention to energy conservation, emissions reduction, energy consumption, and more stringent environmental pollution control; however, with the development of the economy, the consumer price index, urban energy consumption, and environmental degradation trend rise somewhat but leveled off in 2015. This shows that during Period III, China paid more attention to the management of urban environmental quality and energy consumption, which ensured the control of urban development’s impact on society, economy, and natural environment.
4.5. The Response Index Analyzation
The city government management response (R), driven by the impact factor (I), improved the city’s economic development policy, blocked the urban development pressure (P), adjusted the shock of pressure (P) on the state (S) of urban development, and maintained the state (S) of urban development. Figure 7 shows the city’s response capability and trend under the DPSIR model. Overall, the governance and responsiveness of Xi’an city are much higher than the other five cities, with the average response index value 0.2958 compared to 0.0748 (Baoji), 0.0799 (Weinan), 0.0737 (Hanzhong), 0.0772 (Ankang), and 0.0483 (Shangluo). The urban response-ability also increased year by year; however, there is a large fluctuation in 2017 (response index value is 0.2728) because of the Qinling Mountains ecological land grab problems, which cost the government a lot of money in terms of ecological reparation and biodiversity restoration, which directly affected the response factor of sustainable development. Then, with the great improvement of ecological and environmental management in 2018, the response capacity of the city returned to normal and showed a rising trend. Compared with Xi’an, the response index (R) of the other five cities tends to be stable; however, it is worth pointing out that, with the attention on Qinling Mountain environmental protection, Hanzhong city—most of the city is located in the Qinling Mountain area—started to increase its investment into urban ecological management, environmental protection, and urban pollution control. The response factor also shows a rising trend in the year of 2017 and 2018.
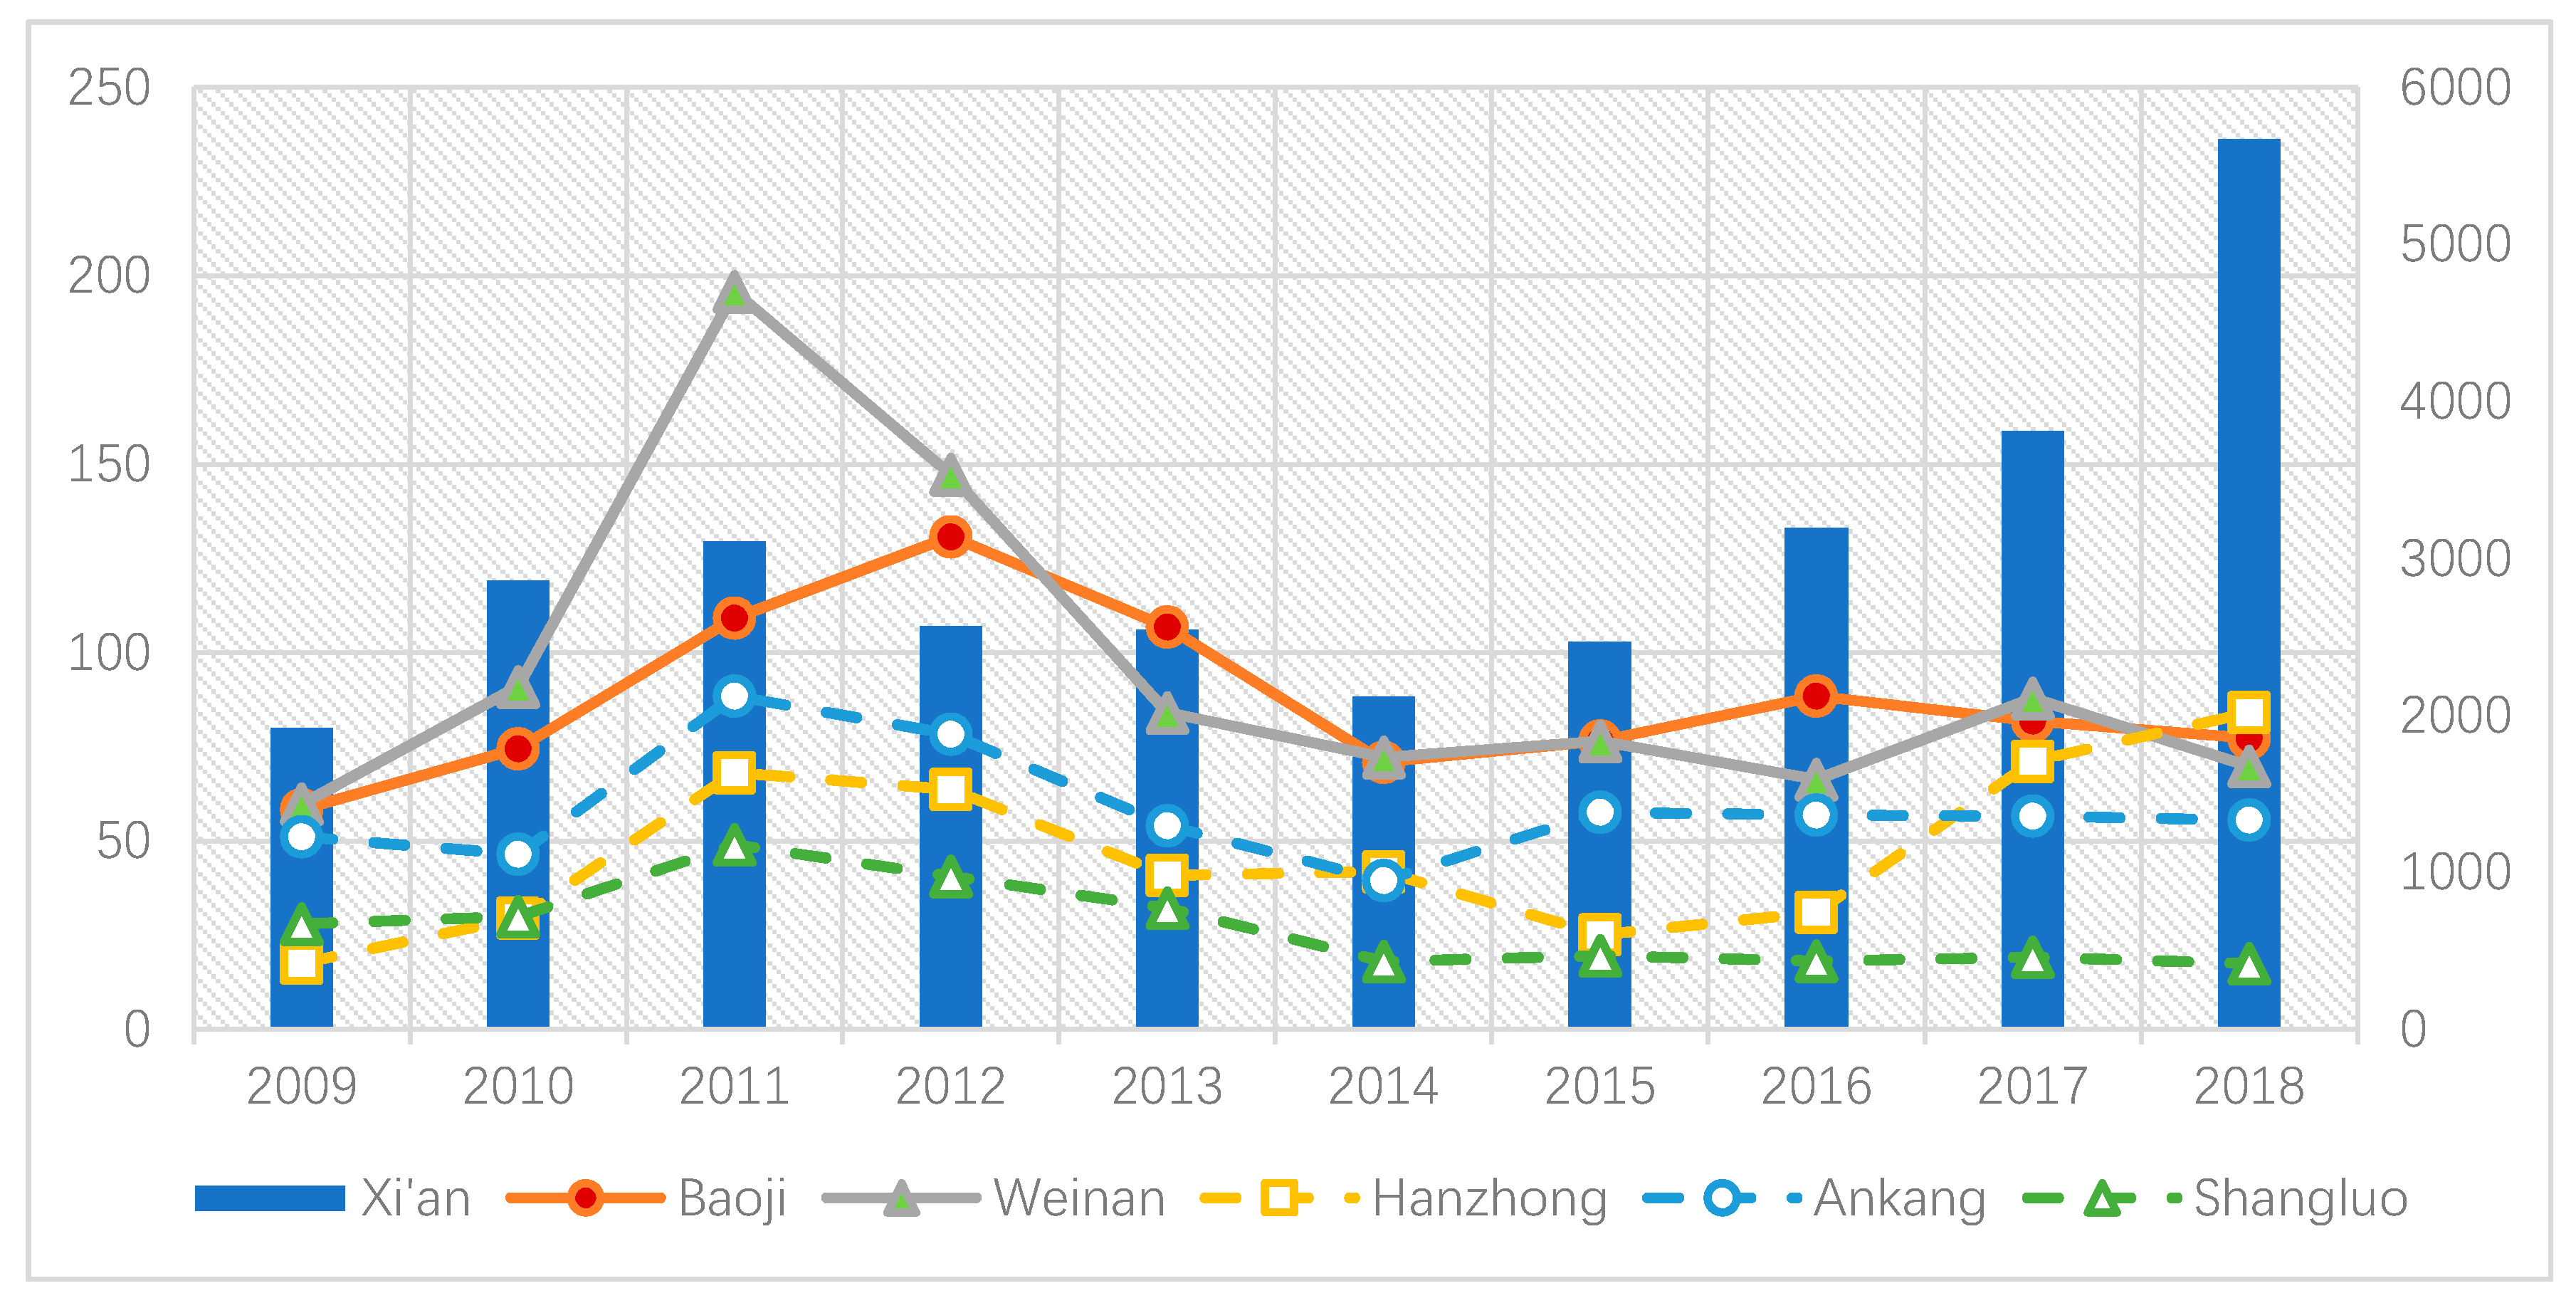
4.6. The Sustainable Development Index (SDI) Analyzation
Figure 8 shows the sustainable development index of the six cities, which is calculated according to Equation (6). The SDI of Xi’an SDI is much higher than the other five cities, with a value from 1921.21 (2009) to 5670.72 (2018), while the SDI values of the other five cities are all below 200. It illustrates an extremely unbalanced sustainable development in Shaanxi Province, i.e., that the sustainability of the capital city is far higher than the surrounding cities.
From the perspective of annual change, the six cities all peaked around 2011 and 2012 and showed a significant downward trend in 2014. Except for Xi’an and Hanzhong city, the sustainability of the other four cities was stable. This shows that between the end of Period I and the beginning of Period II, driven by the policy of industrial transformation, the government invested a large amount of money in environmental improvement, energy conservation, emission reduction, and industrial structure optimization, which greatly improved the sustainability of urban development; however, due to the pressure of economic development, urban sustainability gradually began to decline. During Period III, urban sustainability tended to develop steadily.
There is a significant difference in development strategies between the Guanzhong and Shannan city agglomerations. The Guanzhong city agglomerations, including Xi’an Baoji and Weinan, are the economic center of Shaanxi Province, so these cities focused on economic development. On the other hand, the Shannan city agglomerations are the environmental protection area of Shaanxi Province with a large area of mountain forest and grassland of the Qinling Mountains close to the cities. Figure 8 shows that for the investment in the urban environmental protection and urban facilities improvement, Xi’an, as the core city of Guanzhong city agglomerations, achieved urban sustainability during Period III. Meanwhile, as the core city of Shannan city agglomerations, Hanzhong city, with the goal of urban ecological development, urban sustainability was also achieved based on the environmental protection and industrial structure adjustment.
5. The Discussions of the Urban Sustainability
5.1. The Impact of China’s National Development Plans and Strategies on Urban Sustainability
The sustainable development of urban cities is greatly influenced by China’s national economic development plans and urban development strategies, and new adjustments are made every five years. For example, during Period I (2005–2010), China’s main economic policy was rapid growth; however, the rapid economic growth brought numerous environmental problems. So, during Period II (2011–2015), China paid great attention to industrial adjustment and steady economic growth. With significant achievements in industrial restructuring, China established the ideology of ecological civilization during Period III (2016–2020), the sustainable development theory was widely accepted by the city government and the UN SDGs were known by the authorities. Through the analysis of DPSIR factors of urban sustainable development in this paper, it is not difficult to find that: in each initial stage of the national economic period (2010, 2011, 2015, and 2016), there was a strong stimulating effect on the economy; the sustainable development index (SDI), including internal D, P, I, and R factors, improved significantly; however, at the end of each stage of the national economic period (2008, 2009, 2013, 2014, 2017, and 2018), all factors showed a downward trend. This demonstrates the far-reaching influence of national policies on urban sustainable development.
5.2. The Promotion of the Urban Sustainability in Shaanxi Province
The economic development and management level of authorities can greatly promote the sustainability of the urban city. By comparing the sustainability of six cities in Shaanxi Province, it can be found that Guanzhong city agglomerations have a well-developed economic foundation and great government investment in urban development. Figure 8 shows that the overall sustainability of Guanzhong city agglomerations is higher than that of the Shannan city agglomerations, especially in the response factor (R) analysis in the DPSIR model, which can directly reflect the city’s economic response-ability and implementation of sustainable urban development (Figure 7 shows Xi’an’s good economic foundation and higher government investment, and also obtained a higher the response-ability than other five cities.
5.3. The Imbalance Development of the Six Cities in Shaanxi Province
The urban sustainability of six cities in Shaanxi Province has shown a great imbalance. Shaanxi Province is a relatively developed province in western China; however, there is a gap between Shaanxi Province and other provinces. Xi’an, as the capital city of Shaanxi Province, has been among the best cities in China in terms of its economic development speed and industrial advantages. According to official data, Xi’an has been included in China’s new first-tier cities list for three consecutive years. This indicates that although the overall economic development level of Shaanxi province is not high, Xi’an has a prominent social and economic development level. Through the analysis of urban sustainability, the urban development of Shaanxi province has a significant imbalance. This will bring adverse factors to the sustainable development of the region for the large concentration of resources and the imbalance of economic development.
5.4. The Restrictions of the Urban Sustainability in Shaanxi Province
Compared with the Guanzhong urban agglomeration, the Shannan urban agglomeration is subject to the policy needs of environmental protection in the Qinling mountain area, its economic development is restricted and urban sustainability is relatively low. Figure 1 shows that the six cities studied in this paper are distributed on both the north and south sides of the Qinling Mountains. On the south side of the Qingling Mountains, most of the cities are located in the Qinling Mountains area; however, on the north side of the Qinling Mountains, besides Baoji city is located in the Qinling Mountains, there is only a small part of an urban area directly related to the Qinling Mountains. Under the guidance of China’s Qinling ecological protection policy, there is a big difference in urban development strategies between Guanzhong and Shannan urban agglomeration, including urban positioning, economic development potential, and urban infrastructure construction. The industrial structure of Shannan agglomeration is inclined to agriculture, light industry, and modern service industry with low energy consumption and pollution.
Due to the limited financial revenue of the government, investment is at a relatively low level each year, which directly leads to low sustainability. In contrast, the Guanzhong agglomeration on the north side of the Qinling Mountains has a large buffer zone between the urban and mountain area. The urban economic development is not restricted by the environmental protection policies of the Qinling Mountains, and the industrial structure is relatively reasonable. With the rise of the high-tech industry and cultural industry, Xi’an has brought more economic radiation effect on Guanzhong agglomeration, and the cities will have a broad market prospect, which directly affects the urban sustainability.
6. Conclusions
This study introduced the DPSIR model to evaluate the urban sustainability by analyzing the law of interannual changes of the drive-pressure-state-impact-response and sustainable development index of the six cities in Shaanxi Province in 2009–2018. The main impact factors and problems of urban sustainable development in the six cities were discussed, aimed to find out the restricting factors to improve the ability of urban sustainable management from the change law of SDI, and built a strong data base and framework to help the urban authorities making the decision to improve the urban sustainability level. The study showed that the DPSIR model which is a quantitative and objective method can be widely used in the field of urban sustainability evaluation work. This method could not only assess the urban sustainability level but also reveal the inherent law of the urban sustainable development by analyzing the relationship between each DPSIR indicators.
The results showed that the urban sustainable development was a complex system problem. As the rapid upward trend of urban socio-economy and population development, the urban government changed their developing strategies from resource-exporting to resource-conserving in Shaanxi Province, which lead to an overall downward trend of pressure index (P). The sustainable status (S) were greatly influenced by the government response in city investment and management. The China’s Five-Year plan effect the urban sustainable impact factors (I) and the different level of urban sustainable response (R) can be directly evaluated by DPSIR model. The higher level of urban management and economic investment, the stronger the city’s response ability will be. As mentioned in the discussion chapter, the conflicts between environmental protection and economic development made the two agglomerations show a different level of economic and investment, and made the regional sustainability appear to have a great imbalance. These implied that the urban sustainability improvement should not only emphasize ecological and environmental protection, but also pay more attention to sustainable economic development and improvement of government management ability.
Due to the resource’s limitation, population growth, and environment protection needs, all Chinese cities are facing the challenges of sustainable development. The theoretical and data analysis implications of this study are presented to assist in addressing these challenges and to support policies and initiatives that move cities in China towards achieving SDG-G11. Therefore, this study contributes to the theory of sustainable development by adopting the SDGs index on the city level and adopts the dynamic mechanism of the DPSIR model to figure out the relationship between each indicator under the SDGs-G11 framework. The main purpose of this study is for the government to adjust the economic development and environmental protection policy by using the data analyzation.
In this paper we also have some limitations. For example, it is difficult to grade the analysis results, such as the sustainable development index (SDI) and each indicator in the DPSIR model, because the six cities that we chose have a significant gap in the economic basis. Meanwhile, the correlation analysis of each indicator in DPSIR model still lacks a strong mathematical method to verify the validity of the dynamic mechanism. For the future studies, by using some more reliable analyzation tools, more cases can be chosen via comparing a large number of cities in a same economic level. We can also evaluate the regional sustainability in different levels, not only the city level, but also the agglomeration and regional level.
Author Contributions
Conceptualization, S.L.; methodology, S.L.; software, B.X.; validation, B.X.; formal analysis, S.L.; investigation, S.L. and H.Z.; resources, S.L.; data curation, S.L.; writing—original draft preparation, S.L.; writing—review and editing, P.D. and H.Z.; visualization, B.X.; supervision, J.G.; project administration, S.L. and J.G.; funding acquisition, S.L. and J.G. All authors have read and agreed to the published version of the manuscript.
Funding
This research received the key project of natural science foundation of China: “Evaluation of The Sustainability of China’s Urban Agglomerations Supported by Remote Sensing Products and Network Big Data” (41601459).
Conflicts of Interest
The authors declare no conflict of interest.
References
- Raszkowski, A.; Bartniczak, B. On the road to sustainability: Implementation of the 2030 agenda sustainable development goals (SDG) in Poland. Sustainability 2019, 11, 366. [Google Scholar] [CrossRef] [Green Version]
- Salvia, A.L.; Leal, W.; Brandli, L.L.; Griebeler, J.S. Assessing research trends related to Sustainable Development Goals: Local and global issues. J. Clean. Prod. 2019, 208, 841–849. [Google Scholar] [CrossRef] [Green Version]
- United Nations Department of Economic and Social Affairs, World Urbanization Prospects: The 2014 Revision. Available online: https://www.un.org/en/development/desa/publications/2014-revision-world-urbanization-prospects.html (accessed on 21 August 2020).
- Miao, L.; Zhu, F.; He, B.; Ferrat, M.; Liu, Q.; Cao, X.; Cui, X. Synthesis of China’s land use in the past 300 years. Glob. Planet Chang. 2013, 100, 224–233. [Google Scholar] [CrossRef] [Green Version]
- The World Bank Urban Development Report. Available online: https://www.worldbank.org/en/topic/urbandevelopment/overview. (accessed on 21 August 2020).
- The World Bank. Open Data for Sustainable Development; The World Bank: Washington, DC, USA, 2015. [Google Scholar]
- Creutzig, F.; Baiocchi, G.; Bierkandt, R.; Pichler, P.P.; Seto, K.C. A global typology of urban energy use and potentials for an urbanization mitigation wedge. Proc. Natl. Acad. Sci. USA 2015, 112, 6283–6288. [Google Scholar] [CrossRef] [PubMed] [Green Version]
- Xu, J.C.; Bai, J.J.; Chen, J. An Improved Indicator System for Evaluating the Progress of Sustainable Development Goals (SDGs) Sub-Target 9.1 in County Level. Sustainability 2019, 11, 4783. [Google Scholar] [CrossRef] [Green Version]
- Xu, X.; Gao, J.; Zhang, Z.; Fu, J. An Assessment of Chinese Pathways to Implement the UN Sustainable Development Goal-11 (SDG-11)-A Case Study of the Yangtze River Delta Urban Agglomeration. Int. J. Environ. Res. Public Health 2019, 16, 2288. [Google Scholar] [CrossRef] [Green Version]
- Koch, F.; Ahmad, S. How to Measure Progress towards an Inclusive, Safe, Resilient and Sustainable City? Reflections on Applying the Indicators of Sustainable Development Goal 11 in Germany and India. In Urban Transformations; Springer: Cham, Switzerland, 2018; pp. 77–90. [Google Scholar]
- Song, J. Goal 11: Sustainable city and communities. In Sustainable Development Goals in the Republic of Korea; Routledge: London, UK, 2018; Volume 3, pp. 110–137. [Google Scholar]
- Simon, D.; Arfvidsson, H.; Anand, G.; Bazaz, A.; Fenna, G.; Foster, K.; Jain, G.; Hansson, S.; Evans, L.M.; Moodley, N.; et al. Developing and testing the Urban Sustainable Development Goal’s targets and indicators—A five-city study. Environ. Urban 2016, 28, 49–63. [Google Scholar] [CrossRef]
- Raheem, U.A. Understanding the spatial context of sustainable urban health in Africa for the SDGs: Some lessons from the corridors of deprivation in Ilorin, Nigeria. Afr. Geogr. Rev. 2017, 36, 216–235. [Google Scholar] [CrossRef]
- Gao, L.; Bryan, B.A. Finding pathways to national-scale land-sector sustainability. Nature 2017, 544, 217–222. [Google Scholar] [CrossRef]
- Cai, W.; Gibbs, D.; Zhang, L.; Ferrier, G.; Cai, Y. Identifying hotspots and management of critical ecosystem services in rapidly urbanizing YRD Region, China. J. Environ. Manag. 2017, 191, 258–267. [Google Scholar] [CrossRef]
- Arslan, T.V.; Durak, S.; Aytac, D.O. Attaining SDG11: Can sustainability assessment tools be used for improved transformation of neighborhoods in historic city centers? In Natural Resources Forum; Blackwell Publishing Ltd.: Oxford, UK, 2016; Volume 40, pp. 180–202. [Google Scholar]
- Klopp, J.M.; Petretta, D.L. The urban sustainable development goal: Indicators, complexity and the politics of measuring cities. Cities 2017, 63, 92–97. [Google Scholar] [CrossRef]
- Stafford-Smith, M.; Griggs, D.; Gaffney, O.; Ullah, F.; Reyers, B.; Kanie, N.; Stigson, B.; Shrivastava, P.; Leach, M.; O’Connell, D. Integration: The key to implementing the Sustainable Development Goals. Sustain. Sci. 2017, 12, 911–919. [Google Scholar] [CrossRef] [PubMed] [Green Version]
- Almeidai, A.C.L.; Smarti, J.C.R.; Daveyi, P. Can Learned Experiences Accelerate the Implementation of Sustainable Development Goal 11? A Framework to Evaluate the Contributions of Local Sustainable Initiatives to delivery SDG 11 in Brazilian Municipalities. Eur. J. Sustain. Dev. 2018, 7, 517–530. [Google Scholar] [CrossRef] [Green Version]
- Wei, Y. Integrating Sustainable Development Goals into the Belt and Road Initiative: Would It Be a New Model for Green and Sustainable Investment? Sustainability 2019, 11, 6991. [Google Scholar]
- Liu, W.; Dunford, M. Inclusive globalization: Unpacking China’s Belt and Road Initiative. Area Dev. Policy 2016, 1, 323. [Google Scholar] [CrossRef]
- Ting, G.; Ke, M.; Wei, L.; Lan, X. Public Attitudes toward Sustainable Development Goals: Evidence from Five Chinese Cities. Sustainability 2019, 11, 5793. [Google Scholar]
- China Statistical Press. Shaanxi Provincial Bureau of Statistics: Statistical Yearbook of Shaanxi Province 2010–2019; China Statistical Press: Beijing, China, 2010–2019. [Google Scholar]
- China Statistical Press. Xi’an Bureau of Statistics: Statistical Yearbook of Xi’an 2010–2019; China Statistical Press: Beijing, China, 2010–2019. [Google Scholar]
- Nagy, J.A.; Benedek, J.; Ivan, K. Measuring Sustainable Development Goals at a Local Level: A Case of a Metropolitan Area in Romania. Sustainability 2018, 10, 3962. [Google Scholar] [CrossRef] [Green Version]
- Foresight Industry Research Institute. A Comparative Analysis Report on the Development of China’s New First-Tier Cities in 2020. Available online: https://bg.qianzhan.com/report/detail/2002181425221478.html#read (accessed on 11 August 2020).
- Jago-on, K.A.B.; Kaneko, S.; Fujikura, R.; Fujiwara, A.; Imai, T.; Matsumoto, T.; Zhang, J.; Tanikawa, H.; Tanaka, K.; Lee, B. Urbanization and subsurface environmental issues: An attempt at DPSIR model application in Asian cities. Sci. Total Environ. 2009, 407, 3089–3104. [Google Scholar] [CrossRef]
- Gari, S.R.; Newton, A.; Icely, J.D. A review of the application and evolution of the DPSIR framework with an emphasis on coastal social-ecological systems. Ocean Coast. Manag. 2015, 23, 63–77. [Google Scholar] [CrossRef] [Green Version]
- Rogers, S.; Greenaway, B.A. UK perspective on the development of marine ecosystem indicators. Mar. Pollut. Bull. 2005, 50, 9–19. [Google Scholar] [CrossRef]
- Borja, A.; Galparsoro, I.; Solaun, O.; Muxika, I.; Tello, E.M.; Uriarte, A.; Valencia, V. The European Water Framework Directive and the DPSIR, a methodological approach to assess the risk of failing to achieve good ecological status. Estuar. Coast Shelf Sci. 2006, 66, 84–96. [Google Scholar] [CrossRef]
- Sekovski, I.; Newton, A.; Dennison, W.C. Megacities in the coastal zone: Using a driver-pressure-state-impact-response framework to address complex environmental problems. Estuar. Coast Shelf Sci. 2012, 96, 48–59. [Google Scholar] [CrossRef]
- Liu, X.; Liu, H.T.; Chen, J.C.; Liu, T.W.; Deng, Z.L. Evaluating the sustainability of marine industrial parks based on the DPSIR framework. J. Clean. Prod. 2018, 188, 158–170. [Google Scholar] [CrossRef]
- Fry, I. United nations environment programme, global environmental outlook 3. Rev. Eur. Comp. Int. Environ. Law 2003, 12, 120. [Google Scholar]
- Bidone, E.; Lacerda, L. The use of DPSIR framework to evaluate sustainability in coastal areas. Case study: Guanabara Bay basin, Rio de Janeiro, Brazil. Reg. Environ. Chang. 2004, 4, 5–16. [Google Scholar] [CrossRef]
- Board, M.A. Millennium Ecosystem Assessment, 13th ed.; New Island: Washington, DC, USA, 2005; p. 120. [Google Scholar]
- Shi, S.X.; Tong, P.S. Evaluation system and spatial distribution pattern of ecological city construction—Based on DPSIR-TOPSIS model. Appl. Ecol. Environ. Res. 2019, 17, 601–616. [Google Scholar] [CrossRef]
- Mell, I. The impact of austerity on funding green infrastructure: A DPSIR evaluation of the Liverpool Green & Open Space Review (LG&OSR), UK. Land Use Policy. 2020, 91, 1–12. [Google Scholar]
- Dijk, M.; de Kraker, J.; van Zeijl-Rozema, A.; van Lente, H.; Beumer, C.; Beemsterboer, S.; Valkering, P. Sustainability assessment as problem structuring: Three typical ways. Sustain. Sci. 2017, 12, 305–317. [Google Scholar] [CrossRef]
- Ness, B.; Urbel-Piirsalu, E.; Anderberg, S.; Olsson, L. Categorising tools for sustainability assessment. Ecol. Econ. 2007, 60, 498–508. [Google Scholar] [CrossRef]
- Shen, L.Y.; Ochoa, J.J.; Shah, M.N.; Zhang, X.L. The application of urban sustainability indicators e a comparison between various practices. Habitat Int. 2010, 35, 17–29. [Google Scholar] [CrossRef]
- Chen, Y.B.; Chen, J.H.; Li, C.X.; Feng, Z.Y. Indicators for Resources Carrying Capacity Assessment Based on Driving Forces-Pressure-State-Impact-Response Model. J. Hydraul. Eng. 2004, 7, 98–103. [Google Scholar]
- Xu, M.; Zhu, X.; Li, J.Z. Evaluation of Land Ecological Security in Human Province Based on DPSIR-TOPSIS Model. J. Glaciol. Geocryol. 2012, 34, 1265–1271. [Google Scholar]
- Yan, L.; Wang, J.K.; Huang, H. An Assessment of Ecosystem Health in Dongxi River Basin Based on PSR Framework. Resour. Sci. 2008, 30, 107–113. [Google Scholar]
- Liu, W.X.; Sun, C.Z.; Zhao, M.J.; Wu, Y.J. Application of a DPSIR Modeling Framework to Assess Spatial-Temporal Differences of Water Poverty in China. J. Am. Water Resour. Assoc. 2019, 55, 259–273. [Google Scholar] [CrossRef] [Green Version]
- Zhu, J.; Tang, Z.; Liu, X. Evaluation of Low-carbon City Development Based on DPSIR Model: A Case Study of Jiyuan City. Urban Issues 2012, 12, 42–47. [Google Scholar]
- Zhao, Z.; Li, P.; Yang, Y.; Wu, X.; Guo, Z. Study on the ecological health evaluation of a geopark based on DPSIR conceptual model—Illustrated by the qianjiang xiaonanhai national geopark of China. Appl. Ecol. Environ. Res. 2018, 16, 3839–3859. [Google Scholar] [CrossRef]
- Shi, S.; Chen, Q. Evaluation of Ecological Civilization Construction in Fujian Province Based on DPSIR Model. J. Fujian Agric. For. Univ. 2015, 18, 45–51. [Google Scholar]
- Zhang, J.Q.; Yi, K.P.; Tani, H.; Wang, X.F.; Tong, Z.J.; Liu, X.P. Ecological security assessment of Baishan City in Jilin Province based on DPSIR. Chin. J. Appl. Ecol. 2011, 22, 189–195. [Google Scholar]
Figure 1.
The six cities in Shaanxi Province.

Figure 2.
The mechanism of the Drive-Pressure-State-Impact-Response model (DPSIR) model application in urban sustainability research.
Figure 2.
The mechanism of the Drive-Pressure-State-Impact-Response model (DPSIR) model application in urban sustainability research.

Figure 3.
The change of driving index of the six cities from 2009 to 2018.

Figure 4.
The change of pressure index of the six cities from 2009 to 2018.

Figure 5.
The change of the state index of the six cities from 2009 to 2018.

Figure 6.
The change of impact index of the six cities from 2009 to 2018.

Figure 7.
The change of response index of the six cities from 2009 to 2018.

Figure 8.
The sustainable development index of six cities from 2009 to 2018 *. * The X-axis value on the right side represents the sustainable development index (SDI) value of Xi’an city.
Figure 8.
The sustainable development index of six cities from 2009 to 2018 *. * The X-axis value on the right side represents the sustainable development index (SDI) value of Xi’an city.


Table 1.
The annual data of energy consumption and environmental pollution.
| 2009 | 2012 | 2015 | 2018 | |
|---|---|---|---|---|
| Annual electricity consumption (100 million kWh) | 740.11 | 1066.75 | 1221.73 | 1744.24 |
| Annual water consumption (100 million tons) | 85.46 | 88.04 | 91.16 | 92.99 |
| Production of industrial solid waste (10,000 tons) | 6136.86 | 7215.11 | 9329.65 | 10,080.70 |
| Industrial wastewater discharge (10,000 tons) | 104,329.30 | 128,748.59 | 168,121.98 | 175,954.54 |
| Industrial SO2 exhaust emissions (10,000 tons) | 88.94 | 84.40 | 73.50 | 27.93 |
Data resources: Shaanxi Provincial Bureau of Statistics: Statistical Yearbook of Shaanxi Province 2010–2019, China Statistical Press: Beijing, China [23].
Table 2.
The indicators of the sustainability evaluation framework based on the DPSIR model.
| Criterion Layer | Indicator Layer | Relevant Indicators in Sustainable Development Goals (SDGs)-G11 | Explanation |
|---|---|---|---|
| Driving Factor | Natural population growth rate (‰) | ||
| GPD annual growth rate (%) | |||
| Urbanization rate (%) | Indicator 11.1.1 Percentage of urban population living in slums or informal settlements | This indicator can be explained from the urbanization rate | |
| Pressure Factor | Population density (person/km2) | Indicator 11.b.2 Population density measured over the continuous urban footprint | |
| Economic density * (10,000yuan/km2) | |||
| Population unemployment rate (%) | |||
| Population aging rate (%) | |||
| Production of industrial solid waste (10,000 tons) | |||
| Industrial wastewater discharge (10,000 tons) | |||
| Industrial exhaust emissions (100 million cubic meters) | |||
| Annual traffic accidents and fire casualties | Indicator 11.5.1 Number of people killed, injured, displaced, evacuated, relocated or otherwise affected by disasters | ||
| Impact Factor | The urban land index ** | Indicator 11.3.1 Ratio of land consumption rate to population growth rate at a comparable scale | |
| Annual average PM 10 | Indicator 11.6.2 Level of ambient particulate matter (PM 10 and PM 2.5) | ||
| Energy consumption per unit GDP (ton standard coal/10,000yuan) | |||
| Annual electricity consumption of urban and rural residents (10,000kWh) | |||
| Annual power consumption of the industry (10,000kWh) | |||
| Annual water consumption (100 million m3) | |||
| Annual average noise pollution | |||
| Consumer price index (%) | |||
| The standard passenger volume of buses (10,000 people/vehicles) | Indicator 11.2.1 Percentage of people living within 0.5 km of public transit in cities with more than 500,000 inhabitants | Urban public transportation capacity | |
| Status Factor | Housing area per capita (m2/person) | ||
| Urban road area per capita (m2/person) | |||
| Number of city parks | Indicator 11.4.1 Percentage of the budget provided for maintaining the cultural and natural heritage | Most of Shaanxi city parks have landscape resources related to history and culture | |
| Park green area per capita | Indicator 11.7.2 Proportion of residents within 0.5 km of accessible green and public space | ||
| Urban landscaping rate | Indicator 11.7.1 Area of public space as a proportion of total city space | This paper restricts the urban residents’ public space to the public green space | |
| Per capita domestic water (L/day) | |||
| Days of good air quality throughout the year | |||
| Disposable income of urban residents | |||
| Disposable income of rural residents | |||
| Response Factor | Urban water supply capacity (10,000 m3/day) | ||
| Urban sewage treatment capacity (10,000 m3/day) | |||
| Public safety investment rate | |||
| Environmental investment rate | Indicator 11.c.1 Percentage of financial support that is allocated to the construction and retrofitting of sustainable, resilient and resource-efficient buildings | ||
| sports, education, science and technology investment rate | Indicator 11.3.2 Cities with more than 100,000 inhabitants that implement urban and regional development plans integrating population projections and resource needs | The city development plan designation is closely related to the city’s annual socio-economic development investment | |
| Social security, medical and health investment rate | |||
| The comprehensive utilization rate of industrial solid waste | Indicator 11.6.1 Percentage of urban solid waste regularly collected and recycled | ||
| Industrial wastewater treatment rate | |||
| Annual afforestation area (ha/year) | |||
| The proportion of tertiary industry (%) | |||
| Clearance of domestic garbage (10,000tons) |
* Economic density = 10,000 yuan GDP/urban area. ** Urban land index = land consumption rate/population growth rate (Technical report by the Bureau of the United Nations Statistical Commission (UNSC) on the process of the development of an indicator framework for the goals and targets of the post-2015 development agenda).
Table 3.
The weights of indicators.
| Criterion Layer | Indicator Layer | Weights | Tendency |
|---|---|---|---|
| Driving Factor | Natural population growth rate (‰) | 0.0058 | − |
| GPD annual growth rate (%) | 0.0320 | − | |
| Urbanization rate (%) | 0.0097 | − | |
| Pressure Factor | Population density (person/km2) | 0.0115 | − |
| Economic density (10,000 yuan GDP/urban area) (10,000 yuan/km2) | 0.0054 | − | |
| Population unemployment rate (%) | 0.0063 | − | |
| Population aging rate (%) | 0.0275 | − | |
| Production of industrial solid waste (10,000 tons) | 0.0091 | − | |
| Industrial wastewater discharge (10,000 tons) | 0.0089 | − | |
| Industrial exhaust emissions (100 million cubic meters) | 0.0077 | − | |
| Annual traffic accidents and fire casualties | 0.0100 | − | |
| Impact Factor | Urban land index (land consumption rate/population growth rate) | 0.0072 | − |
| Annual average PM10 | 0.0048 | − | |
| Energy consumption per unit GDP (ton standard coal/10,000 yuan) | 0.0020 | − | |
| Annual electricity consumption of urban and rural residents (10,000 kWh) | 0.0054 | − | |
| Annual power consumption of the industry (10,000 kWh) | 0.0064 | − | |
| Annual water consumption (100 million m3) | 0.0259 | − | |
| Annual average noise pollution | 0.0060 | − | |
| Consumer price index (%) | 0.0099 | − | |
| Standard passenger volume of buses (10,000 people/vehicles) | 0.0158 | − | |
| Status Factor | Housing area per capita (m2/person) | 0.0166 | + |
| Urban road area per capita (m2/person) | 0.0146 | + | |
| Number of city parks | 0.0723 | + | |
| Park green area per capita | 0.0074 | + | |
| Urban landscaping rate | 0.1195 | + | |
| Per capita domestic water (L/day) | 0.0118 | + | |
| Days of good air quality throughout the year | 0.0087 | + | |
| Disposable income of urban residents | 0.0183 | + | |
| Disposable income of rural residents | 0.0205 | + | |
| Response Factor | Urban water supply capacity (10,000 m3/day) | 0.1023 | + |
| Urban sewage treatment capacity (10,000 m3/day) | 0.0918 | + | |
| Public safety investment rate | 0.0185 | + | |
| Environmental investment rate | 0.0128 | + | |
| sports, education, science and technology investment rate | 0.0166 | + | |
| Social security, medical and health investment rate | 0.0183 | + | |
| The comprehensive utilization rate of industrial solid waste | 0.0182 | + | |
| Industrial wastewater treatment rate | 0.0606 | + | |
| Annual afforestation area (ha/year) | 0.0176 | + | |
| The proportion of tertiary industry (%) | 0.0245 | + | |
| Clearance of domestic garbage (10,000 tons) | 0.1116 | + |
“+” stands for positive indicators, “−” stands for negative indicators.
© 2020 by the authors. Licensee MDPI, Basel, Switzerland. This article is an open access article distributed under the terms and conditions of the Creative Commons Attribution (CC BY) license (http://creativecommons.org/licenses/by/4.0/).
Share and Cite
MDPI and ACS Style
Liu, S.; Ding, P.; Xue, B.; Zhu, H.; Gao, J. Urban Sustainability Evaluation Based on the DPSIR Dynamic Model: A Case Study in Shaanxi Province, China. Sustainability 2020, 12, 7460. https://0-doi-org.brum.beds.ac.uk/10.3390/su12187460
AMA Style
Liu S, Ding P, Xue B, Zhu H, Gao J. Urban Sustainability Evaluation Based on the DPSIR Dynamic Model: A Case Study in Shaanxi Province, China. Sustainability. 2020; 12(18):7460. https://0-doi-org.brum.beds.ac.uk/10.3390/su12187460
Chicago/Turabian StyleLiu, Shidong, Peiyi Ding, Binrui Xue, Hongbing Zhu, and Jun Gao. 2020. "Urban Sustainability Evaluation Based on the DPSIR Dynamic Model: A Case Study in Shaanxi Province, China" Sustainability 12, no. 18: 7460. https://0-doi-org.brum.beds.ac.uk/10.3390/su12187460
Note that from the first issue of 2016, this journal uses article numbers instead of page numbers. See further details here.