Article

Teaching Challenges in COVID-19 Scenery: Teams Platform-Based Student Satisfaction Approach

by
Leticia Rodriguez-Segura
1,†,
Marco Antonio Zamora-Antuñano
2,*,†,
Juvenal Rodriguez-Resendiz
3,†,
Wilfrido J. Paredes-García
3,†,
José Antonio Altamirano-Corro
2,† and
Miguel Ángel Cruz-Pérez
2,†
1
National Directorate of Innovation and Educational Research, Universidad del Valle de Mexico, San Juan de Dios 6, Coapa, Ex de San Juan de Dios, Tlalpan, Ciudad de Mexico 14370, CDMX, Mexico
2
Engineering Area of Universidad del Valle de Mexico, Campus Querétaro and Centro de Investigación e Innovación Tecnológica (CIIDETEC-UVM), Naranjos Punta Juriquilla 1000, Santa Rosa Jauregui, Santiago de Querétaro 76230, Mexico
3
Facultad de Ingeniería, Universidad Autónoma de Querétaro, Querétaro 76010, Mexico
*
Author to whom correspondence should be addressed.
All authors contributed equally to this work.
Sustainability 2020, 12(18), 7514; https://0-doi-org.brum.beds.ac.uk/10.3390/su12187514
Submission received: 11 June 2020 / Revised: 1 August 2020 / Accepted: 1 September 2020 / Published: 11 September 2020

Abstract

:
At the onset of the crisis caused by COVID-19, the Mexican education system chose to join the global context and suspend face-to-face classes for all educational levels. For the continuity of educational processes, a transition from a traditional educational model (face-to-face) to emergency remote teaching (ERT) was made through virtual learning platforms and learning management system (LMS) schemes. Universidad del Valle de Mexico (UVM), in a collaboration agreement with Microsoft Co., chose to use Teams to continue its educational process. In this work, we intend to identify the factors that can be taken into account regarding the level of student satisfaction in the teaching–learning process in ERT using Teams, and validate the established educational strategy. Statistical analysis was carried out to analyze the academic environment for these scenario changes while considering knowledge assessment, and competencies achievement. A combined sampling method was applied with convenience and statistical analysis. The main results established significant percentages, where more than 60% of the students surveyed were manifested in the use of the teams and the organization of the class sessions by the teachers, and the activities developed. Using the Cronbach’s Alpha coefficient, the reliability of the data collection instruments was determined. The correlations of each of the survey questions were calculated to determine the relationship between themselves and the total answers, giving results similar to those obtained through data science tools. Taking advantage of the situation, data science tools were applied to compare the results with obtained values from RapidMiner software in the correlation of factors in of 0.440, 0.384, 0.246, 0.048 and 0.384.

Graphical Abstract

1. Introduction

The number of students who do not attend schools or universities due to the COVID-19 crisis increased exponentially. Mexico was no exception due to governments around the world deciding to close educational facilities in an attempt to contain the global pandemic. According to UNESCO, there are 290 million students who now do not attend the school. Table 1 shows the number of students who stopped attending the universities and Higher Education Institutions (HEI) in Mexico.
More than 850 million children and young people, which is about half of the population of students around the world, are being kept away from schools and universities, with national closures active in 102 countries, and local closures in 11 others. This represents more than double, in four days, the number of students who were barred from attending educational facilities, and the number is expected to increase, according to UNESCO [1].
The main problem faced by higher education institutions, including UVM, was the continuity of their academic processes; hence the ERT was an alternative, and what is sought to analyze in this research is how satisfied students are with the use of Teams to continue educational processes during the COVID-19 crisis. The traditional educational model, based on masterclasses and linear teaching materials, required adapting to the demands of the knowledge society in postmodernity, hence the urgent need to carry out this research. Because of the threat of COVID-19, schools and universities faced the dilemma of how to continue teaching their courses while keeping their staff and students safe from a rapidly moving public health emergency that is not fully understood [2,3,4].
During the COVID-19 crisis, in Mexico, many of the higher education institutions have given teachers the freedom to choose the learning management system (LMS) that best suits their needs for ERT. UVM decided upon the Teams platform, with the premise of maintaining order in the execution of the process, and using the same scheme for all students. This research is intended to verify a comparison between online learning and classroom instruction in these circumstances. This work describes the characteristics of the current context in order to identify some elements that require deep reflection on teaching practices. It will consider a mandatory and forced transition for communities to use technological means involving several challenges generated by the COVID-19 crisis at the university—from traditional methods to ERT—and the impact on learning and student satisfaction. Many LMS platform options have been used by higher education institutions and their teachers to continue academic processes, and this can lead students to see the need to use multiple LMS platforms at the same time [5,6].
Unlike educational experiences which were fully designed and planned to be online, ERT responds to a sudden change in instruction to alternative models as a result of a crisis. In such circumstances, education that would usually be delivered face-to-face, or in a blended form, requires immediate remote solutions, although, when the crisis recedes, they return to the original format. The main objective in these circumstances is not to recreate a robust educational ecosystem, but rather to provide temporary access and instructional supports in a quick and easy-to-configure way. By understanding ERT in this way, it can be disassociated from online learning. Switching to ERT would require teachers to take more control over the course design, development, and implementation process, but would also require students to be responsible of their own learning process. According to Carrasco [7], totally online learning is good for mature students, who are disciplined enough to be autonomous learners, while totally face-to-face learning is useful for students who lack self-discipline and do not know how to manage their own learning. Regarding the way technology is used for education, and specifically in what is called ‘face-to-face learning’, classes should be better understood, because most UVM students use technology in the classroom. This means that a certain kind of online learning was involved prior to the ERT.
In many higher education institutions, teachers were given the freedom to select the LMS that best suited their needs, but this caused a conflict for students, since, in the process during the transition, they found the need to use more virtual platforms, making it challenging to self-learn. Hence, the UVM strategy was to establish Teams as the only virtual platform [5].
One of the main challenges is the speed with which the change to the ERT is intended to prevent quality issues of the courses. Developing a full course can take months when done correctly [8]. Therefore, classes created in these circumstances should not be accepted as a long-term alternative, but as a solution to an immediate problem. One of the issues of concern in the context of the ERT is the accessibility of academic and learning materials [9,10]. The effect of convenience is one more reason why Universal Design for Learning (UDL) should be part of all discussions on teaching and learning. UDL principles focus on designing flexible learning environments, including student-centered learning environments, on the principle of ensuring that all of them can access and learn from materials, activities and assignments [3,4].
The objective of this work is to measure the satisfaction of the students with the Teams platform. The application of data science to compare the results achieved in the descriptive study of satisfaction in the use of Teams by UVM students was obtained by applying machine learning tools, such as deep learning and neural networks, among others. By doing this, the research seeks to establish new procedures for diagnosing and improving educational practices. As a secondary objective, we intend to apply data science tools to compare the results obtained in RapidMiner with the ones obtained through statistical analysis.
This work is divided into the following sections: in Section 2, preliminary issues are presented. In Section 3, deep learning is carried out from a remote teaching platform. In Section 4 and Section 5, the results and discussion are presented, respectively. Section 6 establishes the conclusions from the study.

2. Preliminary

In directives from the Federal Government and the Governments of the States, as of 16 March 2020, it was established that schools at all levels would close their facilities in order to minimize the spread of COVID-19. Laureate Mexico, integrated by UVM and its 33 campuses, and UNITEC and its 9 campuses, with a coverage of 210,000 students at all levels and modalities, decided to join the national guidelines and continue with all their face-to-face courses in ERT. Since 2008, the use of LMS platforms has been incorporated into the learning–teaching process. The platforms used in other schools are primarily Blackboard, Moodle, and Schoology, but UVM students use the virtual platforms in 10 subjects in a 100% online mode throughout their academic training; the students take eight subjects that are taught 100% online, where students and teachers decide the type of tools that enter to the UVM. As an institutional strategy for the in-person organization of 100% online schemes, the use of the same virtual platform was chosen in order to maintain standard academic processes (e.g., activities to be developed by each of the students in all subjects) [11]. For the selection of the virtual platform, an agreement was established with Microsoft Co., which includes: the assignment of institutional mail accounts for the whole community, training in the use of Teams [12] for 100% of teachers, and the configuration of subjects and calendar sessions. Table 2, Table 3, Table 4 and Table 5 show the attributes of the leading platforms. A key aspect to consider in the selection of the platform was group communication, with Teams providing the best conditions, since it allows a higher number of users in each session, without a time limit.
In addition to the features discussed in Table 2, Table 3, Table 4 and Table 5, the most important features for the selection of Teams as the platform in the virtualization process at the UVM were video conferencing, duration time, and the number of users who could simultaneously be in a class. See Table 6 [6,13].
From 17 to 21 March, 2020, as part of the strategy, a deployment of human, material and technological resources was carried out at the UVM to provide the continuity of the school calendar and to guarantee the fulfillment of the educational programs. As was already mentioned, Teams was chosen, and achieved the necessary connectivity as an LMS with easy access, and a friendly environment and configuration.
This work deals with different aspects of the transition of a model which was using limited online learning to a 100% online model, but also with the satisfaction of the students in the handling of technological tools, the knowledge and skills achieved by students, the assessment process, and students’ willingness to use the resources as part of their teaching in their back-to-normal day-to-day through the use of learning platforms at UVM. The platform at UVM is Teams.
The instrument used to collect data from students consists in four sections:
  • General aspects: campus, educational program, school period and number of subjects being studied.
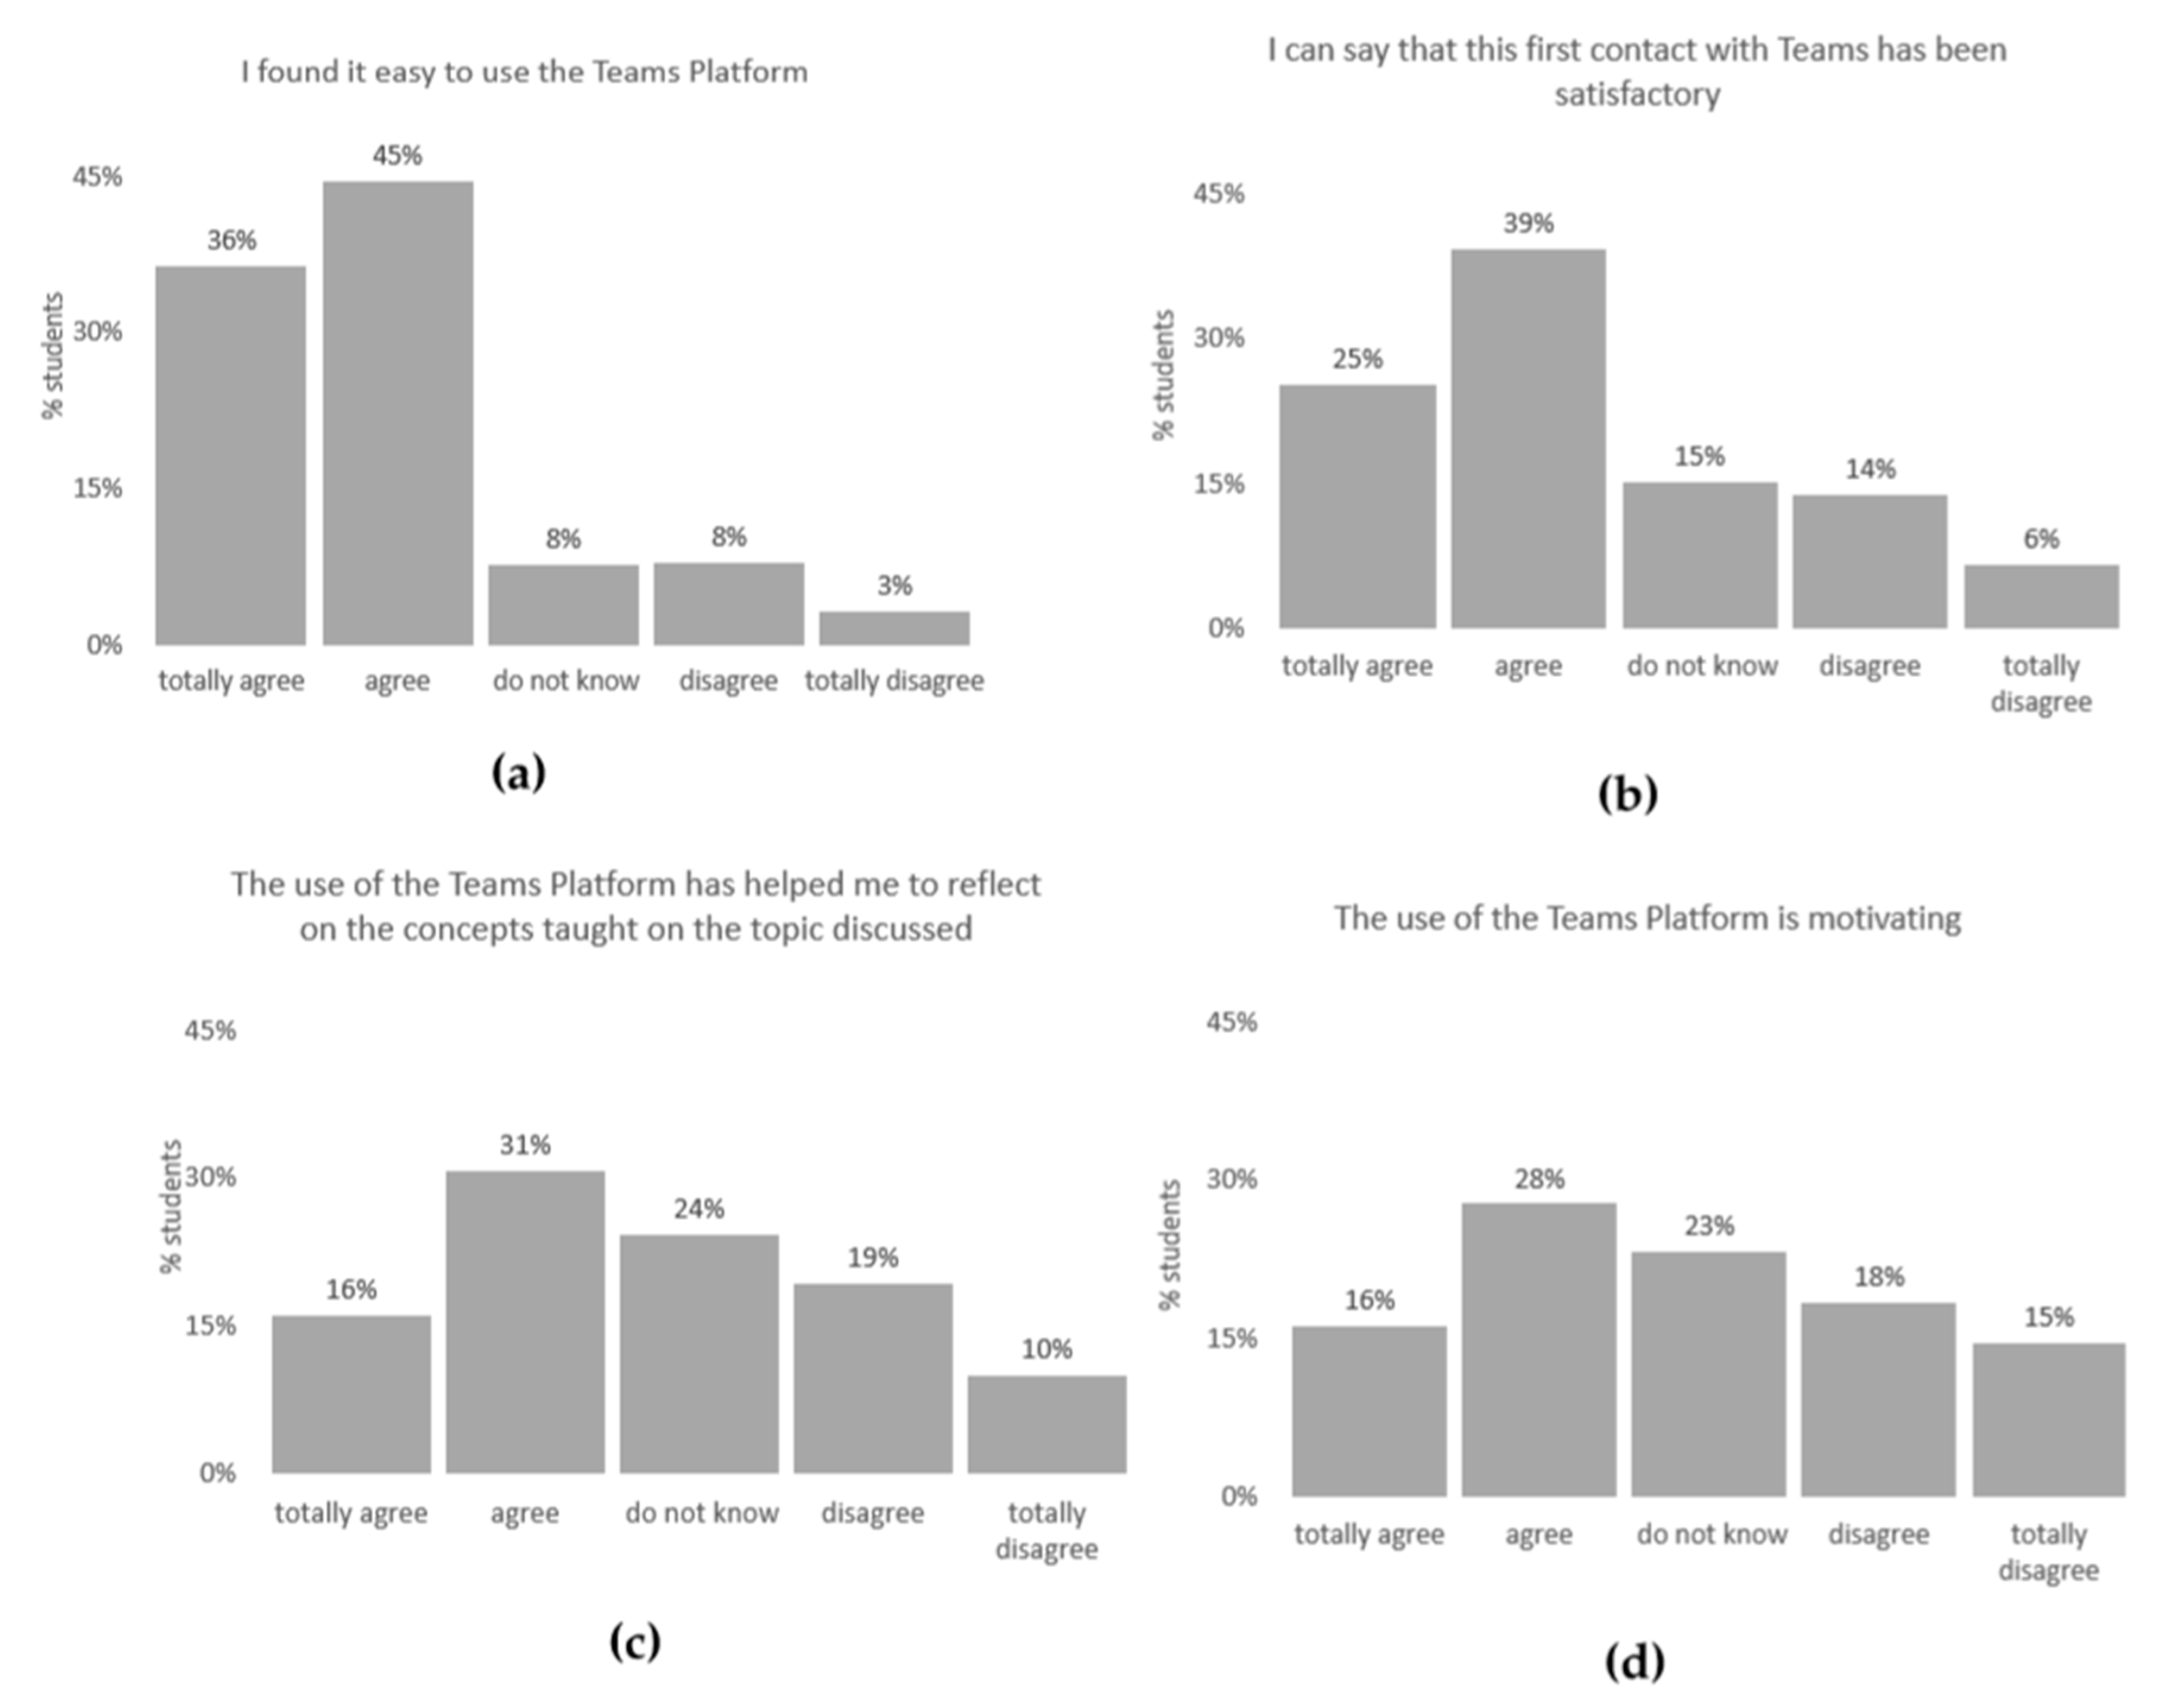
  • Satisfaction with the use of the Teams platform/ usability: four questions, with an answer item on a Likert scale.
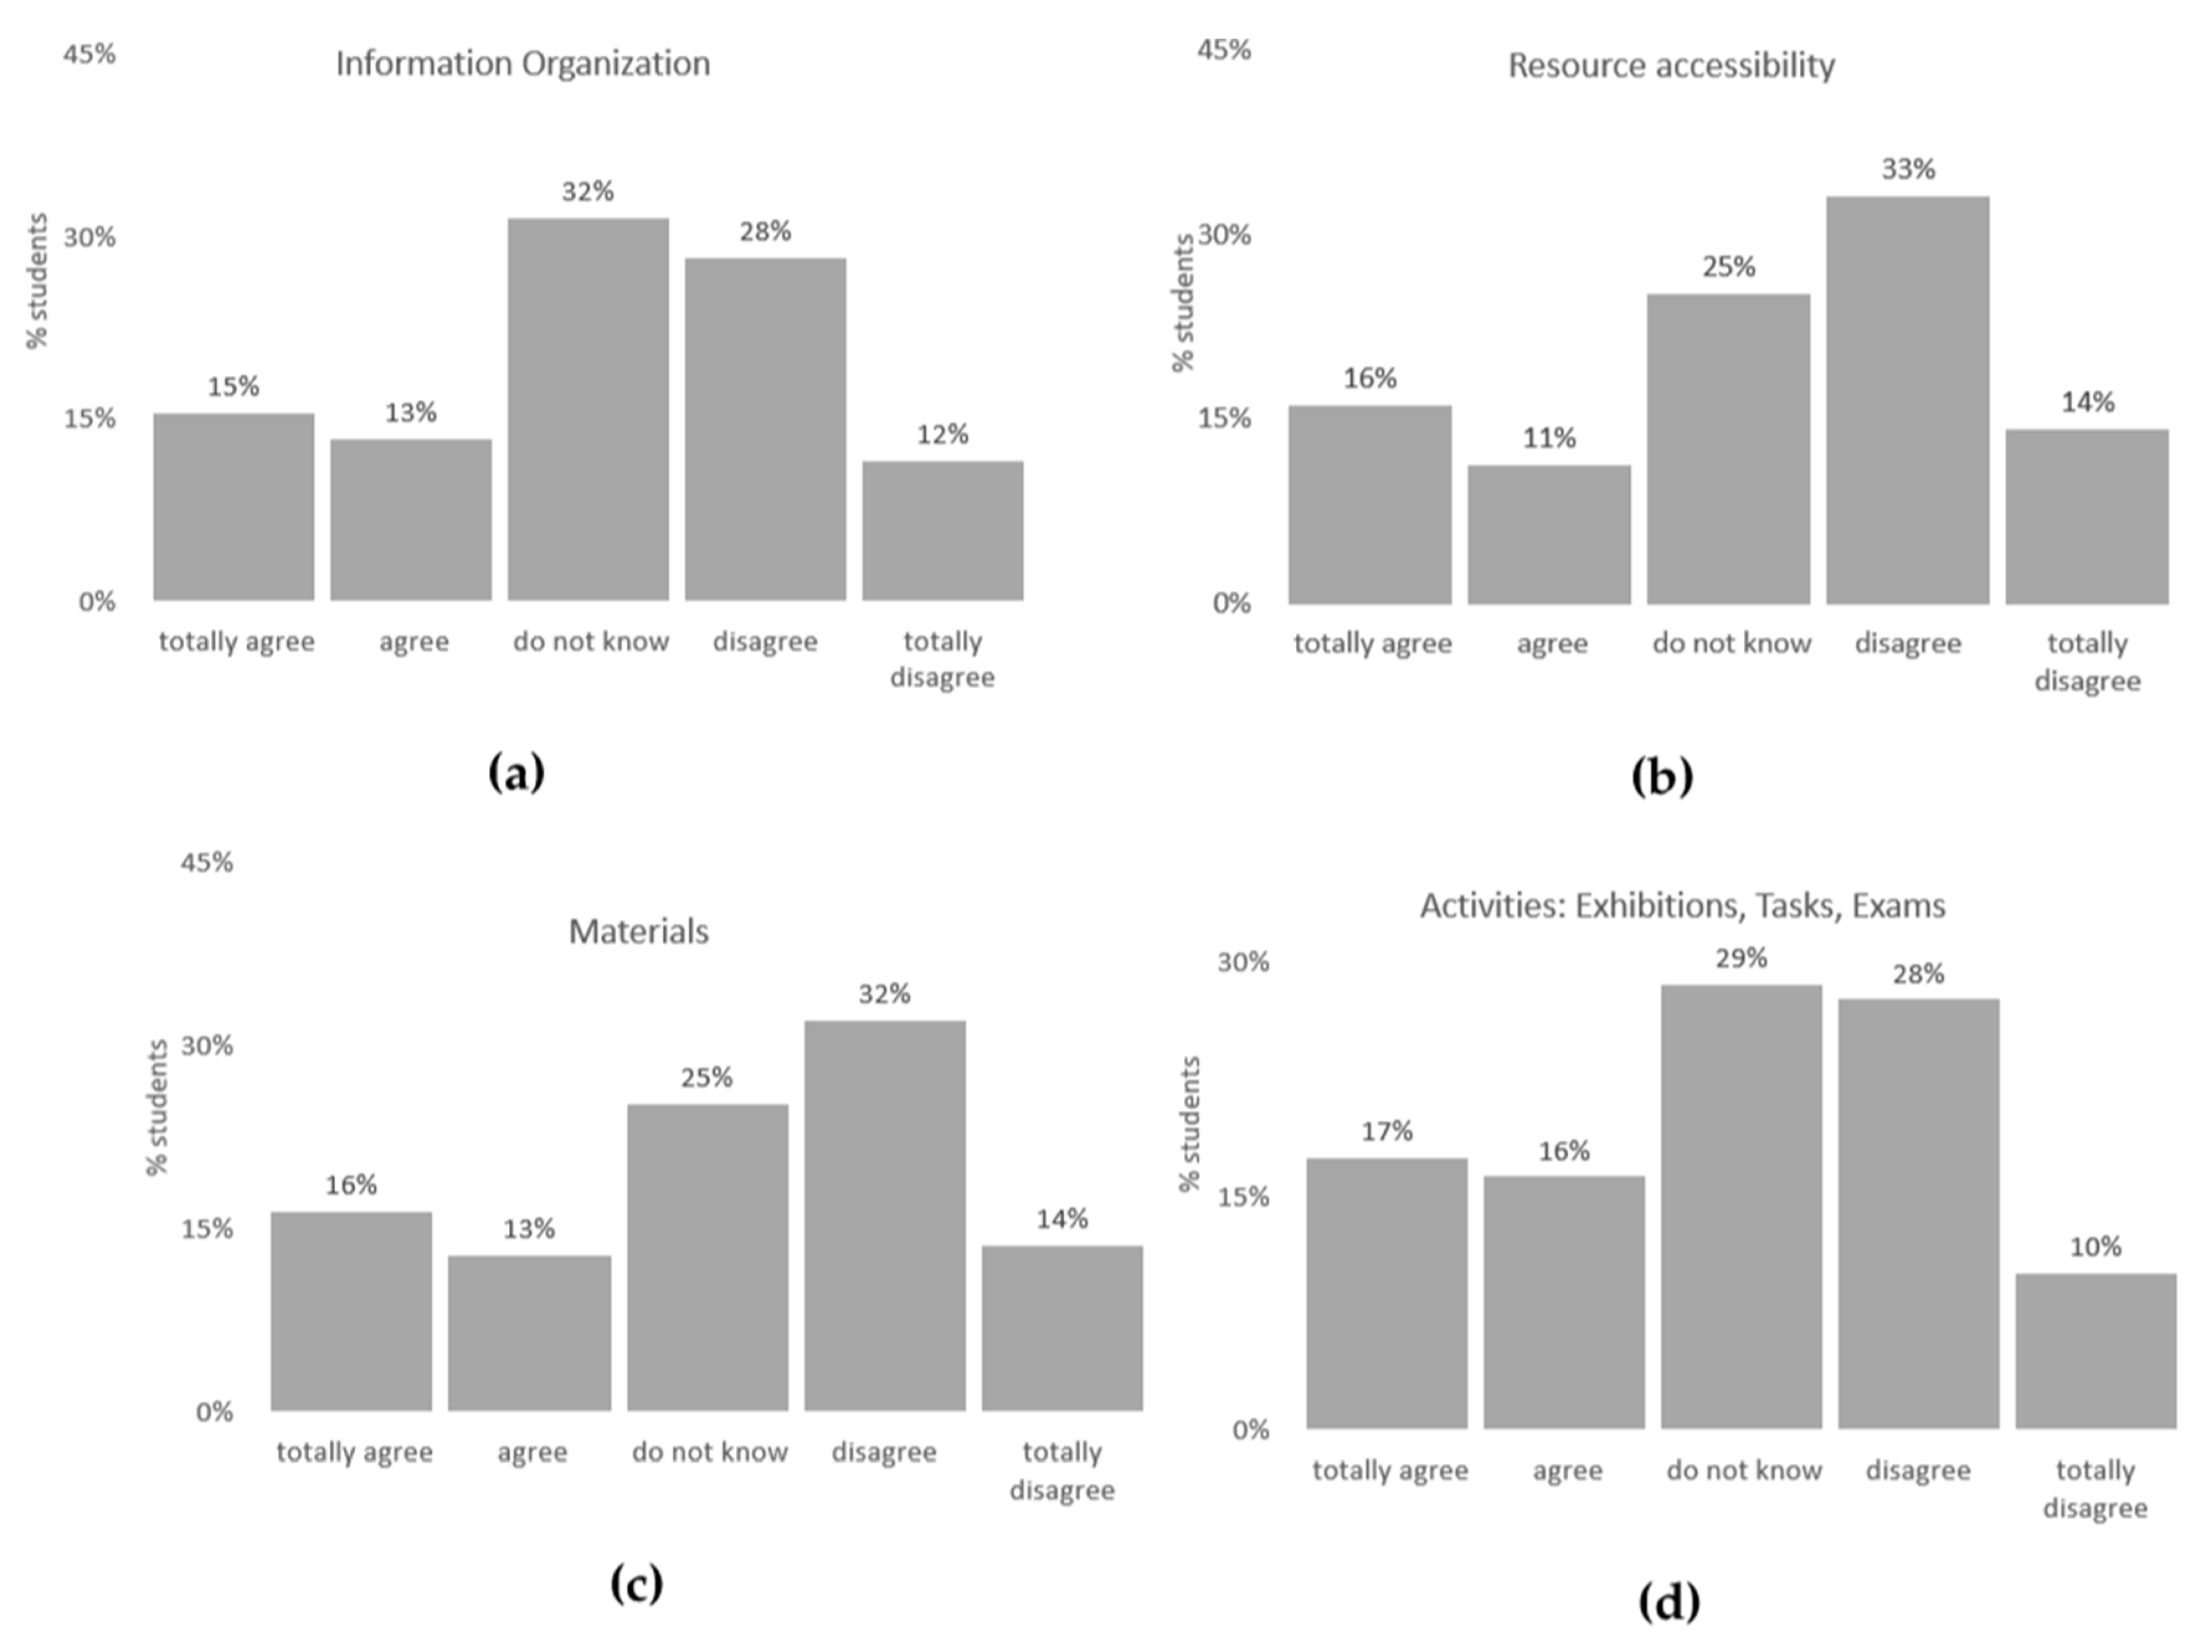
  • Resources of the Teams platform: six questions, with a response item on a Likert scale.
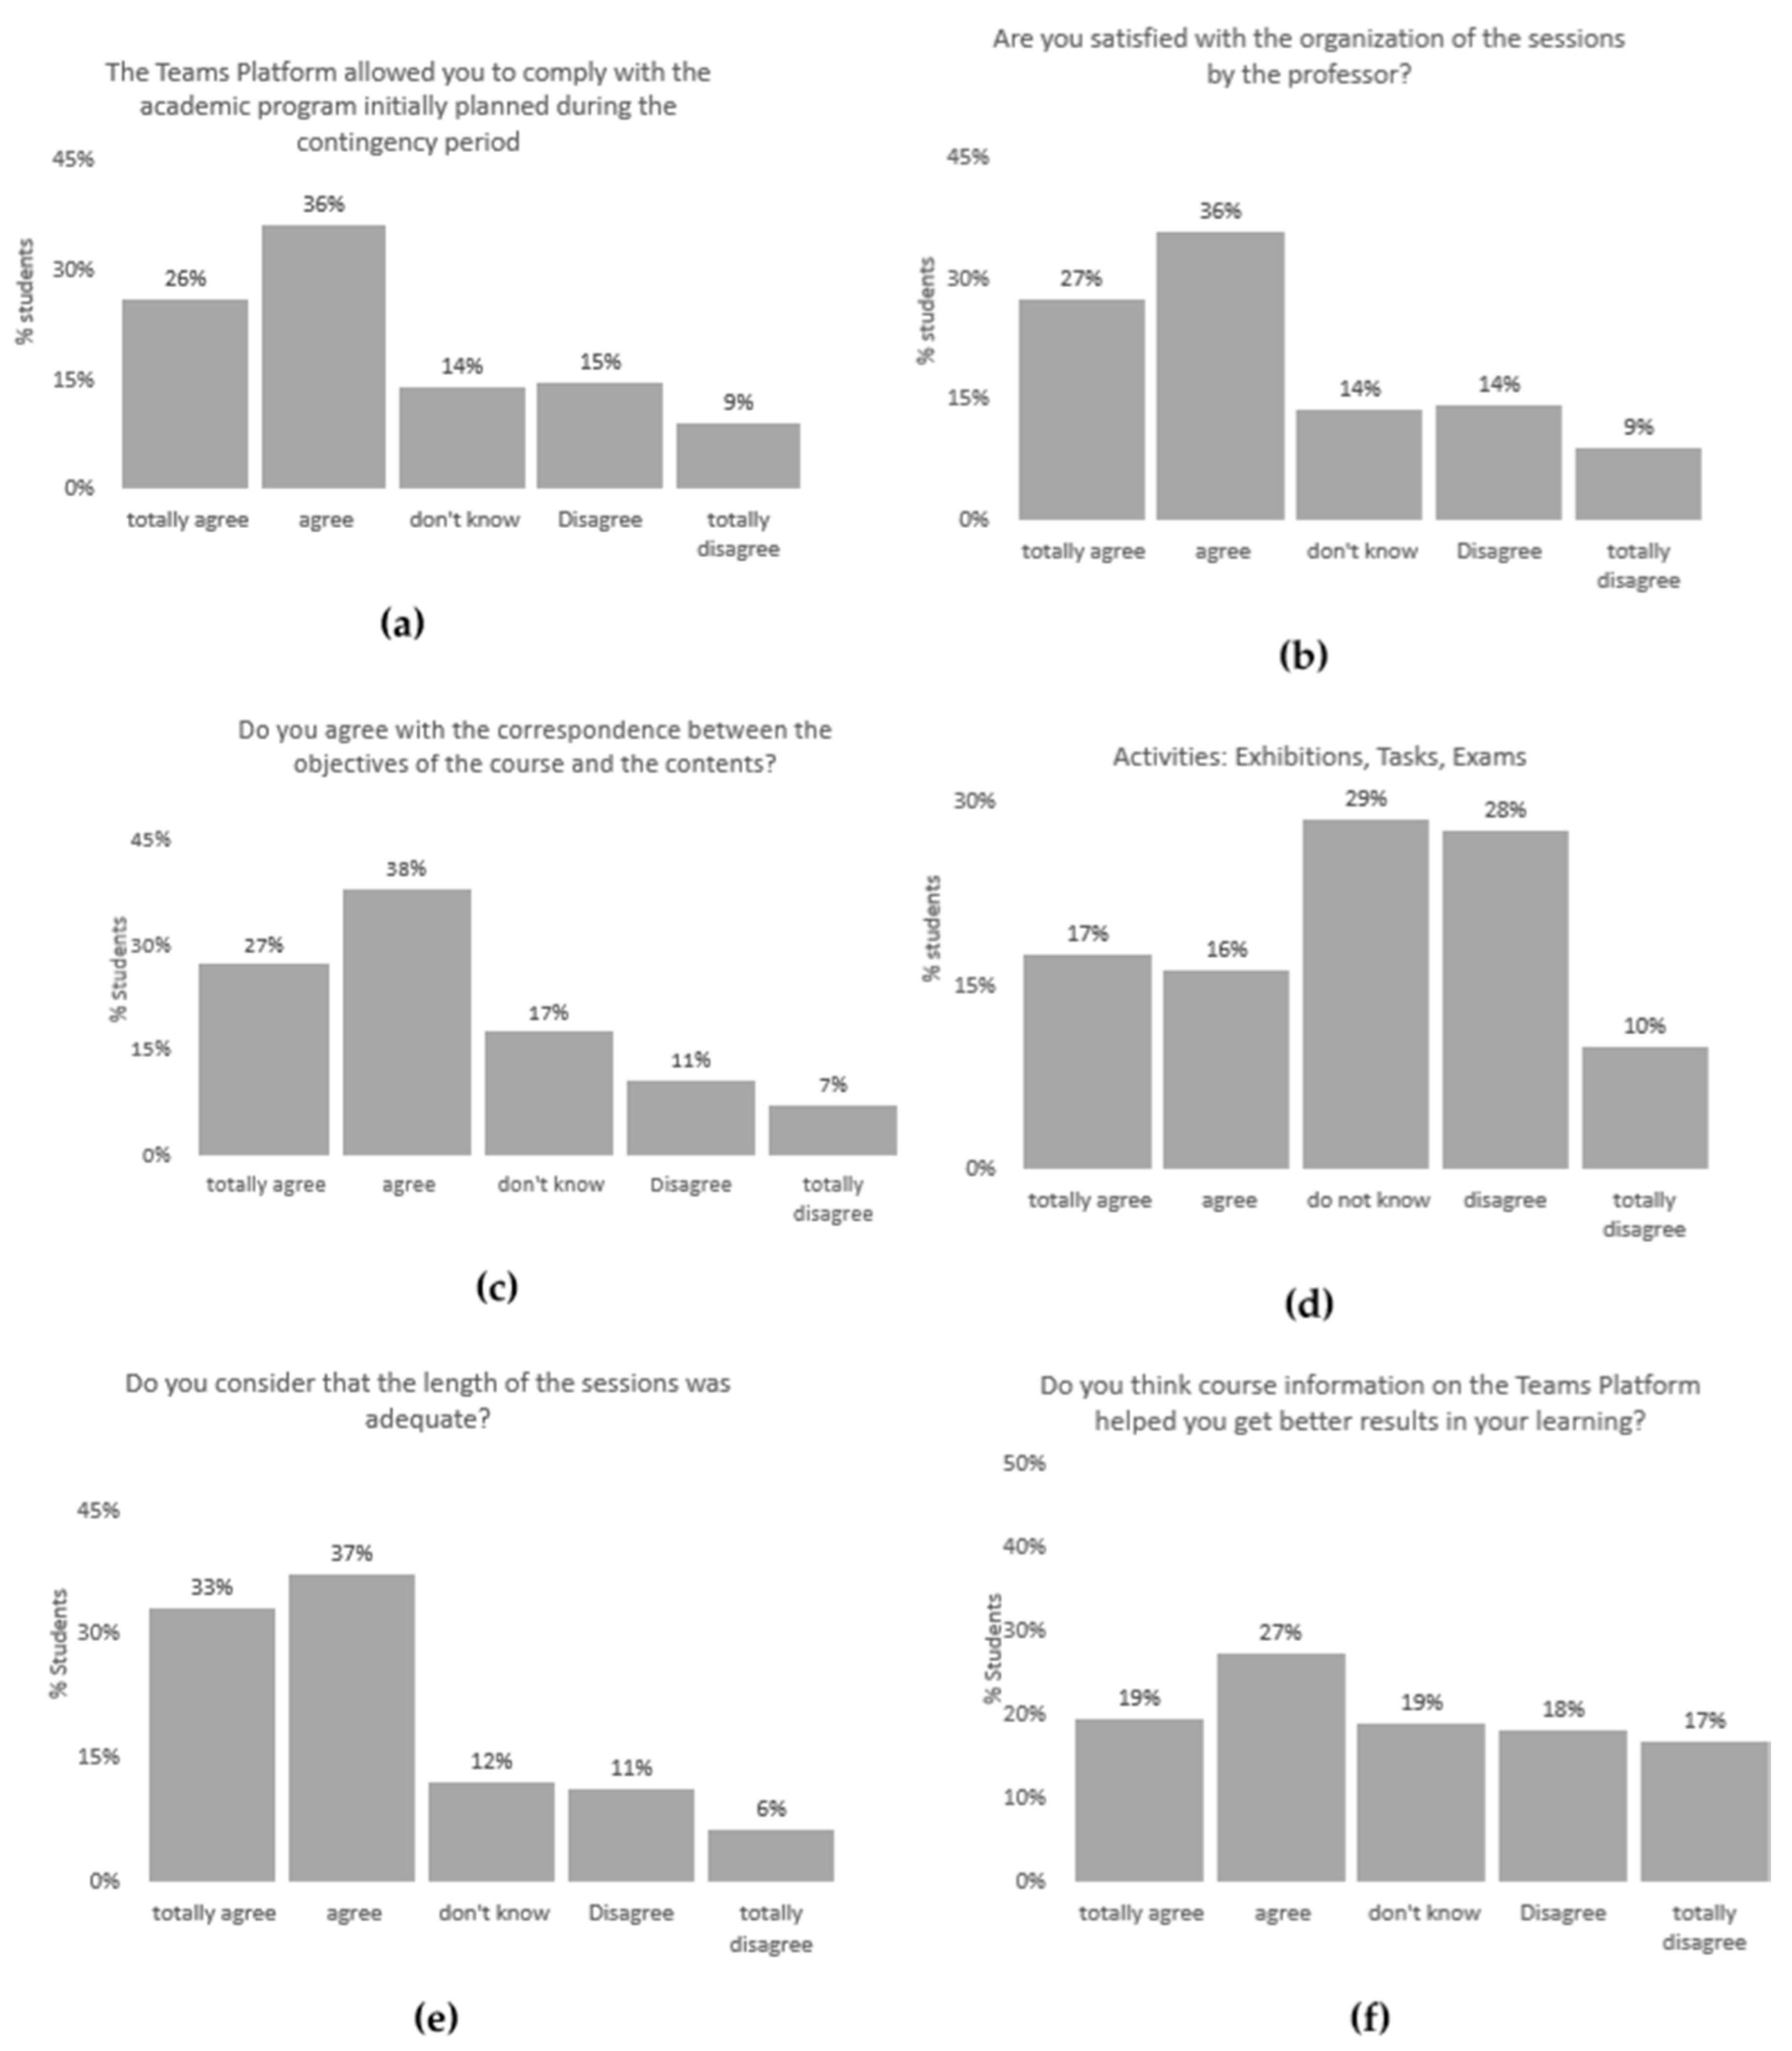
  • The functionality of Teams for the development of the educational process: seven questions, with a response item on a Likert scale.
Sections II, III and IV of the point of view of the students were established with questions relevant to this research; see Appendix A.
A convenience sampling method was used to determine the sample size, since this technique is used to select a sample from the accessible population. A universe of 81,384 students from the 13,433-UVM campuses, who registered in the period January–June 2020, was considered [14,15].
For the calculation of the sample size, the following formula was used:
n = Z 2 p ( 1 p ) C 2
where Z is the confidence level of 95%, p is the estimate of the proportion to be measured = 0.5, and c is the margin of error = +/− 4.
By substituting the data in the formula, a sample size of 1053 surveys were obtained from the students. The proportion of the total number of enrolled students in each UVM Campus was taken as the criterion for the distribution of the data collection instrument for each Campus. At the end of the data collection period, there was a response from 1918 students. This favors the reliability of the results and the reduction of the margin of error.

3. Deep Learning from a Remote Teaching Platform

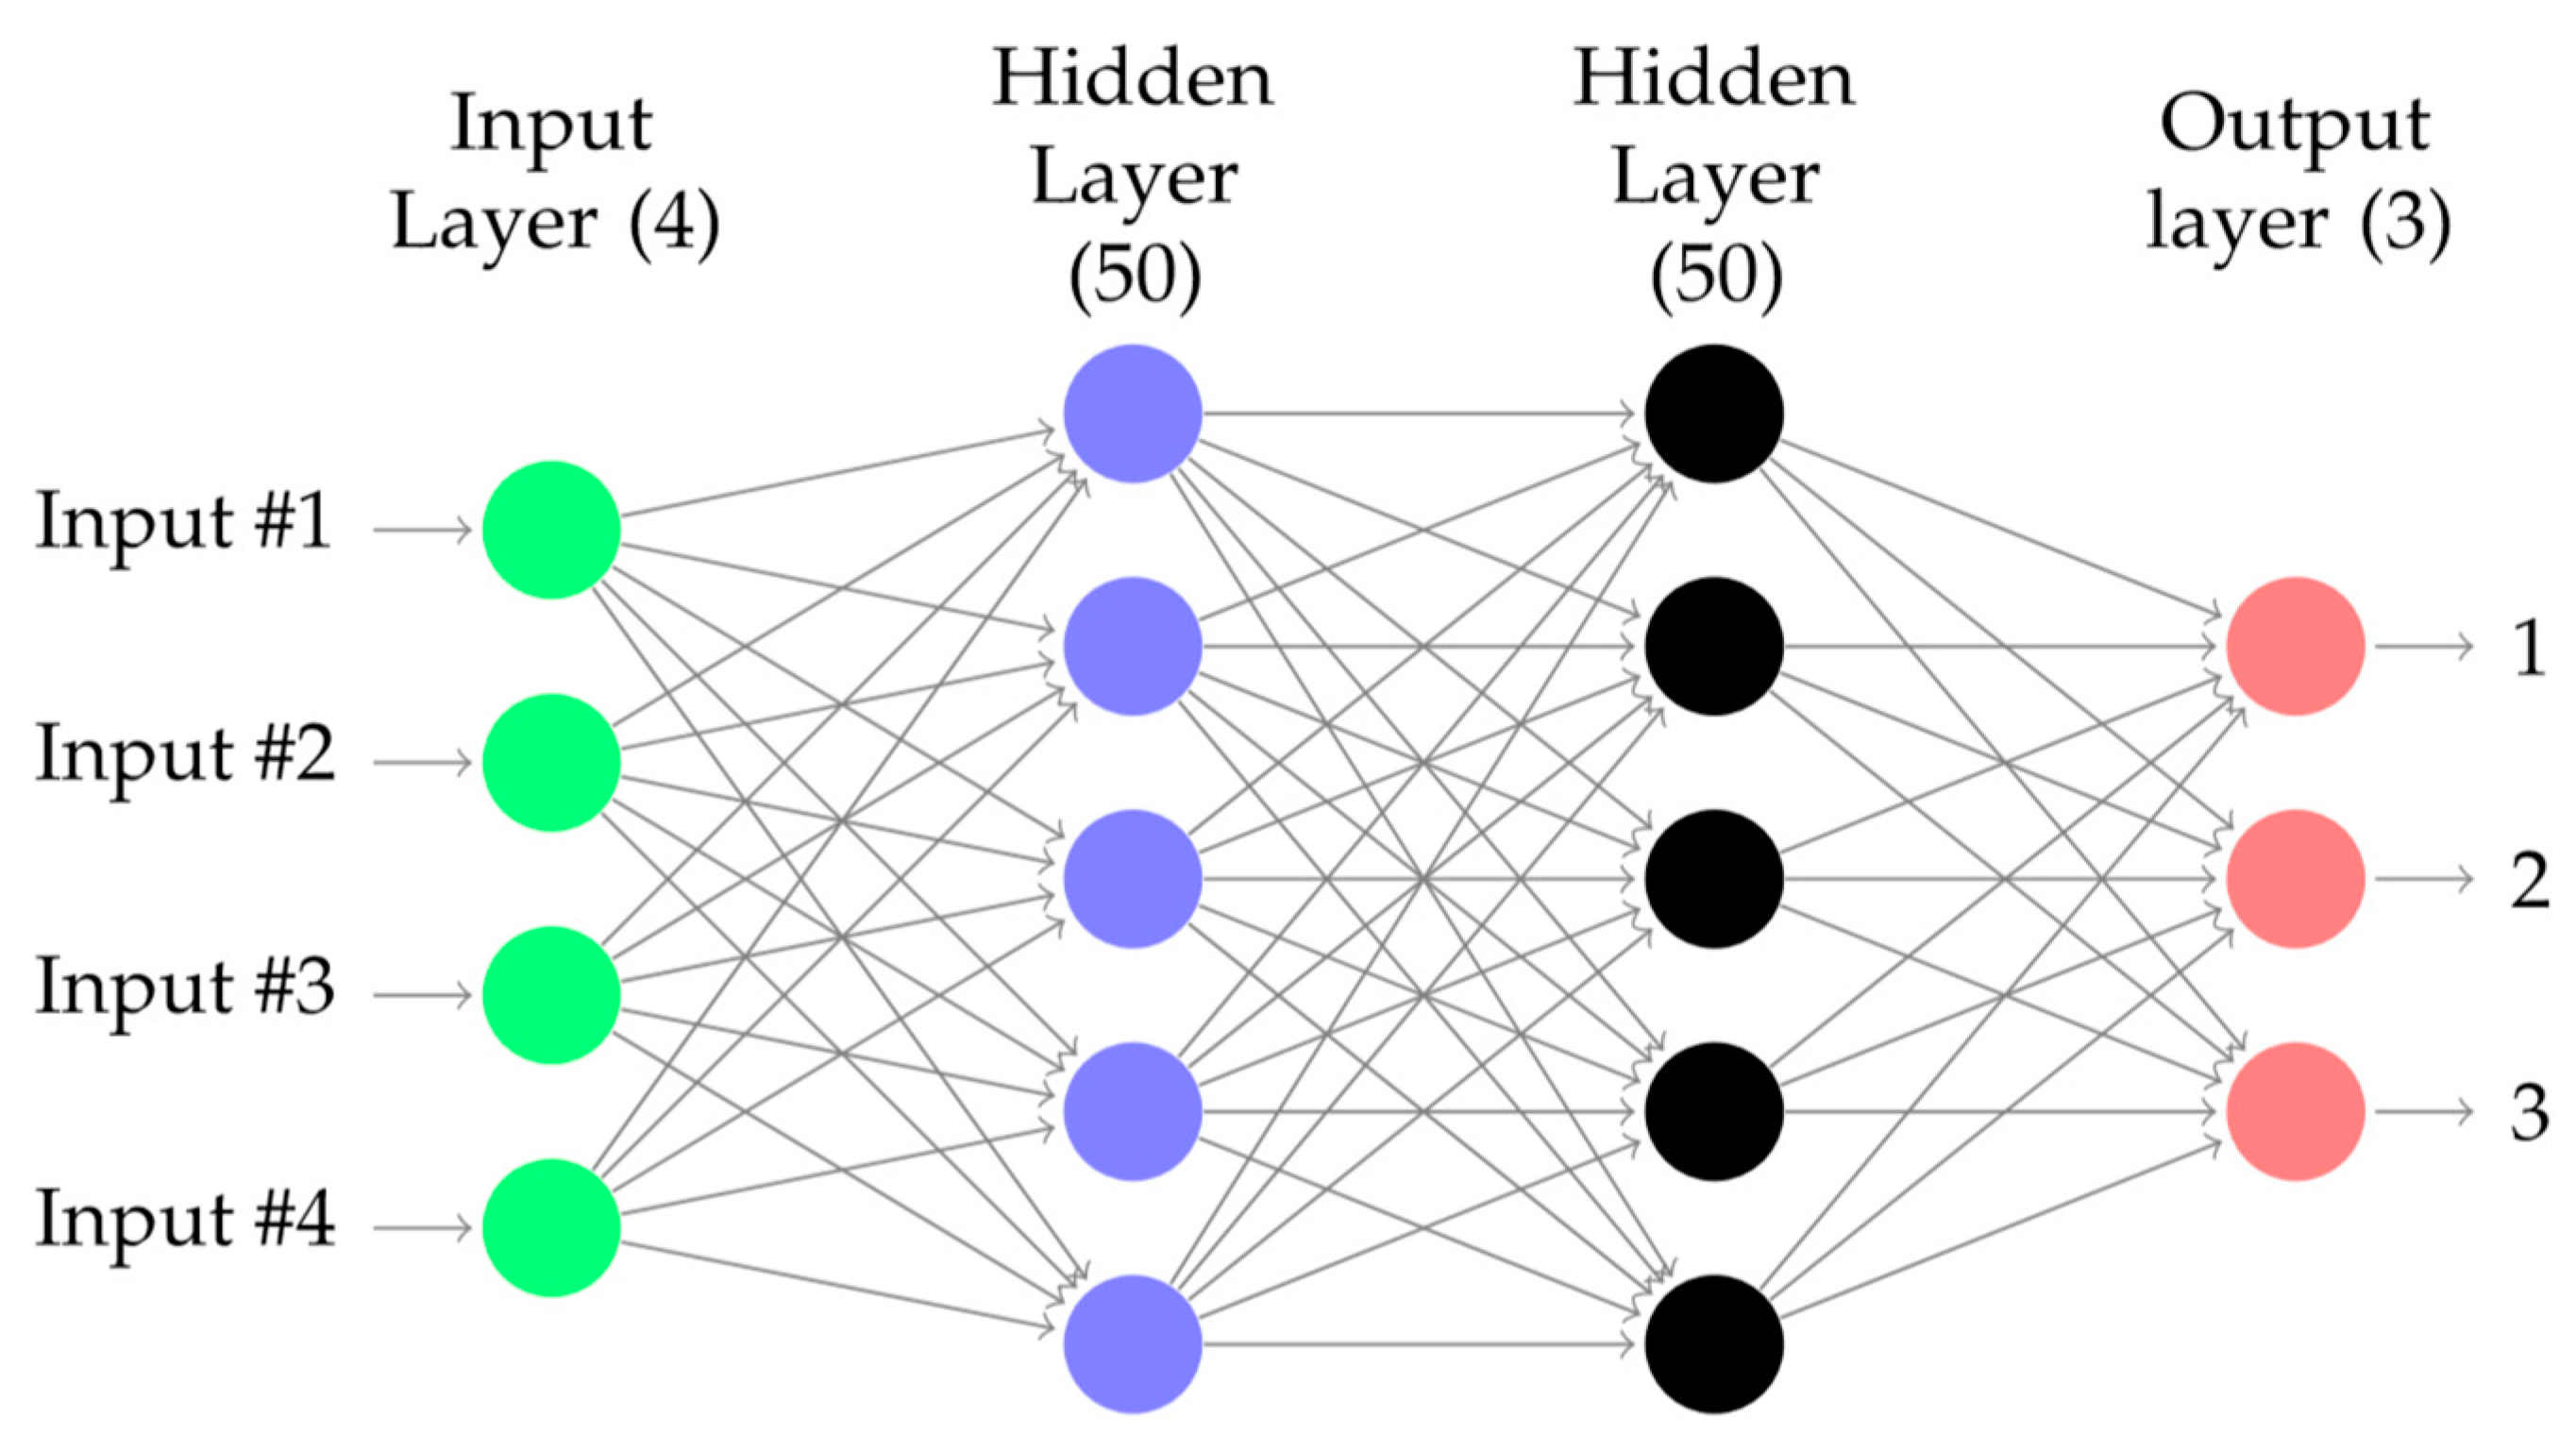
Deep learning is a subset within the field of machine learning, which deals with the idea of learning from the example. This tool is based on an artificial multilayer feeding neural network that is trained with a stochastic gradient descent by spreading it backwards. The system can contain a large number of hidden layers consisting of neurons with a hyperbolic tangent, a rectifier, and maxout activation functions, see Figure 1. Advanced features, such as the adaptive learning rate, rate annealing, impulse training, abandonment, and L1 or L2 regularization, enable high predictive accuracy. Each computation of the node trains a copy of the global model parameters in its multithreaded local data (asynchronously), and periodically contributes to the global model through average models across the network. In deep learning, instead of feeding a computer with a vast list of rules for solving a problem, a model is given that can evaluate examples, and a small collection of instructions are also given for the whole-model-modification when errors occur. Over time, it is expected that these models will be able to solve the problem exceptionally accurately, thanks to the system being able to extract patterns. Although there are different techniques for implementing deep learning, one of the most common is to simulate an artificial neuronal network (ANN) system within the data analysis software.
Bias units are included in each non-output layer of the network. The weights linking neurons and biases with other neurons fully determine the output of the entire network. Learning occurs when these weights are adapted to minimize the error on the labeled training data. More specifically, for each training example j, the objective is to minimize a loss function:
L ( W , B | j )
where:
  • j, the goal is to minimize the function of loss.
  • W is the collection (Wi)1:N−1, where Wi denotes the weight matrix connecting layers i and i + 1 for a network of N layers.
  • B is the collection (B1)1:N−1, where bi denotes the column vector of biases for layer i + 1.
This basic framework of multi-layer neural network can be used to accomplish deep-learning tasks. Deep-learning architectures are models of hierarchical feature extraction, typically involving multiple levels of non-linearity. Deep-learning models are able to learn useful representations of raw data, and have exhibited high performance on complex data, such as images, speech and text [16,17]. This is related to the secondary objective, which is to apply data science tools to compare results.

RapidMiner Software Application

RapidMiner [16] is a widely used and internationally proven Data Mining tool for enterprise, government, and academia applications. It implements over 500 data pre-processing techniques, predictive and descriptive modeling, model testing methods, and data visualization. The data were analyzed and compared through RapidMiner.
The defined variable—chosen in institutional interest—was student satisfaction with the use of Teams; the factors are:
  • Teams platform usability, corresponds to questions Q5, Q6, Q7 and Q8.
  • Teams platform resources, corresponds to questions Q9, Q10, Q11, Q12, Q13 and Q14
  • Teams platform functionality, corresponds to questions Q15, Q16, Q17, Q17, Q18, Q19, Q20, Q21, Q22, Q23, Q24, Q25, Q26, Q27.
As for institutional interest, the analysis with data science through Deep Learning was defined and compared:
  • The satisfaction of Teams Functionality for Program Compliance (Q15) with Team Usability (Q5–Q8) and Resources1 (Q9–Q14).180
  • Functionality of the satisfaction in the organization of the sessions by the teacher (Q16) with Usability (Q5–Q8) and181Resources(Q9–Q14)
(See Sections II, III and IV of the instrument, see Appendix A).
Particularly, questions Q15 and Q16 are the comparison variables in RapidMiner, because they resulted the most interesting results, not at a mathematical but at an institutional level.
Factor Analysis proposes that some latent variables are generated by some score variables [18]. In this way, the following structural equations (SEM) are proposed to explain the following latent variables: Usability, Recourses and Satisfaction:
U s a b i l i t y   =   i   =   5 8 λ i P i   +   µ 1
R e s o u r c e s   =   i   =   9 14 λ i P i   +   µ 2
F u n c t i o n a l i t y   a n d   s a t i s f a c t i o n   =   i   =   15 27 λ i P i   +   µ 3

4. Results

4.1. Reliability of the Instrument

To calculate reliability, Cronbach’s Alpha Coefficient was used:
α   =   k 1   k ( s i 2 S T 2 )
where k is the number of items, s2 is the variance of items, and ST2 is the variance of the sum of the items.
The analysis was performed using a correlation matrix for each section of the instrument with the selected questions, see Appendix B: Table A2, Table A3, Table A4, Table A5, Table A6, Table A7, Table A8 and Table A9.
The reliability analysis was performed in the following sections of the instrument: UVM students, section II. Satisfaction with the use of Teams; III. Teams platform resources; IV. Student view on the academic process. This is due to the consideration of the high importance questions that were defined to integrate each instrument. The MS Excel v2016 program was used to perform the calculations. Table 3 shows the results of Cronbach’s Alpha Coefficient, see Table 7.
In the application of Cronbach’s Alpha considers a questionnaire to be reliable when the result exceeds 0.8. Therefore, it can be concluded that the data collection instruments are authentic in their sections [14,15].
Using MS Excel, the calculated correlation of the answers for each of the questions in the collected data for the instrument was performed see Table 8. It can be seen that the results are similar to the clauses obtained through the application of deep learning; see Appendix B.

4.2. Data Collection Results

Only the most relevant results of the data collection instrument are displayed in each of the sections that make it up. For data collection, the surveys were sent electronically. The period for the application was from 30 March to 20 April 2020, as it is the first period established by the Mexican Ministry of Education (SEP) for the closure of the Educational Institutions. UVM, like most Higher Education Institutions, measures its academic processes through questionnaires, and students and teachers generally respond to surveys voluntarily; topics include students’ educational outcomes and the satisfaction of the community with the services provided, among others. With the support of the National Academic Directorate, the study for measuring satisfaction in the use of Teams was distributed to students, and the information was collected.

4.2.1. Student Results

Figure 2 corresponds to step II of the data Collection Instrument Satisfaction with the use of the Teams. See Appendix A.
In Figure 2a, 81% of the students surveyed fully agreed or agreed to the use of Teams. In Figure 2b, 64% of students indicated that their first contact with Teams was satisfactory to them. Figure 2c shows the results of the reflection on the concepts taught in the classes: 475 students agreed or wholeheartedly agreed. Figure 2d shows that 44% of students said they found it motivating to them to use Teams.
Teams platform resources used for ERT, Figure 3a shows that students are satisfied or very satisfied with the organization of information, by 30%, and in Figure 3b, it can be observed that students totally agree or agree, by 37%. Regarding the activities that are carried out through Teams, Figure 3d shows that the degree of student satisfaction in the materials, activities, tasks and exams are above 30%, taking into account average satisfaction.
It can be seen in Figure 4a–f that the answers provided in each of the items are grouped in students that totally agreed or agreed, according to the development of the Academic Process through Teams in percentages more significant than 60%. Figure 4b shows that the students are satisfied with the course objectives developed in Teams concerning the ordinary course. Figure 4e shows a successful response from students regarding the duration of the sessions. As for teacher guidance, information on Teams Figure 4c,d, show that there is more satisfaction than discontent. In other areas such as academic results, working autonomously and learning assessment schemes through the different Teams resources, students responded that they totally agree and agree with correspondence between courses objectives and contents and with the whole process: tasks, exhibitions, and exams.

4.2.2. Analysis through Deep Learning

In Appendix B, the application of deep learning is deployed to compare the results obtained in the descriptive study of student satisfaction. As was previously mentioned, RapidMiner software was used [19].
The results generated in RapidMiner allow the comparison of the findings determined in the descriptive study. Both models—data science and statistical analysis—have similar results; this is favorable evidence that supports the decision of the use of Teams in ERT; the methods support the relevance and usefulness of such tools in the current situation derived from COVID-19. The values are minimal due to the range. It is observed that almost all of the values ranged in the field of 3, 4, and 5 in the responses in the instrument, and presented a few response values between 1 and 2. The range of values according to the instrument is minimal; the variance is significant. A minimum value of R2 was given, see Appendix B [19].
This study allowed to begin testing different methods of artificial intelligence to forecast different academic scenarios and processes. It is complicated in this type of scenario to perform repeatability of conditions. Reproducibility will depend on the specific situation of respondents.
This makes it possible to understand how the situation or the environment impacts the perceptions of students. The fact of having a variance indicates that there are secondary emotions that—through a selection, as the environment changes—can be identified in terms of the impact on that variance, and with this, it can be determined which emotion causes greater negativity, so that we can reduce the negative effect with curricular design. These results make it possible to detect key variables that would help improve educational processes in higher education institutions. This detection also serves to develop more effective diagnostic tools for educational planning.
Moreover, an SEM model was estimated using SEM package R 4.0.2. In order to estimate the SEM model, a text file must be provided (Appendix B). Table 9 shows the estimated parameters of the SEM model. Using these parameters, it was found that the usability range of Teams is between 3.7213 and 18.6065, the resource range of Teams is between 6.4164 and 32.0822, and the satisfaction range of Teams is between 6.0428 and 30.2144. In particular, according to the survey, the median of the UVM student score for Usability was 13.208, the median of the resources was 20.349, and the median of the satisfaction was 24.60. Therefore, the usability of Teams was around 63.73%, the acceptance of the resources provided by Teams was 57.64%, and the satisfaction with the Team platform was 76.77%.
Moreover, the rho parameters are the estimation of the dissatenuated correlation, and the absolute dissatenuated correlation for this case is lower than | 0.5 | . Therefore, it can be concluded the three latent variables are independent [20].
On the other hand, Table 10 shows the variance explained for the model for each question. Thus, the questions related to usability and resources (P5–P14) were explained via the model. However, the questions related to satisfaction (P15–P23) are not completely explained via the model. This lack of fit might be due to the fact that the satisfaction variable can be split in two or more variables.

5. Discussion

Facing a complex scenario, it was considered necessary to redefine the role and responsibility of academic teaching, thus providing stakeholders with the appropriate tools to tackle the current challenges efficiently. In a crisis environment, UVM applied the ERT paradigm established by [2,21,22]. The results of the questionnaires were analyzed referring to validated and published methods [23,24,25]. Using a platform such as Teams during the COVID-19 contingency presented a series of advantages, such as accessibility and an extensive range of available applications [26]. Without the need to generate version dependency, the support that was given was very diversified and the system was robust (especially in the ease of exploring and knowing fundamental aspects of a medium for a VLE). Teams is a powerful enough tool to implement educational applications and satisfy the needs of the UVM community, since it allows the application of techniques in the generation of knowledge and information management in the necessary time, given the nature of the process [8,27]. In the conception of person-to-person teaching and its dimensions regarding the role of the teacher and the part of the student in face-to-face courses, particular approaches to teaching and learning are presented: in person-to-person classes, the focus on education predominates wherein teachers perceive themselves as guides and facilitators of the construction of student knowledge, which is consistent with concepts [28,29] of skill development but also understanding the proposals of [30]. Despite the predominance of the centering of attention on learning, the number of teachers with a focus on teaching was highlighted, emphasizing the transmission of knowledge to a passive student. However, following Carrasco [7], this is more appropriate to students lacking in discipline, or that have not yet developed their time management skills. This perspective is in line with the prospect of teaching [31] education. The implementation of Teams facilitated the process, the cognitive development of students, and more active participation in their learning. In addition, this allowed personal and professional development, when deepening topics and looking for educational tools for the progress of the classes. It stands out that, in order to improve the outcomes of the learning process, it is important to consider the development of self-management skills, so that students can become autonomous learners from now on.
The primary function of Teams has been centralized as a tool for managing the subject and supporting resources for Teaching and students: the teachers and students expressed high adaptability to incorporate new elements into the development of their teaching and learning processes. They assure that Teams is a flexible tool that facilitates the management of the subject contents and tasks to a great extent. This tool gives the possibility to elaborate academic materials but also keeps record of student’s data. An element that is capable of increasing the attractiveness of the teaching also fosters communication relationships and enables the dissemination and access to knowledge and information [32,33]. Undoubtedly, Teams opens the door to information, innovation, and a motivational instrument for the student when the teacher uses it to increase the attractiveness in the presentation of curricular content in their teaching area. However, there are a large number of erroneous considerations regarding its use, especially about the possible harmful effects on the student, like the possibility of accessing unwanted information, and the unethical use of the information obtained. Teacher training is conceived as an essential element for the ‘intelligent’ use of this technology while guiding students trough digital literacy and ethics.
Teachers are the critical element for the incorporation of LMS. It has been observed that the use of Teams and its different tools have definitively changed the relationships with the students, which represents a powerful academic resource that allows them to share experiences and knowledge.
The potential of Teams in education as an alternative to continuing with the teaching and learning process has been descriptively explored. The isolated student has a more stable organization of time, promoted by the UVM. Although he has to organize time in a personal way—to make consultations, readings, and homework—there is an institutional time dedicated to academic exchange and derived from the COVID-19 crisis. They underwent a paradigmatic change in their day-to-day work, having to organize their own time in an ‘unlimited’ way while keeping the established schedules, with some obstacles.
The student managed to awaken interest and carry out learning activities on the virtual platform, allowing him to read, understand, develop and deliver his tasks under the provisions of the programs, and to self-assess and organize—to a certain extent—his time of academic dedication in a different paradigm. It seems that everything depends on the will to ‘win’ and not lose heart. However, a great analysis of the limits of time is required, because knowledge has no boundaries, and therefore the time dedicated to it is not limited either.
In this way, the schedules of the school classes were maintained. This has direct consequences in the performance of other activities, including the same course or other courses. In fact, for each of the subjects of each session, the student could write an extended essay. Some course coordinators reduce the evaluation workload by establishing that the size of the reports should be no longer that one page. Still, others require reports with no established limits. Both forms have their advantages and disadvantages, but that already belongs to another discussion, perhaps to those of the difficulties inherent in the system, or in education in general [34].
Furthermore, the use of activities that were changed from a face-to-face to an online model was feasible, since the teacher managed to transform generic operations into virtual events, adopting a kind of writing of best-practices style, and the impact of these learning activities was self-assessed by the teacher and evaluated by the students during the development of the educational process during the COVID-19 crisis [33].
The impact on student of learning after virtualization will allow more innovative activities to be implemented effectively. The effect on the adoption of those practices will form part of the new conception of a tutoring on-line teacher (a Traditional Teacher with Virtual Teacher Skills) as a critical element in time to strengthen the academic offer.
School education has limited time; it has its own specific space that distance education does not have. During the COVID-19 crisis, the students improvised their areas. Sometimes, this was on a table or in the living room, in the corner of the bedroom or the dining room. All of these are areas that have other functions, for which other family members are present while carrying out activities of a different nature than school.
The current student studies in a time and space made for that. School buildings are closed and abandoned while not in use. A student may require that his or her classroom be vacated if someone occupies it for something else within class hours. It exists in a time and in a space that does not exist (a paradoxical truth). In other words, virtual education exists in the context of its own reality, an area that the student does not physically share with the people they are studying with, and with whom, simultaneously, learning and real interactions are shared [35].
The study provides the administrative and academic staff of Laureate Mexico with favorable results on the curricular implementation under the combined and practical education approaches. The UVM is part of the Federation of Mexican Private Institutions of Higher Education (FIMPES), an organization that brings together the central private higher education institutions, an essential factor in the importance of strengthening this dynamic generated by the crisis, seeking an academic satisfaction scheme. With the concept of virtuality, it seems that a social representation of all communication mediated by electronic networks or specialized software is being built; it should be noted that the term is not new, but its frequent use is. In this regard, it should be noted that, since Information and Communication Technologies (ICTs) openly penetrated the world, new words and communication codes also began to thicken everyday language, as a common use practice. Thus, the virtual is no longer a matter for specialists, nor is email or so-called cyberspace.
However, in the case of virtuality, protocols on its use are not easily perceived, leading to confusion, which extends to contexts such as education or commerce [9]. In the case of online and virtual learning, it is positioned worldwide as a useful alternative for the rapid mobility of the population, but also without agreements between its managers and users about its true meaning. Therefore, there are concerns about the conceptual limits of virtuality, and the components, characteristics and assumptions about the virtual education modality. Still, it must be specified a concept called ERT. Unlike fully designed and planned online educational experiences, ERT responds to a sudden change from instructional models to alternative ones as a consequence of a crisis [2,36]. In such circumstances, education that would usually be delivered face-to-face or semi-face-to-face requires immediate remote solutions, even though, when the crisis recedes, they will revert to the first format. The primary goal in these circumstances is not to recreate a robust educational ecosystem, but rather to provide temporary access to instruction and instructional supports in a quick and easy-to-configure manner.
By understanding ERT in this way, it can begin to be decoupled from online learning. The fact that institutions would make different decisions and investments results in very different possible solutions and outcomes. This calls attention to political agendas and differences from one institution to another based on their priorities and contingency plans that would have an impact in the way online learning is conceptualized. Another problem to consider are the emotions that need integration with online learning: the feelings of the isolation should not be considered as independent from the learning process. This experience serves to emphasize some distinctions that may guide evaluations to ERT at the end of the crisis. Despite the research, online learning is perceived as being lower in quality than face-to-face learning. In this regard, Bates (2019) [37] defines quality as “teaching methods that successfully help learners develop the knowledge and skills they will require in a digital age” (p.1896), which are granted partially by the satisfaction of the students in being knowledgeable while interacting in virtual contents while being aware of their emotions and the changes their life and the world are facing. In a state of emergency such as the one we are experiencing, it is not difficult for this idea to be reinforced, since the urgency to migrate to online learning will, in many cases, cause the proposals that are made not to maximize their potential or possibilities. Thus, in finding out if students are satisfied, and if they are also learning the required content or developing the skills, the way ITCs are used to stimulate autonomous learners could be an aim of the university, but also point out the need of social interaction and safety the students need to give sense to what is learnt.
There are many cases of process measurement in higher education institutions using different methodologies and tools [38]. Other researchers around the world have made contributions on the crises facing higher education [39,40]. It is desirable to apply data science tools—such as Neural Networks, Machine Learning, and Deep learning, among other tools—to improve educational processes in higher education institutions in Mexico [41] by analyzing one that reduces error and uncertainty.

6. Conclusions

Due to a transition from face-to-face education to ERT, it became important to know the perceptions of the students regarding this matter. A survey was carried out using a convenience sampling method in the 33 UVM campuses in order to collect the necessary data. The reliability of the instrument was tested and a 0.926 Cronbach’s Alpha was obtained, indicating both the high reliability and correlation of the items.
A limitation of this research is that the necessary training of the students is not considered, and the perception is from the whole situation. The way things happened and the emergency training to continue with the teaching and learning process is very important when assessing the anxiety level before the confinement and the previous situation. Teams was an alternative for the UVM to respond to the change of the educational paradigm; its use for educational purposes is an open field for reflection and research. One way to explain the possibilities as a means of communication is to conceptualize the platform as a set of ‘tools’ and ‘spaces’ in which communities of human beings with common interests interact and exchange information; it is a space for synchronous and asynchronous communication (individual–individual or individual–group) that allows interaction and social activity, and a means for searching for information, for the distribution, search and retrieval of it in any digital format, and is the support tool for the execution of the teaching–learning process in an online education environment (but based on the phenomenon of the COVID-19 crisis, the ERT).
The most significant results indicate that the transitional educational strategy through Teams platform was able to create a satisfactory environment for students and teachers at the high-school, UST, and Bachelor levels in their different modalities at the Universidad del Valle de México (UVM). In the design of the instruments for collecting data for UVM students and teachers, the validation of the questions and answers using Cronbach’s Alpha Coefficient gave 0.926, which indicates the high reliability and correlation of the items.
About the students who answered the instrument, 14% were high-school students, and the rest were of the other modalities, where more than 75% were from a traditional bachelor’s degree. Students found it easy to adapt to the Teams environment, being satisfied in the activities performed and the accessibility of the information.
Within the teaching–learning process, it can be seen how relevant some aspects are, i.e., that the student consider that there was no change/reduction in the contents provided for them in the initial planning, a pleasant disposition from the teachers, and a very favorable satisfaction expressed by the students in the duration of the sessions. This is a matter of great importance concerning what could be thought of in a process under the characteristics generated by the crisis, and for their learnings. Students considered that the use of Teams had favored them. The latter is an aspect mentioned as being key in the development of the educational process using Teams, which made it easier for teachers and students to develop the academic process in crisis conditions under a standardized scheme. In just six days, the UVM trained more than 100,000 students. The phenomenon of the virtualization of the management processes, academic processes and ERT caused 100% of UVM teachers to become teachers with Virtual Tutor skills.
Regarding the application of deep learning, its importance lies in allowing—through quantitative techniques, designing, and managing—the strategies necessary to transform data into key, essential, optimal, productive, and scalable information, to allow better decision-making in the present [42].
Deep learning is mentioned because of its analytical and predictive ability, allowing the construction of an improved idea of the technology involved in educational processes. These results will allow the definition of variables related to teaching work, linked to several specific groups of students, and even covering an entire training project; according to Zhan [43], it has been achieved by incorporating data science tools for the analysis and improvement of educational processes.

Author Contributions

Conceptualization, M.A.Z.-A.; Data curation, L.R.-S.; Formal analysis, W.J.P.-G., J.A.A.-C., M.Á.C.-P.; Investigation, M.A.Z.-A., L.R.-S.; Methodology, J.R.-R., M.A.Z.-A., L.R.-S., M.Á.C.-P.; Project administration, M.A.Z.-A., J.R.-R.; Resources, J.A.A.-C.; Validation, J.A.A.-C., W.J.P.-G.; Visualization; J.R.-R.; Writing—original draft, M.Á.C.-P.; Writing—review editing, J.R.-R. All authors have read and agreed to the published version of the manuscript.

Funding

This research was funded by the Vice Rectory of National Research of Universidad del Valle de Mexico.

Acknowledgments

The authors would like to thank the Academic Vice Rectory of UVM for their contribution of resources and materials to this research. The authors thank Miguel Angel Cruz Pérez for the support provided to carry out the translation and correction of the style of the work.

Conflicts of Interest

The authors declare that they have no conflict of interest.

Appendix A. Data Collection Instrument

Below is a satisfaction questionnaire on the online training that we are applying to the University community on the Learning Teaching Process. It is a questionnaire aimed at assessing the degree of satisfaction that UVM students achieve with the use of Teams, as well as with the level of training they achieve through it. We are aware that this is only one of the dimensions to be addressed in the educational process during the COVID-19 contingency.
Purpose: this questionnaire aims to assess the university community’s view on the Learning Teaching Process during the crisis period of COVID-19. It is intended to assess the degree of satisfaction that UVM Students achieve with the use of Teams. Please indicate the answers you consider nearest.
Table A1. Instrument to measure student satisfaction with the use of Teams.
Section I. General Data
Instrument Items
Q1. Campus
Q2. Career/Educational Program
Q3. Semester/Four-Quarter
Q4. How many subjects are you currently taking?
1. Very dissatisfied; 2. Unsatisfied; 3. Mediumly satisfied; 4. Satisfied; 5. Very satisfied
Section II. Satisfaction with the use of the Teams platformAnswers
Instrument’s Items 1 2 3 4 512345
Q5. I have been able to use the Teams without any difficulties.
Q6. I believe that Teams has helped me to reflect on the concepts taught on the subject.
Q7. In general, I can say that this first contact with Teams has been satisfactory to me.
Q8. In general, teams’ use is motivating in itself.
Section III. Teams ResourcesAnswers
Instrument Items 1 2 3 4 512345
Q9. Organization of Information
Q10. Resource Accessibility
Q11. Materials
Q12. Expositions
Q13. Tasks
Q14. Exams
Section IV. Student View on the Academic ProcessAnswers
Instrument’s Items 1 2 3 4 512345
Q15. During the contingency period, the use of the Teams platform complies with the initially planned academic program.
Q16. Organizing the sessions by the Professor
Q17. The teacher’s technical skills for the use of the different resources of the Teams platform
Q18. The teacher’s ability to motivate and stimulate participation
Q19. Attention to the interests of students and explanation of content by the teacher
Q20. Teacher response time for attention to doubts and recommendations about the work and quality of the works (H)
Q21. The duration of the sessions was adequate
Q22. Correspondence between course objectives and content
Q23. Clarity in the orientation of activities
Q24. Level of adequacy of information received
Q25. The course information in Virtual Format helps me get better grades in the subject.
Q26. The information in Virtual Format helps me get better grades in the subject.
Q27. The course in Virtual Format allows you to work autonomously.
The Data Collection Instrument, called a student viewpoint, was answered by students from 33 UVM Campuses. The complete instrument in Google Forms can be viewed at: Viewpoint of UVM students in the use of the Teams during the contingency by COVID-19.

Appendix B. Statistical and Machine Learning Analysis

Appendix B.1. Statistical Analysis

In this section is shown the elements needed to reproduce the statistical analysis. In this way, the SEM text file employed was the following:
  • Usability -> Q5, lambda1, NA
  • Usability -> Q 6, lambda2, NA
  • Usability -> Q 7, lambda3, NA
  • Usability -> Q 8, lambda4, NA
  • Resources -> Q 9, lambda5, NA
  • Resources -> Q 10, lambda6, NA
  • Resources -> Q 11, lambda7, NA
  • Resources -> Q 12, lambda8, NA
  • Resources -> Q 13, lambda9, NA
  • Resources -> Q 14, lambda10, NA
  • Functionality and satisfaction -> Q 15, lambda11, NA
  • Functionality and satisfaction -> Q 16, lambda12, NA
  • Functionality and satisfaction -> Q 17, lambda13, NA
  • Functionality and satisfaction -> Q 18, lambda14, NA
  • Functionality and satisfaction -> Q 19, lambda15, NA
  • Functionality and satisfaction -> Q 20, lambda16, NA
  • Functionality and satisfaction -> Q 21, lambda17, NA
  • Functionality and satisfaction -> Q 22, lambda18, NA
  • Functionality and satisfaction -> Q 23, lambda19, NA
  • Functionality and satisfaction -> Q 24, lambda20, NA
  • Functionality and satisfaction -> Q 25, lambda21, NA
  • Functionality and satisfaction -> Q 26, lambda22, NA
  • Functionality and satisfaction -> Q 27, lambda23, NA
  • Functionality and satisfaction <-> Resources, rho1, NA
  • Functionality and satisfaction <-> Usability, rho2, NA
  • Usability <-> Resources, rho3, NA
  • Satisfaction <-> Satisfaction, NA, 1
  • Resources <-> Resources, NA, 1
  • Usability <-> Usability, NA, 1
  • Q 5 <-> Q 5, theta1, NA
  • Q 6 <-> Q 6, theta2, NA
  • Q 7 <-> Q 7, theta3, NA
  • Q 8 <-> Q 8, theta4, NA
  • Q 9 <-> Q 9, theta5, NA
  • Q 10 <-> Q 10, theta6, NA
  • Q 11 <-> Q 11, theta7, NA
  • Q 12 <-> Q 12, theta8, NA
  • Q 13 <-> Q 13, theta9, NA
  • Q 14 <-> Q 14, theta10, NA
  • Q 15 <-> Q 15, theta11, NA
  • Q 16 <-> Q 16, theta12, NA
  • Q 17 <-> Q 17, theta13, NA
  • Q 18 <-> Q 18, theta14, NA
  • Q 19 <-> Q 19, theta15, NA
  • Q 20 <-> Q 20, theta16, NA
  • Q 21 <-> Q 21, theta17, NA
  • Q 22 <-> Q 22, theta18, NA
  • Q 23 <-> Q 23, theta19, NA
  • Q 24 <-> Q 24, theta20, NA
  • Q 25 <-> Q 25, theta21, NA
  • Q 26 <-> Q 26, theta22, NA
  • Q 27 <-> Q 27, theta23, NA

Appendix B.2. Machine Learning

In this section, a summary of the training stage is shown for both of the ANNs trained. In the first seven rows of the table, a statistical summary of a good fitness is presented. The following four rows shows a summary of the topology employed by the ANN. Finally, the last rows show the ANN’s performance of the training over the 10 epoch.
Table A2. Model satisfaction in program compliance temptations (Q15) vs. usability (Q5–Q8).
Deep Learning
Model Metrics TypeRegression
DescriptionMetrics reported on full training frame
model id:rm-h2o-model-production_model-988506
frame id:rm-h2o-frame-production_model-885474
MSE:0.36216992
R2:0.18601082
mean residual deviance:0.36216992
Status of Neuron Layers (predicting L, regression, gaussian distribution, Quadratic loss, 2851 weights/biases, 38.1 KB, 19,040 training samples, mini-batch size 1)
LayerUnitsTypeDropoutL1L2Mean RateRate RMSMomentum
14Input0.00%
250Rectifier0.00%0.0000100.0049580.0025810
350Rectifier0.00%0.0000100.09662400
41Linear 0.0000100.0010020.0009380
Mean WeightWeight RMSMean BiasBias RMS
0.0107490.1847030.4086660.07023
−0.0164020.1391970.9634960.053492
0.0175720.139197−0.0241050
Scoring History:
Time StampDurationTraining Speed rows/secEpochsIterationsSamples TrainingMSETraining DevianceTraining R2
29/05/202020:03:13 0.000 s 000NaNNaNNaN
29/05/202020:03:13 0.088 s26,0821119040.376260.376260.15434
29/05/202020:03:13 0.173 s26,2622238080.391350.391350.12042
29/05/202020:03:13 0.257 s26,3223357120.390850.390850.12156
29/05/202020:03:13 0.339 s26,5364476160.370650.370650.16695
29/05/202020:03:13 0.418 s26,8925595200.414530.414530.06833
29/05/202020:03:13 0.497 s27,2006611,4240.366780.366780.17566
29/05/202020:03:13 0.580 s27,0897713,3280.362170.362170.18601
29/05/202020:03:13 0.658 s27,2978815,2320.368740.368740.17125
29/05/202020:03:13 0.733 s27,6389917,1360.364810.364810.18008
29/05/202020:03:14 0.807 s27,917101019,0400.390640.390640.12201
29/05/202020:03:14 0.819 s27,877101019,0400.362170.362170.18601
H2O version: 3.8.2.6-rm9.0.0
Table A3. Performance vector program compliance temptations (Q15) vs. Usability (Q5–Q8).
root_mean_squared_error:0.603 +/− 0.014 (micro average: 0.603 +/− 0.000)
absolute_error:0.464 +/− 0.017 (micro average: 0.464 +/− 0.386)
relative_error_lenient:0.464 +/− 0.017 (micro average: 0.464 +/− 0.386)
squared_error:0.364 +/− 0.017 (micro average: 0.364 +/− 0.464)
correlation:0.438 +/− 0.040 (micro average: 0.440)
Table A4. Model satisfaction in organizing sessions (Q16) vs. Usability (Q5–Q8).
Deep Learning
Model Metrics TypeRegression
DescriptionMetrics reported on full training frame
model id:rm-h2o-model-model-533734
frame idrm-h2o-frame-model-13779
MSE:0.30517727
R2:0.29519385
Mean residual deviance:0.30517727
Status of Neuron Layers (predicting L, regression, gaussian distribution, Quadratic loss, 2851 weights/biases, 38.1 KB, 19,040 training samples, mini-batch size 1)
LayerUnitsTypeDropoutL1L2Mean RateRate RMSMomentum
16Input0.00%
250Rectifier0.00%0.0000100.0054310.0034690
350Rectifier0.00%0.0000100.0238050.0580760
41Linear 0.0000100.000770.000450
Mean WeightWeight RMSMean BiasBias RMS
0.0166630.1830.4451590.05
−0.0105530.1390.9774220.05
0.0145620.1910.0224270
Scoring History:
Time StampDurationTraining Speed rows/secEpochsIterationsSamples TrainingMSETraining DevianceTraining R2
29/05/202020:12:12 0.000 s 000NaNNaNNaN
29/05/202020:12:12 0.055 s25,9541111420.4030.403160.0952
29/05/202020:12:12 0.107 s25,9542222840.340.340180.23653
29/05/202020:12:12 0.159 s25,9543334260.3520.351660.21077
29/05/202020:12:12 0.211 s26,1024445680.360.36030.19139
29/05/202020:12:12 0.266 s25,7205557100.3360.336440.24492
29/05/202020:12:12 0.317 s25,8566668520.3360.336130.24563
29/05/202020:12:12 0.366 s26,0397779940.3570.357480.1977
29/05/202020:12:12 0.417 s26,1028891360.3710.370530.16841
29/05/202020:12:12 0.467 s26,2199910,2780.3330.332670.25339
29/05/202020:12:12 0.517 s26,313101011,4200.370.36960.17051
29/05/202020:12:12 0.526 s26,252101011,4200.3330.332670.25339
H2O version: 3.8.2.6-rm9.0.0
Table A5. Performance vector satisfaction in program compliance temptations (Q15) vs. Team platform resources (Q9–Q14).
root_mean_squared_error:0.620 +/− 0.012 (micro average: 0.621 +/− 0.000)
absolute_error:0.467 +/− 0.007 (micro average: 0.467 +/− 0.409)
relative_error_lenient:10.30% +/− 0.13% (micro average: 10.30% +/− 8.99%)
squared_error:0.385 +/− 0.015 (micro average: 0.385 +/− 0.537)
correlation:0.378 +/− 0.049 (micro average: 0.384)
Table A6. Model Satisfaction in program compliance temptations (Q16) vs. Usability (Q5–Q8).
Deep Learning
Model Metrics TypeRegression
DescriptionMetrics reported on full training frame
model id:rm-h2o-frame-model-962745
frame id:rm-h2o-frame-model-962745
MSE:0.32686412
R2:0.24510813
mean residual deviance:0.32686412
Status of Neuron Layers (predicting L, regression, gaussian distribution, Quadratic loss, 2,851 weights/biases, 38.1 KB, 19,040 training samples, mini-batch size1)
LayerUnitsTypeDropoutL1L2Mean RateRate RMSMomentum
14Input0.00%
250Rectifier0.00%0.0000100.0044660.0028490
350Rectifier0.00%0.0000100.0335920.0921140
41Linear 0.0000100.0008460.000760
Mean WeightWeight RMSMean BiasBias RMS
0.0046170.1877240.4483830.053302
−0.0105860.1394110.9783370.047876
0.0158510.191092−0.0215750
Scoring History:
Time StampDurationTraining Speed rows/secEpochsIterationsSamples TrainingMSETraining DevianceTraining R2
2020-05-2920:07:51 0.000 s 000NaNNaNNaN
2020-05-2920:07:51 0.057 s25,3771111420.33990.33990.21501
2020-05-2920:07:51 0.110 s25,3772222840.395330.395330.08698
2020-05-2920:07:51 0.161 s25,5673334260.337320.337320.22096
2020-05-2920:07:51 0.213 s25,6624445680.332840.332840.23131
2020-05-2920:07:51 0.264 s25,8375557100.376460.376460.13057
2020-05-2920:07:51 0.314 s26,0536668520.34150.34150.21131
2020-05-2920:07:51 0.365 s26,1247779940.43110.43110.00437
2020-05-2920:07:51 0.418 s26,0288891360.328360.328360.24165
2020-05-2920:07:52 0.468 s26,1529910,2780.326860.326860.24511
2020-05-2920:07:52 0.517 s26,252101011,4200.357130.357130.17521
2020-05-2920:07:52 0.527 s26,132101011,4200.326860.326860.24511
H2O version: 3.8.2.6-rm9.0.0
Table A7. Performance vector satisfaction in organizing sessions (Q16) vs. Usability (Q5–P8).
root_mean_squared_error:0.639 +/− 0.026 (micro average: 0.639 +/− 0.000)
absolute_error:0.506 +/− 0.035 (micro average: 0.506 +/− 0.391)
relative_error_lenient:11.10% +/− 0.66% (micro average: 11.10% +/− 8.70%)
squared_error:0.409 +/− 0.033 (micro average: 0.409 +/− 0.498)
correlation:0.252 +/− 0.047 (micro average: 0.246)
Table A8. Satisfaction in organizing sessions (Q16) vs. Teams platform resources (Q9–Q14).
Deep Learning
Model Metrics TypeRegression
DescriptionMetrics reported on full training frame
model id:rm-h2o-model-model-533734
frame id:rm-h2o-frame-model-13779
MSE:0.30517727
R2:0.29519385
mean residual deviance:0.30517727
Status of Neuron Layers (predicting L, regression, gaussian distribution, Quadratic loss, 2851 weights/biases, 38.1 KB, 19,040 training samples, mini-batch size 1)
LayerUnitsTypeDropoutL1L2Mean RateRate RMSMomentum
16Input0.00%
250Rectifier0.00%0.0000100.0051660.0036110
350Rectifier0.00%0.0000100.0283480.0722640
41Linear 0.0000100.0007820.0005520
Mean WeightWeight RMSMean BiasBias RMS
0.0124440.1826780.4612880.053274
−0.0097440.1384040.980190.049139
0.0128050.192879−0.0237380
Scoring History:
Time StampDurationTraining Speed rows/secEpochsIterationsSamples TrainingMSETraining DevianceTraining R2
2020-05-2920:17:04 0.000 s 000NaNNaNNaN
2020-05-2920:17:04 0.056 s25,3771111420.318480.318480.26447
2020-05-2920:17:04 0.110 s25,0982222840.359410.359410.16994
2020-05-2920:17:04 0.164 s25,1913334260.312360.312360.27862
2020-05-2920:17:04 0.215 s25,5194445680.325470.325470.24832
2020-05-2920:17:04 0.267 s25,6055557100.327590.327590.24344
2020-05-2920:17:05 0.321 s25,4726668520.315260.315260.27192
2020-05-2920:17:05 0.374 s25,4587779940.471490.47149−0.0889
2020-05-2920:17:05 0.424 s25,6628891360.305180.305180.29519
2020-05-2920:17:05 0.473 s25,8899910,2780.309310.309310.28566
2020-05-2920:17:05 0.522 s26,073101011,4200.350450.350450.19064
2020-05-2920:17:05 0.531 s25,954101011,4200.305180.305180.29519
H2O version: 3.8.2.6-rm9.0.0
Table A9. Vector satisfaction in organizing sessions (P16) vs. Teams platform resources (P9–P14).
root_mean_squared_error:0.658 +/− 0.018 (micro average: 0.658 +/− 0.000)
absolute_error:0.534 +/− 0.020 (micro average: 0.534 +/− 0.385)
relative_error_lenient:11.74% +/− 0.41% (micro average: 11.75% +/− 8.58%)
squared_error:0.433 +/− 0.024 (micro average: 0.433 +/− 0.494)
correlation:0.068 +/− 0.068 (micro average: 0.048)

References

  1. Members, U.C. Hispanic Situationist Archive. Available online: https://es.unesco.org/covid19/globaleducationcoalition (accessed on 30 May 2020).
  2. Hodges, C.; Moore, S.; Lockee, B.; Trust, T.; Bond, A. The difference between emergency remote teaching and online learning. Educ. Rev. 2020, 27, 1–12. [Google Scholar]
  3. García Aretio, L. Necesidad de una educación digital en un mundo digital. Rev. Iberoam. Educ. Distancia-Ried 2019. [Google Scholar] [CrossRef]
  4. Aranda, R.M. Propuesta de buenas prácticas para la impartición de programas online, a aplicaren la Facultad de Ingeniería de la Universidad Andrés Bello. Rev. Daena Int. J. Good Conscienc. 2018, 13, 223–229. [Google Scholar]
  5. Rodríguez Segura, L.; Zamora-Antuñano, M.A. Análisis del usos de plataformas virtuales en Instituciones de Educación Superior durante la crisis del COVID-19. 2020; In press. [Google Scholar]
  6. Pireva, K.; Imran, A.S.; Dalipi, F. User Behaviour Analysis on LMS and MOOC. In Proceedings of the 2015 IEEE Conference on e-Learning, e-Management and e-Services (IC3e), Melaka, Malaysia, 24–26 August 2015; pp. 21–26. [Google Scholar] [CrossRef]
  7. Carrasco, S. Guía para la enseñanza y el aprendizaje online. In Based on Toni Bates’ Book, Teaching in a Digital Age, with Modifications; DSpace JSPUI: Palo Alto, CA, USA, 2018. [Google Scholar]
  8. Ruiz-Palmero, J.; López-Álvarez, D.; Sánchez-Rivas, E.; Sánchez-Rodríguez, J. An analysis of the profiles and the opinion of students enrolled on xMOOCs at the University of Málaga. Sustainability 2019, 11, 6910. [Google Scholar] [CrossRef] [Green Version]
  9. Yang, Y.; Durrington, V. Investigation of students’ perceptions of online course quality. Int. J. E-Learn. 2010, 9, 341–361. [Google Scholar]
  10. AI-Youbi, A.O.; Al-Hayani, A.; Bardesi, H.J.; Basheri, M.; Lytras, M.D.; Aljohani, N.R. The King Abdulaziz University (KAU) pandemic framework: A methodological approach to leverage social media for the sustainable management of higher education in crisis. Sustainability 2020, 12, 4367. [Google Scholar] [CrossRef]
  11. Cervi, L.; Tornero, J.M.P.; Tejedor, S. The challenge of teaching mobile journalism through MOOCs: A case study. Sustainability 2020, 12, 5307. [Google Scholar] [CrossRef]
  12. Microsoft. Teams Platform. Available online: https://www.microsoft.com/es-mx/microsoft-365/microsoft-teams/group-chat-software (accessed on 19 July 2020).
  13. Jayaraman, R.; Jothiswaran, V. Web-based platforms for virtual learning. Biot. Res. Today 2020, 2, 184–186. [Google Scholar]
  14. De Smith, M.J. Statistical Analysis Handbook A Comprehensive Handbook of Statistical Concepts, Techniques and Software Tools/Dr Michael J de Smith, 2018; The Winchelsea Press: Edinburgh, UK, 2018. [Google Scholar]
  15. Kennedy, W.J.; Gentle, J.E. Statistical Computing; Routledge: Abingdon-on-Thames, UK, 2018. [Google Scholar]
  16. Candel, A.; Parmar, V.; LeDell, E.; Arora, A. Deep Learning with H2O; H2O. ai Inc.: Mountain View, CA, USA, 2016. [Google Scholar]
  17. Bengio, Y. Understanding the difficulty of training deep feedforward neural networks. Learn. Deep Archit. AI 2009, 2, 249–256. [Google Scholar] [CrossRef]
  18. Morrison, D.F. Multivariate analysis, overview. In Encyclopedia of Biostatistics; John Wiley & Sons: Hoboken, NJ, USA, 2005; Volume 5. [Google Scholar] [CrossRef]
  19. Members, R. [RapidMiner Studio]. RapidMiner Account, 9.1.000 (Rev: ef0090, Platform OSX). Available online: https://my.rapidminer.com/nexus/account/index.html (accessed on 25 May 2020).
  20. Bond, T.; Yan, Z.; Heene, M. Applying the Rasch Model: Fundamental Measurement in the Human Sciences; Routledge: Abingdon-on-Thames, UK, 2020. [Google Scholar]
  21. Morado, M.F.; Hernández, S.O. Una experiencia de acompañamiento tecno-pedagógico para la construcción de Entornos Virtuales de Aprendizaje en educación superior. Rev. Educ. 2019, 43, 43–61. [Google Scholar] [CrossRef]
  22. Luque, F.V.; Veliz, M.A.; Guerra, A.M. Nuevas tendencias educativas: Los MOOC (Cursos Masivos Abiertos Online) en la ciudad de Guayaquil. Nuevas Tend. 2018, 39, 27. [Google Scholar]
  23. Abarca-Alvarez, F.J.; Campos-Sánchez, F.S.; Mora-Esteban, R. Survey assessment for decision support using self-organizing maps profile characterization with an odds and cluster heat map: Application to children’s perception of urban school environments. Entropy 2019, 21, 916. [Google Scholar] [CrossRef] [Green Version]
  24. Artino, A.R., Jr.; LaRochelle, J.S.; Dezee, K.J.; Gehlbach, H. Developing questionnaires for educational research: AMEE Guide No. 87. Med. Teach. 2014, 36, 463–474. [Google Scholar] [CrossRef] [PubMed] [Green Version]
  25. Sáa, S.D.R.; Gil, M.Á.; Gonzalez-Rodriguez, G.; López, M.T.; Lubiano, M.A. Fuzzy rating scale-based questionnaires and their statistical analysis. IEEE Trans. Fuzzy Syst. 2014, 23, 111–126. [Google Scholar] [CrossRef]
  26. Goldie, J.G.S. Connectivism: A knowledge learning theory for the digital age? Med. Teach. 2016, 38, 1064–1069. [Google Scholar] [CrossRef] [PubMed] [Green Version]
  27. Calvo, S.; Lyon, F.; Morales, A.; Wade, J. Educating at scale for sustainable development and social enterprise growth: The impact of online learning and a massive open online course (MOOC). Sustainability 2020, 12, 3247. [Google Scholar] [CrossRef] [Green Version]
  28. Rodríguez, M.I. Competencias docentes ante la virtualidad de la educación superior. Rev. Cienc. Soc. Humanid. Apoyadas Technol. 2016, 5, 13–23. [Google Scholar]
  29. Krüger, K. El concepto de sociedad del conocimiento. Rev. Bibliográfica Geogr. Cienc. Soc. 2006, 11, 25. [Google Scholar]
  30. Bozal, R.G.; Márquez, P.G.O.; Navas, J.M.M.; Vázquez, I.N. Inteligencia emocional y adaptación socioescolar. REME 2006, 9, 359–366. [Google Scholar]
  31. Riva, G.; Mantovani, G. The need for a socio-cultural perspective in the implementation of virtual environments. Virtual Real. 2000, 5, 32–38. [Google Scholar] [CrossRef]
  32. Coll, C.; Monereo, C. Educación y aprendizaje en el siglo XXI: Nuevas herramientas, nuevos escenarios, nuevas finalidades. In Psicología de la Educación Virtual: Aprender y Enseñar con las Tecnologías de la Información y la Comunicación; Ediciones Morata: Donostia-San Sebastian, Spain, 2008; pp. 19–53. [Google Scholar]
  33. Gaviria, L.A.O.; Monsalve, L.M.R. Nuevos retos para la educación del siglo XXI. Rev. Reflex. Saberes 2019, 1, 25–32. [Google Scholar]
  34. González-González, C.S.; Infante-Moro, A.; Infante-Moro, J.C. Implementation of E-Proctoring in online teaching: A study about motivational factors. Sustainability 2020, 12, 3488. [Google Scholar] [CrossRef] [Green Version]
  35. Knihs, E.; García-Holgado, A. Young people participation in the digital society: A case study in Brazil. In World Conference on Information Systems and Technologies; Springer: Cham, Switzerland, 2020; pp. 347–356. [Google Scholar] [CrossRef]
  36. Tran, T.; Hoang, A.D.; Nguyen, Y.C.; Nguyen, L.C.; Ta, N.T.; Pham, Q.H.; Pham, C.X.; Le, Q.A.; Dinh, V.H.; Nguyen, T.T. Toward sustainable learning during school suspension: Socioeconomic, occupational aspirations, and learning behavior of vietnamese students during COVID-19. Sustainability 2020, 12, 4195. [Google Scholar] [CrossRef]
  37. Bates, A.T. Teaching in a Digital Age: Guidelines for Designing Teaching and Learning; UBC Library: Vancouver, BC, Canada, 2016. [Google Scholar]
  38. Garcia-Aracil, A.; Palomares-Montero, D. Indicators for evaluating higher education institutions: Validation through the Delphi method. Rev. Esp. Doc. Cient. 2012, 35, 119–144. [Google Scholar] [CrossRef] [Green Version]
  39. Sanchez, J.G. Universities in Transition: Overcoming Barriers and Creating Pathways for Sustainability; Manchester University Press: Manchester, UK, 2014. [Google Scholar] [CrossRef]
  40. Lozano, R.; Barreiro-Gen, M.; Lozano, F.J.; Sammalisto, K. Teaching sustainability in european higher education Institutions: Assessing the connections between competences and pedagogical approaches. Sustainability 2019, 11, 1602. [Google Scholar] [CrossRef] [Green Version]
  41. Antonio, A.C.; Domingo, G.M.; Humberto, O.; Alvaro, L.R.; del Rocio, P.V.R. Measuring the institutional efficiency using data envelopment analysis and analytic hierarchy process: The case of a Mexican University. Afr. J. Bus. Manag. 2012, 6, 11923–11930. [Google Scholar] [CrossRef] [Green Version]
  42. De Albuquerque, R.M.; Bezerra, A.A.; de Souza, D.A.; do Nascimento, L.B.P.; de Mesquita Sá, J.J.; do Nascimento, J.C. Using neural networks to predict the future performance of students. In 2015 International Symposium on Computers in Education (SIIE); IEEE: Piscataway, NJ, USA, 2015; pp. 109–113. [Google Scholar] [CrossRef]
  43. Zhang, L.; Li, K.F. Education analytics: Challenges and approaches. In Proceedings of the 32nd International Conference on Advanced Information Networking and Applications Workshops (WAINA), Krakow, Poland, 16–18 May 2018; pp. 193–198. [Google Scholar]
Figure 1. ANN’s topology employed.
Sustainability 12 07514 g001
Figure 2. Satisfaction with the use of the Teams platform. Each figure illustrates a summary of a question: (a) question 5, (b) question 6, (c) question 7, (d) question 8.
Sustainability 12 07514 g002
Figure 3. (ad) displays the results of the survey for questions 9–12 (see Appendix A).
Sustainability 12 07514 g003
Figure 4. Perception of the academic process by the students. Each figure illustrates a summary of the answer for questions 13–22 of the survey (see Appendix A).
Sustainability 12 07514 g004
Table 1. Students who stopped attending HEI in Mexico.
InstitutionNo Students Who Stopped Attending Classrooms
UNAM356,530
ITESM150,000
IBERO12,698
ITAM6300
La Salle12,000
UAM57,000
UVM and UNITEC210,000
IPN191,253
Autonomous Universities600,000
Technological and Polytechnic Universities450,000
Table 2. Features and attributes: installation and management.
Installation and Administration
Platform NameOpen SourceMultidiomPersonalization Look & FeelAuthenticationAutomaticleProfiles and PrivilegesStatisticsIdentifying Users OnlineMassive User LoadExternal Users (LDAP, Database, etc.)Course Management
Blackboard **********
CANVAS **********
Chamilo***********
Claroline******* * *
Coursera **********
Edmodo **********
e-Learning * ********
Fronter***********
Mentor **********
Moodle***********
Sakai***********
SELF *** ******
Google Classroom***********
Schoology***********
Teams *********
* Indicates that the platform has the features and attributes listed in the columns.
Table 3. Features and attributes: communication.
Communication
Platform NameAdsInternal EmailDistribution ListsForumsChatNewsIntegrated Online Video ConferencingAudio-ConferenceSupports VideoSupports AudioSending SMS to StudentsEmail Alerts
Blackboard********** *
CANVAS********** *
Chamilo** ******* *
Claroline** ** *
Coursera********** *
Edmodo********** *
e-Learning************
Fronter************
Mentor********* *
Moodle****** *** *
Sakai* *** **
SELF** ** ***
Google Classroom************
Schoology************
Teams************
* Indicates that the platform has the features and attributes listed in the columns.
Table 4. Features and attributes: resources.
Resources
Platform NameSearch ToolOffline HelpOnline HelpPersonal PagesPersonal AgendaCalendarWorking GroupsBook of NotesWikiBlogFaqsSurveysGlossaryExternal Link RepositoryVirtual LibraryTasksAuthor Tool
Blackboard*****************
CANVAS*****************
Chamilo************** **
Claroline ** * ** ****
Coursera*****************
Edmodo*****************
e-Learning************* ***
Fronter*****************
Mentor** *** * *
Moodle*****************
Sakai*****************
SELF* * * * *****
Google Classroom*****************
Schoology*****************
Teams*****************
* Indicates that the platform has the features and attributes listed in the columns.
Table 5. Features and attributes: operation and general features.
Operation and General Features
Platform NameMonitoring and Monitoring of AssessmentsRating SystemCustom Rating ScalesWork Done and EarringsStudent Registration and Follow-UpRegistration and Follow-Up of TutorsReportingPossibility to Import/Export Data in XMLSCORM StandardIMS StandardAICC StandardOperating System: LinuxOperating System: MS WindowsOperating System: OtherBack-up CoursesAdaptable in Online Classes and/or Face-to-Face LearningEnable or Disable Blocks of InformationStudent User ManualTutor User ManualActive Community of Users and DevelopersAdaptability for Small and/or Large ProjectsPlatform Integration with External Applications/Software
Blackboard**********************
CANVAS *********************
Chamilo**********************
Claroline***** * * **
Coursera *********************
Edmodo *********************
e-Learning ******* *** *****
Fronter************ ***** **
Mentor********* **********
Moodle********* ************
Sakai********** ** ** *****
SELF********* * ** *****
Google Classroom*********************
Schoology*********************
Teams*********************
* Indicates that the platform has the features and attributes listed in the columns.
Table 6. Comparison of the features of different web-based platforms for virtual learning.
Web-Based PlatformNumber of ParticipantsTime LimitsChat FeatureRecordingCostBreakout GroupsConference Phone
Google meet/Classroom150NoneYesNoFree until July 2020NoYes
Zoom10040 minYesYesFreeNoYes
Zoom paid10024 hNoYes$15 per month$49.99 per room per monthYes
Facetime (apple devices only)32NoneNoNoFreeNoNo
Facebook liveNo limit4–8 h (depending on device)In the commentsNoFreeNoNo
Facebook video chat messenger50NoNoNoFreeNoNo
Teams10,000NoYesYes8–35/monthYesYes
Google Hangouts10NoneYesNoFreeNoNo
Freeconference-call.com (video and/or phone)10006 hYesYesFreeNoYes
Skype5024 hYesYesFreeNoYes
Slack15NoYesNoFreeNoNo
Moodle20NoneYesNoFreeYesNo
Blackboard Collaborate300NoYesYes10–90/monthYesNo
Table 7. Cronbach’s Alpha Coefficient.
Category UVM Students
Factorα
Satisfaction with the use of Teams0.868
Resources of the Teams platform0.907
The functionality of the Teams platform, for the development of the academic process0.926
Total0.868
Table 8. Correlation analysis for each question in the data collection tool.
VariableUsability
Instrument question numberQ5Q6Q7Q8
Correlation0.450.540.540.53
Average high values4.6324.4914.0934.093
Average low values3.2182.5532.2202.143
Difference of means1.4141.9381.8721.950
VariableResources
Instrument question numberQ9Q10Q11Q12Q13Q14
Correlation0.510.460.510.50.490.47
Average high values4.2154.2934.3034.1124.0803.846
Average low values2.3002.3542.2412.1732.1192.089
Difference of means1.9151.9392.0621.9381.9611.757
VariableFunctionality
Instrument question numberQ15Q16Q17Q18Q19Q20
Correlation0.380.450.450.450.450.48
Average high values4.5374.6444.6064.6324.5944.743
Average low values3.8593.8383.7783.8013.7853.878
Difference of means0.6770.8060.8290.8310.8090.865
Instrument question numberQ21Q22Q23Q24Q25Q26Q27
Correlation0.420.470.490.380.230.380.27
Average high values4.6724.6024.6744.5524.3814.5434.408
Average low values3.8783.7313.7493.8363.9513.8673.869
Difference of means0.7930.8710.9240.7160.430.6770.54
Table 9. Estimated parameters of the SEM model.
ParameterEstimatedParameterEstimatedParameterEstimated
lambda10.65lambda170.43theta70.19
lambda20.96lambda180.54theta80.45
lambda31.03lambda190.53theta90.53
lambda41.08lambda200.50theta100.69
lambda51.10lambda210.39theta110.29
lambda61.17lambda220.44theta120.22
lambda71.19lambda230.43theta130.22
lambda81.03rho1−0.08theta140.25
lambda91.06rho20.38theta150.22
lambda100.87rho30.26theta160.20
lambda110.40theta10.61theta170.25
lambda120.46theta20.48theta180.20
lambda130.48theta30.40theta190.18
lambda140.48theta40.47theta200.24
lambda150.50theta50.26theta210.36
lambda160.47theta60.24theta220.27
theta230.36
Table 10. R2 for endogenous variables.
Q5Q6Q7Q8Q9Q10Q11Q12
0.40900.65920.72780.71420.82350.85110.88200.7050
Q13Q14Q15Q16Q17Q18Q19Q20
0.67950.52370.35760.48560.51010.47870.53510.5245
Q21Q22Q23Q24Q25Q26Q27
0.42530.59350.61330.50460.30070.40940.3375

