Photogrammetric Measurement of Erosion at the Sabbath Point Beothuk Site in Central Newfoundland, Canada


1
Department of Archaeology, Faculty of Humanities and Social Sciences, Memorial University of Newfoundland, P.O. Box 4200, St. John’s, NL A1C5S7, Canada
2
High North Department, Norwegian Institute for Cultural Heritage Research (NIKU), Fram Centre, N-9296 Tromsø, Norway
3
Kazan Federal University, 18 Kremlevskaya Street, 420008 Kazan, Russia
4
College of Humanities, Arts and Social Sciences, Flinders University, Sturt Road, Bedford Park SA 5042, GPO Box 2100, Adelaide SA, Australia
*
Author to whom correspondence should be addressed.
Sustainability 2020, 12(18), 7555; https://0-doi-org.brum.beds.ac.uk/10.3390/su12187555
Submission received: 4 August 2020
/
Revised: 9 September 2020
/
Accepted: 11 September 2020
/
Published: 14 September 2020
(This article belongs to the Special Issue Cultural Heritage and Natural Disasters)
Abstract
:Erosion at archaeological sites in Central Newfoundland, Canada is a major concern, which is compounded by the fact that there has been a dearth of archaeological research in this region. While more than 70 house pits are known, very few excavations have examined whole features in the Exploits River Valley (ERV), and the archaeology of many has not been examined yet. The aim of this study is to examine the rate of erosion at the Sabbath Point house pit, a recently recorded archaeological site, located on the bank of Red Indian Lake (RIL), and to describe a low-cost methodology for analysing site level bank changes. This site is particularly important, as it represents an example of a late Beothuk residential feature about lifeways practiced in this region. The surveys employed here were carried out using image-based modelling. GRASS GIS was used to measure the diachronic difference between bank edges. The Digital Elevation Models (DEMs) were then compared, and the differences were measured using a transect based method. The erosion measurement has shown that Sabbath Point is in danger of being completely eroded. This shows that a salvage excavation program covering the entire feature is necessary within the next few years, as the feature itself will begin to erode.
1. Introduction
The erosion of cultural heritage sites has been analysed using geospatial technology since the 1990s, although studies have primarily focused on the use of satellite imagery [1] and spatial statistical methods [2]. These studies tend to apply either analytics focused on forecasting erosion [3] or measuring ongoing erosion from prior data [4,5,6]. These efforts are directed towards different natural disasters like landslides [3,7], gully erosion [8,9], rockfalls [10], debris flow [11,12], flooding [13], coastal erosion [14], and anthropic causes including: infrastructure works [15], urban sprawl [16], intensive agriculture [17], etc. Cultural heritage represents an intersection between history and society [18], and archaeological cultural heritage has proven to be an important nexus of identity and social cohesion as well as a valuable economic resource via tourism [19]. Therefore, assessing the current state of threatened cultural heritage is crucial, given its importance.
The stochastic nature of erosion has also been widely discussed, as has the increasing severity of weather patterns [20]. Studies have shown that archaeological sites within the arctic and sub-arctic are under greater threat from anthropic effects due to global warming. Whether satellite imagery or geophysical prospection are used [21], the results are promising, and the methods are continually being improved upon.
The use of unmanned aerial vehicle (UAV) photogrammetry in quantifying the dynamics, morphology and erosion of landforms has become increasingly common, as it offers high-resolution local imagery of archaeological sites. UAVs have been used to monitor river morphology, bank erosion [22] and to create data for use in river management and flood analysis [23]. The use of UAV photogrammetry in archaeology began properly around 2010, when a proliferation of archaeological papers appeared which analysed the usefulness of UAVs for understanding sites [24] and to document their erosion [25]; however, this technique is still in its infancy, and quality standards have not yet been formally agreed upon. Image-based modelling has been used to record archaeological features and excavations [26], and to record artefacts [27]. Verhoeven [28] began the widespread discussion of the use of aerial image-based matching in 2011, and the technique has been widely tested against traditional aerial photography [29]. The use of both aerial imagery and terrestrial photography for image-based modelling has also been tested in Greece, where a combination of aerial and terrestrial photography was used to prepare 3D models of the features [30]. The combination of terrestrial and aerial photography has become more useful as image-based modelling algorithms have also improved [31]. This allows 3D models to be prepared using different acquisition methods as needed. Early attempts to use photogrammetry for measuring erosion confirmed that non-metric cameras can be used to prepare 3D models to examine changes in landscapes [32].
Recent investigations in the use of photogrammetry for measuring erosion have shown that an external error of 3 cm is likely when compared to other techniques; however, the method has also been shown to be effective in analysing subtle landscape changes, even in slow moving rivers, as the internal error is often much lower [33]. There have been several archaeological studies focusing on the use of photogrammetry for measuring the erosion of cultural heritage and the use of UAV imagery to analyse erosion [25,34,35,36,37], but these have focused on map based comparisons and the analysis of photos and orthophotos. These have been conducted at different scales, from studies on footprints [36] to studies of monumental sites [25,37]. This paper introduces a methodology for studying bank erosion using a DTM analysis, focusing on the indigenous archaeology of the Boreal forest, an area which has traditionally been ignored, as archaeological sites are often obscured by vegetation and thus may remain un-recorded. Archaeological techniques, including erosion studies, must be altered to work in these conditions [38]. This study is novel, as it applies a photogrammetric method using DTMs for studying a bank edge at a cultural heritage site. As similar photogrammetric methods have been used in environmental studies [32,39], this technique can be implemented for studying erosion at archaeological sites. The use of consumer grade cameras for measuring erosion has also been tested, with the result that these can be effective for analysis [39].
Canada’s cultural heritage, especially the archaeological sites located on the coastal areas in the Arctic, is threatened by thermokarst activity [40] and coastal erosion [40,41,42]. Archaeological sites from the coastal area of Newfoundland are vulnerable to increased erosion resulting from future sea-level rise and increasingly intense weather caused by global warming [43]. As studies on erosion at cultural heritage sites located on the shores of inland man-made reservoirs are scarce [4,5,6,44,45], this study is necessary to assess the danger to archaeological features at Sabbath Point, Newfoundland, Canada. The study involved the recording and measurement of the bank at the Sabbath Point site using image based modelling, referencing the models, and then measuring the bank by outlining the edge and also by using an elevation profile method in GRASS GIS [46]. The use of image-based modelling, a photogrammetric technique based around matching images to create 3D models [47], has become a common technique for archaeological recording, but not for measuring erosion.
The current study will focus on the rate of erosion on the bank beside the Sabbath Point house pit, which is gradually eroding into RIL, central Newfoundland, Canada [48]. This feature was part of a larger historic indigenous use of this area by the Beothuk, who have since become extinct [49]. This study was carried out as part of a larger project “Beothuk Settlement in the Exploits River Valley” (ERV). This project focuses on surveying the archaeological landscape of the ERV through UAV imagery and geospatial statistics, to examine the social characteristics of these features.
Regional Settings and Archaeological Background
Sabbath Point is a historical indigenous residential feature on the bank of RIL, in Central Newfoundland [50] (Figure 1), north of the mouth of the ERV (Figure 2), and is among the later sites inhabited by the Beothuk, who were the indigenous people of this region. This site is believed to have been inhabited in the 18th century, as it has a hexagonal outline, which fits with Marshall’s house pit typology [49].
The Sabbath Point house pit has seen three separate excavations (the areas excavated are visible in Figure 3), which have each focused on the interior of the house pit. These took place in July 2018 [50], September 2018 [51], and June 2019 [52]. As they focused on the interior of the feature, they did not examine the exterior architecture, aside from the September 2018 excavation, which showed that they were partially stone based. The area around the site contains important indigenous cultural heritage (CH) sites and is within a settled landscape. Historical evidence suggests that this area was almost exclusively inhabited by the Beothuk between the 16th and 19th centuries [53]. The relationships between different indigenous groups in Newfoundland have been antagonistic [54] but recent discussions have called this into question [55] and suggest that a more nuanced understanding may be necessary. The wider cultural landscape has also been negatively affected by anthropic changes to the landscape. Erosion measurement has been used here to show how erosion is proceeding at the Sabbath Point house pit, and that erosion on RIL is a danger to other regional features.
The ERV and RIL in central Newfoundland were cultural hot spots throughout human history in the area and have seen 5000 years of human habitation [56]. The site immediately to the north of Sabbath Point, Indian Point, was occupied by the Maritime Archaic Peoples, followed by the Little Passage peoples (the ancestral Beothuk) and then the Beothuk themselves. Within the ERV, barring the Dorset Paleo-Inuit, there are sites associated with every indigenous group to live in Newfoundland [57,58,59]. The area was culturally central to the Beothuk [53]. The shore of RIL also held the funerary hut of both Nonosabasut and Demasduit, in 1820, although these features have since disappeared, and are likely to have eroded into RIL [49]. The indigenous archaeology of this region is eroding into RIL at an accelerated rate, and many features are likely to have been lost.
The underlying geology of the area is within the Dunnage zone of the Newfoundland Appalachians. Volcanic and sedimentary rocks within Dunnage zone are remnants of continental and intra-oceanic areas and are composed of back-arcs and ophiolites deposited within the Iapetus Ocean during the Cambro-Ordovician period. The Red Indian Line separates rocks of the Buchans and Robert Arm groups of the Notre Dame Subzone from the Victoria Lake Supergroup of the Exploits Subzone. The Red Indian Line is located along the south shore of RIL and extends on a north-northeast direction along Joes Lake and eastern edge of Dawes Pond and continues northeast into Notre Dame Bay [60]. The climate of Newfoundland is typically northern Atlantic, with short summers and long, mild winters. The average temperature in central Newfoundland is about 17 °C in the summer and −6 °C during the winter. Mean annual precipitation ranges from 700–900 mm/yr and the mean annual snowfall ranges between 275–325 cm [61].
The erosion has been caused by the raising and lowering of the water-level for the Grand Falls-Windsor power plant downstream of this site, and this has impacted the cultural heritage of the region. Since 1980, Beothuk house-pits at different areas within Central Newfoundland have also eroded into the river [58,62,63]. At Red Indian Falls (RIF) 5, 23 km to the East of this site, a house pit has eroded into the Exploits River [63], at RIF 1 the features are disappearing because they are regularly flooded [64], and at Boom Island several hearth features from the ancestral Beothuk are almost permanently underwater [58,65]. Erosion can destroy features, and submergence under a fast-flowing river will likely remove subtle features than can allow surface archaeological analyses. There have been no prior studies of erosion at archaeological sites in the interior of the island. While the Coastal Archaeological Resources Risk Assessment (CARRA) Project [66] focused on coastal archaeological resources, very little thought was given to the state of inland sites. The reason for this is that interior archaeological sites on the island of Newfoundland have largely been ignored in archaeological literature, as they do not fit the current coastal model of life on the island prior to contact [67].
A method for studying the erosion at this site, since its discovery in 2016 [68], was necessary to provide an approximate baseline for how erosion should be expected to continue at other sites [59]. Image based modelling was used to prepare measurements of this feature, as it is a scalable method for measurement which can be applied to different areas easily [69]. These models were processed using Agisoft Metashape, which has recently been shown to have the most accurate photogrammetric algorithm [31], when compared with open source tools, and has been applied to archaeology at several different scales and in varied situations [24,27,70]. Agisoft Metashape is both more user friendly, more accurate, and has a more efficient workflow than its nearest rival, MicMac ENSG [71].
2. Materials and Methods
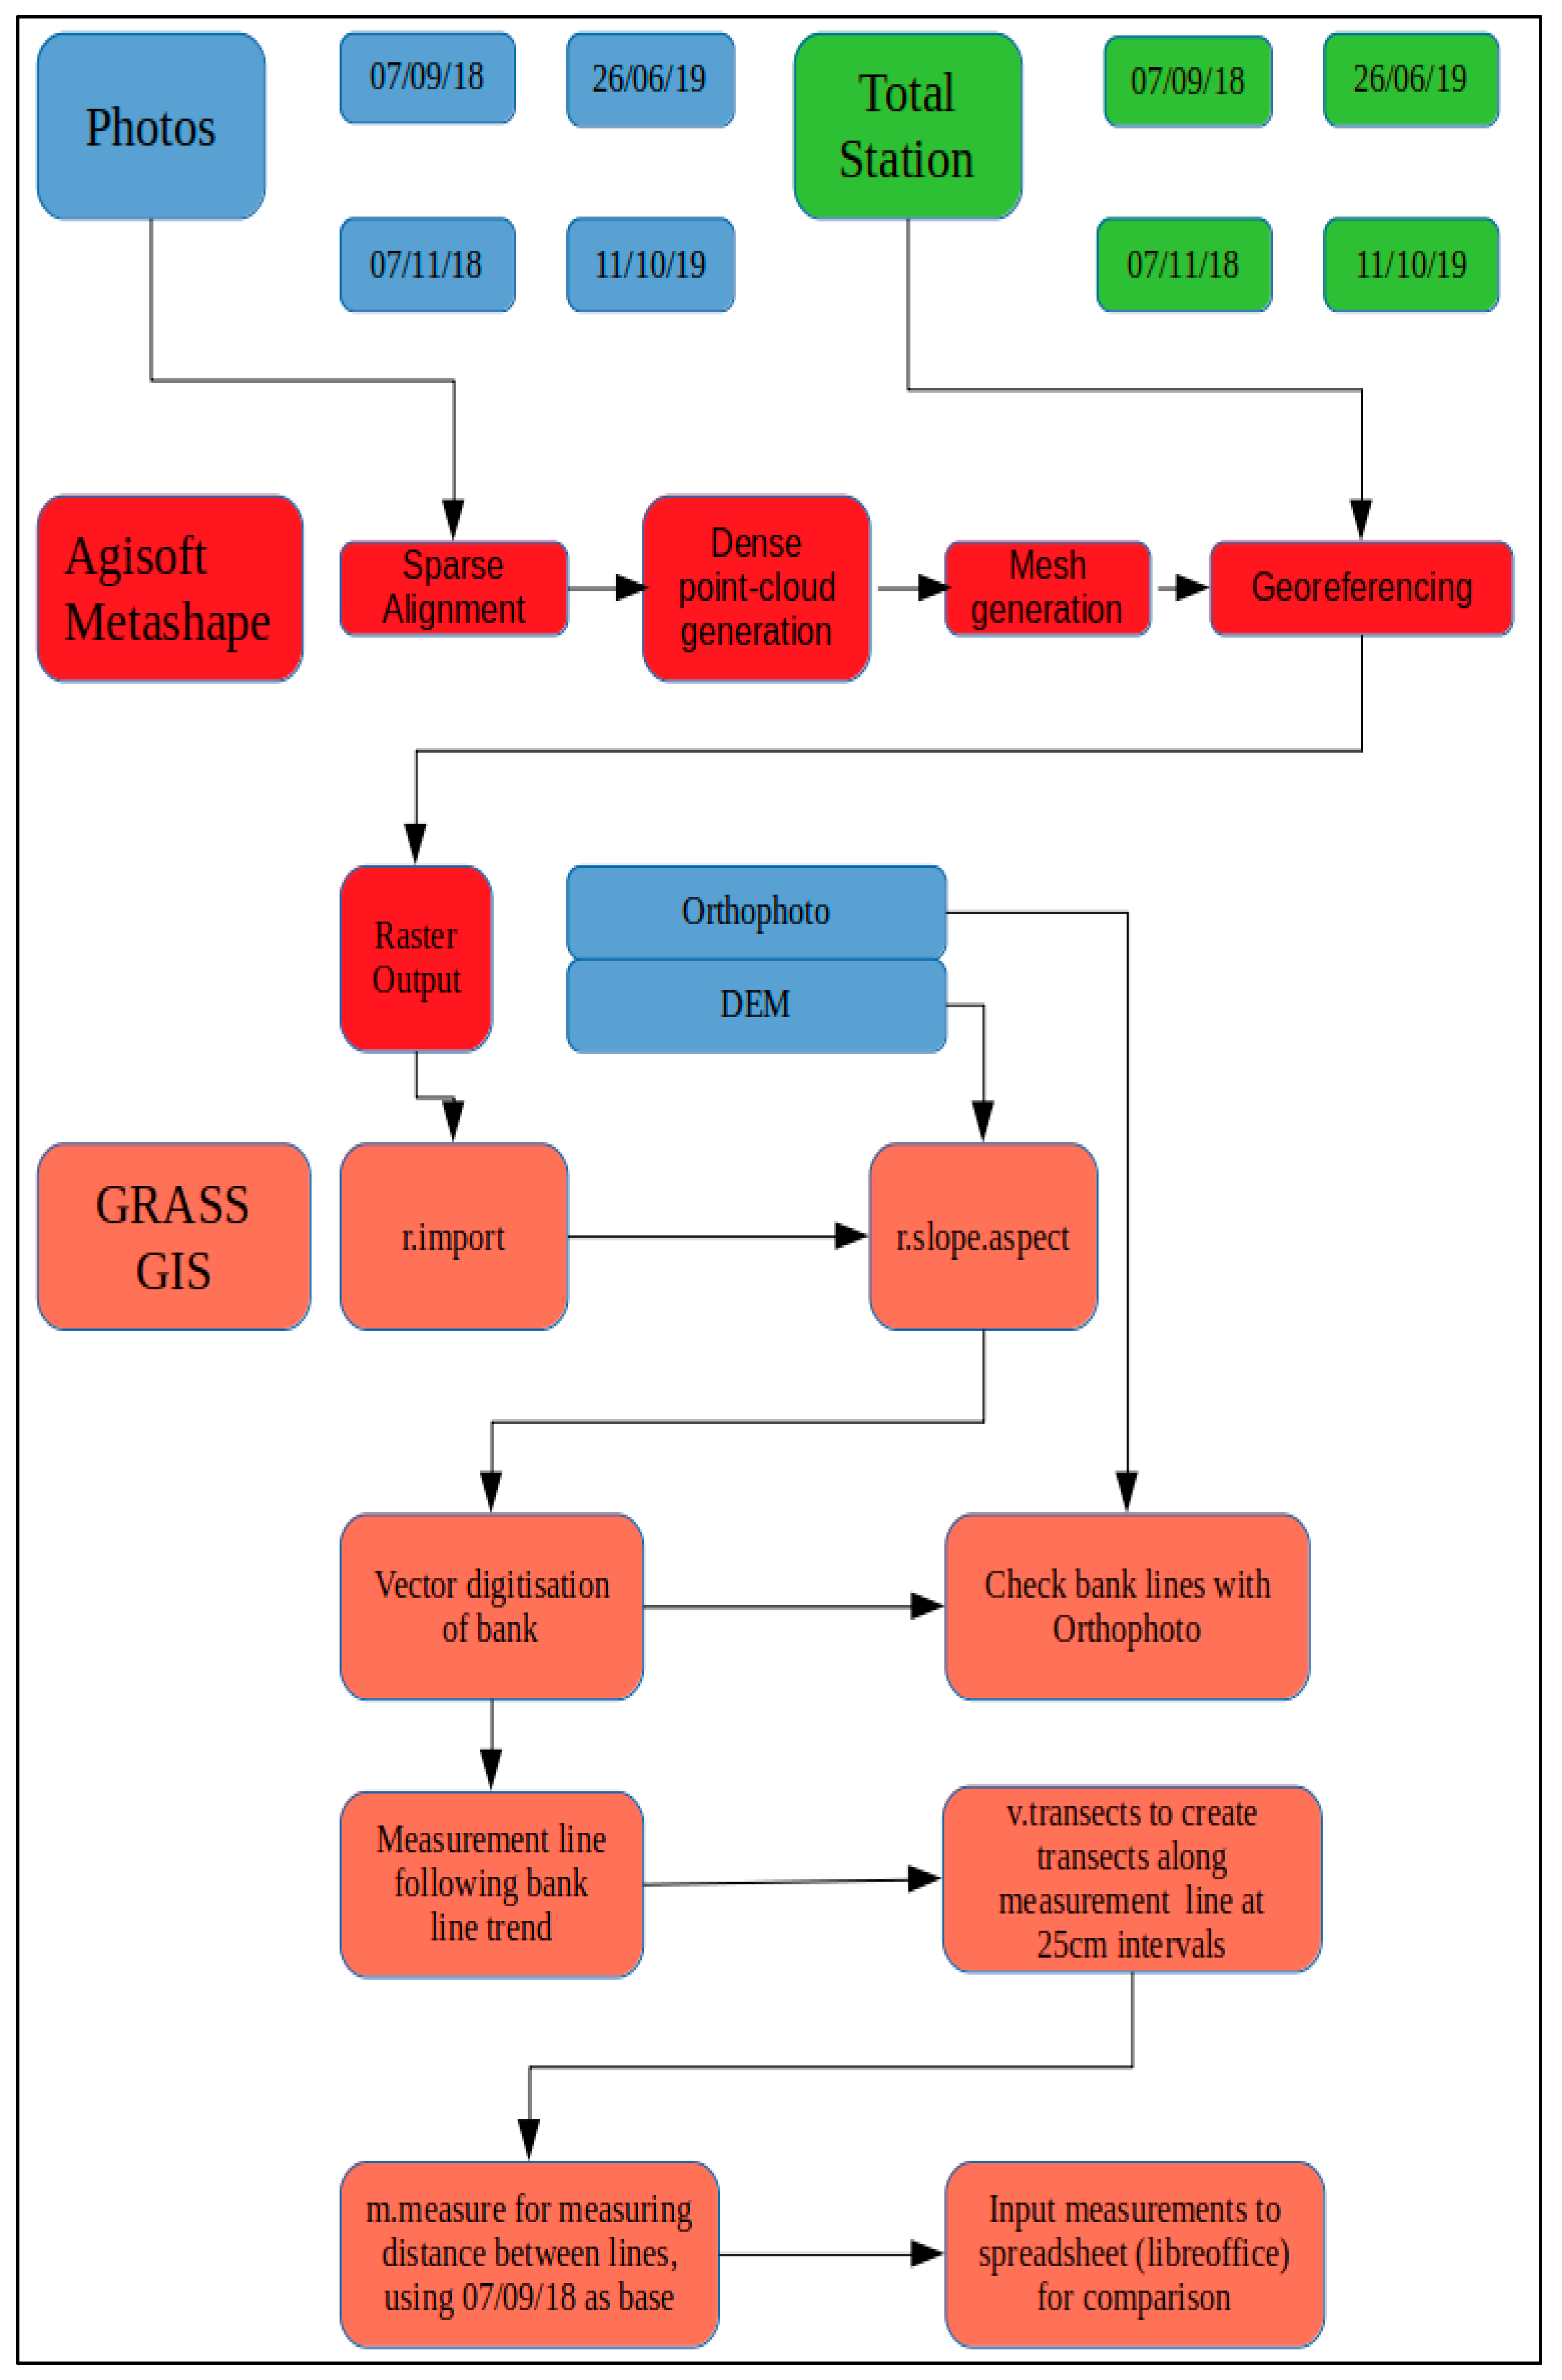
The measurement of erosion at Sabbath Point has been carried out using a photogrammetric technique, image-based modelling, and analysed using GRASS, an open source GIS [46]. A comprehensive flow chart methodology is outlined in Figure 4.
Image-based modelling was used to measure the bank edge as field measurements would have provided less precise models of the bank edge, and the extra time spent standing on the edge of the bank may have damaged it. The data was gathered on the 07/09/2018, 07/11/2018, 26/06/2019, and 11/10/2019, during each fieldwork visit to the region. The photos were processed in Agisoft Metashape, using points to tie the photos together, then to build a dense point cloud through interpolation, and finally to create a mesh [53]. A final model, which did not cover the edge of the bank, was acquired on the 24/06/2019 (and was used to reference the other models against the grid set up using the total station (Nikon 300 Series Total Station). The meshes were then referenced to the local grid using this model. A Digital Terrain Model (DTM), and an Orthophoto were processed from these models. These are then imported into GRASS GIS, where they are processed to produce a terrain visualisation (aspect, or the direction of slope beginning at North, with 0 degrees). The aspect is then used to digitise the edge of the bank. Then a line along the bank edges was drawn to create a guide for transects to be drawn to measure the edges along their length. The measurements are then compared in a spreadsheet.
2.1. Photograph Acquisition
Two different photogrammetric acquisition methods were used to prepare the 3D models. The methods of acquisition used were low altitude UAV (using a Phantom 3 Pro) and commercial handheld photography (using a WB36F). These tools, DJI Phantom UAVs and consumer grade cameras, have both been used separately for analysing erosion [5,39]. The photographic acquisition was carried out whenever fieldwork in the area was taking place, to maintain a record of the position of the bank during this time. The handheld camera was used during two of the 3D modelling attempts, it was not possible to prepare 3D models using a UAV and a handheld digital camera was used instead on the 07/11/2018 and 26/06/2018. The aim of the acquisition scheme was to maximise coverage, and to ensure that each part of the bank was covered by at least 9 photos. During the 07/09/2018 acquisition 182 phots were taken, on 07/11/2018 177 photos were taken, on the 26/06/2019 acquisition 432 photos were taken, and on the 11/10/2019 acquisition 665 photos were taken. The variation in the number of photos was due to the size of the area covered by each model, and the coverage of the house-pit. The 24/06/2019 acquisition included 163 photos and was used to reference the models. This did not cover the bank and focused on the interior of the house-pit.
The acquisition flight with the UAV was performed manually, as autonomous flight paths rely upon the UAVs internal GPS, and can often waver, making planned flights unsafe in areas under tree canopy. When using the camera, photos were taken from 1–2 m from the bank edge, separated by around 50 cm, or a single step. The camera-based acquisition method involved taking a photo pointing at the bank, or the house-pit, and another at an oblique angle, to increase the possibility of photo matching. As handheld photogrammetry is not particularly suitable for large horizontal features [64] a focus on the bank was necessary, as it provided a vertical dimension, that made it easier to prepare a model. The photographic acquisition method with the UAV involved taking photos 2–4 m above the feature flown in a rough grid, with photos taken directly facing the feature and oblique angles. The useful geometric data captured in oblique photos is often uneven throughout the photo but allows for several photos to be matched more easily, as they will include geometric data from a wider area.
2.2. Image-Based Modelling Method
The photographs were processed using Agisoft Metashape [72]. Agisoft has the most accurate image-based modelling algorithm [31] when compared with other photogrammetric programs and is the industry standard in archaeology because of its user friendliness, the fact that data remains on the computer of its user, and is cheaper than the nearest competitor. MicMac ENSG, the nearest open source competitor, has recently been in transition between two different algorithms, and was not stable enough to be used here. Image-based modelling works by comparing photographs of the same object, which share geometric features, to produce a set of points which tie together each photograph [64,72]. These are then added to by interpolating points from the photographs around this, and these are then used to prepare the whole 3D point cloud. This point cloud is then sampled to a fifth of the dense cloud density for processing to create a mesh. A mesh, or triangles joining every point to form a surface are produced. The mesh was used to create the Digital Elevation Model (DEM), and an Orthophoto Mosaic. The 3D models were then compared against each other after referencing the models against the model prepared on the 24th of June 2019. As the site is largely under thick tree canopy, Real Time Kinematic (RTK) points in certain areas of the site had high levels of error [53]. The 24 June 2018 model was aligned using the corners of the June 2019 excavation, measured using the total station. It had an error of 3 cm from the grid. This model was then used to pick out points in common with each different model, and these were evaluated according to their error within Agisoft. The 07/09/2018 model had an error of 2.8 cm, the 07/11/2018 model had an error of 1.5 cm, the 26/06/2019 model had an error of 1.9 cm, and the 11/10/2019 model had an error of 1.2 cm. The greatest error present was 3.5 cm on a control point in the 07/09/2018 model. Each of the models used for measurement had 6 or more control points, spread throughout the model. As the area around the bank is changing, points from near the edge of the bank, could not be used. The bank is subsiding, as it is being undermined. The subsidence of the bank meant that preparing a linear measurement using the total station with a high level of detail (which may have required 30 measurements), could have caused further damage to the edge of the bank. The DEMs and Orthophotos are then exported from Agisoft for import into GRASS GIS.
2.3. Geographic Information System (GIS) Processing
The DEMs and Orthophotos were then imported to GRASS GIS which was used to outline the edge of the bank by comparing different visualisations of the 3D models and drawing the line of the bank over these. GRASS GIS was used because it has powerful and varied tools for raster analyses [72]. The raster processing involved testing the usefulness of different visualisations of the model, which included using comparisons of slope and DEMs, hillshade (or relief), and composite images. The comparison of different visualisation has been shown to be an effective tool in the past and has been central to resolving feature edges in other studies [39].
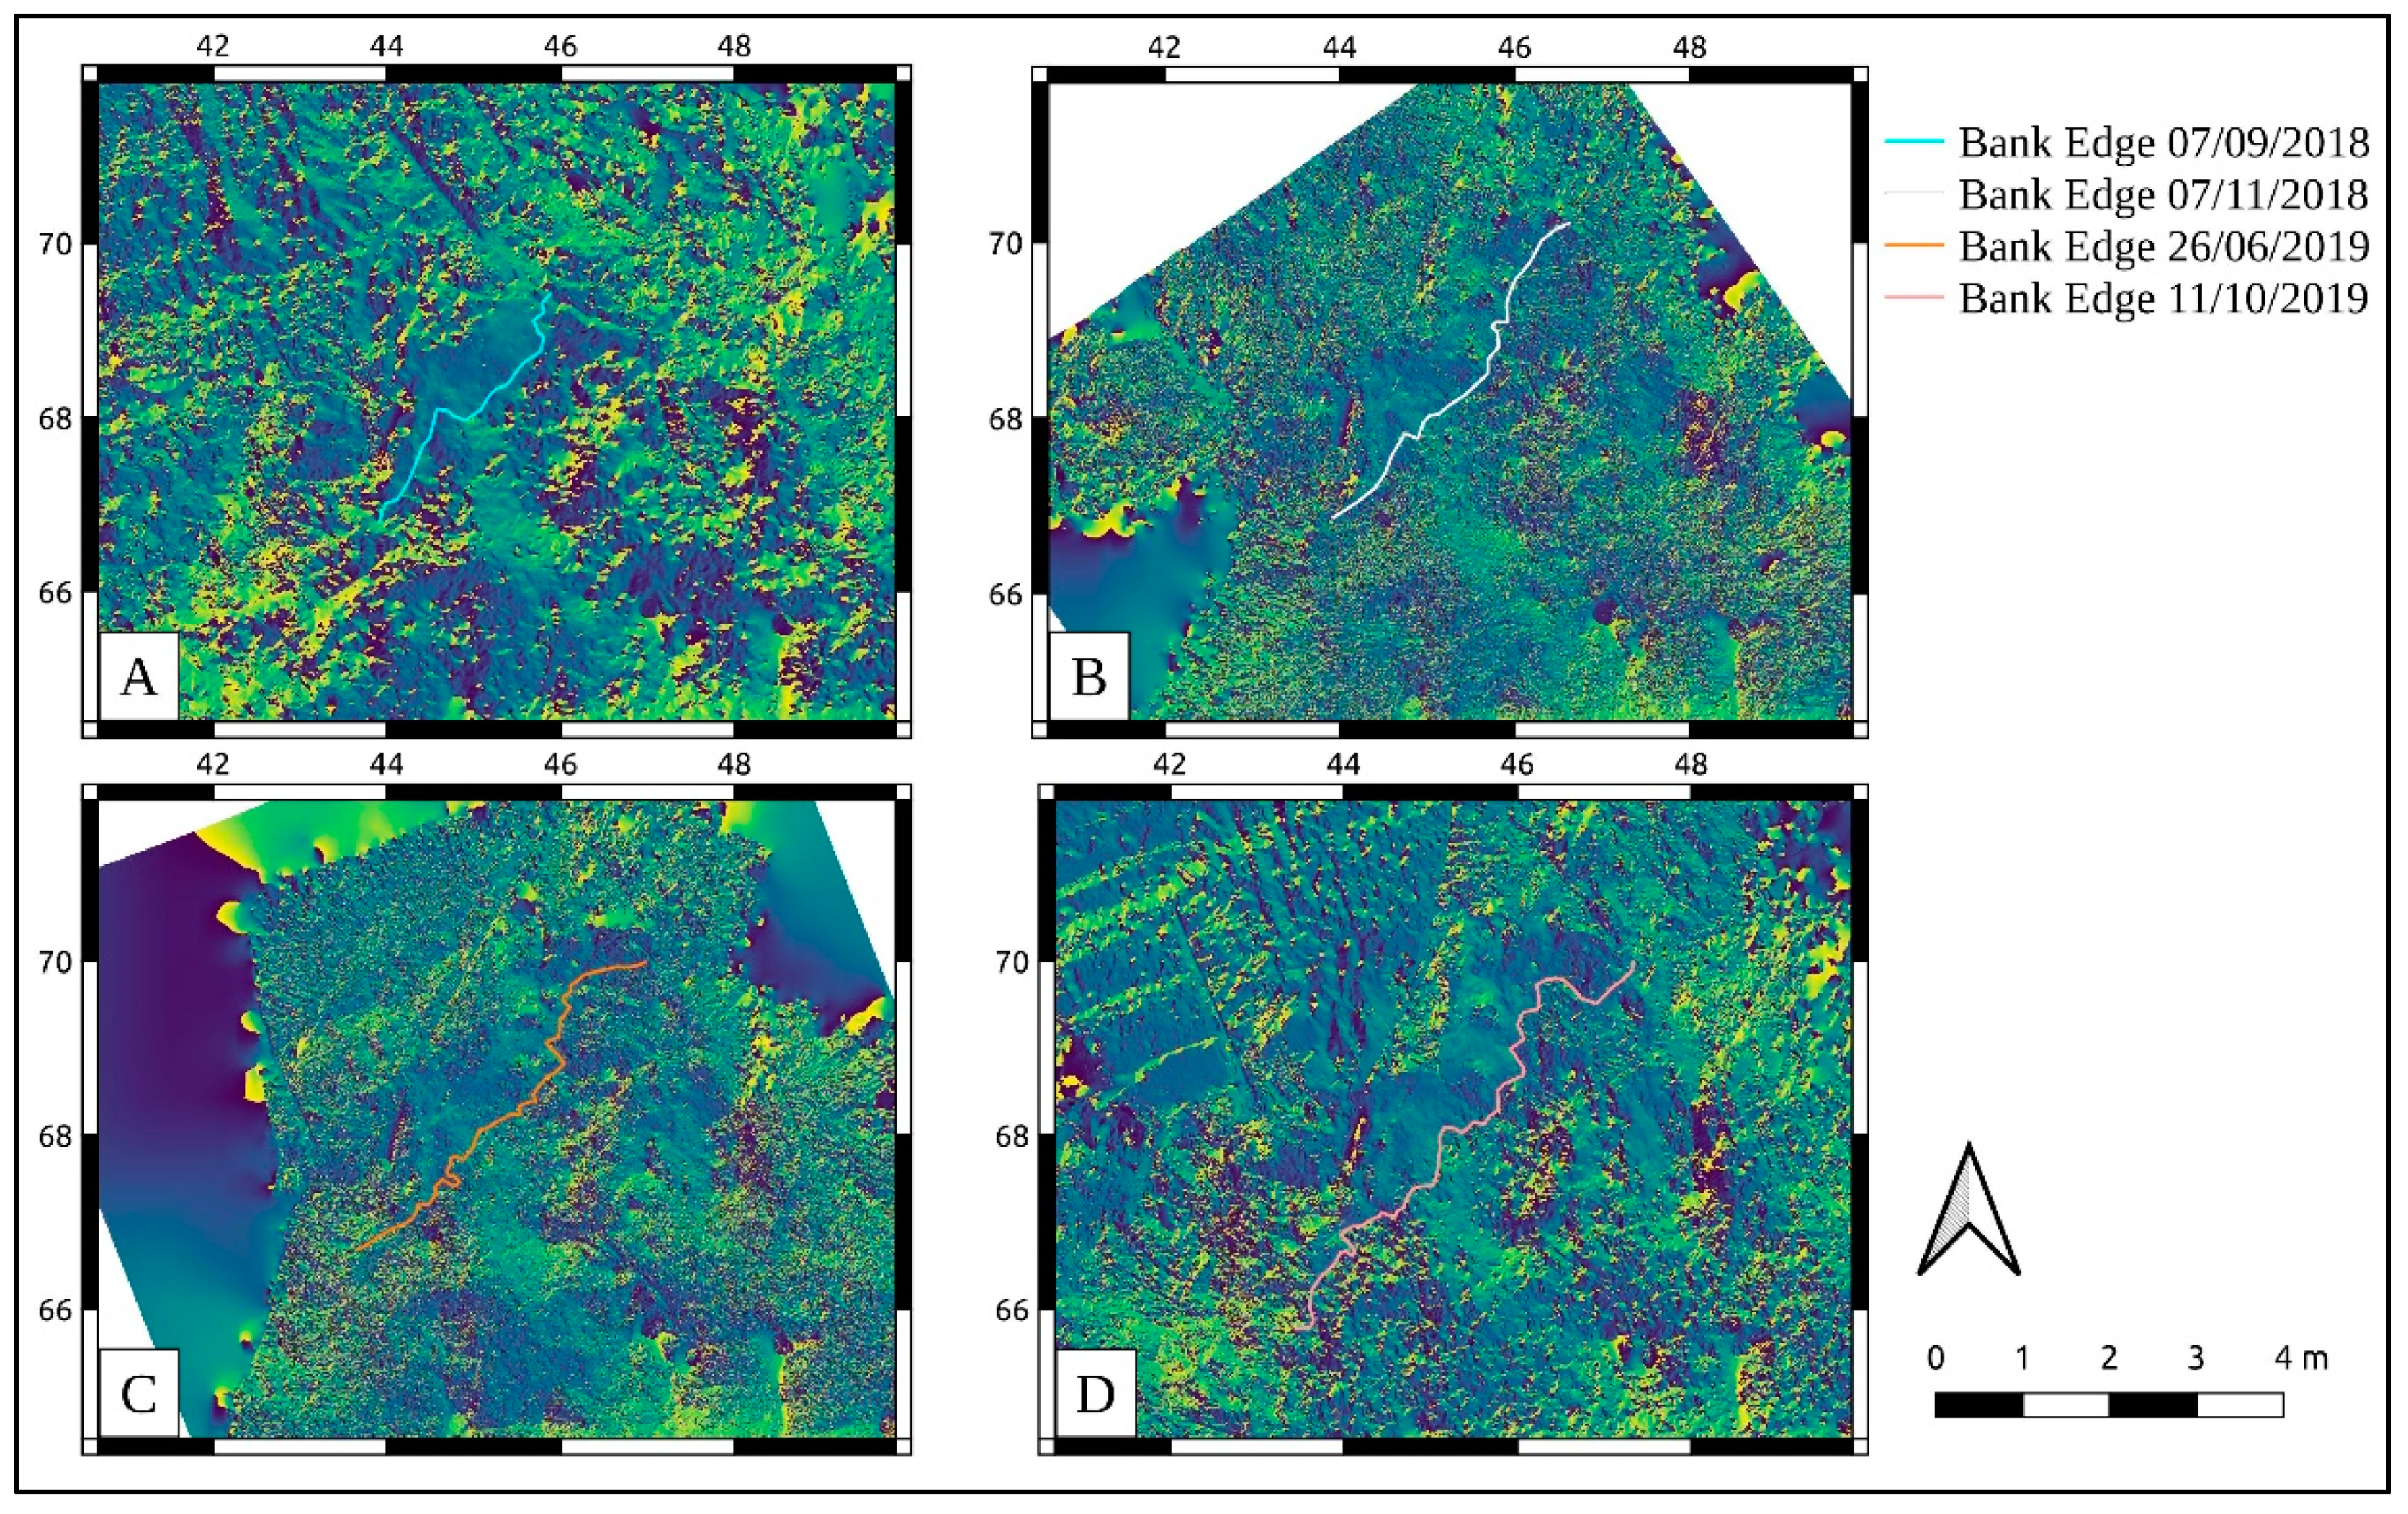
Finally, the Aspect visualisation was used (prepared using the r.slope.aspect module), as this highlighted the edge of the bank more clearly. The edge was digitised as the aspect changed between sloping North West to sloping South East. The edge was recognised by a solid change in colour which corresponded to the difference in direction, and the edge of the bank was highlighted along this. In Figure 5, the four aspect views of the site can be seen, and the fact that the change in the aspect marks where the model is used. The aspects show how a change in the colour gradient shows where the bank should be drawn on. This was overlaid on the DEM, to show a terrain visualisation that could be used to draw on the edges using the GRASS GIS digitisation tool, over the first major change in direction of the bank.
Similar 2D methods are widely used to measure erosion [4,6,14,41]. 2D digitisations are commonly used to analyse 3D models [34,73], and a reliance on satellite imagery and orthophotos can be seen throughout the analysis of erosion on banks. There are limitations to 2D methods, and 3D models offer the possibility of volumetric analysis through voxel analysis in GRASS GIS. This method may allow more detailed results to be rendered, as dynamic processes involved in erosion should show that the bank has expanded. However, this would reduce the ability of researchers to use historic data, as historic maps tend to have either limited or non-existent 3D information. At best this data are often present as contours or relief maps. This is also unnecessary in the case of the present study, as the data required is 2D, to prepare an analysis of the features to show the distance that the bank is retreating.
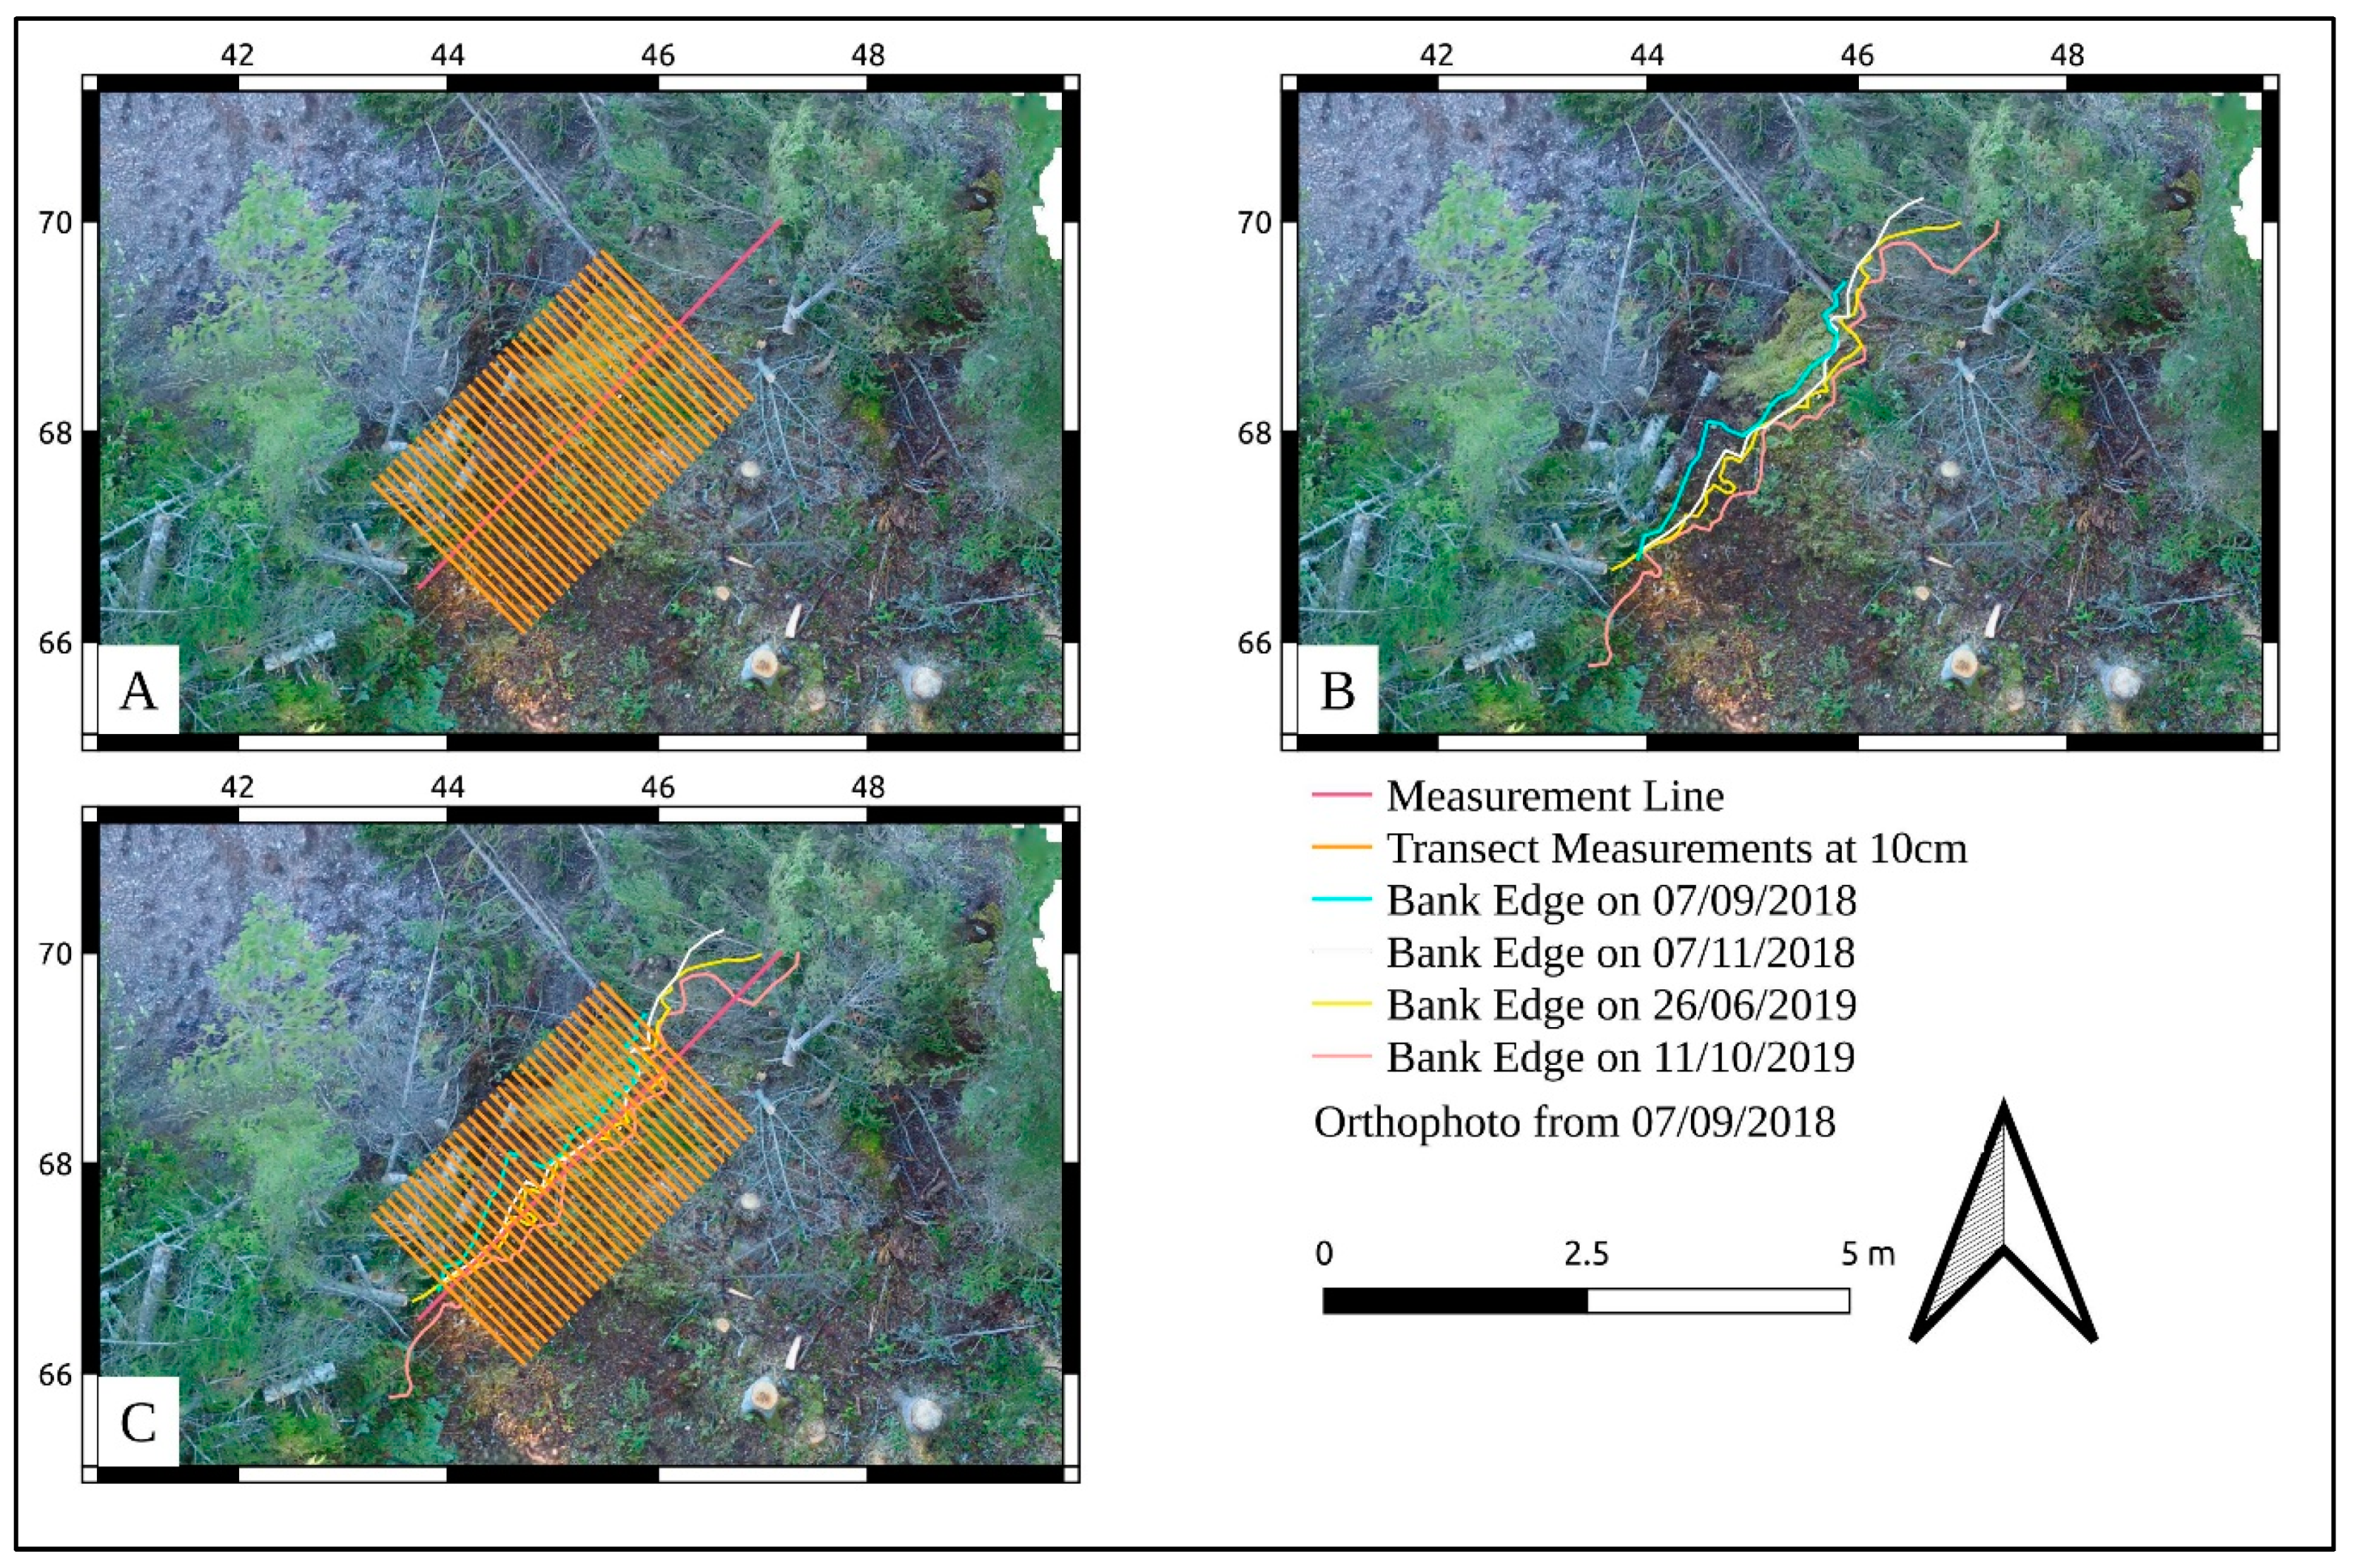
A line following the broad trend of these models was then drawn along the bank, following the trend of the other models, to provide a common orientation for the measurements. To prepare measurements, transects were drawn at 0.1 m. The distance between the bank edge at 07/09/2018 and the later bank edges was measured along the transects, to show how the bank edge has retreated. The layering of the transect and the measurement lines, when compared with the bank edge can be seen in the diagram below to create a visualisation of how the data are being gathered (Figure 6). This shows how different layers can be used to prepare the measurements. Finally, the GRASS GIS data was imported into the QGIS GRASS Module, where it was used to prepare the graphics used here.
3. Results
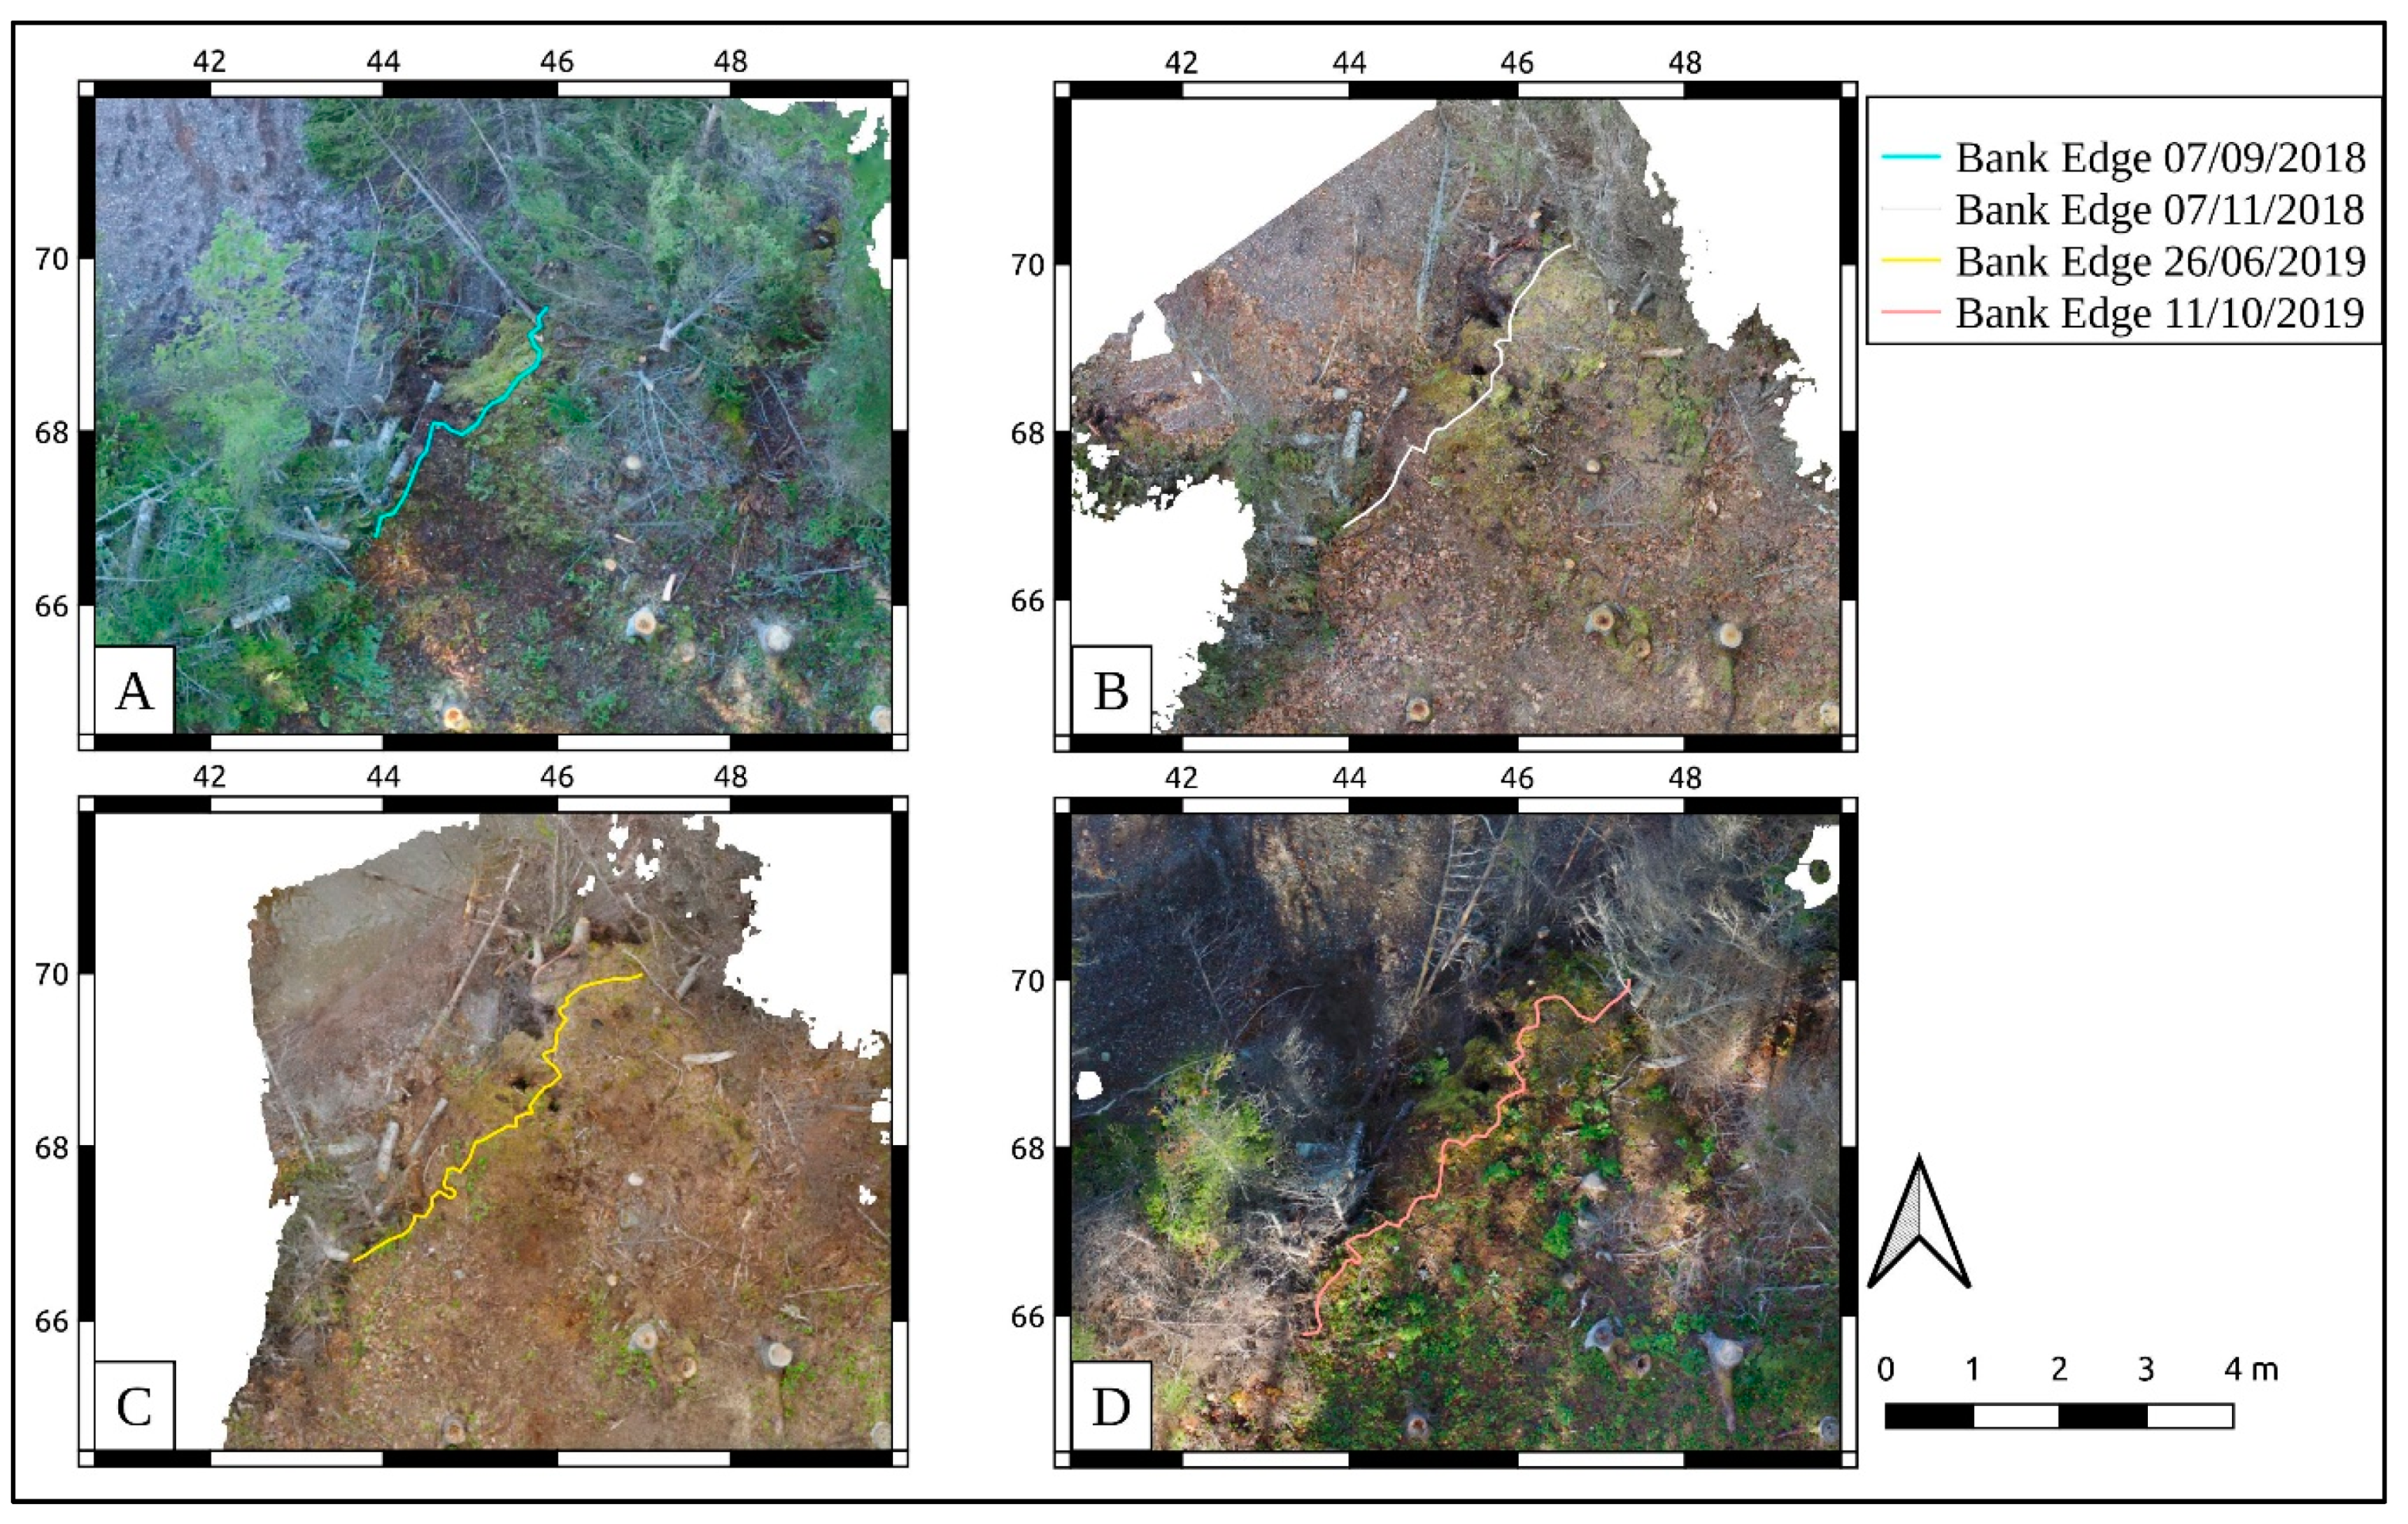
The changes in the bank can be seen in Figure 5 and Figure 7, with each line representing the bank at the given dates, with the image below showing the bank at different areas. The background shows the orthophoto of the site based on the 07/09/2018 imagery captured using a Phantom 3 Pro. To the immediate south of the bank, the house-pit wall can be seen. This shows how this site is in danger. Much of the architectural remains of the houses and zooarchaeological evidence in surrounding middens are placed outside the house [26,29,50]. The exterior archaeological features are in particular danger.
3.1. Bank Edge Erosion
The lines that show the bank as it has progressed throughout this period. As can be seen in Figure 8, the bank edge has retreated at different speeds between 07/09/2018 and 11/10/2019 and that the rate of erosion is increasing. Between the first and last data gathered the bank has moved back by 72 cm at the widest point. The shortest distances are below the level of error. In one area, the distance between 07/11/2018 and 26/062018 shows that the bank has subsided and slide forward. This is also an artefact of the analysis, because a 2D analysis, as is commonly used in erosion studies, does not show volumetric changes. This study shows how the bank is retreating, and thus, needed only to show a 2D measurement. This suggests that there are dynamic processes occurring around the bank, which is being undermined by the annual water-level fluctuation between Summer and August. The effect of the snow on the site is less than the effect of soil falling out during the late summer and early autumn. The difference between these stages can be seen in Figure 8. Other changes have taken place in the bank as well, as it is being undercut by rising water levels. Holes have opened in the bank, which were partially overgrown by moss the 11/10/2019 measurement. These holes can be seen in Figure 9. This shows the changes were more complex than bank regression and shows that the feature itself may be undermined soon.
3.2. Diachronic Analysis and Spatial Averages
The bank edge has eroded an average of 32 cm in across the measurements, between 07/09/2018 and 11/10/2019. Because the bank edge has retreated an average of 10 cm in two months, 17 cm in 9 months, and 30 cm in 13 months with the greatest difference being 70 cm, it seems as though erosion is accelerating. However, the average difference per month is greatest in the first two (07/09/2018 and 07/11/2018), measurements. When the area between 50 cm and 160 cm from the left is counted, the average change in the bank is greatest monthly change is between the 3rd and 4th models (26/06/2019 and 11/10/2019). Between the 50 cm and 160 cm (from south west to north east) measurements along the transect line, the monthly change between each model is 4 cm between the 07/09/2018 and 07/11/2018 models, 3 cm between the 07/11/2018 and 26/06/2019 models, and 9 cm between the 26/06/2019 and 11/10/2019 modes. This shows how the rate of erosion is spatially varied throughout the transect area. This can also be seen in Figure 5. In the areas in which 2D erosion has slowed down, holes have opened underneath the bank edge, as can be seen in Figure 9, and this suggests that erosion is continuing, and that the process is more complex.
4. Discussion
4.1. Regional Implications
The deterioration of the bank at Sabbath Point draws parallels with other Beothuk residential features. The feature is not only facing erosion at the slope beside the water line but is also being undercut by the edge of the bank. The raised walls, which have not been excavated on this side of the site (the excavations are outlined in Figure 3), could show information about the architecture [31], and midden heaps, normally outside the features [56,57], may have also been lost.
A map of the unlabelled archaeological features in the ERV can be seen in Figure 2. These have been left unlabelled to offer some protection to the sites. Important Beothuk features on the bank of RIL including the burial hut of Nonosawbasut, and Demasduit are already likely to have been lost, as RIL water-level oscillates by at least 5 m between June and September (measured from the furthest tree stump visible on the beach) [28]. This relates to a serious issue in studying the geospatial aspects of each Beothuk site, in that the original bank of the river from the Contact period has now been lost. This is also a direct danger that relates the feature to other sites within the ERV, where other house pits have been eroded, as at RIF 5 [52], where erosion has destroyed a house pit, and at RIF 1, where the features are regularly submerged. Other features such as the Boom Island hearths have been submerged for many years [45] and are now only visible from the air. This means that the risk of losing features is not simply limited to RIL, but also occurs throughout the ERV. The erosion throughout the year is variable, and between September and November, most of the erosion occurs. This shows that specific mechanisms taking place in early autumn drive accelerated erosion. The erosion is also variable throughout the measured area. This suggests a more nuanced model of erosion is necessary for archaeological sites in the ERV. Erosion measurement has been carried out at several different sites using UAVs. Erosion at different sites must therefore be analysed at different sites in the future with this consideration, as it could inform site maintenance plans. Two example studies have been chosen for comparison, both of which focus on reservoirs, where much of the damage is anthropic [4,5,6].
A primary difficulty in drawing comparisons between these discussions is the fact that most studies into erosion take place at large scales, of at least 100 m, while this example has required a grid of 1 m for visualization and measurements at 10 cm. The difference between this study and that at the Kuibyshev dam is two orders of magnitude [6] as the study area in this study is 3 m long, while that of the Kuibyshev dam at the Beganchik site is more than 100 m. Archaeological measurements and geospatial discussions are often scalable [58], but, the implications of erosion are different at separate scales. At sites where erosion is considered at an intersite, or almost regional level, measurements can be used for statistical techniques to forecast erosion due to the stochastic nature of this process [3]. The effect of the scalar difference is that measuring erosion at small sites may produce outliers when compared with large scale measurements.
4.2. Comparison with the Kuibyshev and Stânca-Costești Reservoirs
The man-made Kuibyshev Reservoir in European Russia draws a useful comparison, as it is also a case of anthropic erosion [6]. The site of Beganchik, represents much of the Palaeolithic evidence for this region, and has been surveyed using UAVs. Erosion at this site has approached a speed of 2–3 m per year since it was surveyed in 2017. Other features within the area of the reservoir are also being submerged. This site shows how anthropic features may gradually eliminate sites but is also disappearing much faster than other regions. The difference in the rate of erosion is also noticeable; however, this may be due to the fact that they are each subject to different mechanical changes, as Beganchik is now on a cliff, while Sabbath Point house pit is now on a lower terrace and has the protection of trees.
A comparison with the Ripiceni—Holm (an Eneolithic site in Romania) on the bank of the Stânca-Costești reservoir may also help discuss the dangers man-made dams pose for heritage at the reservoir [4]. The bank edge at Ripiceni—Holm has seen a change of 96 cm per year. A direct comparison with erosion at Sabbath Point shows that the Ripiceni—Holm site is eroding much faster. As the site is on a plain, the soil in the region is more mobile, which means that the features are in more danger. As the forests of RIL help protect it from erosion events, the vegetation should be protected. The study on the Ripiceni—Holm site shows that erosion is causing more damage on the left bank of the river being fed by the reservoir. This has serious implications for sites in the ERV and suggests that future research must focus on forecasting erosion in this area, as the level of erosion may vary throughout the region.
4.3. Vegetation and Bank Deterioration
Both the Kuibyshev and Stânca-Costești reservoir have archaeological sites on open, unforested land and have faster rates of erosion [4,6] than Sabbath Point. Forests stabilise soil, and tree roots tend to protect sites from erosion [23,59]. The issue with preserving the tree cover features is that many features cannot be properly surveyed without removing the tree cover, and that fast growing alders can destroy or damage archaeological features [47]. Examples of this difficulty in surveying features in the ERV include the sites RIF 5 and RIF 2, where previous surveys lead to recording the existence of features, but were unable to analyse their morphology, leading to changes in their interpretation after brush cutting [47,60]. Brush cutting has since become a regular part of surveying house pits. Sustainable management procedures suggested at Arctic sites have included the fact that vegetation helps protect features from erosion [61] but the rapid growth of alder thickets has been seen as a possible danger for features in Central Newfoundland [47]. This creates a paradoxical situation, and the necessity to manage our brush cutting activities, while preserving vegetation to protect sites. This will however require further research into methods for sustainably managing sites to prepare policies for these sites.
5. Conclusions
Measuring erosion using a combination of photogrammetry and GRASS GIS has been successful. As the method is based on cost-effective tools, consumer grade cameras, UAVs, and common GIS-based analyses and visualisations, the method could be easily used in future analyses of erosion rates of eroding archaeological sites. The Beothuk house pit at Sabbath Point could help to answer questions about the nature of hexagonal house pits, their interior architecture, and the resources that the Beothuk relied on, but has only been partially excavated until today. Erosion within the study area has seen a maximum of 70 cm, with a measured average of 30 cm in 13 months, however, this does not include the undercutting of the bank seen in Figure 9. The house pit will begin to erode within the next two years, with deterioration in the north wall, however exterior evidence, which has been present at other Beothuk sites. Tree cover in this area has helped to maintain a lower rate of erosion than that seen at either Stânca-Costești or the Kuibyshev reservoirs. Tree cover is also an issue in this area, as it makes photogrammetry more difficult while also protecting the edge of the bank. Research into erosion using sequential satellite maps and historic maps focusing on statistical methods for erosion analysis is a priority for pursuing a necessary heritage protection scheme.
Author Contributions
Conceptualization, J.W.; methodology, J.W.; software, J.W.; validation, J.W.; formal analysis, J.W. and I.C.N.; investigation, J.W.; resources, J.W.; data curation, J.W.; writing—original draft preparation, J.W.; writing—review and editing, J.W. and I.C.N.; visualization, J.W. and I.C.N.; supervision, I.C.N.; project administration, J.W.; funding acquisition, J.W. All authors have read and agreed to the published version of the manuscript.
Funding
For J.W.: this research was funded by the Provincial Archaeology Office of Newfoundland and Labrador, the ISER Research Grant Program and the Smallwood Research Grant Program. For I.C.N., part of this work is performed according to the Russian Government Program of Competitive Growth of Kazan Federal University. The APC was funded by the Department of Archaeology, Memorial University of Newfoundland, and the Chair of Northern Indigenous Community Archaeology, Memorial University.
Acknowledgments
For J.W.: I would like to acknowledge the help given to me by my supervisors Lisa Rankin and Peter Whitridge in this project, and thanks to Laurie McLean, Don Holly, and Chris Wolff for including me in the excavations at Sabbath Point. I would also like to thank Don Pelley for help during fieldwork in the Exploits River Valley. The constructive comments of two anonymous reviewers are kindly acknowledged.
Conflicts of Interest
The authors declare no conflict of interest. The funders had no role in the design of the study; in the collection, analyses, or interpretation of data; in the writing of the manuscript, or in the decision to publish the results.
References
- Agapiou, A.; Lysandrou, V.; Sarris, A.; Papadopoulos, N.; Hadjimitsis, D.G. Fusion of Satellite Multispectral Images Based on Ground-Penetrating Radar (GPR) Data for the Investigation of Buried Concealed Archaeological Remains. Geosciences 2017, 7, 40. [Google Scholar] [CrossRef] [Green Version]
- O’Rourke, M.J.E. Risk and value: Grounded visualization methods and the assessment of cultural landscape vulnerability in the Canadian Arctic. World Archaeol. 2018, 50, 620–638. [Google Scholar] [CrossRef]
- Nicu, I.C. Application of analytic hierarchy process, frequency ratio, and statistical index to landslide susceptibility: An approach to endangered cultural heritage. Environ. Earth Sci. 2018, 77, 1–16. [Google Scholar] [CrossRef]
- Asandulesei, A.; Tencariu, F.A.; Nicu, I.C. Pars pro toto—Remote Sensing Data for the Reconstruction of a Rounded Chalcolithic Site from NE Romania: The Case of Ripiceni—Holm Settlement (Cucuteni Culture). Remote Sens. 2020, 12, 887. [Google Scholar] [CrossRef] [Green Version]
- Usmanov, B.; Nicu, I.C.; Gainullin, I.; Khomyakov, P. Monitoring and assessing the destruction of archaeological sites from Kuibyshev reservoir coastline, Tatarstan Republic, Russian Federation. A case study. J. Coast. Conserv. 2018, 22, 417–429. [Google Scholar] [CrossRef]
- Nicu, I.C.; Usmanov, B.; Gainullin, I.; Galimova, M. Shoreline Dynamics and Evaluation of Cultural Heritage Sites on the Shores of Large Reservoirs: Kuibyshev Reservoir, Russian Federation. Water 2019, 11, 591. [Google Scholar] [CrossRef] [Green Version]
- Nicu, I.C.; Asăndulesei, A. GIS-based evaluation of diagnostic areas in landslide susceptibility analysis of Bahluieț River Basin (Moldavian Plateau, NE Romania). Are Neolithic sites in danger? Geomorphology 2018, 314, 27–41. [Google Scholar] [CrossRef]
- Nicu, I.C. Natural risk assessment and mitigation of cultural heritage sites in North-eastern Romania (Valea Oii river basin). Area 2019, 51, 142–154. [Google Scholar] [CrossRef]
- Kincey, M.; Gerrard, C.; Warburton, J. Quantifying erosion of ‘at risk’ archaeological sites using repeat terrestrial laser scanning. J. Archaeol. Sci. Rep. 2017, 12, 405–424. [Google Scholar] [CrossRef] [Green Version]
- Mineo, S.; Pappalardo, G. Sustainable Fruition of Cultural Heritage in Areas Affected by Rockfalls. Sustainability 2020, 12, 296. [Google Scholar] [CrossRef] [Green Version]
- Hu, X.; Hu, K.; Tang, J.; You, Y.; Wu, C. Assessment of debris-flow potential dangers in the Jiuzhaigou Valley following the August 8, 2017, Jiuzhaigou earthquake, western China. Eng. Geol. 2019, 256, 57–66. [Google Scholar] [CrossRef]
- Wang, J.-J. Large-scale Debris Flow Disasters: Hazard-Risk-Vulnerability Analysis Approach in Taiwan. Conserv. Manag. Archa. 2016, 18, 449–463. [Google Scholar] [CrossRef]
- Kropáček, J.; Neckel, N.; Tyrna, B.; Holzer, N.; Hovden, A.; Gourmelen, N.; Schneider, C.; Buchroithner, M.; Hochschild, V. Repeated glacial lake outburst flood threatening the oldest Buddhist monastery in north-western Nepal. Nat. Hazards Earth Syst. Sci. 2015, 15, 2425–2437. [Google Scholar] [CrossRef] [Green Version]
- Nicu, I.C.; Stalsberg, K.; Rubensdotter, L.; Martens, V.V.; Flyen, A.-C. Coastal Erosion Affecting Cultural Heritage in Svalbard. A Case Study in Hiorthhamn (Adventfjorden)—An Abandoned Mining Settlement. Sustainability 2020, 12, 2306. [Google Scholar] [CrossRef] [Green Version]
- Kamran, M. Role of cultural heritage in promoting the resilience of linear/critical infrastructure system with the enhancement of economic dimension of resilience: A critical review. Int. J. Constr. Manag. 2020. [Google Scholar] [CrossRef]
- Nicu, I.C.; Stoleriu, C.C. Land use changes and dynamics over the last century around churches of Moldavia, Bukovina, Northern Romania—Challenges and future perspectives. Habitat Int. 2019, 88, 101979. [Google Scholar] [CrossRef]
- Kajihara, H.; Zhang, S.; You, W.; Min, Q. Concerns and Opportunities around Cultural Heritage in East Asian Globally Important Agricultural Heritage Systems (GIAHS). Sustainability 2018, 10, 1235. [Google Scholar] [CrossRef] [Green Version]
- Cozzolino, M.; Di Giovanni, E.; Mauriello, P.; Piro, S.; Zamuner, D. Management of Cultural Heritage: Contribution of Applied Geophysics. In Geophysical Methods for Cultural Heritage Management; Springer: Cham, Switzerland, 2018; pp. 1–4. [Google Scholar] [CrossRef]
- Amit-Cohen, I.; Sofer, M. Cultural heritage and its economic potential in rural society: The case of the kibbutzim in Israel. Land Use Policy 2016, 57, 368–376. [Google Scholar] [CrossRef]
- O’Rourke, M.J.E. Archaeological Site Vulnerability Modelling: The Influence of High Impact Storm Events on Models of Shoreline Erosion in the Western Canadian Arctic. Open Archaeol. 2017, 3, 1–16. [Google Scholar] [CrossRef]
- Asăndulesei, A. Inside a Cucuteni Settlement: Remote Sensing Techniques for Documenting an Unexplored Eneolithic Site from Northeastern Romania. Remote Sens. 2017, 9, 41. [Google Scholar] [CrossRef] [Green Version]
- Hemmelder, S.; Marra, W.; Markies, H.; De Jong, S.M. Monitoring river morphology & bank erosion using UAV imagery—A case study of the river Buëch, Hautes-Alpes, France. Int. J. Appl. Earth Obs. Geoinf. 2018, 73, 428–437. [Google Scholar] [CrossRef]
- Lee, G.; Choi, M.; Yu, W.; Jung, K. Creation of river terrain data using region growing method based on point cloud data from UAV photography. Quatern. Int. 2019, 519, 255–262. [Google Scholar] [CrossRef]
- Hamilton, S.; Stephenson, J. UAV (drone) aerial photography and photogrammetry and its utility for archaeological site documentation. Ont. Assoc. Prof. Archaeol. 2017, 2. [Google Scholar] [CrossRef]
- Howland, M.D.; Jones, I.W.N.; Najjar, M.; Levy, T.E. Quantifying the effects of erosion on archaeological sites with low-altitude aerial photography, structure from motion, and GIS: A case study from southern Jordan. J. Archaeol. Sci. 2018, 90, 62–70. [Google Scholar] [CrossRef] [Green Version]
- Forte, M. 3D Archaeology—New Perspectives and Challenges—The Example of Çatalhöyük. J. East. Mediterr. Archaeol. Herit. Stud. 2014, 2. [Google Scholar] [CrossRef]
- Haukass, C.; Hodgetts, L. The Untapped Potential of Low-Cost Photogrammetry in Community-Based Archaeology and Heritage. J. Community Archaeol. Herit. 2016, 3, 40–56. [Google Scholar] [CrossRef]
- Verhoeven, G. Taking computer vision aloft—Archaeological three-dimensional reconstructions from aerial photographs with photoscan. Archaeol. Prospect. 2011, 18, 67–73. [Google Scholar] [CrossRef]
- Nikolakopoulus, K.; Soura, K.; Koukouvelas, I.; Argyropoulos, N. UAV vs. classical aerial photogrammetry for archaeological studies. J. Archaeol. Sci. Rep. 2017, 14, 758–773. [Google Scholar] [CrossRef]
- Thomas, H. A methodology for combining terrestrial and aerial photographs to create high-resolution photogrammetric models of large-scale archaeological sites: A case study for Methone, Greece. J. Archaeol. Sci. Rep. 2017, 16, 27–33. [Google Scholar] [CrossRef]
- Probst, A.; Gatziolis, D.; Strigul, N. Intercomparison of photogrammetry software for three dimensional vegetation modelling. R. Soc. Open Sci. 2018, 5, 172192. [Google Scholar] [CrossRef] [PubMed] [Green Version]
- Heng, B.C.P.; Chandler, J.H.; Armstrong, A. Applying close range digital photogrammetry in soil erosion studies. Photogramm. Rec. 2010, 25, 240–265. [Google Scholar] [CrossRef] [Green Version]
- Jugie, M.; Gob, F.; Virmoux, C.; Brunstein, D.; Tamisier, V.; Le Coeur, C.; Grancher, D. Characterizing and quantifying the discontinuous bank erosion of a small low energy river using Structure-from-Motion Photogrammetry and erosion pins. J. Hydrol. 2018, 563, 418–434. [Google Scholar] [CrossRef]
- Magnani, M.; Douglass, M.; Schroder, W.; Reeves, J.; Braun, D.R. The Digital Revolution to Come: Photogrammetry in Archaeological Practice. Am. Antiq. 2020, 1–24. [Google Scholar] [CrossRef]
- Lazzari, M.; Gioia, D. UAV images and historical aerial-photos for geomorphological analysis and hillslope evolution of the Uggiano medieval archaeological site (Basilicata, southern Italy). Geomat. Nat. Hazards Risk 2017, 8, 104–119. [Google Scholar] [CrossRef] [Green Version]
- Zimmer, B.W.; Liutkus-Pierce, C.; Marshall, S.T.; Hatala, K.G.; Metallo, A.; Rossi, V. Using differential structure-from-motion photogrammetry to quantify erosion at the Engare Sero footprint site, Tanzania. Quat. Sci. Rev. 2018, 198, 226–241. [Google Scholar] [CrossRef]
- Fujii, Y.; Fodde, E.; Watanabe, K.; Murakami, K. Digital photogrammetry for the documentation of structural damage in earthen archaeological sites: The case of Ajina Tepa, Tajikistan. Eng. Geol. 2009, 105, 124–133. [Google Scholar] [CrossRef] [Green Version]
- Scott, H. Archaeological Predictive Modelling in the Boreal Forest: No Easy Answers. Can. J. Archaeol. 2000, 24, 41–76. [Google Scholar]
- Zheng, F.; Wackrow, R.; Meng, F.-R.; Lobb, D.; Li, S. Assessing the Accuracy and Feasibility of Using Close-Range Photogrammetry to Measure Channelized Erosion with a Consumer-Grade Camera. Remote Sens. 2020, 12, 1706. [Google Scholar] [CrossRef]
- Lantuit, H.; Pollard, W.H. Fifty years of coastal erosion and retrogressive thaw slump activity on Herschel Island, south Beaufort Sea, Yukon Territory, Canada. Geomorphology 2008, 95, 84–102. [Google Scholar] [CrossRef]
- Radosavljevic, B.; Lantuit, H.; Pollard, W.; Overduin, P.; Couture, N.; Sachs, T.; Helm, V.; Fritz, M. Erosion and Flooding—Threats to Coastal Infrastructure in the Arctic: A Case Study from Herschel Island, Yukon Territory, Canada. Estuaries Coasts 2016, 39, 900–915. [Google Scholar] [CrossRef] [Green Version]
- Irrgang, A.M.; Lantuit, H.; Gordon, R.R.; Piskor, A.; Manson, G.K. Impacts of past and future coastal changes on the Yukon coast—Threats for cultural sites, infrastructure, and travel routes. Arct. Sci. 2019, 5, 107–126. [Google Scholar] [CrossRef] [Green Version]
- Westley, K.; Bell, T.; Renouf, M.A.P.; Tarasov, L. Impact Assessment of Current and Future Sea-Level Change on Coastal Archaeological Resources—Illustrated Examples from Northern Newfoundland. J. Isl. Coast. Archaeol. 2011, 6, 351–374. [Google Scholar] [CrossRef]
- Ebert, J.; Camilli, E.; Wandsnider, L. Environmental Impact Research Program: Reservoir Bank Erosion and Cultural Resources: Experiments in Mapping and Predicting the Erosion of Archeological Sediments at Reservoirs along the Middle Missouri River with Sequential Historical Aerial Photographs. 1989, p. 129. Available online: https://apps.dtic.mil/sti/pdfs/ADA212709.pdf (accessed on 3 August 2020).
- Gatto, L.W.; Doe, W.W., III. Bank conditions and erosion along selected reservoirs. Environ. Geol. Water Sci. 1987, 9, 143–154. [Google Scholar] [CrossRef]
- GRASS Development Team. Geographic Resources Analysis Support System (GRASS GIS) Software, Version 7.2. Available online: https://grass.osgeo.org (accessed on 8 September 2020).
- Solem, D.-Ø.E. Two New Ways of Documenting Miniature Incisions Using a Combination of Image-Based Modelling and Reflectance Transformation Imaging. Remote Sens. 2020, 12, 1626. [Google Scholar] [CrossRef]
- McLean, L. Summary of Archaeological Research Performed by Laurie McLean/Consulting Archaeologist in 2017; Annual Archaeology Review 2017; Provincial Archaeology Office: St. John’s, NL, Canada, 2018; pp. 184–197. [Google Scholar]
- Marshall, I. A History and Ethnography of the Beothuk; McGill-Queens University Press: London, UK, 1996. [Google Scholar]
- Schwarz, F.; Hutchings, C. Archaeological Excavations at Sabbath Point (DeBd-08), July 2018, Red Indian Lake, Newfoundland; Provincial Archaeology Office: St. John’s, NL, Canada, 2018. [Google Scholar]
- McLean, L. Partial Excavation of a Beothuk House Pit at Sabbath Point (DeBd-08), Red Indian Lake; Provincial Archaeology Office: St. John’s, NL, Canada, 2018. [Google Scholar]
- Holly, D.; Wolff, C.J.; Samuels, A.; Yakabowskas, D.; Illenberg, M. Continuing Excavations at Sabbath Point (DeBd-08), Red Indian Lake, Newfoundland; Annual Archaeology Review 2019; Provincial Archaeology Office: St. John’s, NL, Canada, 2020; pp. 121–132. [Google Scholar]
- Howley, J.P. The Beothucks or Red Indians: The Aboriginal Inhabitants of Newfoundland; Coles Publishing Company: Toronto, ON, Canada, 1915. [Google Scholar]
- Marshall, I. Beothuk and Micmac: Re-examining Relationships. Acadiensis 1988, 17, 52–82. [Google Scholar]
- Aylward, C.; Joe, M. Beothuk and Mi’kmaq: An interview with Chief Mi’sel Joe. In Tracing Ochre: Changing Perspectives on the Beothuk; Polack, F., Ed.; University of Toronto Press: Toronto, ON, Canada, 2018. [Google Scholar]
- Devereux, H. A Preliminary Report on the Indian Point Site, a Stratified Beothuk Site; Provincial Archaeology Office: St. John’s, NL, Canada, 1970. [Google Scholar]
- McLean, L. Salvage Excavation of Groswater Palaeoeskimo Features at Aspen Island-2 (DfAw-05); Provincial Archaeology Office: St. John’s, NL, Canada, 2016. [Google Scholar]
- McLean, L. Final Report for Archaeological Salvage Excavations at Boom Island (DfAw-03), and Aspen Island-2 (DfAw-05), on the Exploits River Newfoundland; Provincial Archaeology Office: St. John’s, NL, Canada, 2016. [Google Scholar]
- Hull, S. Provincial Archaeology Site Database 2018. Available online: https://www.gov.nl.ca/tcar/artsheritage/culture/archaeology/provincial-archaeology-office/ (accessed on 10 April 2020).
- Smith, J.S. Eastern Red Indian Lake Basin, Central Newfoundland: Surficial and Ice-Flow Mapping Results. Report 13-1; Current Research, Newfoundland and Labrador Department of Natural Resources, Geological Survey; 2013; pp. 67–81. Available online: https://www.gov.nl.ca/nr/files/mines-geoscience-publications-currentresearch-2013-smith-2013.pdf (accessed on 14 July 2020).
- Wilton, D. NI 43-101 Technical Report on the Central Newfoundland Regional Gold Project, Central Newfoundland, NL, Canada. 2017, p. 90. Available online: https://www.antlergold.com/files/CheckCode.do_.pdf (accessed on 3 August 2020).
- Schwarz, F. Archaeological Investigations in the Exploits Basin; Provincial Archaeology Office: St. John’s, NL, Canada, 1992. [Google Scholar]
- Schwarz, F. Archaeological Monitoring of Brushcutting Activities at Six Beothuk Archaeological Sites along the Exploits River; Provincial Archaeology Office: St. John’s, NL, Canada, 2011. [Google Scholar]
- Williamson, J. Photogrammetric Surveys in the Exploits River Valley; Annual Archaeology Review 2019; Provincial Archaeology Office: St. John’s, NL, Canada, 2020; pp. 227–232. [Google Scholar]
- Locke, D. Field Notes; Provincial Archaeology Office: St. John’s, NL, Canada.
- Pollard-Belsheim, A.; Storey, M.; Robinson, C.; Bell, T. The CARRA project: Developing tools to help heritage managers identify and respond to coastal hazard impacts on archaeological resources. In 2014 Oceans—St. John’s; Provincial Archaeology Office: St. John’s, NL, Canada, 2014. [Google Scholar] [CrossRef]
- Holly, D.H., Jr.; Erwin, J.C. Terra Incognita, still: Archaeological investigations in the interior of the Island of Newfoundland. Archaeol. East. N. Am. 2009, 37, 65–84. [Google Scholar]
- Erwin, J.; Crompton, A.; Bolli, M. Sabbath Point (DeBd-08) Unmanned Aerial Vehicle (UAV) Mapping Project; Field Season Reports; Provincial Archaeology Office: St. John’s, NL, Canada, 2017; pp. 54–60. [Google Scholar]
- Chatzifoti, O. On the Popularization of Digital Close-Range Photogrammetry: A Handbook for New Users. Master’s Thesis, National University of Athens, Athens, Greece, 2015. [Google Scholar]
- Ahmed, N.; Carter, M.; Ferris, N. Sustainable archaeology through progressive assembly 3D digitization. World Archaeol. 2014, 46, 137–154. [Google Scholar] [CrossRef]
- MicMac ENSG. Available online: https://micmac.ensg.eu/index.php/Accueil (accessed on 8 September 2020).
- Agisoft LLC Agisoft Metashape User Manual, Professional Edition, Version 1.5 2019. Available online: https://www.agisoft.com/pdf/metashape-pro_1_6_en.pdf (accessed on 2 April 2020).
- De Felice, G. The New Trend of 3D Archaeology is...Going 2D! In CAA2015. Keep the Revolution Going: Proceedings of the 43rd Annual Conference on Computer Application and Quantitative Methods in Archaeology; Campana, S., Scopigno, R., Carpientiero, G., Cirillo, M., Eds.; Archaeopress: Oxford, UK, 2016; pp. 363–368. [Google Scholar]
Figure 1.
(A) Geographical location of the study area in Newfoundland context; (B) Location of Sabbath Point Site in regional context; (C) Detail on the house-pit location on the shore of Red Indian Lake.
Figure 1.
(A) Geographical location of the study area in Newfoundland context; (B) Location of Sabbath Point Site in regional context; (C) Detail on the house-pit location on the shore of Red Indian Lake.

Figure 2.
The location of all the archaeological sites in the ERV.

Figure 3.
View of the areas excavated, showing the house pit itself, and the bank edge from 07/09/2018 (excavations took place on the interior part of the house pit and through a single wall which is not in immediate danger of eroding).
Figure 3.
View of the areas excavated, showing the house pit itself, and the bank edge from 07/09/2018 (excavations took place on the interior part of the house pit and through a single wall which is not in immediate danger of eroding).

Figure 4.
Methodological workflow used in this study (in blue and green at the top is the raw data, the red shows the photogrammetric processing, and the blue in the middle shows the raw rasters produced in Agisoft; finally, the pink shows the steps involving GRASS GIS).
Figure 4.
Methodological workflow used in this study (in blue and green at the top is the raw data, the red shows the photogrammetric processing, and the blue in the middle shows the raw rasters produced in Agisoft; finally, the pink shows the steps involving GRASS GIS).

Figure 5.
Visualisation of the aspect of the bank on (A) 07/09/2018, (B) 07/11/2018, (C) 26/06/2019, and (D) 11/10/2019.
Figure 5.
Visualisation of the aspect of the bank on (A) 07/09/2018, (B) 07/11/2018, (C) 26/06/2019, and (D) 11/10/2019.

Figure 6.
Components of the measurement method showing (A) the line drawn between the end points of the measurable bank and the transect at 25 cm distance; (B) different bank edges measured; (C) merged layers (background: orthophoto of the site from 07/09/2018).
Figure 6.
Components of the measurement method showing (A) the line drawn between the end points of the measurable bank and the transect at 25 cm distance; (B) different bank edges measured; (C) merged layers (background: orthophoto of the site from 07/09/2018).

Figure 7.
Orthophotos of the bank on (A) 07/09/2018, (B) 07/11/2018, (C) 26/06/2019, and (D) 11/10/2019.
Figure 7.
Orthophotos of the bank on (A) 07/09/2018, (B) 07/11/2018, (C) 26/06/2019, and (D) 11/10/2019.

Figure 8.
The graph is showing the distance eroded (m) from the 07/09/2018 bank and the future bank measurements.
Figure 8.
The graph is showing the distance eroded (m) from the 07/09/2018 bank and the future bank measurements.

Figure 9.
Holes that began appearing in the bank on 26/06/2019.

© 2020 by the authors. Licensee MDPI, Basel, Switzerland. This article is an open access article distributed under the terms and conditions of the Creative Commons Attribution (CC BY) license (http://creativecommons.org/licenses/by/4.0/).
Share and Cite
MDPI and ACS Style
Williamson, J.; Nicu, I.C. Photogrammetric Measurement of Erosion at the Sabbath Point Beothuk Site in Central Newfoundland, Canada. Sustainability 2020, 12, 7555. https://0-doi-org.brum.beds.ac.uk/10.3390/su12187555
AMA Style
Williamson J, Nicu IC. Photogrammetric Measurement of Erosion at the Sabbath Point Beothuk Site in Central Newfoundland, Canada. Sustainability. 2020; 12(18):7555. https://0-doi-org.brum.beds.ac.uk/10.3390/su12187555
Chicago/Turabian StyleWilliamson, James, and Ionut Cristi Nicu. 2020. "Photogrammetric Measurement of Erosion at the Sabbath Point Beothuk Site in Central Newfoundland, Canada" Sustainability 12, no. 18: 7555. https://0-doi-org.brum.beds.ac.uk/10.3390/su12187555
Note that from the first issue of 2016, this journal uses article numbers instead of page numbers. See further details here.