1. Introduction
The Sustainable Development Goal 6,
Clean water and sanitation [
1] is not a persistent and critical problem in Norway compared to other contexts. However, intense rainfall and increased temperatures due to climatic change can contribute to increased risk of contamination of drinking water resources in the future, and, in the few last years, there have been Norwegian incidents of water outages and contamination of tap water [
2]. The responses of citizens vary in such incidents of water outages. Some comply with
boil water advisories (BWAs), while others do not. An additional adaptive strategy and water consumption practice is buying bottled drinking water. On a general level, this makes the different uses and consequences of tap or bottled water an interesting case of trust in state or market and examples of adaptive consumption strategies in changing climatic conditions.
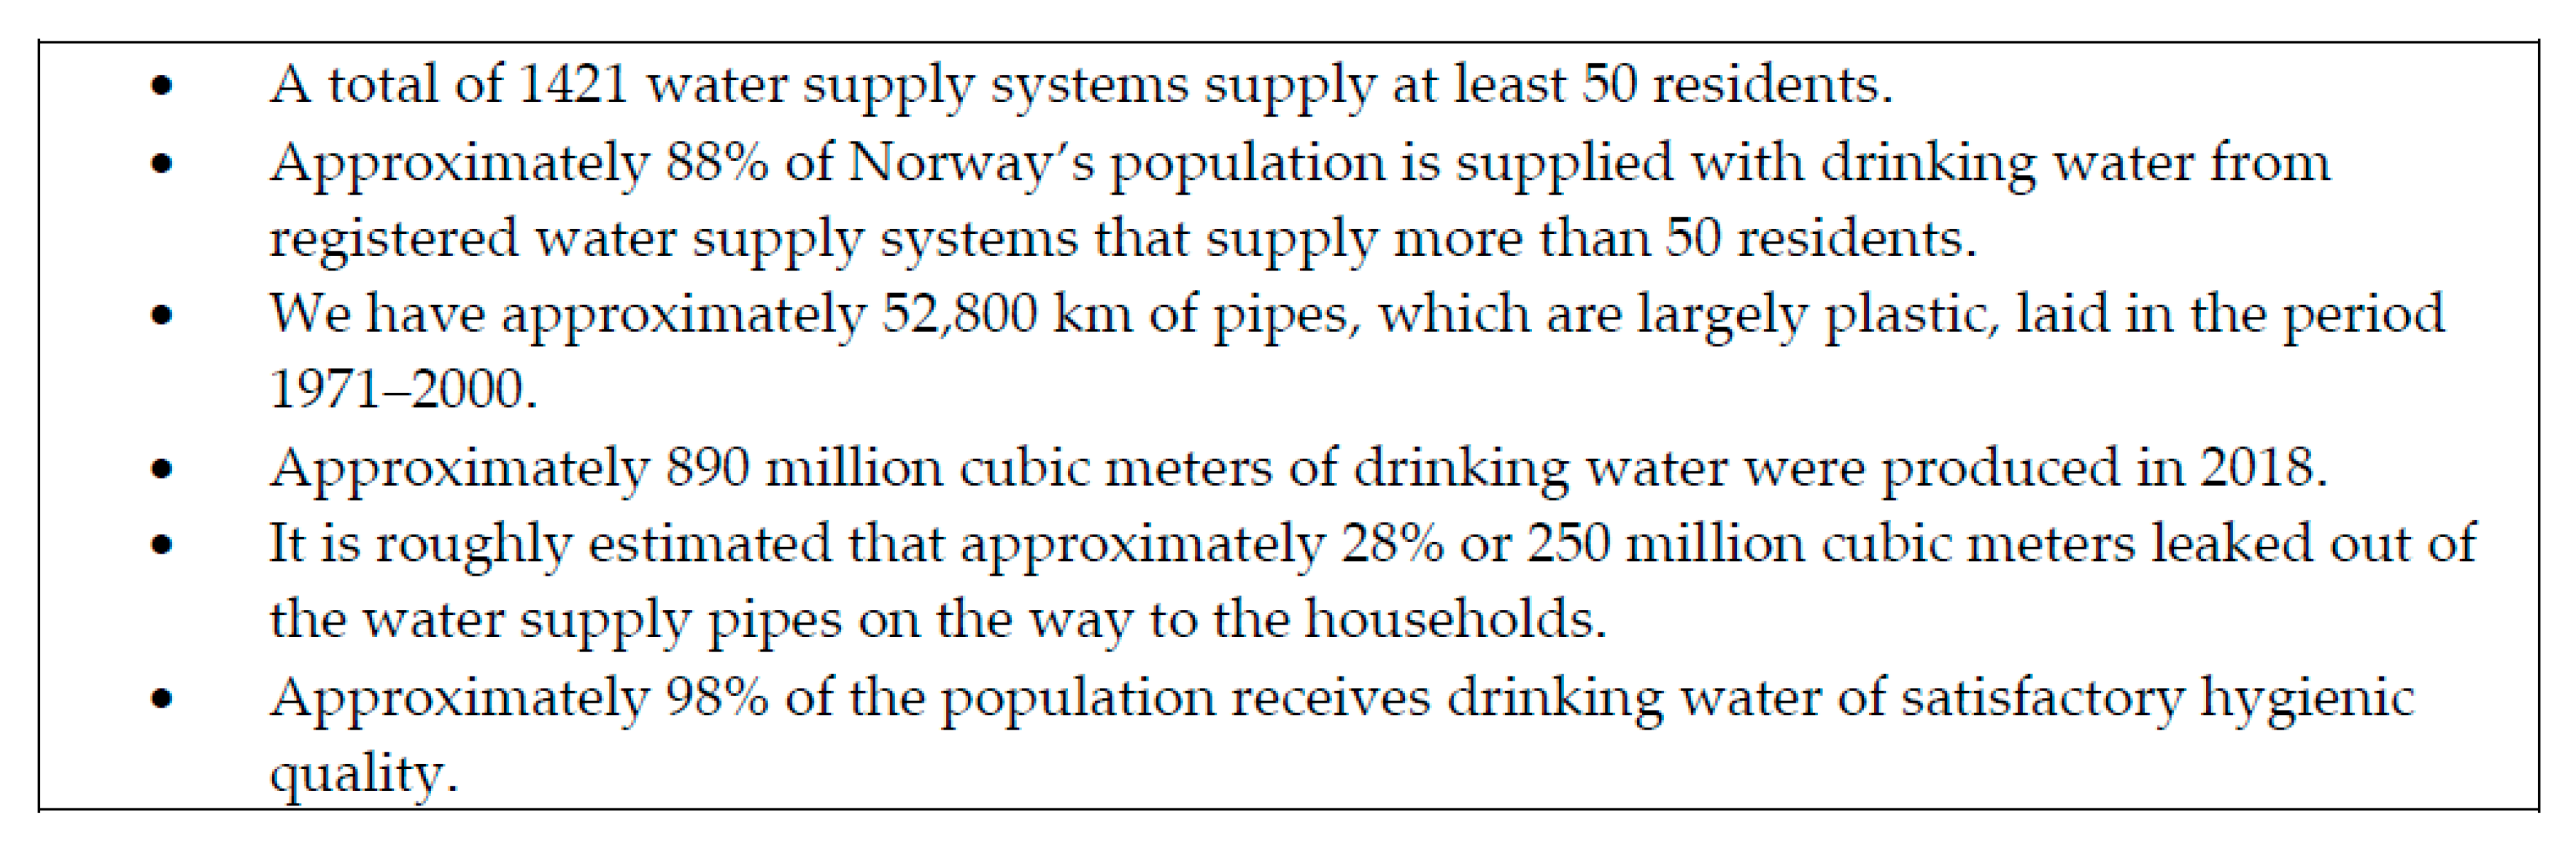
Around 96% of the Norwegian population gets their drinking water from public/municipal owned water supply systems [
3]. Water supply and water intended for human consumption in Norway is subject to the Norwegian Drinking Water Regulations [
4]. According to the regulations, all Norwegian water plant owners are required to submit annual reports to the Norwegian Food Safety Authority. On behalf of the Norwegian Food Safety Authority, the Norwegian Institute of Public Health prepared a compilation of reported data for 2018 on Norwegian water supply systems [
5]. Some of the key figures that emerged from the compilation are listed in
Figure 1.
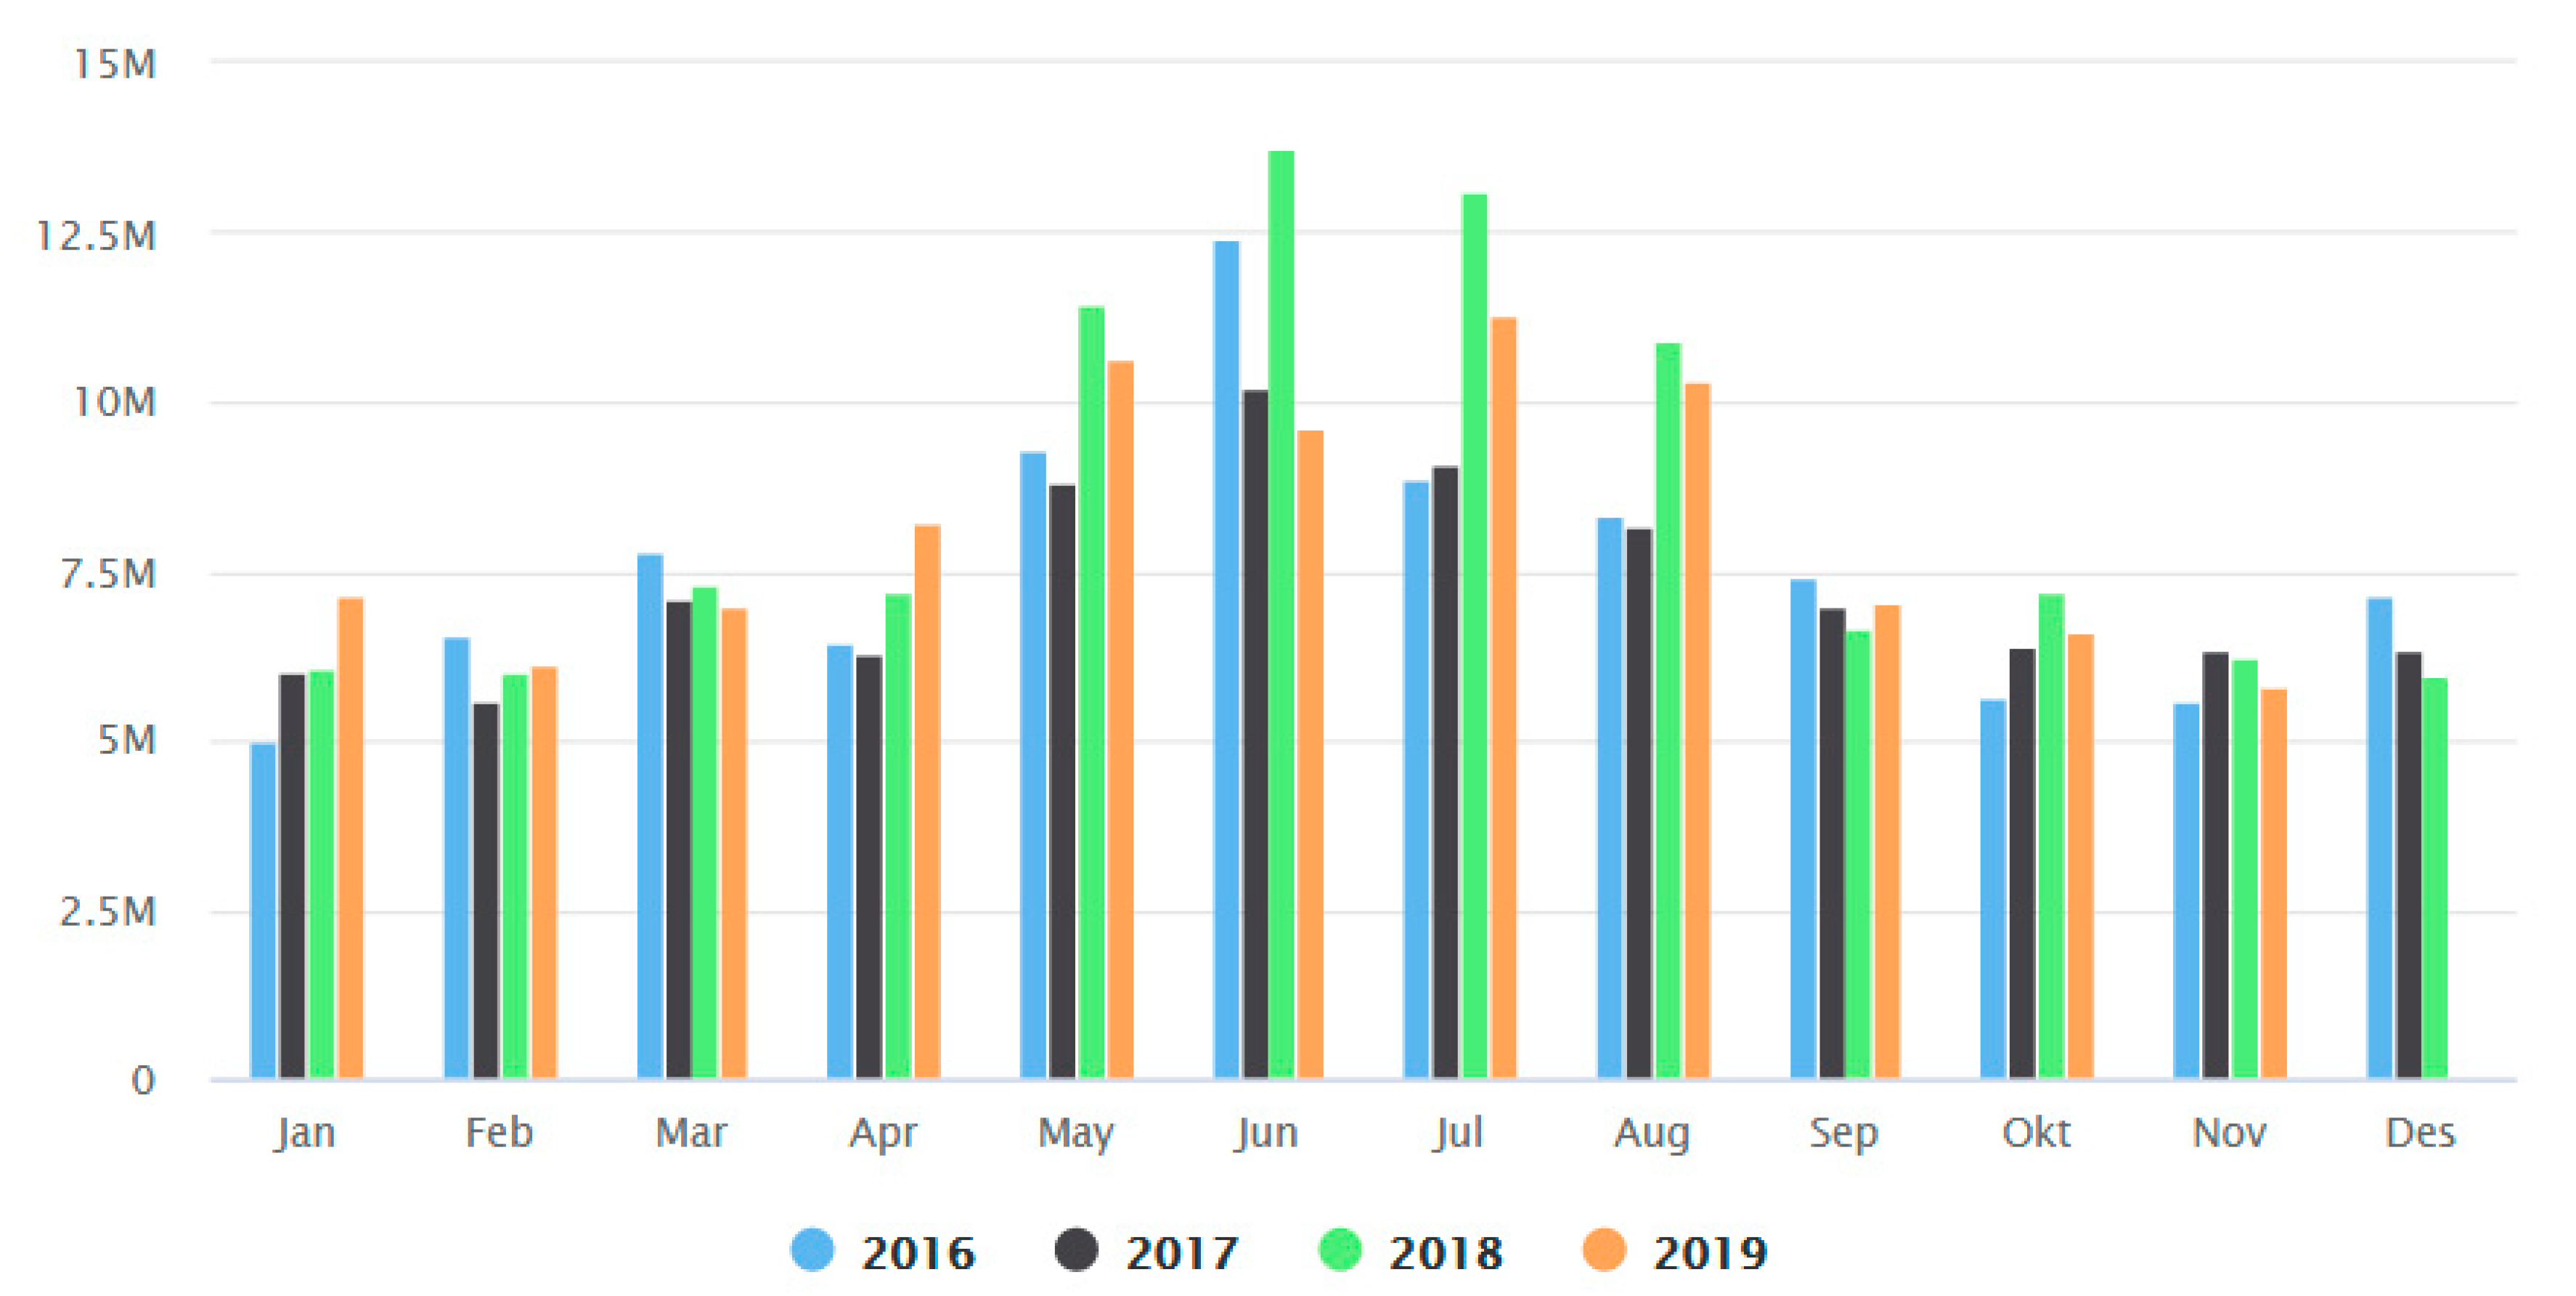
The Norwegian market for bottled water is reflected in the total sales of carbonated and natural bottled water reported by the Norwegian Brewery and Beverage Association, as in
Figure 2. The numbers include all Norwegian water producers except Isklar. Numbers are listed in millions of liters [
6].
Variations in water consumption practices in every day life and during outages are related to change in environmental attitudes. Consumption practices is also of increasing importance in the common goal to cope with grand global challenges. At the most general level, the importance of consumption behavior or practices for sustainable development is emphasized in the IPCC Special Report,
Global Warming of 1.5 °C [
7], and the
Sustainable Development Goal 12: Responsible Production and Consumption [
8], respectively.
Our analysis of personality and the consumption of tap vs. bottled water is an example of the relevance of understanding the importance of personality related to alternative consumption patterns and sustainable consumer attitudes and lifestyles. We propose that, in combination with other perspectives and segmentation models, the focus on personality in sustainable water consumption expands and strengthens both the theoretical, methodological and substantial understanding of sustainable water consumption and sustainable consumption in general. More specifically, this article adds to the debate on sustainable water consumption by probing the relation between consumers’ personality, understanding of risk, trust and social distinction in consumption of water in Norway. Our main research question, how can we understand preferences for water consumption?, is approached by answering a set of hypotheses inspired by a combination of mainly three theoretical approaches to understand consumption: risk/trust, conspicuous attitudes and the Big Five personality model.
In several international regions, there is an understanding that tap water should be safe and provided free of charge [
9]. However, bottled water is obviously needed in specific areas and situational contexts [
10,
11]. Consumption of tap water is, in general, understood to be more sustainable than consumption of bottled water. Nevertheless, consumption of bottled water increases in countries where clean tap water is available at low cost [
12]. Wilk [
13] (p. 303) understands this development from a cultural perspective and describes it
as a case where sound cultural logic leads to environmentally destructive behavior. A range of factors have already been identified that have an effect on public perception of drinking water quality [
14] and bottled water [
15] such as sociodemographics and implicit and explicit attitudes [
16,
17], consumers’ perceptions [
12,
18] and behavior [
19].
Psychological research has linked environmental concern with the personality traits of agreeableness and openness to experience [
20,
21,
22]. A higher degree of agreeableness tends to be consistent with altruistic behavior and emphatic concern about the environment. More openness to experience is associated with aesthetic interests.
Based on existing research, risk/trust, social distinction and personality are shown to be elements that may impact preferences for water consumption. However, as far as we know, there are few, if any, international analyses that combine these perspectives.
Our perspectives in this paper do not presuppose that consumers think of collective sustainability in their water consumption. We rather assume that it is driven by individual motives in a dialectical relation with sociocultural conditions. However, personality and consumption practices in specific contexts may have consequences for sustainability.
In this study, we first used the Graded Response Model (GRM) to construct latent variables for the personality traits from the Big Five taxonomy. A latent variable measuring the degree of conspicuous attitude was also constructed. These variables were included in bounded beta regression models together with a variable measuring risk and other socioeconomic predictors. Then, models for bottled water and tap water were estimated based on survey data from 2015. The models were bootstrapped and expected water consumption for individuals with high and low degrees of the different traits were constructed. Finally, hypotheses regarding differences in water consumption between individuals with high degrees and low degrees of the personality traits, conspicuous attitude and risk were tested.
After this introduction, we will first discuss our theoretical triangulation to understand water consumption. In
Section 3, we describe our methods and data. In
Section 4 and
Section 5, we describe the modeling and estimation process and present the results concerning personality/fear/conspicuous attitudes and consumption frequency of bottled water and tap water. In
Section 6, we perform and discuss the tests of the hypotheses. In
Section 7, we discuss the methodology and the results, and
Section 8 concludes the article.
2. Theoretical Triangulation and Operationalization
It goes without saying that water consumption is context-specific and depends on a nexus of variables. Inspired by a set of perspectives, we equip ourselves with a multi-tool for theoretical triangulation to understand the complexity of water consumption. Our multi-theoretical perspective permits us to make a multilevel analysis that spans from the personal to the sociocultural in our understanding of consumers conceptual understanding of risk/trust and consumption practices.
It is not our intention to probe the theoretical debates in each of the theoretical perspectives. We describe them roughly and use them ‘practically’ in accordance with the conditions given by our data material.
2.1. Personality
An individual’s personality defines how he or she relates to other individuals and to the surroundings. The personality traits are thought to be relatively stable from the age of 30 [
23]. The Big Five taxonomy assumes that personality may be described by five broad traits: extraversion, agreeableness, conscientiousness, emotional stability and openness to experience. Extraversion is the tendency to be talkative and sociable, agreeableness is associated with compassion and trust, conscientiousness is the tendency to be organized and work hard to achieve goals, emotional stability is about psychological stress, and openness to experience is about creativity, curiosity and preference for variety. These traits are latent but may be revealed by a questionnaire and statistical modeling. The Big Five personality model has been linked to both attitudes and food consumption.
Gustavsen and Hegnes [
24] found that openness to experience was positively related and extraversion was negatively related to the consumption of organic foods in Norway. Pfeiler and Egloff [
25] analyzed the differences between German vegetarians and meat eaters and revealed that individuals high in openness to experience have a higher probability to be vegetarian, while individuals high in conscientiousness have a higher probability to be a meat eater. In Gustavsen and Rickertsen [
26], high levels of extraversion and openness to experience increased the expected frequency of wine consumption while high levels of agreeableness reduced the expected frequency of wine consumption. Regarding consumption of water, Harmon et al. [
27] found that openness to experience affected the consumption of bottled water.
In this study, we perform the following tests regarding personality traits:
Hypothesis 1 (H1). Extraversion does not influence the frequency of water consumption.
Hypothesis 2 (H2). Agreeableness does not influence the frequency of water consumption.
Hypothesis 3 (H3). Conscientiousness does not influence the frequency of water consumption.
Hypothesis 4 (H4). Emotional stability does not influence the frequency of water consumption.
Hypothesis 5 (H5). Openness to experience does not influence the frequency of water consumption.
2.2. Risk and Trust
Risk and trust may be understood from a range of different perspectives. Risk/trust is commonly understood as a threat to economic activity or to human health and is related to the relative frequency of an unwanted event. In general, it is concerned with how people understand the probability of a future unwanted event. Risk is most often about probabilities of a loss in the financial or commodity markets. However, risk and trust of food and drinks are closely connected to food safety. Perceived risks and trust in food and water depend upon perceived hazards, food technology and how the risk is communicated. Trust is akin to risk but is not connected to probability. Trust is more related to cognitive processes and feelings. People may trust and mistrust both bottled and tap water for different reasons and different understandings of risk [
13].
Risk and trust can be measured in various ways. They can be measured though questions about food or water safety or measured through earlier incidents. In addition, newspaper articles write about hazards which people may perceive as risks. In our study, we have one question concerning tap water and perceived risk: “I am very concerned about drinking [tap] water because of the increased pollution”. The respondent checks one of the following responses: “Totally agree”, “Somewhat agree”, “Somewhat disagree” or “Totally disagree”. In our model, we make an indicator variable out of it: risk = 1 if the respondent checks “Totally agree” and “Somewhat agree”, risk = 0 otherwise.
In this paper, we perform the following test regarding risk and trust:
Hypothesis 6 (H6). Fear for water quality does not influence the frequency of water consumption.
2.3. Conspicuous Attitude/Social Distinction
Buying bottled water may have many motives, such as signaling a specific class, a specific identity, belonging to a specific group, etc. In our analysis, we have explored whether consumption of bottled water can be understood along the lines of thought that Torstein Veblen introduced at the end of the 19th century in
the Theory of the Leisure Class. Veblen’s main argument was that the consumption of the leisure class at that time in America was not only for utility and practical reasons but for demonstration of social status. Could this also be the case for water? According to Trigg [
28], Veblen [
29] identifies two ways in which an individual can display wealth: through extensive leisure activities and through lavish expenditure on consumption and services. The former displays waste of time and the latter displays waste of goods. In our study, we have four different questions that indicate conspicuous attitude. How an individual respond to these questions indicates how he/she prefers to act and be understood by other individuals: if it is important to look well-off, to wear clothes with visible brands and to obtain things that impress others, then we may say that the individual has a conspicuous attitude. Likewise, if a nice house, an expensive car or a nice dress rouse an individual’s admiration, we can say that the individual has a conspicuous attitude.
In this paper, we perform the following test regarding conspicuous attitude:
Hypothesis 7 (H7). Conspicuous attitude does not influence the frequency of water consumption.
Although our theoretical triangulation and operationalization adds to the understanding of the complexity of drinking water attitudes and practices, it is not an exhaustive analysis. As already mentioned, it is tailored to our data material consisting of data from The Norwegian Monitor database. However, the combination of personality, risk/trust and conspicuous attitudes gives insight into aspects of the complexity of this phenomenon.
3. Methods and Data
To unpack the relation between individuals’ personality, conspicuous attitude and their choice of drinking water, we make use of GRM to estimate latent variables. The six latent variables are then incorporated into bounded beta regression models together with a perceived risk indicator and other predictors. Further, the models are estimated with maximum likelihood to unpack associations between personalities, conspicuous attitude, perceived risk and frequency of drinking bottled and tap water. The models are used with data from the Norwegian Monitor (NM) database [
30] to find expected frequencies.
3.1. The Graded Response Model
The Graded Response Model [
31] for the latent variables is defined as
Here, for question i, (1) is the probability of choosing the response k from K possible choices, where K = 7 for a 7-point Likert scale for the personality traits, and K = 4 for the conspicuous attitude variable (4-point Likert scale). Our aim is to find for each individual. is the latent variable that describes the position of the individual on the scale from the lowest to highest. These five personality traits are then included in bounded beta regression models where the outcomes are frequency of drinking tap water and frequency of drinking bottled water. In addition to the personality variables and the conspicuous attitude variable, socioeconomic predictors are included in the models.
3.2. The Bounded Beta Regression Models
The beta distribution for a continuous variable q is a two-parameter distribution within the range of (0, 1). If we think of this as a relative frequency of yearly drinking of bottled water (by bottled water, we mean bottled water that is purchased), we must also take into account individuals who never drink bottled water (q = 0) and individuals who drink bottled water every day (q =1). We reparametrize the beta distribution to be able to include covariates and include the covariates for the terms bounded at 0 and 1.
Assuming that the frequency of bottled water drinking,
q, is beta distributed, i.e.,
where
is the gamma function, and
and
are parameters.
To be able to include covariates, the beta distribution is reparametrized as in Ferrari and Cribari-Neto [
32]. However, we also must take into account the values 0 and 1, i.e., in the model, we have to include individuals who never drink bottled water and individuals who drink bottled water every day. This is done by including the probabilities of never drinking bottled water (
P0) and the probabilities of drinking bottled water every day (
P1). Using the same vector of covariates,
x, in the three parts, the whole conditional distribution then becomes
where
f(
x) in our case is the beta distribution. The likelihood function will then be based on
For tap water, the model is bounded in 1 but not in 0, so in (3) and (4), P0 will drop out.
3.3. The Data
Norwegian Monitor (NM) is a Norwegian representative cross-sectional survey consisting of 3000–4000 adults. The survey covers a range of topics such as political preferences, stands on moral and ethical issues, socioeconomic and demographic information, health and eating habits, including frequencies of eating and drinking different foods and beverages. The survey has been performed since 1985.
Based on John, Donahue and Kentle [
33], Engvik and Clausen [
34] developed a 20-item Norwegian version of the Big Five. This short version was developed for situations where the time is limited. The version has reached adequate levels of structural validity, factor divergence, maximal representation, test–retest reliability and criterion validity [
34]. These 20 questions were included in NM in 2015 and data from this year are applied in this paper. Our sample consists of 3501 individuals from 20 to 89 years of age. The questions related to BF-20 are included in the
Appendix A.
Also included in the NM survey are four multiple choice questions regarding conspicuous attitude. The respondents checked whether they totally or somewhat agreed or disagreed with the following statements: “For me, looking good is important”, “I like to wear clothes with a visible brand”, “I try to obtain things that impress others” and “Nice house, expensive car and nice clothes rouse admiration among others”.
The socioeconomic variables used as predictors are age, income, education, gender, social status and place of living. Age is constructed as standardized individual age. The original survey question on household income included 11 response alternatives, each representing a specific income interval. The income variable is constructed in the following way: first, we set the household income to the midpoint of each income interval; then, we adjust for household size by dividing by the square root of household as recommended by the Organisation for Economic Co-operation and Development OECD [
35]. Finally, the income variable is standardized. Education is an indicator variable set to 1 if the individual has university education, 0 otherwise; female gender is an indicator variable, taking the value 1 if gender is female, 0 otherwise; married status is an indicator variable, taking the value 1 if the individual is married or cohabiting, 0 otherwise; big city is an indicator variable, taking the value 1 if the individual is living in one of Norway’s four biggest cities.
Table 1 shows the frequency distribution of non-carbonated and carbonated water together with the frequency of drinking tap water. While there are very few who drink bottled water with high frequency, there are a lot who never drink bottled water. More than 40% drink non-carbonated bottled water infrequently or never. The same is true for carbonated bottled water. For tap water, the opposite is true. Nearly 90% drink tap water every day, while 0.2% never drink tap water.
4. The Modeling and Estimation Process
To transform the frequency intervals from
Table 1 to the continuous beta distribution, within each interval and for each respondent, we randomly drew the frequency from a uniform distribution, with the limits of the intervals used as the limits of each distribution. We first transformed the frequencies to number of times per year. Then, to close the gap between each interval, we used the midpoint between each interval as the limit. For each individual, we randomly drew a number from the uniform distribution within the pertaining interval of the individual. This was done in each bootstrap repetition. In this way, the interval distribution is transformed to a continuous distribution between 0 and 365. Then, the alternative “every day” was set to 365 days and the alternative “never” was set to 0 days. Then, dividing each observation by 365, we have the continuous beta distribution in the interval (0, 1) and bounds in 0 and 1. We aggregated the non-carbonated and carbonated bottled water into one variable. When the variable was larger than 1, it was set equal to one. Then, the bootstrap N × K draws, where N = 3501 and K = 500, were performed with N = the number of individuals and K as the number of bootstrap repetitions. The GAMLSS package in R was used to estimate the beta regression models, one model for bottled water and one model for tap water. Odds ratios were used instead of probabilities in the bounds.
In the estimation process, we first estimated the latent variables (the five personality traits and the variable measuring conspicuous attitude) with the GRM using the grm package in R. These variables were inserted into bounded beta regression models using the outcome variables for tap water and bottled water and socioeconomic predictors. The models were estimated with the GAMLSS package in R.
5. Results of the Estimation Process
Table 2 shows the estimated parameters for bottled and tap water. The first column shows the estimated parameters from the
O0 part of the model, i.e., the odds of not drinking bottled water. Since very few individuals do not drink tap water,
O0 is not included for this model. The
BE(0, 1) is the beta regression part of the model. The last two columns show the estimated parameters from the
O1 part of the model, i.e., the odds of drinking bottled water every day and the odds of drinking tap water every day.
We see that conscientiousness is a significant positive predictor. The higher the conscientiousness, the higher the odds (and the probability) of not drinking bottled water. In addition, high age, low income, low education, being a man and not having a conspicuous attitude increase the odds (and the probability) of not drinking bottled water. All these results are highly probable. For the beta regression part of the model, we see that agreeableness and openness to experience are positive predictors of the frequency of drinking bottled water, while conscientiousness is a negative predictor. In addition, low age, higher income, higher education and high conspicuous attitude increase the expected frequency of bottled water drinking. Due to large variation, fear for water quality is the only significant predictor for tap water.
Individuals high in openness to experience, individuals living in one of Norway’s four largest cities and individuals who fear for the water quality have higher odds (and probability) of drinking bottled water every day. For tap water, individuals high in conscientiousness have high odds of drinking tap water every day. Individuals fearing for water quality have low odds of drinking tap water every day. In addition, women have higher odds than men of drinking tap water every day.
6. Relation between Personality/Risk/Conspicuous Consumption and Expected Frequency of Water Consumption
To be able to test for the relation between personalities, risk, conspicuous attitude and frequency of bottled and tap water consumption, we estimated the same models as in
Table 2 with the nonparametric bootstrap with 500 iterations. In each iteration, we constructed the consumption frequency for bottled water evaluated at the 90th quantile and 10th quantile of one latent trait at the time, holding all the other predictors fixed at their means. Then, the average effects in the high and low quantiles, their differences and their respective
t-statistics were found. The
t-statistics were then used to test the following hypotheses: there is no difference between consumption frequency of bottled water for individuals with high levels of extraversion and individuals with low levels of extraversion; there is no difference in consumption frequency of bottled water for individuals with high levels of agreeableness and individuals with low levels of agreeableness, and so on. We also did the same for tap water.
Then, we did the same procedure for individuals fearing risk for water quality and individuals not fearing risk for water quality and tested for differences in consumption frequency. The same was also done for individuals high in conspicuous attitude and individuals low in conspicuous attitude.
Table 3 shows the expected consumption frequency of bottled water and tap water in the 10th and 90th quantiles of the different distributions of the five different personality traits and the conspicuous attitude variable when the other predictors were measured at their means. In addition,
Table 3 also shows the expected frequency among those who fear and those who do not fear for water quality. To find the expected consumption frequency, we first calculated the conditional odds ratios from their link functions. Then, the conditional probabilities were found from the odds ratio. Finally, the conditional expected frequencies were found as
for bottled water. For tap water, the expected frequencies are
Table 3 shows that extraversion is the only personality trait that has an effect on the frequency of bottled water consumption. Individuals with high levels of extraversion are expected to drink bottled water almost 57 days per year, while individuals with low levels of extraversion are expected to drink bottled water around 49 days per year. The difference is a significant 8 days per year. Conspicuous attitude is also a significant predictor of the frequency of bottled water consumption. While individuals with high levels of conspicuous attitude are expected to drink bottled water 60 times per year, individuals with low levels of conspicuous attitude are expected to drink bottled water 47 times per year. The difference is 13, which is significantly different from zero.
For tap water, openness to experience is the only personality trait that has a significant effect. The difference between individuals at the 90th quantile of openness to experience and individuals at the 10th quantile is a significant nine times per year. We also see that fear for water quality has a significant effect on the expected frequency of tap water consumption. Individuals who fear for the tap water quality are expected to drink tap water 307 times per year, while individuals who do not fear for the water quality are expected to drink tap water 347 times per year. The difference is 40 times per year and significantly different from 0.
The tests of the hypotheses are summarized in
Table 4.
If we look at
Table 4, we see that the null hypothesis, extraversion does not influence the frequency of bottled water consumption, is rejected. The null hypotheses for the influence of agreeableness, conscientiousness, emotional stability, openness to experience and fear for water quality on frequency of bottled water consumption are all accepted. The null hypothesis for the influence of conspicuous attitude on bottled water consumption is rejected. For tap water, all the null hypotheses are accepted, except for openness to experience, which has no effect on the frequency of tap water consumption, and fear for water quality has no effect on the frequency of tap water consumption.
To summarize the results from the tests, both extraversion and conspicuous consumption have positive effects on the consumption of bottled water and, while openness to experience has a positive effect on the consumption of tap water, fear for water quality has a negative effect. Possible reasons for these effects are as follows: extraversion is linked to being with others and, when people get together, they may tend to drink bottled water instead of tap water. Conspicuous attitude is about showing and admiring wealth; therefore, bottled water may be preferred when drinking in front of others as tap water is free. The reason that openness to experience is positively related to tap water may be due to environmental attitudes [
20,
21] or it may be that individuals with a high degree of openness have an intellectual curiosity and therefore know that tap water in Norway is safe to drink. Those who fear for the quality of water will naturally drink less tap water, but some of them will drink more bottled water (the test of H6, no effects of fear on bottled water consumption, is rejected on a 10% level according to
Table 3) but they may also choose other beverages instead of water or reduce their water consumption.
7. Discussion
A range of approaches and perspectives has been applied to study water consumption. In this regard, consumer background variables, such as sociocultural and/or socioeconomic variables, have been important. In this article, we have elaborated and nuanced the set of consumer background variables for understanding the consumption of tap and bottled water. We have used the analysis of personality and water consumption in Norway as a case to show that personality is one of several variables and theoretical perspectives that should be included in the research on sustainable consumption.
In this study, latent variables for personality traits and conspicuous attitude are constructed with GRM. Unlike factor analysis, which is constructed to deal with continuous data, GRM is particularly designed to deal with ordered polytomous categories, as Likert scale items [
36]. The outcome variables, frequencies of drinking bottled and tap water, were originally registered as intervals. Hence, knowing the interval limits, and random sampling within these limits, will give a continuous distribution between 0 and 365. Beta regression is then a very suitable and flexible method to apply. The great advantage is that predictions will never be outside the (0, 1) limits.
Including variables for personalities, conspicuous attitudes and fear for water quality have some advantages: (1) heterogeneity will be reduced and thereby reduce the possibilities of biasing the other parameters and predictions from the models; (2) stakeholders may take personalities, conspicuous attitude and fear for water quality into account when making their plans, and (3) studying the connection between personalities, conspicuous attitude, fear for water quality and water consumption has, to our knowledge, never been done before.
As in most empirical studies, this study has its limitations. Survey data from one point in time are used to estimate the model. The disadvantage is that we do not know if the respondents acted in the same way the year before or the year after. To better capture the effects of water drinking habits, individuals should be measured in multiple time periods. In addition, if there are unobserved confounding variables simultaneously affecting water drinking habits and some of the predictors, our results may be biased. Qualitative data could have contributed constructively to answer why people consume water as described in our quantitative analyses.
Although our theoretical and methodological approach is not exhaustive, our results imply that a combination of personal–psychological and socio-cultural perspectives is needed to understand the complexity of water drinking practices and its consequences. Moreover, we argue that the perspectives need to be applied and understood as mutually dependent in a reinforcing and interpretive framework. The fact that cultures differ according to degrees of trust in market and state, and in the understanding of hygiene and contamination risks, makes the combination of personal–psychological and sociocultural perspectives also relevant for other sustainable consumption practices, on a more general level. We elaborate briefly on these issues and our combination of perspectives in the concluding section.
8. Conclusions
Based on our analysis, our results can be summarized as follows: (1) personality traits are important predictors of water consumption; (2) perceived risk and trust of water quality is linked to low consumption frequency of tap water but not necessarily to the consumption frequency of bottled water and (3) the consumption frequency of water purchased in bottles can be related to conspicuous consumption.
Water treatment plants in Norway have improved over the last 20–30 years [
37]. In October 2019, the Norwegian Food Safety Authority (NFSA) reported that
the drinking water in Norway is safe, in the sense that most residents receive healthy drinking water from a water supply system. However, increased focus on drinking water is highly important to prevent future problems and further improve the condition [
38]. Even though the report concludes that the water in Norway is safe, media and public discourse regularly focus on the risk and incidents of contaminated water. From a historical perspective, one may then assume that the perceived risk of consuming tap water has shifted from being compared to the risk of consuming tap water at an earlier stage to also being compared with other alternatives, such as bottled water. The degree of awareness of the relationship between water and risk can thus be understood as an example of social memory and how people remember [
39] and forget [
40].
Our results indicate that bottled water competes with tap water as an alternative and adaptive practice to handle risk and uncertainty. Although tap water has become safer, it may be communicated and perceived as less safe relative to bottled water in the media and public discourse. However, discursive construction may also have varying impact. The public discourse may impact differently on consumers with different personalities. Whereas the option of buying the bottled water may be more attractive for consumers with high extraversion, the option of turning the tap may be more attractive to consumers high in openness to experience. Against this background, one may ask, what if the water qualities had been framed differently in communication and discourse from governmental authorities and stakeholders, emphasizing that Norwegian water is safe, less expensive and does not produce plastic waste and contribute to microplastic risk? Would this have had different impacts on people with differing personalities? If so, stakeholders should consider the connection between psychological traits, tap water, bottled water and the discursive conditions when strategizing.
As mentioned, our results also indicate that consumption of tap and bottled water reflects different kinds of trust. A coarse and maybe speculative analysis of these results is that consumers’ personality and choice between tap and bottled water reflect their personal trust in state or market. A continuation of such an argument is that trust in the market and turning to bottled water due to increased risk in drinking water represents an adaptive practice in a changing climate. According to a personal–psychological perspective, this practice may be more used by people with a certain personality and requires resources such as economy and trust in market. Bottled water from a specific place, such as San Pellegrino or Vichy Catalan, may be understood to hold specific natural and symbolic quality traits. The water has a specific taste and consumers trust that it has undergone specific control. This may represent consumers’ trust in market mechanism. On the other hand, Norwegian consumers may also know where their local water source is. Depending on their perception of the supplier system as trustworthy or a black box/black pipe, this can be understood as more or less trust in the state.
Additional to personality and risk, our results also indicate that consumption of bottled water is used to express and impress. However, our results do not give information concerning the kinds of reasons, norms and attitudes that are important for this conspicuous consumption practice. It can be related to various motives, such as hygiene, class, healthy lifestyle, etc. An interesting consumption pattern that transcends the tap and bottled dichotomy is that some people tend to fill bottles that initially were bought with special water with tapped water [
18]. The explanation for this practice can be practical but may also be performative. The performative approach can be understood as kinds of
backstage and
frontstage consumption, according to Goffman’s [
41] (p. 107 and 114) famous concepts. Bottled water may be more used in public spaces, whereas tap water may be related to backstage. Understanding water consumption as an omnivorous consumption practice [
42] may be a constructive analytical perspective in this regard.
The combination of personality, conceptions of risk/trust and conspicuous attitudes and adaptive consumption practices may be studied further to understand the impact of personality on consumption in general. In addition to water, this may include new qualities represented by products such as purified water, food made from insects, genetically modified foods, foodstuff produced with the use of human excreta as fertilizer More knowledge about early adopters [
43] of sustainable qualities and their personal traits should be of interest in the transition to more sustainable consumption.


