Sexual Violence in the City: Space, Gender, and the Occurrence of Sexual Violence in Rotterdam


1
Institute for Housing and Urban Development Studies, Erasmus University Rotterdam, 3062 PA Rotterdam, The Netherlands
2
Department of Civil Engineering, Western Norway University of Applied Sciences, 5020 Bergen, Norway
3
Department of Urbanism, Faculty of Architecture, Delft University of Technology, 2628 CD Delft, The Netherlands
*
Author to whom correspondence should be addressed.
Sustainability 2020, 12(18), 7609; https://0-doi-org.brum.beds.ac.uk/10.3390/su12187609
Submission received: 15 July 2020
/
Revised: 1 September 2020
/
Accepted: 13 September 2020
/
Published: 15 September 2020
(This article belongs to the Special Issue Space Syntax and the Sustainable City: Theory, Methods and Applications)
Abstract
:There is a need for knowledge of how the spatial features of the urban environment can shape the potential for safe streets and a gender inclusive society. This research reveals the relationship between a built environment’s spatial features, the presence of various types of people, and gender-based sexual violence in the public space of four neighborhoods in Rotterdam. Detailed sexual violence data are obtained from the police on a street resolution level for correlation with the spatial data on a micro and macro scale level (the space syntax method) and registrations regarding human behavior on streets at different time periods. Pooled Poisson regression models were created to explain the number of sexual violence reports per street and per block. The result is that there are correlations between the occurrence of sexual crimes, the number of people and women on the streets, local spatial integration, the land use of streets, and temporal aspects. Non-residential streets are safe during the day but become dangerous at night, and mixed land use is safer than mono-functional areas. A high degree of inter-visibility for entrances generates high degree of natural surveillance, resulting in greater safety on streets. A residential street with higher flow of people has fewer incidents than mono-functional commercial blocks. Commercial blocks have higher numbers of incidents at night due to the lack of natural surveillance from windows on the ground floor after shops close.
1. Introduction
The most common advice for preventing sexual violence in cities is to avoid “being at the wrong place at the wrong time”. Research on sexual violence is mostly approached from a social and psychological perspective, whereas preventive strategies consist mainly of improving lighting and installing surveillance cameras in so-called scary places. However, little focus is put on the spatial features of the places in relation to the temporal aspects where sexual harassment take place. Planning a gender inclusive built environment requires knowledge of the physical setting to enhance safe streets, which is in line with the United Nations sustainability goal number 5 on gender equality.
Urban design strategies for making safe places depend on general knowledge of unsafe built environments’ spatial features. We gained access to a detailed registration of human behavior in the public spaces of four neighborhoods in Rotterdam, where temporal aspects and the age and gender registrations of recorded people are taken into account. The challenge is to find reliable records of where and when sexual violence takes place. Reporting is difficult for the victims due to shame, fear, and other factors; in most cases, it does not lead to concrete action. Likewise, police files often lack precision in terms of location and the gender of the harasser and victim. Moreover, there are statistical challenges to overcome. The number of incidents must be correlated with the number of potential targets in public space: where there are no women, no sexual violence towards women can take place. In the Rotterdam case, the police records on sexual violence in public space are registered on a street resolution level, but victims’ gender has only been recorded since 2012.
Public spaces are the stage for a number of crimes, from pick pocketing to robbery to sexual assault. Violence on the streets limits freedom and citizens’ rights on daily basis [1,2]. It affects the way people access opportunities by limiting the times that they go outside, limiting their choice of transportation, limiting the choice of routes to destinations, and may even result in them renouncing desired activities. This is especially true for women, who suffer from sexual harassment and assault in cities all over the world [3].
Several researchers have shown how limited access to the city curtails women’s economic potential in diverse ways. Family and home responsibilities that have traditionally fallen on women’s shoulders, such as taking children to school and grocery shopping, limit women’s available time, eventually forcing them to take part-time jobs. In addition, restrictions on work entrance and exit times, as well as work locations that are unsafe at night or require accessibility by car, are all factors that might prevent women from getting the best paying jobs available [4].
Causes for sexual violence can be grouped into three categories: social factors (such as gender inequality and sexism), economic factors, and physical (spatial) factors. This research’s objective is to reveal the relationship between the built environment’s spatial features on a micro as well as macro level and gender-based sexual violence in public spaces in Rotterdam. How is gender-based sexual violence spatially distributed in Rotterdam’s neighborhoods in relation to the socioeconomic characteristics of a neighborhood? Furthermore, how does the relationship between the inter-visibility of buildings and streets, the use of buildings, and degrees of street network integration play a role in the extent of women’s presence on streets and the occurrence of sexual violence?
Previous studies have been mostly qualitative and focused on fear causing impacts. For instance, there are studies on how fear impacts on women’s use of space [1,3,5], women’s mobility issues [6,7]), and fear and perception of safety [8]. This study, however, adds quantitative research results on street-level resolution to existing knowledge. Most crime data tend to be registered on a neighborhood or postcode level, which hinders precise descriptions of the spatial features that characterize where incidents take place.
A recently published report about sexual harassment in Rotterdam found that, from a sample of 1200 women aged 18 to 45, 84% experienced men whistling at them, shouting, insulting, asking for sex, following or cornering them in public spaces. As a result, 44% of the interviewed women felt irritated, insulted, threatened, or limited in their sense of personal freedom by sexual harassment. If there is a strong correlation between sexual violence, gender, and public space, then the challenge is to gain knowledge on the spatial framework contributing to the provision of a safe living environment for women.
2. Research on Gender, Space, and Violence
Maintaining urban safety is fundamental for a vital street life. A few cases of violence in a street are enough for generating avoidance, contributing to unsafe streets [9]. Divergent views have been proposed to design safe cities, but with a lack of systematic evidence. In 1961, Jane Jacobs proposed that streets should be open for inhabitants and visitors at all times, and that eyes from buildings on streets ensure natural surveillance. Conversely, Oscar Newman proposed in 1972 that spaces should be designed with semi-public spaces, separating inhabitants and visitors [10].
Two different scenarios for eliminating gender-based violence on streets can be imagined. The Newman-inspired scenario consists of urban areas for exclusive male or female use. Shopping, entertainment, education, and jobs are all clearly divided by the gender of their users. Clearly, no gender mixture on streets means no opportunities for sexual violence of men towards women. The Jacobs scenario presents a gender-mixed city, where the vivacity of streets ensures their safety.
The so-called scientific “objective” construction of knowledge represents the perspective of the white male, without assuming this perspective as a partial one. Rather, this perspective has been repeatedly declared as “universal” and valid for everyone. Accordingly, feminine approaches to scientific knowledge are seen as “partial” approaches. Rather, both approaches should declare themselves as views that are associated to a subject who authors them, be it men or women [11].
Many scholars claim that gender is a socially constructed concept and norm, and that this construction relates to the way women use the city. The basic unit for urban policies and plans was the stereotypical family, where the private realm is the place for female members and the public realm is for male members [12]. It is argued that gender-based sexual violence has a profound influence on the relationship of women with the city, beyond the realm of conscious thought.
The right to the city is exercised every day, in every activity a person engages in. To access such activities, people largely need to move across the city by any means available. Commuting research [7] shows that women’s mobility in the city is very different from men’s. Gender roles that are traditionally associated with women, such as taking care of children, running errands, and keeping house provision, have an impact on the way women move in the city. Women walk and use public transportation more, besides doing more trip-chaining (e.g., bringing children to school on the way to work, shopping on the way from work) than men, who usually travel directly from home to work [7]. In the Netherlands, research has shown that men take more work and leisure trips than women, while women take a higher proportion of trips for shopping purposes than men. Men also take more trips by car (31%) than women (16%), while women take more trips by public transportation (28%), bike (19%), and as a car passenger (15%) [13].
Women’s perception of safety is affected by their lack of control over who they interact with: “unlike men, women find that when in public space their personal space is frequently invaded by whistles, comments, or actual physical assault from strange men” [1] (p. 386). Bowman [5] proposes the “open category” theory to explain how men often seem to feel entitled to impose interaction with unknown women on the street. She observes that men invade women’s privacy in the public space to reinforce that women (unlike men) belong to the private sphere. In Rotterdam, Fischer and Sprado found that 50% of women attributed street sexual harassment to a desire by men to exercise power (2017).
Fisher and Sprado conducted research on street sexual harassment with 1200 women aged 18 to 45. Over a period of one year, 84% had experienced sexual harassment in the form of men whistling at them, shouting, insulting, asking for sex, or following or cornering them in public spaces. 44% of respondents felt irritated, insulted, threatened, or limited in their sense of personal freedom by such undesired approaches. They explained that reporting sexual harassment took too much time and energy and produced too little results [14].
Fear of crime, for women, is mostly a fear of men [2]. A reason for this is that “the behavior of any stranger encountered is potentially unpredictable and uncontrollable” in the public space [1] (p. 386). Interestingly, Valentine’s research suggests that women only perceive men as “strangers” in the public space. What some authors call a “paradox” is that women’s greatest fear of sexual assault derives from strangers in the public space, even though data reports show that victimization is much higher at home with partners or other acquaintances. The fear of public spaces is partly due to government policies advising women to avoid places and times perceived as more “dangerous”, and also due to the societal tendency to place blame on victims for being in “the wrong place at the wrong time” or for wearing “inappropriate clothes” when they were attacked [2]. Such institutional and social behavior has long placed responsibility on women to avoid such attacks, rather than focusing on building societies, environmental conditions, and cities less favorable to such crimes.
Gender and city access studies explain sexual harassment as a demonstration of the power of men and a reminder of ownership of public spaces displayed by men towards women. Studies on men’s reasons for harassing women show that harassment is a result of boredom, feelings of youthful camaraderie, anger towards the privileged class, or a desire to humiliate their victims [15] (p. 397). Fischer and Sprado’s research in Rotterdam shows that 47% of the women were harassed by perpetrators from a group. Being in a group provides anonymity and a diminished sense of individual responsibility to the street sexual harassers, reducing their fear of personal consequences. Young people involved in street sexual harassment usually have little reason to stay at home, know little structural leisure, and likely have no responsibilities, resulting in boredom and a significant amount of time spent on streets, thus leading to harassing behavior [14].
The extent to which sexual violence corresponds to a crime depends on the laws of each country. In the Netherlands, sexual violence can be identified as a crime of sexual assault (aanranding) or rape (verkrachting) when it also involves penetration of the body. Under such laws, street sexual harassment is not considered as a crime. It is seen as “too subjective”.
The occurrence of sexual harassment does not significantly vary with factors like country of origin, whether the women are completely covered (in Egypt) or less so (in Vienna), or the education, income, or age of the men. The only exempt areas are villages where everybody knows each other and residential suburban areas [15]. The study from Rotterdam shows that sexual harassment is more common in places with bars and nightclubs along the streets and in late night shopping areas in the city center. The scariest forms happened in residential areas or on women’s way to residential areas.
Public spaces are the setting for most sexual harassment and violence perpetrated by strangers. The public space is also a realm undeniably under the government’s responsibility, as this is a matter of public safety [4]. Therefore, the spatial features of the places where sexual violence takes place need to be analyzed in order to provide ruling bodies with increased knowledge to create safer city building/city regeneration guidelines. However, spatial features cannot be studied separately from the temporal aspects in the topic of sexual violence.
There are several writings on how physical improvements can be made to increase the feeling of safety in built environments. Boomsma and Steg [8] concluded that the most important physical factors for the perception of safety (or absence of it) apart from gender are lighting, the effect of entrapment (blocked escape), and concealment. To control other variables, the authors studied these factors in a virtual environment. They found that women felt more afraid than men did in the same settings and that people felt less safe in situations with lower lighting and higher entrapment.
Other studies have registered experiences with physical modifications of space to increase its safety. Beebeejaun [16] terms them “technical fixes” (as opposed to social ones), focusing on improving visibility in landscaping, lighting, and the implementation of Closed-Circuit TV (CCTV). Although they are important, Beebeejaun highlights the insufficient gender understanding (by professionals involved in these urban regeneration programs) as an obstacle to better results of the interventions. In her opinion, technical fixes must “challenge gender relations, rather than perpetuate them” [16] (p. 226). Finally, Beebeejaun draws attention to the fact that CCTV is not fit to monitor verbal and other less explicit forms of sexual violence.
Regarding space syntax research on space and crime, macro scale studies show that different types of crime require different types of space. While pickpocketing typically happens in crowded integrated streets, burglary happens mostly in locally segregated streets with low pedestrian flow and thus low natural surveillance [17]. Van Nes and López developed tools for quantifying spatial relationships between private and public space. Comparing these micro scale attributes with crime occurrence data shows that burglaries take place mostly along un-constituted streets with low inter-visibility from neighbors, with high topological depth both in relation to the street and to the city (far from main streets). The micro scale factors are interrelated to the macro scale ones [18].
Another study shows that neighborhoods with poor connections between buildings and streets and segregated streets generate social separation among ethnicities, gender, and age of users. Women were more frequently seen walking in vibrant, integrated streets and very rarely in the most segregated streets, while men dominated the segregated streets [19]. Van Nes and De Rooij’s research [20] shows that vibrant streets were perceived to be safer, and that the street network and micro scale relationship between streets and buildings played a role in making such streets lively. Neighborhoods lacking street network integration and inter-visibility between buildings and streets contributed to unsafe streets.
Correlations were also found between improper touching and spatial configuration in a research project on sexual harassment in Cairo. The incidents were located in the most integrated street segments, and men dominate public spaces of central Cairo after dark. The spatially integrated main streets have a dual effect: they give a sense of safety through informal surveillance through the presence of other people, whereas the crowd itself “may assist potential harassers to perpetrate, hide, and escape swiftly” [21] (p. 1).
As the few previous space syntax studies on space and crime indicate, there is indeed a relationship between urban spatial features and sexual violence. However, there is a lack of systematic knowledge on the relationship between urban spatial features of the built environment and sexual violence victimization. Getting access to a detailed police report is often difficult, if it exists at all. Often the success of research projects on space and crime stands or falls on the willingness of the police to share these data. Moreover, these police data need to be compared with detailed registration of potential targets on streets in relation to the presence of all types of people on streets at different time periods and with the various spatial features of the built environment. This systematic knowledge is needed before any well-functioning recommendations can be given for urban planning and design practice.
3. The Research Operationalization of the Rotterdam Case
The following four neighborhoods in Rotterdam were investigated: Cool, Hillesluis, Pendrecht, and Nieuwe Westen. These neighborhoods have defined administrative borders (in Dutch named “wijken”). Table 1 shows the operationalization of the research concepts, including indicators, source of the information and scale of measurement for each variable.
Rotterdam’s police department’s records provide data of reported sexual violence with location at street level. The report about street sexual harassment in Rotterdam shows neighborhoods where women have suffered the most street sexual harassment in the previous year. In addition, the Netherlands provides detailed socioeconomic data at neighborhood level (Wijkprofiel) [22].
Rotterdam has approximately 635,000 inhabitants located in 71 neighborhoods. The chosen four neighborhoods represent different types of local centers and residential areas, both from post-war and pre-war construction periods. Information about the spatial characteristics of these four neighborhoods is registered and analyzed accordingly: the spatial structure (Space Syntax analysis of Rotterdam’s street network), the relation between streets and buildings (constitutedness, density of entrances, and inter-visibility of doors and windows), land use type of buildings (residential, commercial, or mixed—usually buildings with commercial use on the ground floor and residences on the upper floors), gender, and human behavior in public spaces (static snapshots differentiating between men, women, and groups of potentially threatening men). Here, the number of people on the streets has an additional purpose: to allow the calculation of the victimization risk, which results from dividing the number of reported cases of sexual violence per street by the number of women in the respective streets.
A single database was created combining the registrations of human activities on the streets of the four neighborhoods and the socioeconomic information from the Wijkprofiel (a neighborhood-scaled research conducted by Rotterdam’s government) of 2014 and 2016 [22]. The four areas combined resulted in a sample of 708 street segments (blocks), 247 streets, and about 84.8 kilometers of streets. Sexual violence data from Rotterdam’s police and from the report of Fischer and Sprado [14] were added into the same database.
All results from the spatial analyses, registrations of human behavior on streets, and sexual harassment data were inserted into both QGIS and Excel and were analyzed with these software programs. The results were also analyzed with the statistical program STATA. Finally, results about crime and built environment features were spatially compared in QGIS and statistically analyzed in STATA. The statistical analysis was conducted using a pooled Poisson model. It is pooled because the 5.5 years of sexual violence records were combined to provide a larger sample per block and street instead of analysing each year separately as panel data.
4. Results
After the Second World War, Rotterdam was reconstructed according to modernist urban planning ideals. In the search for a well-ordered separation between work, shopping, and home, the city accomplished also a gender separation in space [23]. Seventy years later, the modernist model continues to influence how space is used by men and women in Rotterdam.
4.1. Sexual Violence Data and Temporal Aspects
First, we examined the spatial distribution of cases as well as their distribution in time (day, week, and year) and compared them with Fischer and Sprado’s research results. The data provided by the police includes sexual assault and rape cases, as well as information of when it happened (day, time), exactly where (street, neighborhood, and district) and who was involved (victim, suspect, and witnesses, sometimes with the gender of each one).
Out of 1087 reported cases of rape and assault, only 29% (320) have identified suspects, of which 98.4% are male, 1.3% are both male and female, and 0.3% are female. The gender of the victim is identified in 55% of the reported cases. Of these, 96% of cases had female victims, 3.7% had male victims, and 0.3% had both. The distribution is essentially the same when assault and rape are investigated separately. The cases with male victims or female suspects were discarded due to the low numbers of reported cases, and the remaining 1059 cases were used for this enquiry. We are aware that sexual harassment with both female and male harassers and male victims takes place. Due to shame issues, these cases tend to be underreported.
Examining the type of crime, sexual assault is about three times more frequent than rape in Rotterdam’s police records. In the 5.5 years of data, there have been 780 sexual assault cases and 279 rape cases. Table 2 shows the number of crimes per neighbourhood inhabitants, per people on the streets and per total street length in each area.
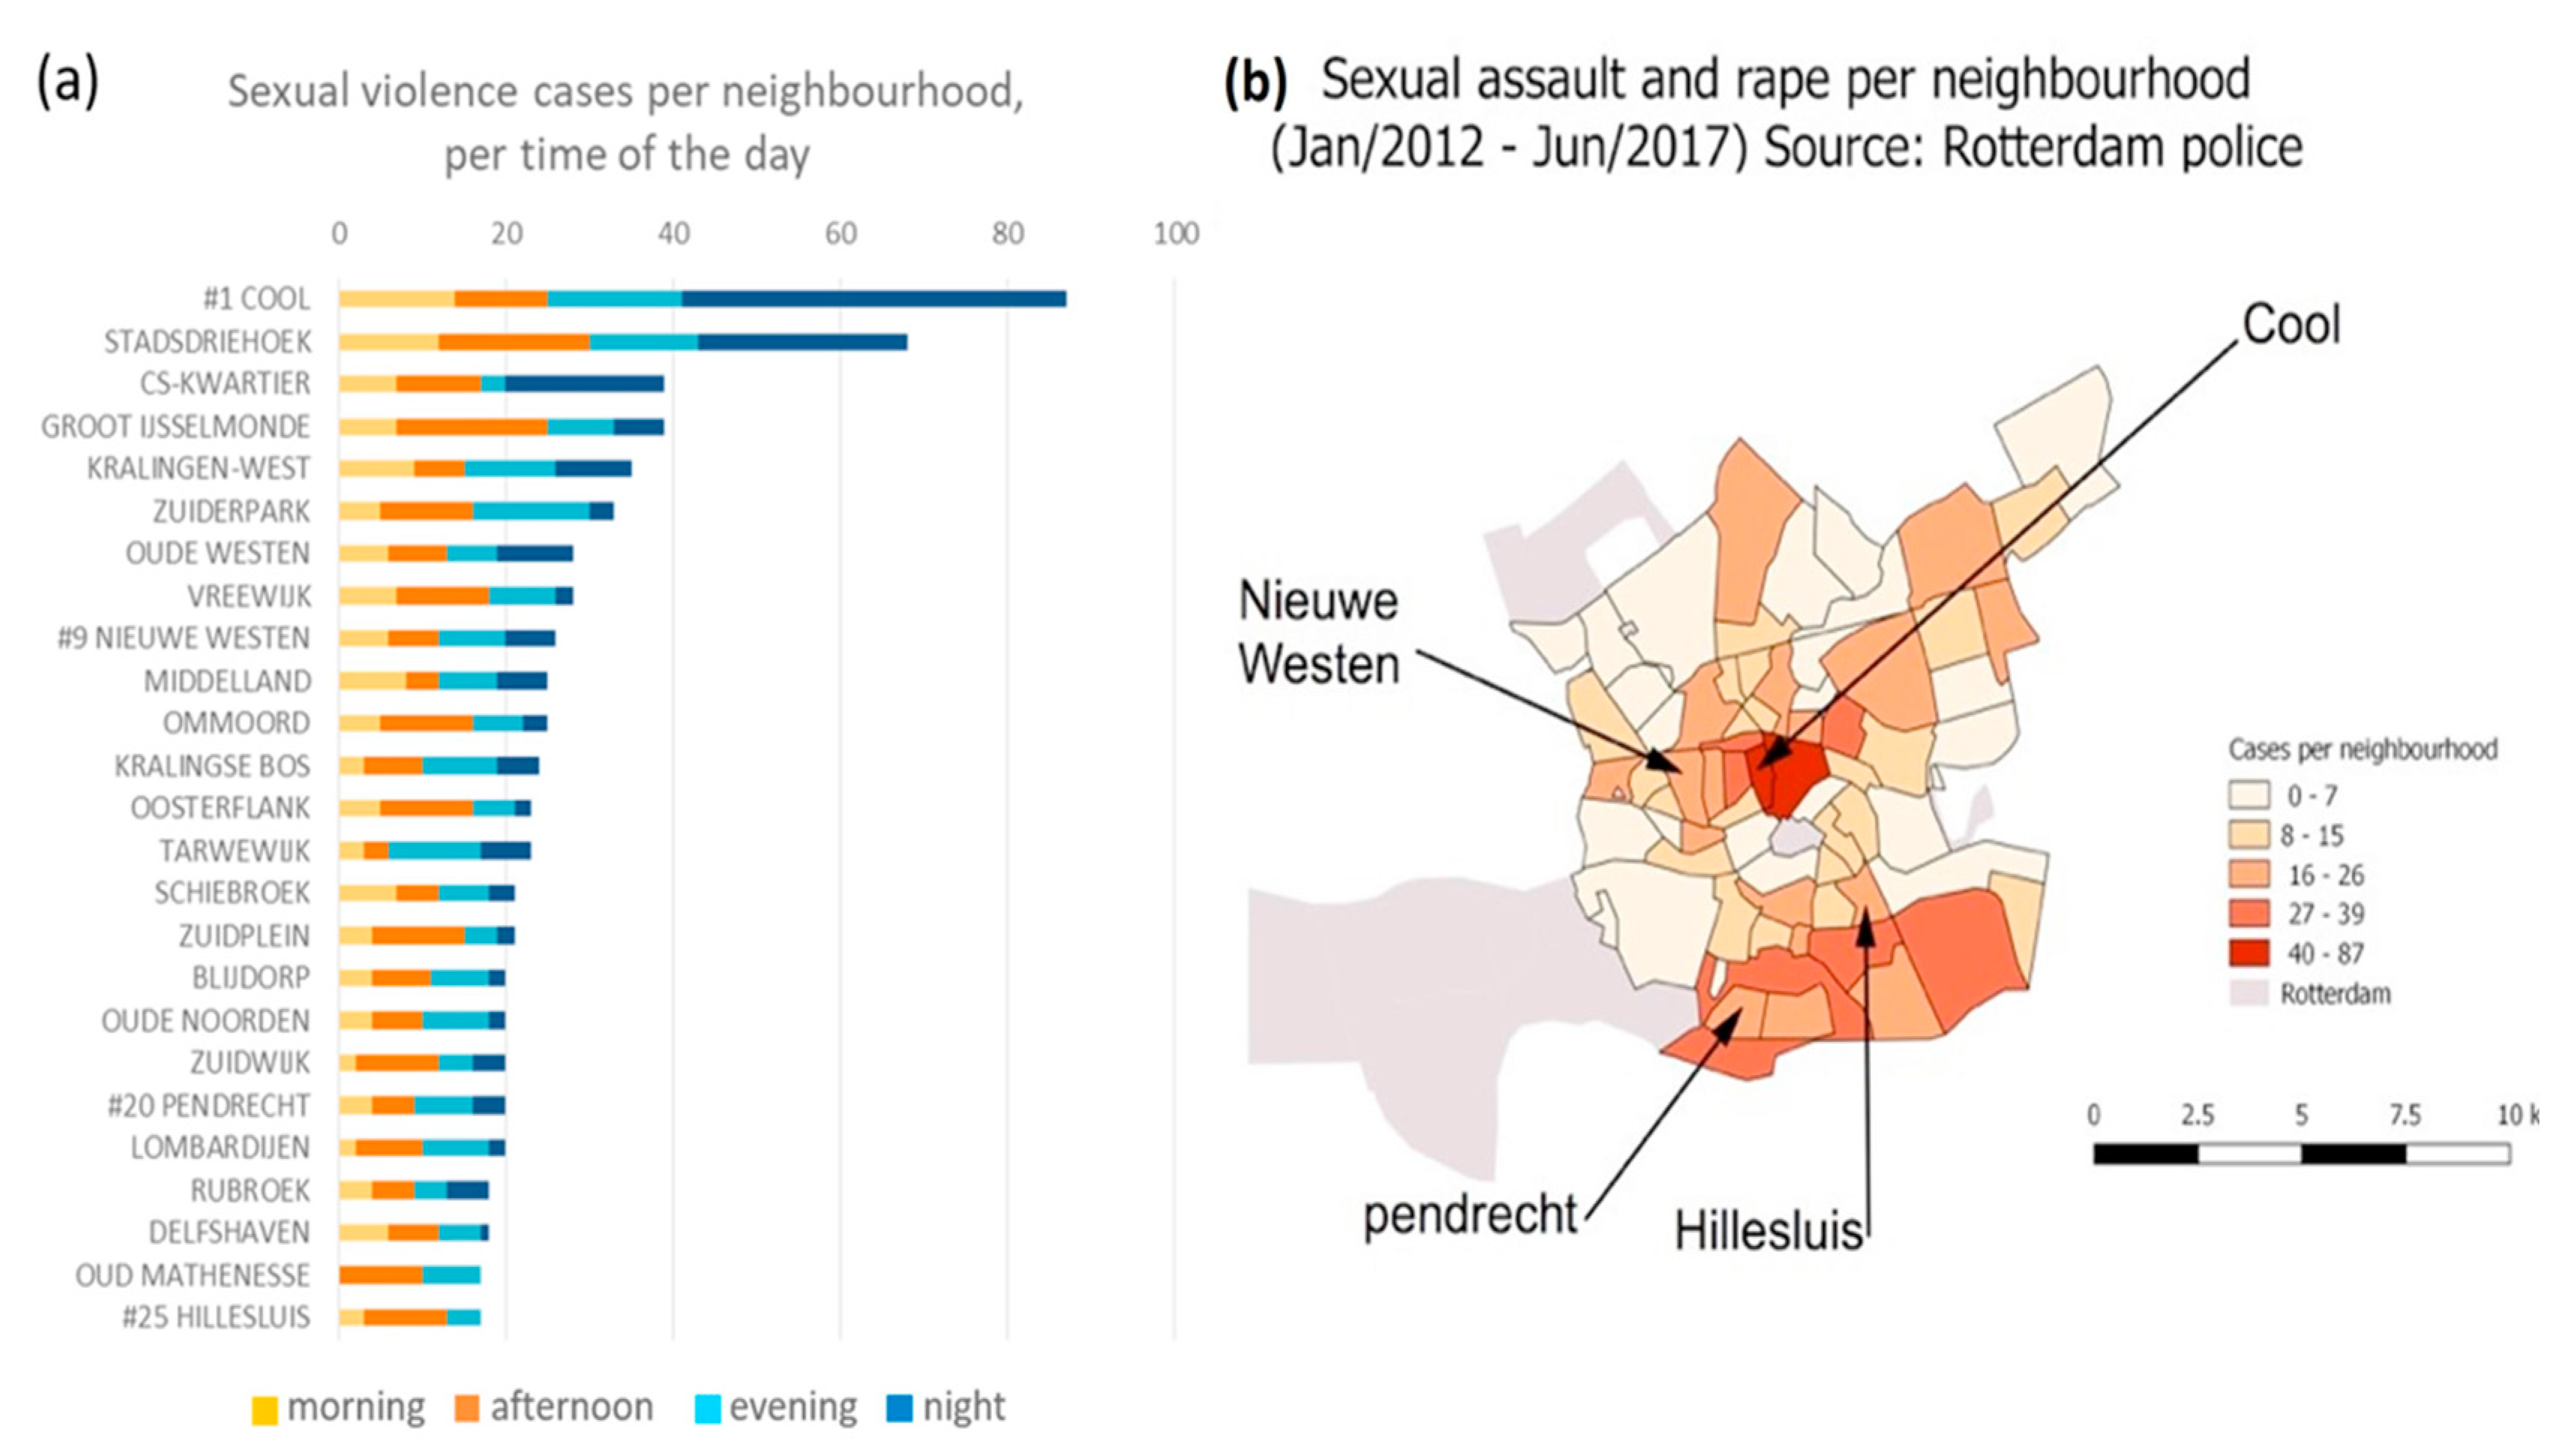
Figure 1 presents the number of cases per neighborhood for the period of 2012–2017 for the 25 neighborhoods with the highest number of incidents from the police reports. The four chosen neighborhoods of this study (Cool, Nieuwe Westen, Pendrecht, and Hillesluis) rank 1st, 9th, 20th, and 25th, respectively.
Nieuwe Westen, Pendrecht, and Hillesluis have all been listed as “problem neighborhoods” in the Netherlands [20], and yet it is Cool that shows higher incidence of gender-based sexual violence. Furthermore, southern neighborhoods are perceived to be more dangerous than the northern ones. However, concerning sexual violence, the two investigated northern neighborhoods are more dangerous than the two in the south. While Cool may have the highest incidence of sexual violence reports relatively to its population, it shows the lowest rate of incidence when considering the total number of people who walk in the neighborhood during a weekday (Table 1).
An analysis of the 25 streets with the highest number of incidents examined together with temporal aspects shows that nearly all streets with sexual violence cases at night (from midnight to 6 a.m.) are close to or offer nightlife activities. Most cases happen on Thursday, Friday, and Saturday, followed by Monday. Saturdays have only 20% more cases than Tuesdays, the least “dangerous” days according to the reports. As anticipated, the city center (Cool, Stadsdriehoek, and CS-Kwartier) concentrating much of the city’s nightlife, has most of its cases on Saturdays and Sundays. In the remaining areas, no clear pattern appears. The spring season has the highest number of sexual violence cases, followed by winter and summer. When examining the hourly distribution of cases in Rotterdam, most occurrences happened between midnight and 1 a.m., while the remainder of cases are evenly distributed over the day from 8 a.m. to 8 p.m.
4.2. Crime and Socioeconomic Aspects of Neighborhoods
Cool is an average-income neighborhood, Nieuwe Westen and Pendrecht have high numbers of low-income households, and Hillesluis has about 40% residents with low household income. There is no clear correlation between the share of residents who have trouble reading Dutch, neither the share of school drop-outs, nor the share of residents with low household income with the occurrence of sexual violence. Additionally, household incomes are not related to the percentage of inhabitants who know their neighbors. However, all four neighborhoods have low shares of “residents who know their neighbors” (between 14% and 35%).
No clear pattern can be seen when correlating these variables against sexual violence data. Nevertheless, neighborhoods where residents know their neighbors tend to have less reports of sexual violence. Furthermore, neighborhoods with higher shares of households with high income tend to have less sexual violence, but it is not a determinant factor. Reasons might be that these neighborhoods are mostly in suburban areas.
Therefore, a more detailed study is necessary to reveal the spatial features of Cool, Nieuwe Westen, Pendrecht, and Hillesluis neighborhoods, the number of potential targets in public spaces, and the spatial distribution of sexual violence data.
4.3. Cool—The Modern, Lively City Center
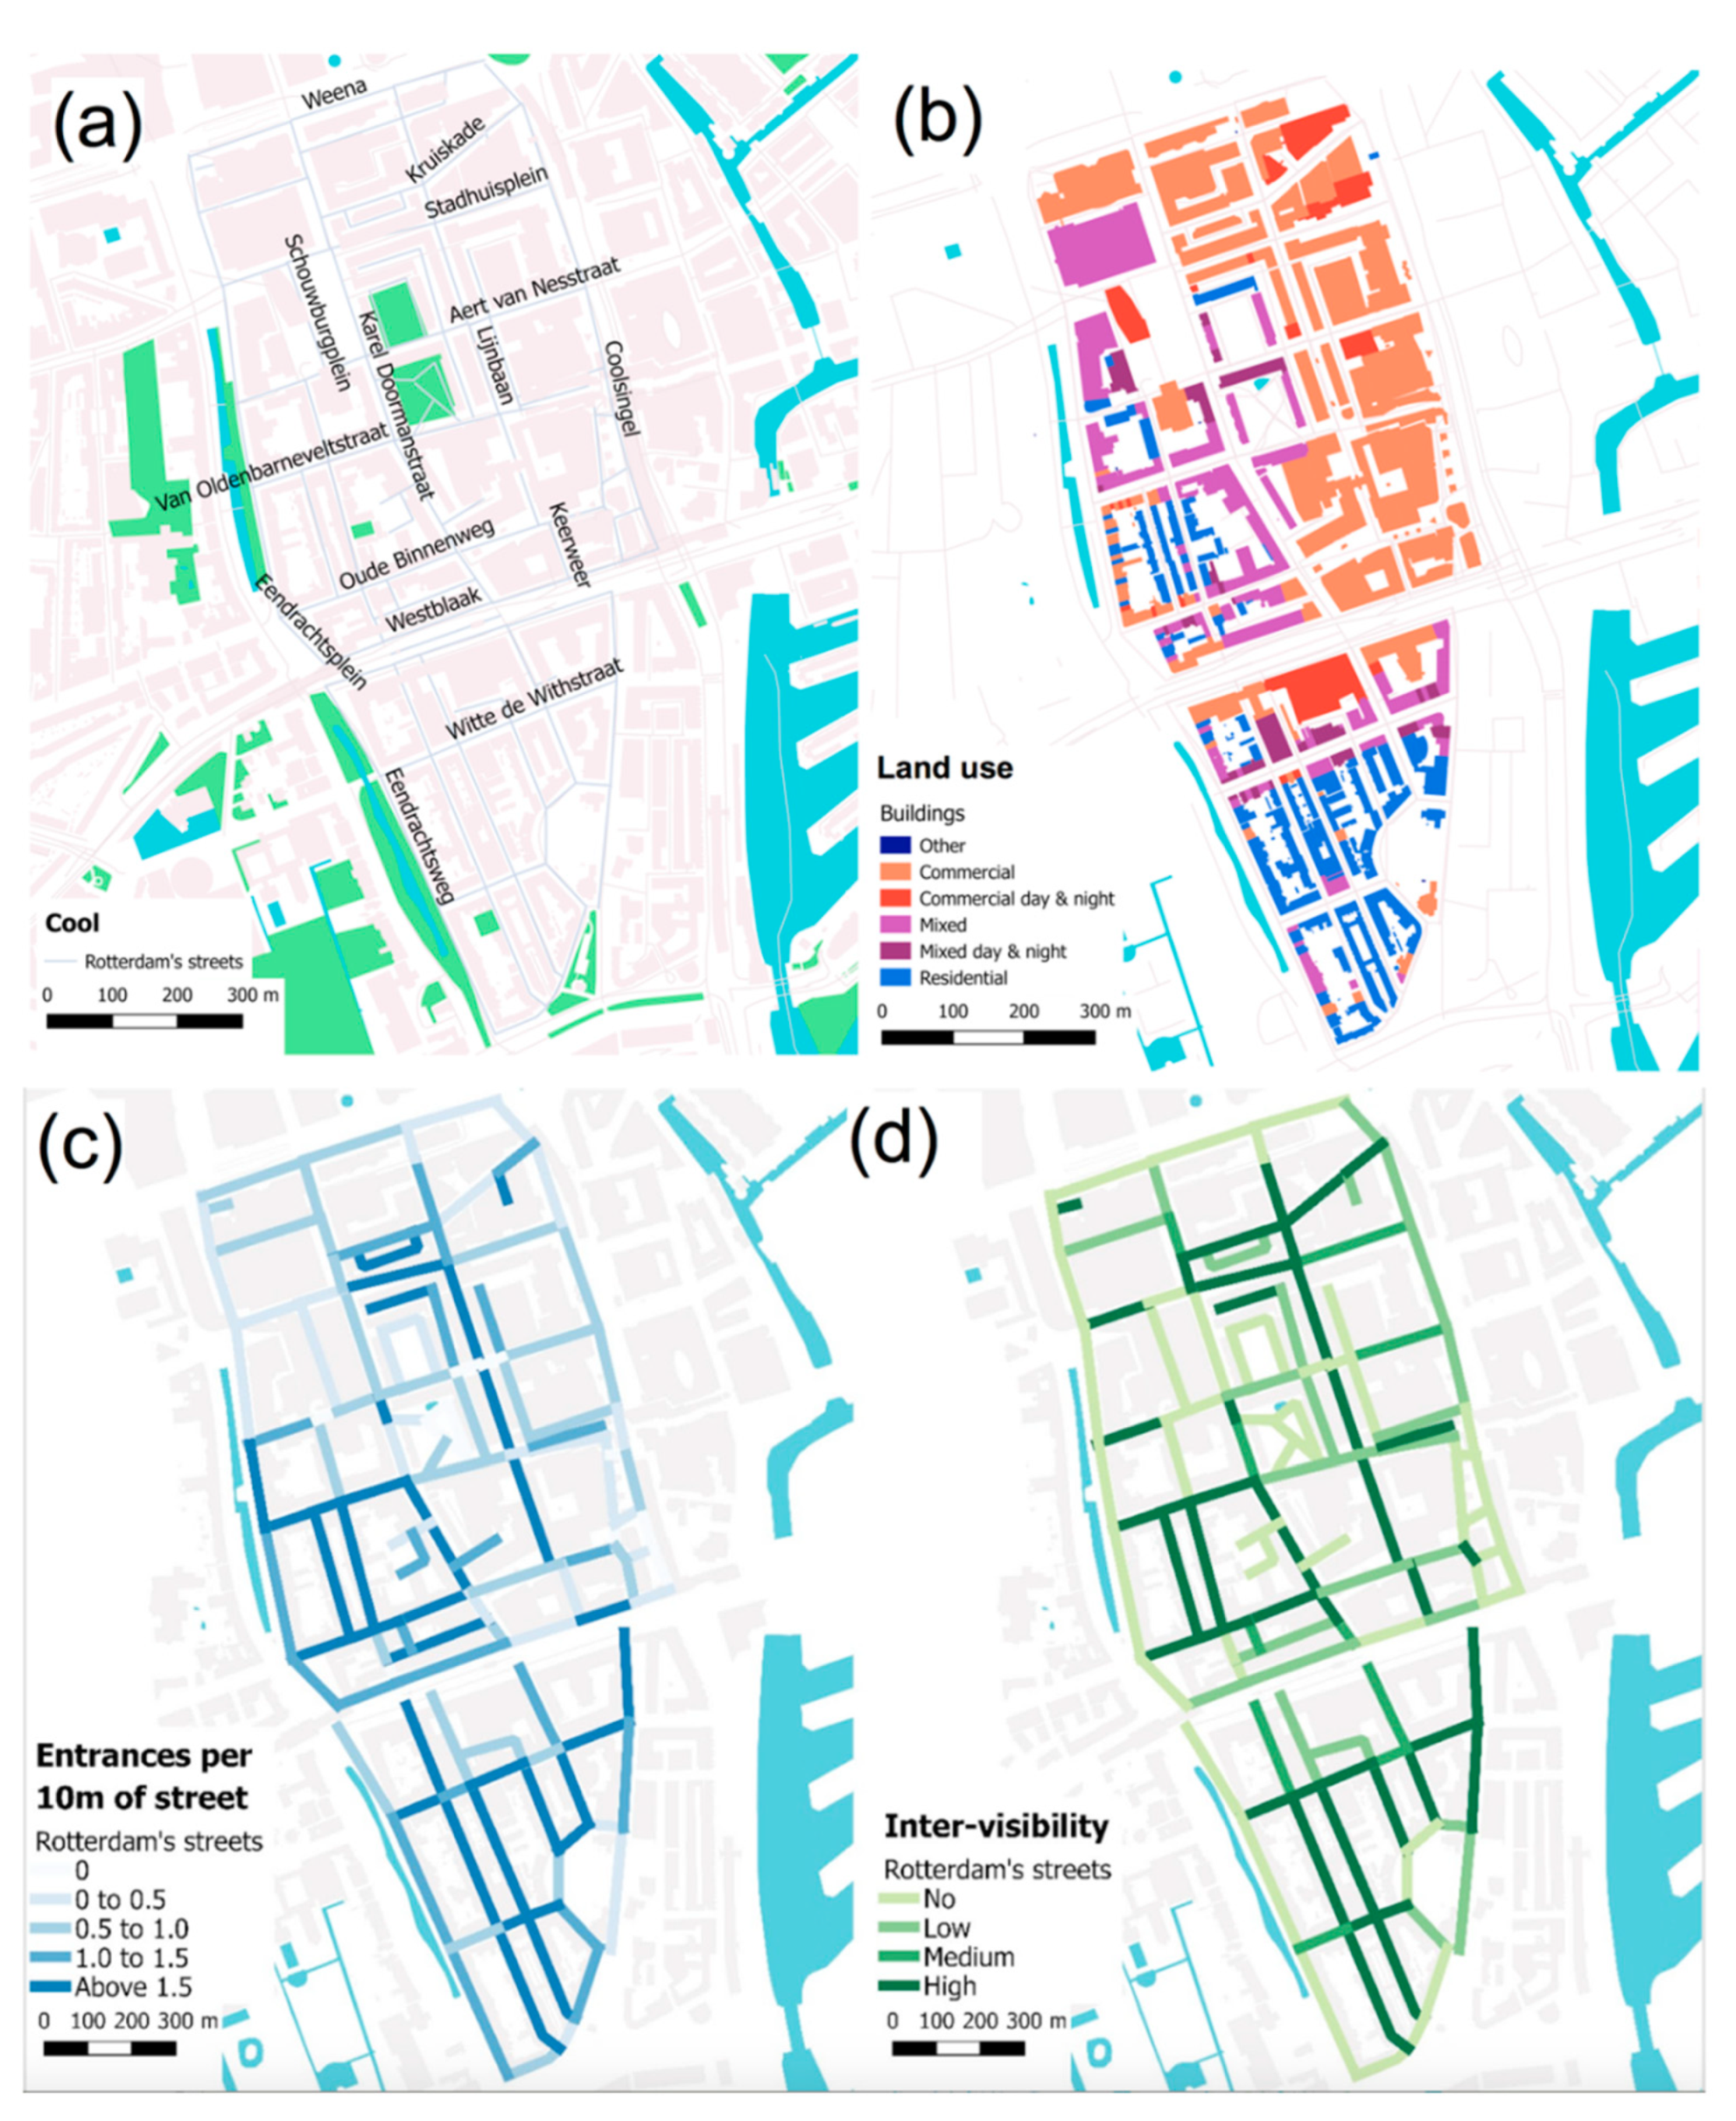
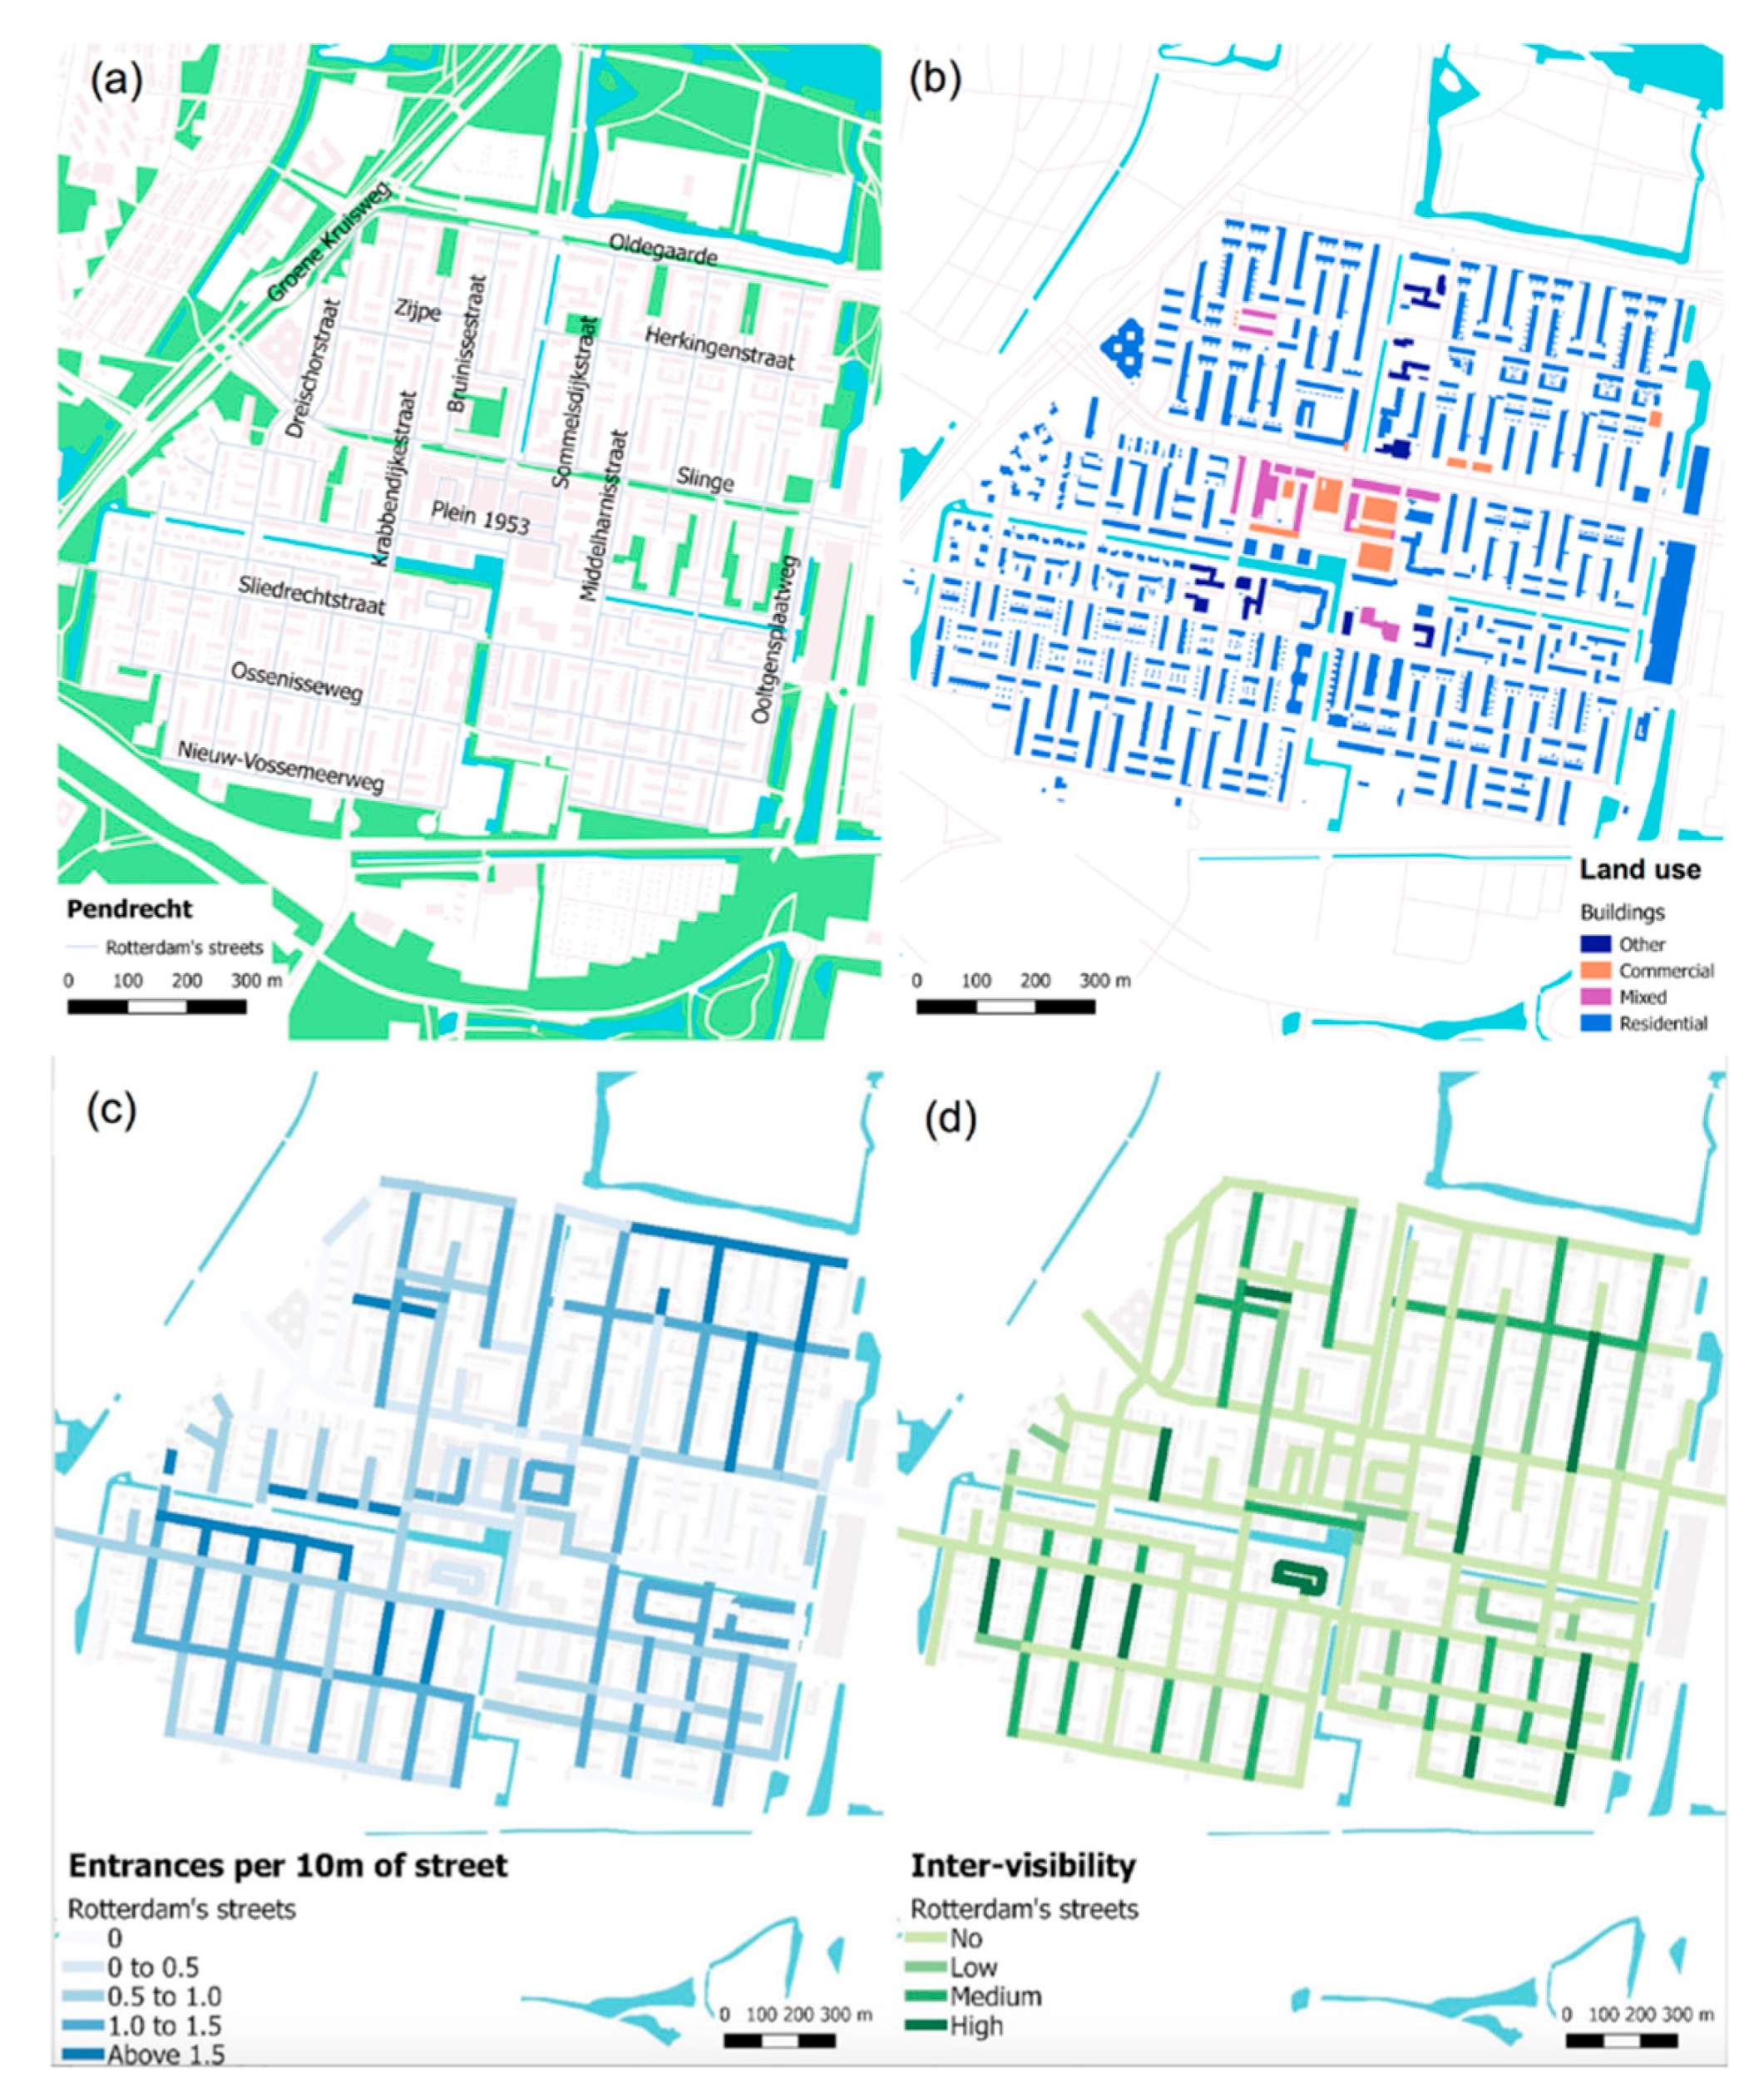
Figure 2 (upper left) shows the main streets in the Cool neighborhood. Cool has 5,086 inhabitants and is the main shopping center of Rotterdam. A lively restaurant street and most dwellings are located South of the Westblaak Avenue. The land uses of buildings are grouped into commercial, residential, and mixed use (commercial on the ground floor and residential on top). The commercial function is divided into “commercial” for businesses that are open from 9 a.m.–5 p.m. and “commercial day and night” for restaurants, bars, and nightclubs open late at night.
Some of the streets with high density of entrances in the northern area are the Lijnbaan (pedestrianized main shopping street), the Korte Lijnbaan, Oude Binnenweg (a street with shops, cafés, and bars), and Van Oldenbarneveltplaats. In the southern area, Witte de Withstraat (the main restaurant/bar street) has also a high density of entrances.
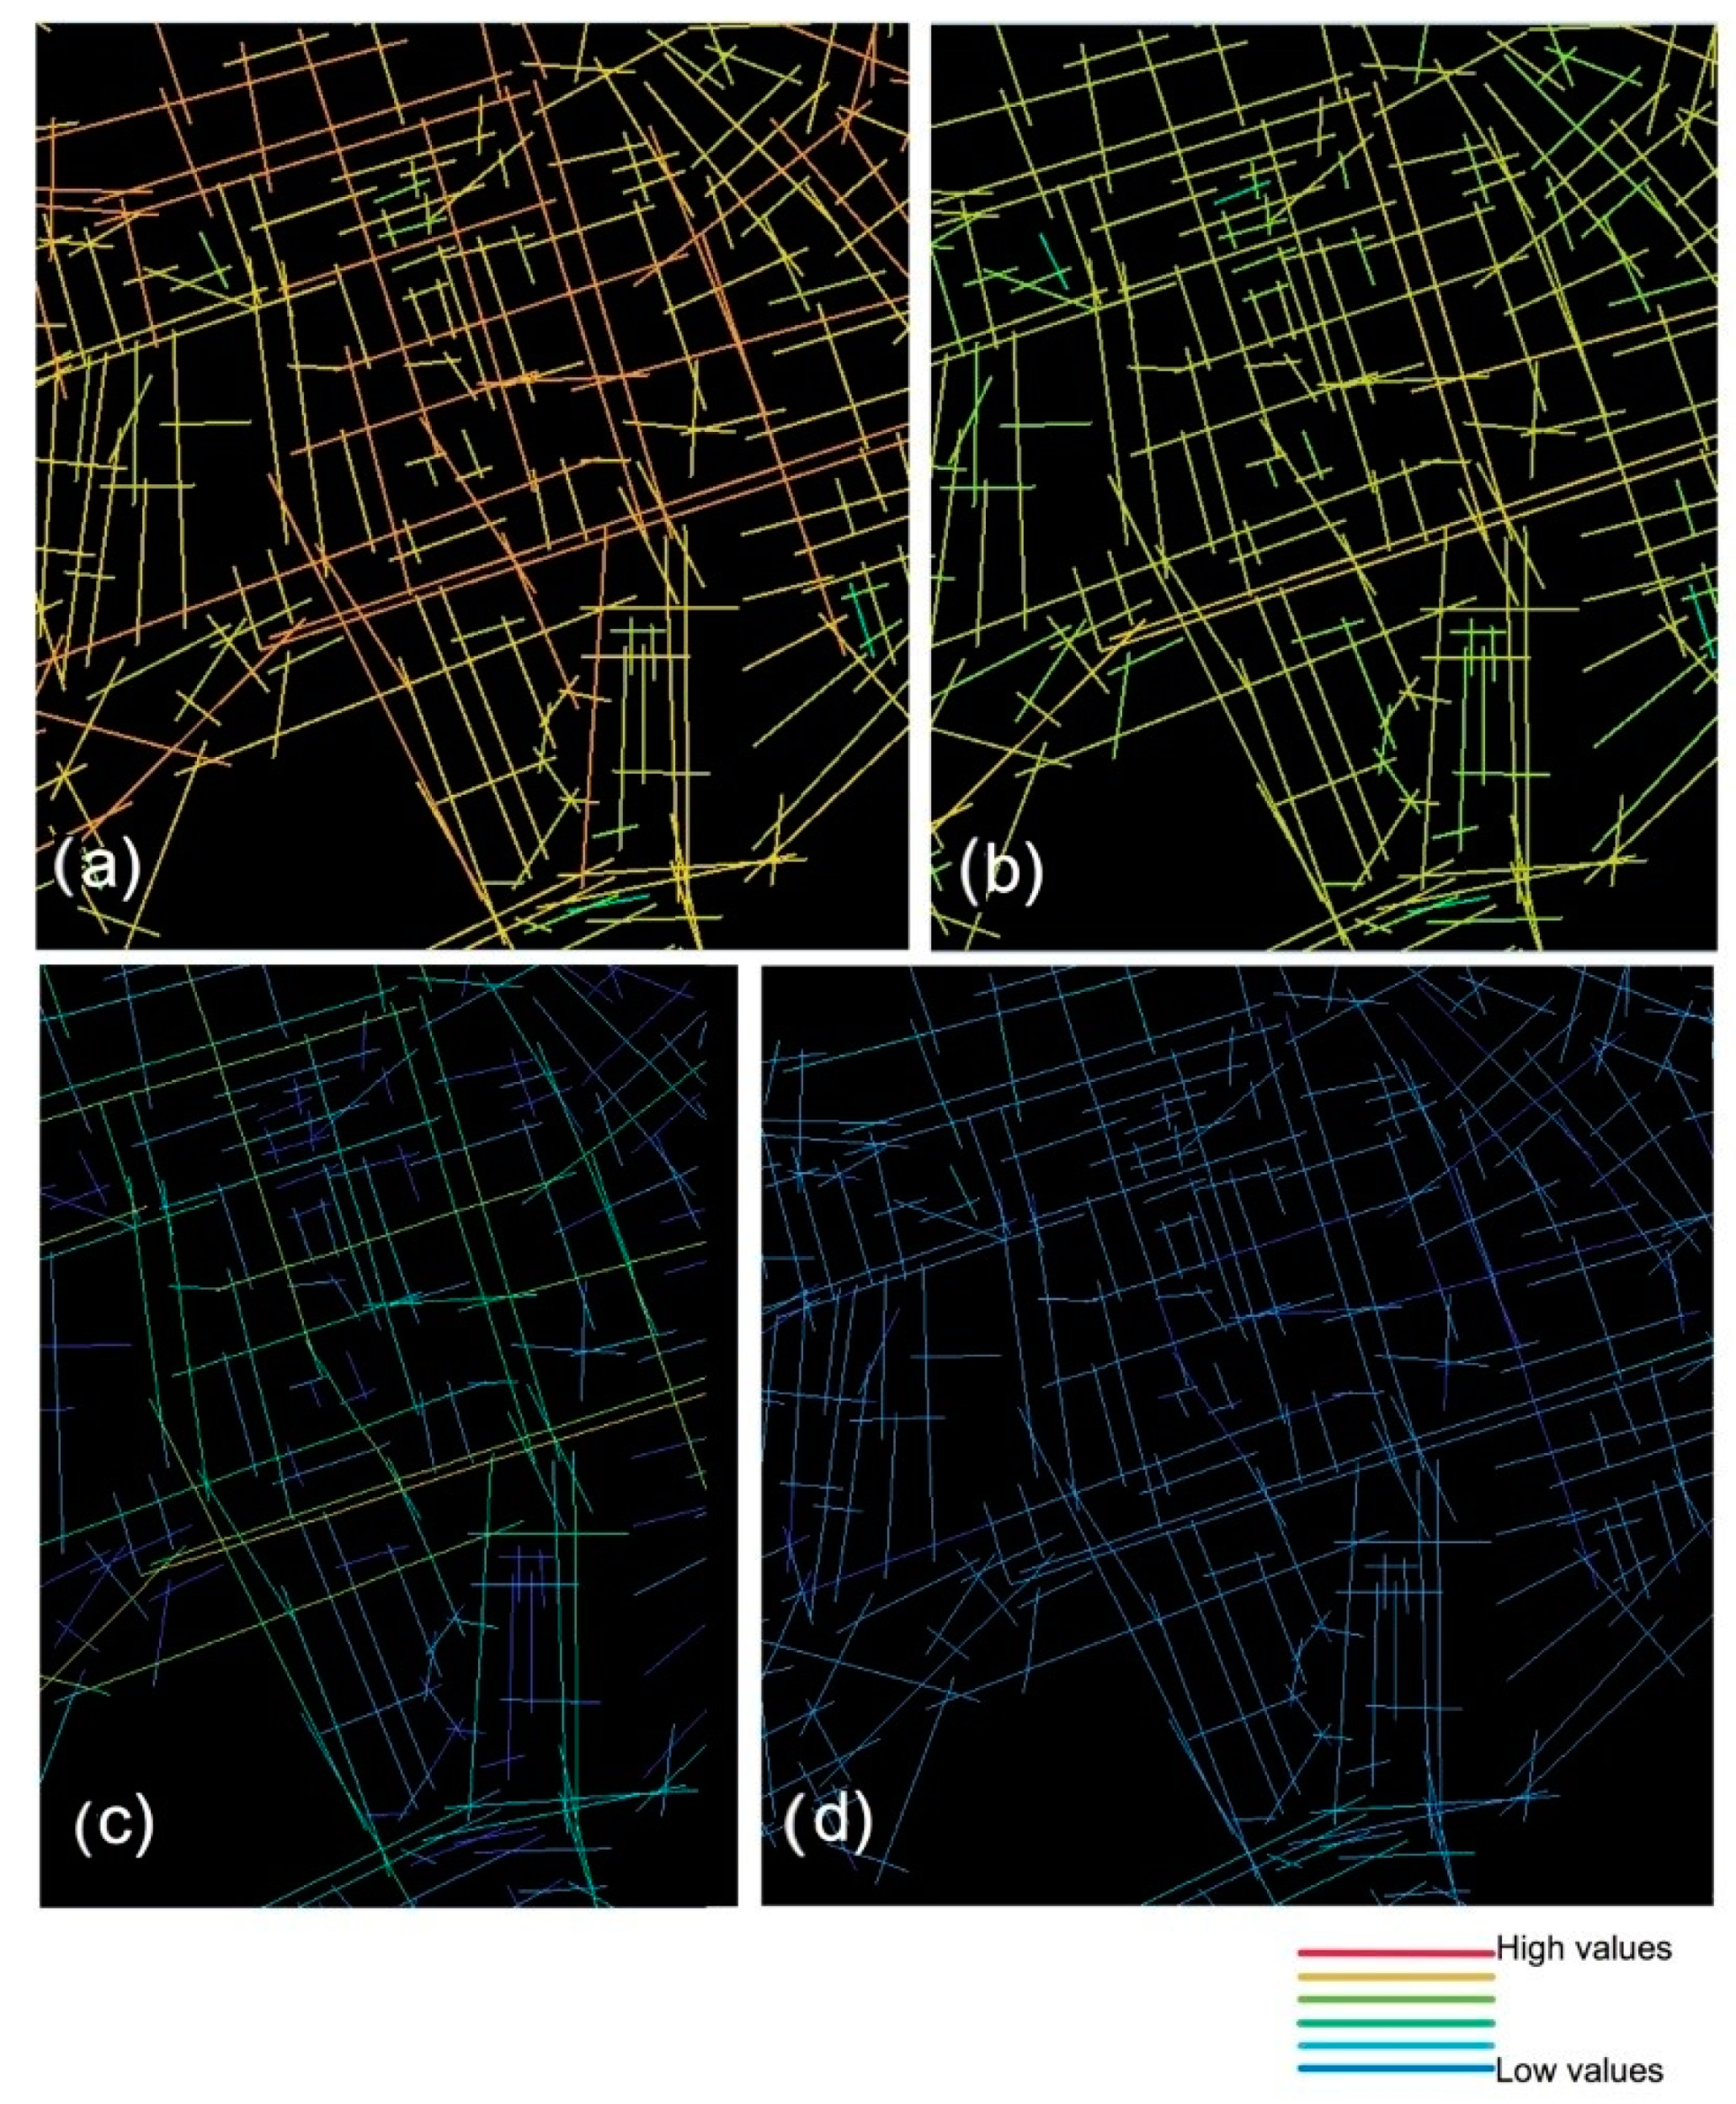
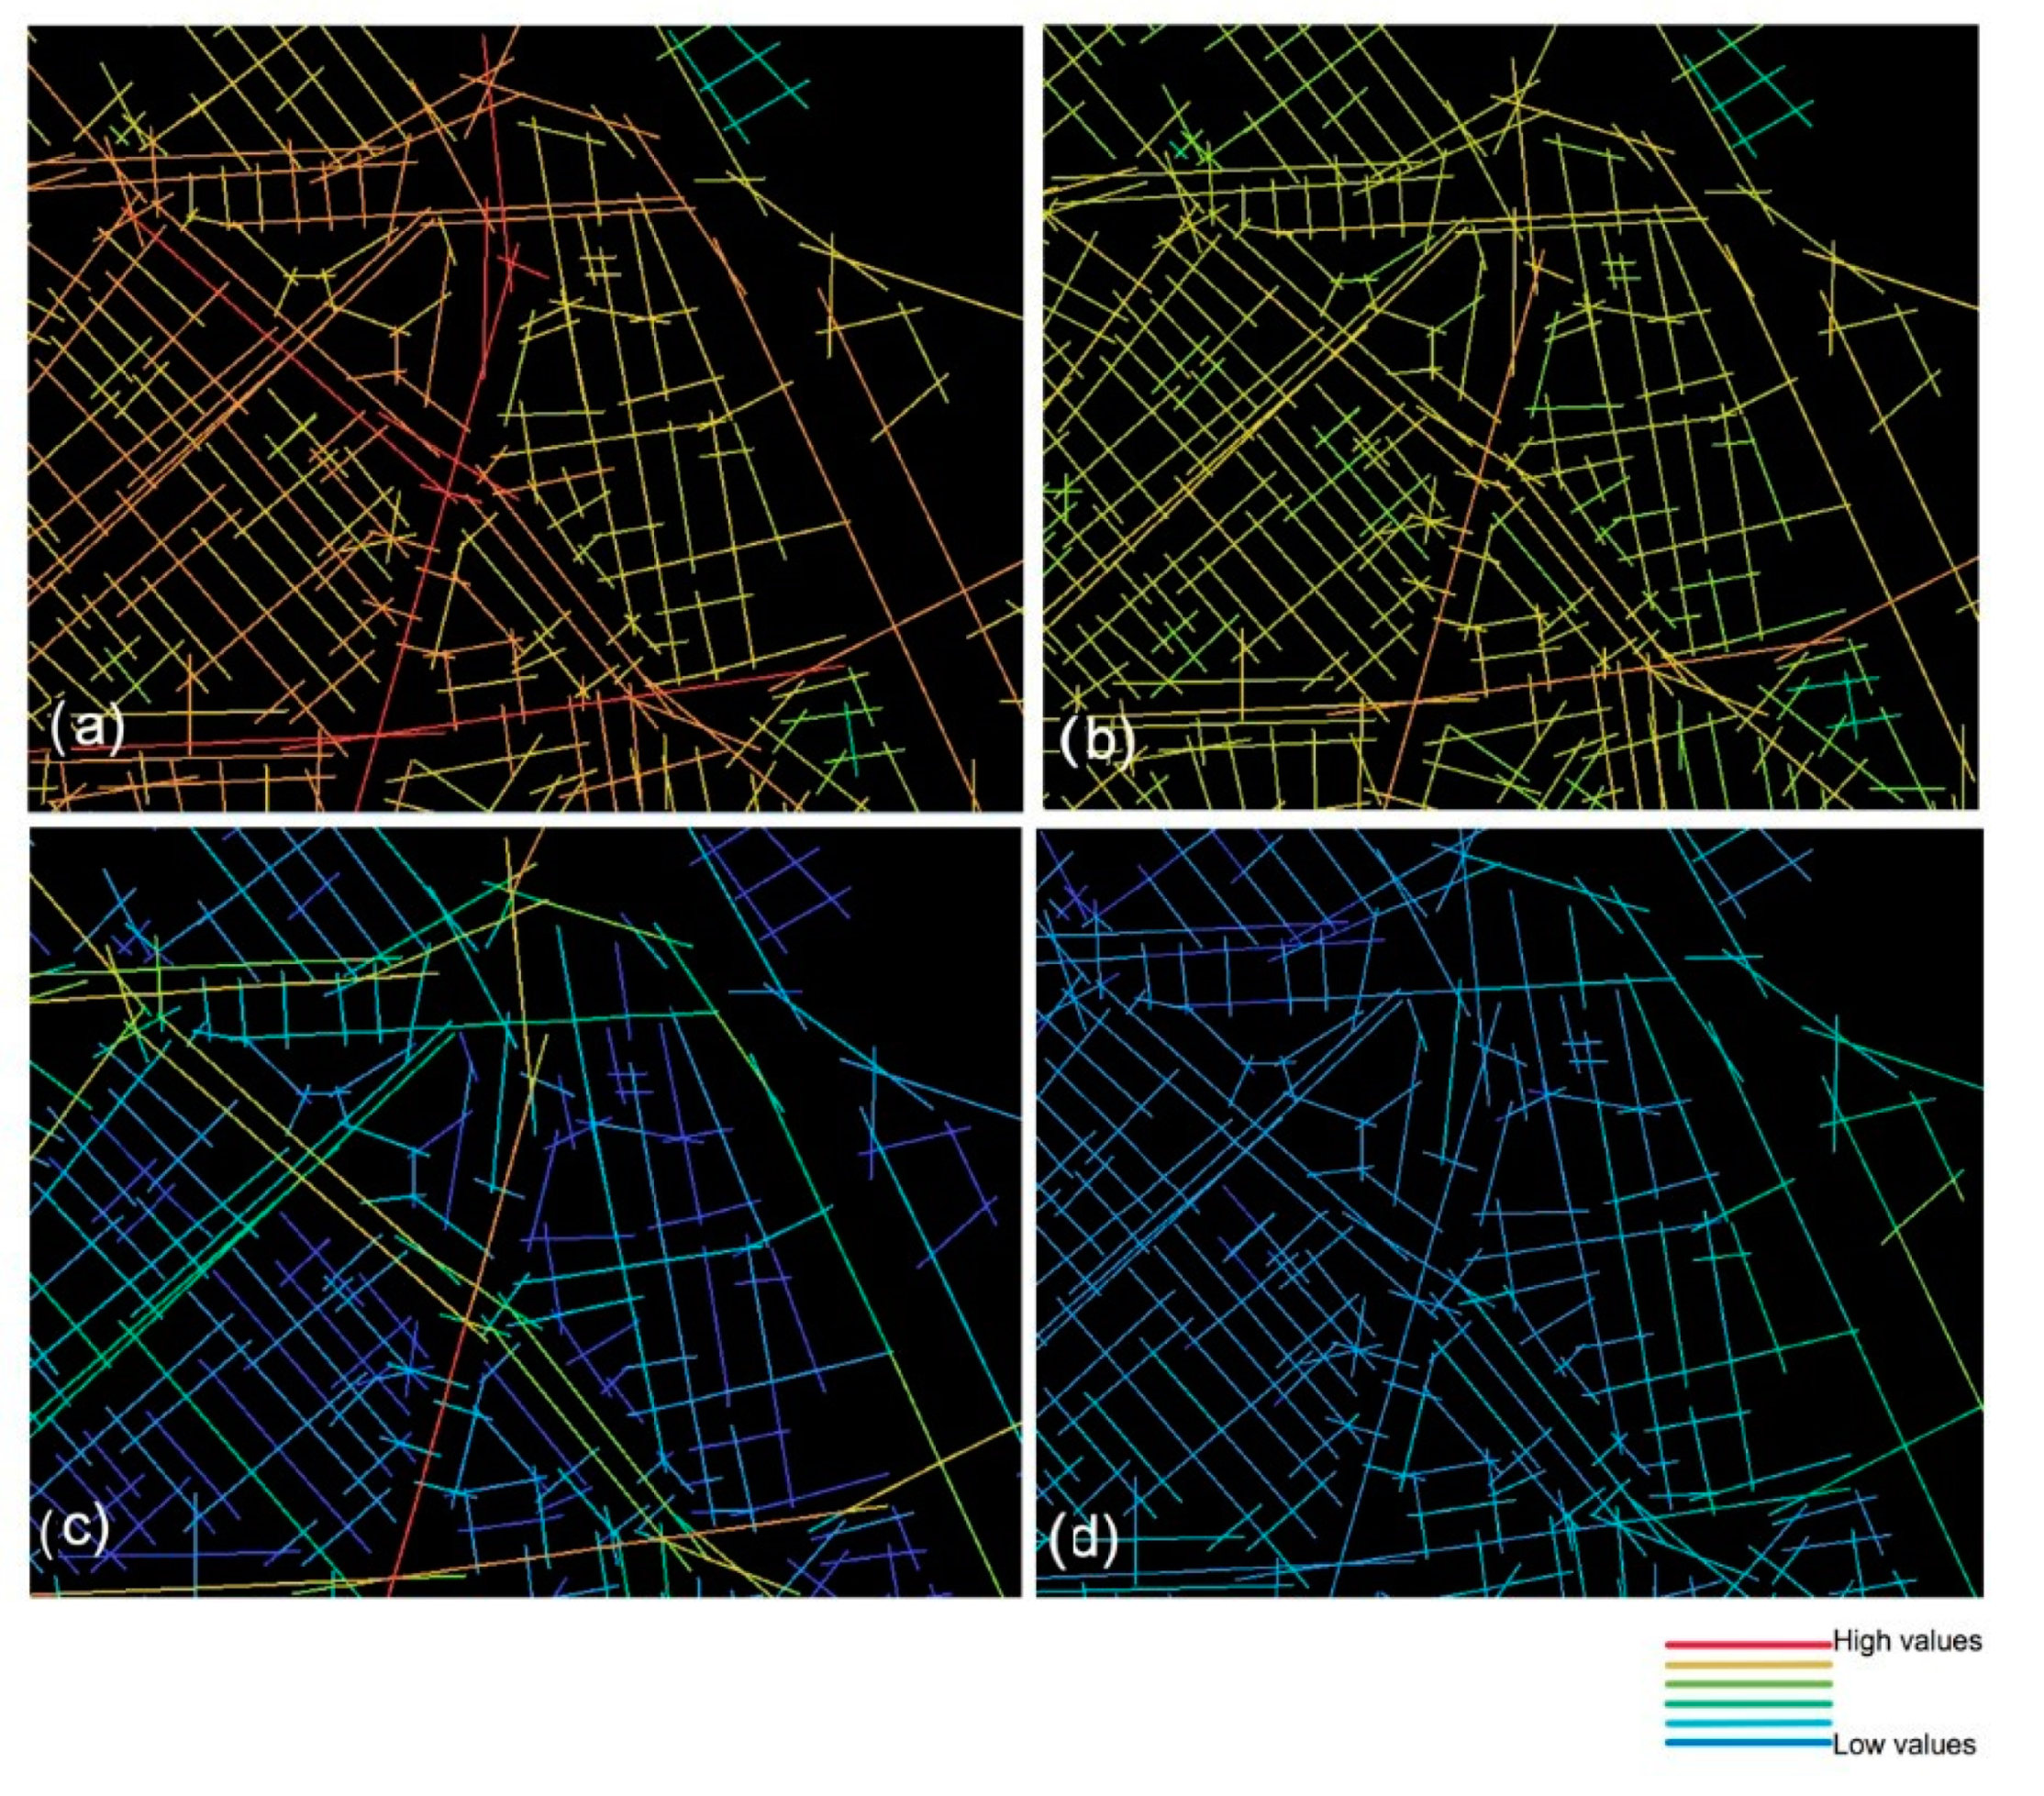
Figure 3 presents the local (a) and global (b) spatial integration analysis of Cool’s street network on top and the local (c) and global (d) angular analysis below. All maps are analyzed with the space syntax software Depthmap. This software is able to calculate how spatially integrated every street segment is in terms of the total number of direction changes and angular deviation to all others. The lines with red and orange colors show the most spatially integrated streets, whereas lines in blue colors show the most spatially segregated streets. The two images on the top panel in Figure 3 show only the spatial analyses with direction changes, whereas the two images in the bottom panel show degrees of angular integration with a low (500 m) and a high (5000 m) metrical radius. The main shopping area is globally and locally integrated. The angular analysis with a low metrical radius predicts higher to-movement to some of the local shopping streets, while the angular analysis with a high metrical radius rightfully predicts higher levels of through-movement. Most of Cool’s main roads tangent or go around its shopping center. The least locally integrated streets have few entrances constituting the street.
On a weekday, the city center is empty before 9 a.m. The peak flows of people occur in the afternoon, from 1–5 p.m. Shops close at around 6 p.m., and by 7 p.m. the streets are nearly deserted, with the exception of streets with nightlife. Shoppers from the whole city and region are frequent mostly in the neighborhood’s northern part.
Witte de With Street has varied types of shops, but also attracts people with its bars and restaurants. There is little movement in the morning, some movement during noon, and the peak happens after working hours, when all tables on the sidewalks are full and streets are crowded. The surrounding residential area has little movement at any time of the day. It has one playground but with no shops. Children occupy the playground in the morning and afternoon, and sportive young men (aged 15–30) occupy it in the evening.
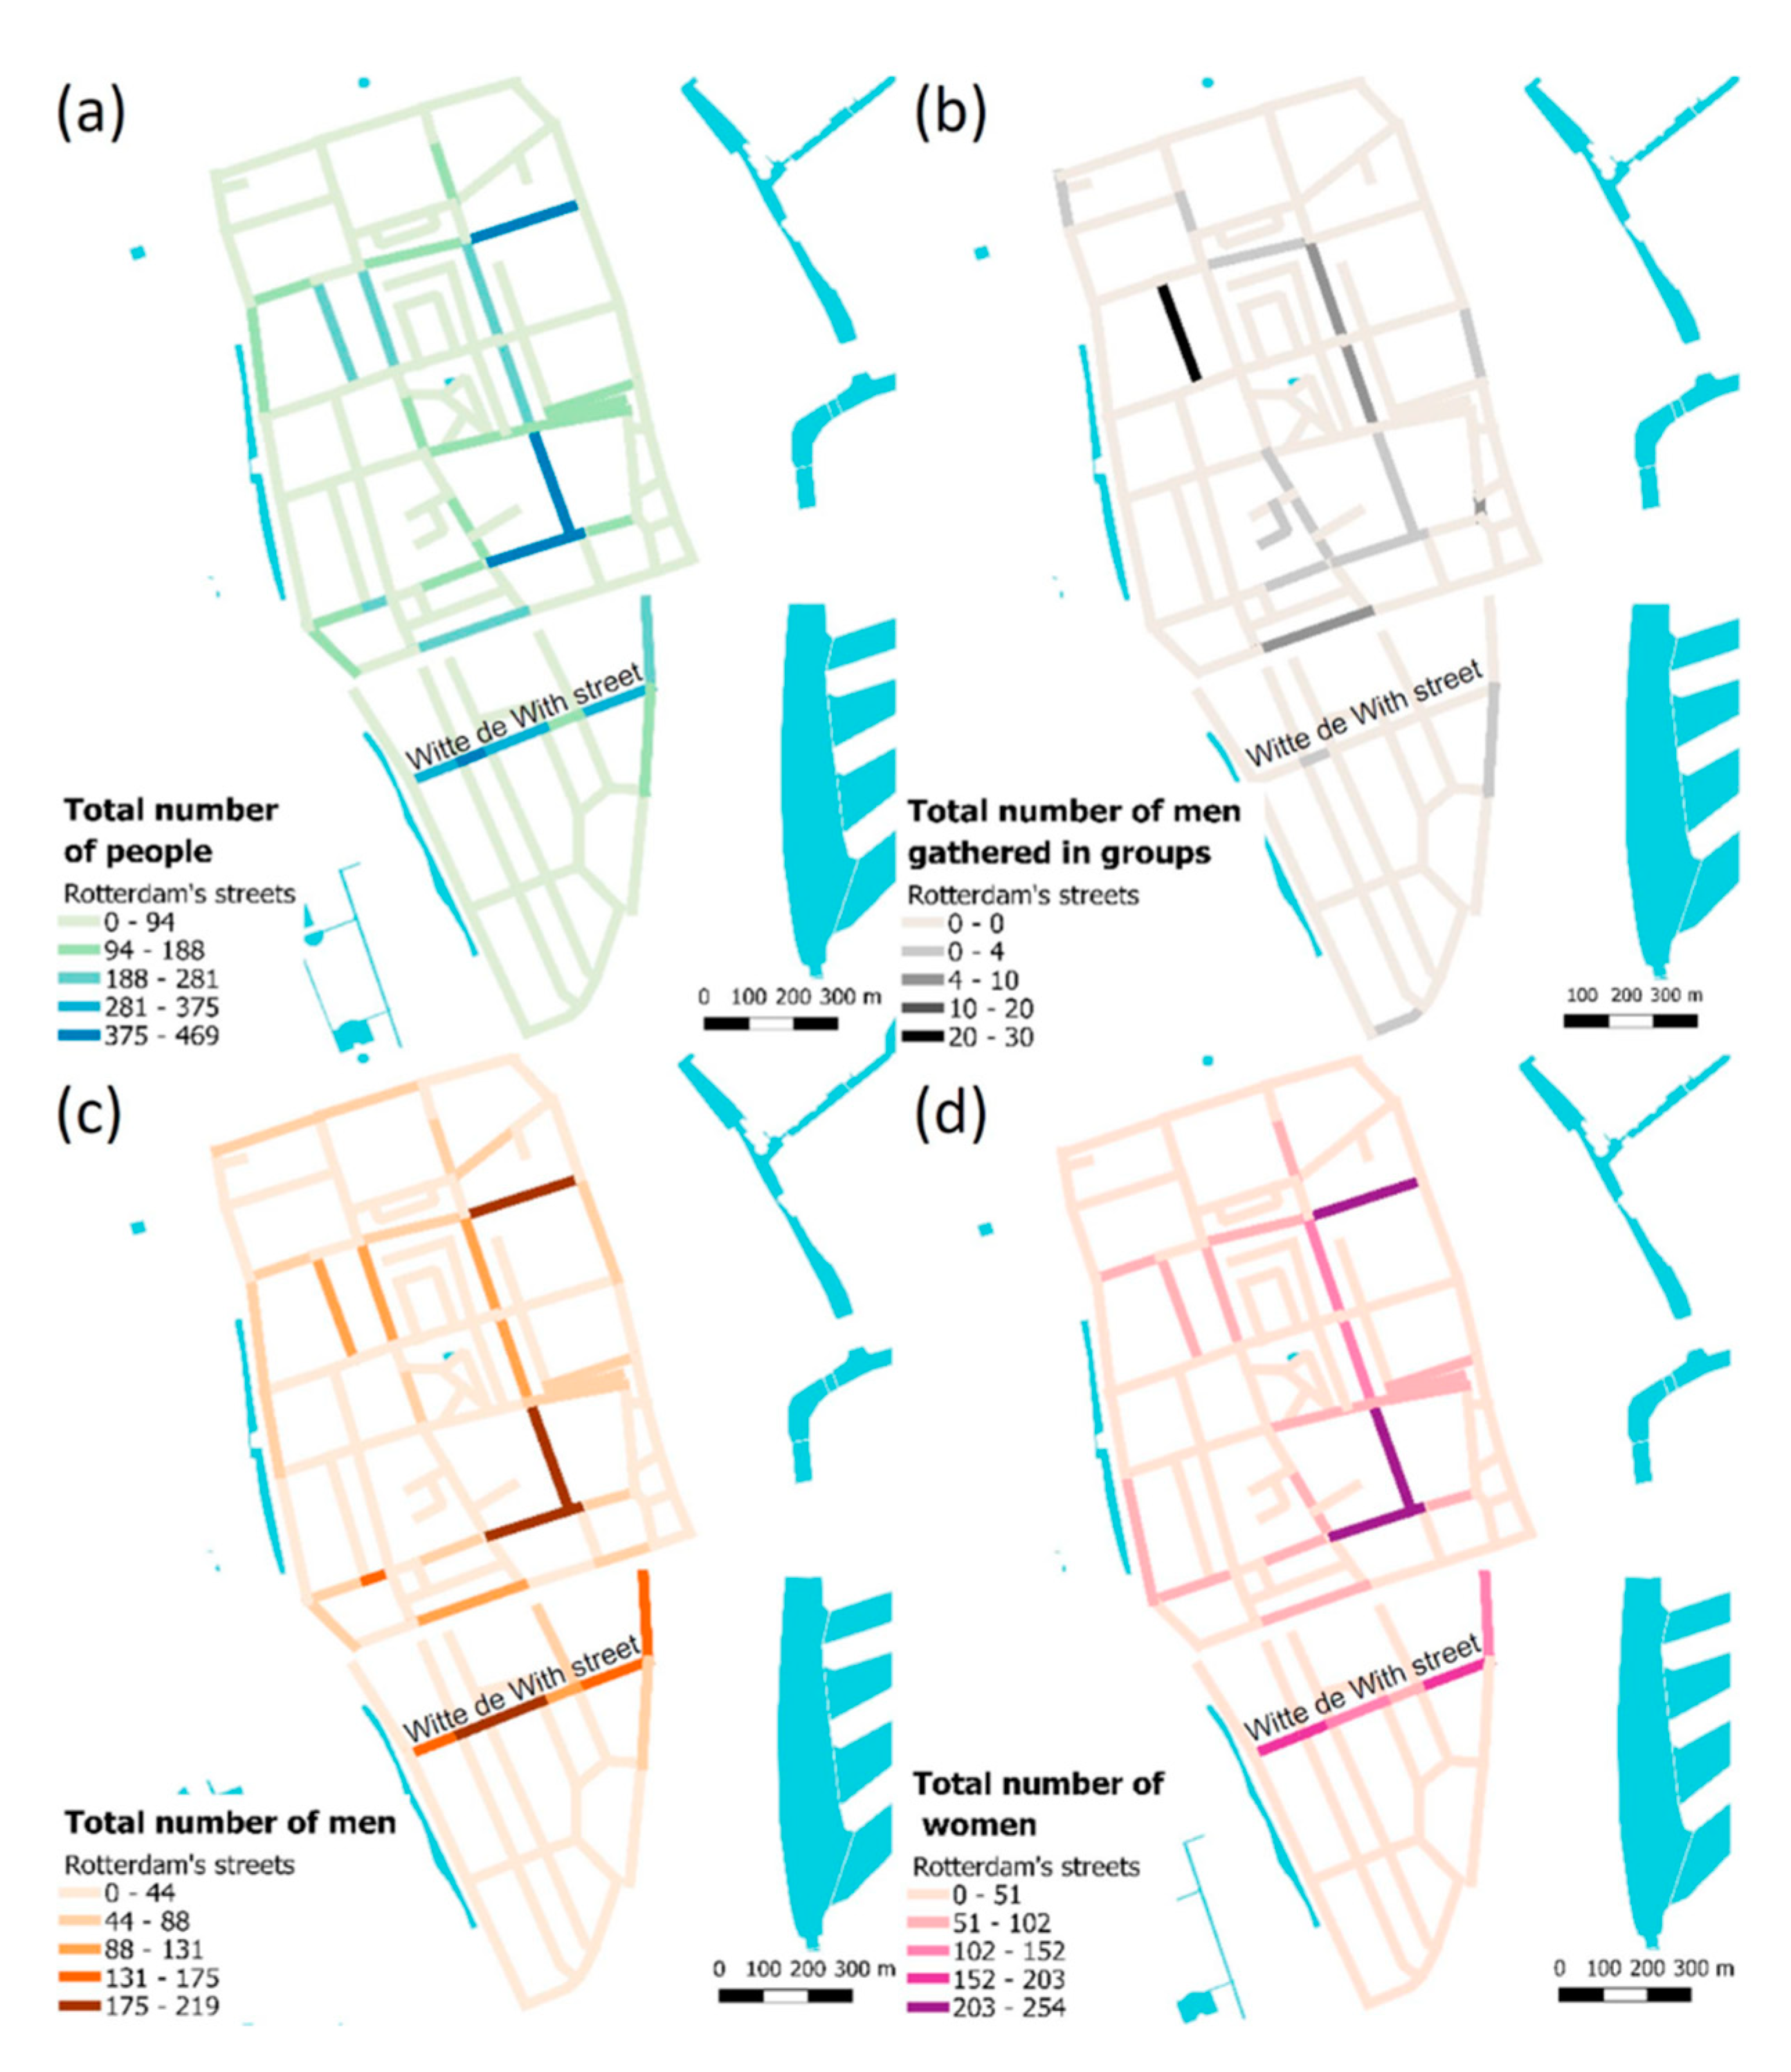
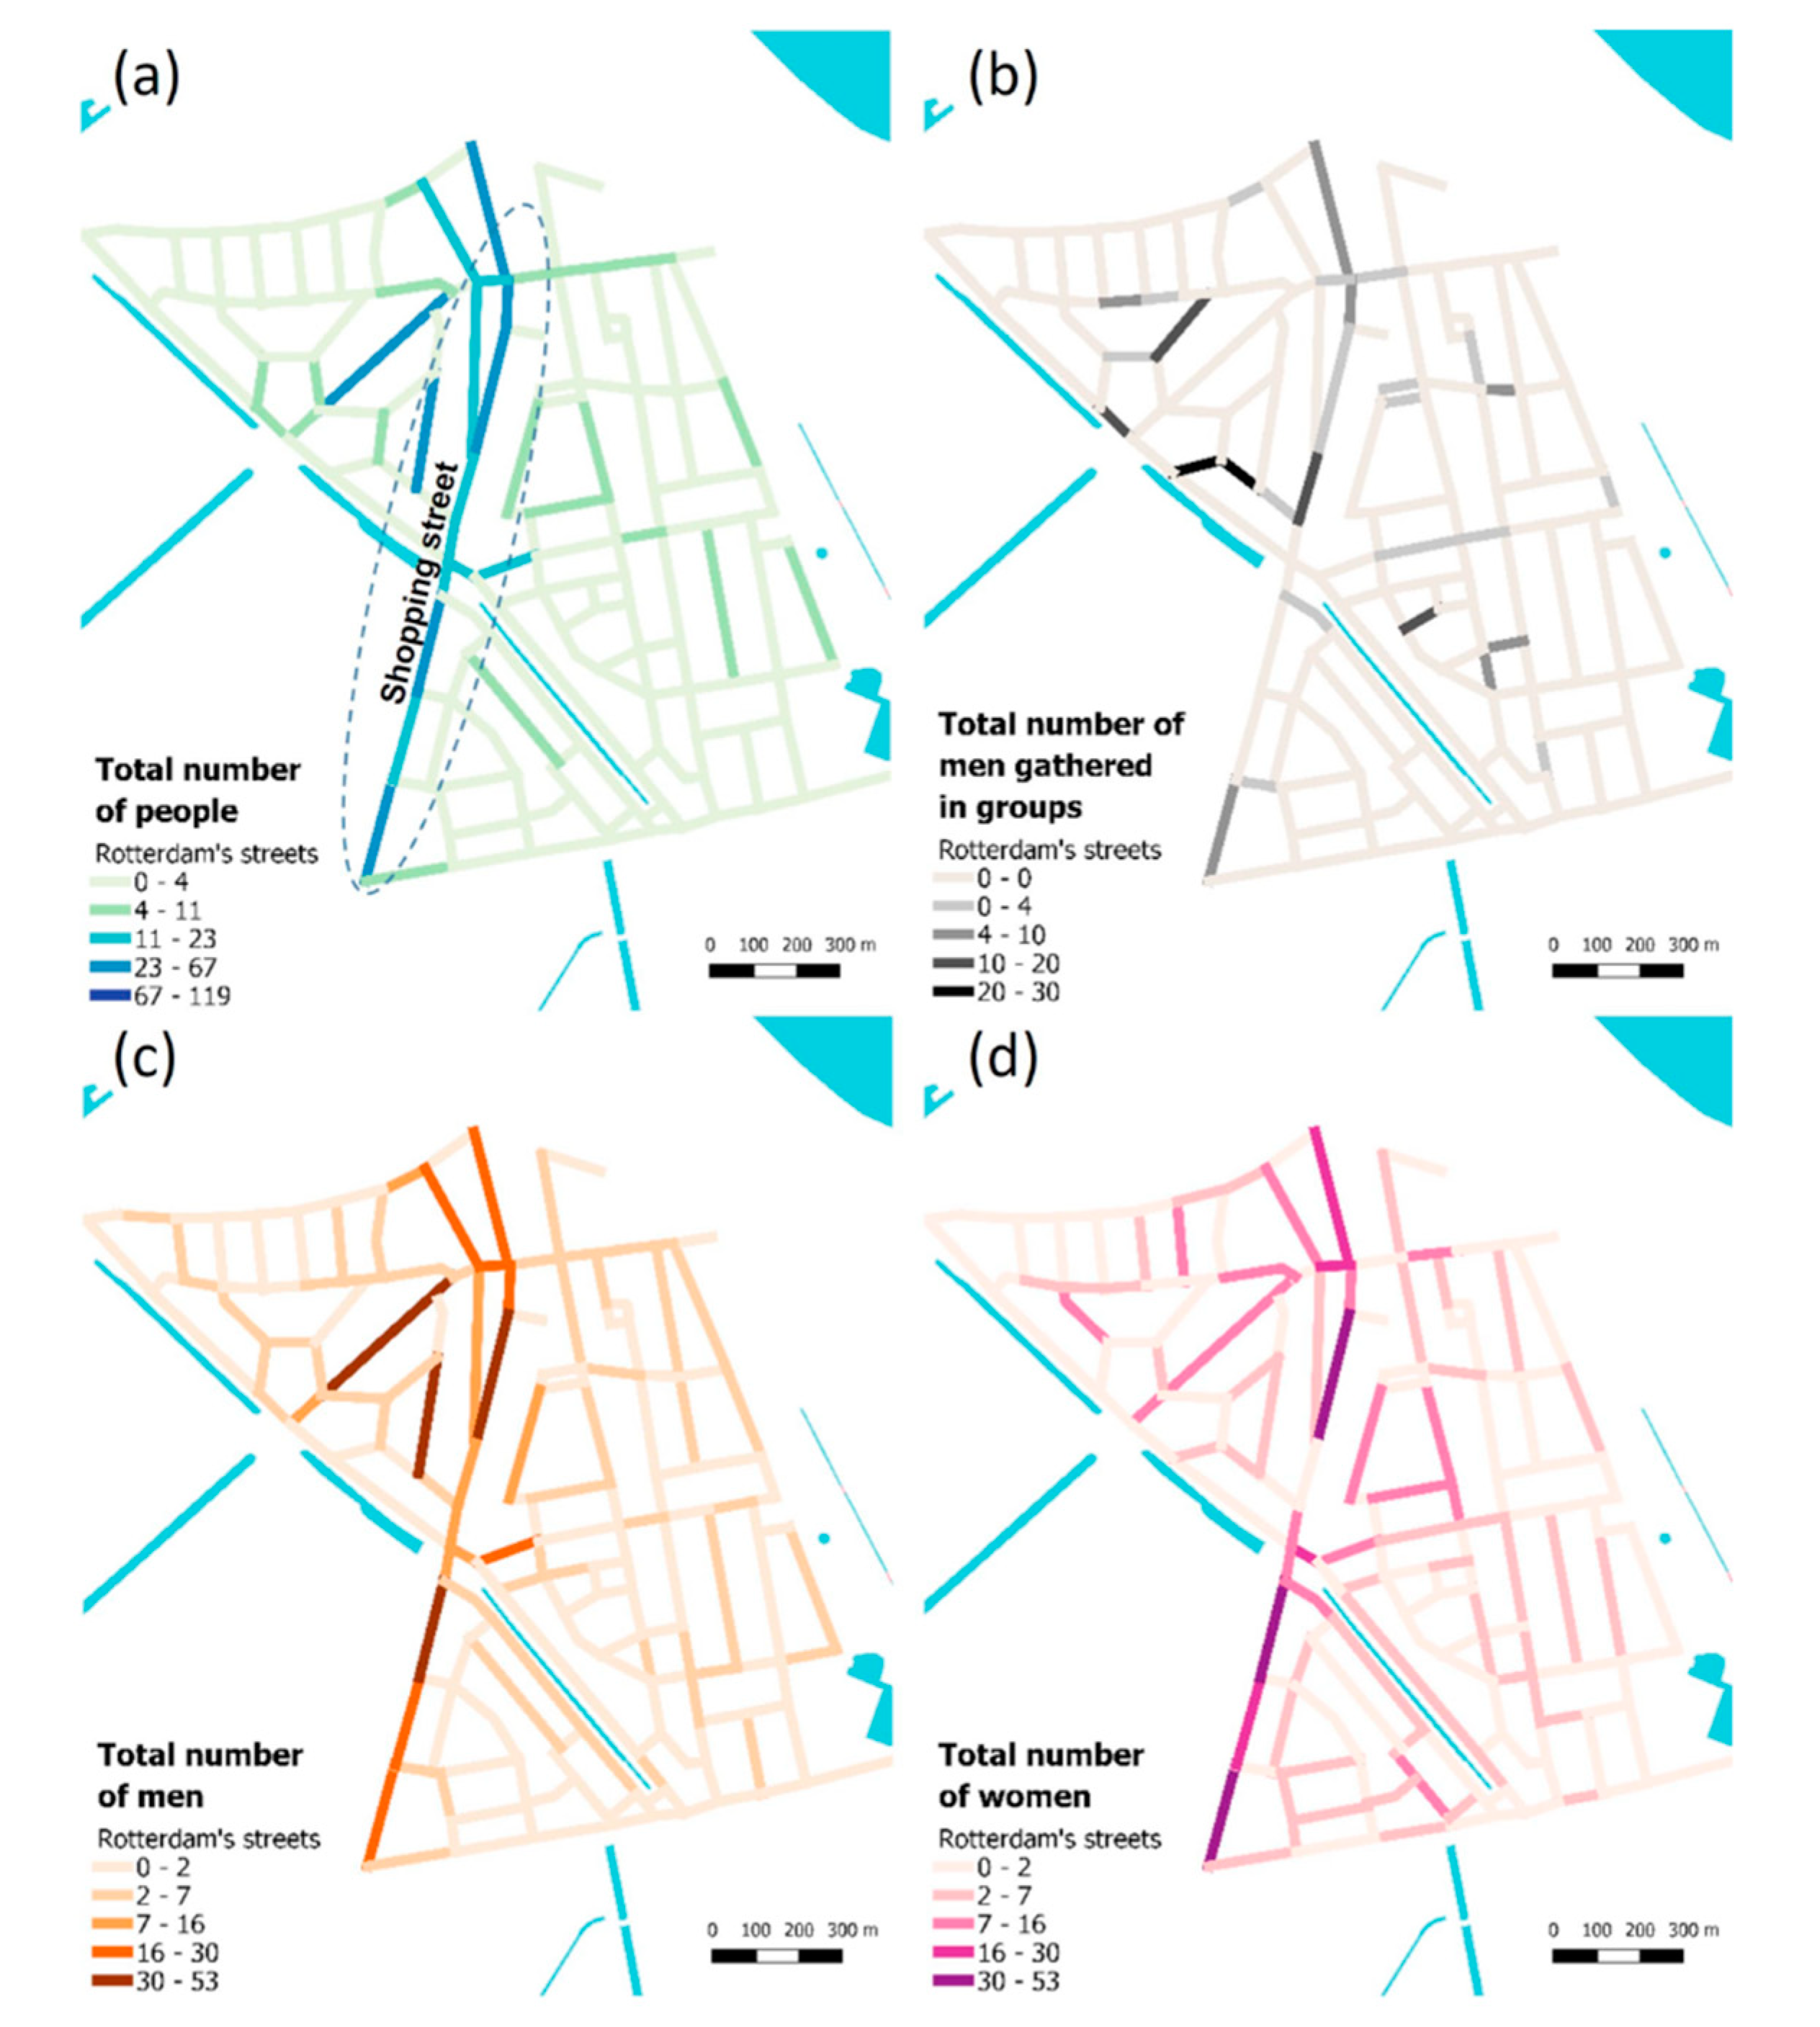
The number of people on streets changes considerably from low numbers on Monday to high numbers on Thursday. The reason is that many shops are closed on Mondays, and many shops are open until 9 p.m. on Thursday evening. At night, when shops are closed, the number of women on the streets clearly decreases, especially on Monday. Women are the majority of people in Cool’s streets during business hours (10 a.m.–6 p.m., when shops are open), whereas men dominate the streets before and after shops’ opening hours. After business hours, women disappear from the streets, while men continue to be seen, mostly in bars and restaurants. In Figure 4, the total number of people for 24 h on an average weekday are presented for the neighborhood, including the total number of (young) men in groups, total men, and total women.
4.4. Nieuwe Westen—The Historical Neighborhood Next to the City Center
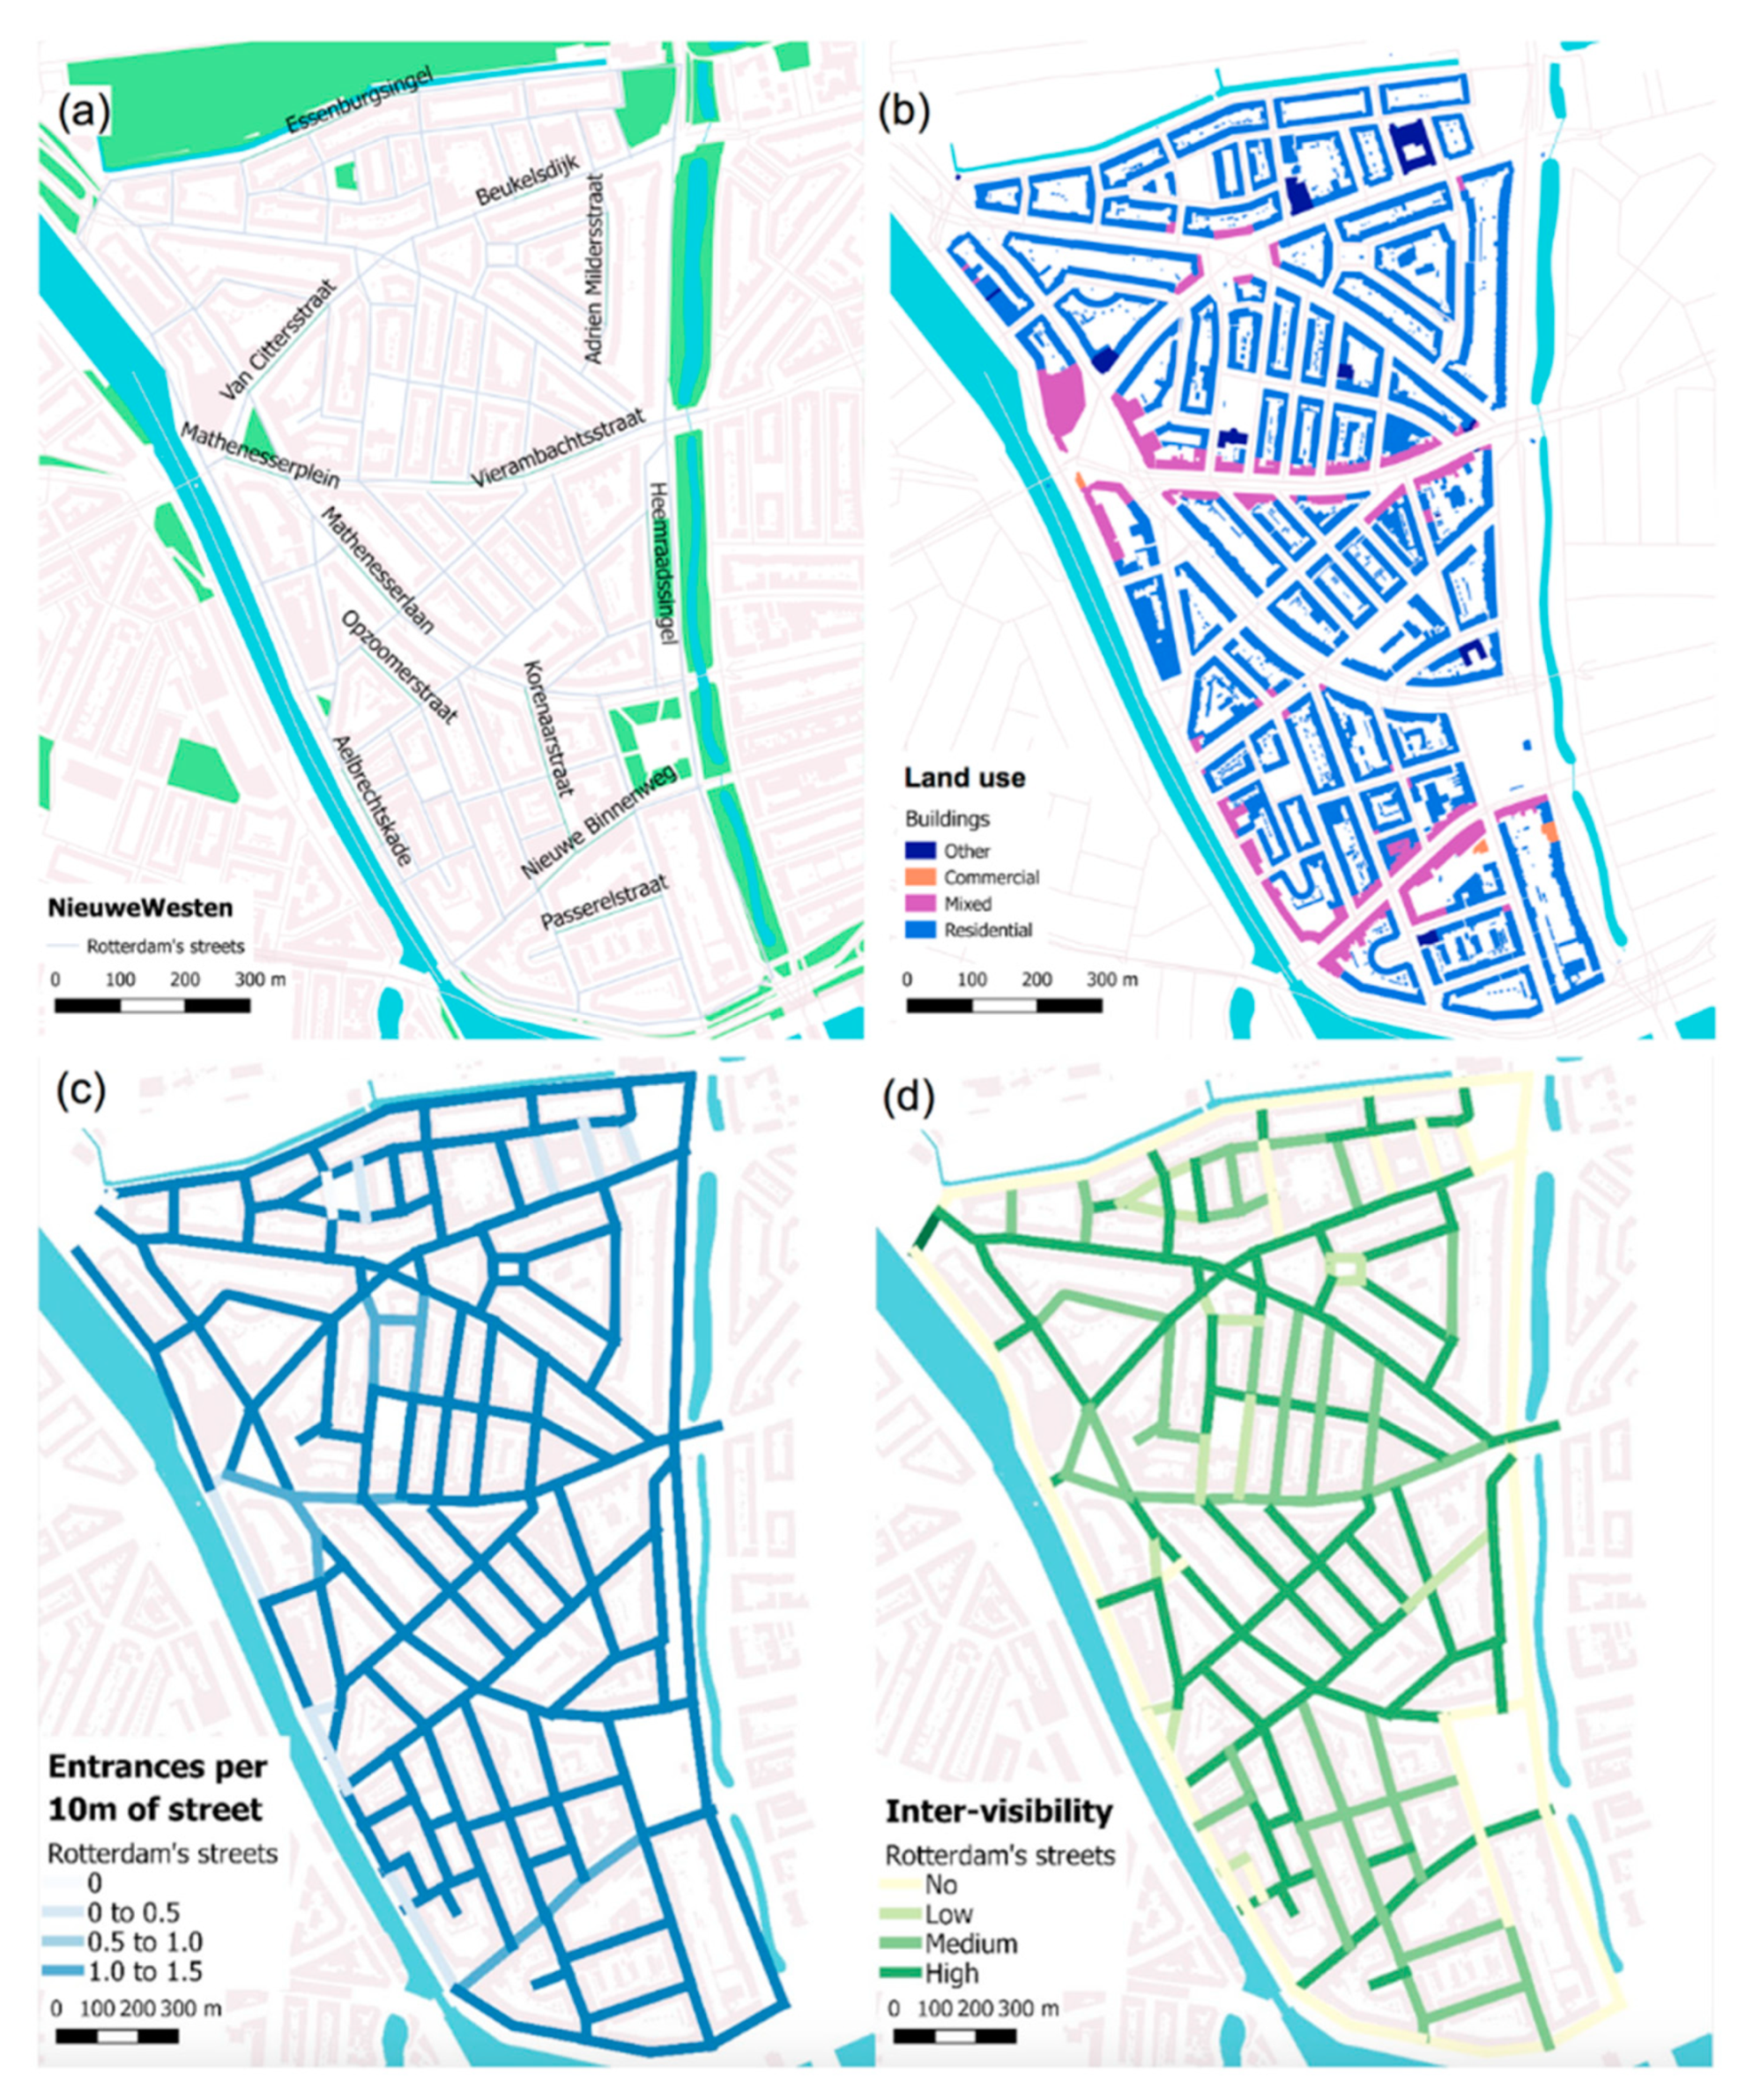
Nieuwe Westen is a mostly residential neighborhood, with 19,224 inhabitants. Its main shopping streets are Nieuwe Binnenweg and Vierambachstraat. All businesses are located in mixed-use buildings with residences on the top floor(s), as shown in Figure 5b. Most of the neighborhood’s streets have a high density of entrances, which also ensures good inter-visibility. The exceptions are on the neighborhood’s borders, due to the canals and wide streets.
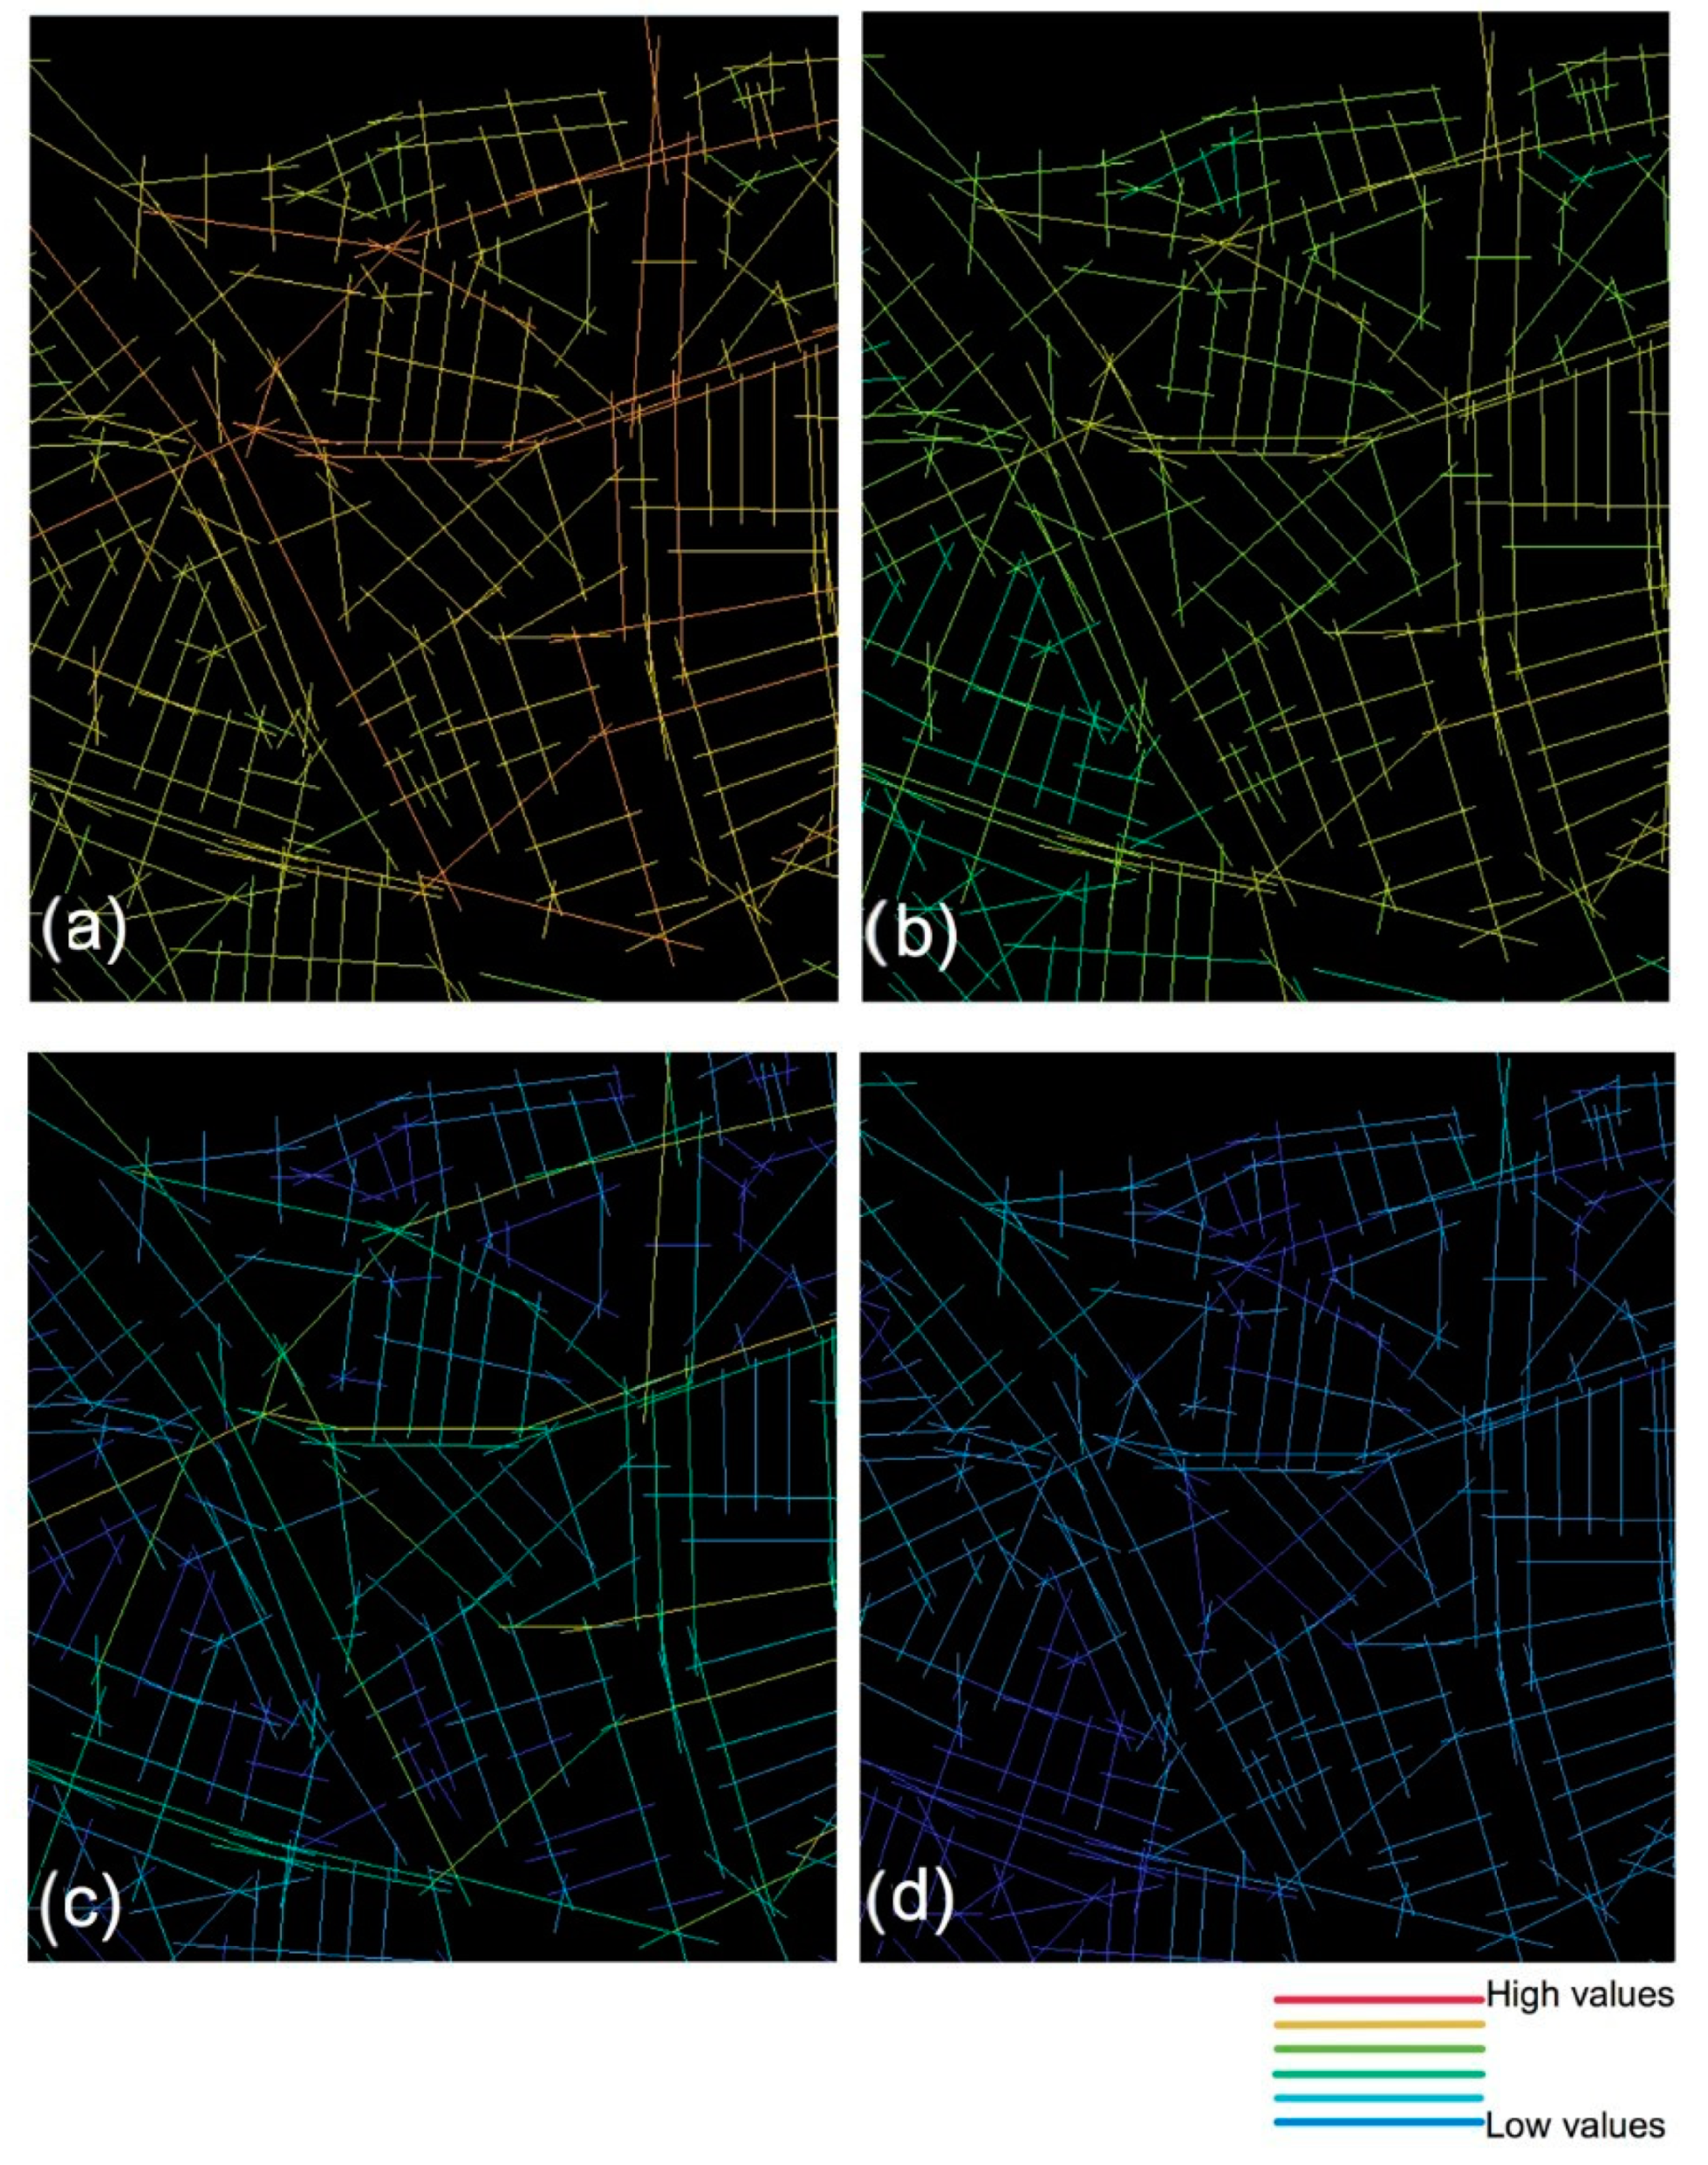
Similarly to Cool, the Space Syntax analyses show that the commercial streets have both high local and global integration values in the neighborhood (Figure 6a,b). The main routes with the highest through-movement potentials are the streets Aelbrechtskade and Nieuwe Binnenweg, which are highlighted in yellow and light green in Figure 6c.
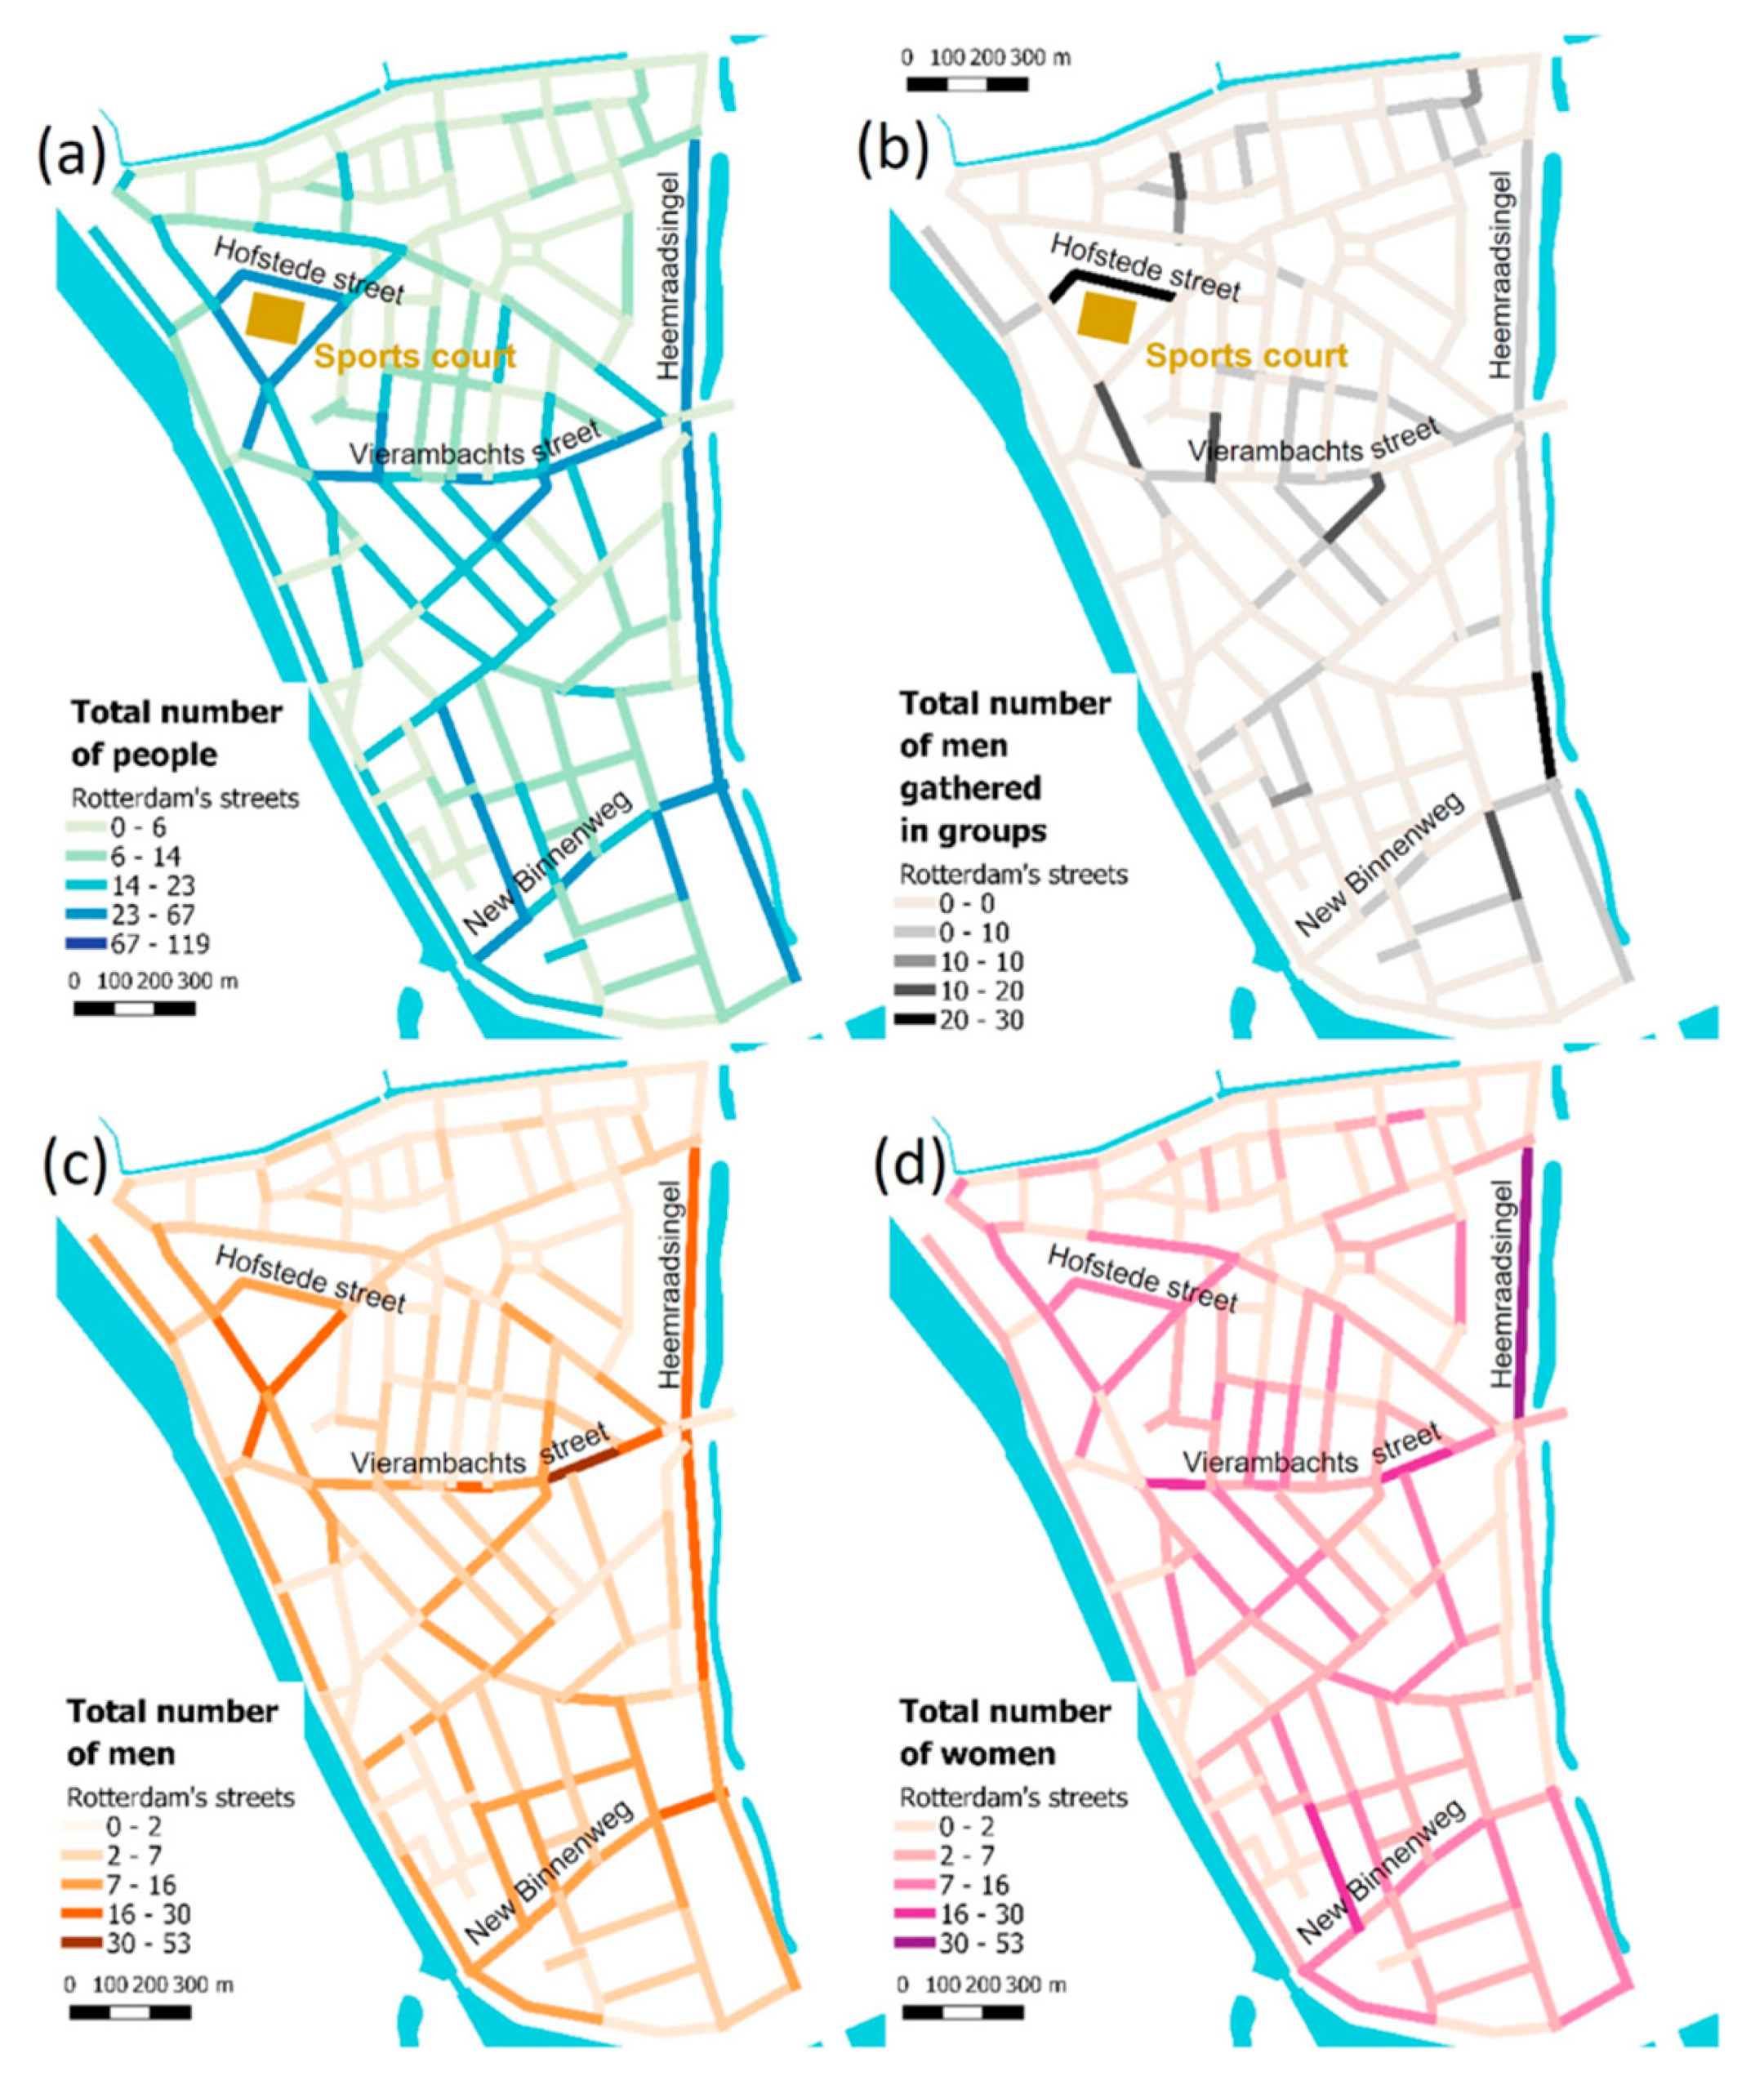
Movement in the neighborhood is very low compared to Cool, even in the busiest streets. On a weekday, most people can be seen in the commercial areas. Eventually, groups gather to play in the sports court in Hofstedestraat and Heemradsingel (Figure 7, top right). Few activities take place in the rest of the neighborhood’s streets.
4.5. Hillesluis—A Historic Neighborhood with an Old Shopping Street
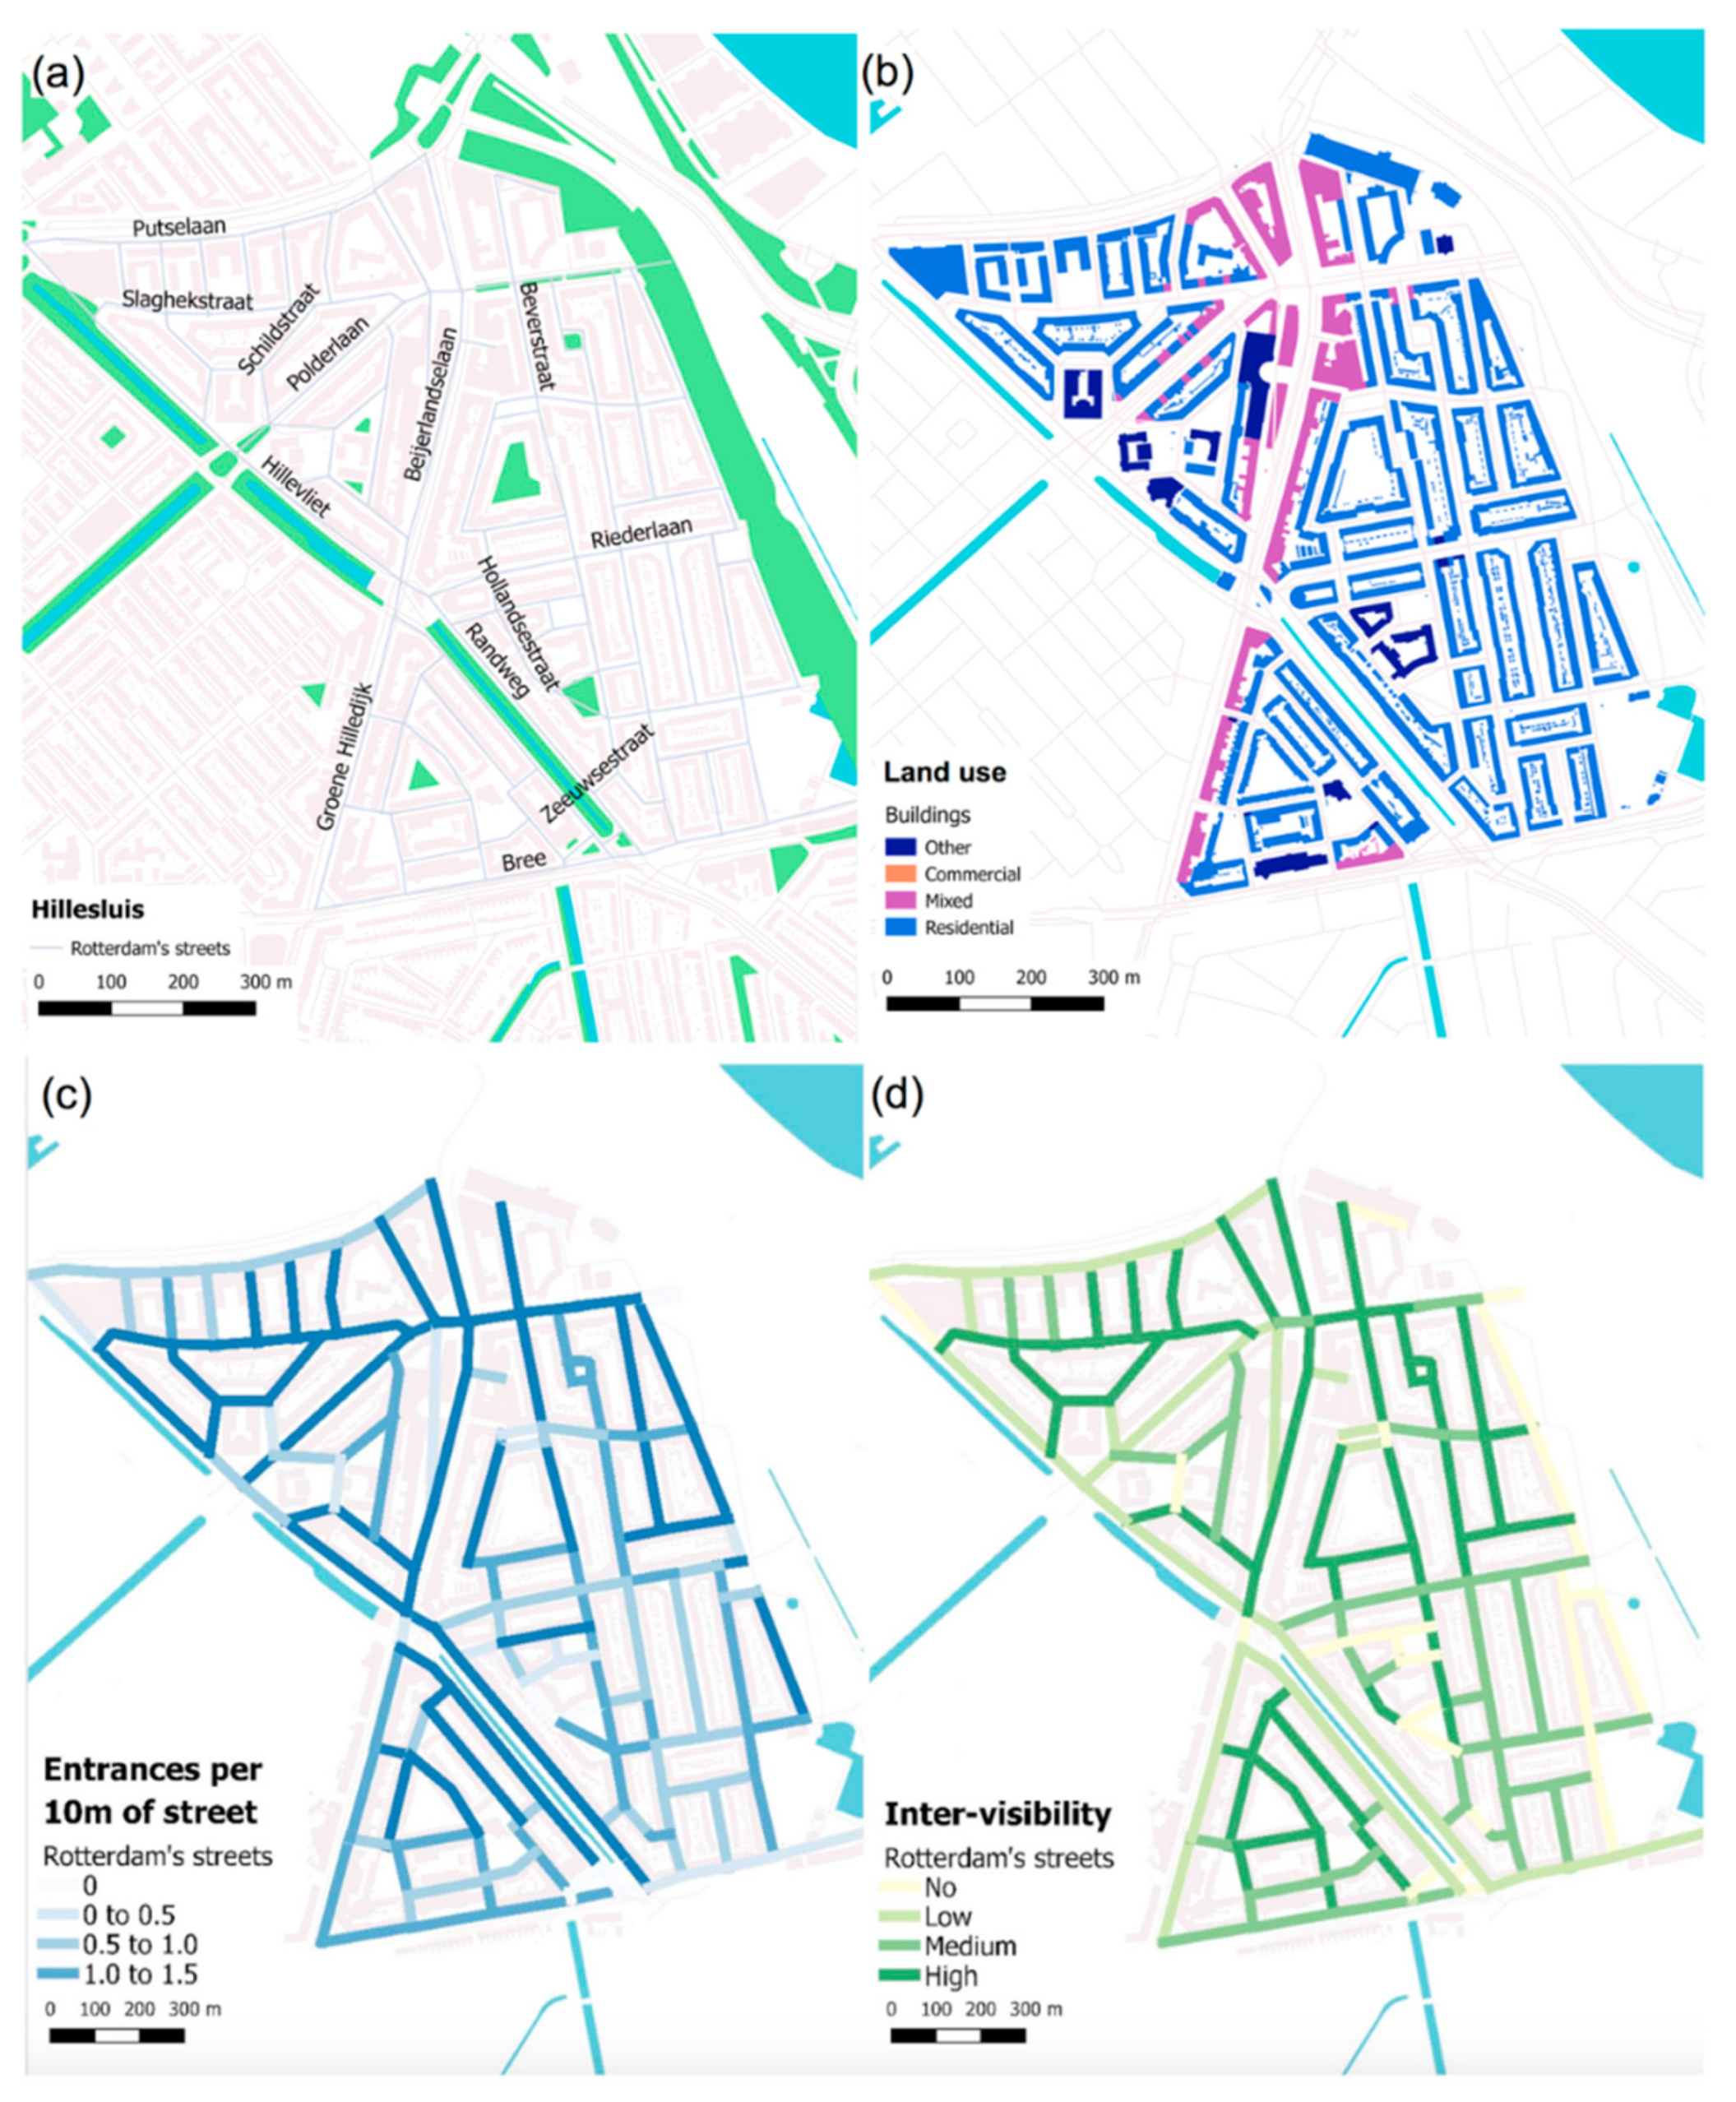
Hillesluis is mainly a residential area, with 11,863 inhabitants. Figure 8 shows a map of Hillesluis with the location of land uses, entrance density and entrance inter-visibility. The businesses are located in mixed buildings with dwellings on top. Streets along canals or parks have reduced visibility from adjacent buildings, even with the high density of entrances. In other cases, wide streets, dense vegetation, and other obstacles to vision explain the discrepancy between the number of entrances and the inter-visibility.
Hillesluis’ shopping streets are located along the highest locally integrated streets (Figure 9). Moreover, the lively and vibrant Groene Hilledijk shopping street has both high local (a) and global (b) spatial integration values, and high values on the angular analyses with a low metrical radius (c).
On a weekday, few people are present on the streets in Hillesluis (Figure 10). The largest number of pedestrians are found in the shopping streets, which are recorded as mixed use in Figure 8b with shops on ground floor level and dwellings from the first floor and above. Women are found mostly in these shopping streets or at bus stops. Elsewhere, even on streets with only commercial use, the presence of people is scarce, and men dominate the spaces. Examples are male shop owners, clients on sidewalk tables, or standing men watching over the street (in what could perhaps be described as Oscar Newman’s feeling of responsibility over the space, but the result is a feeling of hostility rather than safety).
4.6. Pendrecht—The Post-War Thoroughly Planned Neighborhood
Pendrecht is a suburban residential neighborhood, with 11,655 inhabitants. Compared with the other neighborhoods, Pendrecht’s buildings’ entrances are facing lawns and pedestrian walks, away from the streets themselves. There is a shopping area in the center of the neighborhood and some shops in Zijpe Street (on the north-west quadrant). Inter-visibility in the neighborhood (Figure 11) is reduced in most streets due to large distances between buildings, and because each building faces a different direction. The few streets with high entrance density have doors half a floor above the ground in semi-private corridors facing the communal lawns.
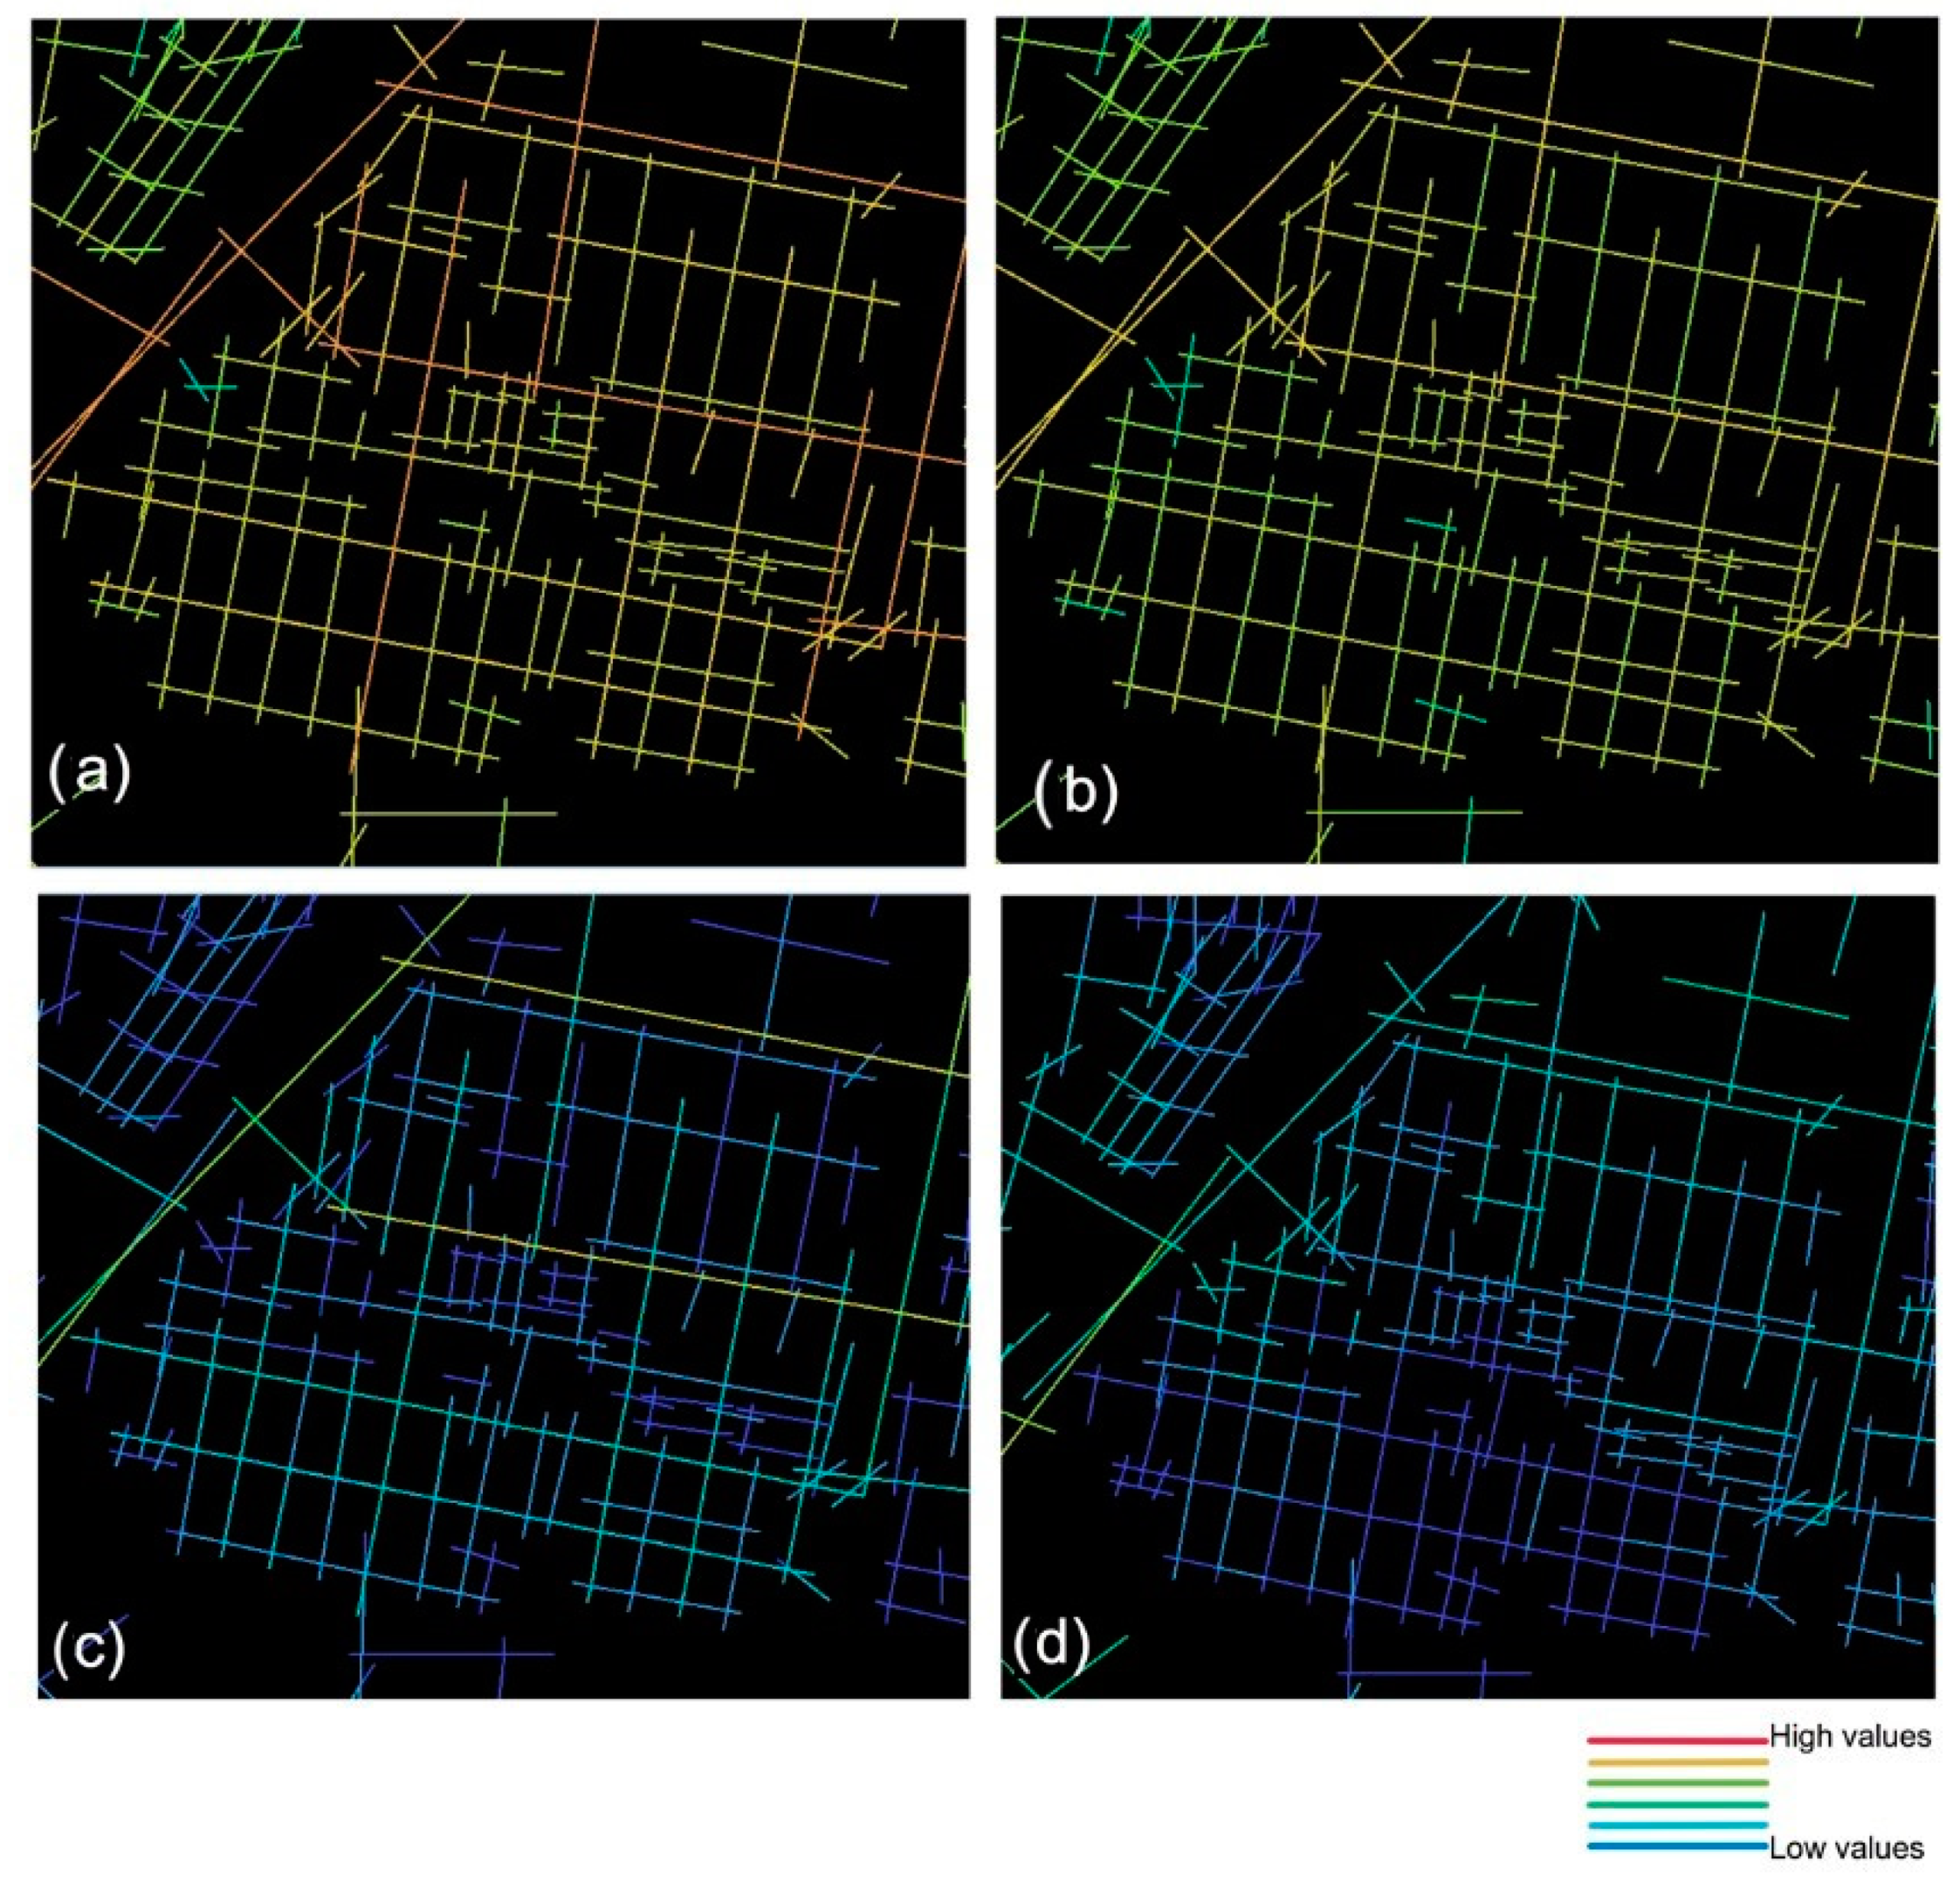
In the Space Syntax analyses, only the main route Slinge is slightly locally spatially integrated (Figure 12a,c). The shopping center Plein 1953 has low spatial integration values. The most integrated streets have an east–west direction, whereas the most constituted streets have a north–south direction.
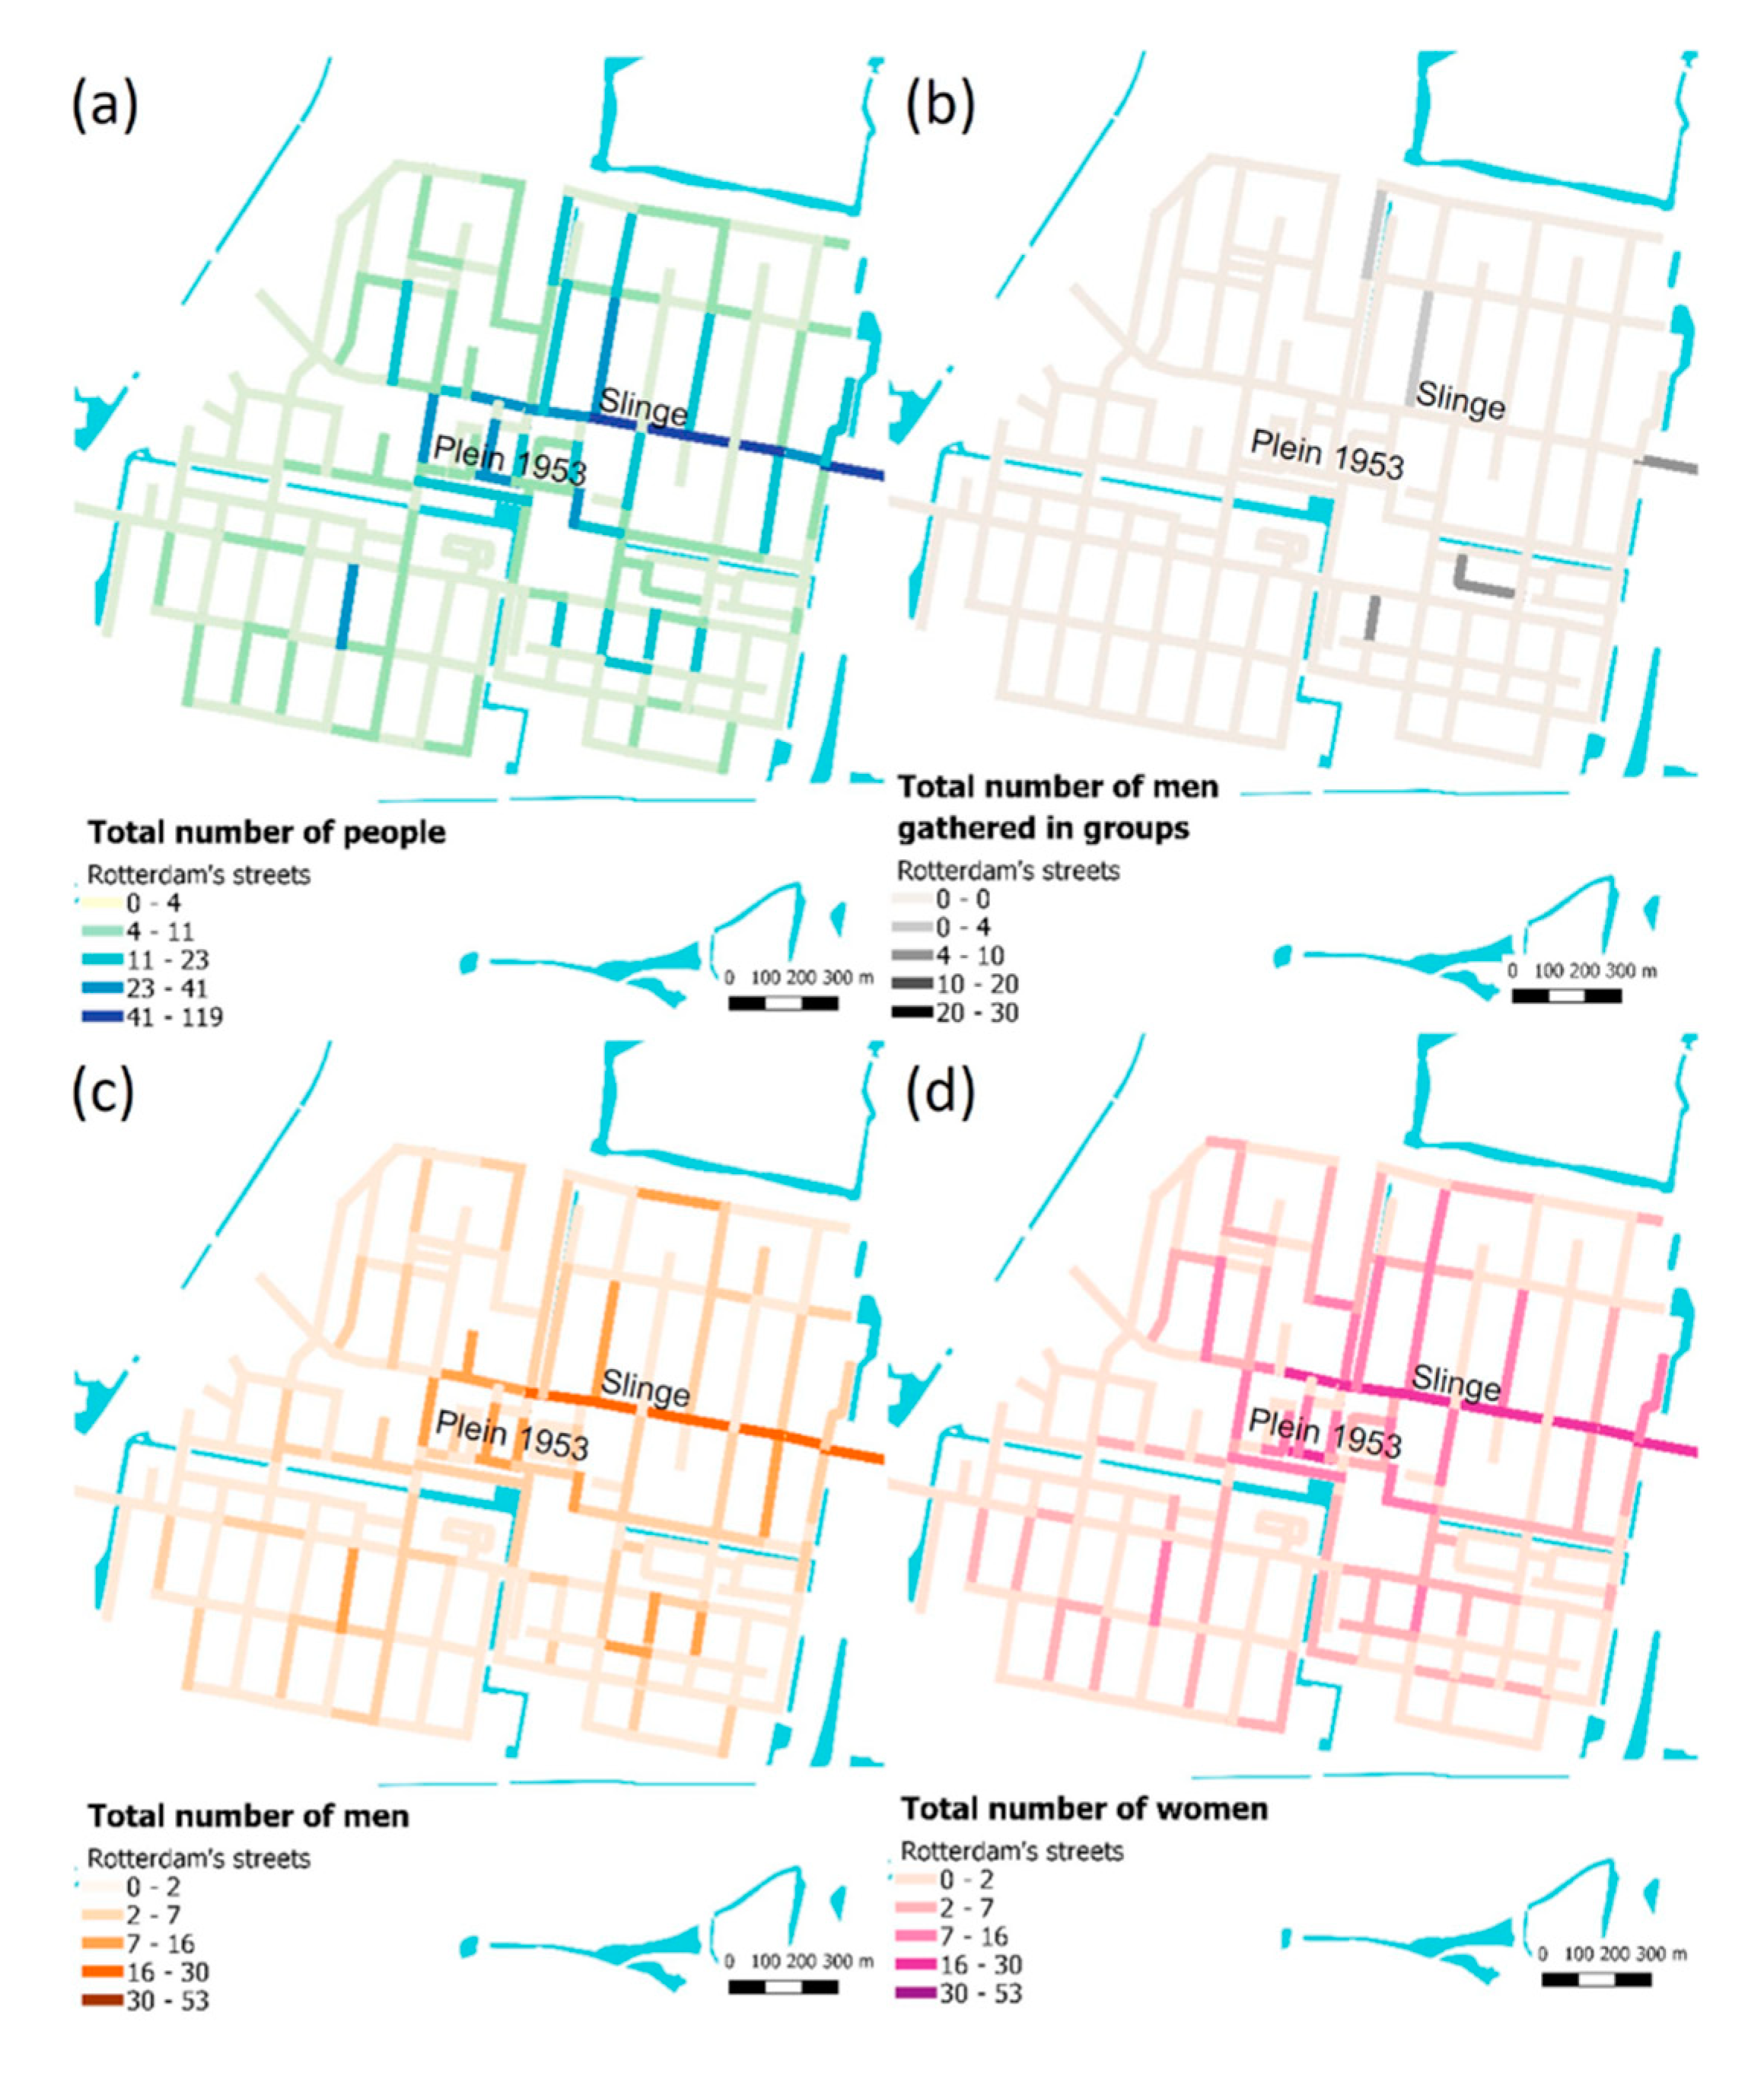
This area has few people on the streets during an average weekday (Figure 13), even in the main shopping areas Plein 1953 and Slinge. There were more people inside a supermarket than outside on the streets. Most people on the streets are women, elderly people running errands or sitting in the plaza, and young loitering men.
5. Relationship between Sexual Violence and Spatial Features of Streets
The statistical analysis was conducted using a pooled Poisson model. It was pooled because the five and a half years of sexual violence records were combined to provide a larger sample per block and street, instead of analysing each year separately as panel data. The choice of a Poisson model over an ordinary least squares (OLS) regression was based on its suitability for a count dependent variable (number of sexual crime occurrences). OLS would be better suited to a continuous dependent variable or a log-transformed count variable. However, this would create issues due to the large number of zeros in the dependent variable. Another option for count data is the negative binomial regression, if data is over-dispersed. As this was not the case (the variance is much smaller than the standard deviation for this data), a Poisson model demonstrated a good fit to the data.
The data availability in this research creates two possibilities for calculating statistical models to predict sexual violence cases’ distribution based on spatial features of the built environment and the number of people present on the streets. The reason for this is that the quantitative spatial data in the GIS file can be aggregated on either a street segment level or urban block level. One possibility is to aggregate spatial features (collected at block level) into the street level (the scale of police reports’ availability). The other possibility is to disaggregate the police records on urban blocks. For lack of a better proxy, such disaggregation is based on the length of each block proportionate to the total street length (which is not an ideal scenario). In the first case, the individualities of each block’s features are lost in the street-level aggregation, thus “homogenizing” the independent variables. In the second case, dividing the number of sexual violence cases equally per block assumes that every block in a street is equally dangerous, which is just as unrealistic. In the face of such adversities, both models were created and are hereafter presented.
Table 3 summarizes the sample size in each neighborhood, Table 4 summarizes the variables used in the construction of the Poisson model at block scale, and Table 5 presents the three best models obtained in STATA for these variables. The results from the space syntax analyses (various numerical degrees of local integration and angular integration) are taken from the Depthmap software, whereas the buildings’ type of land use is presented as nominal data, that is, as residential, commercial (shops and entertainment), or mixed use (business use at street level, residential use on upper levels).
Three models were found to be statistically significant at block scale, based on the data from the four neighborhoods. These models are not to be considered universal, but rather as a starting point for future research concerning other cities and countries and for comparing spatial data with harassment data and socioeconomic data from other cases with similar data accessibility.
(1) Harassment incidents on a street block = 0.0118*Tw + 3.258*Li + 0.797*F − 6.663
The first resulting model shows significant positive correlation between the number of women on the streets, the local spatial integration, the function of the street (whether it is commercial, mixed, or residential), and the occurrence of sexual crimes. This result is counterintuitive at first sight. However, there can be no crimes where there are no victims (women). Moreover, most women can be seen in the shopping areas, which are located on locally integrated streets. Non-residential streets that may be safe during the day become dangerous at night, when natural surveillance disappears. These hypotheses are supported by the positive correlation between buildings’ functions and the occurrence of cases (as “zero” represents “solely residential” and values closer to “2” represent non- residential). Predominantly, commercial streets are associated with a higher incidence of crime, which is in line with the findings of Hillier and Sahbaz (2008) on street robbery.
(2) Harassment incidents on a street block = 0.0126*Tw + 3.231*Cw + 4.294*Li + 0.725*F − 8.112
The second model shows the number of crimes per woman as an additional positive correlate of the total number of crimes. The third model includes the measure of to-movement (angular analysis with low metrical radius) as a positive significant variable of the sexual crimes against women on a block:
(3) Harassment incidents on a street block = 0.0174*Tw + 3.136*Cw + 2.08*10−6*Al − 2.383
Commercial blocks are attractors of movement and tend to have high to-movement potentials. If commercial blocks have high rates of sexual violence, then higher to-movement also associates with high rates of sexual violence. Table 6 summarizes the variables used in the construction of the Poisson model at street scale, and Table 7 presents the two best models obtained in STATA for those variables.
(4) Harassment incidents on a street = 2.68*Cw +0.0035*Tw + 6.83*Li + 0.996*F − 0.14*V − 10.1
The resulting models at street level are mostly similar to those at block level. Regarding the street-level model (4), there is a high correlation between harassment incidents per woman, the number of women on a street, the local spatial integration, and the land use of the street, but a negative correlation with inter-visibility from buildings towards streets. This means that high numbers of women, high rates of harassment incidents per woman, high local spatial integration, and commercial streets imply a high occurrence of harassment incidents, while high inter-visibility of entrances and doors imply low numbers of harassment incidents per street. The correlation between high numbers of women and commercial streets with harassment incidents has been covered in the previous segment (the statistical models at block level). The negative relation between inter-visibility of entrances and the incidence of crime is in line with Jacobs’ deductions: natural surveillance from buildings results in greater safety on the streets.
(5) Harassment incidents on a street = 2.89*Cw + 0.0050*Tw + 9.61*Li − 0.18*V − 2.17 × 10⁻⁶*Al − 12.5
The second street model includes angular low values instead of the land use of the street. Streets with high to-movement potential values correlate with a low number of harassment incident reports. The difference between the sign of to-movement at street scale and at block scale indicates that a street with a high flow of people contributes to fewer harassment incidents (especially in residential neighborhoods), but the block that attracts such movement (usually a commercial one) has more harassment incidents due to the lack of surveillance after shops’ closing hours. Therefore, temporal aspects matter on streets with a land use consisting of only commercial activities.
The next step in the analyses is to group street blocks by the rate of sexual violence reports per 100 meters. This facilitates patterns to emerge without the influence of the block length. It allows for an investigation concerning whether blocks with high rates of incidents per length unit have different characteristics from those with low rates. Figure 14 illustrates the univariate relationship between variables. Graph A presents the distribution of total women in a street in a day according to the land use of street (function). There is a clear tendency that a high number of women are present in non-residential streets. Graph B shows the total number of harassment incidents in relation to types of land use. A high number of commercial land uses implies high numbers of harassment incidents.
Graph C shows that the occurrence of harassment incidents increases with the densities of entrances, although three of the last four points seem to indicate a second curve with smaller average densities of entrances that correlates with high numbers of harassment incidents. Thus, the different mechanisms governing sexual violence in public spaces are twofold: one in non-residential blocks and another in residential areas.
Some patterns are easier to visualize by grouping streets rather than blocks. In the case of the inter-visibility of entrances, graph E shows a correlation between densities of harassment incidents per street and inter-visibility.
Graph D shows that commercial streets have high densities of harassment incidents, supporting graphs C and E: commercial streets have higher densities of entrances and inter-visibility than other streets, but only during shops’ opening hours. Some of the high harassment incident rates per street length are correlated with streets with some residential use (a value of 1.0 indicates mixed streets that typically have stores on the ground floor and residences on the upper floors). Streets with only shops on the ground floor that are closed at night contribute to a lack of natural surveillance on streets.
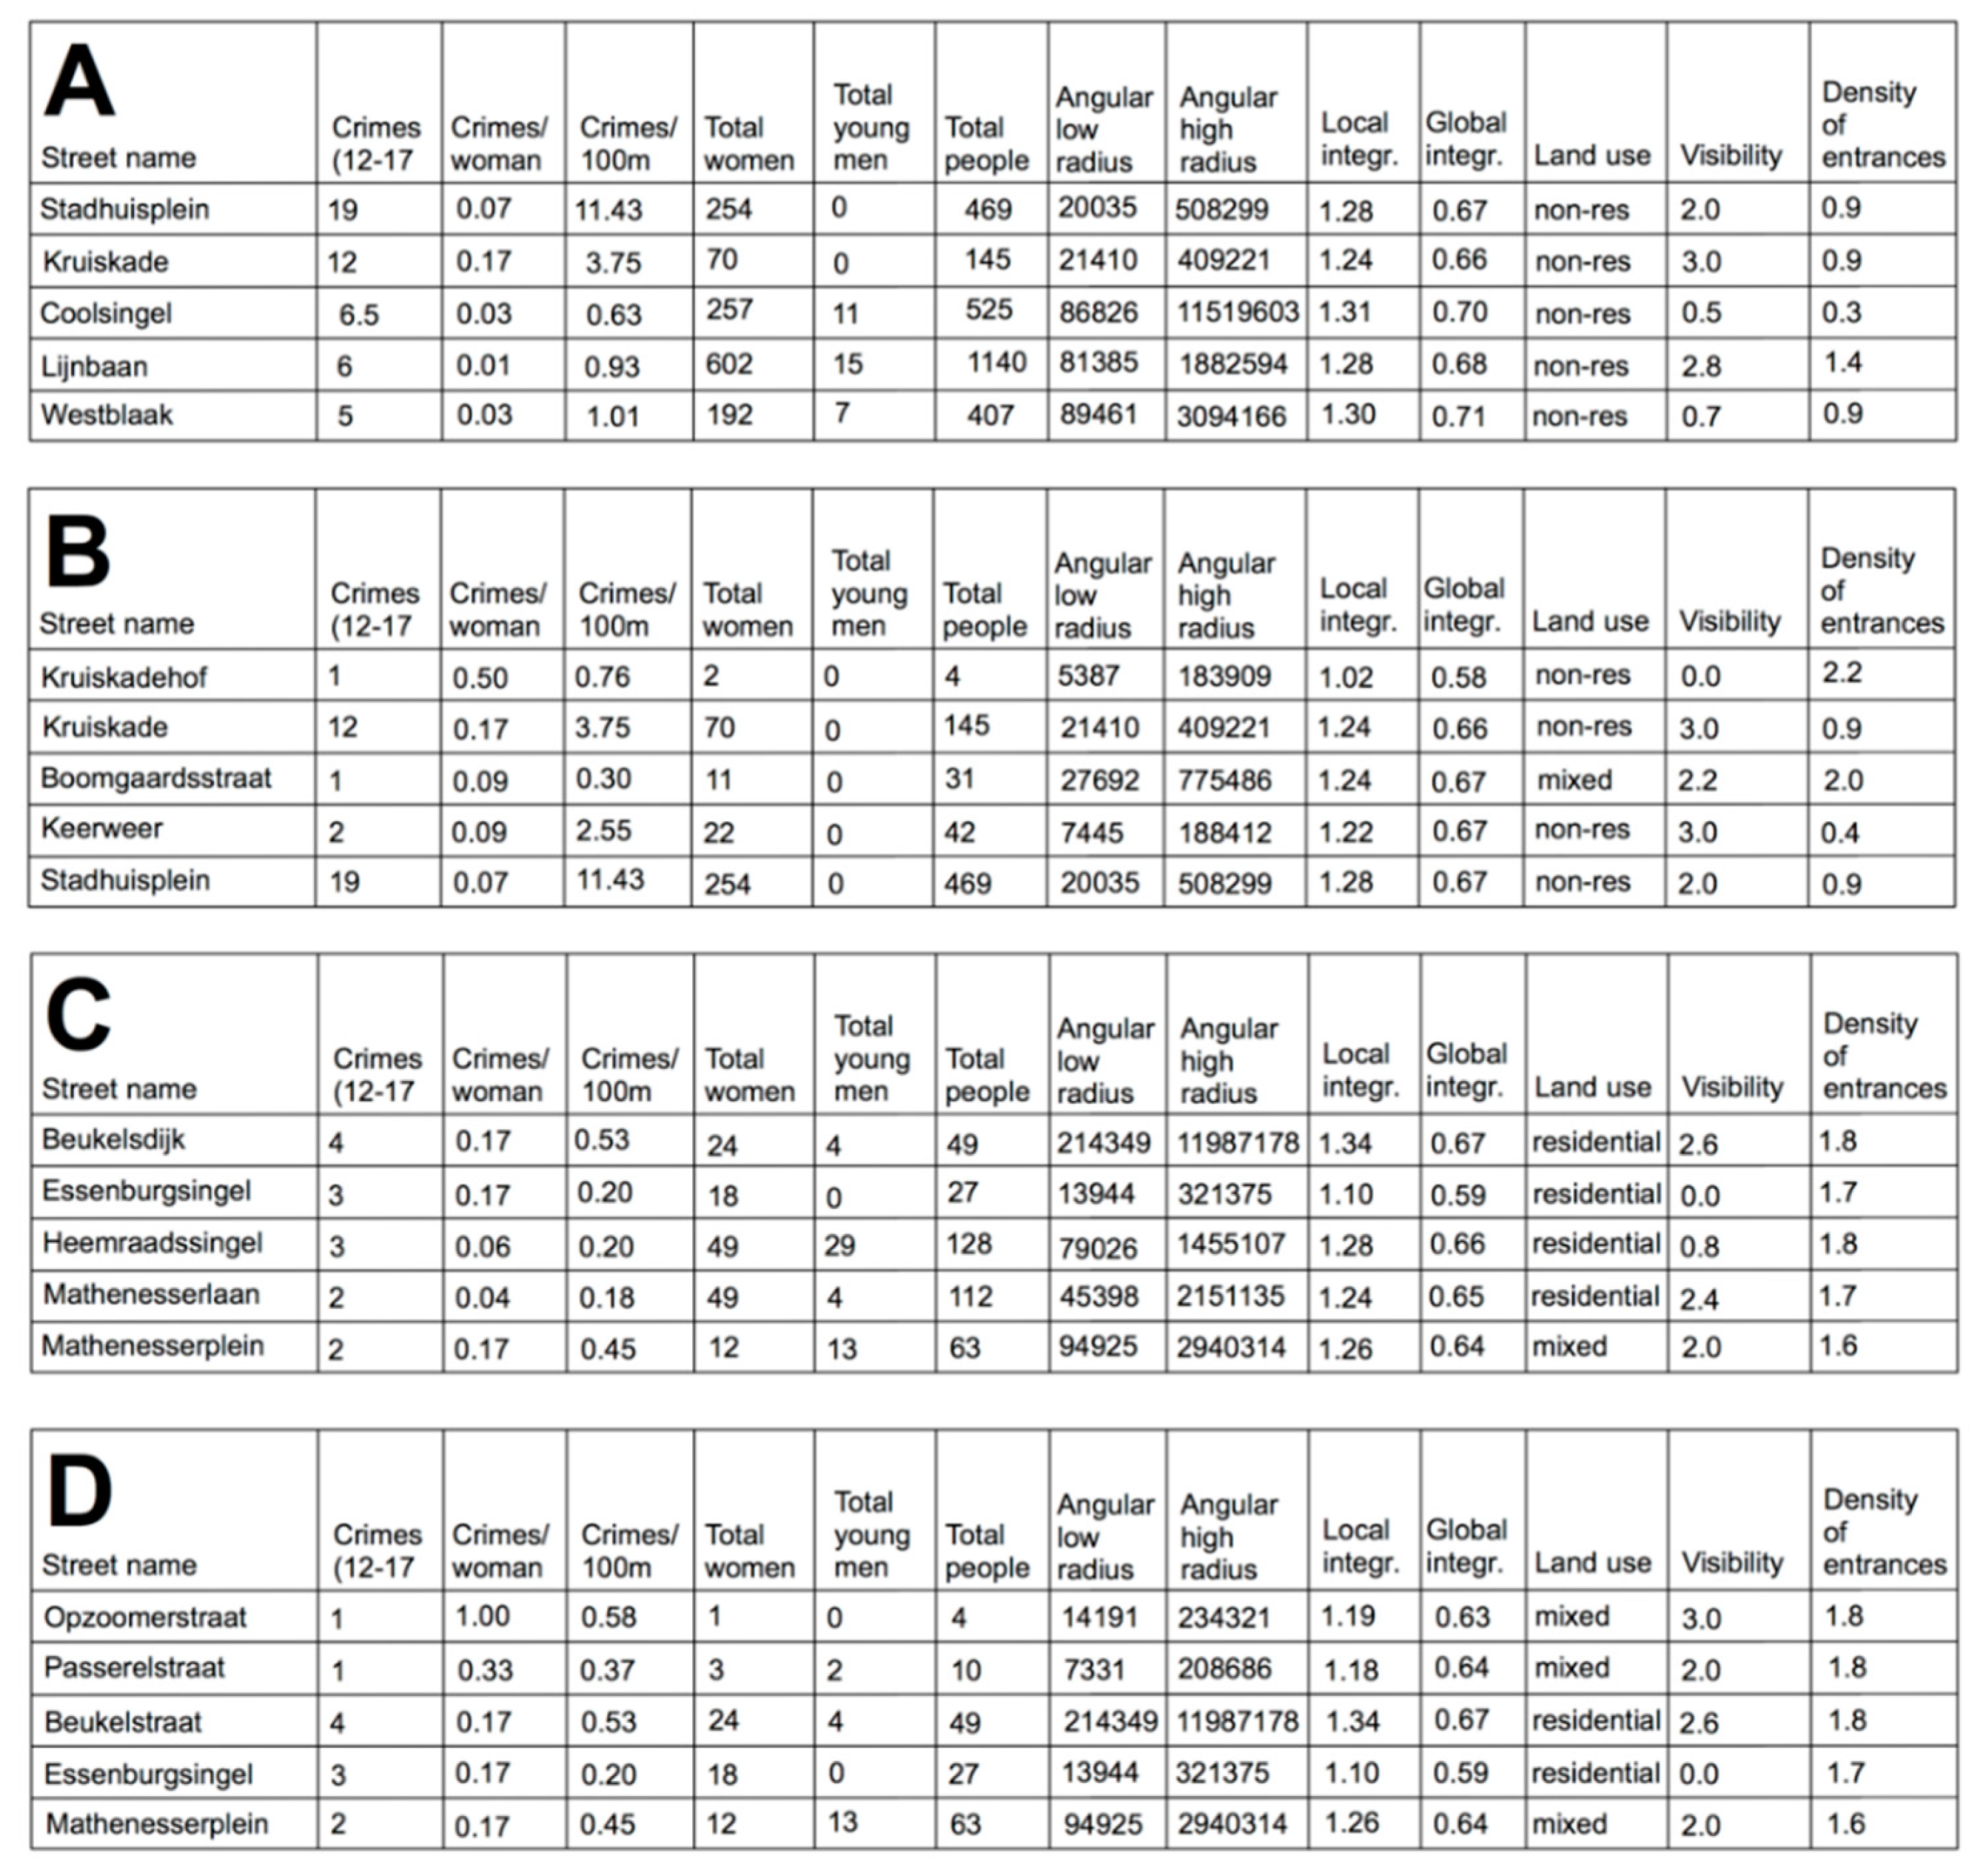
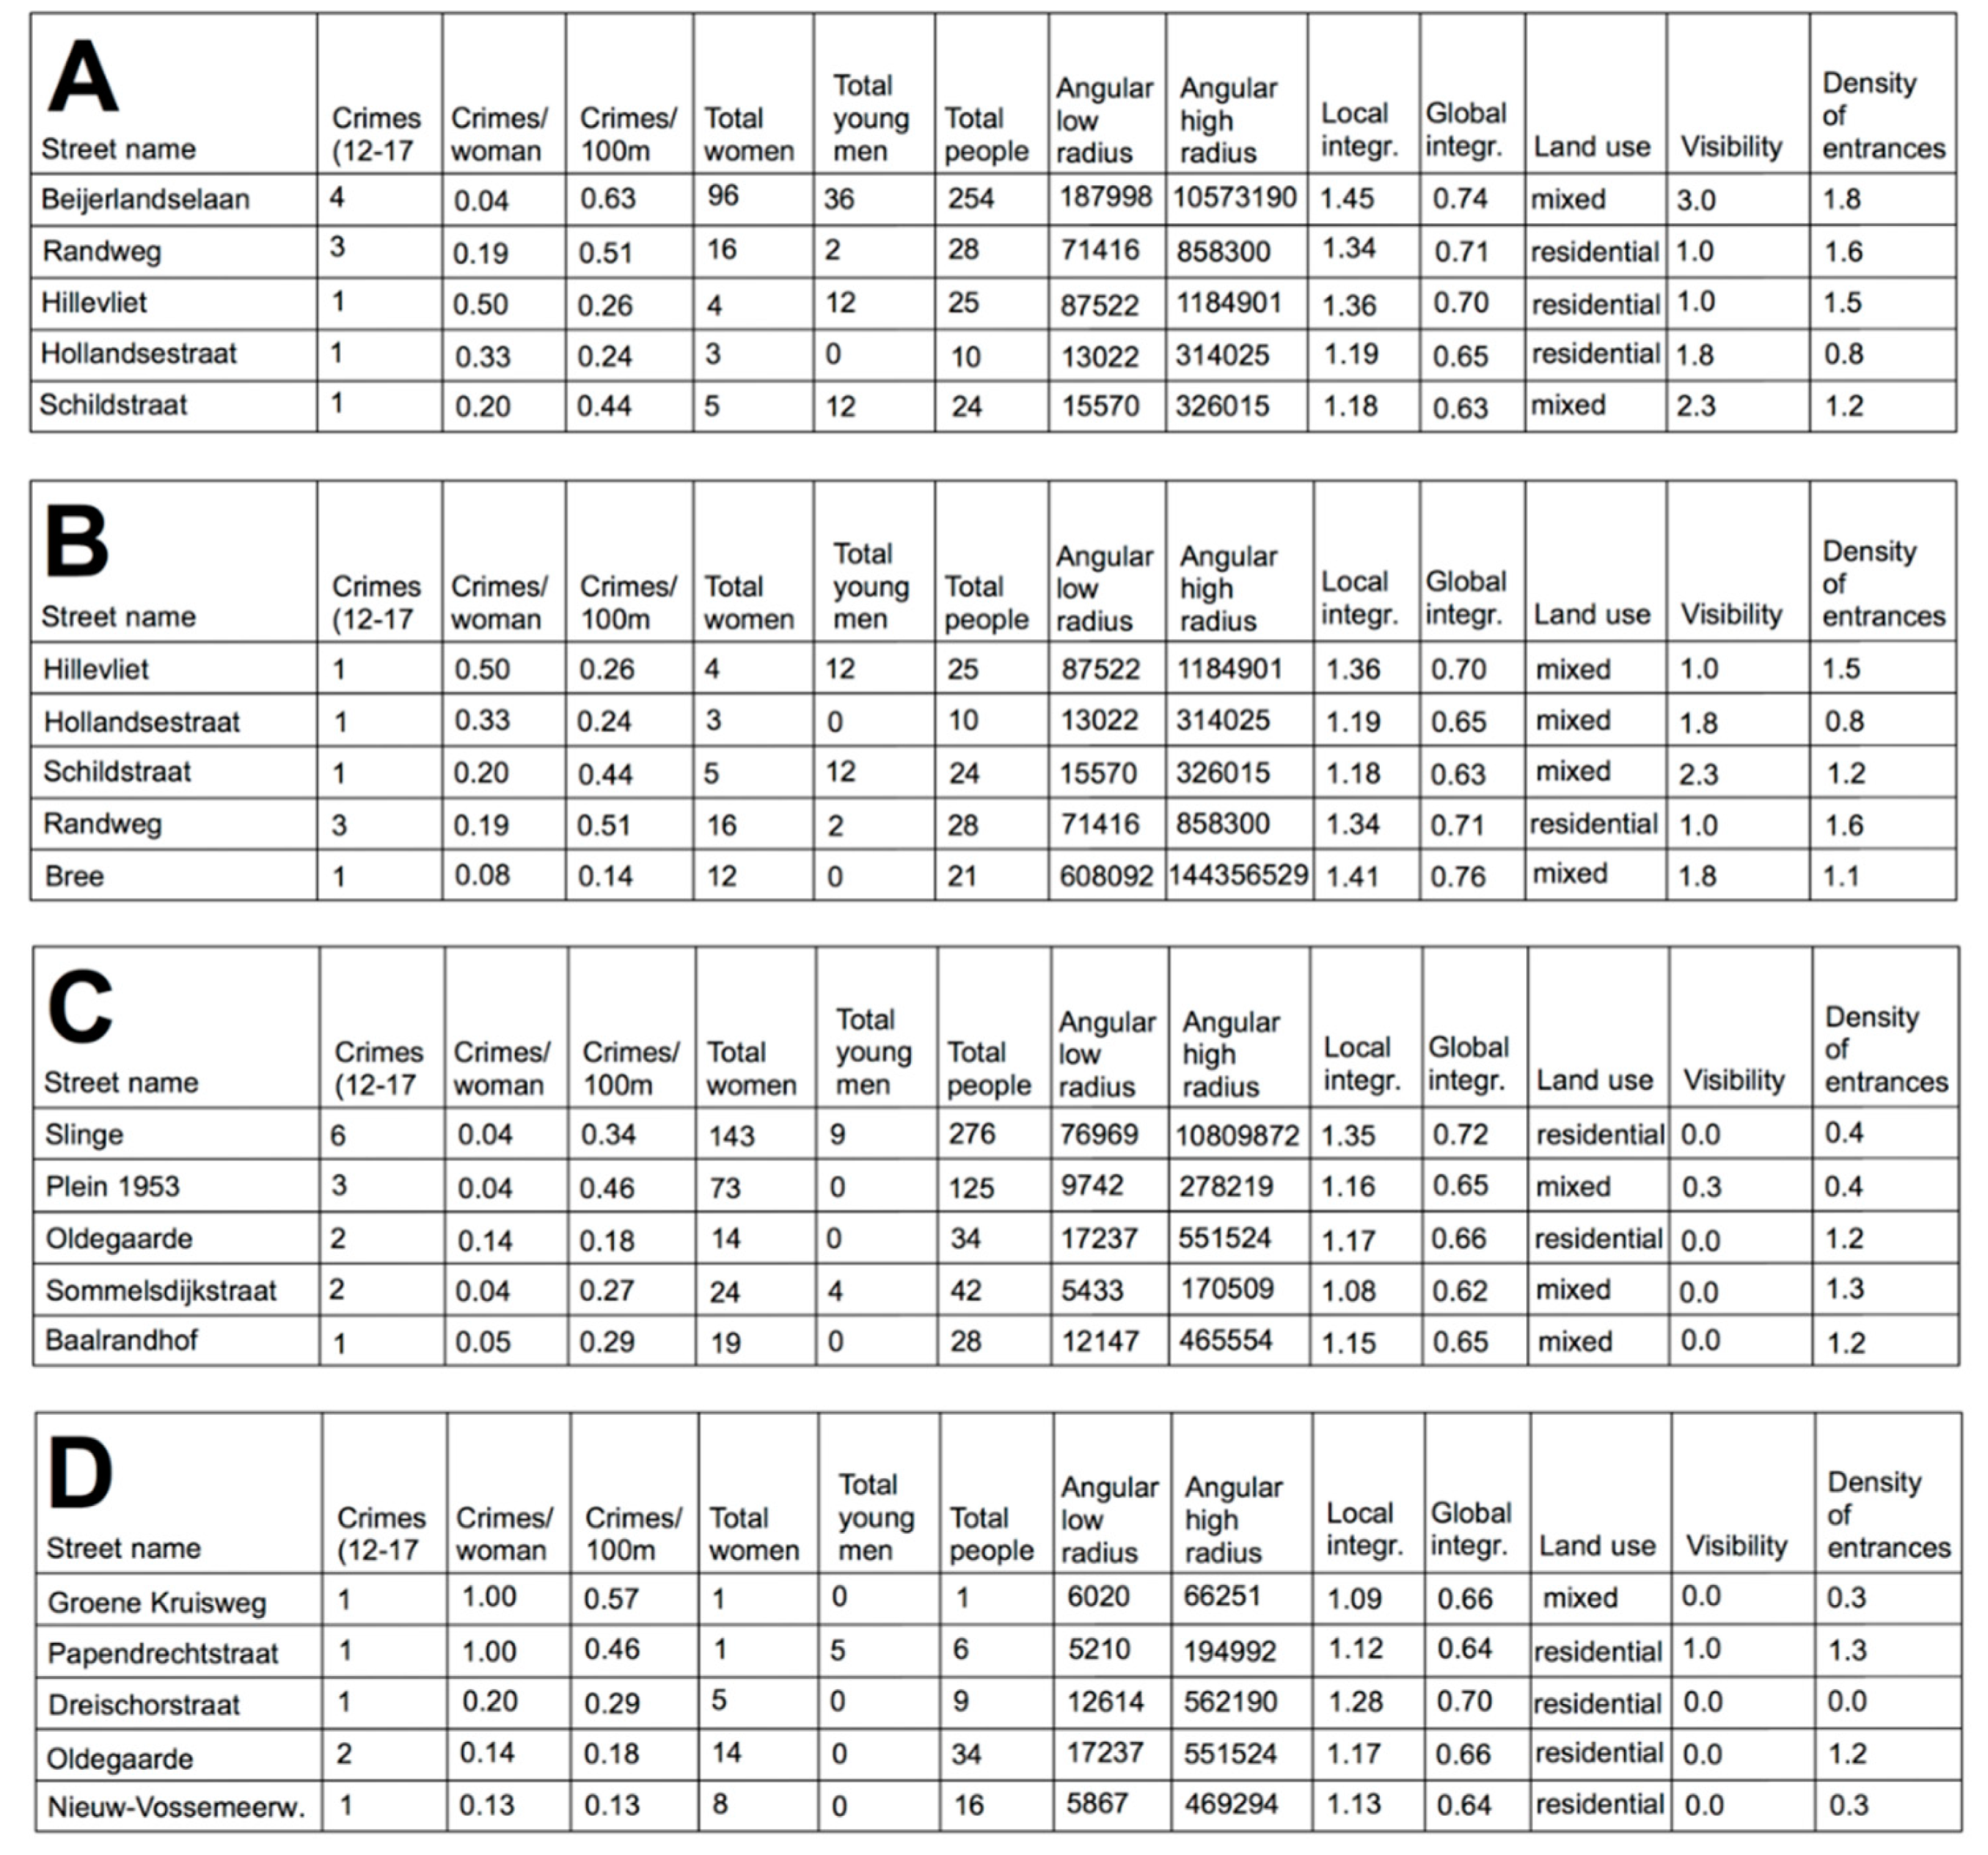
Figure 15 shows the spatial values of the five most dangerous streets in Cool and Nieuwe Westen based on the total number of reported cases (tables A and C in Figure 15). These streets are all commercial, constituted streets that attract hundreds of people a day. However, dividing the number of crimes by the number of women seen on the street on an average weekday (Tables B and D), the riskiest streets change considerably, to Kruiskadehof, Kruiskade, Boomgaardstraat, Keerweer, and Stadhuisplein in the Cool neighborhood. This list includes streets with low flows of people (such as Kruiskadehof, a service street located behind shops and restaurants, and the residential street Boomgaardstraat) and streets with high amounts of harassment incidents (such as Kruiskade and Stadhuisplein). Stadhuis and Kruiskade are nightlife spots. The visibility from buildings towards streets is low in Coolsingel, Westblaak, and Kruiskadehof, and the density of entrances is especially low in Coolsingel and Keerweer, as can be seen in the tables.
Mathenesserplein is the only commercial street amongst the most dangerous of Nieuwe Westen (both in absolute numbers and in crimes/woman). The other streets are mostly residential. However, all of them have a high density of entrances and only Essenburgsingel has poor visibility. All of the streets in the riskiest list have extremely low pedestrian flows during the day.
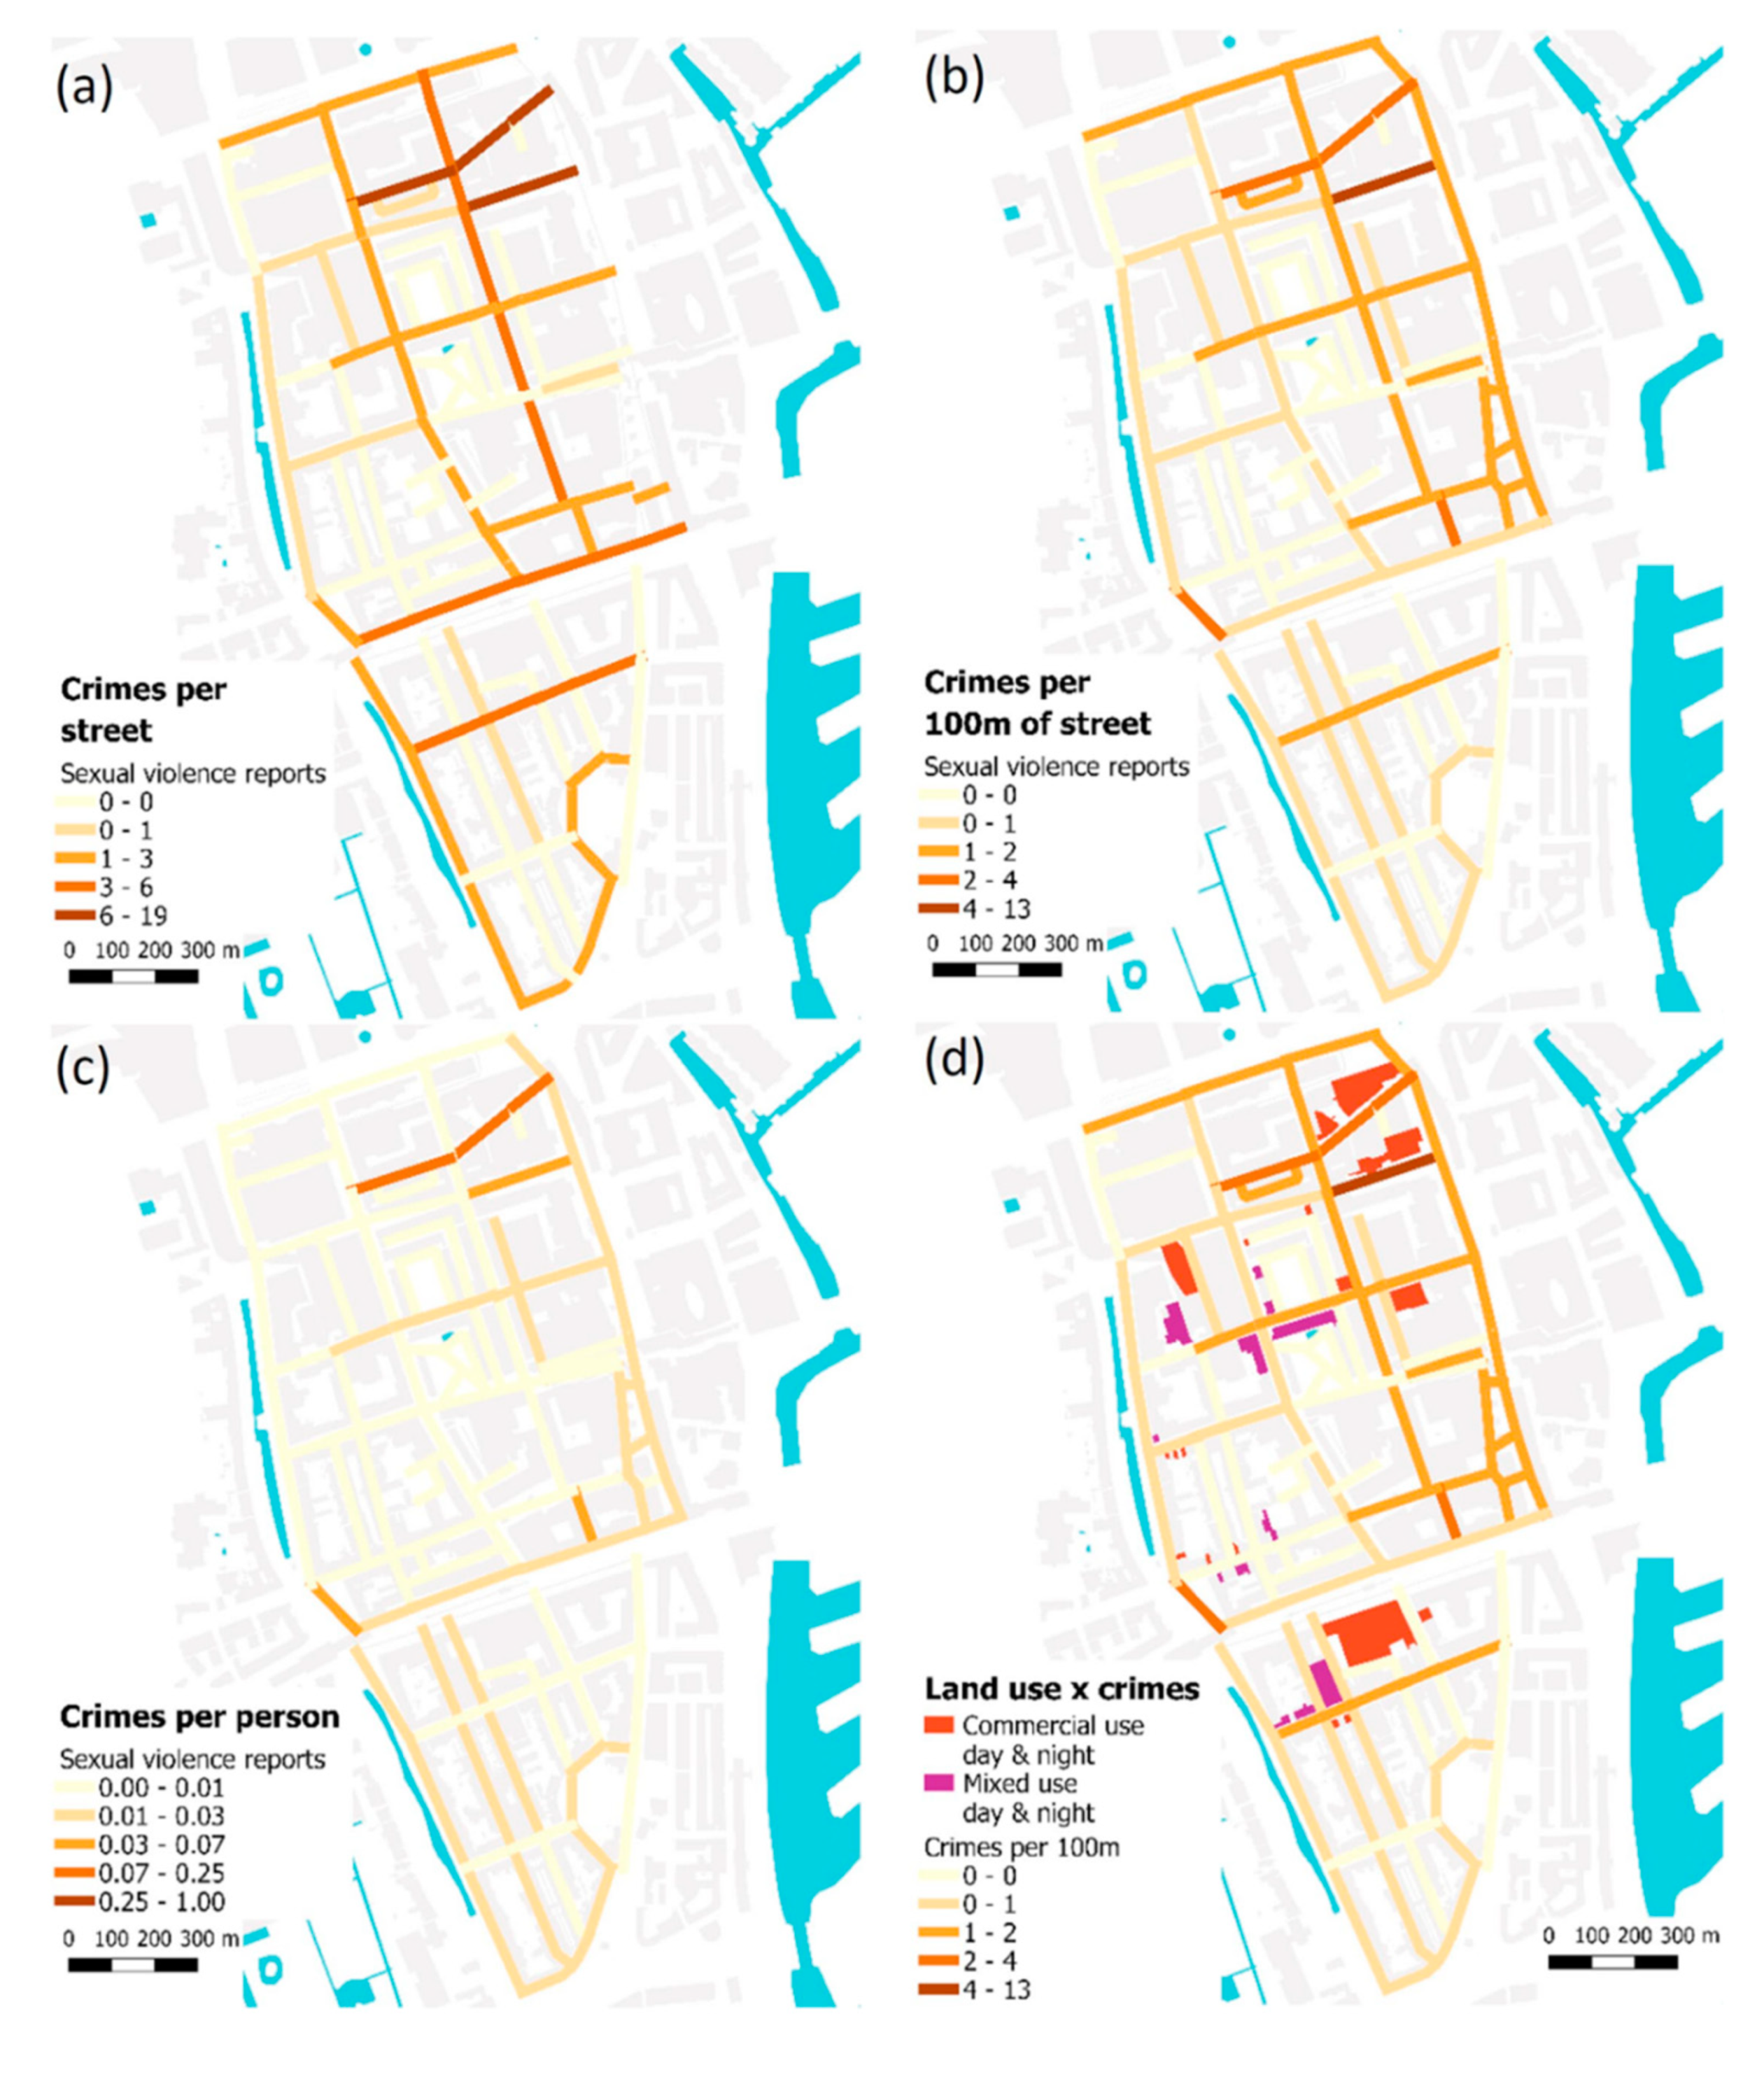
Figure 16 shows that the riskiest streets are not the most frequented streets. Based on the apparent convergence between Cool’s non-residential land use, night time activities, and high incidence of sexual violence reports, the “Land use x crimes” map (lower right) shows solely non-residential or mixed non-residential/residential buildings open in the evening (and, in some cases, at night), together with those streets with the highest number of harassment incidents.
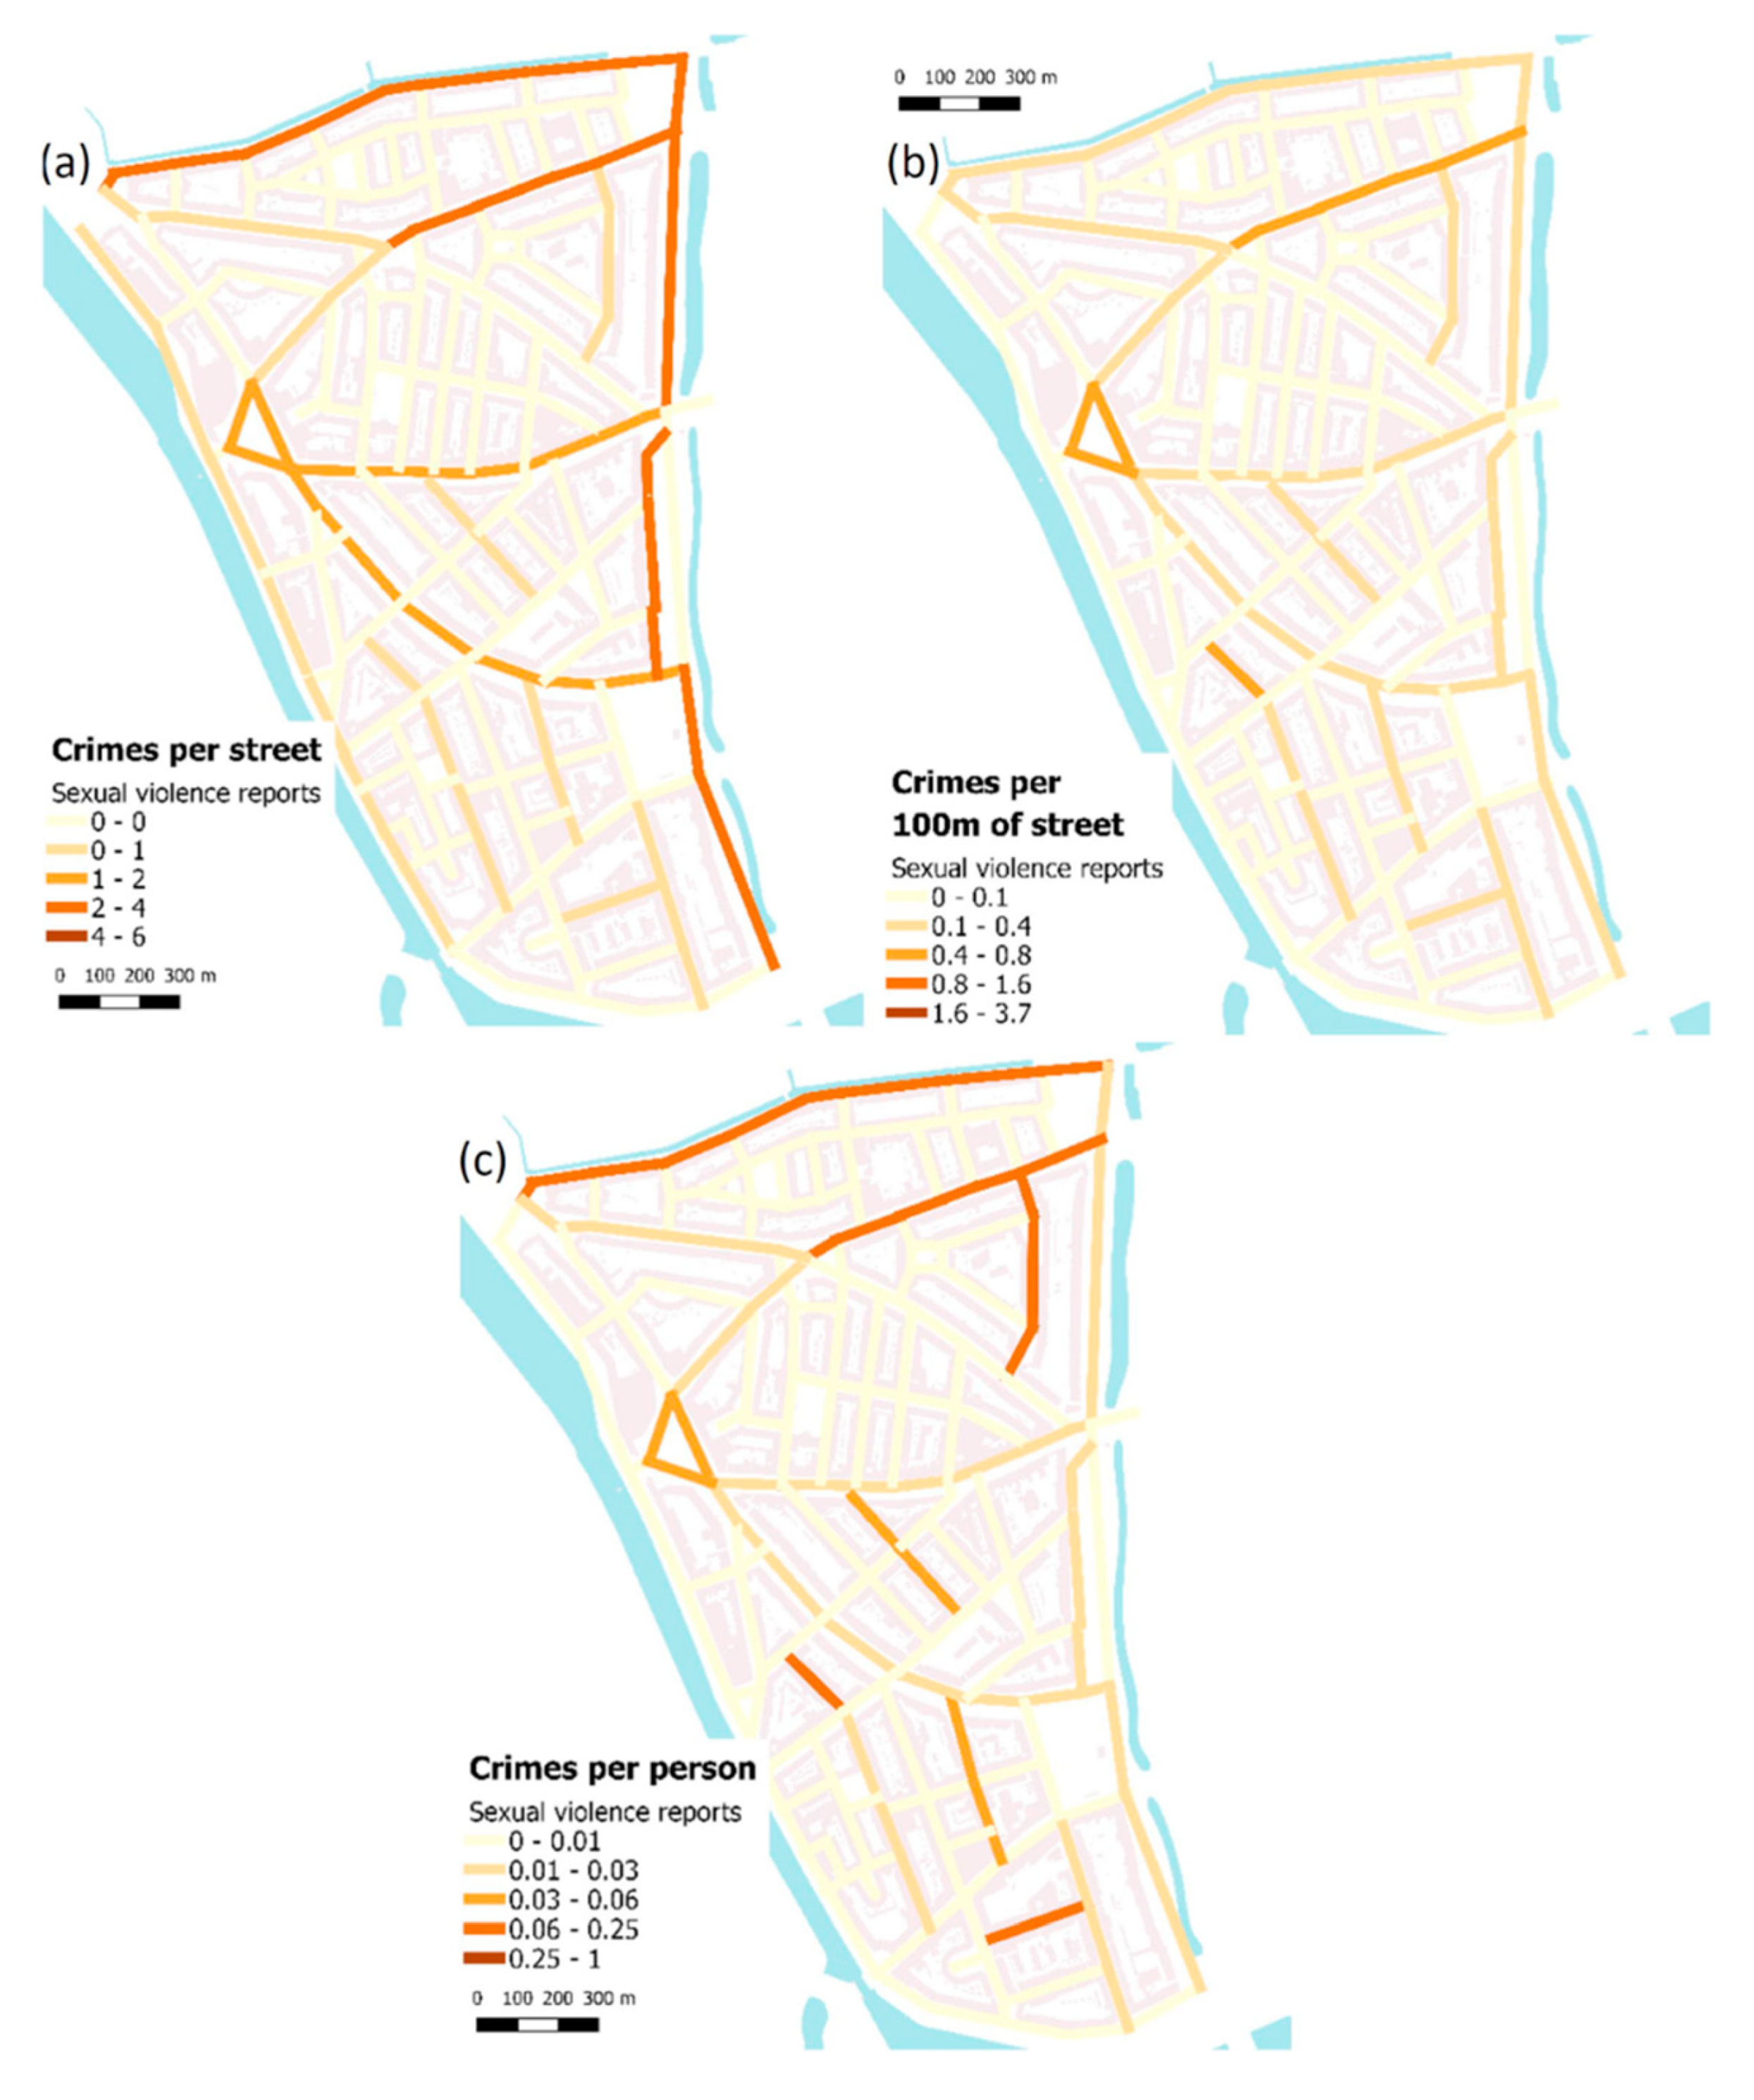
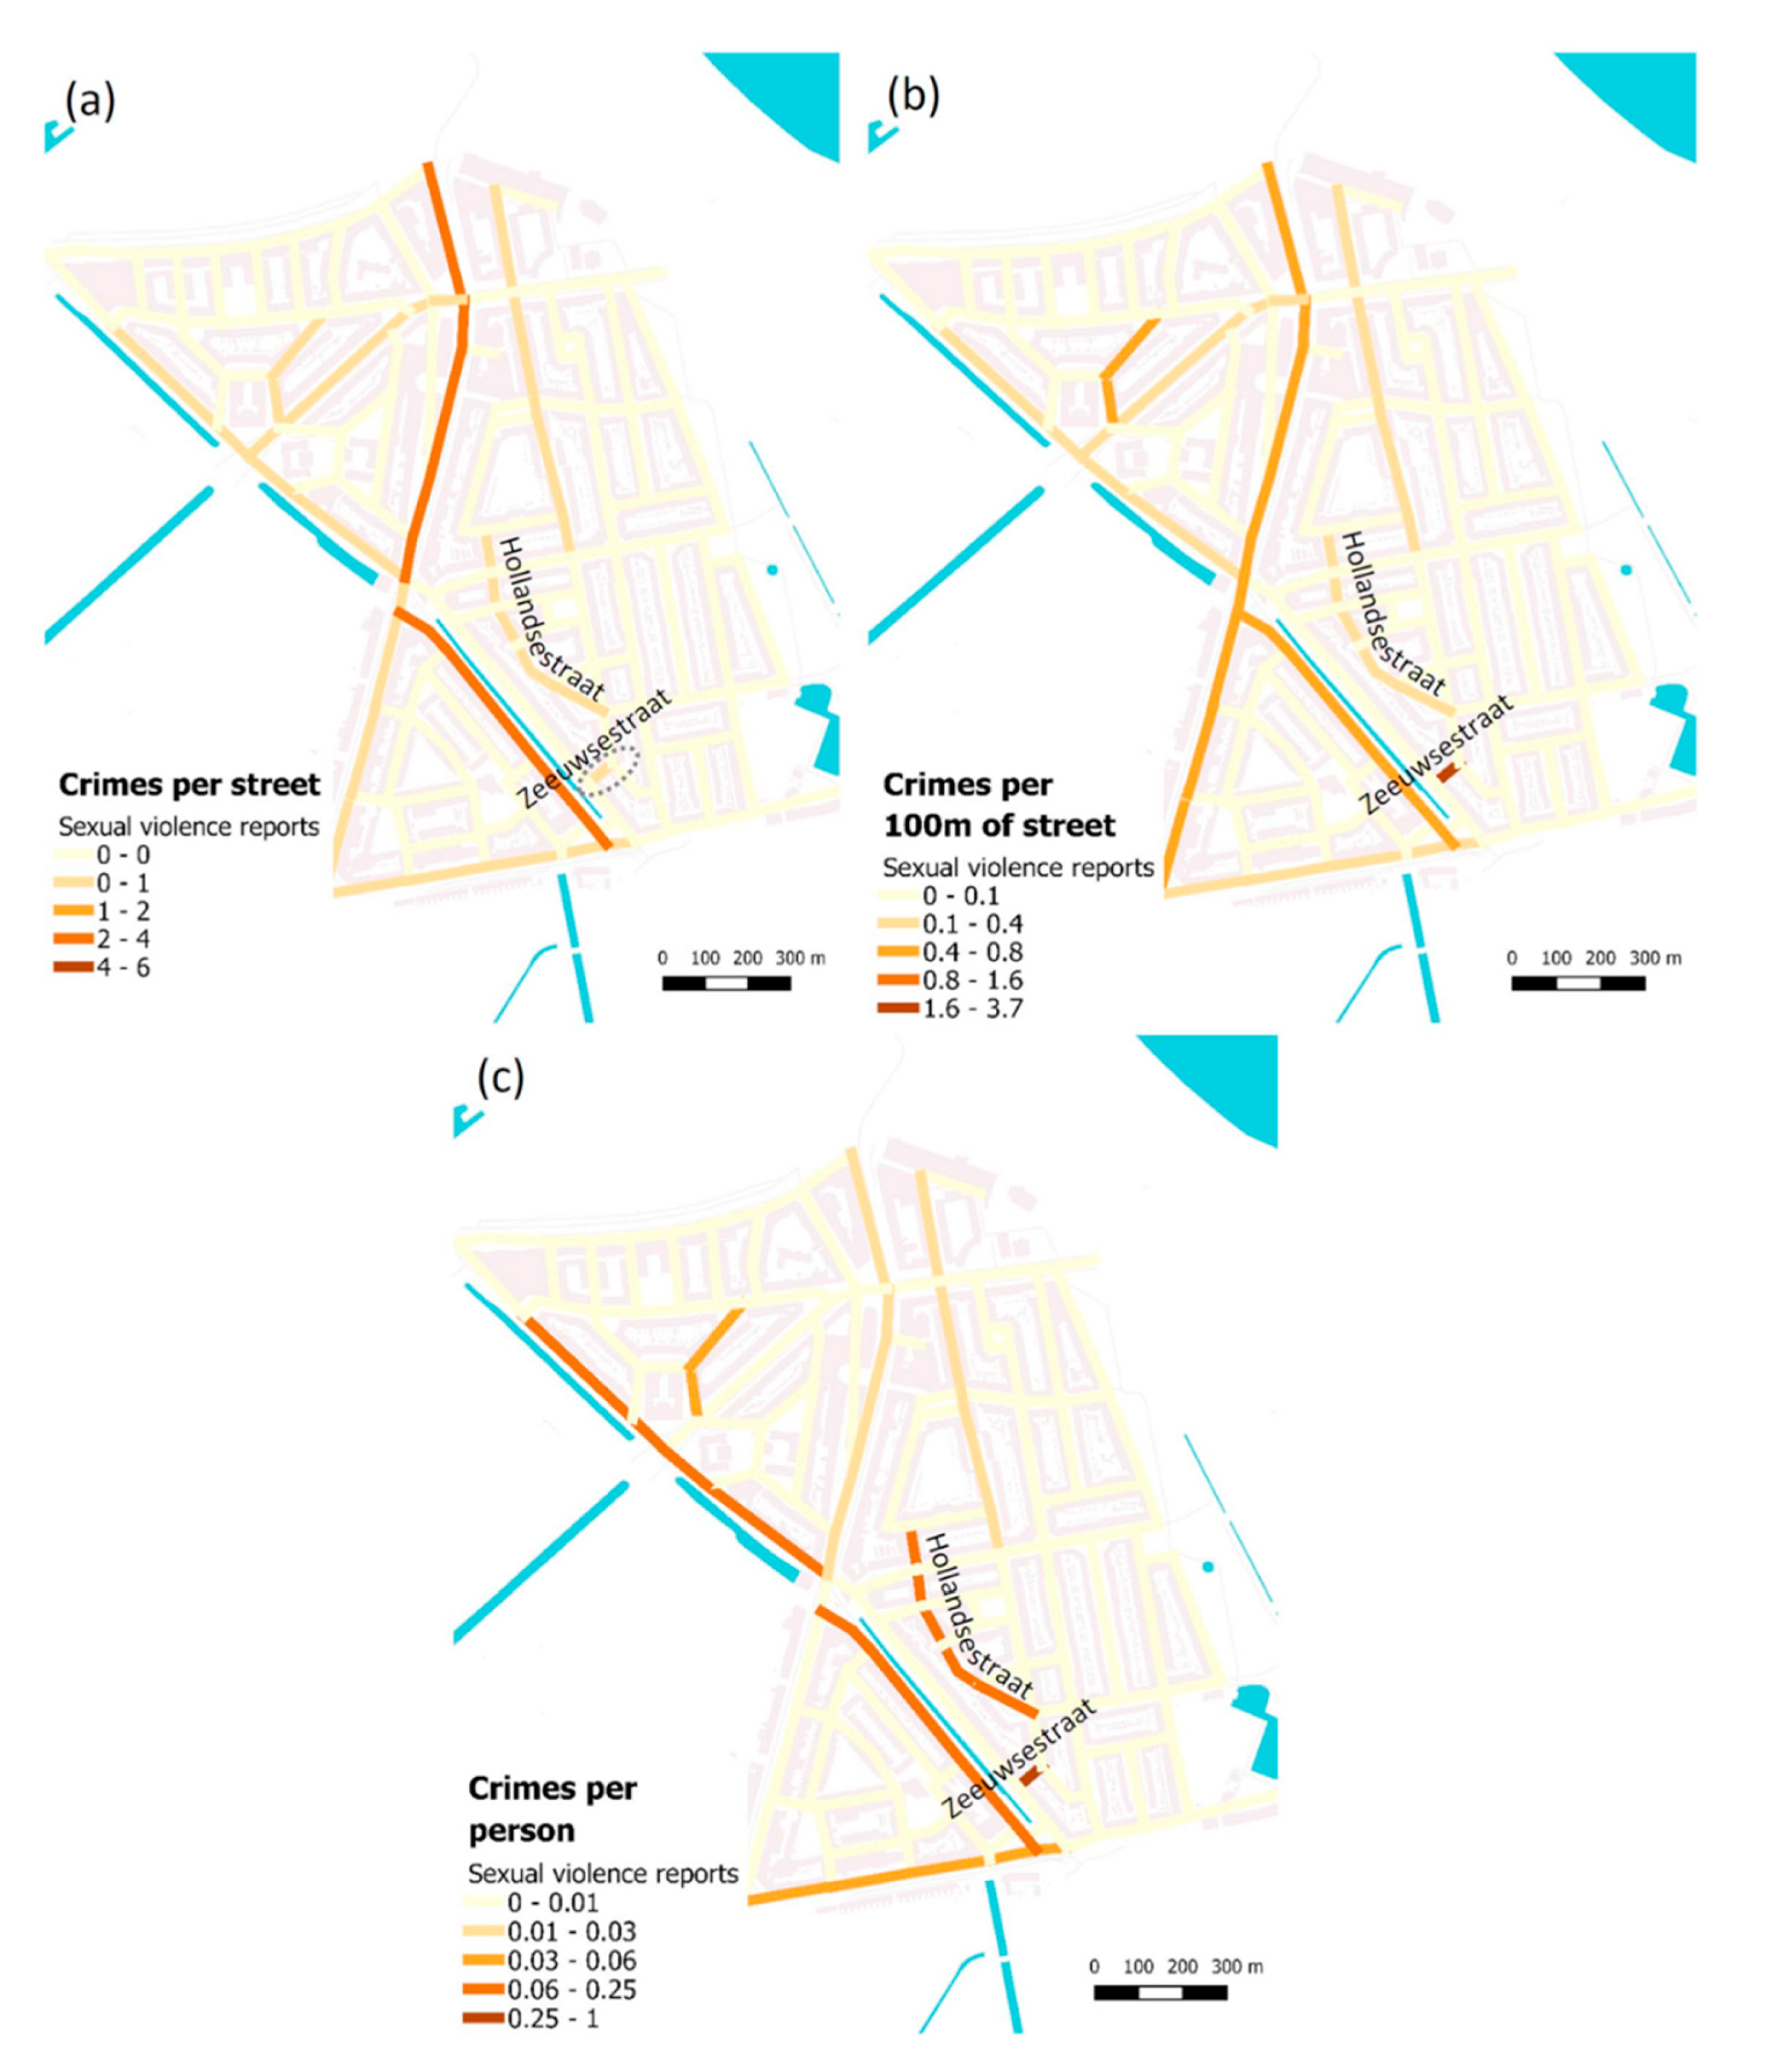
Figure 17 shows the results for Nieuwe Westen. Some of the riskier streets (those with higher rates of crimes/women), such as Hollandsestraat and Zeeuwsestraat, are not the ones with higher absolute numbers of sexual violence reports.
Figure 18 shows the spatial values of the 5 most dangerous streets in Hillesluis and Pendrecht. In Hillesluis, the most dangerous streets (in both absolute numbers, A, and risk, B) have a high density of entrances and are mostly residential or mixed. The streets with higher rates of harassment incidents per woman all have low flows of people (columns “total women”, “total men”, and “total people”). Pendrecht’s most dangerous streets (in absolute numbers—table C) also include the shopping streets Plein 1953 and Slinge.
The riskiest streets in Pendrecht (in both absolute and proportional numbers) have low visibility. However, compared with the riskiest streets in Nieuwe Westen, the density of entrances and inter-visibility do not seem to play a determinant role, as they are both high in Nieuwe Westen’s riskiest streets and low in Pendrecht’s streets (in both absolute numbers and crimes/woman). Finally, all streets presented in Figure 18 have low flows of people.
Figure 19 shows streets with the number of incidents and reports per 100 m, as well as blocks with the number of reports per pedestrian (from the average of pedestrians counted on a weekday), for Hillesluis. As in Nieuwe Westen, the riskiest streets (those with high crime rates per person) are not those with a high absolute number of sexual violence reports.
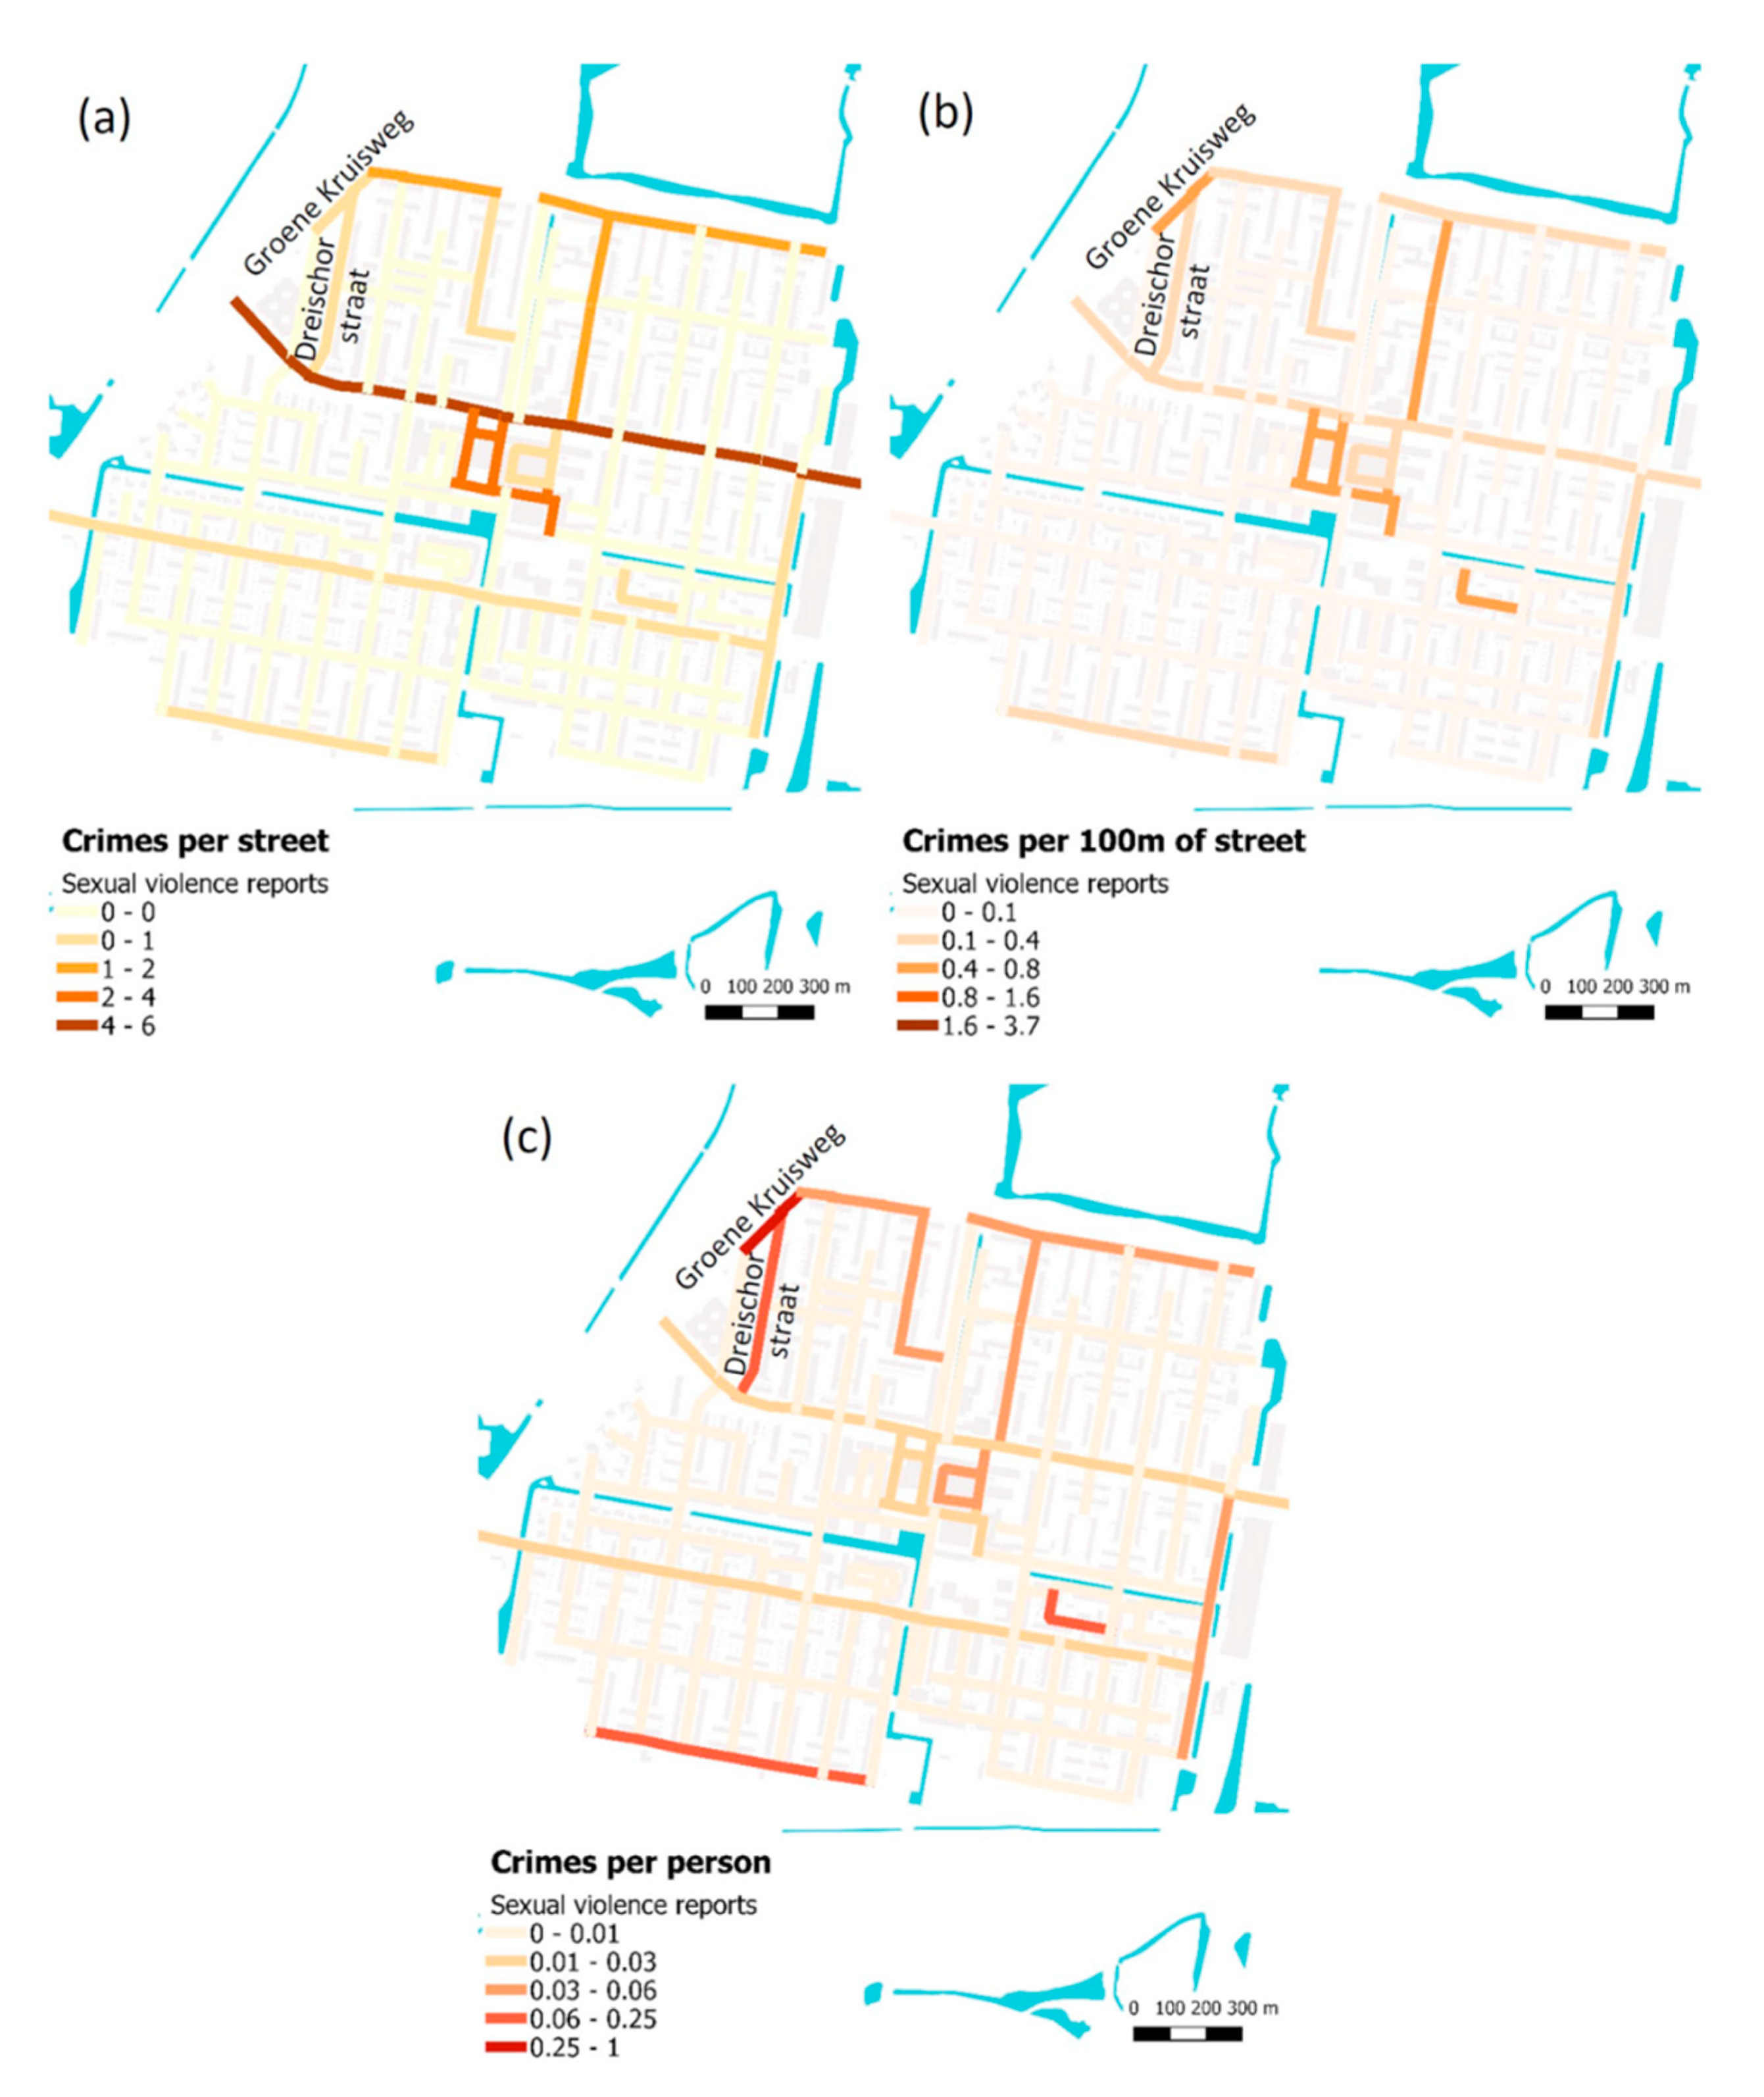
Figure 20 shows the results for Pendrecht. As in previous neighborhoods, the riskiest streets have low inter-visibility of entrances. The streets Groene Kruisweg and Dreichorstraat do not have a high absolute number of sexual violence reports. These streets are very segregated and have low numbers of people on streets.
6. Discussions and Conclusions
What are the mechanisms that shape opportunities for sexual violence on streets? Cultural, behavioral, and economic aspects vary across neighborhoods. However, as this study of the multi-cultural city of Rotterdam shows, various spatial features of a built environment matter. The Newman inspired separation strategy between inhabitants and strangers is relatively easy to apply and physically guarantees that no menace will approach. However, a built environment with opportunities for everyone to move freely and safely requires enhancing well-integrated streets and urban blocks with high building permeability to reduce sexual violence risk, as streets are the urban spaces where everyone needs to move between home, work, and leisure activities. What are then the right spatial strategies for designing safe streets?
Neither Jacobs’ nor Newman’s scenarios can be defended individually. On the one hand, numerous cases reported to the police happened in places with large flows of different types of people, supporting Newman’s view that strangers are dangerous. On the other hand, evidence from this enquiry supports Jacob’s proposal of mixed uses, with eyes on the streets from adjacent buildings.
Regarding land use diversity, some of the areas with higher absolute numbers of sexual violence incidents against women are the central neighborhoods with the most nightlife and leisure opportunities. However, dividing the number of cases by the number of people on the streets during the day shows that these busy streets have the lowest sexual violence risk of the four studied neighborhoods.
The temporal aspect shows that central areas had a high number of incidents at night (12 to 6 a.m.) and on weekends. These areas have few residents, and shops are closed during these time periods. Conversely, residential and suburban neighborhoods had a high number of incidents during the afternoon or evening and during working days.
The number of people on the streets shows that Hillesluis attracts mostly locals, while Cool attracts locals as well as visitors. Results of the observations show that women were the majority on the streets during commercial opening hours. Otherwise, men dominated the streets. Children were seen more often with an adult woman than with a man.
The pooled Poisson regression models show a strong correlation between the number of women on the streets, local spatial integration, the function of the adjacent buildings, and the occurrence of sexual crimes. First, there can be no sexual violence in public spaces where there are no potential victims. Second, most women on the streets can be found in shopping areas, which are situated in locally integrated streets. Non-residential streets that are safe during the day become dangerous at night when the natural surveillance mechanism disappears. The street sexual violence results indicate that streets with a mixed land use on the ground floor level from adjacent buildings are safer than streets with only one type of land use.
High inter-visibility of entrances on the ground floor and the presence of other people result in safer streets compared to a combination of deserted streets with a lack of active frontages from adjacent buildings towards streets. As indicated, a street with a high flow of people has fewer occurrences of sexual violence (especially in residential neighborhoods). However, commercial blocks attracting such movement have more incidents due to the lack of surveillance after shops close.
All spatial variables are interdependent. Streets with high inter-visibility from the ground floor of adjacent buildings have at least a medium density of entrances; commercial streets usually have a high density of entrances and windows and, therefore, high inter-visibility between them during opening hours. After opening hours, commercial streets can turn into ghost streets. Streets with high local spatial integration tend to have non-residential land uses on the ground floor level. Therefore, the findings require further investigation of other neighborhoods in more cities and in other countries before generalizations on the relationship between safety and spatial issues can be made. All future investigations on space and sexual harassment depend on acquiring access to detailed recorded crime data from the police, the precision of the recordings, and victims being brave enough to report incidents to the police with an exact location of where it took place.
The number of people in public spaces has a twofold influence as a generator of crime (as sexual violence cannot happen without both a victim and perpetrator) and as a form of social control (as most perpetrators will avoid being caught in the act).
The research findings also indicate that the precision of the spatial aspects needs to be taken into account to understand the risk of sexual violence in built environments. First of all, the theory of the natural movement [24] states that high spatial integration on streets contributes to a high presence of people and the attraction of shops. The more shops located along the streets, the more people will be present on streets and vice versa. Conversely, a high degree of spatial segregation of public space contributes to avoidance and a low degree of land use diversity [25]. Likewise, un-constituted streets with a lack of inter-visibility from adjacent buildings contribute to their avoidance by women. When most current crime prevention advice places the responsibility on women to avoid being in the wrong place at the wrong time, these avoidance strategies contribute to a gendered space where the women’s place is at home and the streets are the domain for men. At its extreme, this downward spiral contributes to empty streets or “no-go” areas.
How can these findings be applied to current strategies for enhancing safe built environments? Current approaches from environmental criminology focus on the physical features of buildings and the provisions of cameras and alarming systems rather than on the spatial configuration of the built environment. Examples of this are the Dutch Police Label Safe Housing and the British programme Secured by Design. According to these approaches, criminal opportunities can thus be limited by manipulating the physical characteristics of the built environment [18]. The next step is to add requirements regarding street inter-visibility for buildings, types of land uses, and street connectedness into these programmes. Seemingly, this is the way to go for implementing these safety strategies into the current design practice with the purpose of providing safe streets. Sadly enough, most newly constructed housing areas and neighborhoods in the Netherlands are spatially very segregated [25] and tend to lack active frontages towards streets [19,20].
Obviously, the occurrence of sexual harassment in public space limits women’s freedom and their access to opportunities in the city. As expected, women’s avoidance strategies for crime prevention contribute to the reduction of incidents. However, they also contribute to 1) a gendered space where the public urban spaces are not accessible for the half of the population and 2) misleading research results in which gated communities are considered the safest. Concerning urban policy practice, this research’s results suggest that women’s safety in residential streets could benefit from a design that includes dwellings on both sides on ground floor level, with good inter-visibility between entrances with windows and streets. In commercial areas, land use should allow and encourage the inclusion or construction of residences on ground floor level, to provide mixed use. However, more research is needed on other neighborhoods in other countries to confirm these ideas with the purpose of reaching the United Nations sustainability goal 5 on enhancing safe and gender-equal public spaces.
Author Contributions
This paper is a result of the joint work of the authors. Development of the methodological framework, fieldwork, and the statistical analyses is carried out by J.V.M. The Space Syntax analyses is carried out by A.v.N. All authors have read and agreed to the published version of the manuscript.
Funding
This research received no external funding.
Conflicts of Interest
The authors declare that there is no conflict of interests.
References
- Valentine, G. The geography of women’s fear. Area 1989, 21, 385–390. [Google Scholar]
- Stanko, E.A. Women, crime, and fear. Ann. Am. Acad. Political Soc. Sci. 1995, 539, 46–58. [Google Scholar] [CrossRef]
- Sur, P. Safety in the urban outdoors: Women negotiating fear of crime in the city of Kolkata. J. Int. Women’s Stud. 2014, 15, 212–226. [Google Scholar]
- Sweet, E.L.; Ortiz Escalante, S. Planning responds to gender violence: Evidence from Spain, Mexico and the United States. Urban Stud. 2010, 47, 2129–2147. [Google Scholar] [CrossRef] [PubMed]
- Bowman, C.G. Street harassment and the informal ghettoization of women. Harv. Law Rev. 1993, 106, 517–580. [Google Scholar] [CrossRef] [Green Version]
- Crane, R. Is there a quiet revolution in women’s travel? Revisiting the gender gap in commuting. J. Am. Plan. Assoc. 2007, 73, 298–316. [Google Scholar] [CrossRef] [Green Version]
- Rapino, M.A.; Cooke, T.J. Commuting, gender roles, and entrapment: A national study utilizing spatial fixed effects and control groups. Prof. Geogr. 2011, 63, 277–294. [Google Scholar]
- Boomsma, C.; Steg, L. Feeling safe in the dark: Examining the effect of entrapment, lighting levels, and gender on feelings of safety and lighting policy acceptability. Environ. Behav. 2014, 46, 193–212. [Google Scholar] [CrossRef]
- Jacobs, J. Death and Life of Great American Cities; Random House: New York, NY, USA, 1961. [Google Scholar]
- Newman, O. Defensible Space. Crime Prevention through Urban Design; Machmillian Company: New York, NY, USA, 1972. [Google Scholar]
- Haraway, D. Situated knowledges: The science question in feminism and the privilege of partial perspective. Fem. Stud. 1988, 14, 575–599. [Google Scholar] [CrossRef]
- Arendt, H. Vita Activa. The Human Condition; Chicago University Press: Chicago, IL, USA, 1958. [Google Scholar]
- de Graaf, P.A. Verplaatsingen in the Metropoolregio Rotterdam den Haag en Nederland, 2004–2015; Rotterdam, The Netherlands, 2016; Available online: www.rotterdam.nl/onderzoek (accessed on 3 June 2017).
- Fischer, T.; Sprado, N. Seksuele Straatintimidatie in Rotterdam; Erasmus Universiteit Rotterdam: Rotterdam, The Netherlands, 2017. [Google Scholar]
- Benard, C.; Schlaffer, E. The Man in the Street: Why He Harasses. In Feminist Frameworks; Jaggar, A.M., Rothenberg, P.S., Eds.; McGraw Hill: New York, NY, USA, 1984. [Google Scholar]
- Beebeejaun, Y. Making safer places: Gender and the right to the city. Secur. J. 2009, 22, 219–229. [Google Scholar] [CrossRef]
- Hillier, B.; Sahbaz, O. An Evidence Based Approach to Crime and Urban Design, or, Can We Have Vitality, Sustainability and Security All at Once; Bartlett School of Graduates Studies University College London: London, UK, 2008. [Google Scholar]
- van Nes, A.; López, M. Macro and micro scale spatial variables and the distribution of residential burglaries and thefts from cars: An investigation of space and crime in the Dutch cities of Alkmaar and Gouda. J. Space Syntax 2010, 1, 296–314. [Google Scholar]
- van Nes, A.; Aghabeik, L. Ethnic groups and spatial behaviour in Rotterdam’s neighbourhoods. In Proceedings of the 10th International Space Syntax Symposium, London, UK, 13–17 July 2015; Volume 102, pp. 1–17. [Google Scholar]
- van Nes, A.; De Rooij, L. The perceived safety and spatial behaviour in three different neighbourhoods in Rotterdam. In Proceedings of the 10th International Space Syntax Symposium, London, UK, 13–17 July 2015; Volume 139, pp. 1–19. [Google Scholar]
- Mohamed, A.; van Nes, A. Towards safer greater Cairo. An investigation of Space and Sexual Harassment. In Proceedings of the 11th International Space Syntax Symposium, Instituto Superior Téchnico, Lisbon, Portugal, 3–7 July 2017; Volume 197, pp. 1–8. [Google Scholar]
- Wijkprofiel Rotterdam. Available online: https://wijkprofiel.rotterdam.nl/ (accessed on 13 July 2020).
- van den Berg, M. Femininity as a city marketing strategy: Gender bending Rotterdam. Urban Stud. 2012, 49, 153–168. [Google Scholar] [CrossRef]
- Hillier, B.; Penn, A.; Hanson, J.; Grajewski, T.; Xu, J. Natural movement: Or, configuration and attraction in urban pedestrian movement. Environ. Plan. B 1993, 20, 29–66. [Google Scholar] [CrossRef] [Green Version]
- Ye, Y.; van Nes, A. Measuring urban maturation processes in Dutch and Chinese new towns: Combining street network configuration with building density and degree of land use diversification through GIS. J. Space Syntax 2013, 4, 18–37. [Google Scholar]
Figure 1.
(a) Dispersal of sexual violence cases on neighborhood level in Rotterdam with temporal distribution. (b) Spatialized data of reported cases of sexual assault and rape on the streets. Source: Rotterdam police, January 2012–June 2017.
Figure 1.
(a) Dispersal of sexual violence cases on neighborhood level in Rotterdam with temporal distribution. (b) Spatialized data of reported cases of sexual assault and rape on the streets. Source: Rotterdam police, January 2012–June 2017.

Figure 2.
Top panel: (a) Cool’s main streets (left), (b) land use of buildings (right). Bottom panel: (c) density of entrances per 10 m (left) and (d) degree of inter-visibility of doors and windows on the ground floor (right).
Figure 2.
Top panel: (a) Cool’s main streets (left), (b) land use of buildings (right). Bottom panel: (c) density of entrances per 10 m (left) and (d) degree of inter-visibility of doors and windows on the ground floor (right).

Figure 3.
Top panel: (a) local (left) and (b) global (right) integration analysis. Bottom panel: (c) angular analysis with low (left) and (d) high metrical radius (right) of Cool.
Figure 3.
Top panel: (a) local (left) and (b) global (right) integration analysis. Bottom panel: (c) angular analysis with low (left) and (d) high metrical radius (right) of Cool.

Figure 4.
Top panel: (a) total number of people on the street in Cool during 24 h on an average weekday (left), (b) total number of (young) men in groups (right). Bottom panel: (c) total number of men (left) and (d) total number of women (right).
Figure 4.
Top panel: (a) total number of people on the street in Cool during 24 h on an average weekday (left), (b) total number of (young) men in groups (right). Bottom panel: (c) total number of men (left) and (d) total number of women (right).

Figure 5.
Top panel: (a) Nieuwe Westen’s streets (left) and (b) land use of buildings (right). Bottom panel: (c) density of entrances per 10 m (left) and (d) degree of inter-visibility of doors and windows on the ground floor (right).
Figure 5.
Top panel: (a) Nieuwe Westen’s streets (left) and (b) land use of buildings (right). Bottom panel: (c) density of entrances per 10 m (left) and (d) degree of inter-visibility of doors and windows on the ground floor (right).

Figure 6.
Top panel: (a) local (left) and (b) global (right) spatial integration analysis. Bottom panel: (c) angular analysis with low (left) and (d) high metrical radius (right) of Nieuwe Westen’s street network.
Figure 6.
Top panel: (a) local (left) and (b) global (right) spatial integration analysis. Bottom panel: (c) angular analysis with low (left) and (d) high metrical radius (right) of Nieuwe Westen’s street network.

Figure 7.
Top panel: (a) total number of people on the street in Nieuwe Westen during 24 h on an average weekday (left), (b) total number of (young) men in groups (right). Bottom panel: (c) total number of women (right) and (d) total number of men (left).
Figure 7.
Top panel: (a) total number of people on the street in Nieuwe Westen during 24 h on an average weekday (left), (b) total number of (young) men in groups (right). Bottom panel: (c) total number of women (right) and (d) total number of men (left).

Figure 8.
Top panel: Hillesluis’ (a) most important streets and (b) land use of buildings in the neighborhood. Bottom panel: (c) density of entrances per 10 m and (d) degree of inter-visibility of doors and windows on the ground floor.
Figure 8.
Top panel: Hillesluis’ (a) most important streets and (b) land use of buildings in the neighborhood. Bottom panel: (c) density of entrances per 10 m and (d) degree of inter-visibility of doors and windows on the ground floor.

Figure 9.
Top panel: (a) local (left) and (b) global (right) spatial integration analysis. Bottom panel: (c) angular analysis with low (left) and (d) high metrical radius (right) of Hillesluis’ street network.
Figure 9.
Top panel: (a) local (left) and (b) global (right) spatial integration analysis. Bottom panel: (c) angular analysis with low (left) and (d) high metrical radius (right) of Hillesluis’ street network.

Figure 10.
Total number of people on the street in Hillesluis (a) during 24 h on an average weekday (left), (b) total number of (young) men in groups (right). Below: (c) total number of women (right) and (d) total number of men (left).
Figure 10.
Total number of people on the street in Hillesluis (a) during 24 h on an average weekday (left), (b) total number of (young) men in groups (right). Below: (c) total number of women (right) and (d) total number of men (left).

Figure 11.
Top panel: Pendrecht’s (a) most important streets (left) and (b) land use of buildings (right). Bottom panel: (c) density of entrances per 10 m of street (left) and (d) degree of inter-visibility of doors and windows on the ground floor (right).
Figure 11.
Top panel: Pendrecht’s (a) most important streets (left) and (b) land use of buildings (right). Bottom panel: (c) density of entrances per 10 m of street (left) and (d) degree of inter-visibility of doors and windows on the ground floor (right).

Figure 12.
Top panel: (a) local (left) and (b) global (right) spatial integration analysis. Bottom panel: (c) angular analysis with low (left) and (d) high metrical radius (right) of Pendrecht’s street network.
Figure 12.
Top panel: (a) local (left) and (b) global (right) spatial integration analysis. Bottom panel: (c) angular analysis with low (left) and (d) high metrical radius (right) of Pendrecht’s street network.

Figure 13.
Top panel: total number of people on the street in Pendrecht (a) during 24 h on an average weekday (left), (b) total number of (young) men in groups (right). Bottom panel: (c) total number of women (right) and (d) total number of men (left).
Figure 13.
Top panel: total number of people on the street in Pendrecht (a) during 24 h on an average weekday (left), (b) total number of (young) men in groups (right). Bottom panel: (c) total number of women (right) and (d) total number of men (left).

Figure 14.
Various graphs showing the correlations between physical aspects of the built environment and the occurrence of sexual violence. Graph A presents the distribution of total women in a street in a day according to the land use of street (function). Graph B shows the total number of harassment incidents in relation to types of land use. Graph C shows that the occurrence of harassment incidents increases with the density of entrances. Graph D shows that commercial streets have high densities of harassment incidents. Graph E: commercial streets have higher densities of entrances and inter-visibility than other streets, but only during shops’ opening hours.

Figure 15.
Tables showing the five most dangerous streets in Cool (Tables A and B) and Nieuwe Westen (Tables C and D) in absolute and relative numbers, respectively.
Figure 15.
Tables showing the five most dangerous streets in Cool (Tables A and B) and Nieuwe Westen (Tables C and D) in absolute and relative numbers, respectively.

Figure 16.
Above: streets with (a) a high amount of sexual violence (left), and (b) the number of reports per 100 m (right). Below: number of (c) reports per person (left) and (d) businesses open at night (right) in Cool.
Figure 16.
Above: streets with (a) a high amount of sexual violence (left), and (b) the number of reports per 100 m (right). Below: number of (c) reports per person (left) and (d) businesses open at night (right) in Cool.

Figure 17.
(a) Top panel: streets with a high amount of sexual violence (left), (b) with the number of reports per 100 m (right). (c) Bottom panel: number of reports per person in Nieuwe Westen.
Figure 17.
(a) Top panel: streets with a high amount of sexual violence (left), (b) with the number of reports per 100 m (right). (c) Bottom panel: number of reports per person in Nieuwe Westen.

Figure 18.
Tables showing the five most dangerous streets in Hillesluis (Tables A and B) and Pendrecht (Tables C and D) in absolute and relative numbers, respectively.
Figure 18.
Tables showing the five most dangerous streets in Hillesluis (Tables A and B) and Pendrecht (Tables C and D) in absolute and relative numbers, respectively.

Figure 19.
Top panel: (a) streets with a high amount of sexual violence (b) with the number of reports per 100 m. Bottom panel: (c) the number of reports per person in Hillesluis.
Figure 19.
Top panel: (a) streets with a high amount of sexual violence (b) with the number of reports per 100 m. Bottom panel: (c) the number of reports per person in Hillesluis.

Figure 20.
Top panel: (a) streets with a high amount of sexual violence and (b) the number of reports per 100 m. Bottom panel: (c) the number of reports per person in Pendrecht.
Figure 20.
Top panel: (a) streets with a high amount of sexual violence and (b) the number of reports per 100 m. Bottom panel: (c) the number of reports per person in Pendrecht.


Table 1.
Research operationalization.
| Concept | Variable | Indicators | Scale of Measurement | Source |
|---|---|---|---|---|
| Gender-based sexual violence | Police reports | Distribution in space of reported cases of sexual violence against women in public spaces | Number of reported crimes against women in public spaces per neighborhood | Rotterdam Police |
| Number of reported crimes against women in public spaces per street | ||||
| Distribution of occurrences over time (day, week, month) | Proportion of cases of sexual violence per time of the day, week, and month of the year | |||
| Self-reported victimization | Sexual harassment in own neighborhood | Proportion of women who reported to have been victims of sexual harassment in their own neighborhood | Fischer and Sprado [14] | |
| Neighborhoods with sexual harassment | % of women who indicated a neighborhood in the top 3 where they experienced most sexual harassment | |||
| Spatial features of the built environment | Micro scale | Number of people on the streets | Number of women, men, and young men (teenagers) per street block per time of the day | Own data collection & Van Nes and De Rooij [20] |
| Density of entrances | Number of entrances per street length | |||
| Constituted streets | Degree to which streets are constituted by entrances (none, low, medium, high) | |||
| Inter-visibility of doors and windows in the ground floor (plinth) | Degree of inter-visible doors and windows on each street (none, low, medium, high) | |||
| Land use of buildings | Registration of the main function of the street’s buildings (on ground floor level) | |||
| Macro scale | Spatial integration analyses of the street network | Local and global spatial integration (Space syntax software Depthmap) | Own analysis | |
| Angular choice analyses of the street network | Angular choice with metrical high and low radius (Space syntax software Depthmap) | |||
| Socioeconomic characteristics | Social characteristics | Social network | % of inhabitants who know their neighbors | Rotterdam Wijkprofiel [22] |
| Social integration | % of residents having trouble reading Dutch | |||
| Education | % school drop-outs (18 to 22 years old) without starting qualification | |||
| Economic characteristics | Economic situation | Household income (low, medium, high) | ||
| % Residents with low household income | ||||
| % Households with high income |
Table 2.
Crimes per neighborhood inhabitants, per people on the streets in a weekday, and per total street length in each area.
Table 2.
Crimes per neighborhood inhabitants, per people on the streets in a weekday, and per total street length in each area.
| Neighborhood | Crimes (2012–2017) | Inhab. 2016 | People/Day | Meters of Streets | Crimes/Inhab. | Crimes/People/Day | Crimes/Block (100 m) |
|---|---|---|---|---|---|---|---|
| Cool | 87 | 5086 | 9611 | 13,161 | 0.017 | 0.009 | 0.066 |
| Nieuwe Westen | 26 | 19,224 | 2090 | 26,303 | 0.0014 | 0.012 | 0.010 |
| Pendrecht | 20 | 11,655 | 1292 | 26,013 | 0.0017 | 0.015 | 0.008 |
| Hillesluis | 17 | 11,863 | 1526 | 19,306 | 0.0014 | 0.011 | 0.009 |
Table 3.
Characteristics of the modelled space.
| Neighborhood | Meters of Streets | Street Segments (Blocks) | Streets |
|---|---|---|---|
| Cool | 13,161 | 134 | 48 |
| Hillesluis | 19,306 | 171 | 59 |
| Nieuwe westen | 26,303 | 190 | 75 |
| Pendrecht | 26,013 | 213 | 65 |
| Total | 84,783 | 708 | 247 |
Table 4.
Summary of variables for the Poisson model at block scale.
| Variable | Obs. | Mean | Std. Dev. | Min | Max |
|---|---|---|---|---|---|
| Crimes per block | 708 | 0.196 | 0.81 | 0 | 19 |
| Total women | 708 | 9.75 | 24.82 | 0 | 254 |
| Local angular integration | 708 | 47,838 | 79,836 | 810 | 639,966 |
| Local spatial integration | 708 | 1.21 | 0.096 | 0.84 | 1.47 |
| Crimes per woman | 708 | 0.032 | 0.096 | 0 | 1 |
| Land use of buildings | 708 | 0.55 | 0.66 | 0 | 2 |
Table 5.
Resulting Poisson models at block scale.
| VARIABLES | Crimes per Block (1) | Crimes per Block (2) | Crimes per Block (3) |
|---|---|---|---|
| Total women (Tw) | 0.0118 *** | 0.0126 *** | 0.0174 *** |
| (0.00) | (0.00) | (0.00) | |
| Crimes per woman (Cw) | 3.231 *** | 3.136 *** | |
| (0.38) | (0.35) | ||
| Local spatial integration (Li) | 3.258 *** | 4.294 *** | |
| (1.19) | (1.14) | ||
| Land use (F) | 0.797 *** | 0.725 *** | |
| (0.14) | (0.14) | ||
| Local angular integration (Al) | 2.08 × 10⁻⁶ ** | ||
| (0.00) | |||
| Constant (c) | −6.663 *** | −8.112 *** | −2.383 *** |
| (1.45) | (1.42) | (0.13) | |
| Observations | 708 | 708 | 708 |
Standard errors in parentheses, *** p < 0.01, ** p < 0.05, * p < 0.1.
Table 6.
Summary of variables for the Poisson models at street scale.
| Variable | Obs. | Mean | Std. Dev. | Min | Max |
|---|---|---|---|---|---|
| Crimes (2012–2017) | 247 | 0.57 | 1.75 | 0 | 19 |
| Crimes per person | 247 | 0.019 | 0.094 | 0 | 1 |
| Crimes per woman | 247 | 0.032 | 0.125 | 0 | 1 |
| Total women | 247 | 28.0 | 77.2 | 0 | 721 |
| Local spatial integration | 247 | 1.19 | 0.088 | 0.94 | 1.47 |
| Global spatial integration | 247 | 0.65 | 0.033 | 0.57 | 0.76 |
| Local angular integration | 247 | 33.499 | 64.333 | 810 | 608,091 |
| Global angular integration | 247 | 2.653867 | 1.41 × 10⁷ | 62,614 | 1.51 × 10⁸ |
| land use of buildings | 247 | 0.54 | 0.60 | 0 | 2 |
| Constitutedness | 247 | 0.89 | 0.29 | 0 | 1 |
| Visibility | 247 | 1.53 | 1.16 | 0 | 3 |
| Density of entrances | 247 | 1.20 | 0.63 | 0 | 2.98 |
Table 7.
Resulting Poisson models at block scale.
| VARIABLES | Crimes1217 (1) | Crimes1217 (2) |
|---|---|---|
| Crimes per woman (Cw) | 2.679 *** | 2.890 *** |
| (0.37) | (0.36) | |
| Total women on street (Tw) | 0.00346 *** | 0.00499 *** |
| (0.00) | (0.00) | |
| Local spatial integration (Li) | 6.832 *** | 9.609 *** |
| (1.12) | (1.36) | |
| Land use along the street (F) | 0.996 *** | |
| (0.14) | ||
| Visibility street (V) | −0.141 * | −0.179 ** |
| (0.08) | (0.08) | |
| Local angular integration (Al) | −2.17 × 10⁻⁶ * | |
| (0.00) | ||
| Constant (c) | −10.05 *** | −12.52 *** |
| (1.42) | (1.68) | |
| Observations | 247 | 247 |
Standard errors in parentheses: *** p < 0.01, ** p < 0.05, * p < 0.1.
© 2020 by the authors. Licensee MDPI, Basel, Switzerland. This article is an open access article distributed under the terms and conditions of the Creative Commons Attribution (CC BY) license (http://creativecommons.org/licenses/by/4.0/).
Share and Cite
MDPI and ACS Style
Miranda, J.V.; van Nes, A. Sexual Violence in the City: Space, Gender, and the Occurrence of Sexual Violence in Rotterdam. Sustainability 2020, 12, 7609. https://0-doi-org.brum.beds.ac.uk/10.3390/su12187609
AMA Style
Miranda JV, van Nes A. Sexual Violence in the City: Space, Gender, and the Occurrence of Sexual Violence in Rotterdam. Sustainability. 2020; 12(18):7609. https://0-doi-org.brum.beds.ac.uk/10.3390/su12187609
Chicago/Turabian StyleMiranda, Julia Vansetti, and Akkelies van Nes. 2020. "Sexual Violence in the City: Space, Gender, and the Occurrence of Sexual Violence in Rotterdam" Sustainability 12, no. 18: 7609. https://0-doi-org.brum.beds.ac.uk/10.3390/su12187609
Note that from the first issue of 2016, this journal uses article numbers instead of page numbers. See further details here.