Article

Multi-Objective Optimization of Building Life Cycle Performance. A Housing Renovation Case Study in Northern Europe

by
Francesco Montana
1,*,†,
Kai Kanafani
2,†,
Kim B. Wittchen
2,
Harpa Birgisdottir
2,
Sonia Longo
1,
Maurizio Cellura
1 and
Eleonora Riva Sanseverino
1
1
Department of Engineering, University of Palermo, 90133 Palermo, Italy
2
Department of the Built Environment, Aalborg University, 2740 Copenhagen, Denmark
*
Author to whom correspondence should be addressed.
These authors contributed equally to this work.
Sustainability 2020, 12(18), 7807; https://0-doi-org.brum.beds.ac.uk/10.3390/su12187807
Submission received: 30 August 2020 / Revised: 17 September 2020 / Accepted: 17 September 2020 / Published: 22 September 2020

Abstract

:
While the operational energy use of buildings is often regulated in current energy saving policies, their embodied greenhouse gas emissions still have a considerable mitigation potential. The study aims at developing a multi-objective optimization method for design and renovation of buildings incorporating the operational and embodied energy demands, global warming potential, and costs as objective functions. The optimization method was tested on the renovation of an apartment building in Denmark, mainly focusing envelope improvements as roof and exterior wall insulation and windows. Cellulose insulation has been the predominant result, together with fiber cement or aluminum-based cladding and 2-layered glazing. The annual energy demand has been reduced from 166.4 to a range between 76.5 and 83.7 kWh/(m2 y) in the optimal solutions. The fact that the legal requirements of 70 kWh/(m2 y) are nearly met without building service improvements indicates that energy requirements can be fulfilled without compromising greenhouse gas emissions and cost. Since the method relies on standard national performance reporting tools, the authors believe that this study is a preliminary step towards more cost-efficient and low-carbon building renovations by utilizing multi-optimization techniques.

Graphical Abstract

1. Introduction

The European building sector is consuming a considerable amount of energy and raw materials compared with other economic sectors. Building operation accounts for about 40% of the energy consumption and 36% of the Greenhouse Gas (GHG) emissions in the European Union (EU) [1]. Furthermore, the construction sector is generating 38% of the total waste [2] and consuming 32% of material resources used in the EU [3].
In order to mitigate environmental impacts related to its energy use, the EU has adopted a short and a long-term climate and energy framework. The EU target for 2030 includes a reduction of GHG emissions by 40% related to 1990 levels, a minimum renewable share of 32% in primary energy production, and 32.5% improvements in energy efficiency. The EU long-term goal is a climate-neutral economy by 2050 [4]. These targets were transposed on each Member State energy strategy with voluntary targets, and the Denmark currently aims at a 70% reduction of GHG emissions by 2030 [5].
The Energy Performance of Buildings Directive (EPBD) has been the main driver in the EU to increase energy efficiency of new buildings towards Nearly Zero Energy Building (NZEB) level in 2020 [6]. However, cutting GHG emissions of existing buildings has a major potential for the building sector to contribute to achieving climate policy targets [7,8]. Since almost 75% of the existing building stock is energy inefficient and about 35% of buildings in EU are at least 50 years old [1], the latest version of the EPBD is considering renovations as the primary target for increasing building stocks energy efficiency [9]. Furthermore, 57% of the EU building activity is related to building renovation [10].
The NZEB efficiency level is currently considered as the feasible lower limit of operational energy levels for new buildings [11]. The currently non-regulated embodied impacts, accounting for about half of the total GHG emissions related to the current low operational energy level [12,13], have a potential for further GHG reduction. While renovations have considerably less impacts related to materials compared with new buildings, the major GHG mitigation potential lies in cutting operational energy [14]. However, in order to fully utilize this potential, these reductions can be optimized by mitigating the embodied impacts associated with them.
A crucial factor for real life GHG reductions is including economic performance indicators. In order to achieve the NZEB energy level, the European Commission recommends a cost-optimization approach [15,16]. Accordingly, cost-optimization is suggested for building renovation, ideally by comparing up to forty different building configurations [17].
While operational and embodied GHG emissions and their cost are key performance indicators for pursuing climate targets, building design includes many more aspects. Traditionally, these requirements are handled by design iterations involving skill, rules of thumb, and quantitative analyses of individual performance indicators. However, there exist more advanced approaches for balancing multiple, quantifiable variables.
In parametric analysis, the choice of input parameters is crucial, since it determines the effort put into the calculation and the number of iterations to be made. Manually implemented parameter variations are handy, when a small number of parameters are included and when the range of variation is low, requiring knowledge of the effect of input parameters on the result.
Parameters variation might be automated with computational tools. Depending on the number of input quantities and variation ranges, these operations can produce large solution spaces and require a long calculation time, since variations are calculated one by one. To reduce this effort, algorithms for the investigation of the variables space may be employed, capable of assessing only a subset of the possible combinations of variables. One possible solution is to adopt a stochastic logic, randomly evaluating the variables and identifying the best solutions at the end of the study. As an alternative, optimization techniques may be adopted using smart investigation algorithms capable of understanding which variable values are better than others from one iteration to the subsequent, thus converging to the optimal solution.

1.1. Literature Review

A few works on the minimization of buildings impacts in Northern European climate were published in past years, although most of them are parametric analyses rather than optimization studies, while one study was based on a stochastic comparison of alternatives. In [18], the optimal mineral wool insulation level of a single family house was determined through a parametric analysis. The building’s heating requirement was derived from national minimum requirements, and several heating sources were compared, while the selection criteria were fourteen Life Cycle Assessment (LCA) indicators. Additionally, ref. [19] performed a parametric analysis, evaluating the effect of six behavioral modifications through a dynamic simulation in IDA-ICE [20], such as limiting the set point temperatures of radiators or night ventilation techniques. In [21], one of the most comprehensive studies in this brief review, a stochastic model was implemented coupling energy rating software Be15 (the predecessor of Be18 [22]) and dynamic simulations in BSim [23] with a tool for sensitivity analyses, adopting a Monte Carlo method. This approach allowed us to parametrically compare 10,000 combinations of variables related to building envelope (e.g., walls and windows transmittance and windows surface) or equipment (e.g., photovoltaic, mechanical ventilation rate). Another parametric study was performed in [24], where a dynamic simulation using EnergyPlus [25] was coupled with OpenStudio [26], a plug-in able to perform parametric analyses, in order to compare eight retrofit packages related to envelope features, efficient equipment, or sensors installation. This study was repeated in [27], adopting the same approach but on different case studies. Harkouss et al. [28] present an optimization employing envelope, energy system, and cost parameters on Nearly Zero Energy Buildings. In a successive study, the authors [29] optimize the building energy systems and recommend optimal design solutions for four different climatic regions. One multi-objective optimization of building performance is conducted in Danish climate conditions [30]. The study focusses on optimizing the building shape in early design using the parameters operating energy, investment costs, visual and thermal comfort, and applying the SPEA2 algorithm. Two subsequent, studies [31,32] apply a genetic algorithm for optimizing the building envelope and services, respectively, in a new detached home in the colder climate of Southern Finland. These works have a life cycle scope including both operating and embodied energy. Another Finnish study is performed on a multi-story apartment building renovation applying multi-objective optimization, including operating and embodied CO2 emissions and energy [33]. The authors include design variables for both envelope and building services, leading to an overall similar scope compared with this work. A main difference lies in the greater focus of a more comprehensive analysis of operating energy and choice of energy system. However, the expected development of GHG emissions from national energy production is not included in the life cycle approach. Since energy production is likely to decrease emissions, the results might overestimate the need for insulation and energy system efficiency. Some detailed information on embodied impacts such as system boundary, component service life, and replacement rates are lacking.
Concluding from this literature review, a single study was found including both operational and embodied energy, as well as greenhouse gas emissions, together with investment and replacement cost applied to a large-scale building renovation.

1.2. Study Objective and Design

This study aims at developing a method for the optimization of operational and embodied environmental and cost parameters in building renovations. A multi-objective optimization algorithm was applied on the renovation of a multi-story housing block, identifying the optimal combinations of interventions for the refurbishment in terms of operational and embodied impacts and cost. The optimization uses a set of typical interventions for improving the envelope and building services. For each intervention, some variants in terms of materials, insulation level or technology are developed. The method applies Danish standard performance reporting tools in order to make a first step towards an applicable solution for the building industry. In the case study, the method is demonstrated and tested in a Danish apartment building renovation. Furthermore, the results were compared with the current regulation on environmental building performance, which is presently focusing on operational energy reductions only. According to the literature review provided, it can be concluded that the innovative content of the present work relies on the combined optimization of operating energy, embodied environmental impacts, and cost, while including both building envelope and services in the study and applying them to the renovation of an existing building, allowing a comprehensive comparison of renovation interventions to identify an optimal configuration.

2. Materials and Methods
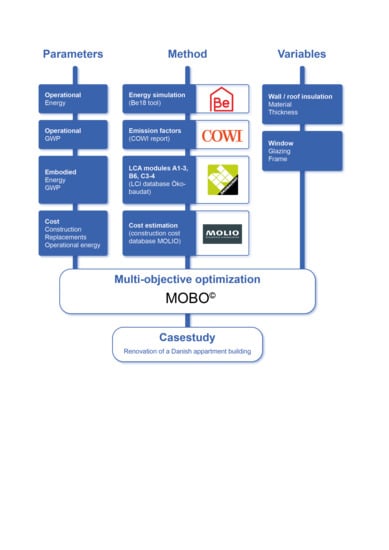
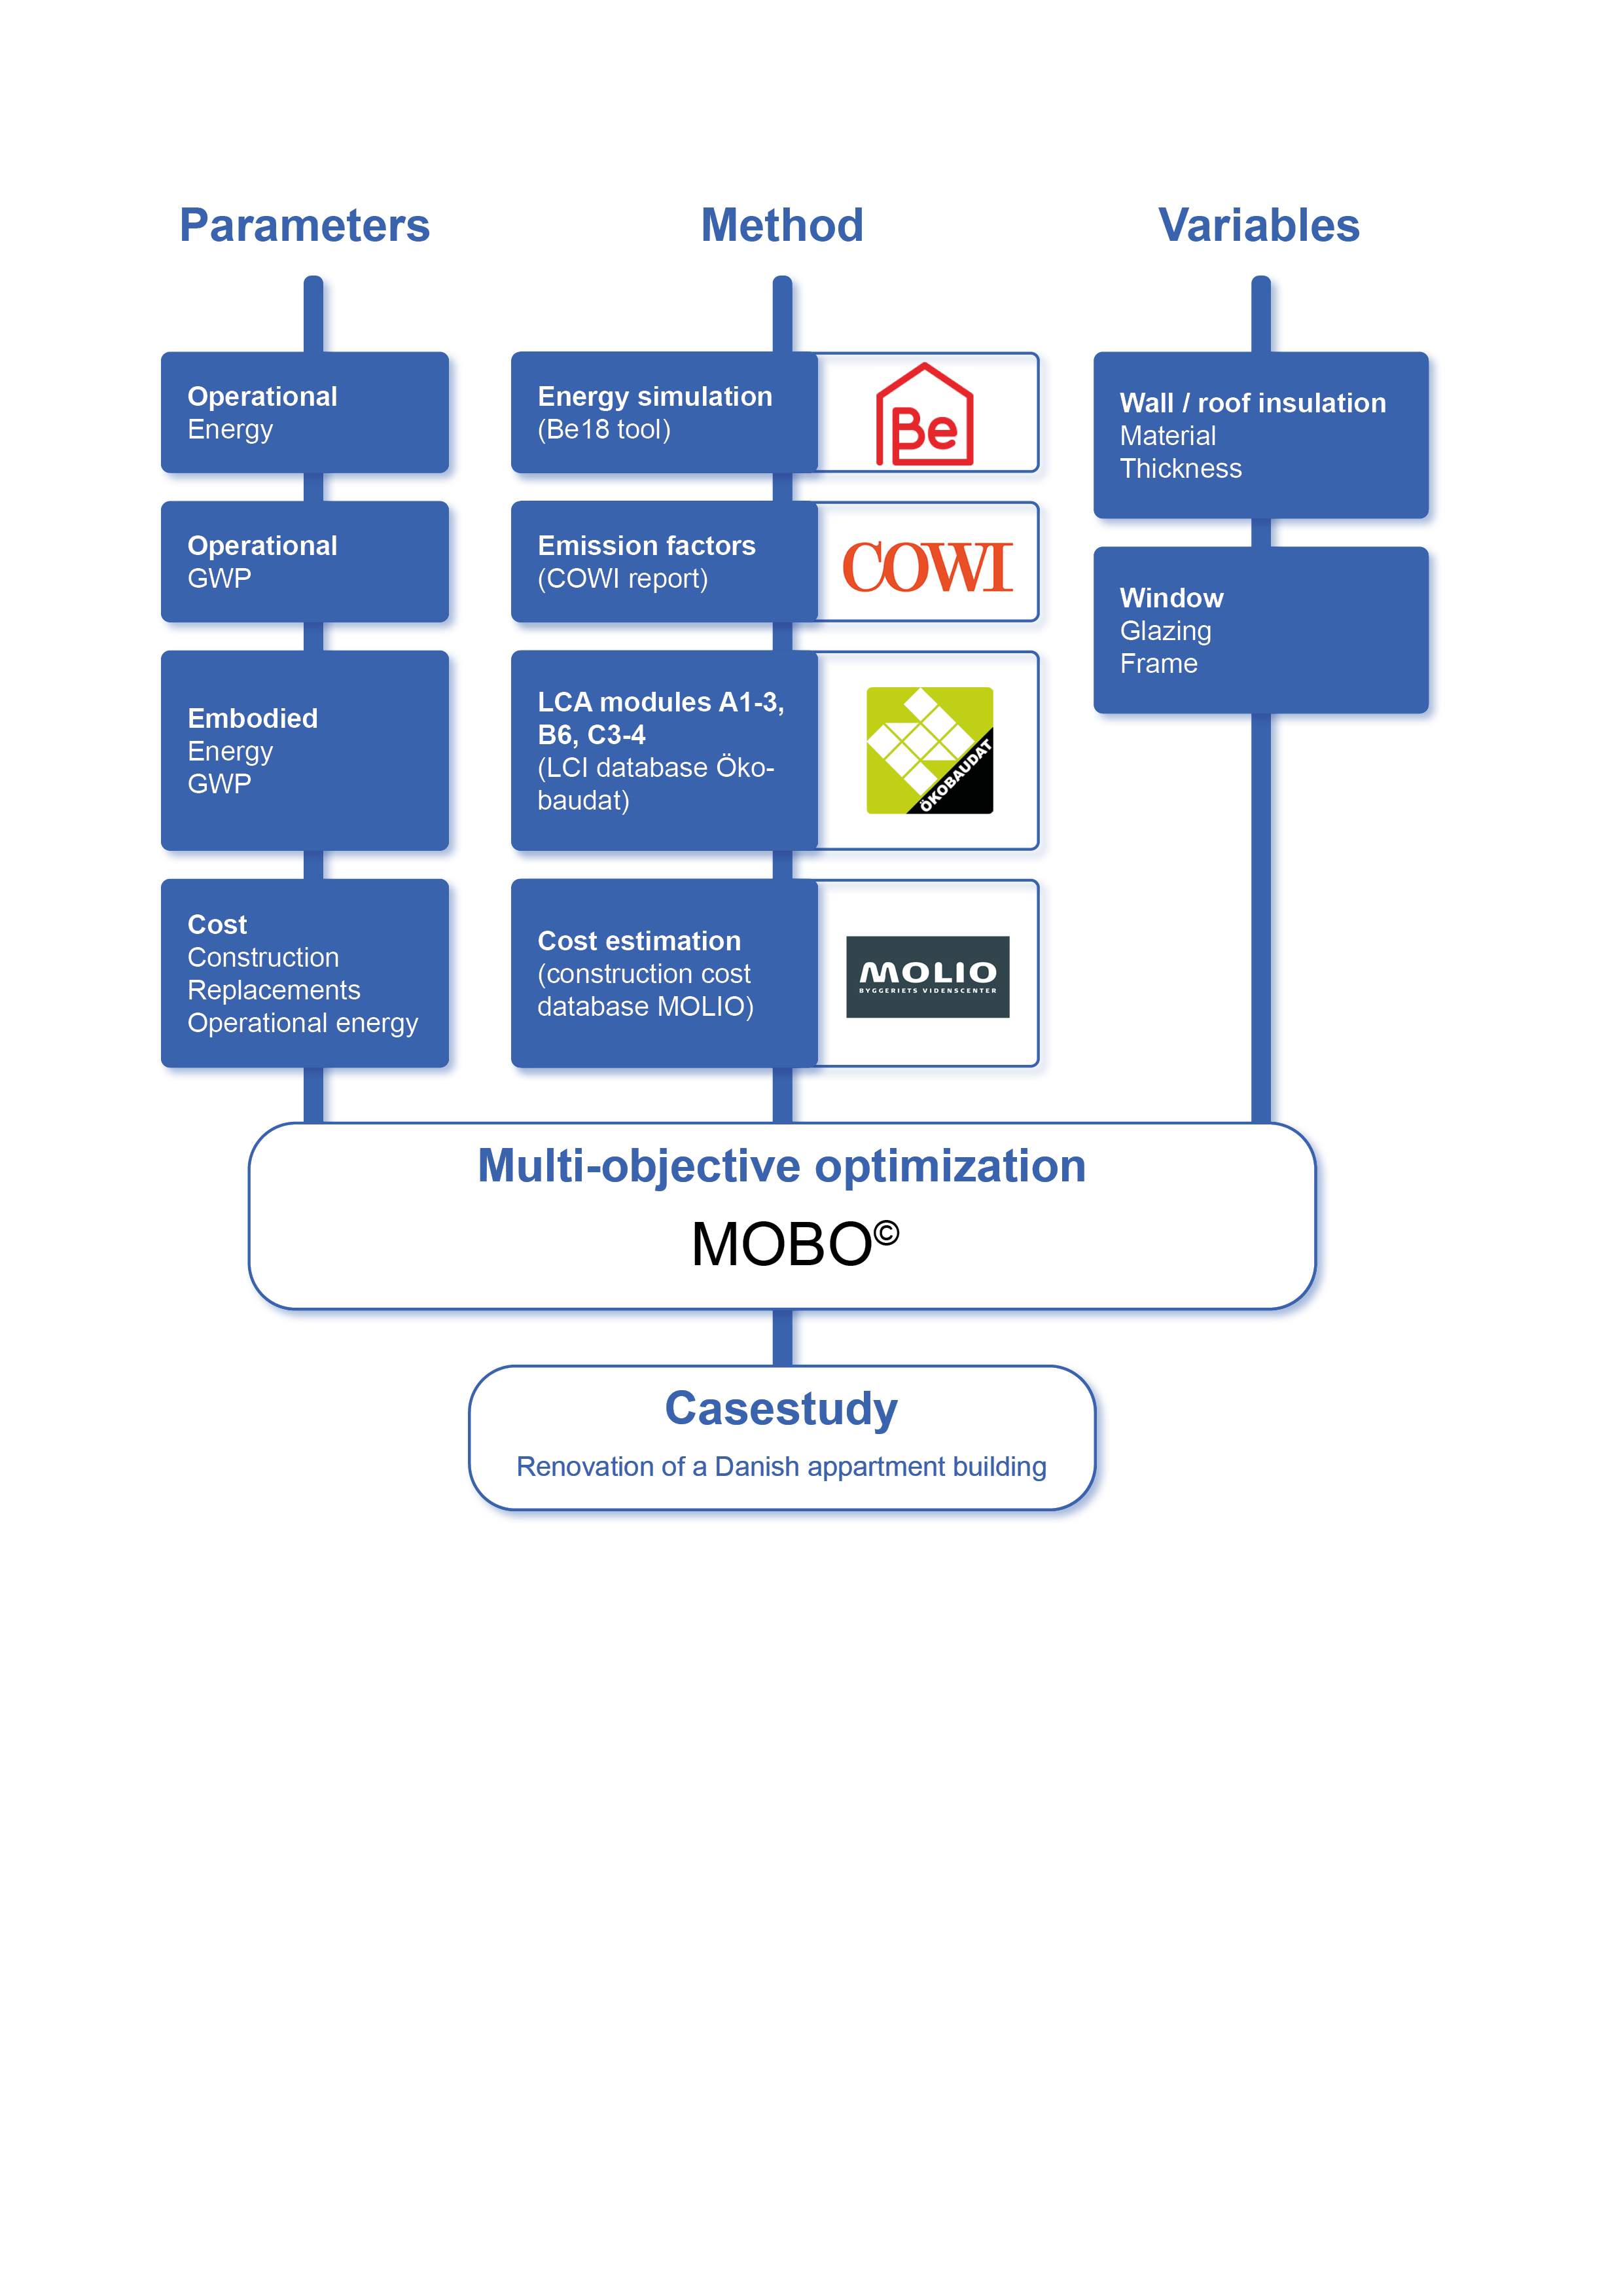
2.1. Approach

This paper presents a multi-objective optimization framework aiming at improving decision making towards low-carbon building design. The presented optimization framework combines a series of techniques with their respective methodological approaches. As laid out in the flowchart (Figure 1), the building performance simulation, the life cycle assessment, the economic analysis, and the optimization were combined in a unique simulation process to provide the optimal design actions. These can be applied to the preliminary design of new buildings or to renovations. The optimization software selects the variables of the problem, namely the interventions to apply to the building, at each iteration for creating a new building model. Then, the energy rating tool assesses the operating final energy demand, adopting a simulation-based optimization approach. The objective functions of the problem are based on the operating final energy demand and on the impacts and costs of the selected interventions.

2.2. Operating Energy

The method for calculating energy demand is based on the regulatory context of the building. It is a national implementation of, among others, ISO 13790:2008 standard and European regulation, and complies with the Danish building regulations [34] and guidelines [22]. Energy demand was calculated using the Be18 tool [35]. Be18 is the legally mandatory tool for calculating new buildings’ energy demand in Denmark and corresponds to the available case study calculation, which has been used as one of the sources. The tool is an energy performance compliance checking tool based on a monthly quasi-steady state calculation, based on the EN/ISO 13790:2008 international standard [36]. Although this method is less detailed than a dynamic simulation, its results in cold climates proved to be sufficiently reliable and accurate, and at the same time requiring a much lower computational time [37]. Furthermore, the adoption of Be18 ensures the compliance with Danish regulation. The calculation scope includes energy demand related to space heating and domestic hot water. Other operating energy consumers such as lighting or appliances are not considered according to the legal rules for residential buildings. All preconditions such as internal heat gains, occupancy, and temperatures also follow the standard conditions used for compliance check.
The building components’ thermal performance was calculated according to [38], and to the corresponding international standards ISO 6946:2007 [39], ISO 10077-1:2006 [40], and ISO 13370:2007 [41].
The ventilation system has been excluded from the optimization and was set as a constant heat recovery efficiency of 0.8 according the minimum requirements in the Danish building regulations. Since, from preliminary simulations, the indoor temperature never exceeds 26 °C, no cooling system design was evaluated in the optimization. Mutual shading of the three buildings has not been considered either. The thermal transmittance and solar energy transmittance of windows were differentiated only related to glazing, neglecting differences related to frames.

2.3. Life Cycle Assessment (LCA)

LCA is an approach for assessing life cycle environmental performance of buildings or parts of it. The applied definition uses the EN 15978:2011 [42] terminology. The selection of included life cycle modules (Table 1) for LCA and Life Cycle Costing (LCC) depart in the common LCA and LCC practice for new buildings in Denmark as implemented in the national tools LCAbyg [43], LCCbyg [44], and the Danish DGNB program [45]. The incomplete life cycle applied for LCC and LCA, i.e., not including repair or maintenance, is common in building LCA [46]. The following study has the objective of comparing performance and cost of renovation solutions, and the renovated building is chosen to start with a new life cycle, while omitting the existing material’s end-of-life impacts and cost. The life cycle therefore starts with the production of renovation products (A-module), while later replacements (B4) follow the standard nomenclature. Environmental impacts are further calculated for operational energy use (B6) and End-of-Life (C3–4).
Life cycle cost includes the production of renovation materials (A1–3), construction (renovation, A4–5), replacements (B4), and operational energy use (B6). End-of-Life costs related to replacements and building demolition are not included.
The source for embodied environmental impacts are generic and average data from Ökobaudat 2016 [47] based on EN 15,804 [48], due to the focus on the design stage, where products are usually not specified yet. This database is the regular source for generic data in Denmark and is available in the tool LCAbyg [49]. The reference period covers 50 years, starting from the beginning of the renovation.
Definitions for component service life are taken from the Danish national guidelines for life cycle environmental and costing assessments [50]. Replacements of components are given in natural numbers. The limitation is based on the rule that replacements are omitted when the remaining reference period is equal or below one third of the component’s service life.
This study only calculated the Global Warming Potential (GWP) and Total Primary Energy use (PEtot). Both of these are relevant for the respect of current climate policies [4], and are also generally often used internationally in building LCA studies [51,52], and in particular in simplified LCA approaches in [53]. Furthermore, too many indicators would increase the risk of not achieving optimal solutions in the optimization.

2.4. Life Cycle Costing (LCC)

As stated in Table 1, the economic analysis included the major cost factor investments of renovation (A1–A3, A5), operating (B6), and replacement (B4) costs, through the evaluation of the Net Present Value. This cost function can be considered as a rough estimation of life cycle costs related to the building, since it does not include terms as recurring costs or residual values, but it was already employed in previous studies [28,29,54]. Investments cover both labor and material cost for the renovation and later replacements.
In order to compare the investments, the real interest rate approach was adopted, using an average inflation rate for envelope materials and equipment and another average value for energy supply. The residual value of investments after the end of the reference period was neglected. The operating costs related to energy bills were evaluated through the Uniform Series Present-Worth Factor (USPWF) [55], as in Equation (1):
U S P W F = ( 1 + r ) n 1 r · ( 1 + r ) n
where r is the real interest rate, and n is the useful life of the building.

2.5. Optimization

Optimization techniques and algorithms, in general terms, allow for the identification of the optimum (minimum or maximum) value of a function, known as objective function, whose value depends on one or on a set of variables. Algorithms can be classified according to the nature of the functions, the equations describing the problem, the number of objectives, or the investigation method of the search space. Building performance optimization generally involves multi-variable problems, i.e., the objective function depends on many variables represented by thermal transmittances of the envelope components or performance of technical components as heating, ventilation, and air conditioning or renewable energy systems. The objective functions usually adopted are related to four main categories: Energy consumption, cost, environmental impact, and dwellings comfort (thermal, visual, or acoustic). Depending on the target of the study, when more than one aspect should be improved, the objective functions can be optimized separately (single-objective optimization) or in a unique process (multi-objective optimization). Regarding multi-objective optimization, since this kind of study usually involves at least two conflicting functions, the output is represented by a set of compromise solutions, known as Pareto Front, unless some preference criteria between objective is specified (a priori methods). Since these studies often involve many variables, suitable software has been developed to help researchers and designers identify the optimal combination of solutions to implement, with the most common being GenOpt or MATLAB [56].
Some popular optimization algorithms are the genetic algorithms, based on the reproduction mechanisms of living beings. Indeed, genetic algorithms assume building configurations as parents and their features as genes. Starting from a generation of parents, buildings genes are mixed in the crossover phase in order to produce a new generation of solutions. This mechanism is repeated for a predetermined number of generations, since no convergence criteria are usually applied. The feature of producing many building configurations for each generation is referred to as population-based algorithms, and this is a mandatory requirement for multi-objective optimization algorithms. Moreover, since the exploration of search space is not related to mathematical method (derivatives-free algorithms), genetic algorithms can easily handle discontinuous or highly non-linear problems [57].
Nowadays, many optimization tools are able to connect to Building Performance Simulation (BPS) tools in order to identify the best building configuration. Some of these were developed as add-ins to specific software, as TRNOPT for TRNSYS or Opt-E-Plus and jEPlus + EA for EnergyPlus, while other tools can be coupled with any BPS, such as MOBO.
The optimization problem was described in MOBO, a building performance optimization software tool developed at Aalto University. MOBO is able to read and write text-based file formats, such as building physic models usually are. MOBO sets the values of variables in the text-based file, gives to the BPS the command to start the simulations and collects the results for assessing the optimality of the solution [58]. In this study, MOBO has been used for setting values for the energy demand calculation in Be18 and collecting the produced result files in order to set new values according to the employed optimization algorithm. A supplementary python script has been developed for automating the generation of Be18 output files.
The mathematical model for the optimization is an improved version of a previous project [59,60]. Improvements are the inclusion of transparent components in the envelope optimization framework, also allowing different values according to the orientation, and the optimization of equipment for the energy demand fulfillment together with envelope-related variables. The mathematical problem is a mixed integer, non-linear, constrained multi-objective optimization problem, since some of the variables are Boolean, and equality and inequality constraints were imposed. The complete model for optimization studies 1 and 2 is reported in the Appendix A.

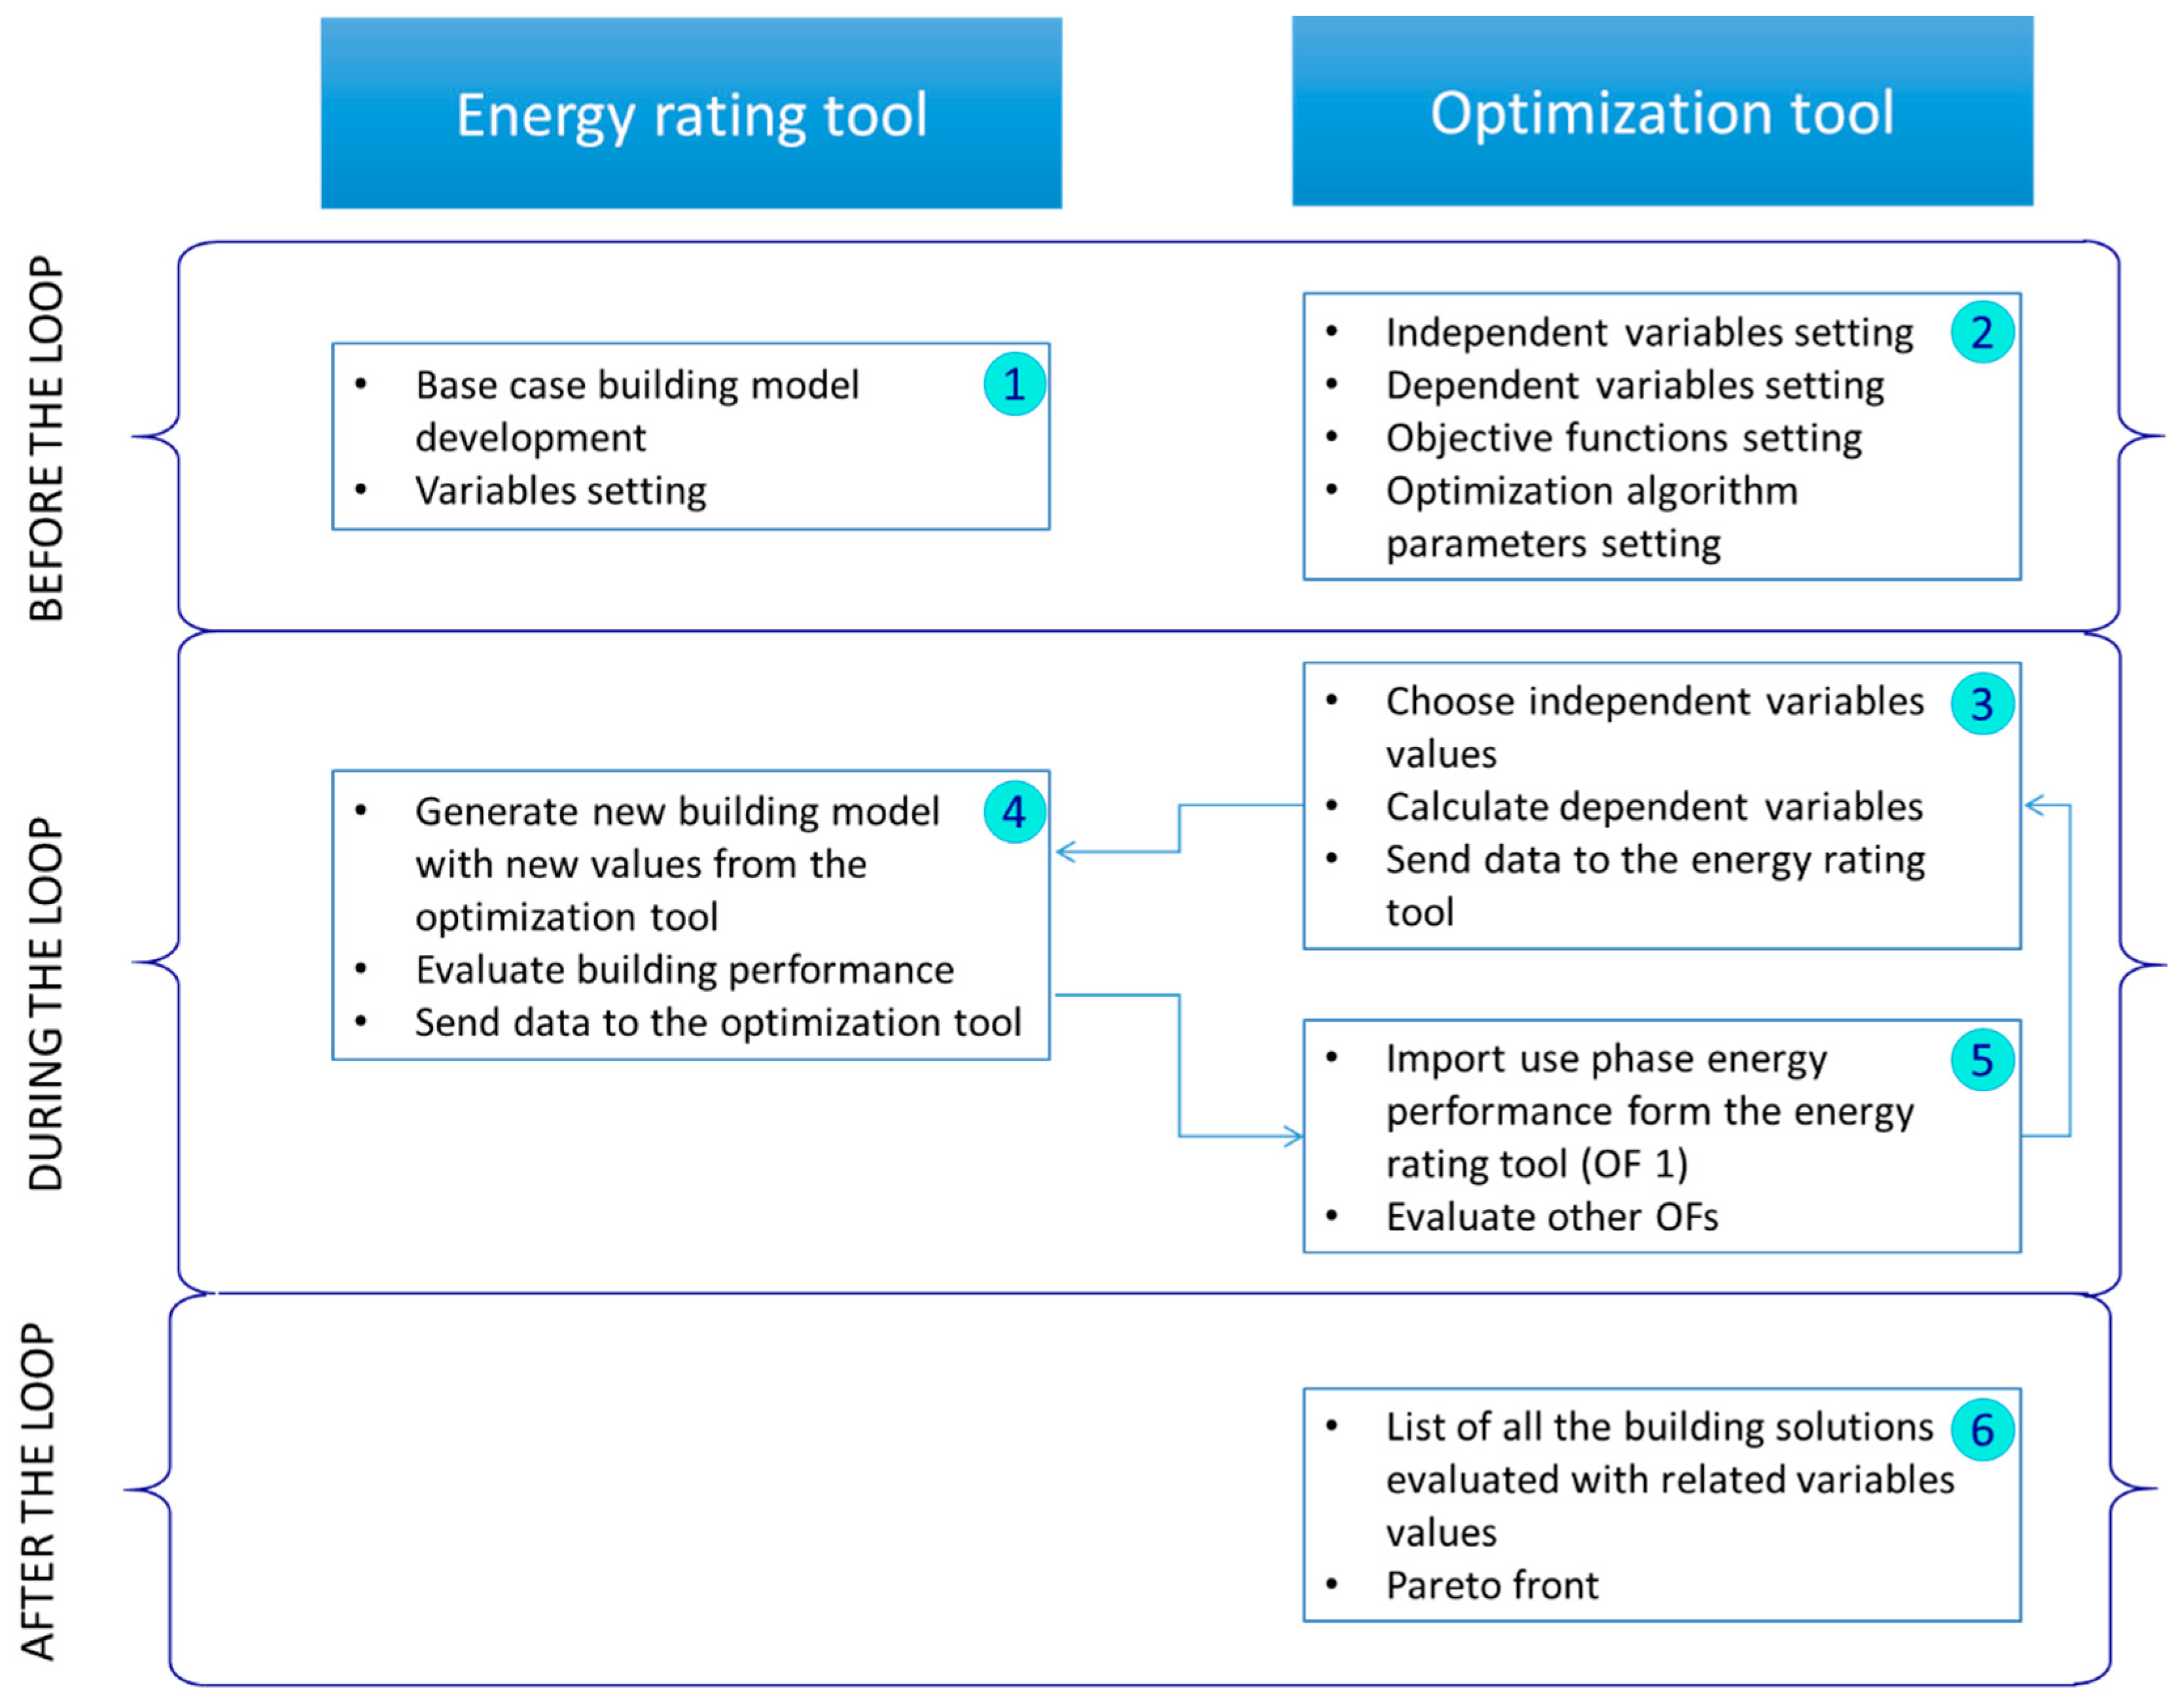
3. Case Study: The Renovation of an Apartment Building

The study was applied on the social housing block Traneparken, which is located in Hvalsø, Denmark. Erected in 1969, the complex consists of three 3-level buildings based on an identical construction principle but different in length, as shown in Figure 2f. In 2011–12, the block underwent an extensive renovation aimed at improving the architectural expression of the façade and cutting operational energy demand considerably. The refurbishment has been evaluated in the International Energy Agency Annex 56 framework [61]. Furthermore, the research has been reported in an extensive report [62], which has been used as a major source of building specifications for this study.
This study only refers to block B (as indicated in Figure 2f), which includes 24 apartments on a heated floor area of 2048 m2 and a heated basement area of 731 m2. The building is a typical Danish apartment building from sixties, with prefabricated concrete sandwich elements in combination with light panel wall sections, in which the windows were integrated, as shown in Figure 2b,d. The basement walls and deck are in situ concrete, and the sloped roof is clad with fiber cement boards. The main building element insulation levels before the renovation are given in Table 2. The rectangular plan shape is oriented East–West. The window to wall ratio is 0.18, and the surface over volume ratio is 0.31 m2/m3.
Space heating and domestic hot water are supplied by district heating through a heat exchanger with three 300 L tanks for domestic hot water storage. The apartments are naturally ventilated in combination with a mechanical exhaust system in the bathrooms and kitchens.
The optimization interventions chosen for the present study are based on the interventions applied in the actual 2011–12 renovation. They included additional façade insulation and a new brick cladding, new roof insulation and cladding, and the new triple-glazed windows and doors. The new façades are shown in Figure 2c,e, while the list of interventions and a comparison of the thermal transmittance is provided in Table 3. The ventilation was improved by a mechanical ventilation system with heat recovery and user-driven demand control. A 33-kWp photovoltaic (PV) plant was installed on the top of the building, facing south, with an expected annual production of 32 MWh.
The interventions are expected to reduce the annual heating energy demand from 166.4 to 77.2 kWh/m2, corresponding to a reduction from 66,700 in 2012 to 45,500 € for energy bills.
This paper describes two optimization studies, the first minimizing the energy loads through interventions on the envelope and the second including variables related to both the envelope and the building services. The division was made in order to retrieve separate results for the passive or demand part of the renovation first, which is a consultancy practice often applied, while the second study can be regarded as a whole building optimization.
In the first optimization, related to the building envelope, the operational energy demand has been left independent on the energy source, since it depends on the equipment technology. As a consequence, the first study only includes the final energy demand related to building operation. In the second study, where the energy source is also assessed as a variable, operating cost, Global Warming Potential (GWP), and Total Primary Energy (PEtot) related to the operational energy demand were included in the respective objective functions (see arrows in Table 4). The investment cost and the embodied impacts (GWP and Primary Energy) related to the refurbishment interventions were minimized in both the optimizations.
The study was based on the case of an existing renovation, and many of the design options are related to this case. Nevertheless, the developed methodology is expected to be transferable to building design in general, both new and existing buildings and different building types.
The chosen refurbishment interventions take the actual interventions adopted for the renovation case as a starting point. These interventions have then been varied in thickness (insulation), materials (claddings), and type (energy services), thereby extending the space of solutions in order to establish a set of independent variables for the optimization. The actually applied solution in the renovation case thereby becomes one among other possible results in the optimization study.
A list of all the envelope interventions type in the insulation, cladding, windows and glazing, and balconies glazing categories is given in Appendix A. For each category (insulation, cladding, window frame and glazing, balconies glazing), there are at least two possible variants. Regarding insulation, these variants are also assessed with different thicknesses. All the values are referred to the functional equivalent.
The renovation interventions for the roof and façade include additional insulation and cladding. Whereas the optimization must include one type of cladding, the level of additional insulation may vary between 0 and 40 cm for concrete walls and roof, and is divided into discrete intervals of 5 cm. Since some horizontal sections of the façade, the exterior light walls, are set back by 9 cm from the outer surface of the concrete sandwich, as shown in Figure 2a), these sections are assumed a minimum insulation level of 9 cm for filling out the cavity, achieving a planar surface, the resulting insulation thickness varying between 9 and 44 cm. Regarding the cladding material, the bricks thickness was set equal to 0.108 m and its conductivity to 0.89 W/(m·K). The thermal resistance of the other claddings was neglected, as explained in the Appendix A. Windows were divided into a set facing North and another facing South, in order to allow different solutions for each one. According to practical experience and narrowing the number of variable combinations, heated spaces are restricted to either double or triple glazing, while unheated spaces such as staircases and balconies may also have single glazing. The physical and thermal properties of main envelope materials are provided in the Supplementary Material.
The life cycle inventory includes components of the building envelope and service equipment as well as impacts from energy supply. Roof and façade renovation components are subdivided into insulation and cladding. The division into functional design layers allows for optimizing insulation and cladding separately. The original case consists of several window types. However, a standardized window frame/glazing ratio complying with the calculation rules in the building regulations [34] have been used instead. The parameters making up the life cycle inventory are provided as Supplementary Material.
Some exceptions from the building regulations and guidelines were made in order to simplify the building model for the optimization. Firstly, variations of shading, and thus solar gains and daylight, which may occur as a consequence of varying wall thickness in correspondence of the windows, have been neglected. Additionally, the dependence of thermal bridges on the insulation thickness and cladding systems has been omitted as well. For simplifying the calculation of unheated spaces, the insulation of the roof area above the staircases is excluded from the optimization and instead insulated statically according to legal minimum requirements. Opaque components of the unheated balconies including facade light panels, roof, and floor, are excluded from the optimization as well and assumed insulated to a level of transmittance of 0.6 W/m2·K. Where necessary, the building model used for the analysis steps have been harmonized regarding conflicting information on dimensions and floor area.
Based on generic assumptions in the Danish national life cycle costing tool LCCbyg [44] in the 2019 version, cost for replacement and future energy cost were extrapolated using an interest rate of 5%, and the present value is calculated using a discount rate of 4% for building materials and for energy vectors (electricity, natural gas, and district heating) and 2% for equipment.
Costs related to building components were based on the Danish building price database [63]. Costs and impacts related to scaffolding, digging works for basement wall renovation, balconies’ structural elements, as well as removal of the existing heating unit, are assumed to be identical for all solutions and thus neglected. Since the building is already equipped with a basement for the heating system and equipped with water piping and electrical components for the existing service equipment, these elements were neglected as well.
The assessment of some impacts and cost with influence for the optimization was omitted for simplification reasons. They include the need for structural support for the brick cladding variant, compared to lighter cladding solutions, which do not need such support. Further, the 5 cm insulation intervals do not reflect actual product dimensions and are combined neglecting the need for a substructure for thicker insulation dimensions. The cost for changing the heat source from the present district heating to, i.e., gas between the public grid and the building are not included either.
All envelope interventions include a bulk discount, interpolated from the available cost data intervals in the price database. In the cost for windows, the bulk discount is neglecting the possibility of no balcony glazing in the optimization.
The building services for space heating and domestic hot water include the most used solutions in Denmark. Furthermore, energy supply through renewables was assessed, including solar thermal collectors for heat production and PV for electricity production. Rules or restrictions for the choice of heat source, i.e., the obligation to use district heating in such areas, are ignored in this study. Nevertheless, the Danish law lets the occupants to regulate the air temperature in every single room of the buildings, thus imposing on them to install centralized heating systems. This requirement imposes to assess only the feasibility of centralized equipment for the whole building, as district heating, air to water heat pump, or natural gas boiler. For these reasons, the study was focused on the assessment of the best technology to be coupled to the currently installed heat exchanger, with a rated power equal to 55 kW. The adopted building service technologies for the supply of electricity, space heating, and domestic hot water represent the most common energy sources for Danish domestic buildings.
Environmental impacts for the supply of electricity, natural gas, and district heating were projected throughout the reference period according to the tool LCAbyg, which are based on a report for the Danish Energy Agency [64]. Since the values are available only for the years 2015, 2020, 2025, 2035, and 2050, a linear trend was assumed between one value and the subsequent for the missing years.
Although the MOBO library includes four algorithms to solve multi-objective problems, namely NSGA II, Pareto Archive NSGA II, Omni-Optimizer, and Random Search, this category of algorithms is known to be not indicated to handle constrained problems [65]. For this reason, many optimizations were performed using different algorithms and related parameters, finding that Omni-Optimizer genetic algorithm [66] with 40 individuals and 200 generations was the most adequate to the problem assessed in this study, providing many solutions in the Pareto Front that satisfied the constraints. The resulting Pareto Front was investigated to understand which kind of renovation solutions should be preferred, after the removal of non-feasible solutions, and the utopia point criterion was adopted to identify the best compromise solution [67]. This criterion is based on the evidence that, in the multi-dimensional space of the objective functions, the origin of axes would represent a building with null values of each objective function, and thus an ideal solution. As a consequence, the lower the Euclidean distance of a building solution is from the origin of axes, the better the renovation actions are, according to the adopted criteria.
Genetic algorithms as Omni-Optimizer allows evaluate many objective functions without attributing a weight to each of them, thus reducing each function’s value independently from its order of magnitude. If one of the objectives is to be preferred with respect to the others, the Pareto front can be subject to a normalization and weighting phase before the selection of the best compromise solution. This practice is sometimes employed also in LCA sector, in order to combine many impact indicators in a single index, in order to make the selection of the best solution for the decision maker easier [68]. Nevertheless, the weighting phase is inherently dependent on the subjectivity of the analyst, and a selection based on the indexes risk to be less transparent than the analysis of each indicator. Since only four objective functions were assessed in the present study, with two of them (embodied energy and embodied global warming potential) being not conflicting, the aim of this research study is to identify the optimal compromise solution, and no weighting was applied to the solutions.
The mutation rate for the optimization algorithm was evaluated according to the formula derived by Mühlenbein, which states that the mutation rate should be set equal to the reciprocal of the bit-string length [69]. For our study, this criterion was evaluated through the following Equation (2) [70]:
m r = 1 10 · N C + log 2 i = 1 N I V I i
where mr is the mutation rate, NC is the number of continuous variables (that are codified through 10 bits per variable), NI is the number of integer variables, and VI is the number of values that each integer variable can assume. This formula provides values allowing to change a gene per each offspring and per each generation, on average, as it is common practice [71]. In this work, mutation rate was set equal to 0.01515 for Optimization Study 1, and to 0.01053 for Optimization Study 2, while crossover rate was set equal to 0.9 in both studies.

4. Results

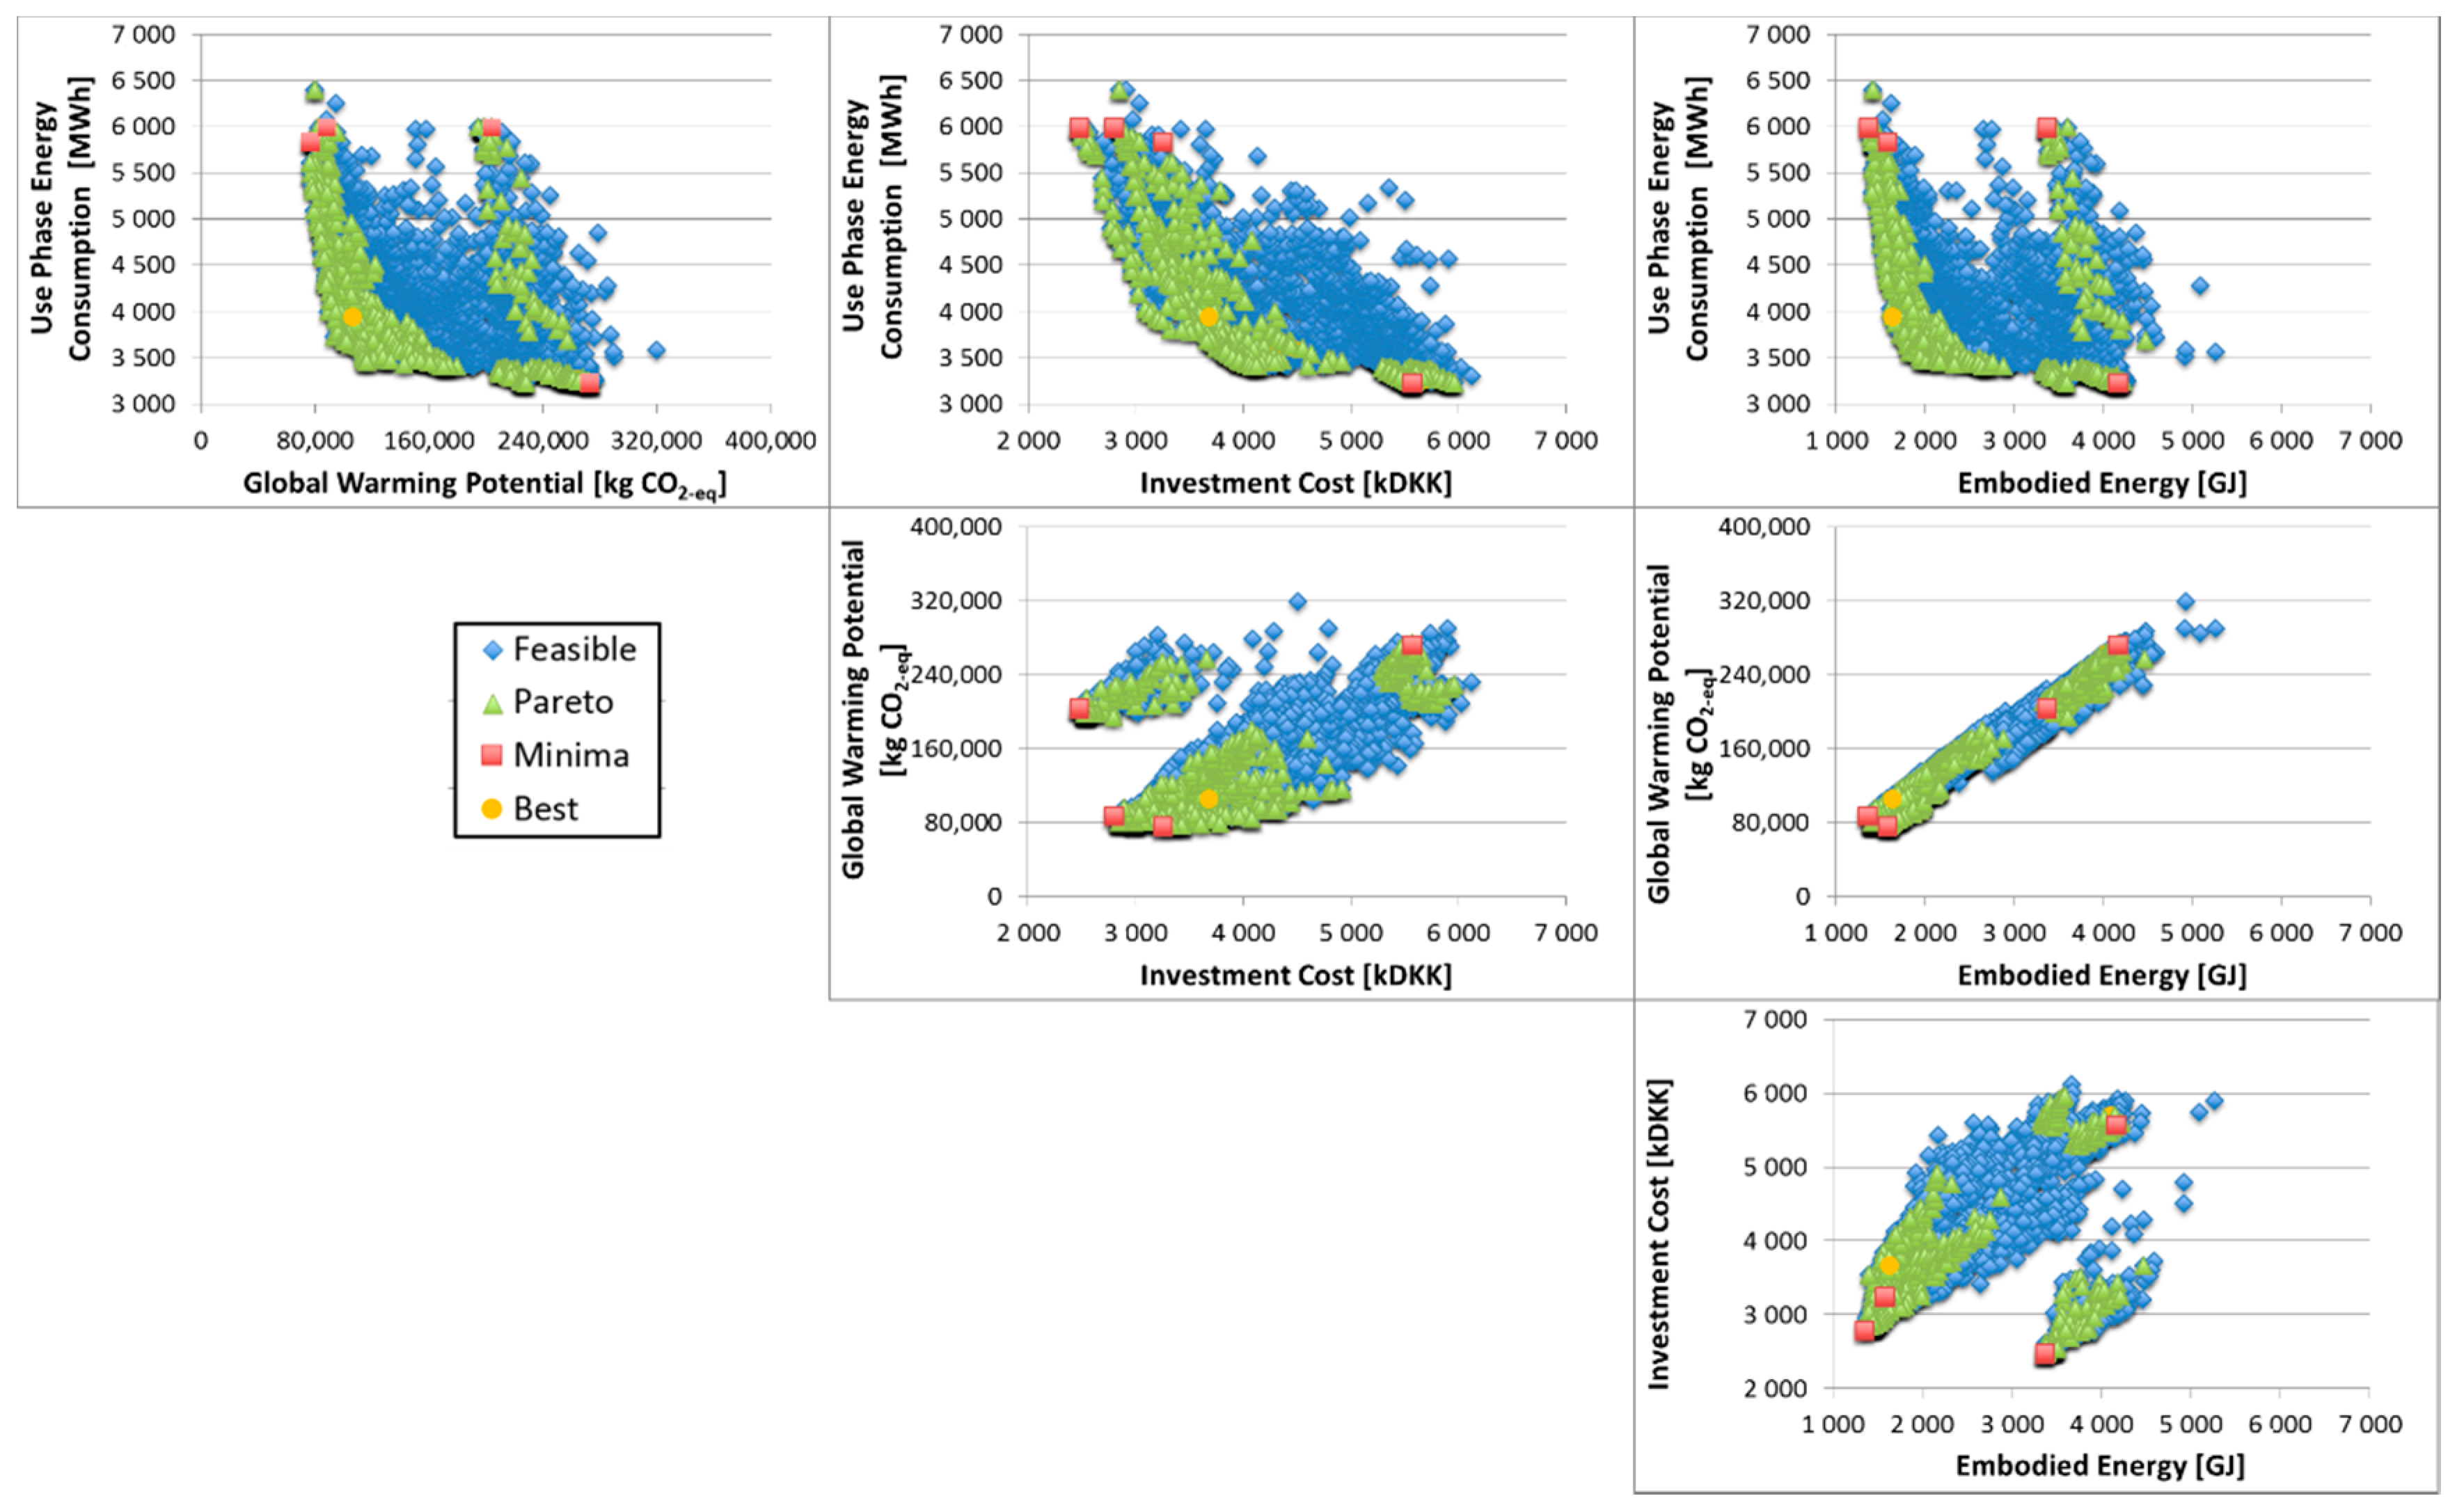
4.1. Optimization Study 1–Envelope

The optimization related to the envelope features allowed for the identification of 2986 feasible solutions, while the related Pareto Front is made up of 483 compromise solutions. An overview of the results is provided in Figure 3, where the solutions obtained from the optimization are presented in six graphs showing the six possible combinations of the four objective functions for all the feasible solutions (blue rhombi), for the Pareto Front (green triangles), for the solutions minimizing separately each objective function, i.e., extreme solutions (red squares) and for the best compromise solution (orange circle), i.e., the solution identified through the utopia point criterion.
Although a bi-dimensional Pareto Front usually has a typical trend, in Figure 3 the different views of the front do not resemble this trend, since the additional dimensions change its shape.
It is possible to state that the Pareto Front is composed by three groups of solutions, with each group including at least one of the extreme solutions. The extreme solutions providing minimum GWP and minimum Embodied Energy are very close since these functions are concurrent objectives, as confirmed by the quasi-linear trend in the graph relating these two functions.
The main features of the solutions from the Pareto Front with the lowest Euclidean distance from the origin are shown in Table 5, ordered according to increasing Euclidean distance value. It is possible to see that the most common insulation material in the results is cellulose for external walls, while no additional insulation is usually applied to the roof. Fibrocement is always selected as cladding material, both for walls and roof, and double-glazing was considered for staircase and apartment windows in both orientations, while no glazing is the most common solution for balconies. A curious feature is that the window frames are usually composed of different materials, i.e., wood for North-oriented windows and PVC for South-oriented windows. PVC-framed windows have the lowest investment cost and embodied energy, while wood frames have the lowest GWP, thus the optimization converged to different frame materials due to the different windows surfaces between North (about 100 m2) and South façade (about 200 m2).
The annual final energy demand of the optimal solutions varies between 76.5 and 83.7 kWh/m2/y, which is close to the value of 77.2 kWh/m2/y, related to the actually conducted 2012 renovation. These results can be compared with average energy demand and legal boundaries using the primary energy source factors of the Danish building regulations, being 1.9 for electricity demand and 0.85 for district heating. Thus, the performance of the optimum results in primary energy terms vary between 74.5 and 81.5 kWh/m2/y, a reduction of 41–46% compared with approximately 138 kWh/m2/y, which is the estimated average primary energy demand for Danish apartment buildings from 1961–72 [72,73]. The 2018 building regulations provide two alternative ways of fulfilling energy efficiency requirements, either by complying with an energy demand limit or by meeting component heat loss limits. The energy demand limit is 70 kWh/heated m2/y, which is 6–16% lower than the results. The specific investment for the optimal solutions varies between 1400 and 1630 DKK/m2 (about 190–220 €/m2).
For the solution with minimum Euclidean distance, identified as the best compromise solution, whose features are shown in the first column of Table 5, the Embodied Energy of the interventions is equal to 1625 GJ, the embodied GWP is 105.9 tons of CO2-eq, and the investment cost is 3,672,627 DKK (about 500 k€). The relative contribution of insulation, cladding, and transparent materials to each objective function is shown in Figure 4.

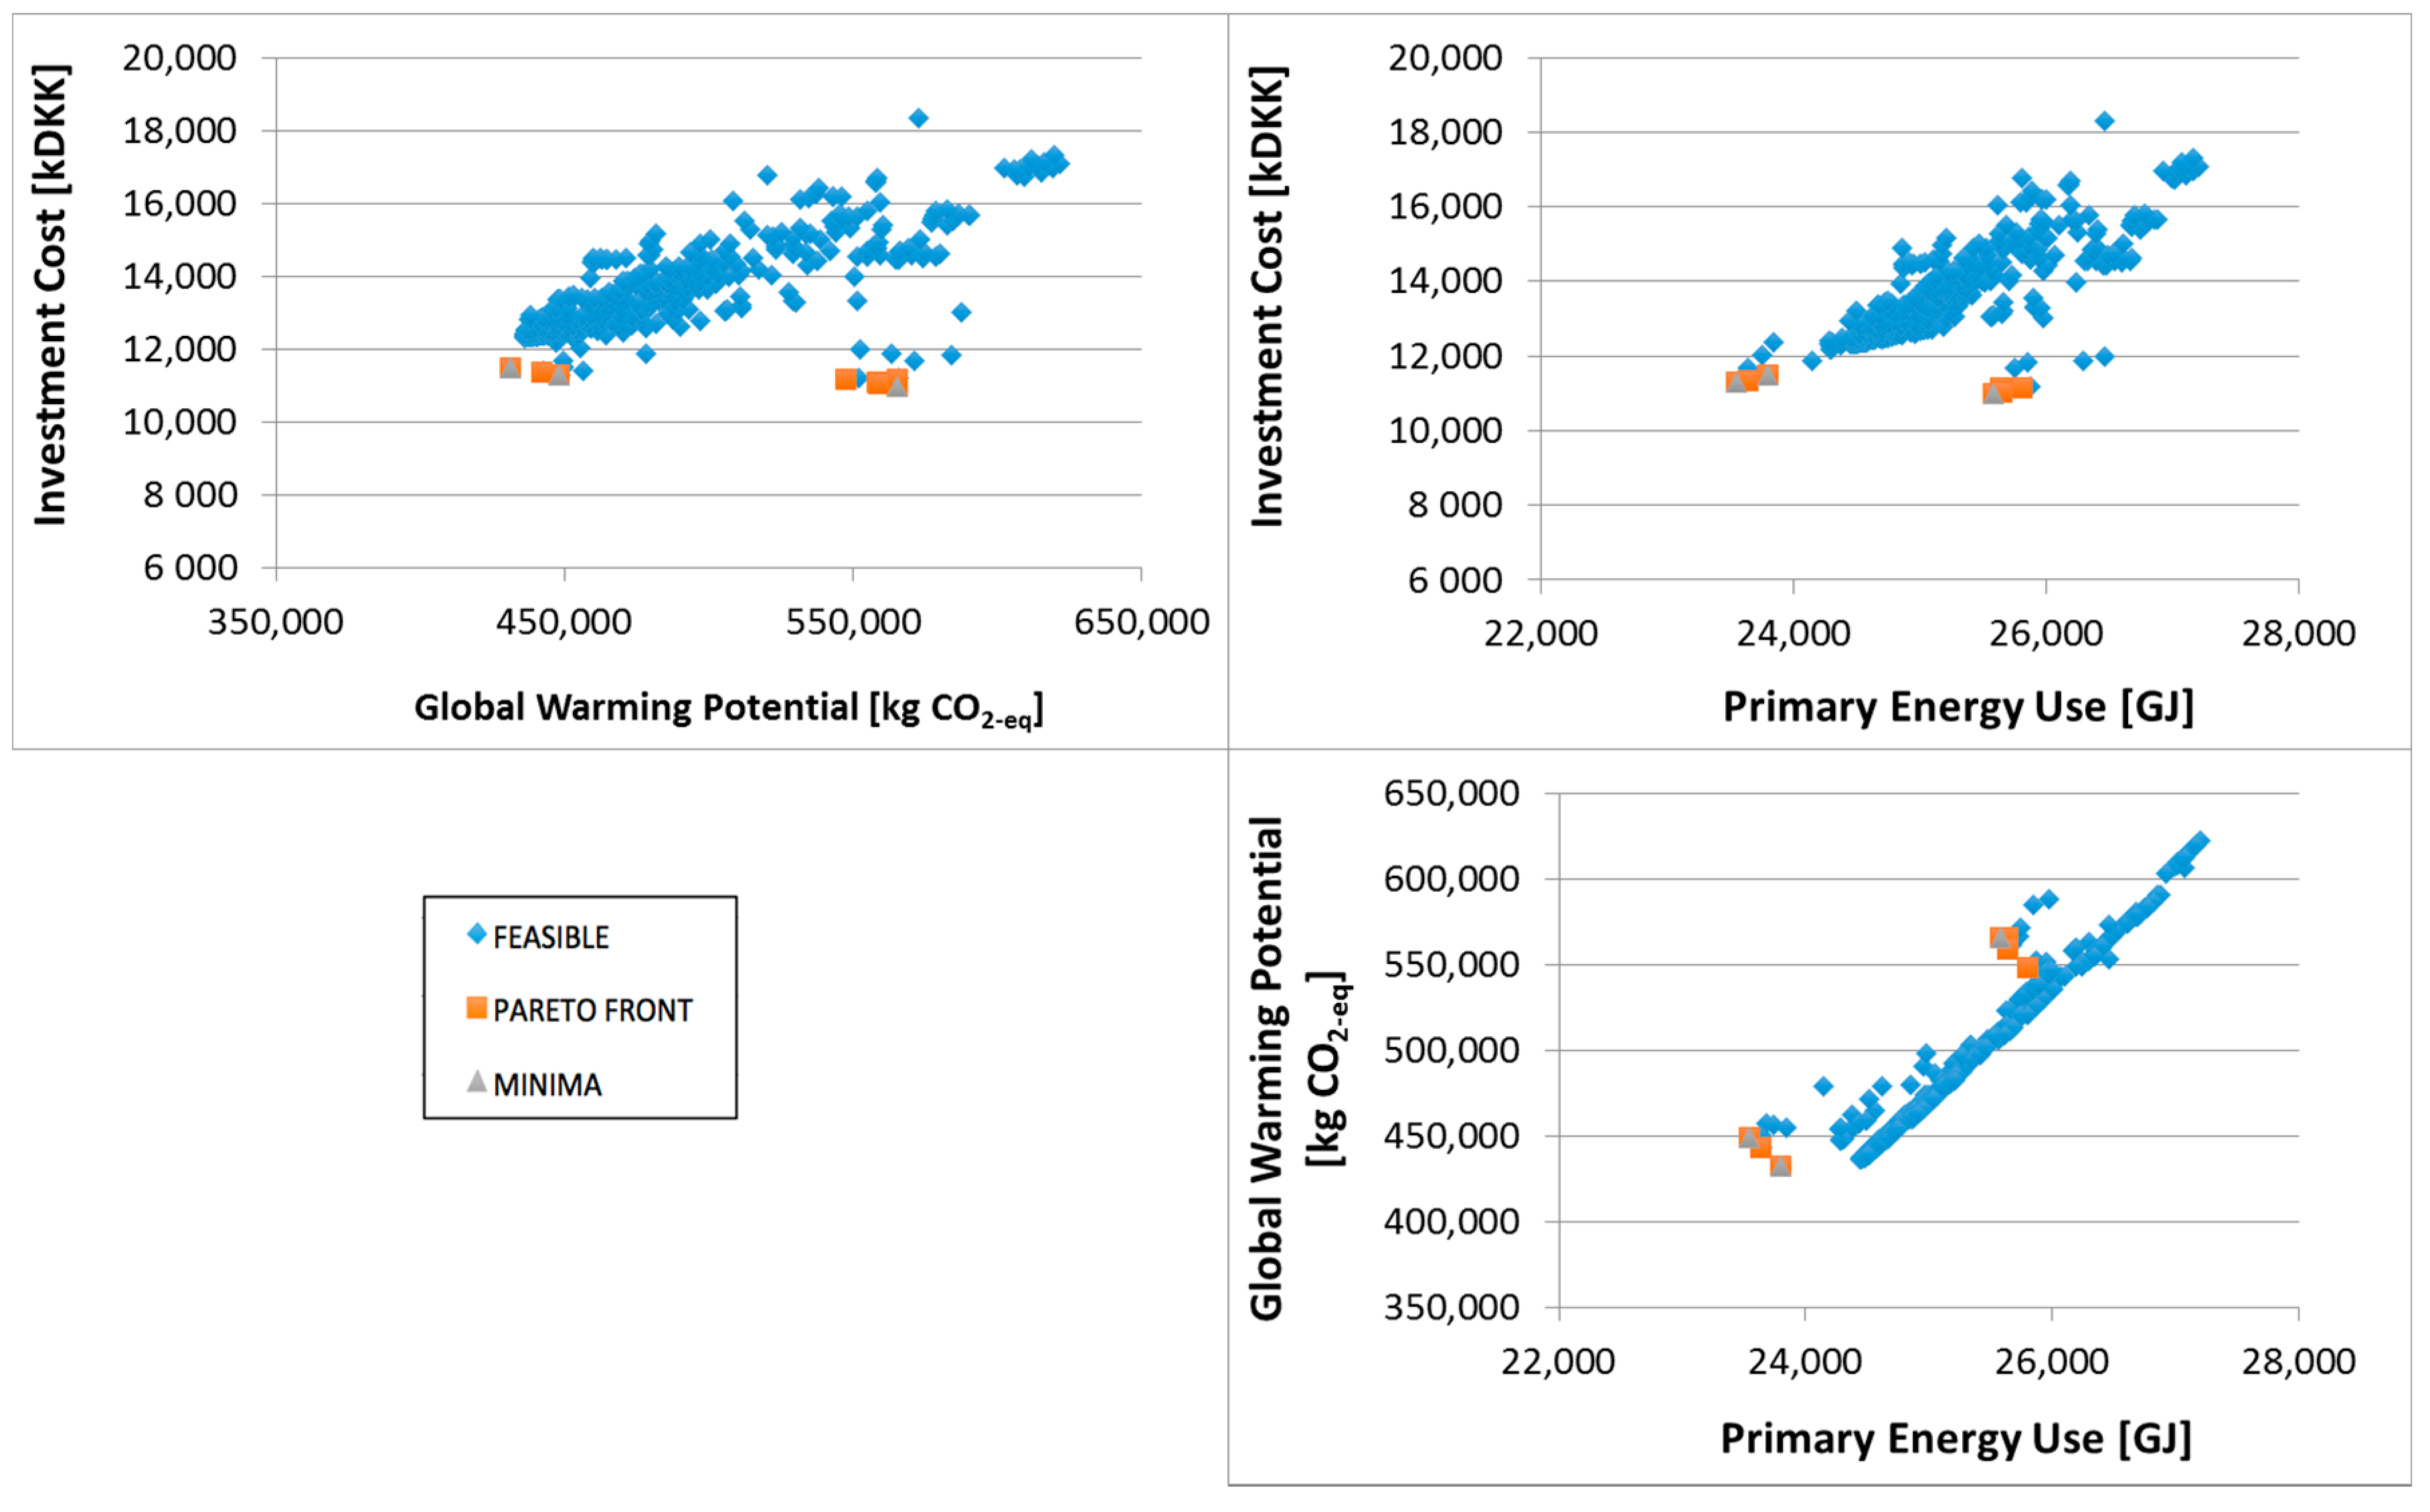
4.2. Optimization Study 2–Envelope and Equipment

The optimization of both the envelope and equipment of the building allowed for the identification of 744 feasible solutions, with the Pareto Front being composed of only 8 compromise solutions. Although the optimization study was repeated with many algorithms and combinations of parameters, the number of feasible solutions in this case study was relatively scarce. A possible explanation may be that the much larger availability of alternatives than in the first optimization, as illustrated in the Appendix A, caused problems in the generation of alternatives. An overview of the results of this optimization is provided in Figure 5, where the three combinations of the three objective functions are shown. As for the previous case study, in Figure 5 are illustrated the feasible solutions (blue rhombi) and the Pareto Front (orange squares), also highlighting the extreme solutions (grey triangles). The Pareto Front is divided in two clusters because some solutions are equipped with fiber-cement for the external walls cladding (less impacting), while most of the solutions in the Pareto Front have an aluminum cladding.
Different from the first study, where the energy demand in use phase was clearly conflicting with embodied impacts and investment costs, in this optimization each objective function is composed by a term related to the supply of material and a term related to the operation of the building, making less evident the conflict between the objectives. Furthermore, all of the feasible solutions are concentrated in a small region of the search space.
Since the Pareto Front is made up of eight solutions only, these alternatives’ features are all shown in Table 6, ordered according to increasing Euclidean distance value. These building solutions have very similar features, all of them showing null additional insulation layers and the same glazing for each component. In detail, North and South oriented windows have double-glazing, as well as the staircase, while balconies have no glazing. The main consequence is that the thermal transmittance of the envelope is the same for each building solution. The walls’ cladding is most commonly aluminum-based in the solutions, because it is the cheapest solution, although having the highest environmental impact. Fiber-cement, however, is the second-best performing solution with the lowest impact, while having the highest cost. As roof material, only tiles appear among the optimal roof cladding solutions. As in the previous case, North-oriented window frames are usually composed by wood, while PVC is often preferred for South-oriented windows. Even regarding the equipment, the solutions are very similar, with heating system being always based on district heating, disregarding installation of solar collectors or recurring to natural gas. This result was predictable, due to the low solar radiation available in Denmark and to the high values of specific impacts and cost of natural gas. The low level of solar radiation may also explain why PV is selected in only one of the optimal solutions. The annual final energy demand of all the optimal solutions is equal to 115.4 kWh/m2/y, over the Danish requirement for the voluntary renovation class 2.
For the best compromise solution, that is even the solution with minimum GWP, solution 19 in Table 6, primary energy use is equal to 23,800 GJ, GWP is 432 tons of CO2-eq, and the investment cost is 11,435,000 DKK (about 1500 k€), given for the reference study period of 50 years. The relative contribution of embodied and operating terms to each objective function is shown in Figure 6, where the embodied contribution is related only to the envelope, since no renovation on equipment was selected for this solution.

5. Discussion and Conclusions

The building sector has to provide a considerable contribution in carbon reduction in the coming years, if the climate change policies are to be met. Since existing buildings have the largest carbon cutting potential, investments in renovations should be directed to achieving the highest possible carbon life cycle reduction.
The present study aimed at contributing to the development of multi-objective optimization as an aid for integrated building design, where numerous technical and financial performance parameters have to be balanced simultaneously. In a housing block renovation case study, the parameters energy, GWP, and cost both for operational and embodied phase are included in a multi-criteria optimization.
The optimization workflow has generally proved to be usable for supporting design decisions in large-scale renovations. Time-consuming explorative analyses can be avoided, because designers can direct their attention towards larger and cheaper carbon reductions from an initial state in the project.
Resulting from the first study on envelope optimization, eight solutions from the Pareto front were defined as the optimum set based on the minimum Euclidean distance. The results suggest cellulose insulation, double-glazing, wooden or PVC window frames, and fiber cement clad roof and façades. Glazed balconies are not among the suggested solutions.
Interestingly, the optimum set deviate in window frame materials for the North and South façade. Since the study does not differentiate thermal conductivity of framing material, the result cannot be the product of an actual optimization. Instead, the phenomenon was most likely caused by differing areas of North- and South-facing windows, which assumedly lie on different sides of an optimization tipping point.
Most of the solutions show one of the four parts of the envelope with no or very little additional insulation, predominantly the roof. Obviously, a cost-efficient reduction in GHG emissions had been achieved by improving all but one included part of the envelope, while further improvements were too costly. Further, the heat-loss contribution and thus improvement potential by the roof is lower in multi-storey buildings due to the geometrical relation with the facades.
The study confirms that the legal energy requirements for deep renovations can be met cost-efficiently and with low overall GHG emissions. With an energy demand of 76.5–83.7 kWh/(m2 y), the optima almost meet the 70 kWh/(m2 y) renovation class 2 limit with envelope optimization alone. The minor remaining savings can be expected to be achieved by building service improvements. This subsequent study is not a part of this work.
The second study, including envelope and services, confirms that district heating, the predominant heating technology in Danish urban areas, is preferable compared with renewable building-level heat sources. The reasons are suspected to be low cost and GHG emissions of district heating and less favorable climatic conditions for solar power production.

5.1. Limitations

For simplification reasons, some factors in the performance simulations were neglected. This applies to the solar shading effect of the wall dimension due to varying insulation thickness. The position and dimension of façade openings was neglected too, since these are less relevant design options in existing buildings. Daylight simulations have not been included as a performance indicator. Here, the optimum solutions show that wall thickness and number of glazing layers are less likely to challenge the existing daylight level.
Insulation levels were divided into theoretical, discretely ignoring actually available product dimensions. This is not considered a problem during the initial design stages. The inclusion of these minor aspects is recommended to be included in detailed analyses in later project stages.
The energy demand is calculated using standard preconditions aiming at building permit design. This includes the application of the obligatory energy performance rating tool for the Danish market and required assumptions for indoor temperature and other occupancy-related factors. As actual energy consumption usually exceeds the calculated standard energy demand, more specific assumptions should be used in real life projects. This bias is expected to lead to higher insulation levels.
In the secondary study, the combination of both building services and envelope alternatives has shown complexity challenges. The number of possible solutions has obviously exceeded the manageable extent for producing reliable results. Even though the optima mostly denied any extra insulation, the authors decided to include these considerations for illustrating that the application of a reliable optimization algorithm with correct parameter settings may lead to sub-optimal solutions instead of approaching the true Pareto front, or give unexpected results if the number of variables is too high. A way out may be reducing the number of variables by a two-step optimization, where building services are optimized based on a previously conducted envelope optimization.
The second study does not take into account cost and impacts for piping for connecting the building with the district-heating network, since these works were already in place in case of the selected building. In new constructions or existing cases with a different heating technology, district heating might be challenged. Furthermore, the water temperature for heating has not been taken into account. Here, low temperature technology, such as solar heating, might perform better in cases where low-temperature DHW or radiant floor heating is an option.

5.2. Applicability

This work focuses on showing the potential of optimizing emission and cost performance of selected building parts. However, in real life, the façade would not be renovated just in parts, but from a more holistic perspective. Additionally, roof insulation would not be as costly as assumed, when subtracting the cost for a necessary replacement of roof cladding due to wear.
The preparatory work for applying multi-objective optimization has shown being the most time-consuming procedure. It included defining the objective functions, thermal properties, GWP impacts, and cost for all cladding alternatives, insulation types for roof and façade and glazed components. It is expected that this effort is primarily related to initiating the method and database, while time may be saved on subsequent projects. However, the calculation time for the optimization has not shown to be a barrier for practical application. Eight thousand building alternatives (40 individuals for 200 generations) were simulated in about 20 min on a 38-core computer, corresponding to three hours for an office quad-core computer, which is comparable with complex rendering visualizations.
Having conducted one of the first studies in a Danish context, the authors hope to contribute the first steps in order to implement multi-objective optimization in building design as a means to achieve carbon reductions.

5.3. Future Work

As future developments of the present work, a dual step approach to the building optimization is suggested, with the first being focused on the envelope components and the second to be oriented to the design of building services equipment. In order to simplify the initial set-up prior to optimization, a template and guide would help a broader range of actors to test and improve the method. By publishing a prototype set-up, the method can be made available for industry testing, generating valuable input for evaluating some improvements.
Besides feasibility improvements, work might also be put into adjusting the study scope for gaining greater value in real life application. Here, legal requirements may be included as a constraint in order to produce compliant optima from the beginning.

Supplementary Materials

The following are available online at https://0-www-mdpi-com.brum.beds.ac.uk/2071-1050/12/18/7807/s1, Table S1: Envelope-related parameters employed for the optimization study, Table S2: Service equipment-related parameters for the optimization, Table S3: Energy vectors-related parameters for the optimization, Table S4: Insulation materials physical and thermal properties, Table S5: Glazing physical and thermal properties.

Author Contributions

Conceptualization, F.M., K.K., K.B.W., H.B., S.L., and E.R.S.; methodology, F.M., K.K., K.B.W., H.B., S.L. and E.R.S.; software, F.M.; validation, F.M. and K.K.; formal analysis, F.M. and K.K.; investigation, F.M. and K.K.; resources, F.M. and K.K.; data curation, F.M. and K.K.; writing—original draft preparation, F.M. and K.K.; writing—review and editing, F.M., K.K., K.B.W., H.B., S.L., M.C. and E.R.S.; visualization, F.M. and K.K.; supervision, K.B.W., H.B., S.L., M.C. and E.R.S.; project administration, H.B., S.L. and E.R.S.; funding acquisition, K.B.W., H.B., S.L., M.C. and E.R.S. All authors have read and agreed to the published version of the manuscript.

Funding

This research received no external funding.

Acknowledgments

This study has been carried out in the framework of the Annex 72 of the International Energy Agency (IEA) Energy in Buildings and Communities (EBC) Programme. The authors wish to thank their colleague Jørgen Rose for his support in software development and in data collection phases.

Conflicts of Interest

The authors declare no conflict of interest.

Appendix A

Mathematical Model of the Optimization Study

In this section, the mathematical model for this optimization study is shown. It is a mixed integer, non-linear, constrained multi-objective optimization problem. With reference to the scheme in Figure 1 and referring to the optimization study 1, for each iteration, the values of variables selected by MOBO were combined to evaluate the new thermal transmittance U, temperature reduction factors b of each envelope component (as defined in EN 12831:2003 standard [74]), solar energy transmittance g of each transparent component, and the glazing-frame ratio Ff of the windows behind eventual balcony windows, all of which are the inputs of Be18.
The variables were modeled as discrete variables, also using Boolean variables to set the constraints, with a total combination number equal to 5.84 × 10¹⁷. To indicate the variables in the following equations, a bold style was used. The objective functions employed in this study are shown in Equations (A1)–(A3):
P E t o t = i = 1 M U E E i · m i + k = 1 E U E E k · e k + k = 1 E U O E k · l k
G W P = i = 1 M U E C i · m i + k = 1 E U E C k · e k + k = 1 E U O C k · l k
C o s t = i = 1 M U I i · m i + k = 1 E U I k · e k + k = 1 E U O C k · l k
where UEE is the unit embodied energy, m is the amount of material (thickness or surface), e stands for the k-th equipment, UOE is the unit operating energy, l stands for the k-th equipment’s energy flow, UEC is the unit embodied carbon, UOC is the unit operating carbon, UI is the unit investment cost, and UOC is the unit operating cost. Each objective function is composed by a term related to the envelope materials (embodied impacts and investment cost), a term related to the equipment materials, and an operating term related to the load of each equipment. Although these equations were employed for both optimization studies, since the equipment technology was not specified in the first optimization study, only a few of these terms were evaluated and optimized. Furthermore, embodied energy and operational energy were considered as separate terms in the first optimization study since the former was evaluated in primary energy terms (PEtot), while the latter was evaluated in final energy terms.
In this work, in order to better fit the market data, the cost relation for some components were expressed as linear functions, instead of using only a unit value [75], as in Equation (A4):
Z = C · S + C 0 · δ
where Z is the investment cost, S is the component size (e.g., insulation thickness), δ is a Boolean variable indicating whether or not the component is to be installed, and C and C0 are the cost function parameters, obtained through least squares regression on market data, to be used in Equation (A3).
The equations for the calculation of dependent variables are shown in Equations (A5)–(A7), (A10)–(A12), (A14), (A15), (A18)–(A25), (A28), (A29), and (A31)–(A34), while the constraints which the problem is subject to, involving independent and dependent variables, are provided in Equations (A8), (A9), (A13), (A16), (A17), (A26), (A27), (A30), (A35), and (A36). For simplicity of reading, these equations were grouped according to the envelope components.
The envelope related variables considered in this study are:
  • Additional insulation material for external walls: EPS, rock wool or cellulose;
  • additional insulation thickness for external walls: 0–0.40 m with 0.05 step;
  • additional insulation material for light walls: EPS, rock wool or cellulose;
  • additional insulation thickness for light walls: 0.09–0.44 m with 0.05 step;
  • additional insulation material for roof: rock wool or cellulose;
  • additional insulation thickness for roof: 0–0.40 m with 0.05 step;
  • additional insulation thickness for basement walls: 0–0.40 m of EPS with 0.05 step;
  • new cladding for external walls: 4 different claddings (bricks, slate, fibrocement board, aluminum board);
  • new cladding for roof: 4 different claddings (fibrocement board, ceramic tiles, bituminous membrane, zinc with double standing seam);
  • new windows glazing: Double or triple, with different values for north and south orientation;
  • new windows frame: PVC, aluminum or wood, with different values for north and south orientation;
  • glazing for balconies: Single, double, triple, or nothing;
  • glazing for staircase: Single, double, or triple.
EXTERNAL WALLS (EW)
U E W = 1 1 U E W , 0 + s m . w . λ m . w . · δ m . w . + s c e l l λ c e l l · δ c e l l + s E P S λ E P S · δ E P S + ( δ s l a t e + δ f i b . c e m . + δ a l u m ) · ( R s i R s e ) + s b r i c k λ b r i c k · δ b r i c k
U E W B B = 1 1 U E W + ( δ 1   b a l c o + δ 2   b a l c o + δ 3   b a l c o ) · δ b r i c k · ( R s i R s e )
b E W B B = δ 0   b a l c o + b 1 g · δ 1   b a l c o + b 2 g · δ 2   b a l c o + b 3 g · δ 3   b a l c o
δ m . w . + δ c e l l + δ E P S 1
δ s l a t e + δ f i b . c e m . + δ a l u m + δ b r i c k = 1
LIGHT WALLS (LW)
U L W = 1 1 U L W , 0 + s m . w . λ m . w . · δ m . w . + s c e l l λ c e l l · δ c e l l + s E P S λ E P S · δ E P S + ( δ s l a t e + δ f i b . c e m . + δ a l u m ) · ( R s i R s e ) + s b r i c k λ b r i c k · δ b r i c k
U L W B B = 1 1 U L W + ( δ 1   b a l c o + δ 2   b a l c o + δ 3   b a l c o ) · δ b r i c k · ( R s i R s e )
b L W B B = δ 0   b a l c o + b 1 g · δ 1   b a l c o + b 2 g · δ 2   b a l c o + b 3 g · δ 3   b a l c o
δ m . w . + δ c e l l + δ E P S 1
BASEMENT WALLS (BW)
U B W = 1 1 U B W , 0 + s E P S λ E P S
ROOF (R)
U R = 1 1 U R , 0 + ( s m . w . λ m . w . · δ m . w . + s c e l l λ c e l l · δ c e l l ) + ( δ t i l e + δ f i b . c e m . ) · ( R s i R s e )
δ m . w . + δ c e l l 1
δ t i l e + δ f i b . c e m . + δ b i t u m + δ z i n c = 1
WINDOWS (W)
U W _ n o r t h = 1 δ 2 , n o r t h U 2 g + ( 1 δ 2 , n o r t h ) U 3 g + R s i + R s e
U W _ s o u t h = 1 δ 2 , s o u t h U 2 g + ( 1 δ 2 , s o u t h ) U 3 g + R s i + R s e
U W B B = 1 δ 2 , s o u t h U 2 g + ( 1 δ 2 , s o u t h ) U 3 g + R s i + R s i · ( δ 1   b a l c o + δ 2   b a l c o + δ 3   b a l c o ) + R s e · δ 0   b a l c o
g W _ n o r t h = g 2 g · δ 2 , n o r t h + g 3 g · ( 1 δ 2 , n o r t h )
g W _ s o u t h = g 2 g · δ 2 , s o u t h + g 3 g · ( 1 δ 2 , s o u t h )
g W B B = ( g 2 g 0 b · δ 0   b a l c o + g 2 g 1 b · δ 1   b a l c o + g 2 g 2 b · δ 2   b a l c o + g 2 g 3 b · δ 3   b a l c o ) · δ 2 , s o u t h + ( g 3 g 0 b · δ 0   b a l c o + g 3 g 1 b · δ 1   b a l c o + g 3 g 2 b · δ 2   b a l c o + g 3 g 3 b · δ 3   b a l c o ) · ( 1 δ 2 , s o u t h )
b W B B = δ 0   b a l c o + b 1 g · δ 1   b a l c o + b 2 g · δ 2   b a l c o + b 3 g · δ 3   b a l c o
F f _ W B B = F f , 0 · δ 0   b a l c o + F f , 1 · ( δ 1   b a l c o + δ 2   b a l c o + δ 3   b a l c o )
δ P V C , n o r t h + δ w o o d , n o r t h + δ a l u m , n o r t h = 1
δ P V C , s o u t h + δ w o o d , s o u t h + δ a l u m , s o u t h = 1
BALCONIES (B)
U V = δ b r i c k ( 1 U 1 g + R s i + R s e ) · δ 1   b a l c o + ( 1 U 2 g + R s i + R s e ) · δ 2   b a l c o + ( 1 U 3 g + R s i + R s e ) · δ 3   b a l c o
g V = g 1 g · δ 1   b a l c o + g 2 g · δ 2   b a l c o + g 3 g · δ 3   b a l c o
δ 0   b a l c o + δ 1   b a l c o + δ 2   b a l c o + δ 3   b a l c o = 1
STAIRCASE WINDOWS (ST)
U S T = 1 1 U 1 g · δ 1   s t a i r + 1 U 2 g · δ 2   s t a i r + 1 U 3 g · δ 3   s t a i r + R s i + R s e
g S T = g 1 g · δ 1   s t a i r + g 2 g · δ 2   s t a i r + g 3 g · δ 3   s t a i r
b S A W = b 1 g · δ 1   s t a i r + b 2 g · δ 2   s t a i r + b 3 g · δ 3   s t a i r
b S B F = b 1 g · δ 1   s t a i r + b 2 g · δ 2   s t a i r + b 3 g · δ 3   s t a i r
δ 1   s t a i r + δ 2   s t a i r + δ 3   s t a i r = 1
where U is the thermal transmittance, s is the material thickness, λ is the thermal conductivity, b is the temperature reduction factor, Rsi and Rse are the internal and external surface resistances, respectively, as defined in ISO 6946:2007 standard [39], g is the solar energy transmittance, Ff is the glazing/frame ratio, and δ are Boolean variables indicating if a component or variable is selected or not. Subscripts have the following meaning: m.w. stands for mineral wool, cell stands for cellulose, fib.cem. stands for fiber cement, alum stands for aluminum, balco stands for balconies, BB stands for behind balconies, numbers from 0 to 3 indicate the glazing, tile stands for ceramic tiles, bitum stands for bituminous membrane, and north and south indicate the exposition of the windows.
In Equations (A5) and (A10), three out of four cladding structures include ventilated air cavities larger than 1500 mm2 per meter of length, thus the transmittance of the cladding structure was neglected, according to standard ISO 6946:2007 [39]. In the same way, in Equation (A15), two out of four cladding structures include ventilated air cavities larger than 1500 mm2 per meter of length, thus the transmittance of the cladding structure was neglected, while the remaining cladding structures have negligible thermal resistance.
The mathematical model described above is composed by:
  • 40 independent variables, describing cladding and insulation material and thickness for external walls, light walls, roof, and basement walls, and glazing and frame material for windows, balconies, and staircase;
  • 22 dependent variables, that are combinations of the independent variables composing useful input values to the Be18 model;
  • 3 inequality constraints, allowing the exclusion or the selection of only one insulation material for external walls, light walls, and roof;
  • 6 equality constraints, with 2 of them allowing the selection of only one cladding material for external walls and roof, 2 of them allowing the selection of only one glazing for balconies and staircase, and 2 of them allowing the selection of only one frame material for windows in 2 different orientations). The selection of only one glazing for windows is guaranteed by the modeling through a unique Boolean variable.
For the second optimization study, including envelope and equipment related variables, the only difference is related to the addition of the following variables and constraints, while the previous model was employed also in this study. The equipment related variables considered in this study are:
  • PV system area;
  • solar thermal collector area;
  • natural gas boiler rated power;
  • district heating heat exchanger rated power (for a standard temperature difference);
  • heat pump rated power.
The areas of solar technologies were modeled as continuous variables while the remaining equipment sizes were modeled as discrete variables. Boolean variables were also included for each component to set the constraints. Since from the simulations the indoor temperature never overcomes 26 °C, no cooling system design was evaluated in the optimization. Taking into account only the discrete variables, the total combination number is equal to 8.98 × 10²⁰. The unique additional constraint of this model is related to solar technologies surface, whose sum has to be lower than the available roof area (220 m2), as in Equation (A36).
S P V + S S T C 220
where SPV is the PV system area and SSTC is the STC area.

References

  1. European Commission. Factsheet: Energy Performance in Buildings Directive; Publications Office of the European Union: Brussels, Belgium, 2019; Available online: https://ec.europa.eu/energy/sites/ener/files/documents/buildings_performance_factsheet.pdf (accessed on 19 September 2020).
  2. European Commission & European Construction Sector Observatory. Improving Energy and Resource Efficiency; Analytical Report; Publications Office of the European Union: Brussels, Belgium, 2018; Available online: https://www.google.com/url?sa=t&rct=j&q=&esrc=s&source=web&cd=&ved=2ahUKEwieiPyf9vPrAhXK6qQKHb_aCQEQFjACegQIBRAB&url=https%3A%2F%2Fec.europa.eu%2Fdocsroom%2Fdocuments%2F33883%2Fattachments%2F1%2Ftranslations%2Fen%2Frenditions%2Fnative&usg=AOvVaw20E2myLWB9wfWcm_rmOFSB (accessed on 19 September 2020).
  3. Eurostat Material Flow Accounts in Raw Material Equivalents by Final Uses of Products—Modelling Estimates [env_ac_rmefd]. Available online: https://ec.europa.eu/eurostat/web/products-datasets/product?code=env_ac_rmefd (accessed on 19 September 2020).
  4. European Commission. Communication 2018/773—A Clean Planet for All. A European Strategic Long-Term Vision for a Prosperous, Modern, Competitive and Climate Neutral Economy; Publications Office of the European Union: Brussels, Belgium, 2018. [Google Scholar]
  5. Frederiksen, M.; Østergaard, M.; Dyhr, P.O.; Skipper, P. Political understanding between Socialdemokratiet, Radikale Venstre, SF and Enhedslisten. In A Fair Direction for Denmark; The Social Democratic Party: Copenhagen, Denmark, 2019. [Google Scholar]
  6. European Parliament and Council. Directive 2010/31/EU of 19 May 2010 on the Energy Performance of Buildings (Recast); Publications Office of the European Union: Brussels, Belgium, 2010. [Google Scholar]
  7. Wittchen, K.B.; Kragh, J.; Søren, A. Potential Heat Savings during Ongoing Renovations of Buildings until 2050; Danish Building Research Institute, Aalborg University: Copenhagen, Denmark, 2016. [Google Scholar]
  8. Streicher, K.N.; Parra, D.; Buerer, M.C.; Patel, M.K. Techno-economic potential of large-scale energy retrofit in the Swiss residential building stock. Energy Procedia 2017, 122, 121–126. [Google Scholar] [CrossRef]
  9. European Parliament and Council. Directive (EU) 2018/844 of 30 May 2018 Amending Directive 2010/31/EU on the Energy Performance of Buildings and DIRECTIVE 2012/27/EU on Energy Efficiency; Publications Office of the European Union: Brussels, Belgium, 2018. [Google Scholar]
  10. Directorate General for Internal Policies. Boosting Building Renovation: What Potential and Value for Europe? Publications Office of the European Union: Brussels, Belgium, 2016. [Google Scholar]
  11. Passer, A.; Kreiner, H.; Maydl, P. Assessment of the environmental performance of buildings: A critical evaluation of the influence of technical building equipment on residential buildings. Int. J. Life Cycle Assess. 2012, 17, 1116–1130. [Google Scholar] [CrossRef]
  12. Röck, M.; Saade, M.R.M.; Balouktsi, M.; Rasmussen, F.N.; Birgisdottir, H.; Frischknecht, R.; Habert, G.; Lützkendorf, T.; Passer, A. Embodied GHG emissions of buildings—The hidden challenge for effective climate change mitigation. Appl. Energy 2020, 258, 114107. [Google Scholar] [CrossRef]
  13. Rasmussen, F.N.; Ganassali, S.; Zimmermann, R.K.; Lavagna, M.; Campioli, A.; Birgisdóttir, H. LCA benchmarks for residential buildings in Northern Italy and Denmark – learnings from comparing two different contexts. Build. Res. Inf. 2019, 47, 833–849. [Google Scholar] [CrossRef]
  14. Rasmussen, N.F.; Birgisdottir, H. Life cycle environmental impacts from refurbishment projects—A case study. In Proceedings of the Central Europe towards Sustainable Building Conference, Prague, Czech Republic, 22–24 June 2016. [Google Scholar]
  15. European Commission. Commission Delegated Regulation (EU) No 244/2012 of 16 January 2012 Supplementing Directive 2010/31/EU of European Parliament and of the Council; Publications Office of the European Union: Brussels, Belgium, 2012. [Google Scholar]
  16. European Commission. Guidelines Accompanying Commission Delegated Regulation (EU) No 244/2012 of 16 January 2012 Supplementing Directive 2010/31/EU of the European Parliament and of the Council; Publications Office of the European Union: Brussels, Belgium, 2012. [Google Scholar]
  17. Thomsen, K.E.; Wittchen, K.B. Energy performance requirements using cost-optimal levels. Overview and outcomes. In Implementing the Energy Performance of Buildings Directive (EPBD): Featuring Country Reports; Maldonado, E., Ed.; Portuguese Energy Agency: Lisbon, Portugal, 2015; pp. 41–56. [Google Scholar]
  18. Sohn, J.L.; Kalbar, P.P.; Birkved, M. Life cycle based dynamic assessment coupled with multiple criteria decision analysis: A case study of determining an optimal building insulation level. J. Clean. Prod. 2017, 162, 449–457. [Google Scholar] [CrossRef] [Green Version]
  19. Christensen, J.E.; Chasapis, K.; Gazovic, L.; Kolarik, J. Indoor Environment and Energy Consumption Optimization Using Field Measurements and Building Energy Simulation. Energy Procedia 2015, 78, 2118–2123. [Google Scholar] [CrossRef] [Green Version]
  20. EQUA. Simulation AB IDA-ICE Web Page. Available online: https://www.equa.se/en/ida-ice (accessed on 19 September 2020).
  21. Sørensen, M.J.; Myhre, S.H.; Hansen, K.K.; Silkjær, M.H.; Marszal-Pomianowska, A.J.; Liu, L. Integrated Building Energy Design of a Danish Office Building Based on Monte Carlo Simulation Method. Energy Procedia 2017, 132, 93–98. [Google Scholar] [CrossRef]
  22. Aggerholm, S. SBi-ANVISNING 213—Bygningers Energibehov: Beregningsvejledning; Danish Building Research Institute, Aalborg University: Copenhagen, Denmark, 2018. [Google Scholar]
  23. Wittchen, K.; Johnsen, K.; Grau, K. Bsim—User’s Guide; Danish Building Research Institute, Aalborg University: Copenhagen, Denmark, 2008. [Google Scholar]
  24. Jradi, M.; Veje, C.; Jørgensen, B.N. Deep energy renovation of the Mærsk office building in Denmark using a holistic design approach. Energy Build. 2017, 151, 306–319. [Google Scholar] [CrossRef]
  25. U.S. Department of Energy EnergyPlus Web Page. Available online: https://energyplus.net/ (accessed on 19 September 2020).
  26. OpenStudio Web Page. Available online: https://www.openstudio.net/ (accessed on 19 September 2020).
  27. Jradi, M.; Veje, C.T.; Jørgensen, B.N. A dynamic energy performance-driven approach for assessment of buildings energy Renovation—Danish case studies. Energy Build. 2018, 158, 62–76. [Google Scholar] [CrossRef]
  28. Harkouss, F.; Fardoun, F.; Biwole, P.H. Multi-objective optimization methodology for net zero energy buildings. J. Build. Eng. 2018, 16, 57–71. [Google Scholar] [CrossRef]
  29. Harkouss, F.; Fardoun, F.; Biwole, P.H. Optimal design of renewable energy solution sets for net zero energy buildings. Energy 2019, 179, 1155–1175. [Google Scholar] [CrossRef]
  30. Negendahl, K.; Nielsen, T.R. Building energy optimization in the early design stages: A simplified method. Energy Build. 2015, 105, 88–99. [Google Scholar] [CrossRef]
  31. Pal, S.K.; Takano, A.; Alanne, K.; Palonen, M.; Siren, K. A multi-objective life cycle approach for optimal building design: A case study in Finnish context. J. Clean. Prod. 2017, 143, 1021–1035. [Google Scholar] [CrossRef]
  32. Pal, S.K.; Takano, A.; Alanne, K.; Siren, K. A life cycle approach to optimizing carbon footprint and costs of a residential building. Build. Environ. 2017, 123, 146–162. [Google Scholar] [CrossRef]
  33. Niemelä, T.; Kosonen, R.; Jokisalo, J. Energy performance and environmental impact analysis of cost-optimal renovation solutions of large panel apartment buildings in Finland. Sustain. Cities Soc. 2017, 32, 9–30. [Google Scholar] [CrossRef] [Green Version]
  34. Danish Transport, Construction and Housing Authority. Building Regulations 2018 (BR18); Ministry of Transport and Housing: Copenhagen, Denmark, 2018. [Google Scholar]
  35. Danish Building Research Institute Be18. Available online: https://sbi.dk/beregningsprogrammet/Pages/Start.aspx (accessed on 19 September 2020).
  36. International Organization for Standardization (ISO). ISO 13790:2008—Energy Performance of Buildings. Calculation of Energy Use for Space Heating and Cooling; ISO: Geneva, Switzerland, 2008. [Google Scholar]
  37. Kiss, B.; Szalay, Z. The applicability of different energy performance calculation methods for building life cycle environmental optimization. Int. Rev. Appl. Sci. Eng. 2019, 9, 115–121. [Google Scholar] [CrossRef]
  38. Danish Standards (DS). DS 418:2011—Calculation of Heat Loss from Buildings; DS: Copenhagen, Denmark, 2011. [Google Scholar]
  39. International Organization for Standardization (ISO). ISO 6946:2007—Building Components and Building Elements. Thermal Resistance and Thermal Transmittance. Calculation Method; ISO: Geneva, Switzerland, 2007. [Google Scholar]
  40. International Organization for Standardization (ISO). ISO 10077-1:2006—Thermal Performance of Windows, Doors and Shutters. Calculation of Thermal Transmittance. Part 1: General; ISO: Geneva, Switzerland, 2006. [Google Scholar]
  41. International Organization for Standardization (ISO). ISO 13370:2007—Thermal Performance of Buildings. Heat Transfer via the Ground. Calculation Methods; ISO: Geneva, Switzerland, 2007. [Google Scholar]
  42. European Committee for Standardization (CEN). EN 15978:2011—Sustainability of Construction Works. Assessment of Environmental Performance of Buildings. Calculation Method; CEN: Brussels, Belgium, 2011. [Google Scholar]
  43. Birgisdottir, H.; Rasmussen, F.N. Development of LCAbyg: A National Life Cycle Assessment Tool for Buildings in Denmark. IOP Conf. Ser. Earth Environ. Sci. 2019, 290, 12039. [Google Scholar] [CrossRef]
  44. Sørensen, N.L.; Haugbølle, K.; Scheutz, P. Designing LCCbyg: A Tool for Economic Sustainability. In Proceedings of the World Building Congress 2016, Tampere, Finland, 30 May–3 June 2016; pp. 129–140. [Google Scholar]
  45. Green Building Council Denmark (DK-GBC). DGNB-Manual for Etageejendomme og Rækkehuse; DK-GBC: Copenhagen, Denmark, 2016. [Google Scholar]
  46. Bahramian, M.; Yetilmezsoy, K. Life cycle assessment of the building industry: An overview of two decades of research (1995–2018). Energy Build. 2020, 219, 109917. [Google Scholar] [CrossRef]
  47. German Federal Ministry of the Interior, Building and Community. ÖKOBAUDAT Database. Available online: https://www.oekobaudat.de/en/database/database-oekobaudat.html (accessed on 19 September 2020).
  48. European Committee for Standardization (CEN). EN 15804:2012—Sustainability of Construction Works. Environmental Product Declarations. Core Rules for the Product Category of Construction Products; CEN: Brussels, Belgium, 2012. [Google Scholar]
  49. Kanafani, K.; Kjær Zimmermann, R.; Nygaard Rasmussen, F.; Birgisdóttir, H. Early Design Stage Building LCA using The LCAbyg Tool: New Strategies For Bridging The Data Gap. In Proceedings of the 2019 Sustainable Built Environment D-A-CH Conference (SBE19 Graz), Graz, Austria, 11–14 September 2019; IOP Publishing: Bristol, UK, 2019. [Google Scholar]
  50. Aagaard, N.-J.; Brandt, E.; Aggerholm, S.; Haugbølle, K. SBI 2013:30—Levetider af Bygningsdele ved Vurdering af Bæredygtighed og Totaløkonomi; Danish Building Research Institute, Aalborg University: Copenhagen, Denmark, 2013. [Google Scholar]
  51. Maslesa, E.; Jensen, P.A.; Birkved, M. Indicators for quantifying environmental building performance: A systematic literature review. J. Build. Eng. 2018, 19, 552–560. [Google Scholar] [CrossRef]
  52. Birgisdottir, H.; Moncaster, A.; Wiberg, A.H.; Chae, C.; Yokoyama, K.; Balouktsi, M.; Seo, S.; Oka, T.; Lützkendorf, T.; Malmqvist, T. IEA EBC annex 57 ‘Evaluation of embodied energy and CO2eq for building construction’. Energy Build. 2017, 154, 72–80. [Google Scholar] [CrossRef] [Green Version]
  53. Soust-Verdaguer, B.; Llatas, C.; García-Martínez, A. Simplification in life cycle assessment of single-family houses: A review of recent developments. Build. Environ. 2016, 103, 215–227. [Google Scholar] [CrossRef] [Green Version]
  54. Krarti, M.; Ihm, P. Evaluation of net-zero energy residential buildings in the MENA region. Sustain. Cities Soc. 2016, 22, 116–125. [Google Scholar] [CrossRef]
  55. Bejan, A.; Tsatsaronis, G.; Moran, M. Thermal Design and Optimization; John Wiley & Sons: Hoboken, NJ, USA, 1995. [Google Scholar]
  56. Longo, S.; Montana, F.; Riva Sanseverino, E. A review on optimization and cost-optimal methodologies in low-energy buildings design and environmental considerations. Sustain. Cities Soc. 2019, 45, 87–104. [Google Scholar] [CrossRef]
  57. Deb, K. Multi-Objective Optimization Using Evolutionary Algorithms; John Wiley Sons, Ltd.: Hoboken, NJ, USA, 2001; p. 497. [Google Scholar]
  58. Palonen, M.; Hamdy, M.; Hasan, A. MOBO A New Software for Multi-Objective Building Performance Optimization. In Proceedings of the 13th Conference of the International Building Performance Simulation Association (BS2013), Chambery, France, 26–28 August 2013; pp. 2567–2574. [Google Scholar]
  59. Cellura, M.; Longo, S.; Montana, F.; Riva Sanseverino, E. Multi-Objective Building Envelope Optimization through a Life Cycle Assessment Approach. In Proceedings of the 2019 IEEE International Conference on Environment and Electrical Engineering and 2019 IEEE Industrial and Commercial Power Systems Europe (EEEIC/I&CPS Europe), Genova, Italy, 10–14 June 2019; Institute of Electrical and Electronics Engineers (IEEE): Genoa, Italy, 2019; pp. 1–6. [Google Scholar]
  60. Attardo, G.; Longo, S.; Montana, F.; Riva Sanseverino, E.; Tran, Q.T.T.; Zizzo, G. Urban Energy Hubs Economic Optimization and Environmental Comparison in Italy and Vietnam. In Proceedings of the 2018 IEEE 4th International Forum on Research and Technology for Society and Industry (RTSI), Palermo, Italy, 10–13 September 2018; pp. 1–6. [Google Scholar]
  61. Thomsen, K.E.; Rose, J.; Morck, O.; Jensen, S.Ø.; Østergaard, I. Energy Consumption in an Old Residential Building Before and After Deep Energy Renovation. Energy Procedia 2015, 78, 2358–2365. [Google Scholar] [CrossRef] [Green Version]
  62. Rose, J.; Thomsen, K.E.; Mørck, O.C.; Mayoral Gutierrez, M.S.; Jensen, S.Ø. Energirenovering af Traneparken; Teknological Institute: Taastrup, Denmark, 2017. [Google Scholar]
  63. Molio. Molio Price Database (In Danish). Available online: https://www.molio.dk/brug-molio-prisdata (accessed on 19 September 2020).
  64. COWI Consulting. Nye Emissionsfaktorer for el og Fjernvarme; COWI: Lyngby, Denmark, 2016. [Google Scholar]
  65. Chehouri, A.; Younes, R.; Perron, J.; Ilinca, A. A Constraint-Handling Technique for Genetic Algorithms using a Violation Factor. J. Comput. Sci. 2016, 12, 350–362. [Google Scholar] [CrossRef] [Green Version]
  66. Deb, K.; Tiwari, S. Omni-optimizer: A Procedure for Single and Multi-objective Optimization. In Proceedings of the International Conference on Evolutionary Multi-Criterion Optimization EMO, Guanajuato, Mexico, 9–11 March 2005; Coello Coello, C.A., Aguirre, A.H., Zitzler, E., Eds.; Springer: Berlin, Heidelberg, 2005; pp. 47–61. [Google Scholar]
  67. Ascione, F.; Bianco, N.; Iovane, T.; Mauro, G.M.; Napolitano, D.F.; Ruggiano, A.; Viscido, L. A real industrial building: Modeling, calibration and Pareto optimization of energy retrofit. J. Build. Eng. 2020, 29, 101186. [Google Scholar] [CrossRef]
  68. Ardente, F.; Beccali, G.; Cellura, M. Eco-sustainable energy and environmental strategies in design for recycling: The software “ENDLESS”. Ecol. Modell. 2003, 163, 101–118. [Google Scholar] [CrossRef]
  69. Mühlenbein, H. How genetic algorithms really work: Mutation and hillclimbing. In Proceedings of the 2nd International Conference on Parallel Problem Solving from Nature (PPSN-II), Brussels, Belgium, 28–30 September 1992; pp. 15–25. [Google Scholar]
  70. Palonen, M.; Hasan, A. MOBO Beta 0.3b Manual Version 1.4. 2014. Available online: https://www.researchgate.net/publication/273307166_MOBO_Beta_03b_Manual_Version_14 (accessed on 29 August 2020).
  71. Eiben, Á.E.; Smith, J.E. Introduction to Evolutionary Computing, 2nd ed.; Natural Computing Series; Springer: Berlin/Heidelberg, Germany, 2015. [Google Scholar]
  72. Danish Enterprise and Construction Authority. Building Regulations 2010; The Danish Ministry of Economic and Business Affairs: Copenhagen, Denmark, 2010. [Google Scholar]
  73. The Danish Energy Agency Find Statistics on Denmark’s Energy Makers. Available online: https://sparenergi.dk/forbruger/vaerktoejer/find-statistik-paa-danmarks-energimaeker (accessed on 27 February 2020).
  74. European Committee for Standardization (CEN). EN 12831:2003—Heating Systems in Buildings. Method for Calculation of the Design Heat Load; CEN: Brussels, Belgium, 2003. [Google Scholar]
  75. Cannata, N.; Cellura, M.; Longo, S.; Montana, F.; Riva Sanseverino, E.; Luu, Q.L.; Nguyen, N.Q. Multi-Objective Optimization of Urban Microgrid Energy Supply According to Economic and Environmental Criteria. In Proceedings of the 2019 IEEE Milan PowerTech, Milan, Italy, 23–27 June 2019; pp. 1–6. [Google Scholar]
Figure 1. Flowchart for the building optimization (OF stands for Objective Functions).
Sustainability 12 07807 g001
Figure 2. The social housing scheme “Traneparken” before and after the renovation.
Sustainability 12 07807 g002
Figure 3. Results of Optimization Study 1 shown through six graphs combining the four objective functions.
Sustainability 12 07807 g003
Figure 4. Share of embodied impacts and investment cost for the three groups of envelope interventions in the optimal solution of optimization study 1.
Sustainability 12 07807 g004
Figure 5. Results of Optimization Study 2 shown through three graphs combining the three objective functions.
Sustainability 12 07807 g005
Figure 6. Share of embodied against operating contributions to the three objective functions in the optimal solution of Optimization Study 2.
Sustainability 12 07807 g006
Table 1. Life cycle stages included in the renovation study. Nomenclature after EN 15,978 [42].
Production (Renovation Components)Construction (Renovation)ReplacementOperational Energy UseWaste Process. and Disposal
ProductionConstructionEnd-of-Life
A1–A3A5B4B6C3–C4
Components impacts
Components cost
Energy cost and impacts
Table 2. Original building elements and thermal transmittance before the renovation in 2011.
ElementFeaturesArea [m2]U [W/m2·K]
Exterior concrete wallsConcrete sandwich, 50 mm mineral wool insulation1047.670.66
Exterior light wallsLight board, 45 mm insulation330.550.70
Shared walls between apartments and staircaseLight weight concrete, no insulation482.911.20
Basement wallsConcrete, no insulation363.841.00
Roof14-degree slope, fiber cement cladding, 185 mm insulation682.620.20
Basement floor100 mm expanded clay aggregate insulation730.800.40
Shared floor slab between staircase and basementConcrete deck, no insulation48.181.30
North windows2-layer glazing101.402.40
South windows2-layer glazing196.872.40
Staircase windows2-layer glazing85.832.40
Thermal BridgesLength [m]Ψ Ņ [W/m·K]
Façade/windows, doors860.000.03
Foundation/basement wall149.200.50
Table 3. Envelope-related interventions and comparison of thermal transmittances before and after the renovation.
ElementInterventionOld Transmittance [W/m2·K]New Transmittance [W/m2·K]Improvement [%]
Exterior concrete walls190 mm extra insulation and new brick layer0.660.1577%
Exterior light walls285 mm extra insulation and new brick layer0.700.1184%
Basement walls250 mm extra insulation light-weight concrete blocks
100 mm extra insulation (plinth)
1.000.2575%
Roof250 mm extra insulation on extended roof construction0.200.0955%
Windows3-layer glazing2.400.8067%
Table 4. Envelope-related interventions and comparison of thermal transmittances before and after the retrofit.
Sustainability 12 07807 i001
Sustainability 12 07807 i002
Table 5. Values of variables in the solutions of the optimization study 1 with the lowest Euclidean distance from the origin.
# of Solution13831750153212771541173914691196
Final energy demand [kWh/m2/y]78.983.780.777.680.883.679.976.5
Specific investment cost [DKK/m2]15221438155615641549140615151631
Concrete walls insulation materialCelluloseCelluloseCelluloseCelluloseCelluloseEPSCelluloseCellulose
Light walls insulation materialCelluloseCelluloseCelluloseMineral woolMineral woolCelluloseMineral woolCellulose
Roof insulation materialno insulationno insulationno insulationCelluloseCelluloseno insulationCelluloseno insulation
External walls insulation thickness0.25 m0.10 m0.20 m0.25 m0.20 m0.10 m0.10 m0.25 m
Light walls insulation thickness0.14 m0.14 m0.44 m0.14 m0.14 m0.19 m0.24 m0.34 m
Basement walls insulation thickness0.30 m0.30 m0.10 m0.20 m0.05 m0.20 m0.20 m0.10 m
Roof insulation thickness---0.10 m0.35 m-0.40 m-
External walls cladding materialFiber- cementFiber- cementFiber- cementFiber- cementFiber- cementFiber- cementFiber- cementFiber- cement
Roof cladding materialFiber- cementFiber- cementFiber- cementFiber- cementFiber- cementFiber- cementFiber- cementFiber- cement
Balcony glazingno glazingno glazingno glazingno glazingno glazingno glazingno glazingsingle glazing
Staircase glazingdouble glazingdouble glazingdouble glazingdouble glazingdouble glazingdouble glazingdouble glazingdouble glazing
North façade windows glazingdouble glazingdouble glazingdouble glazingdouble glazingdouble glazingdouble glazingdouble glazingdouble glazing
South façade windows glazingdouble glazingdouble glazingdouble glazingdouble glazingdouble glazingdouble glazingdouble glazingdouble glazing
North façade windows framePVCWoodWoodWoodWoodWoodWoodWood
South façade windows framePVCPVCPVCPVCPVCPVCPVCPVC
Table 6. Values of variables in the solutions of Optimization Study 2 with the lowest Euclidean distance.
# of Solution19151262518
Final energy demand [kWh/m2/y]115.4115.4115.4115.4115.4115.4115.4115.4
Specific investment cost [DKK/m2]46054605460546054532457145324605
Concrete walls insulationno insulationno insulationno insulationno insulationno insulationno insulationno insulationno insulation
Light walls insulationno insulationno insulationno insulationno insulationno insulationno insulationno insulationno insulation
Roof insulationno insulationno insulationno insulationno insulationno insulationno insulationno insulationno insulation
Basement walls insulationno insulationno insulationno insulationno insulationno insulationno insulationno insulationno insulation
External walls cladding materialFiber- cement Fiber- cement Fiber- cement Alumin.Alumin.Alumin.Alumin.Alumin.
Roof cladding materialTilesTilesTilesTilesTilesTilesTilesTiles
Balcony glazingno glazingno glazingno glazingno glazingno glazingno glazingno glazingno glazing
Staircase glazingdouble glazingdouble glazingdouble glazingdouble glazingdouble glazingdouble glazingdouble glazingdouble glazing
North wall windows glazingdouble glazingdouble glazingdouble glazingdouble glazingdouble glazingdouble glazingdouble glazingdouble glazing
South wall windows glazingdouble glazingdouble glazingdouble glazingdouble glazingdouble glazingdouble glazingdouble glazingdouble glazing
North wall windows frameWoodWoodPVCWoodWoodWoodPVCAlumin.
South wall windows frameWoodPVCPVCWoodPVCPVCPVCPVC
PV surface [m2]0000001.930
Solar collectors’ surface [m2]00000000
Heating technologyDistrict heatingDistrict heatingDistrict heatingDistrict heatingDistrict heatingDistrict heatingDistrict heatingDistrict heating

