Article

Identifying ‘True’ Water Loss Information through the MFCA Model for Improved Cost-Saving Decisions in a Water Utility: A Case Study of the Doorndraai Water Treatment Scheme in South Africa

by
Michael Bamidele Fakoya
1,* and
Emmanuel O. Imuezerua
2
1
ACSAM, School of Accountancy, University of Limpopo, Mankweng 0727, South Africa
2
Department of Accounting, Vaal University of Technology, Vanderbijlpark 1900, South Africa
*
Author to whom correspondence should be addressed.
Sustainability 2020, 12(18), 7824; https://0-doi-org.brum.beds.ac.uk/10.3390/su12187824
Submission received: 21 August 2020 / Revised: 17 September 2020 / Accepted: 21 September 2020 / Published: 22 September 2020
(This article belongs to the Special Issue Environmental Management Accounting (EMA) for Sustainable Development)

Abstract

:
We identified the deficiency in the conventional accounting system in capturing water-loss-related information and its effect on cost-saving decisions in a water utility in South Africa. We employed the material flow cost accounting (MFCA) model in the case of the Doorndraai Water Treatment Scheme to highlight inefficient phases of the water purification processes for the manager to identify opportunities for corrective action. Findings reveal that the inability of the conventional accounting system in accurately capturing water loss information limits the scheme manager’s ability to recognize cost-saving opportunities. Consequently, we found that the implementation of the material flow cost accounting (MFCA) model identified the pumping process as a major contributor to the water scheme’s daily operating loss because of the pumping machine’s low capacitor. Besides, this pumping machine has been in operation for about five years, an indication that the water scheme had been operating at a loss daily for a number of years. Thus, we suggested that the water scheme should invest in procuring a more suitable pumping device to reduce the huge electricity cost incurred daily by the Doorndraai Water Treatment Scheme. Besides this, the paper extended the implementation of the MFCA by providing an example of how the managerial accounting system can support environmental and economic sustainability in water purification processes. Thus, we reiterate that one way of effectively managing water resources is to appropriately capture the volume of water loss and water-purification-related costs to improve its efficiency.

1. Introduction

Previous water accounting studies have focused on the traditional input-output system, especially in the purification process, thereby neglecting to account for other systems costs vital to the determination of appropriate water pricing by water treatment schemes (Molden & Sakhivadivel, 1999; Vardon et al., 2006; Launiainen, Futter, Ellison, Clarke, Finer & Hogbom, 2014; Meng et al., 2014; Tilmant, Marques & Mohamed, 2015) [1,2,3,4,5]. Inappropriate capturing and matching of water-purification-related costs is a significant obstacle to the successful identification of inefficient processes, cost-saving opportunities, and sound decision-making. Inefficiencies may occur at the water purification, transportation or distribution, and end-user stages. The challenge regarding water utilities is the inability of the existing management accounting system to capture water-loss-related costs, leading to a drop in per capita water availability (Molden, 2007; Van der Zaag, Juizo, Vilanculos, Bolding & Uiterweer, 2010) [6,7]. Earlier studies have focused on the application of water-accounting-related approaches to account for drinkable water quality and their effect on the progress of the Millennium Development Goal (MDG) (Molden, 2007; Onda, LoBuglio & Bartram, 2012; Chalmers, Godfrey & Lynch, 2012; Meng et al., 2014) [4,6,8,9]. Others focused on integrated water resources management systems (Molden & Sakthivadivel, 1999) [1], the water resources and services framework (Ringler, Bhaduri, & Lawford, 2013) [10], and the complex hydrological process and water management framework (Karimi, Bastiaanssen, Sood, Bastida-Obando & Dost 2014) [11]. In this study, our focus and contribution center on the lack of an integrated cost accounting model for capturing water-purification-loss-related information to support and improve water processing decisions in water utilities (mostly state-controlled) in South Africa. Such a model is necessary because water utility managers need adequate information to make informed decisions for current and future improvements.
In South Africa, all the water utility companies are regulated continuously by supervising ministries or departments (Asmah-Andoh & Gumede, 2016) [12] that appoint Chief Executive Officers (CEOs) and other board members, with their terms of reference and fixed product prices, as well as overreliance on grants and government bailouts, thereby making them inefficient and unprofitable. We argue that having sufficient and correct water loss information is essential for the effective management of water utilities. Thus, by appropriately determining the volume and costs of water losses, water utility managers can be well informed on the value of water loss at the different stages of the purification process using a water management accounting tool to make informed decisions (Slattery, Chalmers & Godfrey, 2012) [13]. However, little attention is devoted to understanding how to apply the Environmental Management Accounting (EMA) tool, the material flow cost accounting (MFCA), in water management. This omission has continually increased the inadequacy in water purification management decisions. It is, therefore, advisable to know how to use this EMA tool (MFCA) to generate the necessary environmental costs to assist in water purification management decisions. Hence, we employ the MFCA model to identify and capture the physical and monetary loss value of inefficiencies in water purification processes. Besides this, the paper extends the implementation of the MFCA model to a state-controlled water utility by providing an example of how the managerial accounting system can support environmental and economic sustainability in water purification processes. This is intended to assist water utilities to become more conscious of their economic and environmental responsibilities. The MFCA considers production losses as process inefficiency or process waste, which must be assigned value, in identifying opportunities for cost-saving. Thus, one main advantage of the MFCA model is the analysis of the phases of the process where the losses are incurred.
The rest of this study explains the theoretical framework and reviews of extant literature, methods used, findings and discussions, and conclusions.

2. Literature Review: Theoretical Framework

As there is no one way to fix organizational challenges, it is contingent upon managers to adapt and resolve incidences using contemporary solutions. In management accounting research, the contingency theory is the most applied (Chenhall, 2003) [14]. The contingency theory applied to management accounting provides clarity on accounting occurrences in circumstances where there have been deficiencies (Christ, 2014) [15]. Further, the contingency approach focuses on the principle that there is no generally suitable accounting system to address all organizational circumstances (Emmanuel, Otley & Merchant, 1990; Ismail, Zainuddin & Sapiei, 2010; Islam & Hu, 2012) [16,17,18]. Instead, the contingency theory proposes that specific circumstances within an organization need a precise and correct accounting system. We argue that the success of any accounting system is dependent on its ability to adjust to changes that are internal or external to the organization. Thus, we assume that the contingency theory is relevant to the management accounting function as we implement the MFCA model to aid in identifying and capturing the “true” cost of water loss, that is, the hidden cost of waste that is often much higher than the apparent cost reported by the conventional cost accounting system.
Furthermore, the identification and capturing of the “true” cost of water loss will help water scheme managers in making informed decisions. For an organization to be sustainable, it needs to envisage and include all contingencies of its environment in its plan to achieve success in a changing and dynamic environment (Scott, 2003) [19] such as in the water purification processes, which need flexibility, internal dynamics, and innovation. Moreover, we contend that since South Africa is a water-scarce country because of its low rainfall, inefficient water purification processes, and pipe leakages in the distribution system, a contingent approach to capturing water processing information is desirable. Besides this, in the water purification sector, the contingent theory encourages adopting more formal controls on the process, thereby reinforcing the link between the theory and practice.

2.1. The Water Situation

Despite water being a substance necessary for human existence, its management and conservation have, in recent years, become a subject of global concern. The water challenge is not limited to South Africa, but it is a regional and global problem as well because water is a natural resource that requires effort to manage (Morrison & Schulte, 2010; Vink, 2014; Meng et al., 2014) [4,20,21]. However, concerns have grown over the years because there is not enough water to meet basic human needs. Moreover, the United Nations News Centre (2009) elucidates that if the current trend continues, about 1.8 billion individuals will be without drinkable water by 2025 while two-thirds of the world’s population will face water stress [22]. Therefore, it is appropriate to sufficiently plan water resource allocation and flows to optimize the resources (Chartres & Varma, 2010; Karimi & Bastiaanssen, 2015) [23,24], as highlighted by the UN SDG 6 on clean water and sanitation (United Nations Development Programme (UNDP), 2020) [25]. Drinkable water is a scarce natural resource in many countries, notably Africa, because of decreasing levels of drinkable water, increasing incidences of drought and deforestation, and the lack of modern technology to tap existing underground reserves. In scheduling water allocation and optimization, it is essential to note that South Africa is a water-scarce country having different environmental, social, economic, and human-related challenges at the national, provincial, and local government levels.
The water scarcity currently experienced in South Africa arose because of low rainfall and wastages related to processed water and usage (Department of Water and Sanitation, 2015) [26]. The need for effective management of water resources resulted in the development of various water accounting tools (Nikolaou, Kourouklaris & Tsali, 2014) [27]. However, these accounting tools have focused on accountability and external reporting requirements. While not underestimating recent developments in water accounting, we argue that the internal management of water resources deserves much more attention than it is presently getting. Thus, one way of effectively managing water resources is to appropriately capture the volume of water loss and water-purification-related costs to improve its efficiency.
Globally, water availability is crucial to the economic and sustainable development (Hedden & Cilliers, 2014) [28]. The focus of this study is on improving water management accounting practices in water treatment schemes to reduce production inefficiencies. Intrinsically, we explore the MFCA model to capture water loss during the purification process to help managers effectively make decisions. This is necessary because South Africa is ranked 29th among the 193 water-scarce countries surveyed with a projected volume of 1110 cubic meters of water per person in 2005 (UNESCO-WWAP, 2006) [29]. In attaining effective water management, it is critical to recognize specific water challenges and opportunities to improve social and economic performance (Development Bank of Southern Africa, DBSA, 2009) [30]. Hence, we submit that combining the existing water accounting framework and management accounting systems could assist in tackling inefficiencies and related water loss costs during the purification process for improved decision-making.

2.1.1. The South African Water Industry

South Africa is considered a semi-arid, water-stressed country with an annual average rainfall of about 450 mm, which is below the global average of 860 mm (Department of Water and Sanitation (DWS), 2015) [26]. In South Africa, the regulation of the water sector through the development of policy and strategy, and the provision of support to the utility sectors, are made by the Department of Water Affairs (DWA). Two Acts governs the DWA: the National Water Act (NWA) (1998) amended as NWA, 2014 (Act 27 of 2014) (RSA, 2014) [31] and the Water Services Act (WSA) (1997) amended as WSA 2014 (Act 44 of 2014) (RSA, 2014) [31]. Thus, an enabling environment for effective water use and management is provided by these Acts, together with the provision of national strategic objectives, governance, and regulatory frameworks. Water utilities were established in terms of the Water Service Act, 1997 (Act No. 108 of 1997), and the main aim of the water utility is the provision of water services to other institutions, like municipalities, in the water sector (RSA, 1997) [32]. Water utilities play a major role in the South African water sector. They are involved with the operation of dams, bulk water supply, and retail infrastructure as well as wastewater systems, while municipalities are the main distributor and water service provider in South Africa.
Also, it is a requirement by the Water Services Act (108 of 1997) for all water utilities to prepare a policy statement within two years of promulgation of the Act and update its policy statement every five years. It is also a requirement that the policy statement should include information relating to the water utility and all the companies, institutions, or bodies where it has an interest. Furthermore, Section 39 of the Water Services Act recommends the content of a water utility policy statement and legislative framework.

2.1.2. The Doorndraai Water Treatment Scheme Purification Process

The purification process in the Doorndraai water treatment scheme (DWTS) of Lepelle Northern Water (LNW) starts with the transportation of raw water from the dam through two pipes and a canal. However, the canal method of transporting raw water was discontinued because it was observed that there was much raw water loss through this method, because the ageing infrastructure resulted in so many leaks. In this water treatment plant, as it is with other plants under Lepelle Northern Water, the plant relies on the input and output measurement system in calculating the percentage of water loss during purification. Water loss is calculated by subtracting the volume of raw material (input) from the output of processed water (output). It is worthy to note that tariff for processed water is fixed by legislation in South Africa through the Department of Water and Sanitation (DWS). Information on water loss during purification is recorded daily by the field workers in charge of water purification. Any real-time problem, abnormal water loss, or any urgent problem is brought to the attention of the scheme manager, who can make an immediate decision to resolve the problem without consultation with the head office because his appointment is at the management level. However, if the scheme manager cannot resolve it, the matter is reported to the head office for urgent action.
It is significant to mention that there is no on-site accountant to verify the data captured by the field officers responsible for water purification. However, a regional accountant visits the site once every month to look at the production charts, which in the view of the researcher may not be accurate. The next section explains the different processes of water purification at the DWTS.

2.1.3. Feed Box/Chemical Dosing

Raw water is transported from the dam, and it splits via controlled pipes into the two purification plants in existence at DWTS called the conventional plant and the packaged plant. For the conventional plant, the first process starts at the lime room or feed box. At this stage of water purification, chemical reagents such as lime are added for the pH adjustment and calcium hypochlorite (HTH) for oxidation. This is also known as the chemical dosing process. The output from this process is now an input for the next stage of water purification called aeration. However, for the packaged plant, the purification process starts with the inflow of raw water (input) through a regulator valve to the lime room where lime and HTH (chlorine type) is added as well. The output from this stage of purification is used as an input for the aeration process.

2.1.4. Aeration

For the conventional plant, oxidized iron and manganese are added to the input from the feed box for coagulation to occur. After coagulation, flocculants are added, which assist in the separation of finer particles, and it also separates impurities from the water. The output from this stage of water purification is used as an input at the sedimentation stage of the water purification process, also known as the settling tank. At the aeration stage of the water purification process of the packaged plant, “superflocs” are added, and the output of this process goes to the oxidation tanks because there is no sedimentation process for package plant.

2.1.5. Sedimentation/Settling Tank

For the conventional plant, this process involves the settling down of heavier flocs in order for sludge to be formed and good quality water to flow through the weirs/barriers. The output of this stage of the water purification process is used as input at the filtration process. For the packaged plant, the output from the aeration stage of water purification is the input at the oxidation tanks. This process is also known as the second stage of aeration or the oxidation tank mixer. The output from this process is used as input at the filtration process.

2.1.6. Sand Filters/Filtration

At the conventional plant, filtration involves the separation of clear water from sand by allowing the water through the sand filter and the filter nozzles. This is where flocs are removed, and all impurities such as leaves trapped on the sand are backwashed when it is due. Water loss during purification is experienced in high volume at this process because of backwashing. The output from this stage of water purification is used as input at the disinfection process. Meanwhile, for the packaged plant, the filtration is done through pressure filters, and the output is the input for disinfection.

2.1.7. Disinfection

The disinfection stage of water purification is where the output from the filtration process from the conventional plant and the output from the packaged plant become the input at the disinfection process. This process of purification, also known as forebay, is where chlorine gas is added to disinfect all harmful micro-organisms. This is important for the water to meet the standard for human consumption before it is pumped to the next stage of purification.

2.1.8. Distribution/Pumping

This is the purification stage, where water is stored in the contact tank for consumers. The purified water is stored and measured before it is transported to the municipality for onward distribution to the consumers. The difference between the input and the output is measured at this stage for the percentage of water loss during water purification to be ascertained.
The argument and findings of this study are combined to address the research objectives and to develop a framework for improving the capturing of an existing approach to calculating water loss and water-related costs, thereby improving management decisions.

2.2. Environmental Management Accounting (EMA)

Resolving inefficiencies in production processes require a contingent approach in data gathering. The worth of data in accounting information systems is vital to effective internal decision-making in an organization (Yakhou & Dorweiler, 2004; Fakoya, 2014) [33,34]. One fundamental aim of the Management Accounting System (MAS) is to provide precise information on processes for making an informed decision. EMA is a different approach with a focus on environmental concerns to provide adequate information to support sustainability-related decisions in organizations. The development of EMA in the 1990s is a reply to requests for organizations to demonstrate greater accountability in environmental management (Qian, Burritt & Monroe, 2011) [35]. Primarily, EMA is associated with internal control, and it seeks to combine conventional management accounting with the MFCA model to recognize environmental information (Christ & Burritt, 2013) [36]. In the past few years, literature has significantly developed and provided evidence, which suggests that EMA has been used in managing resources and in minimizing both the cost and adverse environmental effects that are related to organizational activities (Schaltegger, Viere & Zvezdov, 2012) [37]. The EMA framework is founded on the following traditions. Firstly, that EMA can support in the effort towards a sustainable society (Schaltegger & Burritt, 2000) [38]. Secondly, EMA can promote a particular focus on the accounting needs of management rather than on the needs of external stakeholders (Bennett, Bouma & Wolters, 2002) [39]. Thirdly, different managers are evaluated based on various criteria (Schaltegger & Burritt, 2000) [38]. In linking business actions and environmental management accounting tools, Burritt, Hahn, and Schaltegger (2002) [40] advanced a framework for management accounting. This framework provides structures for managers to understand and assess the various environmental management accounting tools already in existence to encourage adopting an appropriate environmental management accounting tool for their organization.

2.3. Material Flow Cost Accounting (MFCA)-ISO 14051

MFCA is an International Organization for Standardization—ISO Standard 14051 EMA tool that enhances material efficiency by making inefficient processes transparent. Additionally, MFCA evaluates material flows within operations to support waste decisions and resource efficiency, thereby increasing economic and environmental performance. The MFCA model measures material and energy flow in production by providing physical and monetary information (Onishi, Kobuku & Nakajima, 2009) [41]. Moreover, the management of material flow utilization can lead to identifying sources of waste and energy inefficiency in processes (Wan, Ng, Ng, & Tan, 2015) [42]. In this study, we employed the MFCA model to help water scheme managers to understand water-loss-related costs during water purification and transportation to make informed decisions.
Employing the MFCA model can ensure the capturing of all crucial waste-related data revealing production inefficiencies that require corrective action. Data compilation and collection from the input to output using the MFCA model will show up wasted materials and expenses in each production process (METI, 2007) [43]. Therefore, using inappropriate tools make losses challenging to identify. In this study, we further argue that using inadequate accounting tools will make water loss reduction decisions incorrect. Implementing the MFCA model in an organization is dependent upon the availability of accurate waste amounts in production (water purification process) with waste volume and value examined (Kokubu & Kitada, 2010) [44]. Though the prediction of production process waste depends on the units of input materials used, the MFCA model utilizes production data, thus contributing to the accuracy of waste quantity calculations (METI, 2007) [43]. Moreover, implementing the MFCA model allows for more transparent documentation of individual improvements by utilizing cost-saving opportunities (Jasch, 2003) [45], thereby helping water scheme managers to make informed decisions.
It is expedient for water scheme managers to understand applying the alternative water purification information capturing technique to reach efficiency (Hassan, 2013) [46]. Besides this, water scheme managers need accurate water loss volume and cost information to make the right reduction decisions and to understand the implications of water process inefficiencies on its economic and environmental performances. However, the inability to explore all available options in reaching water loss volume and related cost decisions will limit opportunities for cost-saving and corrective actions. To benefit from employing the MFCA model, managers need to separate quantity centers from the cost centers (METI, 2007) [43]. An implication that managers should avoid matching a hypothetical unit to actual process quantity without undermining the advantages of applying waste cost reduction efforts (Kokubu & Kitada, 2010) [44]. Nevertheless, managers will identify waste costs, which are made transparent by the MFCA calculation for practical improvements (Jasch, 2009) [47]. Hence, it is essential to capture water-related costs to control the right waste reduction targets for purification processes.
The analysis of output into a “good” product or “negative” product is possible through the implementation of the MFCA model (Nakajima, 2003; Wang, Cui, Zhu & Li, 2010) [48,49]. The MFCA model classifies salable products as a “good” product and considers production losses as process inefficiency or process waste as a “negative” product (METI, 2007) [43]. This analysis is necessary for determining the percentage of water loss in each stage of the water purification process (Christ & Burritt, 2013) [36]. In water treatment, this assessment may help ease the effectiveness in the number of chemicals and other resources used during the water purification process. Determining the percentage quantity and costs of water loss throughout water purification expose inefficiencies in the purification process (METI, 2007) [43]. Instead of pursuing expensive scientific solutions in reducing waste (Lee, Min & Yook, 2012) [50], the cause of water losses and related costs should be determined to initiate corrective actions. Thus, a comprehensive analysis of the water purification processes into “good” (drinkable water) and non-product output (water loss) will ensure that managers take remedial actions.
Difficulties may arise in calculating the actual consumption of input energy and other system costs in each process into positive and negative product quantities (Hyršlová, Palásek & Vágner, 2011) [51]. However, the MFCA model includes work-in-progress from earlier processes to the next process (Bortolotti & Romano, 2012) [52]. Besides this, determining the positive input of the prior process helps in distributing the proportion of “positive” and “negative” products, respectively (Hyršlová et al., 2011) [51]. Implementing the MFCA model in analyzing production output information will accelerate comparisons between “negative” and “positive” products for better water loss decisions (Bortolotti & Romano, 2012) [52]. Moreover, the “positive” and “negative” product systems cost ought to be calculated separately (METI, 2007) [43] for a specific time (Onishi et al., 2009) [41] and the correct time limit (Kokubu & Kitada, 2010) [44]. Additionally, the inclusion of the “negative” product cost into the following process should be considered (Weigand & Elsas, 2013) [53].
Evaluation of loss and improvement costs is simplified by reducing the effect of fluctuation between processes’ work-in-progress, thereby enabling the MFCA computation to be based on the final product (METI, 2007) [43]. Another method of calculating this is to use the actual yield of the product (in this case, liters of water) as opposed to the theoretical unit of the final process (Kokubu & Kitada, 2010) [44]. The MFCA calculations will help in identifying where improvement is needed. Furthermore, MFCA calculations will help identify processes generating negative product costs based on the scale of losses (Mena, Adenso-Diaz & Yurt, 2011) [54]. This identification may help water scheme managers to understand the different improvement needs before setting water loss reduction targets.
Researchers have adopted the MFCA model in different organizations in the past, resulting in energy and resource efficiency achievement. Schmidt and Nakajima (2013) [55] used the Canon industry as a case study renowned for its production of the camera. The study tested the production of single-lens reflex cameras and found that waste occurs more during the grinding process. Although conventional accounting only accounted for the defective products, the application of MFCA showed that a large part of the costs is connected with material losses due to defective products and waste. Fakoya and van der Poll’s (2013) [56] study on the alcoholic beverage industry integrated MFCA with the Enterprise Resource Planning (ERP) system to generate waste cost information for decision-making. The study concluded that integrating the ERP and MFCA systems would assist in quickening the accessibility of waste information for managers to make a prompt decision. However, Fakoya (2014) [34] states that manufacturing and other industries, such as the brewery cost system, are centered on established standard costs where actual costs are compared before the resulting variance cost is analyzed and addressed.
Viere, Stock, and Genest (2013) [57], in a study conducted using the SWU Special Yarns GmbH & Co. KG (Südwesttextil e. V.), a textile company as a case study, used MFCA to calculate the material and energy flow-based costs of fibers. The material and energy flow-based costs of the fibers were calculated and matched against the sale of its residue. It found that MFCA provided a better understanding of cost drivers of material and energy usage. It also provided new and accurate information on inefficiency about the differences in costs and product-specific costs. Likewise, Trappey, Yeh, Wu, and Kuo (2013) [58] conducted research using Kansai electric power (KEP) and Tokyo Electric power (TEP) as a case study and found that the application of MFCA to its new technology of power generation allowed the negative output of products and waste to be made transparent to the management. Moreover, the application of MFCA to TEP’s nuclear power generation assisted in the disclosure of both internal and external waste. It also provided information such as the output data information of plants’ power consumption, power transition, power transitions, and water pumps. Also, Trappey et al. (2013) [58], in a study of MFCA at the Innolux Corporation, an optoelectronic industry, found that the adoption of MFCA reduced its material costs and minimized negative environmental impacts.
Similarly, in the Czech Republic, Hyršlová, Palásek, and Vágner (2011) [52] did a study using MFCA in a ceramic tiling plant. MFCA was applied in the various manufacturing stages from input to output. This was divided into three cost centers with an existing management accounting system, which included the preparation of materials, preparation of glazes, and manufacturing. It was found that the grinding, drying, pressing, glazing, burning, sorting, and packaging stages were the stages where most material losses happened. Moreover, the authors prescribed that MFCA calculation and the preparation of a material quantity center should focus on phases of material losses. From these previous studies, it can be concluded that the implementation of MFCA to the water utility company in South Africa will improve cost-capturing related water losses during purification. The information on water losses through leakages will also assist managers in making the right decision.
Besides this, it takes time to reach the desired waste reduction targets by setting realistic and feasible limits. Water scheme managers may need to assess progress quarterly, bi-annually, or yearly to check the achievement level recorded. The attainment of the desired level of waste reduction takes time because there is no quick solution (Boos, 2013) [59]. Determining the quantity and costs of water loss during the water purification process is the starting point for making informed water loss decisions (Lehr, Thun & Milling 2013) [60]. Hence, employing the MFCA model in harmony with current waste-reduction policies may provide substantiation to improving water loss reduction decision-making. The MFCA model demands that managers (water scheme managers) react to feedback about inconsistencies resulting from planned water loss reduction targets through monitoring and controlling for enhanced decision-making. This should be accepted as being an on-going process without an endpoint of having ever achieved full efficiency levels. In effect, we argue that in executing corrective actions, water scheme managers can no longer depend on existing water loss reduction strategies.

3. Methods

We did a case study and implemented the MFCA model to highlight areas of inefficiencies within the Doorndraai Water Treatment Scheme (DWTS). We also sought to understand whether the use of the existing conventional accounting system by the DWTS was sufficient in capturing the volume and monetary value of water loss during the water purification process to improve water management decisions. The case study approach could aid the generalization from individual cases in a logical way, primarily where production follows a similar pattern (for example, water utility companies) (Yin, 2014) [61]. Moreover, we utilized the case study approach to incorporate participants’ views as it is often used in management accounting research to provide an understanding of practices appropriate for the context being investigated (Berry, Coad, Harris, Otley & Stringer, 2009; Fakoya, 2014) [34,62].
The convenience sampling approach is suitable for an exploratory study to generate innovative ideas (Alvi, 2016) [63]. Thus, we utilized a case study using the “convenience” approach in gathering relevant data that would have been impossible using probability sampling techniques, which require more formal access to a defined population. For this study and because of the non-cooperation and inability to gain access to the other water utility company because of their indifference to researchers, it is reasonable to use the water utility company that provided the researcher with the opportunity to use its facility as a case study.
Data collection for this study started with an in-depth interview, direct observation, and the use of physical artifacts (which is the use of the Umberto Efficiency+ software) as the primary data collection method. In a case study design, direct observation is often employed. A case study usually takes place in the natural setting of the “case,” thus allowing the researcher to observe directly. Direct observation contributes as a source of evidence to develop a reliable case study (DeWalt & DeWalt, 2010; Yin, 2014) [61,64]. Researchers can reliably observe what is happening in a social setting, interact with participants, and participate in activities through direct observation. Direct observation is described by another term, such as participant observation, site visits, or fieldwork (Yin, 2014) [61]. Direct observation was expedient for this study because it provided insight into the everyday activities that participants in the study do not report. It provided the researcher with direct experience of the phenomena being studied and creates an opportunity to observe social settings rather than focusing on the participants’ narrative descriptions (Struwig & Stead, 2013) [65].
For the complexities in many situations (as with this study—water purification processes) to be fully understood, direct participation in and observation of the phenomenon of interest may be the best research method (Yin, 2016) [66]. However, it is vital for the data collected to be descriptive for the reader to understand what happened and how it happened. For this study, observational data was relevant because it helped the researchers overcome discrepancies between what participants say and what they do. Also, it helped in uncovering participants’ behavior.
Physical artifacts are a device in the form of a technological device, a tool, or instrument (Yin, 2016) [66]. For this study, Umberto Efficiency+ software was used. The Umberto Efficiency+ software was designed by ifu Hamburg GmbH (Hamburg, Germany), and is used to calculate the potential environmental impacts of a product’s process waste. It is an MFCA tool and instrument used to identify and calculate the real cost of process waste and material losses, and identifies cost drivers for processes, material, and energy within the production system. The Umberto Efficiency+ software creates resource (material and energy) flow models to identify inefficiencies in a production process. This software assisted in calculating hidden costs as they can profoundly influence the economic relevance of material losses. In this research, the Umberto Efficiency+ software was used to measure resource efficiency at every process of purification. It was used to calculate the true costs of material losses and material flows and cost using the Sankey diagram (defined later in the paper). To better understand the production processes, the Umberto Efficiency+ software, through the Sankey diagram, create a visual graph that depicts the energy and material flows, which enhances the transparency of the processes. It shows all the positions of hidden costs, which are often higher than the traditional input-output approach of calculating production cost by including all systems costs in the MFCA calculation. Besides this, the Sankey diagram captures process cost at every quantity center, and when adequately analyzed, it reveals processes where inefficiency happens; thus, corrective action can be taken to save, reduce, or eliminate resource losses. The green nodes or circles represent the input, the blue cookies represent the quantity center, the yellow circles represent the intermediate goods, and the red nodes or circles represent output (“good” or “negative”). After that, the Umberto Efficiency+ software analyzes the data entered in the different nodes and presents it in a ledger format in cost tables (see Table 1, Table 2, Table 3, Table 4, Table 5, Table 6, Table 7, Table 8, Table 9 and Table 10).
The journey for data collection started with the researcher applying for ethical clearance at Lepelle Northern Water for permission to research one of their water treatment schemes. We obtained permission to use the DWTS located 26 km North of Mookgopong and 25 km Southwest of Mokopane in the Limpopo Province, South Africa. Apart from the in-depth interview at the Doorndraai water scheme, the researcher was taken around the scheme to witness the water purification process during the various visits to familiarize himself with and to document the processes that enabled the development of the water processing site. A graphical representation is depicted in Figure 1. This presented the researcher with a chance to directly observe how the water purification was done and document findings by asking questions during the scheme tour. We informed participants of their ethical rights during the in-depth interview and that they could decline to answer if they were uncomfortable with it.
Furthermore, participants knew about the recording devices (cell phone and laptop cameras) used during the interview to capture discussions effectively. The interview guides included unstructured and open-ended questions, thus, allowing for follow-up questions when required. We assured participants that all information provided throughout the interview was exclusively for the current study.
Data for this study were analyzed in two phases because of the mixed approach used. Likewise, data collection during the in-depth interview followed the methodologies of qualitative data analysis, data representation, identification, verification, and conclusion. The researchers collected the quantitative data through direct observation during the water purification process and from the daily water processing records provided on-site by the scheme manager. We recorded the water volume and other costs at every stage of purification; these were then measured against the output by inputting the data into the Umberto Efficiency+ software. Additionally, we used the Umberto Efficiency+ software to analyze data collected at every stage of the purification process and calculate the “true” cost of water and material losses in the flow processes and to create the water scheme, Sankey. We drew the Sankey diagram to illustrate a graphical water purification process for the water treatment scheme. The researchers adopted a non-subjective approach to the study. The participants selected were personnel in the departments directly involved with the water purification process. They were requested to tell their “story” about existing accounting and processing-related practices at the water scheme. Up-to-date water processing data were gathered during the visit to the water purification process. These data were for the quantitative analysis and represented current realities at the DWTS. Data from the water purification process underscored areas of inefficiency and water loss in the DTWS.

3.1. Background: Doondraai Water Treatment Scheme (DWTS)

The DTWS is one of the water purification plant sites under the Lepelle Northern Water. It is situated approximately 26 km north of Mookgopong and 25 km southwest of Mokopane in the Limpopo Province of South Africa, and it is responsible for the production and purification of 12 megaliters (12 million liters) of water daily. The plant is run by the scheme manager, who is the head of the plant, and whose appointment is at the management level. The scheme manager is assisted in the plant by the production officer (supervisor) who oversees the production process. The production officer is assisted in the water purification process by process controllers who work in shifts. The plant also has maintenance officers who oversee the maintenance of equipment. Additionally, there are instrument technicians and artisans who make up the entire workforce at the water scheme.
We approached the LNW head office for permission to use the DWTS as a case site. This was done to demonstrate that the MFCA system can improve decision-making in a water utility. Nevertheless, for some time, the DWTS had been operating at a loss.

3.2. The Doorndraai Water Treatment Scheme Current Cost Accounting System

At the Doorndraai Water Treatment Scheme, as it is with other plants under Lepelle Northern Water management, the scheme relies on the input-output system in calculating the percentage and cost of water loss during purification. By this approach, water loss is calculated by subtracting the raw material (input) from the output of processed water (output). Besides this, it is significant to note that the tariff or rate charged by the Doorndraai Water Treatment Scheme per liter of processed water is determined by the Department of Water and Sanitation (DWS), which is the supervising department for all water utilities in South Africa through a legislative mandate. Information on water loss during purification is recorded daily by employees in charge of the water purification. It is significant to mention that there is no on-site accountant to verify the data captured by the field officers responsible for water purification. However, a regional accountant visits the site once every month to look at the production charts, which in the view of the researcher, may not be accurate.
Around the world, some water utilities have adopted management accounting practice, for example, the City of Bielsko-Bialav in Poland, the Scotland Water and Sewerage Corporation, the Philadephia Water Department, and the Haiphong Provincial Water and Sewerage Corporation in Vietnam (Baietti, Kingdom & van Ginneken, 2006) [67]. In the South African context, according to the Department of Water Affairs and Forestry (DWAF) (2011) [68], the current cost accounting system used by water utilities has been ineffective in capturing water loss and all other water-related costs during the water purification process. The inadequacy of the current cost accounting system to support managers in effective water-related costs decision-making was alluded to by Kotzee (2016) [69]. Thus, to completely capture all water-related costs and leakages during the purification process, which the current cost accounting system overlooks (Kotzee, 2016) [69], it is vital to adopt an appropriate management accounting system (MAS). The importance of capturing and matching all water-related costs during the water purification process cannot be overemphasized in a water utility because such information will assist scheme managers in determining the real cost of water purification and in the effective pricing of processed water. In relating this study to the contingency theory approach, which posits no one-size-fits-all organizational issues, it is expedient that the contingent situation is addressed as they arise using the most suitable approach. Thus, a MAS capable of providing information to management on captured water loss and water-related costs during the water purification process is used.
Presently, the water scarcity in South Africa is due to insufficient rainfall, wastages, and inappropriate capturing and matching of water-related costs at various points of the water purification process. Subsequently, a project initiated by the South African Water Research Commission (WRC) has been promoting how to treat unaccounted-for water, which has also helped water management. Additionally, Mckenzie, Siqalaba, and Wegelin (2013) [70] state that leakages can be avoided at a cost lower than initiating a new water project. However, the literature search reveals that there has been no research on how to capture losses and other water-related costs during the purification process that will lead to a decline in the per capita water availability. The Water Services Act 1997 is where the dictate of the water utility is derived, and it entails that water utilities conform with the Public Finance Management Act (PFMA), the Municipal Finance Management Act (MFMA), the Treasury Regulations (TR), the Division of Revenue Act (DRA), and the Municipal Structures and Systems Act (MSSA). Besides this, these Acts have been inappropriate to provide sufficient water purification information to enable informed water loss decisions among the water utilities.

4. Findings on the Application of the MFCA Model to the DWTS

In the above section, we provided a more detailed description of the methods currently used by the company to detect water and energy losses. This enabled us to make a comparison between the evidence available through the conventional method and the data collected and analyzed with the implementation of the MFCA model. As earlier stated, the Doorndraai Water Treatment Scheme uses the input-output system to determine the volume of its water loss; the challenge is that energy losses and other systems or conversion costs in water loss during purification were not included in the analysis. The non-inclusion of energy losses and other systems or conversion costs in water loss during purification is the main deficiency of the current cost accounting system used by the Doorndraai Water Treatment Scheme. The point here is not whether the MFCA model can detect water losses, but instead, it makes visible or transparent any phase or stage of the water purification process that needs improvements, otherwise hidden by the current conventional control system. Notwithstanding, the MFCA model allocates all water purification process-related activities and costs to the final output (drinkable water) and identified inefficiencies (negative output or water loss) to enable managers to make informed improvement decisions.
Water purification requires the input of different chemicals and the necessary expertise before it is suitable for consumption. Although the DWTS of LNW sources its raw water from a nearby dam, it is nonetheless expedient to monitor water loss and water-related costs efficiently considering the effect this water loss may have on the environment apart from the monetary loss.

Implementation of the MFCA Model in DWTS

We applied the MFCA model throughout the whole purification process of the DWTS in May and September 2018. The water purification processes described in Table 1, Table 2, Table 3, Table 4, Table 5 and Table 6 make use of material and energy flows at every stage of the process of water purification except for the sedimentation process of the conventional plant that is done by gravity. In the water purification process, lime, oxidized iron, manganese, “superflocs,” chlorine, and silicon-sand are the input materials used. Pipes then transport the purified water to municipalities for distribution to households and business entities. We used the Umberto Efficiency
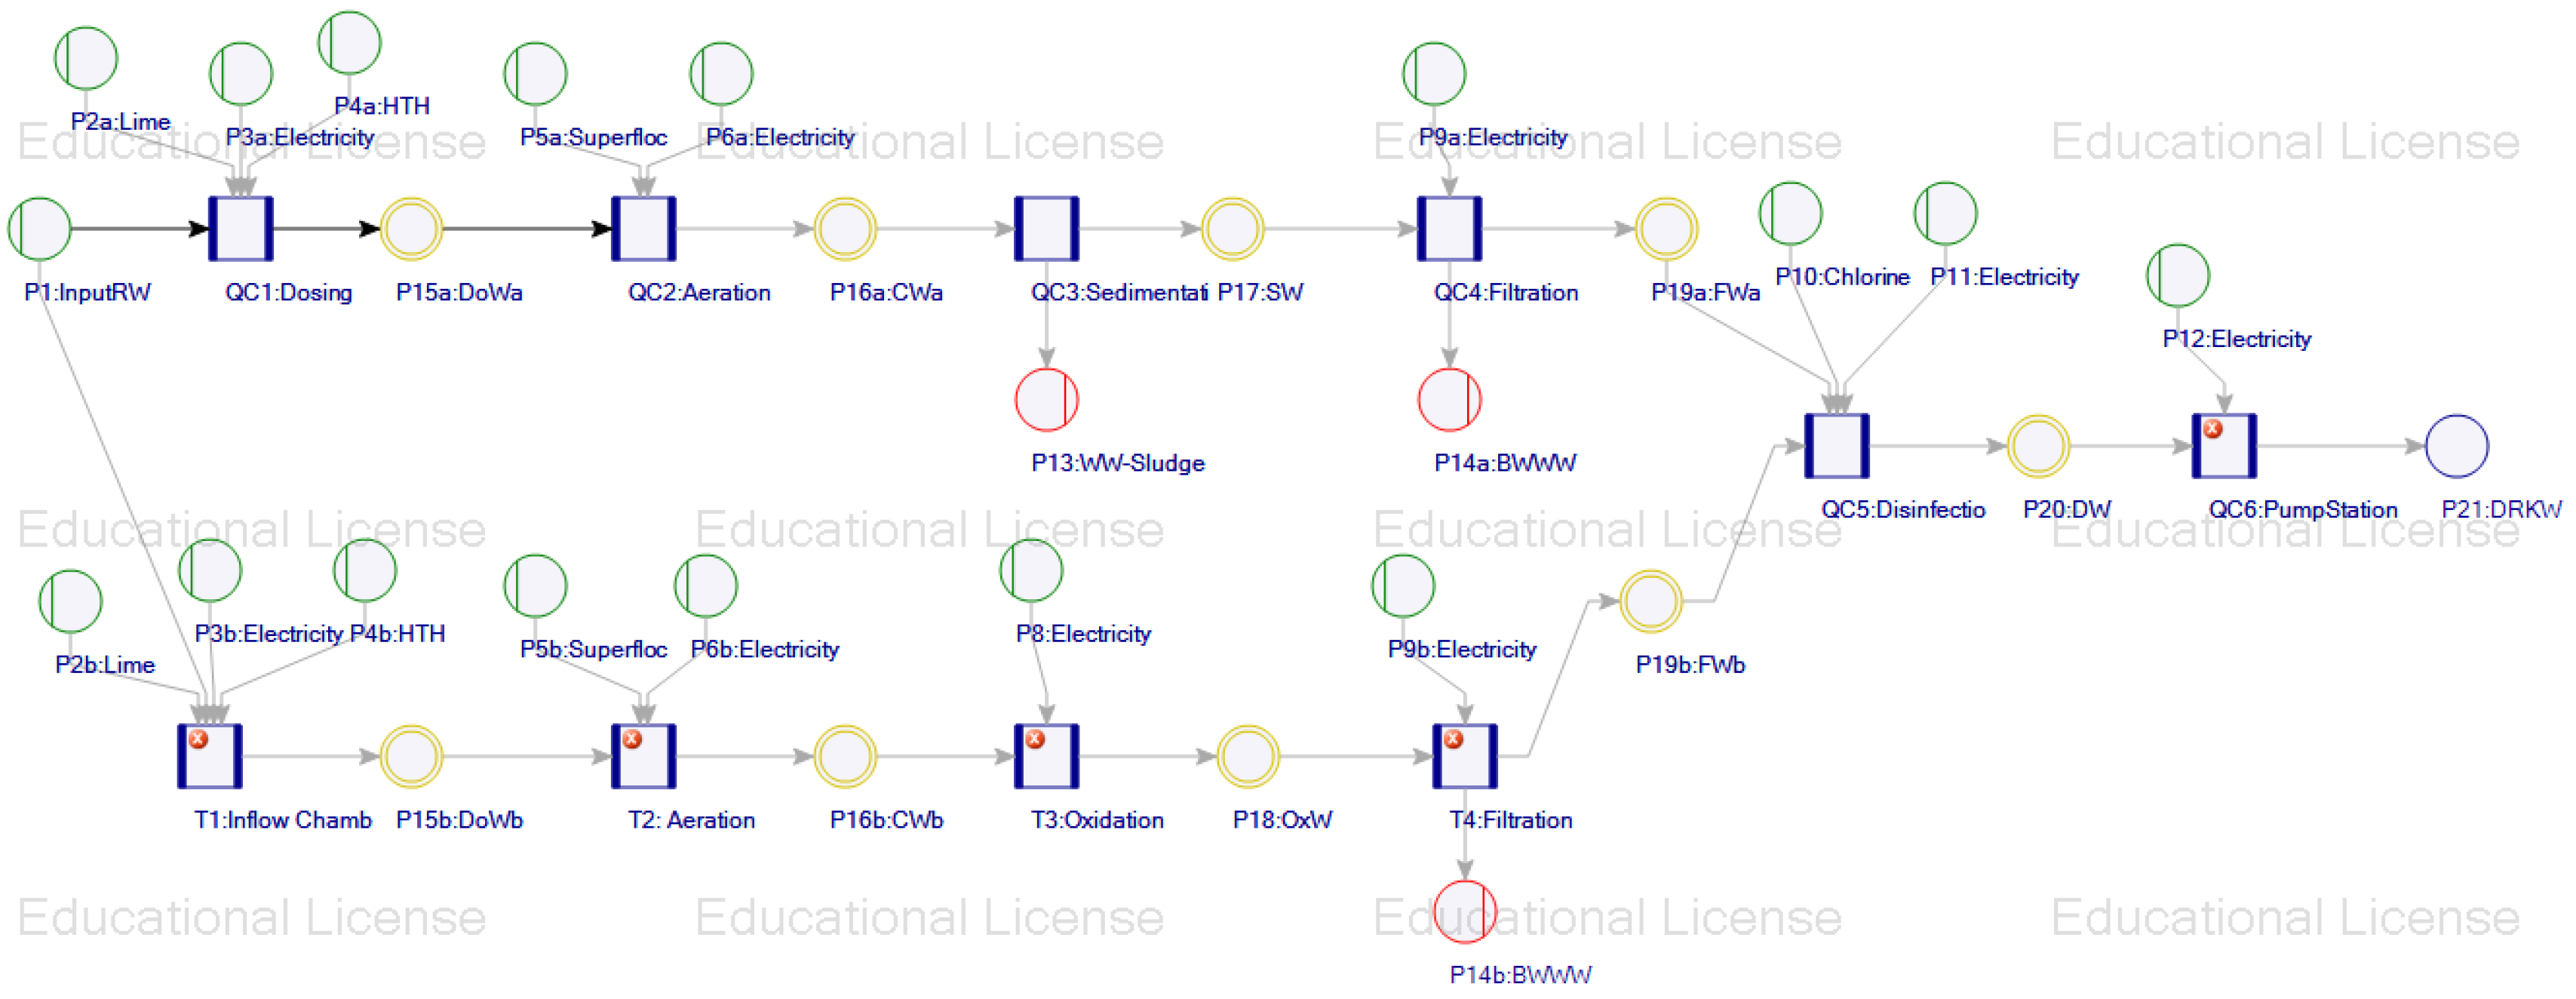
+ software to execute the MFCA calculation to visibly expose areas of inefficiency in the DWTS to improve process efficiency. MFCA can calculate actual material losses and energy usage. The graphical flow chart created by the Umberto model made the water treatment process transparent, hence making the production system easier understood. This graphical representation is also known as the Sankey diagram that helps visualize the energy and material flows in the DWTS (see Figure 1). It links process engineering knowledge with cost-saving during the water purification process to enable an efficient resource process and visualization. The Sankey diagram visualizes all the hidden costs of the production cost. Also, it analyzes costs and water volume at every quantity center, to indicate phases that create material losses to be reduced or eliminated.
Figure 1 represents the total water purification process flow at the DWTS. The total water purification process is made up of a series of processes, namely, dosing, aeration, sedimentation, filtration, disinfection, and pumping, and these are indicated as quality centers on the diagrammatic process flow. The green circles are the input, the blue cookies are quantity centers, and the yellow circles are intermediate goods, while the red circles are output (“good” or “negative”). Figure 1 highlights the two water purification plants (conventional plant and package plant) at the DWTS. The topmost part of the water purification process flow in Figure 1 represents the traditional plant with labels QC1 to QC4 (where QC1 = quantity center 1 and QC4 = quantity center 4) representing the quantity centers, while the packaging plant with tags T1 to T4 (where T1 = quantity center 1 and T4 = quantity center 4) represents the quantity center as well. After data collection, we analyzed the data using the Umberto Efficiency+ software.

Cost Tables

The results of the analyses are presented in Table 1, Table 2, Table 3, Table 4, Table 5, Table 6, Table 7, Table 8, Table 9 and Table 10. The following coloration depicts the different phases of the water purification processes. The green color represents input material, and other resources (good) used at each phase. The orange color depicts the intermediate output, while the red color represents inefficiency or waste (negative). The light blue color represents the final salable output.
Table 1 (QC1) is the dosing process of the traditional plant. QC1 receives 6000 m3 (this is the total daily capacity of the traditional plant) of raw water from the dam as input. At this point, lime and a chemical called calcium hypochlorite (HTH) are added as input. The lime and calcium hypochlorite are meant to disrupt micro-organism cells through oxidation. The energy input in QC1 is used by the machine to blend the chemical combinations with the raw water. Table 1 also shows the quantity and the monetary value of the different input at quantity center 1. It includes 6000 m3 of natural water at R1.33/m3, 1.60 kg of HTH at R37.60/kg, 44.88 kW of electricity at R4.75 kW/h, and 150 kg of lime at R5.50/kg.
Furthermore, Table 1 shows the total output from this process, which is represented as DoWa, which is then transferred to the next purification process known as aeration. The total volume of water purified at quantity center 1 is 6000 m3 of water at R1.5182/m3. It is noteworthy that there is no water loss at this process in water purification.
Table 2 shows the second stage of the water purification process in a conventional plant known as aeration. The output of QC1 becomes the input of QC2 because it is a process. At this quantity center, the inputs are 6000 m3 of DoWa at R1.5182/m3, 0.58 kW of electricity at R4.75/kW, and 71.25 kg of “superflocs” at R12.58/kg. The “superflocs,” which contain iron (Fe) and manganese (Mn), are added at this quantity center to separate impurities from the water and make finer particles form. The electrical energy used during this process is not high when compared to the electricity used in QC1 because of the capacity of the machine. The total output from this quantity center is 6000 m3 of the “good” product at R1.6630/m3, represented as CWa in Table 3. This is transferred as an input to the next process known as sedimentation.
The third process of water purification at the conventional plant is the settling tank or sedimentation. This process receives “good” product of 6000 m3 of water from QC2 at R1.6630/m3 from the other process of water purification known as aeration. The sedimentation process is where heavier flocs can settle down for good quality water flowing through the weirs (channel) to the next purification process. During this process in the conventional plant, no added cost is incurred for chemicals or electricity; hence, the price per cubic meter (m3) remains the same. The movement of processed water to the next purification process is done by gravity. It is important to note that water loss occurs at this quantity center during the water purification process. Water loss (“negative” product) of 2.5 m3 was captured at this process; hence, the output represented as SW in Table 3 is 5997.50 m3 at R1.6630/m3. The water loss in this process results from sludge formation, whereby the heavier flocs settle down, allowing “sedimented” water to flow to the subsequent process of the water purification. The “negative” product in this process was not included in the table because, in a costing process, all inefficiencies (the “negative” product) are included in the calculation of the “good” product so as not to lose the critical aspect of the water purification cost.
Table 4 shows the fourth process in the water purification process of a conventional plant, the filtration. Water input of R5997.50 m3 at R1.6630/m3 was received from QC3, and 58.30 kW/h of electricity at R4.75/kWh was used at this quantity center. In QC4, water purification happens through sand filtration using filter nozzles to remove impurities trapped and backwashed. The high energy consumption in QC4 results from high usage of machine capacity for backwashing. It is done for about one and a half hours. QC4 recorded water loss amounting to 104 m3. The water loss is occasioned by backwashing to flush trapped impurities from the water. The amount of “good” water transferred to QC5 is 5893.50 m3 at R1.7401/m3. Table 4, which is the filtration phase of the conventional plant, is merged with the packaged plant (the two plants converge at the disinfectant phase in Table 9, where the outputs of these plants are combined into one phase (see the Sankey diagram)). Table T1 (Inflow Chamber) is the first phase of the packaged plant (consists of Tables T1–T4), which later combines with the output of the conventional plant at QC5 for disinfection before being transferred to the pumping station (QC6) for distribution to the municipal bulk water tank (to be distributed to users). The conventional plant consists of Tables QC1–QC4.
Table 5 shows the first process of water purification in the packaged plant known as the inflow chamber for this study. This process is like that found at the conventional plant. Input for this quantity center was 6000 m3 of raw water from the dam at R1.33/m3, 50 kg of lime at R5.50/kg, the energy consumed was 25.22 kWh at R4.75/kWh, and calcium hypochlorite of 0.40 kg at R37.60/kg was added. The lime and calcium are reagents to disrupt micro-organism cellular processes by oxidation. Machines used energy consumption in T1 for dosing. The total output from T1 is 6000 m3 at R1.4000/m3, and this becomes an input for T2 in the water purification process for the packaged plant known as aeration.
Table 6 shows the second water purification process for a package plant known as aeration. The input for this quantity center is 6000 m3 at R1.4000/m3, 22.50 kg of “superflocs” at R12.58/kg, and 0.54 kW/h at R4.75/kWh of electricity. The “superflocs” are a chemical the removes impurities from the processed water at this stage of water purification in a package plant. T2 recorded no water loss. Hence, total production, represented by CWb in Table 6 of 6000 m3 at R1.45/m3, was used as one of the inputs in the next purification process known as oxidation.
Table 7 shows the oxidation process of water purification in a package plant. This process is the second stage of aeration. The input at this process is 6000 m3 of processed water at R1.4500/m3 and electricity of 36 kWh at R4.75/kWh. The energy consumption in T3 resulted from the oxidation tank mixer used during water purification. No water loss was recorded in T3. Hence, the total output from this quantity center was 6000 m3 at R1.4802/m3, represented as OxW in Table 7, and it was used as one of the inputs in the next water purification process known as filtration.
Table 8 shows the filtration process of the water purification for the packaged plant at the DWTS. The input for this process is 6000 m3 of processed water from the oxidation process at R1.4802/m3 and 809.25 kWh at R4.75/kWh of electricity. T4 recorded a water loss of 253 m3. The “good” product bears the cost of the “negative” product. Furthermore, water loss and high electricity consumption resulted from the backwashing done at this quantity center for a package plant. Therefore, the total output from this process is 5747 m3 of water at R2.1210/m3, represented as FWB in Table 8. This output became input at the next process called the disinfection process. In Table QC5, both the conventional and packaged plants outputs are combined at the disinfection phase (hence, we have the output of both the conventional plant (FWA—5893.50 m3) and the packaged plant (FWB—5747 m3) totaling drinkable water (DW) in P20: DW of 11,640.5 m3.
Table 9 shows the disinfection process of water purification at the DWTS. This is the processing center where processed water from the filtration process of the conventional plant and the processed water of the “packaged” plant are combined for disinfection. Table 9 shows the input from the two plants represented on the table as FWa for conventional plant and FWb for the packaged plant. The added input at this quantity center is chlorine of 28 kg at R28.55/kg and electricity of 52.80 kWh at R4.75 kWh. The addition of chlorine, known as chlorine gas at this quantity center, kills toxic micro-organisms in the water. The processed water is then allowed to settle in the contact reservoir to allow the chlorine to mix with the water and fit for human consumption properly. The energy used in QC5 resulted from the use of a machine to disinfect the water. It is imperative to note that no water loss was recorded in QC5. The total output for this quantity center was 11,640.50 m3 of water at R2.1206/m3, used as input at the last process of water purification known as the pump station.
Table 10 shows the last process of water purification at the DWTS, known as the pump station. The input of 11,640.50 m3 of processed water from the disinfection process amount to R1.95/m3 and consumes 12,384 kWh of electricity at R4.75/kWh, which resulted in the production of 11,640.50 m3 of water at R7.00/m3. The abnormal increase in the price per m3 at this quantity center is because of the high capacity pumping machine used for this process of water purification. The processed water is pumped to the municipal reservoir for distribution to the public for consumption. Results from Table 10 show the “true” cost of water purification at the DWTS as R7.00/m3, which is higher than R6.75/m3 presently charged by DWTS (it should be noted that the water tariff of R6.75/m3 charged by the DTWS is the regulated tariff approved by the Department of Water and Sanitation, South Africa for bulk water sale to municipalities). Thus, we reiterate that one way of effectively managing water resources is to appropriately capture the volume of water loss and water-purification-related costs to improve its efficiency. The overhead costs of the DWTS are shown in Table 11.
Table 11 displays the total overhead expenses on water produced at the DWTS. Production overhead cost is integrated into material and energy or system costs to make up the production cost. The inclusion of overhead costs enables the calculation of the “true” water purification cost. Besides, it is necessary to include related personnel costs in determining accurate production cost. Consequently, the ZAR8.6508/kl includes all expenses related to daily water treatment at the DWTS.
Nonetheless, the exemption of the daily ZAR1.6508/kl overhead cost calculation resulted in erroneous water purification costs and, subsequently, inaccurate water pricing. Such erroneous cost calculation and subsequent incorrect pricing limits managers’ ability to implement cost-saving opportunities. The failure of the current costing system to gather all associated water processing costs may have failed to rectify continuous water loss incurred daily. Besides, water pricing by the DWTS is subject to the Department of Water and Sanitation’s (DWS) fixed water tariff policy as the supervising government department. Thus, we argue that the DWS should allow water utilities to function as a profit center by allowing them to determine the price of their product. Similarly, because the DWTS relies on the DWS to pay its personnel salary, the DWS has allowed the DWTS and LNW’s management to overlook apparent production-related losses.
The MFCA system can provide support for the managerial decision about water pricing, as it can make visible and transparent stages or phases in the water purification process that are inefficient, for instance, in this study, the problem of the pumping device with a low capacitor. The management of the DWTS has failed to pick out the inefficient capacitor of the pumping machine for years, thus incurring daily losses. Besides this, we found from the MFCA analysis that energy cost resulting from the inefficient pumping device was not included in the input-output approach of determining water purification costs. Likewise, by revealing inefficient stages in the water purification process, the MFCA analysis enables the management of DWTS to fulfill its environmental and economic responsibility sustainably.
Regarding the pricing of the output water, the MFCA analysis shows that the DWTS’s water pricing decisions were underestimated by about 21.97% ( ZAR 1.9008 ÷ ZAR 8.6508 ). The reason for the underestimation is because water utilities do not depend on water production cost to determine its water pricing, but rely on the water tariff regulation by the Department of Water and Sanitation (DWS) influenced by the Water Act, which regards water provisioning the constitutional right of its citizens. Besides this, in terms of the total cost of ZAR8.6508/kl, it is worth noting the high proportion of the direct costs of ZAR7.00/kl. Nonetheless, of more significance is the impact which the one task of the pumping station has on the high cost of water purification is ZAR5.05/kl or 72% of the direct water purification cost. Hence, we suggest that any efficiency saving in this phase of the water purification process will have a significant effect on the overall cost. Thus, we reiterate that one way of effectively managing water resources is to appropriately capture the volume of water loss and water-purification-related costs to improve its efficiency.
The DWTS is operating at a loss of ZAR1.9008/kl. The current cost accounting system of DWTS is inadequate to capture water loss and the related cost information. A more specific waste capturing system is needed to expose the actual water loss and related costs to support the manager’s decision-making and create opportunities to minimize losses and cost-saving. Material loss is the excess of raw material that does not become saleable output. Reducing material loss means better resource efficiency and more cost-saving opportunities for any organization. Estimating and attributing costs to material losses is an essential aspect of purification, which would help in improving material usages, and in turn, reduce direct costs. The water utilities in South Africa are responsible for capturing water loss and its related costs in order to know the “true” value of water purification and so maximize profit. Using a suitable management accounting system can capture accurate water loss and its related costs information. In so doing, it enables water scheme managers to make informed water loss reduction decisions. Findings from the DTWS revealed the absence of an accounting system for capturing water loss during the water purification process. This study has proven that the implementation of MFCA and the extension of its implementation is achievable in state-controlled agencies South African water utilities. The implementation of the MFCA to capture water loss-related costs data is lacking in DWTS. Evidence from the study’s analysis shows that the MFCA could help managers make effective water loss reduction decisions when the full cost of water purification is known.

5. Discussions

DWTS’s commitment to capturing water loss and its related costs during the water purification process is non-existent because of unavailable records to show earlier recordings. The cost calculation at every quantity center is a vital part of the data gathering (METI, 2007) [44]. This cost calculation gives an overview of the cost and expenses incurred at each quantity center for the right water pricing. The data analysis (Table 1, Table 2, Table 3, Table 4, Table 5, Table 6, Table 7, Table 8, Table 9 and Table 10) provides a pictorial view of each quantity center, and information can be extracted at a glance. The results from the Sankey diagram and analysis tables indicate that the input-output measurement system used by DWTS is inadequate to capture leakages and water-related costs during purification, and the data is insufficient to support informed water management decisions. This confirms findings from the in-depth interview. Figure 1 represents the DWTS flow model representing the flow and exchange of information within the water purification process. The model graphically shows the data flow through the water purification process by describing the processes involved in transferring data from the input process to the final procedure of the water purification process.
In examining the extent to which current cost accounting in LNW capture and supports improved water-related decisions, there is a need to assess whether the existing cost accounting system in DWTS is enough to improve water management decisions. We found that, presently, no management accounting system is used to capture water-loss-related costs during the water purification process at the DWTS. The absence of a management accounting system indicates that information on water loss and related costs was not available to managers for effective water management decisions. The DWTS uses the input-output approach to measure the percentage of water loss throughout purification. The scheme manager relies on information supplied weeks after the completion of water purification. This assertion was made when the scheme manager was asked if the DTWS uses a management accounting system to collect water loss and its related cost, and he replied with this statement:
“We do not have any (accounting) system to record water loss at every stage of water purification. What we do is measure the input/output, and if we get a percentage more than we usually have, that is when we raise an eyebrow.”
We assumed, given the response of the scheme manager, that the capturing of water loss and its related costs have not been given any special consideration at DWTS.
The technically inclined scheme manager and the representative of the Chief Executive Officer (CEO), who is an administrator, respectively, do not see anything wrong with the input-output measurement system currently used by the scheme. However, they welcome the introduction of any process that will be more effective and cost-saving. This assertion was made when they were asked at separate interviews if they knew any other system of capturing water loss. His response was:
“There is nothing wrong with what we are using now. It has been used for a while, and we have been able to measure our product without any problem.”
However, the representative of the CEO gave a thought to consider the introduction of any new water loss capturing system as long as the cost of the system is not more than the problem it is meant to solve.
The use of the input-output measurement accounting system by DWTS is a problem because this data is collected by a non-accounting staff member who might not understand the importance of capturing water loss and its related cost-effectiveness. Also, there is no accountant present at the scheme to verify the daily data collected. The regional accountant only visits the water scheme twice monthly. Although the representative of the CEO informed the researcher that everything is under the control of the scheme manager, there was no visible presence of accounting or finance personnel at any of the water schemes involved in improving data capturing to support managers in water management decision-making. Understanding the amount of water loss and its related cost during water purification will help reduce its occurrence, just as Kokubu and Kitada (2010) [44] allude that it depends on the availability of accurate waste production data. Although the representative of the CEO agrees with this, he, however, asserts that there is no water loss capturing system in place, and he responded as follows:
“We convert the percentage of water loss during purification to a monetary value just for staff to know the equivalent monetary value we are losing during water purification.”
Having a record of the volume of water-loss-related costs connected with water purification will result in improved water management decisions. This assertion is supported by (METI, 2007) [43] that data compilation and collection using the MFCA model reveals wasted materials and expenses in each production process. Though avoiding water loss cannot be entirely guaranteed during purification, it may be controlled if a liter of water loss can be directly attributable to the loss of material and energy cost. In support, Wan et al. (2015) [43] emphasize that the management of material flow utilization can lead to the identification of sources of waste and energy inefficiency in processes. Besides this, the DTWS does not incorporate systems cost attributable to the different water purification phases in its cost calculations only because it relies on determining its loss or gain by deducting output water from input raw water at the end of each production cycle. Hence, Lee et al. (2012) [50] argue that instead of pursuing expensive scientific solutions to reduce waste, managers should endeavor first to determine the cause of water losses and related costs to initiate corrective actions. Moreover, being a state-owned entity, the DTWS is hampered by regulation by the supervising instead of focusing on economic sustainability. Besides this, Asmah-Andoh and Gumede (2016) [12] confirm the consequences of such political interference.
The lack of understanding of material and energy flow discovered during the in-depth interview became clear when data from the MFCA tool was analyzed. The scheme manager, in the in-depth interview, showed that water loss during water purification is always minimal because the result from the input-output measurement system has not always been shocking. However, data analysis shows the contrary. The inability of the scheme manager to acknowledge the flaw in the current costing system is stressed by Scott (2003) [19], that if an organization is to be sustainable, it needs to envisage and include all contingencies of its environment in its plan to achieve success in a changing and dynamic environment. The inefficiency in the capturing of water-loss-related costs is because of the DWTS’s lack of understanding and its non-compliance with the calculation of the material balance, an essential facet of the MFCA model. The current input-output approach at the DWTS is inefficient in collecting water-loss-related costs during water purification. In contrast, Slattery et al. (2012) [13] advocate using an appropriate water management accounting tool to make informed decisions. Besides this, Hassan (2013) [46] contends that it is expedient for managers to understand applying an alternative water purification information capturing technique to reach efficiency. The use of an alternative and appropriate water management accounting tool was highlighted when MFCA was applied to the water purification process of DWTS at the sedimentation (QC3) and the filtration (QC4) center of the conventional plant, as well as at the filtration (T4) center of the packaged plant water purification process. By accounting for materials entering and leaving a production system, mass flows that may have been challenging to measure, become easier to identify. For emphasis, Hyršlová et al. (2011) [52] explain that without a suitable management accounting tool like the MFCA, difficulties may arise in calculating the actual consumption of input energy and other system costs in each process into positive and negative product quantities.
Despite physical and monetary water loss not having been previously captured for comparison, data analysis has nonetheless shown that it is vital for managers to understand the cost of water loss during water purification. This affirms what Molden and Sakhivadivel (1999), Vardon et al. (2006), Launiainen et al. (2014), Meng et al. (2014), and Tilmant et al. (2015) [1,2,3,4,5] explain about previously held practice in conventional water accounting which have focused on the traditional input-output system, which had neglected to account for other systems costs vital to the determination of appropriate water pricing by water treatment schemes. The availability of water loss information is vital for managers to improve water purification efficiency to maximize profit. This view that the current cost accounting system to support managers in effective decision-making is inadequate in South Africa’s water utilities is consistent with Kotzee (2016) [70]. Furthermore, Kotzee (2016) [70] states that because of this inadequacy of the current cost accounting system in production organizations, it is essential for a suitable MAS to be adopted to assist in capturing waste-related costs during production.
A suitable management accounting system is a vital part of an organization because information generated from such a system will likely assist management in making informed decisions. According to the theory of contingency, one size does not fit all situations in all organizations. We implemented the MFCA model to collect data from the DTWS, which gives correct water loss-related information to management. Regrettably, our analysis of the MFCA model implementation could not be compared to any analysis of the current cost accounting system because there was no sufficient capturing of the water purification process cost at the DWTS. The DTWS had relied on the input-output approach of calculating water loss (by subtracting the volume of raw water received as input from the bulk volume of output water pumped out to municipalities water tanks). Process costing is a fundamental concept of management accounting as a form of operation costing applicable for mass-produced goods. The use of the right process costing tool like MFCA could have helped DWTS capture water-loss-related costs because it captures costs linked to water processing. The introduction of MFCA in data gathering for this study exposed the inefficiency of the current cost accounting system at DWTS. This assertion is confirmed when Jasch (2003) [45] argues that implementing the MFCA model allows for more transparent documentation of individual improvements by utilizing cost-saving opportunities. Furthermore, the result from the data analysis shows there is a lack of awareness of capturing water-loss-related costs during water purification by DWTS. Similarly, Schmidt and Nakajima (2013) [56] found that managers often underestimate the degree of waste in their production processes.
In the analysis of data as shown on the quantity centers of Table 3, Table 4, and Table 8, there was evidence of water loss. Still, the current cost accounting system has no record to justify it even though the representative of the CEO during the in-depth interview mentioned that the percentage of water loss captured is assigned a monetary value. Linking physical and monetary data is an essential element of MFCA, which has been neglected by DWTS. The inability to connect physical water loss to monetary value at each water purification stage makes it challenging to fully account for the “true” cost of process loss. The need to fully account for costs of related activities is highlighted by Trappey et al. (2013) [59] on the need to connect both internal and external sources of waste to reduce its material costs and minimize negative environmental impacts. This lack of connection may have caused the actual cost of water-loss-related costs not to be considered by the board of DWTS for effective water management decision-making.
The data analysis also revealed that the DWTS current accounting system is insufficient to improve water management decisions. This is because of its inability to ensure accuracy, completeness, and compatibility of physical data. The effectiveness of the MFCA to provide correct, complete, and compatible physical and monetary information in DWTS would enhance water-related decisions. Combining the MFCA principles with the water purification process will help water scheme managers to capture the “true” cost at every stage of the water purification process. This information will assist managers in water-related costs and water management decisions. It is clear from the results of the data analysis that the DWTS was not applying the MFCA to help in the allocation of value at every quantity center in the purification process. MFCA would help allocate both direct and indirect costs to a process for inventory evaluation, cost-effectiveness analysis, and price decisions. The primary purpose of the MFCA tool is to record all the costs and expenses related to production and present this information to managers for improved water management decision-making. Implementing the MFCA model at DWTS would help in inventory evaluation and improve pricing decisions by managers.
Furthermore, findings from this study show that using water loss and its related costs information, supplied by implementing the MFCA, can enhance decision-making in water utilities across South Africa. We arrived at this inference because what is not measurable cannot be managed. Upon completion of data gathering and analysis, we presented our findings to a committee appointed by the management of LNW, where the Sankey diagram was explained, and the corresponding tables explained as well. At this point, and because of the analysis we provided, we found that the capacitor of the pumping machine used to pump water to the municipal reservoir was inefficient. This was the reason for the high costs recorded at the pumping stage. One of the Research and Development technicians suggested that the study should include a chemical engineer or a chemist who would be able to point out the chemical components of each reagent as well as the cost involved. However, we pointed out that the scope of the study was to gather process cost data used during the water purification process and that the study is about sustainability.

6. Conclusions

We examined how the inadequate capturing of water-loss-related information in the DWTS inhibits effective decision-making to initiate corrective measures to address inefficiencies in its water purification process. To eradicate the purification process inefficiencies, the capturing of the correct value of water loss is essential for helping managers make the right cost-saving decisions. Therefore, implementing the MFCA model has proven to be vital in generating water purification information to assist water scheme managers to make informed water loss reduction decisions. Further, the conventional accounting system used in the DWTS has failed to provide sufficient water loss information. The application of the MFCA model helped the scheme manager identify the pumping process as the reason for the continual operating loss.
Consequently, we suggest that the implementation of the MFCA model becomes an integral part of organizations’ sustainability decisions. Besides this, the paper extended the implementation of the MFCA by providing an example of how the managerial accounting system can support environmental and economic sustainability in water purification processes. Thus, we reaffirm that one way of effectively managing water resources is to appropriately capture the volume of water loss and water-purification-related costs to improve its efficiency. In generalizing our results, we believe that majority of state-controlled businesses will benefit from implementing the MFCA model to highlight areas of inefficiencies in their operations because they continually suffer being regulated by supervising ministries or departments through political interference, which often makes them unprofitable because of the overreliance on grants and government bailouts when they underperform. The study may have suffered from some natural limitations such as subjectivity and generalization. One possible limitation of this paper is that it is based upon data from a single water utility; thus, the makeup of participants, organizational practices, resources, and operating characteristics potentially limits the generalizability of our results.

Author Contributions

Both the authors were involved in all aspects of the study. We declare that it was a joint contribution. All authors have read and agreed to the published version of the manuscript.

Funding

This research received no external funding.

Acknowledgments

We acknowledge the support of the Lepelle Northern Water (LNW) for the use of its facility as a case study site for this study.

Conflicts of Interest

The authors declare no conflict of interest.

References

  1. Molden, D.; Sakthivadivel, R. Water accounting to assess use and productivity of water. J. Water Res. Dev. 1999, 15, 55–71. [Google Scholar] [CrossRef]
  2. Vardon, M.; Lenzen, M.; Peevor, S.; Creaser, M. Water accounting in Australia. J. Ecol. Econ. 2006, 61, 650–659. [Google Scholar] [CrossRef]
  3. Launiainen, S.; Futter, M.N.; Ellison, D.; Clarke, N.; Finer, L.; Hogbom, L. Is the water footprint an appropriate tool for forestry and forest products: The Fennoscandian case? Ambio 2014, 43, 244–256. [Google Scholar] [CrossRef] [PubMed] [Green Version]
  4. Meng, J.; Cheng, G.Q.; Shao, L.; Li, J.S.; Tang, H.S.; Hayat, T.; Alsaedi, A. Virtual water accounting for building: Case study of E-town, Beijing. J. Clean. Prod. 2014, 68, 7–15. [Google Scholar] [CrossRef]
  5. Tilmant, A.; Marques, G.; Mohamed, Y. A framework based on marginal resource opportunity cost. Hydrol. Earth Sys. Sci. 2015, 19, 1457–1467. [Google Scholar] [CrossRef] [Green Version]
  6. Molden, D. A Comprehensive Assessment of Water Management in Agriculture; Earthscan: London, UK, 2007. [Google Scholar]
  7. Van der Zaag, P.; Juizo, D.; Vilanculos, A.; Bolding, A.; Uiterweer, N.P. Does the Limpopo river basin have sufficient water for massive irrigation development in the plains of Mozambique? J. Phys. Chem. Earth Parts A/B/C 2010, 35, 832–883. [Google Scholar] [CrossRef]
  8. Onda, K.; LoBuglio, J.; Bartram, J. Global access to safe water: Accounting for water quality and resulting impact on MDG progress. Inter. J. Environ. Res. Pub. Health 2012, 9, 880–894. [Google Scholar] [CrossRef] [Green Version]
  9. Chalmers, K.; Godfrey, J.M.; Lynch, B. Regulatory theory insights into the past, present and future of general-purpose water accounting standard-setting. Account. Audit. Account. J. 2012, 25, 1001–1024. [Google Scholar] [CrossRef] [Green Version]
  10. Ringler, C.; Bhaduri, A.; Lawford, R. The nexus across water energy, land and food (WELF). Potential for improved resource use efficiency. J. Curr. Opin. Environ. Sustain. 2013, 5, 617–624. [Google Scholar] [CrossRef]
  11. Karimi, P.; Bastiaanssen, W.G.M.; Sood, A.; Bastidas-Obando, E.; Dost, R. Spatial evaporation, rainfall and land use data in water accounting-Part 2: Reliability of water accounting policy results for policy decisions in the Awash basin. J. Hydrol. Earth Sci. 2014, 11, 1125–1167. [Google Scholar] [CrossRef] [Green Version]
  12. Asmah-Andoh, K.; Gumede, N. Prescriptions of the national development plan for state-owned enterprises in South Africa: Is privatization an option? J. Public Admin. 2016, 51, 265–277. [Google Scholar]
  13. Slattery, M.; Chalmers, K.; Godfrey, J.M. Beyond the Hydrographer’s Legacy: Water Accounting in Australia; Edward Elgar Publishing Ltd.: Cheltenham, UK, 2012. [Google Scholar]
  14. Chenhall, R.H. Management control systems design within its organizational context: Findings from contingency-based research and directions for the future. Account. Org. Soc. 2003, 28, 127–168. [Google Scholar] [CrossRef]
  15. Christ, K.L. Water management accounting and the wine supply chain: Empirical evidence from Australia. Brit. Account. Rev. 2014, 46, 379–396. [Google Scholar] [CrossRef]
  16. Emmanuel, C.R.; Otley, D.T.; Merchant, K.A. Accounting for Management Control, 2nd ed.; Thomson Learning: London, UK, 1990. [Google Scholar]
  17. Ismail, K.; Zainuddin, S.; Sapiei, N.S. The use of contingency theory in management and accounting research. Asian J. Account. Perspect. 2010, 3, 22–37. [Google Scholar] [CrossRef]
  18. Islam, J.; Hu, H. A review of literature on contingency theory in management accounting. Afr. J. Bus Manag. 2012, 6, 5159–5164. [Google Scholar]
  19. Scott, W.R. Organizations: Rational, Natural and Open System, 5th ed.; Prentice-Hall: Englewood Cliffs, NJ, USA, 2003. [Google Scholar]
  20. Morrison, J.; Schulte, P. Corporate Water Accounting: An Analysis of Methods and Tools for Measuring Water Use and Its Impacts; Pacific Institute: Oakland, CA, USA, 2010. [Google Scholar]
  21. Vink, S. Water accounting: International approaches to policy and decision making. Australas. J. Envion. Manag. 2014, 21, 219. [Google Scholar] [CrossRef]
  22. United Nations News Centre. World leaders meet to accelerate negotiations on climate change (22 September 2009). 2009. Available online: http://www.un.org/apps/news/photostories-_detail.asp?PsID=52 (accessed on 22 March 2016).
  23. Chartres, C.; Varma, S. Out of Water: From Abundance to Scarcity and How to Solve the World Water Problems; FT Press: Upper Saddle River, NJ, USA, 2010. [Google Scholar]
  24. Karimi, P.; Bastiaanssen, W.G.M. Spatial evaporation, rainfall and land use data in water accounting-Part 1. J. Hydrol. Earth Sci. 2015, 19, 507–532. [Google Scholar] [CrossRef] [Green Version]
  25. United Nations Development Programme (UNDP). Sustainable Development Goals—Goal 6: Clean water and sanitation. 2020. Available online: https://www.undp.org/content/undp/en/home/sustainable-development-goals/goal-6-clean-water-and-sanitation.html (accessed on 14 September 2020).
  26. Department of Water and Sanitation. Water Quality and Water Quality Management Challenges in South Africa; Government Printers: Pretoria, South Africa, 2015. [Google Scholar]
  27. Nikolaou, L.E.; Kourouklaris, G.; Tsalis, T.A. A framework to assist the financial community in incorporating water risks into their investment decisions. J. Sustain. Financ. Invest. 2014, 14, 93–109. [Google Scholar] [CrossRef]
  28. Hedden, S.; Cilliers, J. Parched Prospects: The Emerging Water Crisis in South Africa; Institute for Security Studies: Pretoria, South Africa, 2014. [Google Scholar]
  29. UNESCO-WWAP (United Nations Educational Scientific and Cultural Organisation-World Water Assessment Programme). World Water Development Report No. 2; UNESCO: Paris, France, 2006. [Google Scholar]
  30. DBSA (Development Bank of Southern Africa). Water Security in South Africa; Development Bank of South Africa: Johannesburg, South Africa, 2009. [Google Scholar]
  31. Republic of South Africa. National Water Amendment Act 27 of 2014. 2014. Available online: https://www.gov.za/documents/national-water-amendment-act-0?gclid=EAIaIQobChMImP7f3abu6wIVFWHmCh3ECQluEAAYASAAEgJPGvD_BwE (accessed on 16 September 2020).
  32. Republic of South Africa. Water Service Act; Office of the President: Cape Town, South Africa, 1997. [Google Scholar]
  33. Yakhou, M.; Dorweiler, V.P. Environmental Accounting: An essential component of business strategy. Bus. Strategy Environ. 2004, 13, 65–77. [Google Scholar] [CrossRef]
  34. Fakoya, M.B. An Adjusted Material Flow Cost Accounting Framework for Process Waste Reduction Decisions in the South African Brewery Industry. DCom (Accounting) Thesis, University of South Africa, Pretoria, South Africa, 2014. [Google Scholar]
  35. Qian, W.; Burritt, R.; Monroe, G. Environmental management accounting in local government. J. Account. Aud. Account. 2011, 24, 93–128. [Google Scholar] [CrossRef]
  36. Christ, K.L.; Burritt, R.L. Critical environmental concerns in wine production: An integrative review. J. Clean. Prod. 2013, 53, 232–242. [Google Scholar] [CrossRef]
  37. Schaltegger, S.; Viere, T.; Zvezdov, D. Tapping environmental accounting potentials of beer brewing: Information needs for successful cleaner production. J. Clean. Prod. 2012, 29, 1–10. [Google Scholar]
  38. Schaltegger, S.; Burritt, R. Contemporary Environmental Accounting: Issues, Concept and Practice; Greenleaf: Sheffield, UK, 2000. [Google Scholar]
  39. Bennett, M.; Bouma, J.; Wolters, T. The development of environmental management accounting: General introduction and critical review. In Environmental Management Accounting: Informational and Institutional Developments; Bennett, M., Bouma, J., Eds.; Springer: Dordrecht, The Netherlands, 2002. [Google Scholar]
  40. Burritt, R.L.; Hahn, T.; Schaltegger, S. Towards a comprehensive framework for environmental management accounting—Links between business actors and environmental management accounting tools. Australian Account Rev. 2002, 12, 39–50. [Google Scholar] [CrossRef]
  41. Onishi, Y.; Kokubu, K.; Nakajima, M. Implementing material flow cost accounting in a pharmaceutical company. In Environmental Management Accounting for Cleaner Production; Schaltegger, S., Bennett, M., Burritt, R.L., Jasch, C., Eds.; Springer: Dordrecht, The Netherlands, 2009. [Google Scholar]
  42. Wan, Y.K.; Ng, R.T.L.; Ng, D.K.S.; Tan, R.R. Material flow cost accounting (MFCA) based approach for prioritization of waste recovery. J. Clean. Prod. 2015, 107, 602–614. [Google Scholar] [CrossRef]
  43. METI (Ministry of Economy, Trade and Industry). Guide for Material Flow Cost Accounting; Environmental Industries Office: Tokyo, Japan, 2007. [Google Scholar]
  44. Kokubu, K.; Kitada, H. Conflicts and solutions between material flow cost accounting and conventional management thinking. In Proceedings of the 6th Asia-Pacific Interdisciplinary Perspectives on Accounting Research (APIRA), Sydney, Australia, 12–13 July 2010. [Google Scholar]
  45. Jasch, C. The use of environmental management accounting for identifying environmental costs. J. Clean. Prod. 2003, 11, 667–676. [Google Scholar] [CrossRef]
  46. Hassan, M.K. Applying Lean Six Sigma for Waste Reduction in a Manufacturing Environment. Am. J. Ind. Eng. 2013, 1, 28–35. [Google Scholar]
  47. Jasch, C. Environmental and Material Flow Costs Accounting Principles and Procedures. Eco-Efficiency in Industry and Science; Springer Science and Business Media: Dordrecht, The Netherlands, 2009. [Google Scholar]
  48. Nakajima, M. Introducing material flow cost accounting for environmental management accounting systems. In Proceedings of the International Symposium on Environmental Accounting, Kanagawa, Japan, 1 March 2003; pp. 48–51. [Google Scholar]
  49. Wang, J.; Cui, Y.; Zhu, J.; Li, L. Discussion about material flow cost accounting. In Proceedings of the International Conference of Logistics Engineering and Management (ICLEM), Chengdu, China, 8–10 October 2010; pp. 3953–3959. [Google Scholar]
  50. Lee, K.H.; Min, B.; Yook, K.H. Exploring the Relationship between Corporate Environmental and Economic Performance: An Empirical Analysis of Japanese Manufacturing Firms; Environmental Management Accounting for a Sustainable Economy: Helsinki, Finland, 2012. [Google Scholar]
  51. Hyršlová, J.; Palásek, J.; Vágner, M. Material flow cost accounting (Mfca) tool for the optimization of corporate production processes. Bus. Manag. Educ. 2011, 9, 5–18. [Google Scholar] [CrossRef]
  52. Bortolotti, T.; Romano, P. ‘Learn first, then automate’: A framework for process improvement in pure service companies. A case study. Prod. Plan. Control. 2012, 23, 513–522. [Google Scholar] [CrossRef]
  53. Weigand, H.; Elsas, P. Construction and Use of Environmental MASs with the REA business ontology. J. Emerg. Technol. Account. 2013, 9, 25–46. [Google Scholar] [CrossRef]
  54. Mena, C.; Adenso-Diaz, B.; Yurt, O. The causes of food waste in the supplier–retailer interface: Evidences from the UK and Spain. Resour. Conserv. Recy. 2011, 55, 648–658. [Google Scholar] [CrossRef]
  55. Schmidt, M.; Nakajima, M. Material flow cost accounting as an approach to improve resource efficiency in manufacturing companies. Resources 2013, 2, 358–369. [Google Scholar] [CrossRef]
  56. Fakoya, M.B.; van der Poll, H.M. Integrating ERP and MFCA systems for improved waste-reduction decisions in a brewery in South Africa. J. Clean. Prod. 2013, 40, 136–140. [Google Scholar] [CrossRef]
  57. Viere, T.; Stock, M.; Genest, A. How to achieve energy and resource efficiency: Material and energy flow modelling and costing for a small and medium-sized company. In Energy Related Balancing and Evaluation in Production Engineering-Methods and Examples; Technical University of Chemnitz: Auerbach, Germany, 2013; pp. 451–467. [Google Scholar]
  58. Trappey, A.J.; Yeh, M.F.; Wu, S.C.Y.; Kuo, A.Y. ISO14051-based material flow cost accounting system framework for collaborative green manufacturing. In Proceedings of the 2013 IEEE 17th International Conference on Computer Supported Cooperative Work in Design (CSCWD), Whistler, BC, Canada, 27–29 June 2013; pp. 639–644. [Google Scholar]
  59. Boos, H.; Frank, Z. Lean principles in healthcare rehabilitation: Suggestions for implementation. In Proceedings of the Seventh International Conference On Healthcare Systems & Global Business Issues, Rajasthan, India, 3–6 January 2013; p. 170. [Google Scholar]
  60. Lehr, C.B.; Thun, J.H.; Milling, P.M. From waste to value–a system dynamics model for strategic decision-making in closed-loop supply chains. Int. J. Prod. Res. 2013, 51, 4105–4116. [Google Scholar] [CrossRef]
  61. Yin, R.K. Case Study Research: Design and Methods, 5th ed.; Sage Publication Ltd.: Thousand Oaks, CA, USA, 2014. [Google Scholar]
  62. Berry, A.J.; Coad, A.F.; Harris, E.P.; Otley, D.T.; Stringer, C. Emerging themes in management control: A review of recent literature. Brit Account Rev. 2009, 4, 2–20. [Google Scholar] [CrossRef] [Green Version]
  63. Alvi, M.H. A manual for selecting sampling techniques in research. Paper No. 70218. 2016. Available online: https://www.mpra.ub.uni-muenchen.de/70218/MPRA (accessed on 19 February 2018).
  64. DeWalt, K.; DeWalt, B. Participant Observation: A Guide for Fieldworkers, 2nd ed.; Rowman Altamira: London, UK, 2010. [Google Scholar]
  65. Struwig, F.W.; Stead, G.B. Research: Planning, Designing and Reporting, 2nd ed.; Pearson Education Ltd.: Cape Town, South Africa, 2013. [Google Scholar]
  66. Yin, R.K. Qualitative Research from Start to Finish, 2nd ed.; Guilford Press: New York, NY, USA, 2016. [Google Scholar]
  67. Baietti, A.; Kingdom, W.; van Ginneken, M. Characteristics of Well-Performing Public Water Utilities. 2006. Available online: http://www.siteresources.worldbank.org/INTWSS/Resources/workingnote9.pdf (accessed on 10 April 2017).
  68. DWAF (Department of Water Affairs and Forestry). Water for Growth and Development in South Africa; Government Press: Pretoria, South Africa, 2011. [Google Scholar]
  69. Kotzee, E. Management Accounting for Decision Makers, 6th ed.; Prentice Hall: London, UK, 2016. [Google Scholar]
  70. Mckenzie, R.; Siqalaba, Z.N.; Wegelin, W.A. The State of Non-Revenue Water in South Africa. 2013. Available online: http://www.wrc.org.za/Knowledge%20Hub%20Documents/Research%20Reports/TT%20522-12.pdf (accessed on 19 November 2016).
Figure 1. Sankey diagram of the Doondraai Water Treatment Scheme Process Flow. Source: Authors’ description. Where: RW = raw water; BWWW = backwash wastewater; DoW = dosed water; CW = chlorinated water; SW = sedimented water; FW = filtered water; DW = disinfected water; DRKW = drinkable water; QC = quantity center.
Sustainability 12 07824 g001
Table 1. Process QC1-Dosing.
Input Output
MaterialPlaceMaterial TypeCoefficientUnitPriceValueMaterialPlaceMaterial TypeCoefficientUnitPriceValue
Calcium Hypochlorite (HTH)P4a: HTHGood1.60kg37.60 ZAR/kg60.16 ZARDoWaP15a: DoWaGood6000.00m31.51 ZAR/m39079.20 ZAR
ElectricityP3a: ElectGood44.88kWh4.75 ZAR/kWh213.18 ZAR
LimeP2a: LimeGood150.00kg5.50 ZAR/kg825.00 ZAR
Raw WaterP1: Input RWGood6000.00m31.33 ZAR/m37980.00 ZAR
Note: Different colors distinguish the material flow processes.
Table 2. Process QC2-Aeration.
Input Output
MaterialPlaceMaterial TypeCoefficientUnitPriceValueMaterialPlaceMaterial TypeCoefficientUnitPriceValue
ElectricityP6a: ElectGood0.58kWh4.75 ZAR/kWh2.74 ZARCWaP16a: CWaGood6000.00m31.66 ZAR/m39978.00 ZAR
Superflocs (Flocculant)P5a: SuperfloccGood71.25Kg12.58 ZAR/kg896.33 ZAR
DoWaP15a: DoWaGood6000.00m31.51 ZAR/m39079.20 ZAR
Note: Different colors distinguish the material flow processes.
Table 3. Process QC3-Sedimentation.
Input Output
MaterialPlaceMaterial TypeCoefficientUnitPriceValueMaterialPlaceMaterial TypeCoefficientUnitPriceValue
CWaP16a: CWaGood6000.00m31.66 ZAR/m39978.00 ZARSWP17: SWGood5997.50m31.66 ZAR/m39978.04 ZAR
SWP17: SWNegative2.50m31.66 ZAR/m34.15 ZAR
Note: Different colors distinguish the material flow processes.
Table 4. Process QC4-Filtration.
Input Output
MaterialPlaceMaterial TypeCoefficientUnitPriceValueMaterialPlaceMaterial TypeCoefficientUnitPriceValue
ElectricityP9a: ElectGood58.30KWh4.75 ZAR/kWh276.93 ZARFWaP19a: FWaGood5893.50m31.74 ZAR/m310,255.28 ZAR
SWP17: SWGood5997.50m31.66 ZAR/m39978.04 ZARFWaP19a: FWaNegative104m31.74 ZAR/m3180.96 ZAR
Note: Different colors distinguish the material flow processes.
Table 5. Process T1-Inflow Chamber.
Input Output
MaterialPlaceMaterial TypeCoefficientUnitPriceValueMaterialPlaceMaterial TypeCoefficientUnitPriceValue
Calcium Hypochlorite (HTH)P4b: HTHGood0.40Kg37.60 ZAR/kg37.60 ZARDoWbP15b: DoWbGood6000.00m31.40 ZAR/m38400.00 ZAR
ElectricityP3b: ElectricGood25.22kWh4.75 ZAR/kWh119.80 ZAR
LimeP2b: LimeGood50.00Kg5.50 ZAR/kg275.00 ZAR
Raw WaterP1: Input RWGood6000.00m31.33 ZAR/m37980.00 ZAR
Note: Different colors distinguish the material flow processes.
Table 6. Process T2-Aeration.
Input Output
MaterialPlaceMaterial TypeCoefficientUnitPriceValueMaterialPlaceMaterial TypeCoefficientUnitPriceValue
ElectricityP6b: ElectricityGood0.54kWh4.75 ZAR/kWh2.57 ZARCWbP16b: CWbGood6000.00m31.45 ZAR/m38700.00 ZAR
Superflocs (Flocculant)P5b: SuperfloccGood22.50kg12.58 ZAR/kg283.05 ZAR
DoWbP15b: DoWbGood6000.00m31.40 ZAR/m38400.00 ZAR
Note: Different colors distinguish the material flow processes.
Table 7. Process T3-Oxidation.
Input Output
MaterialPlaceMaterial TypeCoefficientUnitPriceValueMaterialPlaceMaterial TypeCoefficientUnitPriceValue
ElectricityP8: ElectricityGood36.00kWh4.75 ZAR/kWh171.00 ZAROxWP18: OxWGood6000.00m31.48 ZAR/m38880.00 ZAR
CWbP16b: CWbGood6000.00m31.45 ZAR/m38700.00 ZAR
Note: Different colors distinguish the material flow processes.
Table 8. Process T4-Filtration.
Input Output
MaterialPlaceMaterial TypeCoefficientUnitPriceValueMaterialPlaceMaterial TypeCoefficientUnitPriceValue
ElectricityP9b: ElectricityGood809.25kWh4.75 ZAR/kWh3843.94 ZARFWbP19b: FWbGood5747.00m32.12 ZAR/m312,183.64 ZAR
OxWP18: OxWGood6000.00m31.48 ZAR/m38880.00 ZAR
Note: Different colors distinguish the material flow processes.
Table 9. Process QC5-Disinfection.
Input Output
MaterialPlaceMaterial TypeCoefficientUnitPriceValueMaterialPlaceMaterial TypeCoefficientUnitPriceValue
ElectricityP11: ElectGood52.80kWh4.75 ZAR/kWh250.80 ZARDWP20: DWGood11,640.50m31.95 ZAR/m322,701.60 ZAR
Chlorine GasP10: ChlorineGood28.00Kg28.55 ZAR/kg71.40 ZAR
FWaP19a: FWaGood5893.50m31.74 ZAR/m310,195.76 ZAR
FWbP19b: FWbGood5747.00m32.12 ZAR/m312,183.64 ZAR
Note: Different colors distinguish the material flow processes.
Table 10. Process QC6-Pump Station.
Input Output
MaterialPlaceMaterial TypeCoefficientUnitPriceValueMaterialPlaceMaterial TypeCoefficientUnitPriceValue
DWP20: DWGood11,640.50m31.95 ZAR/m322,698.98 ZARDRKP21: DRKWReference Flow (Good)11,640.50m37.00 ZAR/m381,522.98 ZAR
ElectricityP12: ElectGood12,384.00KWh4.75 ZAR/kWh58,824.00 ZAR
Note: Different colors distinguish the material flow processes.
Table 11. Overhead expenses of Doondraai Water Treatment Scheme *.
ParticularsSix MonthsMonthlyAmount Daily
civil engineering staff125,49320,915.50746.98
mechanical engineering staff492,97282,162.002934.36
electrical engineering staff156,68426,114.00932.64
cleaning staff198,11433,019.001179.25
diesel expenses200,95033,491.671196.13
other salaries (supervisor and scheme manager)1,878,372313,062.0011,180.79
staff overtime payments175,71729,286.171045.93
total3,228,302538,050.3419,216.08 **
Daily overhead costs = ZAR19,216.08/11,640.50kl = ZAR1.6508/kl. The daily cost of water manufactured before overhead costs = ZAR7.00/kl. Thus, the total daily cost per kilolitre of water purified = ZAR7.00/kl + ZAR1.6508/kl = ZAR8.6508/kl. DWTS tariff (regulated and determined by the Department of Water and Sanitation (DWS)) for bulk water delivery to municipalities = ***ZAR6.75/kl. The DWTS is running at a loss because it is processing its water at an approximate loss of = ZAR8.6508/kl − ZAR6.75/kl = ZAR1.9008/kl. Total amounts of loss on daily water manufactured = 11,640.50kl × ZAR1.9008 = ZAR22,126.2624 daily. **The overhead rate per kiloliter is calculated by dividing the total daily production by 28 days because Doondraai Water Treatment Scheme operates on a 28-day monthly cycle. ***ZAR = South African Rand.

