Article

Energy Analysis of a Novel Ejector-Compressor Cooling Cycle Driven by Electricity and Heat (Waste Heat or Solar Energy)

1
Department of Mechanical Engineering, National University of Singapore, 9 Engineering Drive 1, Singapore 117575, Singapore
2
Department of Mechanical Engineering, University of Engineering and Technology, GT Road, Lahore 54000, Pakistan
3
School of Mechanical, Biomedical and Design Engineering, College of Engineering and Applied Sciences, Aston University, Aston Triangle, Birmingham B4 7ET, UK
*
Author to whom correspondence should be addressed.
Sustainability 2020, 12(19), 8178; https://0-doi-org.brum.beds.ac.uk/10.3390/su12198178
Submission received: 4 August 2020 / Revised: 25 September 2020 / Accepted: 25 September 2020 / Published: 4 October 2020
(This article belongs to the Special Issue Advances in Solar Thermal Energy)

Abstract

:
Low-grade heat is abundantly available as solar thermal energy and as industrial waste heat. Non concentrating solar collectors can provide heat with temperatures 75–100 °C. In this paper, a new system is proposed and analyzed which enhances the electrical coefficient of performance (COP) of vapour compression cycle (VCC) by incorporating low-temperature heat-driven ejectors. This novel system, ejector enhanced vapour compression refrigeration cycle (EEVCRC), significantly increases the electrical COP of the system while utilizing abundantly available low-temperature solar or waste heat (below 100 °C). This system uses two ejectors in an innovative way such that the higher-pressure ejector is used at the downstream of the electrically driven compressor to help reduce the delivery pressure for the electrical compressor. The lower pressure ejector is used to reduce the quality of wet vapour at the entrance of the evaporator. This system has been modelled in Engineering Equation Solver (EES) and its performance is theoretically compared with conventional VCC, enhanced ejector refrigeration system (EERS), and ejection-compression system (ECS). The proposed EEVCRC gives better electrical COP as compared to all the three systems. The parametric study has been conducted and it is found that the COP of the proposed system increases exponentially at lower condensation temperature and higher evaporator temperature. At 50 °C condenser temperature, the electrical COP of EEVCRC is 50% higher than conventional VCC while at 35 °C, the electrical COP of EEVCRC is 90% higher than conventional VCC. For the higher temperature heat source, and hence the higher generator temperatures, the electrical COP of EEVCRC increases linearly while there is no increase in the electrical COP for ECS. The better global COP indicates that a small solar collector will be needed if this system is driven by solar thermal energy. It is found that by using the second ejector at the upstream of the electrical compressor, the electrical COP is increased by 49.2% as compared to a single ejector system.

1. Introduction

Vapour compression cycle (VCC) is a commonly used technology for cooling and air conditioning [1]. Global demand for cooling is estimated to increase by three times by 2050 [2]. Approximately 20 to 50% of energy input to industries is released to the environment through flares and stacks as waste heat [3]. Additionally, low-temperature heat energy (60–100 °C) is abundantly available from the sources like solar energy and geothermal energy. Non concentrating solar collectors can provide heat with temperatures 75–100 °C [4]. Therefore, low-temperature heat recovery can lead to increased efficiency and the share of sustainable energy in the global energy mix. Solar thermal energy is an environmentally-friendly source of low-temperature heat energy with good acceptable potential in most of the regions around the globe [5]. Solar energy is regarded to be the most promising alternative to fossil fuels for desalination and cooling due to the coincidence of high solar availability, cooling demand and severe water scarcity [6]. The simple ejector refrigeration system has the issue of stability when used with solar thermal energy [7] and to solve this, many researchers have studied a system combining ejector refrigeration and vapour compression cycle [8].
A challenge for the adoption of the ejector refrigeration system (ERS) is the availability of the amount of heat to meet the requirement of cooling. An excellent solution is to use a hybrid cooling system which is driven by both heat and electricity. Therefore, such ejector based hybrid systems have been studied and recommended by many studies in recent times [9,10,11,12].
Sokolov et al. [13,14,15] presented an enhanced ejector refrigeration system (EERS) where they used a compressor to help ejector with the compression process. The electrical compressor was used before the ejector such that the outlet of the compressor was the entrained fluid for the ejector. A similar system was further studied by Arbel et al. [16] which was designed for about one RT (ton of refrigeration) of cooling by using 23.5 m2 of solar collector area. Wang et al. [12] reported experimental results on an EERS for an automobile case such that the exhaust of automobile supplied waste heat and the compressor was run by engine power. They designed the system such that it could operate in three modes: (i) as conventional VCC, (ii) as an ERS, (iii) as a hybrid-EERS. They reported 35% improvement of the coefficient of performance (COP) in an idle condition and 40% improvement in the COP for a driving condition for hybrid-system as compared to the conventional system.
A cascade ejection-compression system (CECS) which was studied by Sun [17] was designed such that the conventional ERS and VCC were joint such a way that the condenser of VCC acted as an evaporator of ERS. This way the compressor of VCC had less pressure ratio to work with hence increasing the electrical COP. Similarly, Chesi et al. [18] reported that CECS saves more electrical energy than simple ERS since the entrainment ratio of ejectors increases significantly for a reduced compression ratio. Petrenko et al. [19] studied a CECS driven by the heat of exhaust gases from an IC engine. The ERS was used as a topping cycle with R600 as working fluid and VCC was used as a bottoming cycle with carbon dioxide as working fluid. The system was designed as small-scale-tri-generation-system with cooling capacity of 10 kW. It was reported that the COP of the bottoming cycle improves from 1.3 to 6.4 when the evaporation temperature varies from −40 °C to 0 °C while the condenser of the bottoming cycle is kept at the same 20 °C temperature.
The literature survey shows that many researchers have reported good performance for hybrid ejector-compressor cooling systems. It is observed that in most of the systems models, the inlet and outlet temperatures of waste heat streams have been not discussed and the system has been modelled by directly assuming the vapour generator temperatures. Due to waste heat-driven systems, the heat is available for free, the focus of system modelling should be on reducing the temperature of the waste stream to as low as possible thereby extracting the maximum amount of heat from the waste stream. Keeping this in mind, it is observed that for various heat-driven systems, the temperature of rejected heat is still quite high which has the potential for further use. Here, in this research, a new system is proposed which extracts heat from the waste stream at two levels; in high pressure (HP) generator and in low pressure (LP) generator such that the heat still available in the waste stream released by an HP generator is used in an LP generator to drive an LP ejector. This novel ejector enhances the vapour compression cycle (EVCC) is described in the next section. It has been modelled in ‘Engineering Equation Solver’ (EES) and its performance results are compared with other systems for a base case. The developed model, in EES, has been used to study the sensitivity of its performance with different operating conditions. It is found that the proposed system is an effective system in extracted more heat from the waste stream and gives better electrical COP.

1.1. Ejectors as Thermal Compressor

Ejectors are thermally driven compressors which can effectively utilize low-grade heat via various system configurations and when used in conjunction with appropriately matched refrigerants or organic fluids. Ejectors utilization has been studied for application in various low-grade heat-driven applications such as ejector refrigeration systems (ERS) [20,21,22,23,24], ejector enhanced Organic Rankine Cycles (EORC) [25], and combined cooling and power (CCP) systems [26,27,28]. Ejectors are reliable and robust and have no moving parts. Therefore, they have low capital and maintenance costs. Ejector systems generally have lower performance [29] because of the nature of ejector processes of relying on fluid-fluid mixing and entrainment. Furthermore, it is a great challenge to integrate the ejector models with system models due to the complicated and iterative nature of these models. Hence, there is much scope to develop predictive tools and improve the performance of an ejector system.
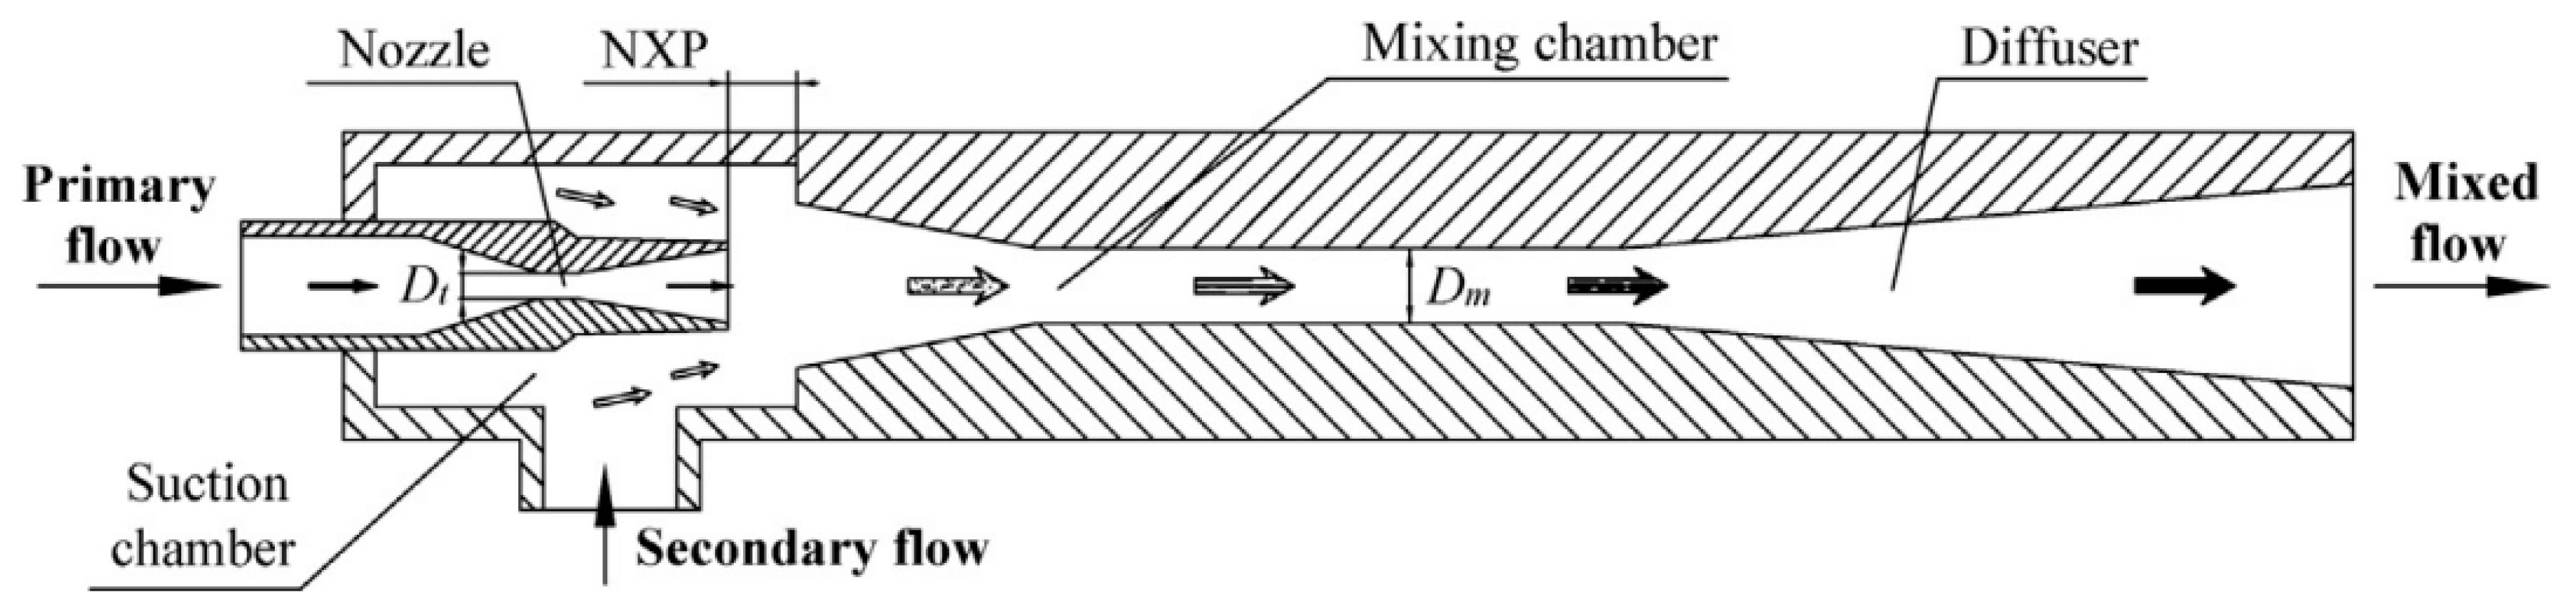
As shown in Figure 1, the assembly of ejector can be divided into four main sections; primary nozzle, suction chamber, mixing chamber, and diffuser.
The high-pressure primary (motive) fluid enters the convergent-divergent primary nozzle. The primary fluid accelerates (at the cost of pressure drop) and induces the low-pressure secondary fluid. In the mixing chamber, both the fluids mix to attain the same pressure and velocity. Pressure recovery happens in the diffuser section. It is important to make sure that the Mach number of one is reached at the throat of the primary nozzle after which the flow continues to accelerate through the diverging section of the nozzle to speed greater than sonic velocity. The mixed fluid experiences a shock wave in the mixing section which results in an abrupt increase in pressure and a decrease in velocity and the flow becomes subsonic. The variation of velocity and pressure along the length of the ejector is discussed in detail later in the modelling section.
The area ratio of an ejector is one of the main geometric parameters and is defined as the ratio of areas of diffuser inlet and primary nozzle throat and is given by (Dm/Dt)2. The performance of an ejector is estimated by the value of its entrainment ratio which is the ratio of secondary and primary mass flow rates. An ejector with a higher value of entrainment ratio requires a smaller mass flow rate of the motive fluid and therefore a lower heat input which means higher system performance. Both the operating conditions and the geometry of ejector affect the entrainment ratio. For a given ejector, the entrainment ratio decreases with increasing generator pressure and with decreasing evaporator pressure. Fixed dimension ejectors operate only within a small operating temperature and pressure range. To cater to varying operating conditions, multi-ejector systems can be developed along with suitable control systems, also, ejectors with adjustable dimensions could be developed.
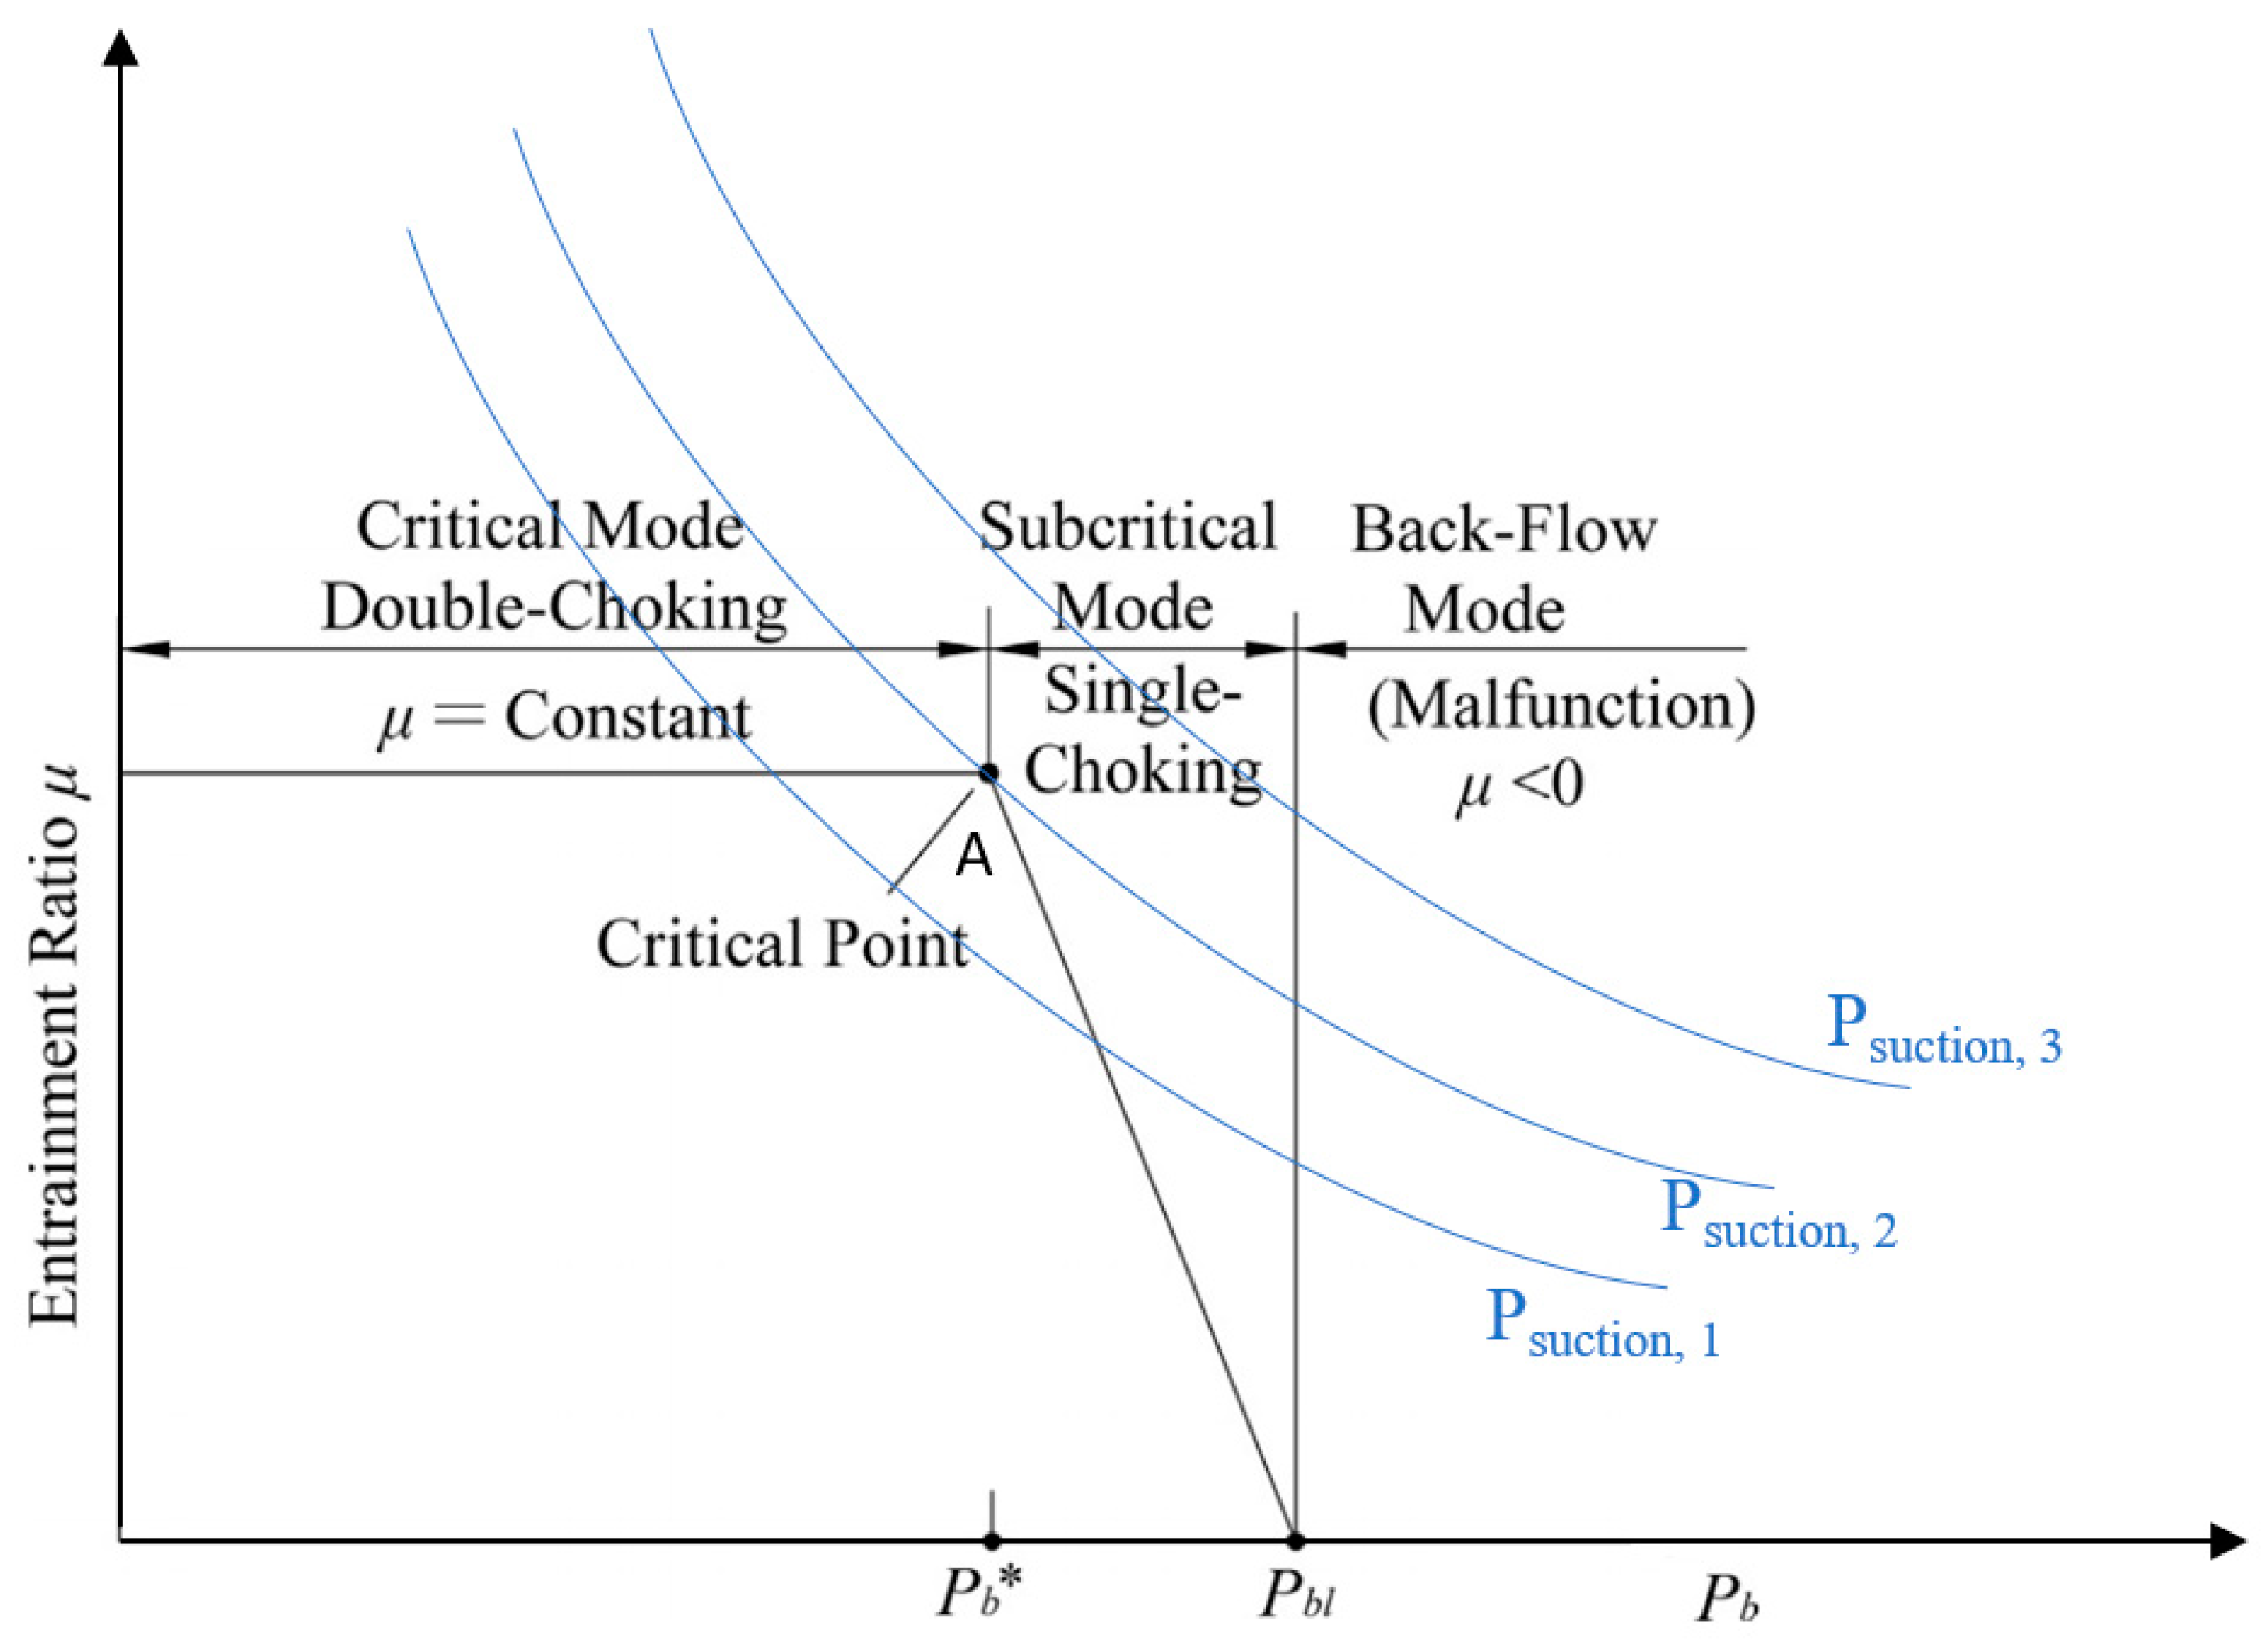
Figure 2 explains the operational modes of a fixed-geometry ejector. For choked flow in any nozzle, the mass flow rate through the nozzle becomes independent of the nozzle exit pressure and does not increase further by decreasing the nozzle exit pressure. The flow rate from a choked nozzle is maximum, hence the name.
The critical mode or the double-choking mode is for the case when both primary and secondary fluids are choked. For this case, the entrainment ratio does not depend on the back-pressure (Pb). Critical back-pressure (Pb*) is the pressure of condenser (or delivery) below which the secondary flow remains choked and the entrainment ratio remains constant for a fixed geometry. Single choking or subcritical mode occurs when the back-pressure is more than the critical back-pressure and the secondary flow is not choked. In this case, the secondary flow rate reduces with increasing back-pressure due to subsonic flow. For very high back-pressure, the entrainment ratio becomes zero and back-flow can occur. For a fixed-geometry ejector, the back-pressure should be kept below the critical back-pressure to make sure that the operation is smooth.
In Figure 2, the blue lines show the on-design optimal performance of ejector which it can give for different suction pressures. For higher suction pressures, the ejector compression ratio decreases, and its entrainment ratio increases. Every point on the blue line needs a new geometry of the ejector. Point A marked on the middle blue line shows that it is the design point for the ejector whose off-design performance is shown by the black line and whose critical pressure is Pb*.
The designing of ejectors is complicated because of the supersonic flow, turbulent mixing, and shock interactions happening inside the ejectors. The flow patterns inside the ejector may be visualized by computational fluid dynamics (CFD). For the detailed design of ejectors, to achieve optimum performance, either CFD or experimental studies need to be conducted.
The area ratio of an ejector is the most sensitive [31] factor affecting its performance. As presented by various researchers [24,32,33], when the operating conditions are varied, the area ratio needs to be altered to determine the optimum geometry. A greater value of the mixing chamber diameter will decrease the critical back-pressure and a shorter diameter will decrease the entrained (suction) mass flow, therefore, there is an optimal value of the area ratio [31,34]. Another sensitive parameter is the nozzle exit position (NXP). Many studies [31,34,35,36,37] have demonstrated that the performance of the ejector is very sensitive to NXP where the entrainment ratio can be changed by up to 40% by changing the NXP.
The detailed design of an ejector’s geometry can be studied by either CFD or experimental investigation. Scott et al. [29] used the CFD analysis for designing a supersonic ejector for a cooling system. They studied the impact of changing the operational conditions on the critical pressure of condenser and the entrainment ratio. Zhang et al. [27] also used the CFD analysis to study the fluid processes within an ejector, with a main focus on quantifying the reasons for the energy losses. They also performed a sensitivity analysis of the important parameters for ejector design.
Keenan et al. [38] proposed an analytical model to evaluate the performance of ejector. Their 1D constant pressure mixing model forms the foundation for the analytical models used in the works of Huang et al. [30] and Chen et al. [33]. This constant pressure-mixing theory is applicable when the primary nozzle exit is in front of the constant area section. The disadvantage of Keenan’s model is that it ignores the second choking of the entrained flow as postulated by Munday and Bagster [39].
Huang et al. [30] made improvements in the 1-D model by considering the double choking phenomenon. They assumed that the first choking occurs in the primary nozzle when the primary motive fluid flows through the throat of the converging-diverging nozzle. The second choke occurs because of the acceleration of entrained flow from stagnation at the secondary flow inlet. The location of the second choking is somewhere upstream of the constant area mixing chamber. After the primary motive fluid exits the convergent-divergent nozzle, it fans out without mixing with the secondary entrained flow. As a result, the spreading of the primary jet and the wall of the mixing chamber will form a hypothetical converging duct for the entrained secondary flow. This converging duct serves to accelerate the secondary flow to sonic speeds [39]. Huang’s 1D analytical model of the ejector is mainly derived from isentropic flow equations and requires the ideal-gas assumption. It also requires an iterative process to obtain the values of the entrainment ratio of the ejector. Furthermore, it requires the working conditions and all the primary nozzle dimensions to allow the calculations to be completed. Huang had also validated his 1-D analytical model by comparing it to experimental results to within ±15% error.
On the other hand, Chen et al. [33] have also proposed improvement to the analytical model. In their model, the double choking phenomenon is also considered, but, however, the model does not requir any geometrical dimensions to calculate the ejector performance. Chen’s model is derived mainly from the momentum and energy equations with the ideal gas assumption applicable for few equations. This model requires double iterations for the two unknown parameters, namely, the entrainment ratio and the pressure of the constant-area mixing chamber. Employing double iteration makes the model more complicated and takes more time for it to converge to a suitable solution. Although Chen’s model does not require geometrical input, the iterations are more complex, and the model is unable to predict off-design conditions.
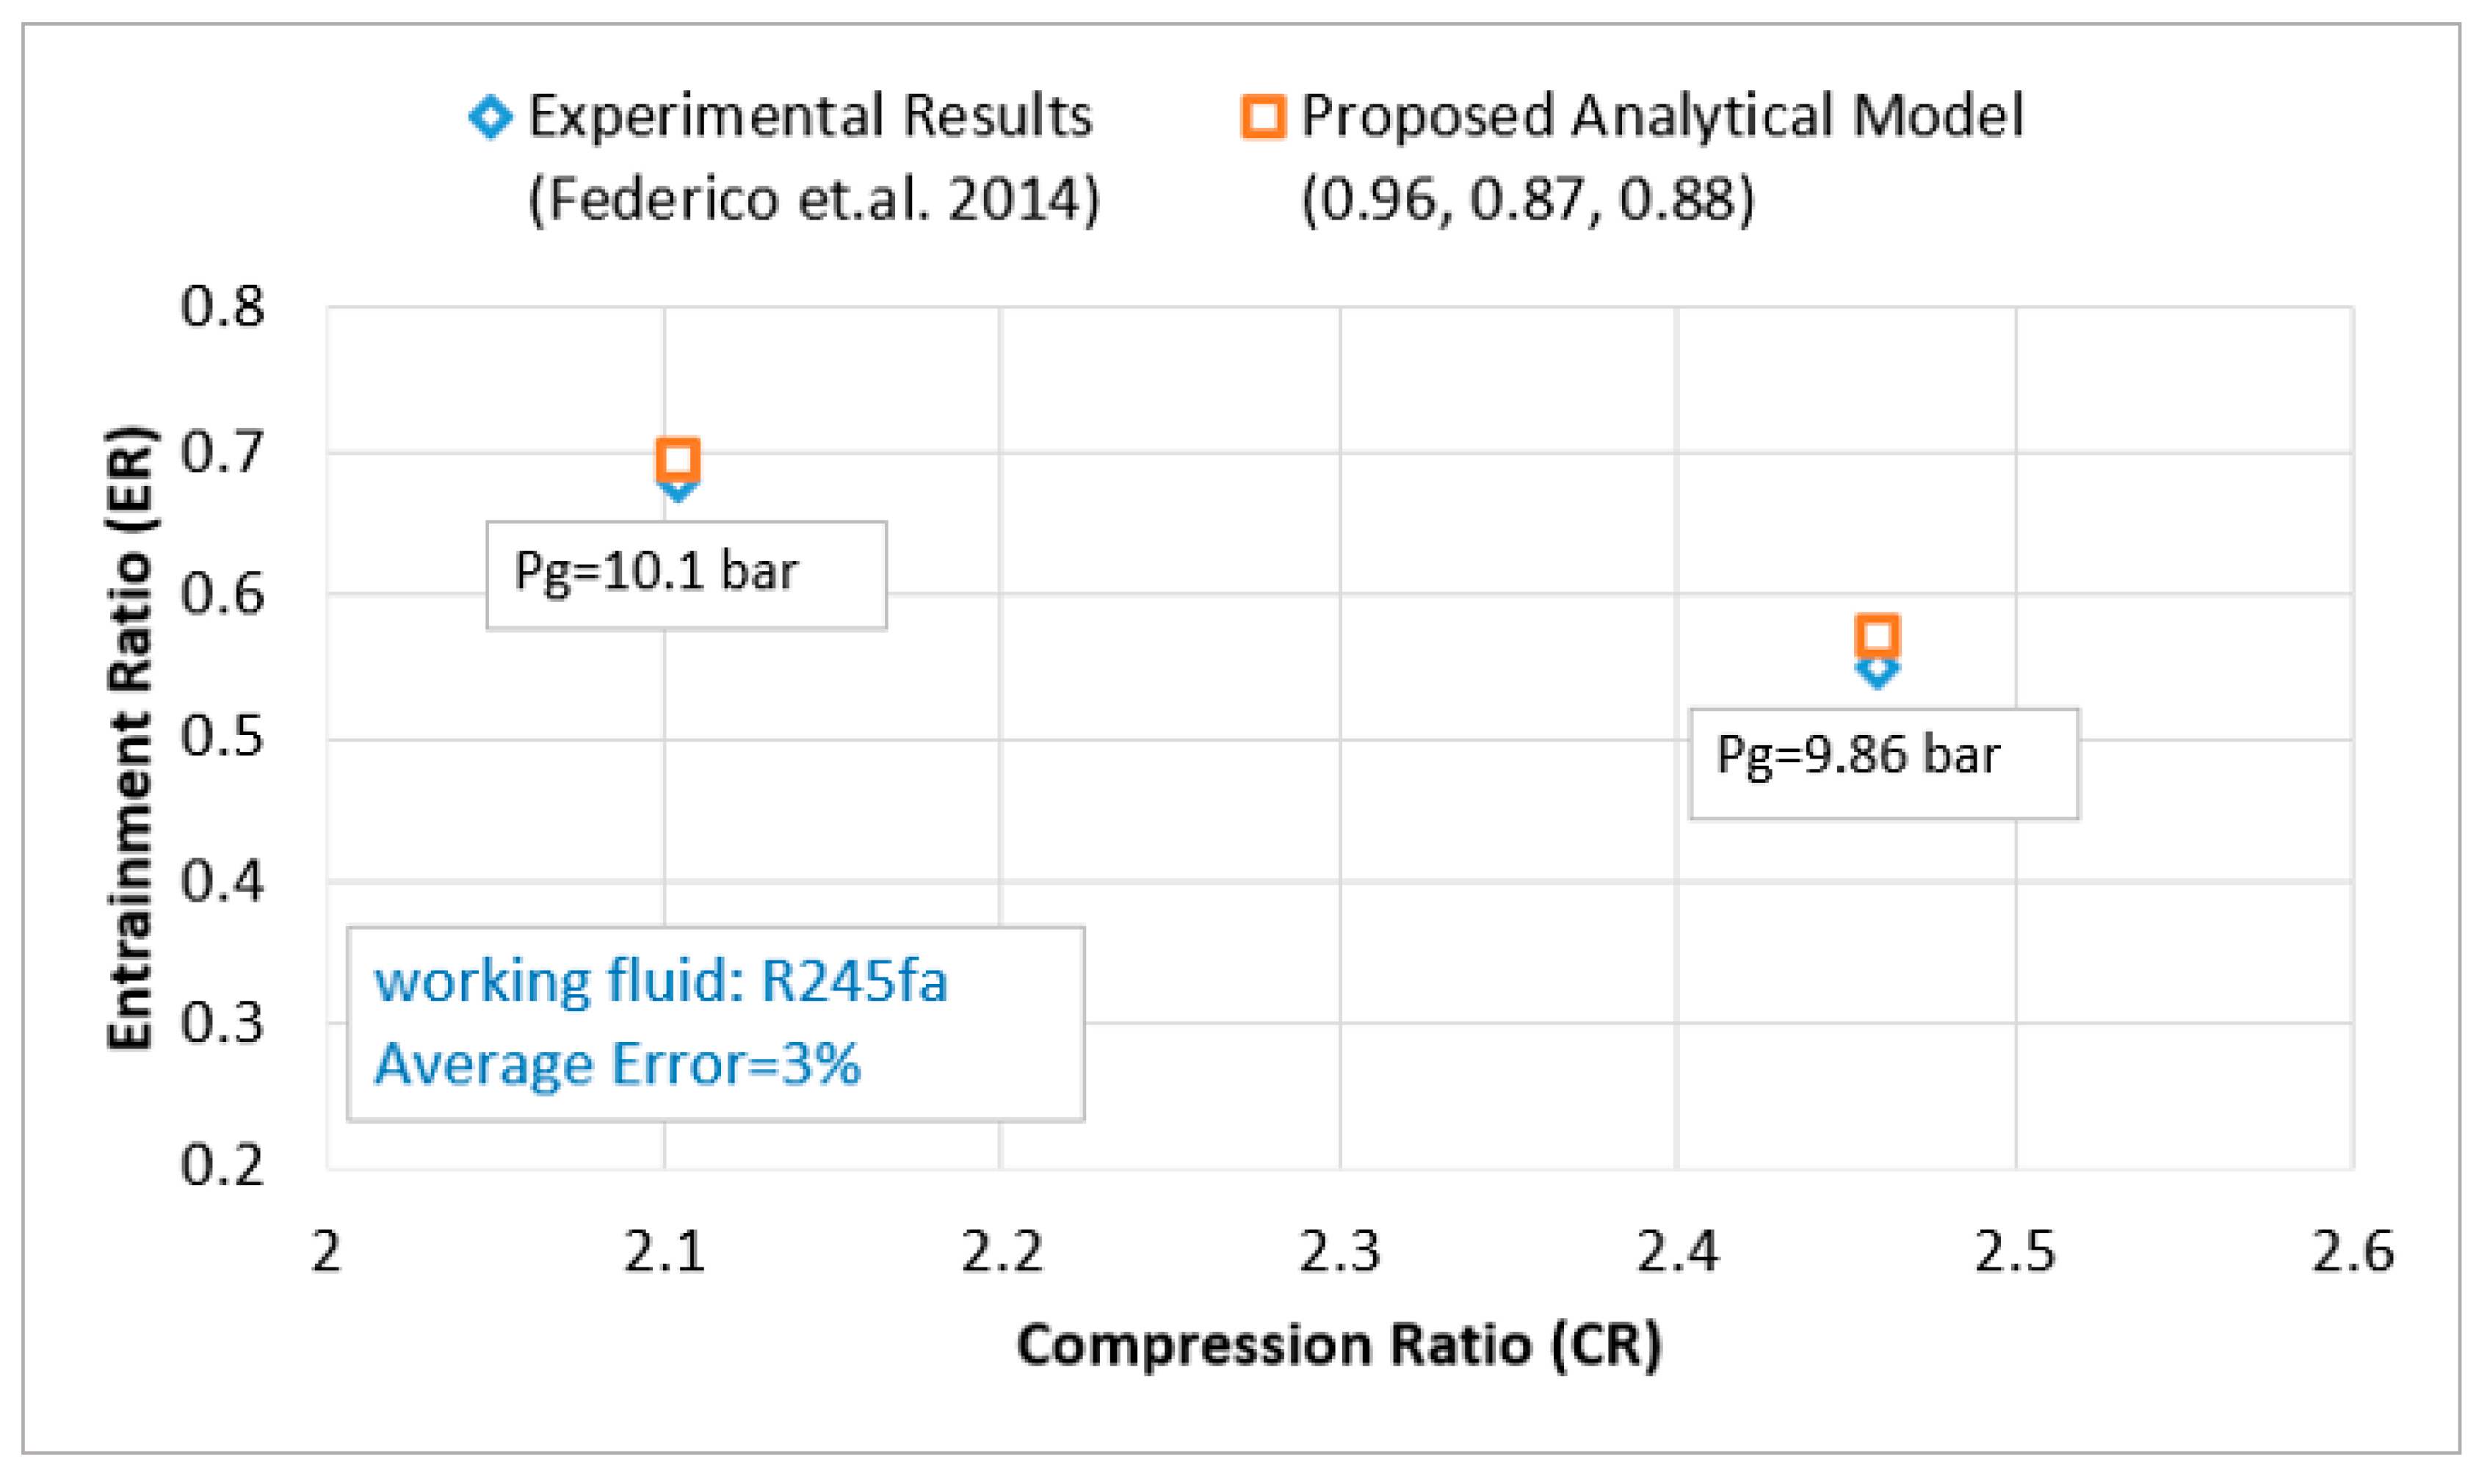
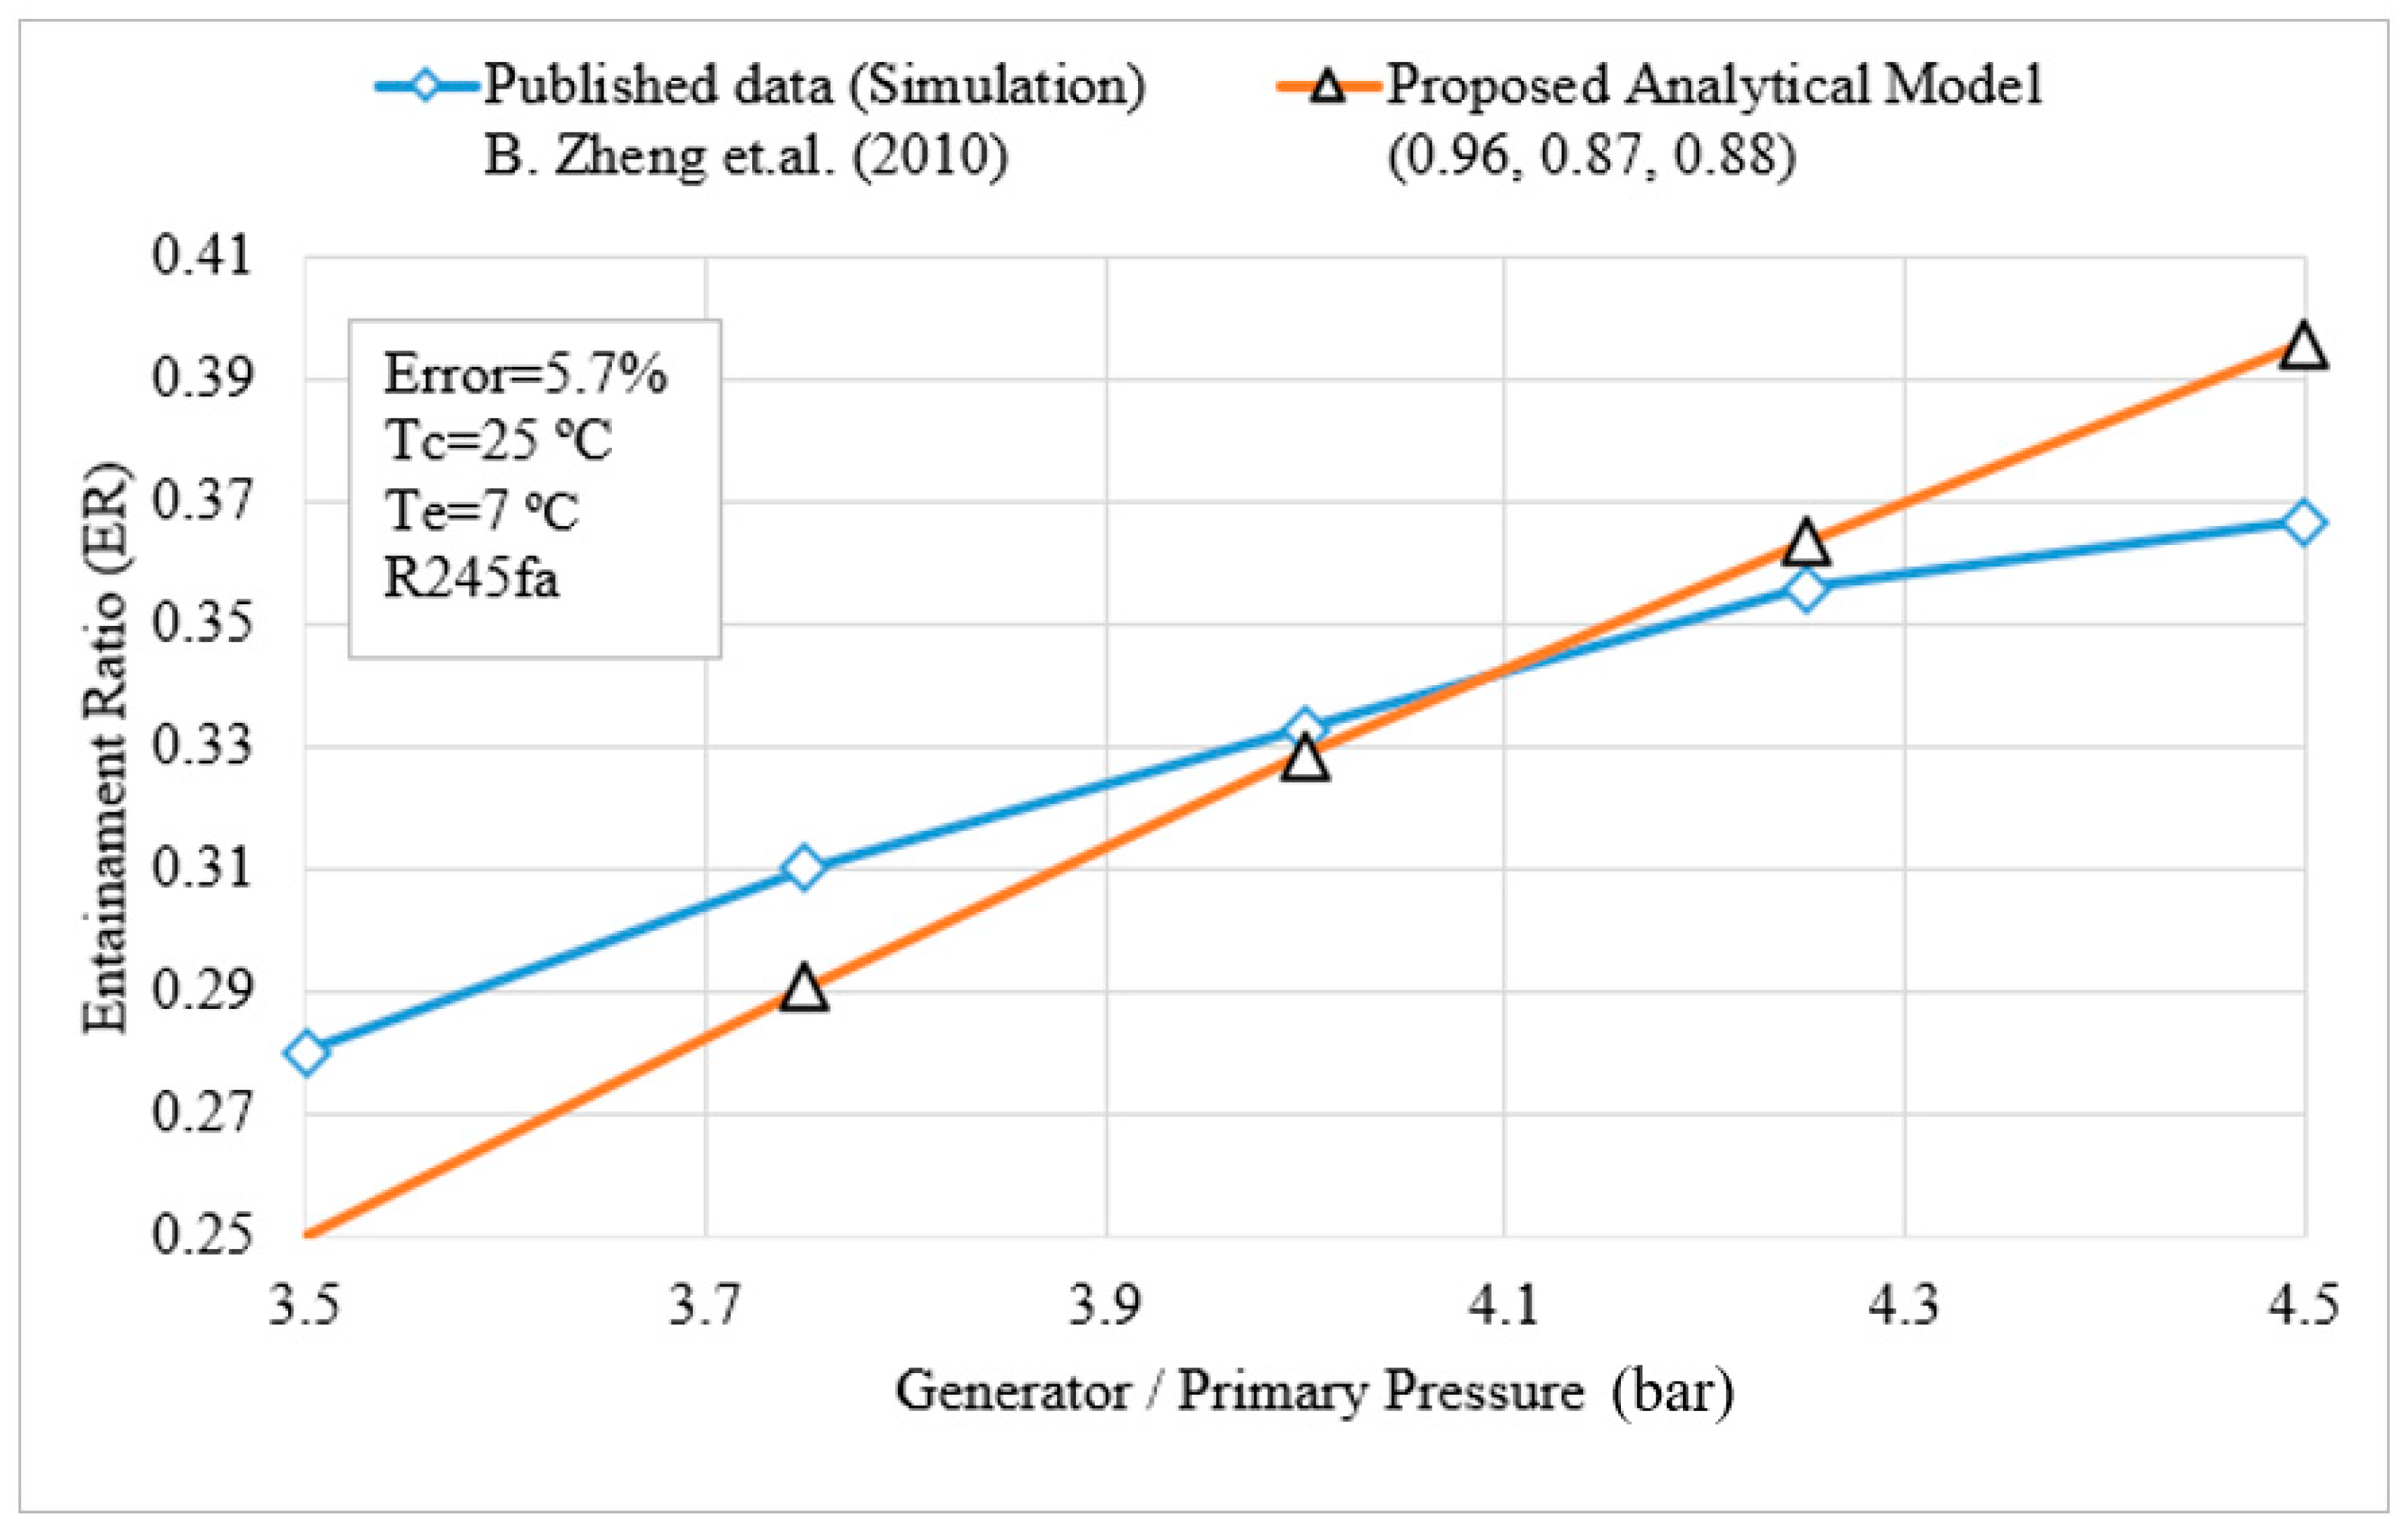
Presently, there are not any available analytical models which can directly calculate the entrainment ratio values without the need for iterations during the calculations. The new analytical model which is used in this paper incorporates some of the assumptions from Huang’s and Chen’s models and uses EES to use the thermal properties of the used working fluid. This new model can predict the ejector performance (ER) without the need for any iterations. This model has been validated with published data from experimental and simulation works. The details of this new analytical model of ejector can be found in F. Riaz et al. [40]. Since there are thermodynamic irreversibilities within the ejector due to high-speed mixing and the compression shock, the pressure drop cannot be neglected as it is quite significant. The used ejector model incorporates the pressure drop by taking the isentropic efficiencies into the consideration. The ejector modelling details have been published in our previous paper which has been cited in F. Riaz et al. [40] where the details of thermodynamic states inside the ejector have been discussed in detail along with the T-s diagram. Additionally, the ejector efficiencies have been calculated based on the optimized CFD based design obtained with ANSYS-FLUENT simulations.

1.2. Description of the Proposed System

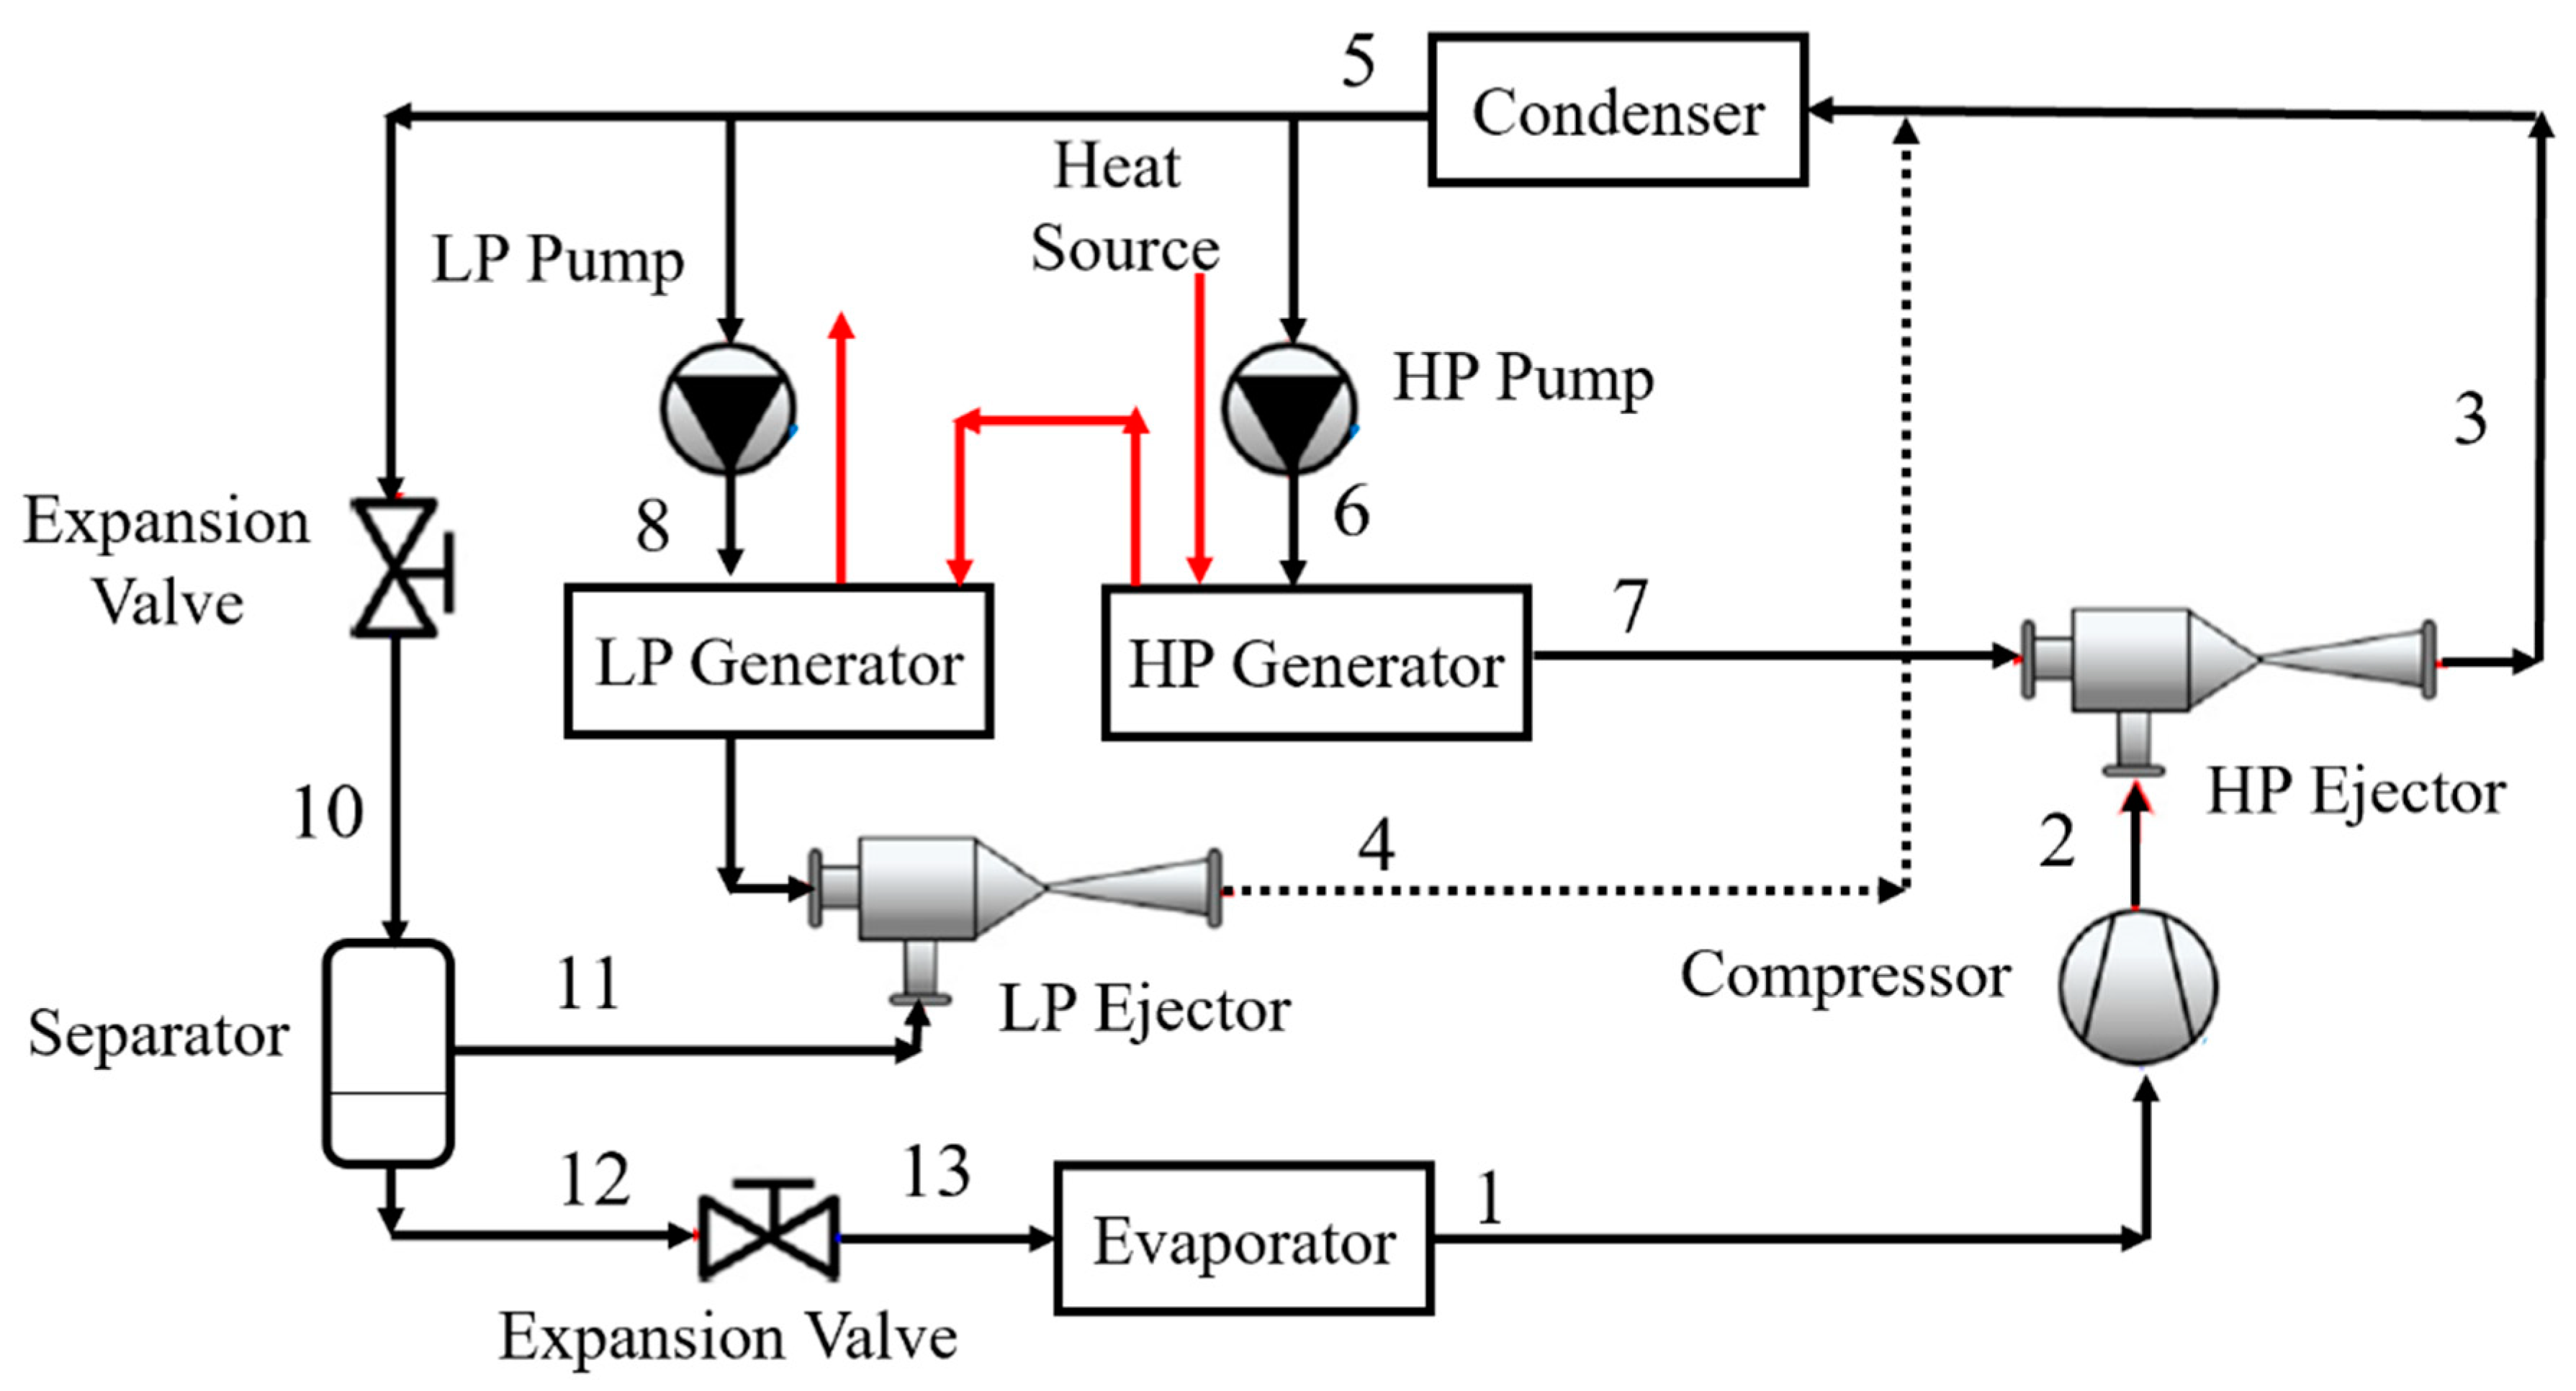
The schematic of the proposed novel ejector enhanced vapour compression cycle (EVCC) is given in 
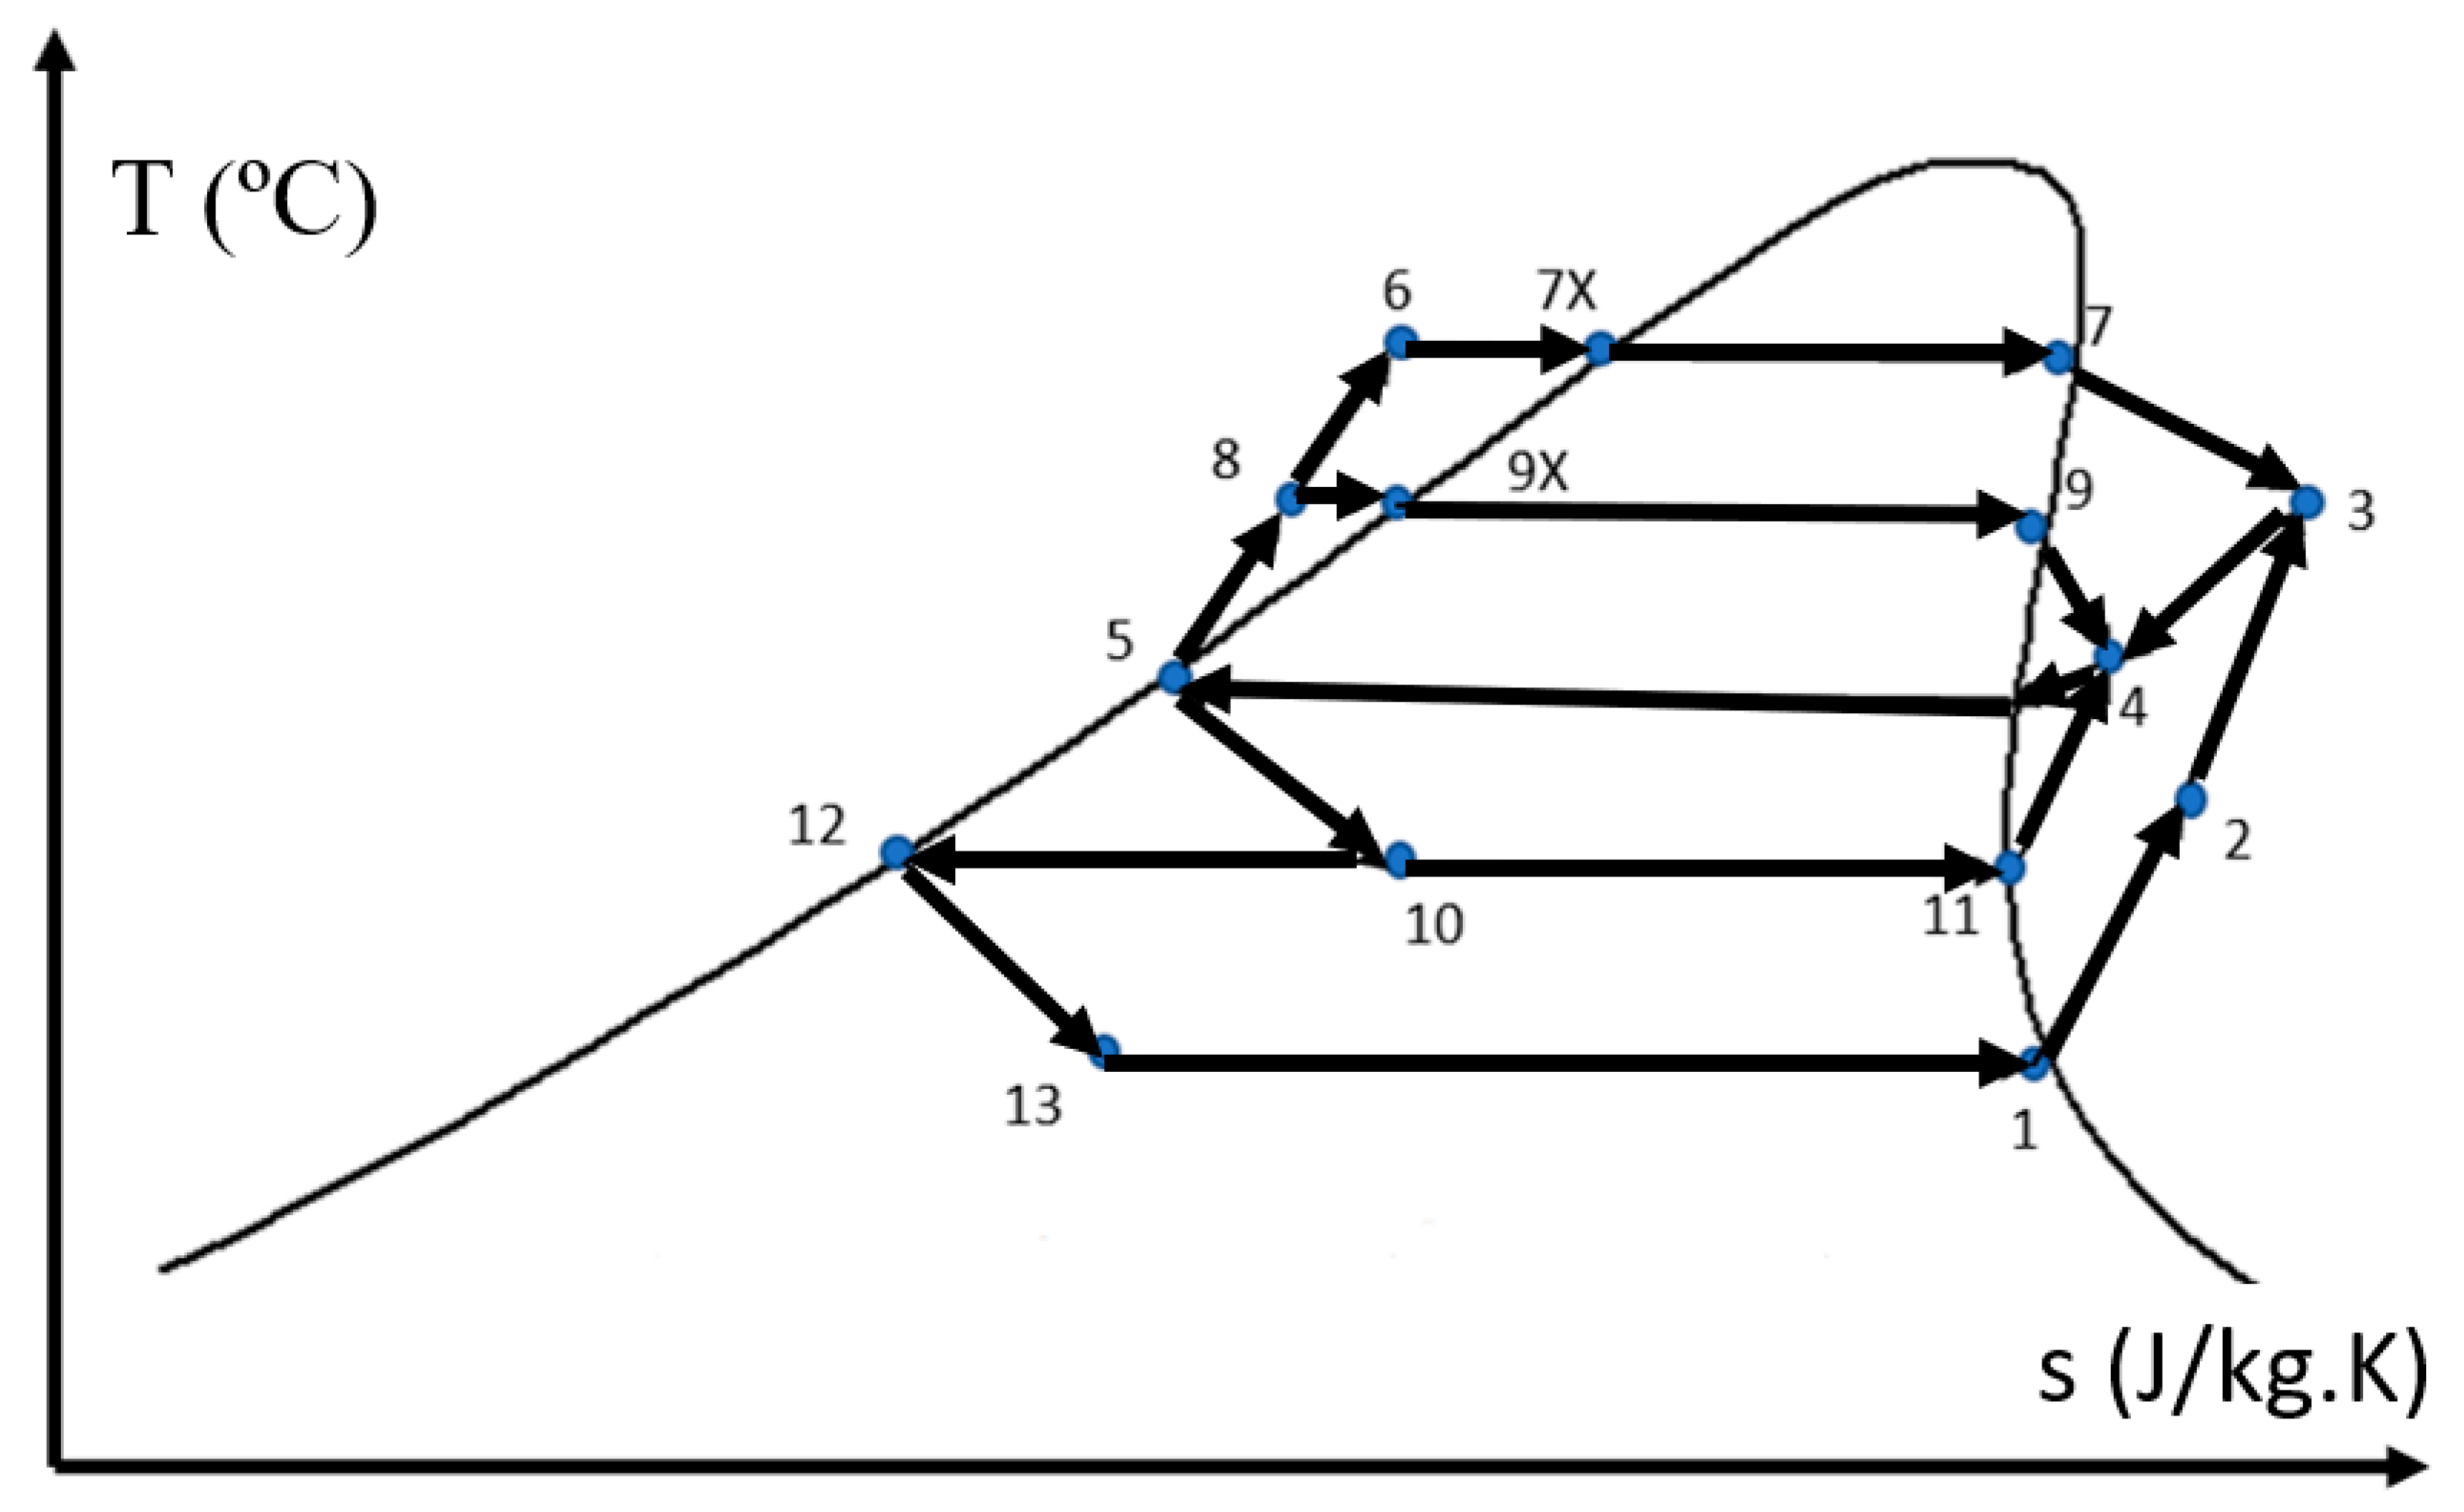
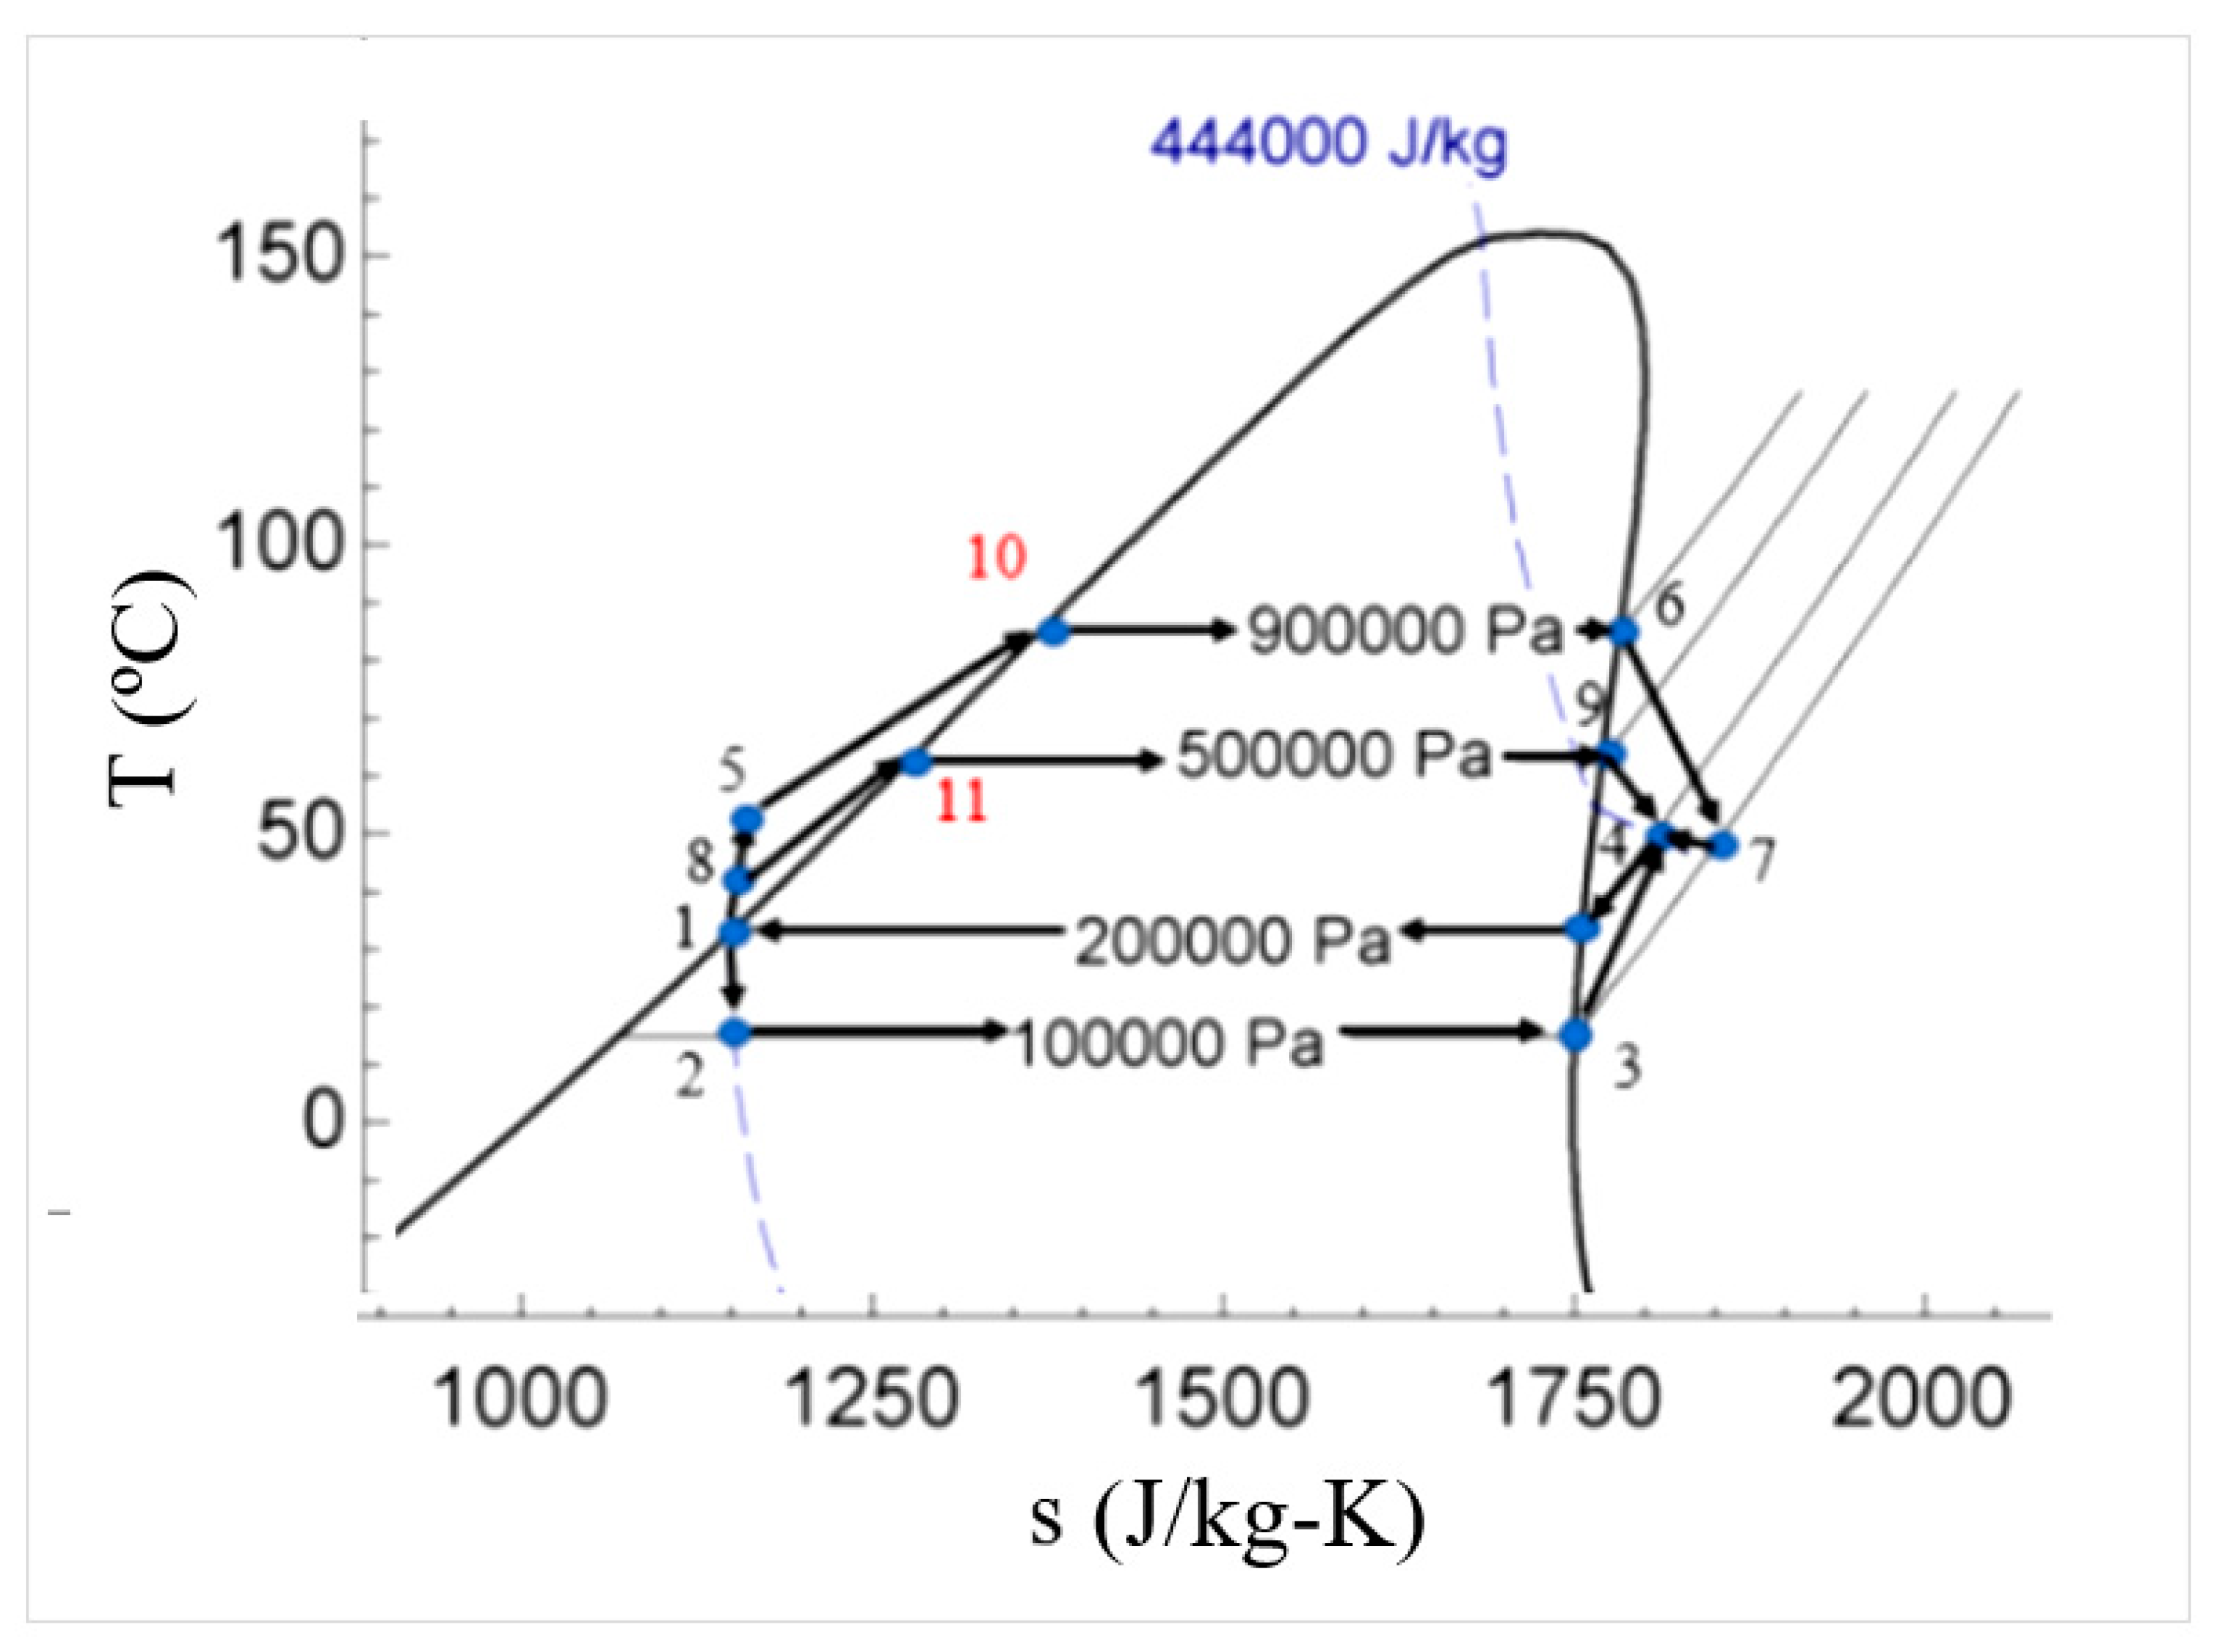
Figure 3 and the corresponding T-s diagram is given in Figure 4.
As shown, the heating water (source heat) is supplied to a high-pressure (HP) generator. The hot water exiting the HP generator is then used by a low-pressure (LP) generator which further extracts heat from the hot water. The HP generator supplies the saturated vapour of working fluid (at state 7) which acts as motive fluid for the HP ejector. Similarly, the LP generator supplies the motive fluid for the LP ejector (at state 9).
The LP ejector entrains the saturated vapour coming from the separator (at state 11) and compresses and delivers it to the condenser. The compressor compresses the working fluid from the evaporator to state 2 which is entrained by the HP ejector. The HP ejector delivers the working fluid to the condenser at the condensation pressure (at superheated state 3). After the condenser condenses the fluid into a liquid, it is divided into three streams going towards an HP pump, LP pump and expansion valve as shown. The novelty of this system lies in using the LP generator and LP ejector such that the LP generator extracts additional heat from the stream exiting the HP generator and the LP ejector shares the compression load with the HP ejector and reduces its compression ratio.

2. System Modelling

The proposed system has been modelled in the EES where the governing equations for all the components have been programmed to calculate the properties of working fluid at all the states as mentioned in the schematic and T-s diagram of the system. R245fa is used as a suitable working fluid and the thermodynamic properties are obtained by built-in data in the EES. The following assumptions have been made:
  • Pressure losses in fluid flow are neglected in pipes and heat exchangers,
  • Heat losses are neglected from all components,
  • Saturated vapour conditions are assumed at the exit of the evaporator, LP and HP generators,
  • The condenser outlet is assumed to be a saturated liquid.
The heat exchangers—HP generator, LP generator, evaporator, and condenser—are modelled by applying mass and heat balance equations. The saturation pressure values are calculated by using working fluid properties based on the saturation temperatures which are directly entered in the EES code.
P sat = f   ( T sat   )
As in the T-s diagram (Figure 4), there are five levels of pressure in the cycle. The pressure of condenser (P5) is dictated by the ambient (or heat sink) temperature and the pressure of evaporator (P1) is governed by the required temperature of cooling needed to be produced. For HP generator and LP generator, to calculate the temperatures of heating (source) water, the pitch point temperature difference (PPTD) method has been used. In addition to the kind of working fluid used (R245fa), other inputs required for the EES model are;
T source =   Temperature   of   heat   source
m source =   Mass   flow   rate   of   heat   source
T cond =   Temperature   of   condenser
T e =   Required   temperature   for   cooling   or   evaporator   temperature
The PPTD is defined as the temperature difference which occurs at a point where the difference of temperatures between the hot and cold fluids is at a minimum. For HP-generator, the PPTD occurs at the state 7X which is the saturated liquid state at the pressure and temperature of vapour generated in the high-temperature generator. For a given pressure and PPTD for HP-generator, it is possible to find out the mass flow rate of the working fluid through the HP-generator if the entrainment ratio (ER) of the HP-ejector is already known. For the HP-generator modelling, the saturation temperature is already known because it is an input parameter, therefore, it is possible to calculate the properties of the working fluid at state 7 (saturated-vapour) and state 7X (saturated-liquid). The PPTD value of 2 °C has been used. Applying the energy balance principle on the heating water (source) and the working fluid from state 7X to state 7, we obtain.
m source Cp source ( T source T source 7 X   ) =   m 7 ( h 7 h 7 X   )
Here, Tsource7X is the temperature of source (heating water) at point 7X and can be calculated by
T source 7 X = T 7 + DTpp HPG
Hence, m7 can be found out and because we know the ER from ejector model, we are able to calculate the m2.
ER HP = m 7 / m 2
Also, applying mass balance on HP ejector gives
m 5 = m 3 = m 7 + m 2
Similarly, for LP-generator, the PPTD is at state 9X as shown on T-s diagram. As the saturation temperature is an input parameter, therefore, it is possible to calculate the properties of working fluid at point-9 and the state 9X (saturated-liquid). Again, applying the energy balance principle on the heating water (source) coming from HP-generator and the working fluid from state 9X to 9, we have
m source   C p , w   ( T sourceout , HPG T source , 9 X   ) = m 9   ( h 9 h 9 X   )
Here, Tsourceout,HPG is the temperature of hot water leaving the HP generator and entering the LP generator. Tsourceout,LPG is the temperature of heating water corresponding to point 12 and can be found by
T source 9 X = T 9 + DTpp LPG
Hence, m9 can be found out and because we know the ER from ejector model, we can find the m11
ER LP = m 9 / m 11
Applying the mass balance on LP ejector gives
m 4 = m 9 + m 11
To calculate the temperature of the heating-water leaving the HP-generator (Tsourceout,HPG), energy conservation is applied on the pre-heating (state 6 to state 7X) section of HP generator
m source C p , w   ( T source , 7 X   T sourceout , HPG   )   = m 7   ( h 7 X h 6   )
Similarly, for LP generator, we have;
m source   C p , w   ( T source , 9 X   T sourceout , LPG   ) = m 9   ( h 9 X h 8   )
Here, Tsourceout,LPG is the temperature of the hot-water exiting the LP-generator and is an important parameter to do the calculations for waste heat driven systems because many a times it is constrained because of the overall system integration requirements. The total heat supplied is calculated as
Q sourceLPG = m source   C p , w   ( T source , HPG   T sourceout , LPG   )
As we know the condensation temperature and pressure, we already know the state 5 and we know how much pressure difference the HP pump needs to generate. Therefore, the specific pumping power of HP pump (WHPpump) is calculated by
W HPpump = v 5   ( P 6 P 5 ) = h 6 h 5
Here, v5 is the specific volume of the liquid working fluid entering the pump at the state 5. As h5 is already known, we can calculate the value of h6 and, therefore, the pumping power of HP pump can be found out with equation below
W HPpump = v 5   ( P 6 P 5 )
The specific volume at state 5 is also calculated by using working fluid properties based on the saturation temperatures which are directly entered in the EES code. Similarly, for LP pump we have:
W LPpump = v 5   ( P 8 P 5   ) = h 8 h 5
W LPpump = m 5 ( h 8 h 5 )
The expansion in the expansion valve (from state 5 to state 10) is isenthalpic. From state 10, the liquid-vapour refrigerant will be separated by the separator to both state 11 (saturated vapour) and 12 (saturated liquid). The saturated vapour at state 11 would then be entrained by the LP ejector. To derive the enthalpic values for state 10, 11, and 12, we would need to determine the optimal pressure state for all three points. This is done by introducing a new variable known as the YY factor (0 to 1) to determine the optimal pressure which would affect the overall COP of the system. YY it is a fraction of pressure difference between condenser and evaporator and its correct value gives the correct value of P10). YY is determined by the program as shown:
P 10 =   P 1 +   DP YY
Difference   of   condenser   and   evaporator   pressure   =   DP   =   P 5   P 1
After P10 has been determined, the enthalpies at state 11 and 12 are calculated by using working fluid properties based on the saturation pressure at P10 (P10 = P11 = P12) which are directly entered in the EES code.
h 11 =   f ( P 11 ,   x 11 )
h 12 =   f ( P 12 ,   x 12 )
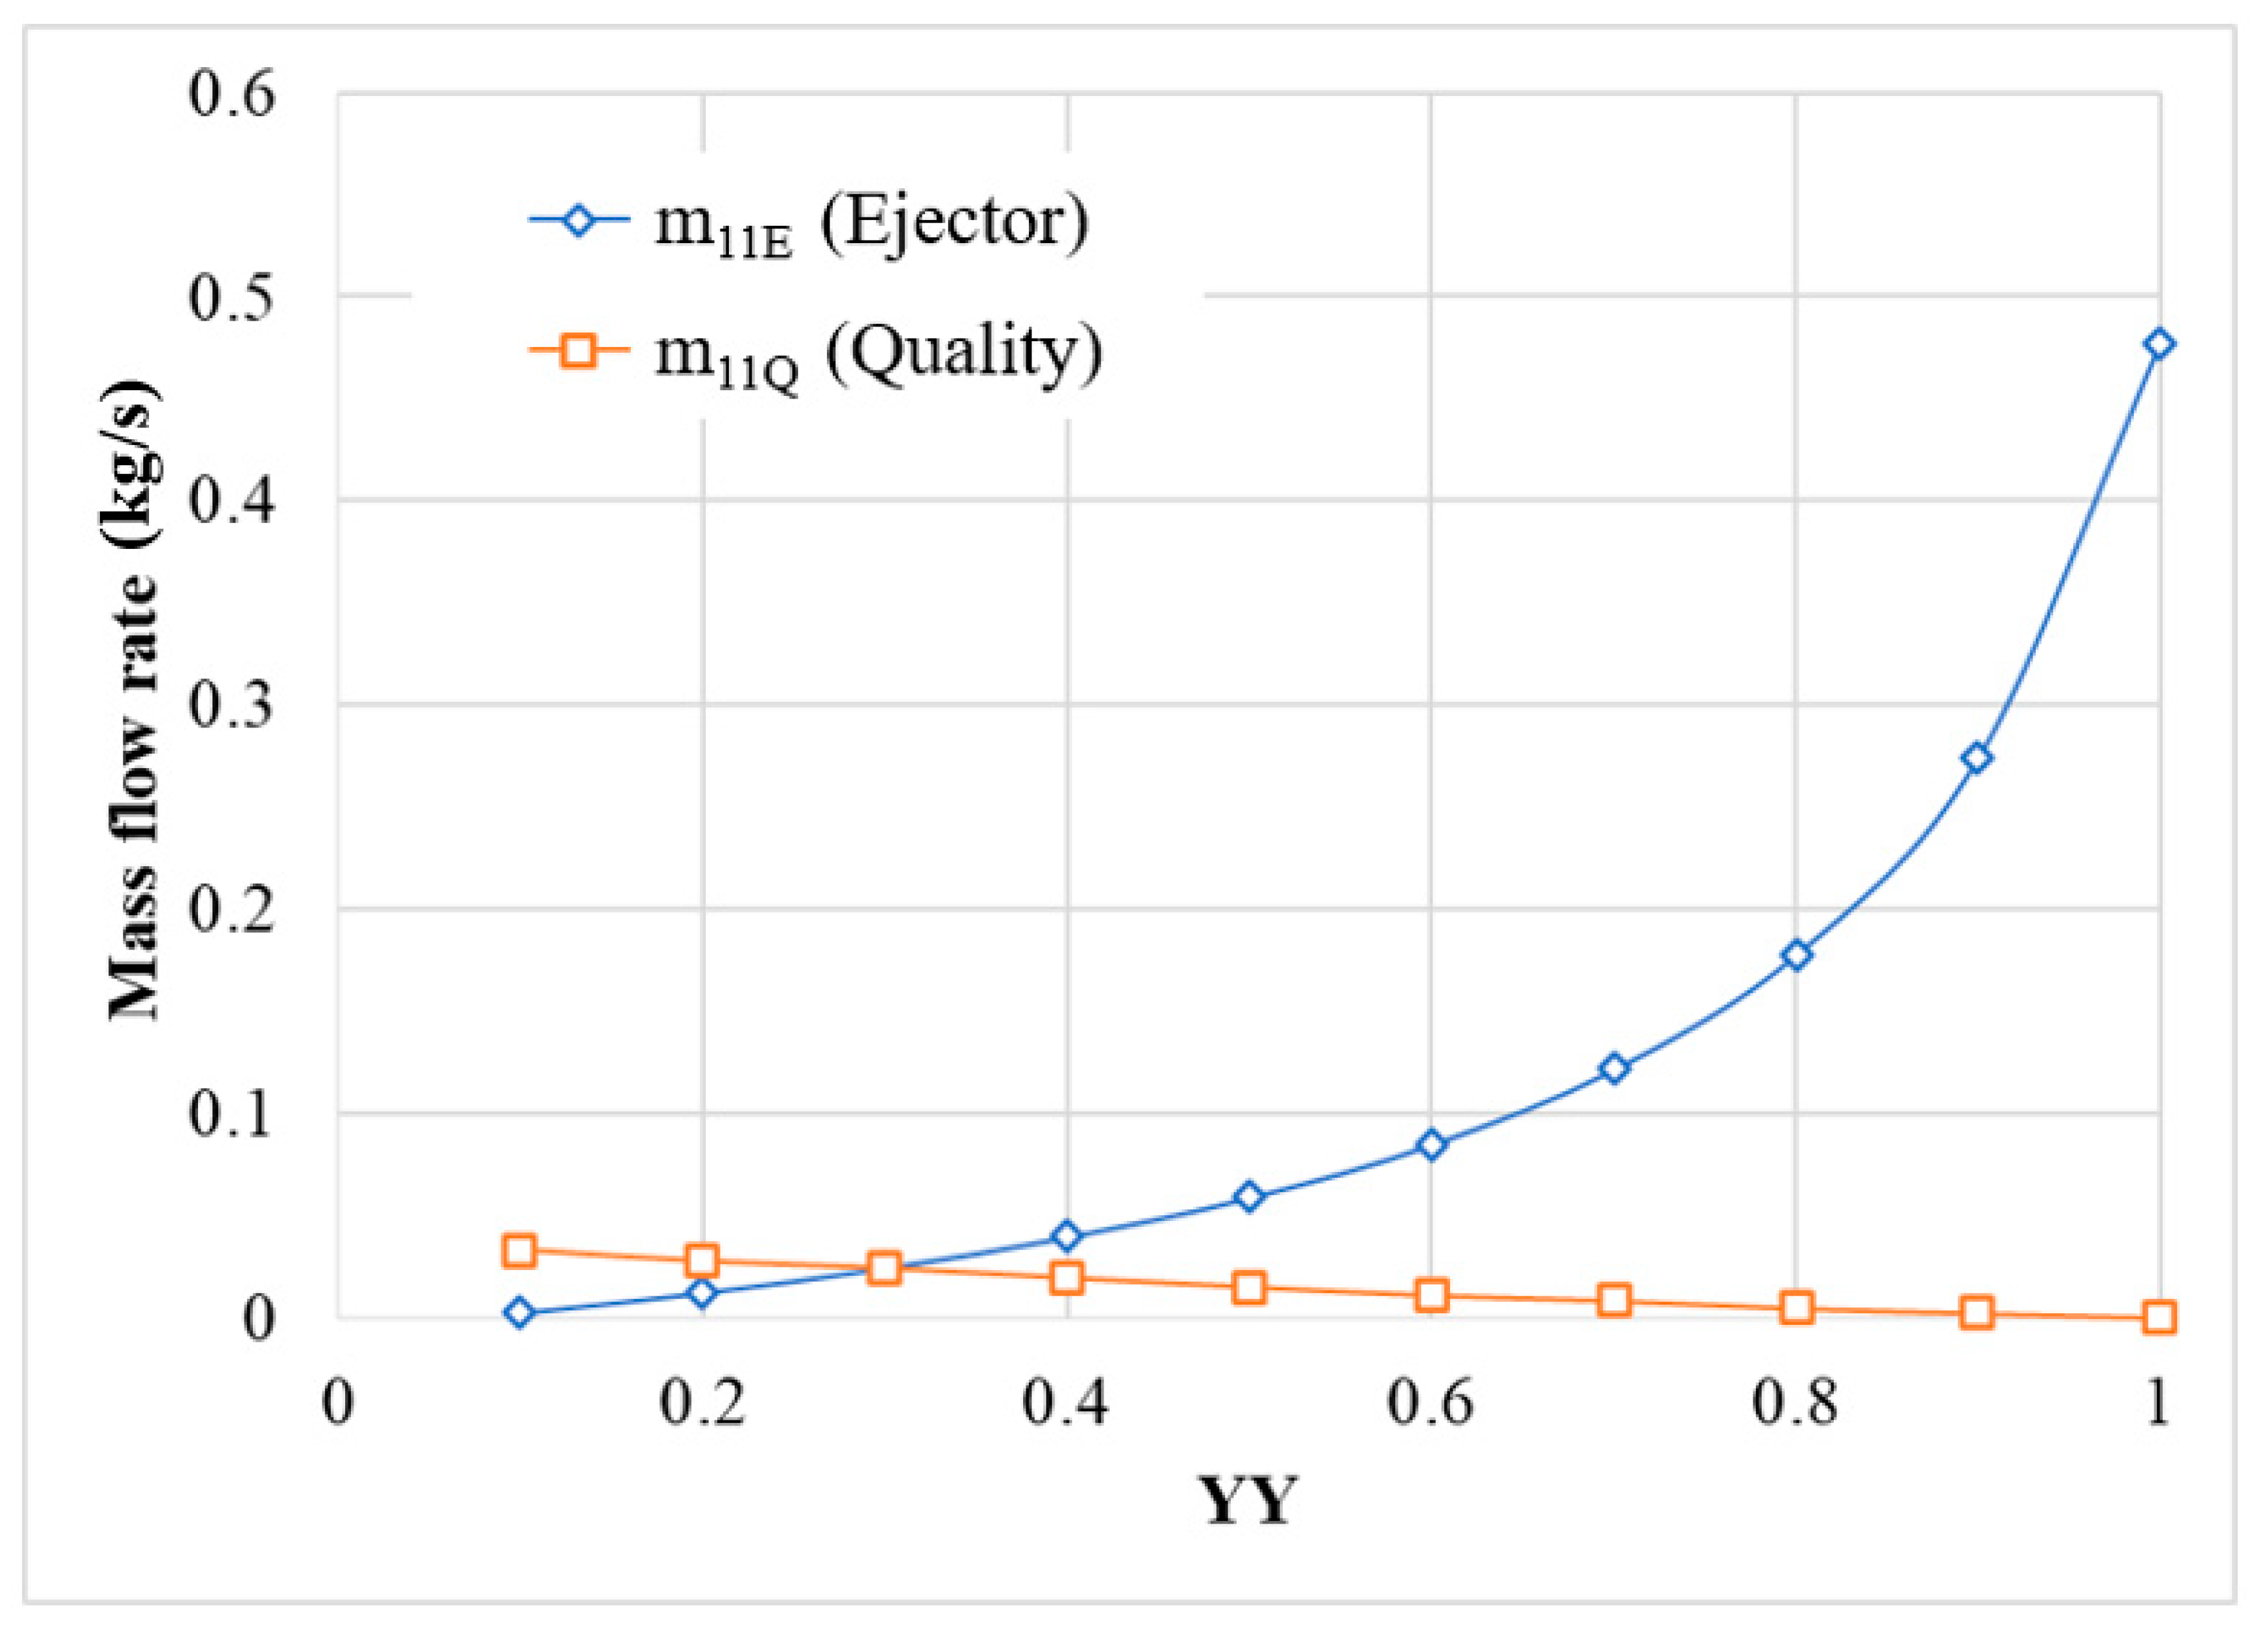
However, we must also consider the mass flow rate, m11E, as there is a maximum constraint on how much of the actual mass flow rate, m11Q, the LP ejector can entrain. This is done by computing m11Q based on the quality relation as the quality puts a constraint on the mass flow rate of vapour and liquid (m11 and m12). Therefore, m11 cannot be very high. The quality relation is as follows:
Quality   = m 11 m 11 +   m 12 ,   where   m 12 = m 1
Since h10 (h5) and P10 are determined, we can determine the quality of the working fluid properties by typing directly the EES code. For higher values of YY, it would lead to higher values of P10 and higher entrainment ratio of the LP ejector. Hence, m11E would be higher as well but the actual mass flow rate, m11Q, would be lesser than m11E as shown in Figure 5. For higher values of YY, the P10 value is higher, therefore, it is easier for the LP ejector to entrain the fluid, therefore, m11E (ejector) values are higher because of the higher value of entrainment ratio. However, higher values of m11 (ejector) are not particle because m11Q (quality) values are lower and therefore the system cannot provide enough mass flow for the ejector to be entrained. Therefore, the only values of YY that are acceptable are those when m11E ≤ m11Q and the optimal value would be when m11Q is as close as m11E.
In the evaporator, state-1 of working fluid is known because the evaporator temperature is an inlet parameter. The expansion in the expansion valve (from state-12 to state-13) is an isenthalpic process and, therefore, state 13 is known because pressure P13 is the same as the evaporation pressure.
The cooling produced (refrigeration effect) is calculated as
Q e = m 1   ( h 1 h 13 )
The total compression pressure difference required for the system to operate is the pressure different between evaporator and condenser which are defined by system operating conditions.
DP comp =   P condenser P evaporator
This total pressure different (DP
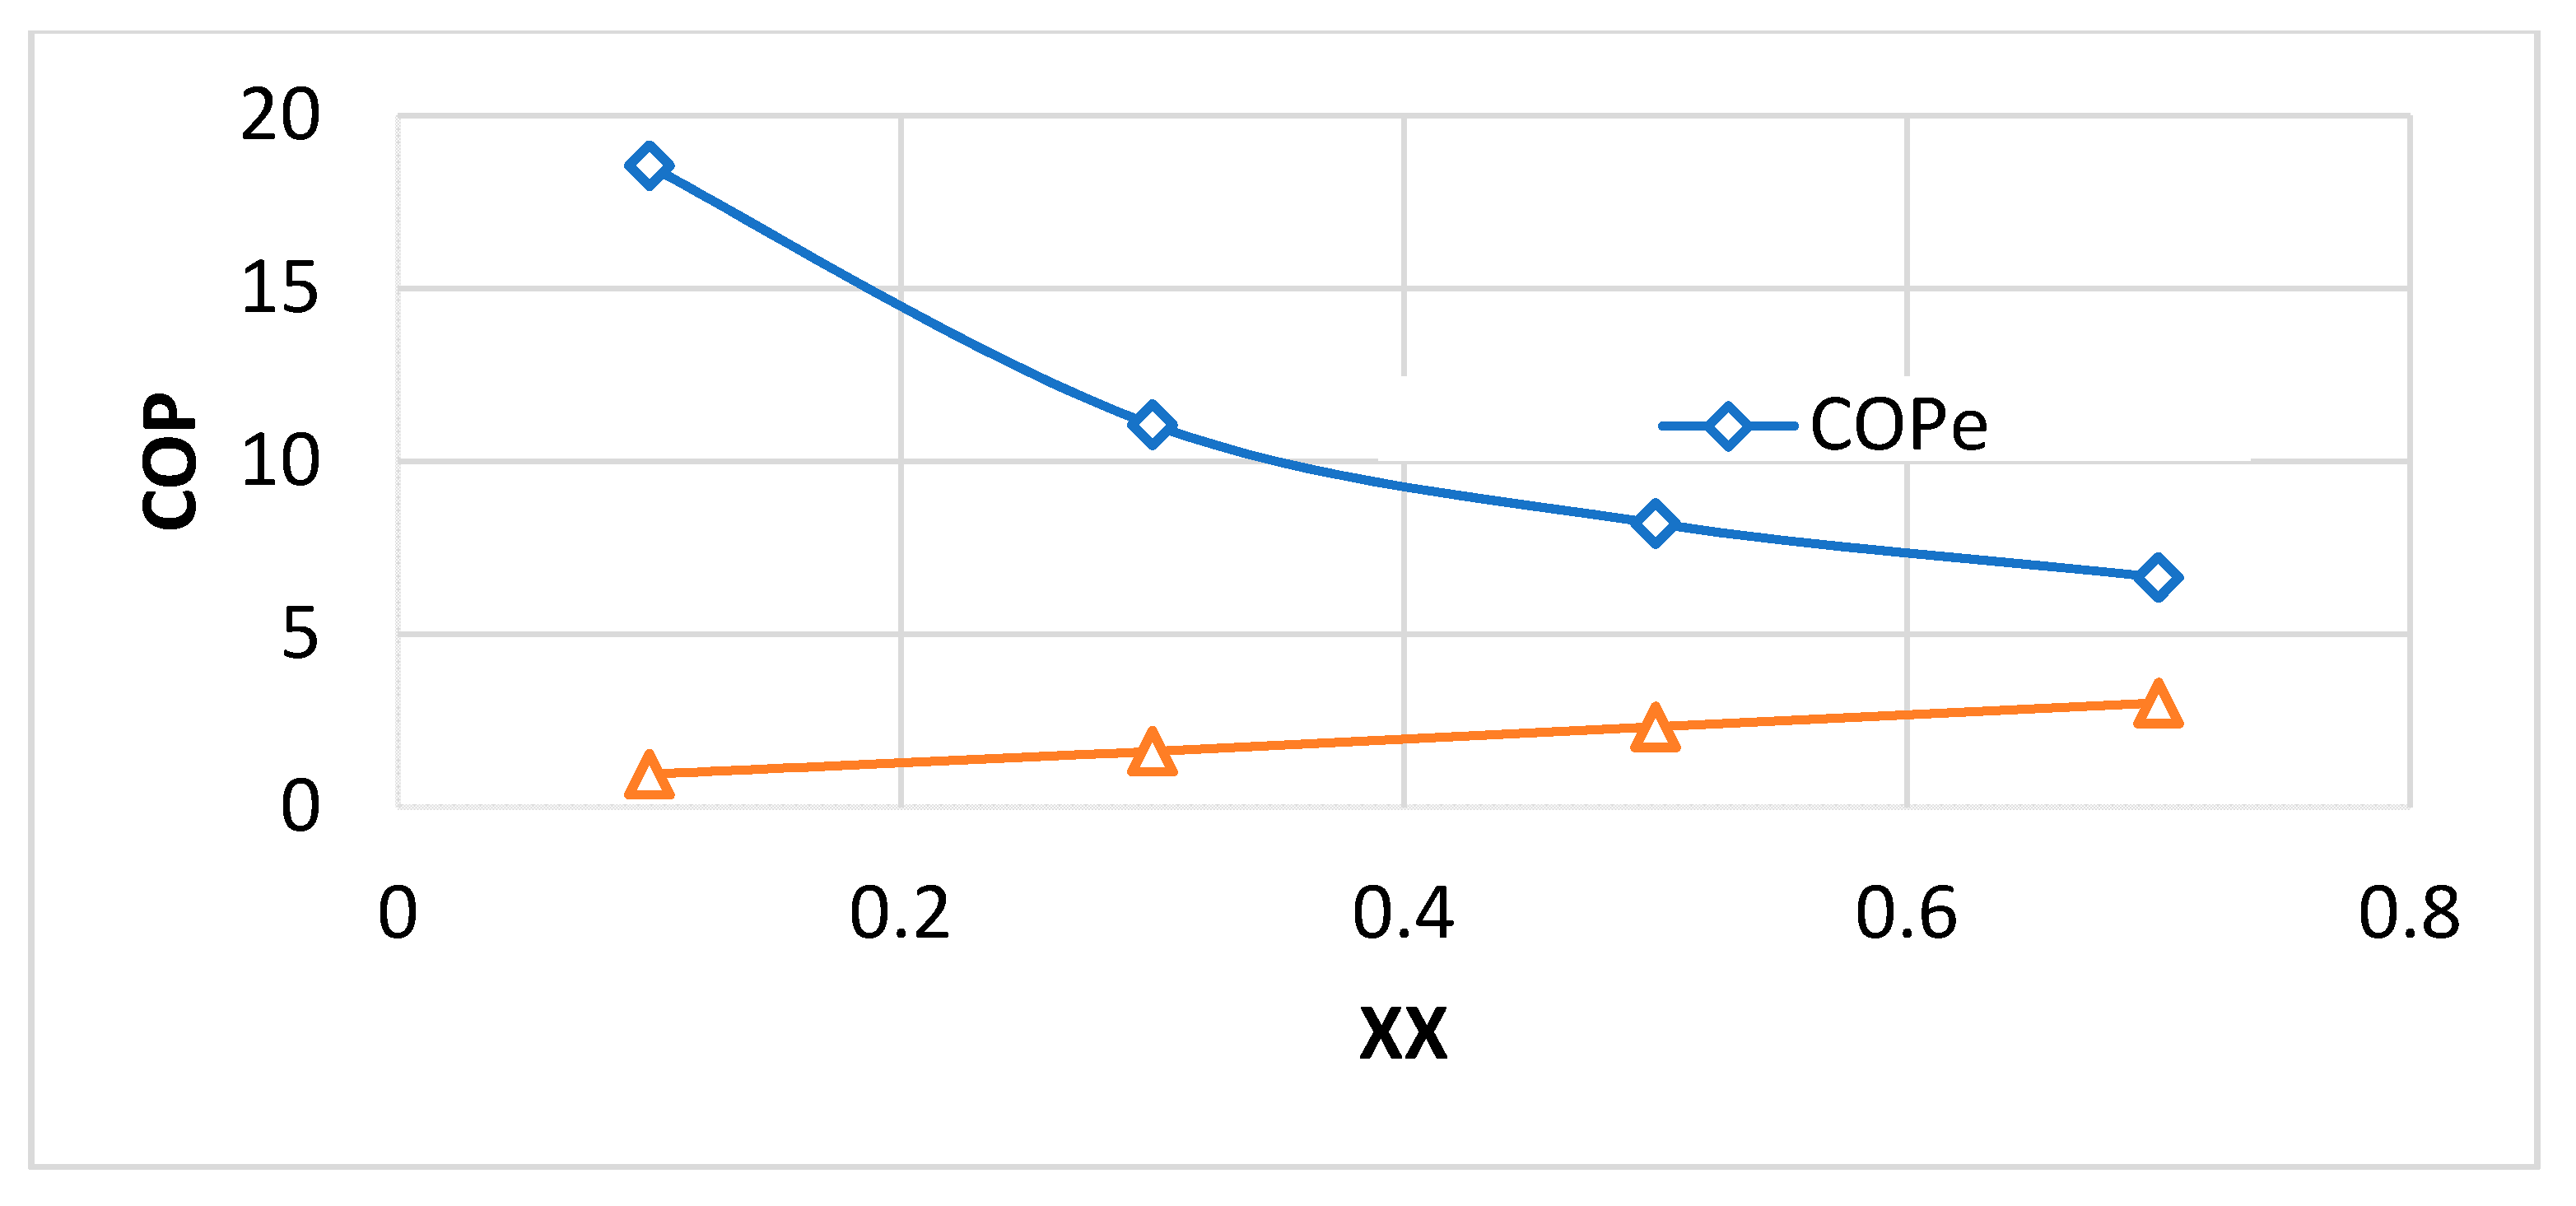
comp) load is shared by the ejectors and the compressor. The amount of load shared by the ejectors and the compressor would depends on the factor XX (0 to 1);
P 2 = P 1 + DP comp   ( XX )
Since the purpose of this study is to achieve a higher COPe while maintaining a good amount of cooling output, XX = 0.5 would be optimal. If the higher value of COPg is preferred, a higher XX value would be desirable. If XX is too low, the entire model would function like an ERS and hence may not achieve the desired COPe. If XX is too high, the entire model would function like a VCC which may not be as energy-efficient since waste heat is not being utilized to its fullest potential. If XX = 0.5, it allows both the ejector and compressor to share the load equally and it would be a good compromise between COPg and COPe. This can be seen in Figure 6.
These compression load sharing percentages of the compression load depends on various factors and be varied to satisfy various system requirements. For example, if the system needs a relatively high amount of cooling and relatively low amount of waste heat is available, the share of the compressor can be increased, and the share of ejectors will be decreased. The share of the HP ejector will always be higher than the LP ejector because the LP ejector is just trying to utilize the heat which is not utilized by the HP ejector.
Because P1 and h1 are known, state 1 is known, and therefore, specific entropy (s1) can be calculated. The compressor isentropic efficiency of 80% is used. The enthalpy at compressor exit (h2) is calculated as
h 2 =   h 1 +   ( h 2 isen h 1   ) η compressor
Here h2,isen is the ideal enthalpy if the compression was isentropic (s2 = s1). The compressor power (Wcomp) is calculated as;
W comp = m 1 ( h 2 h 1 )
Because the state 2 is now known, an energy balance can be applied on the HP ejector to find out h3 as;
m 7   h 7 + m 2   h 2 = ( m 7 + m 2   ) h 3
Therefore, the heat rejected by the condenser is calculated as
Heat   Rejected = m 5   ( h 3 h 5 )
m 5 =   m 3   +   m 4
The electrical coefficient of performance (COPe) is defined as the ratio of the refrigeration effect produced to the electrical power consumed by the system which is calculated as;
COP e = Q e W comp +   W HPpump + W LPpump
The global coefficient of performance (COPg) calculation considers both the electrical input as well as heat input adjusted for its quality. COPg is calculated as;
COP g =   Q e W comp +   W HPpump + W LPpump   +   Q source ( η power )
Q source =   Q sourceLPG + Q sourceHPG
η power =   0.1
Here, ηpower is the efficiency of an imaginary heat engine which converts the heat supplied into electrical power. Since the exergy value of electrical power is unity while for the low-grade heat the exergy value is much less, it is not right to just simply add the heat supplied with compressor and pump power.
Here, T_ambient value is taken as 5 °C lower than the condenser temperature and it is assumed that the imaginary heat engine operates at 80% of the maximum efficiency (Carnot Efficiency). Please note that the assumed efficiency is 80% of the Carnot Efficiency and NOT the Carnot Efficiency.
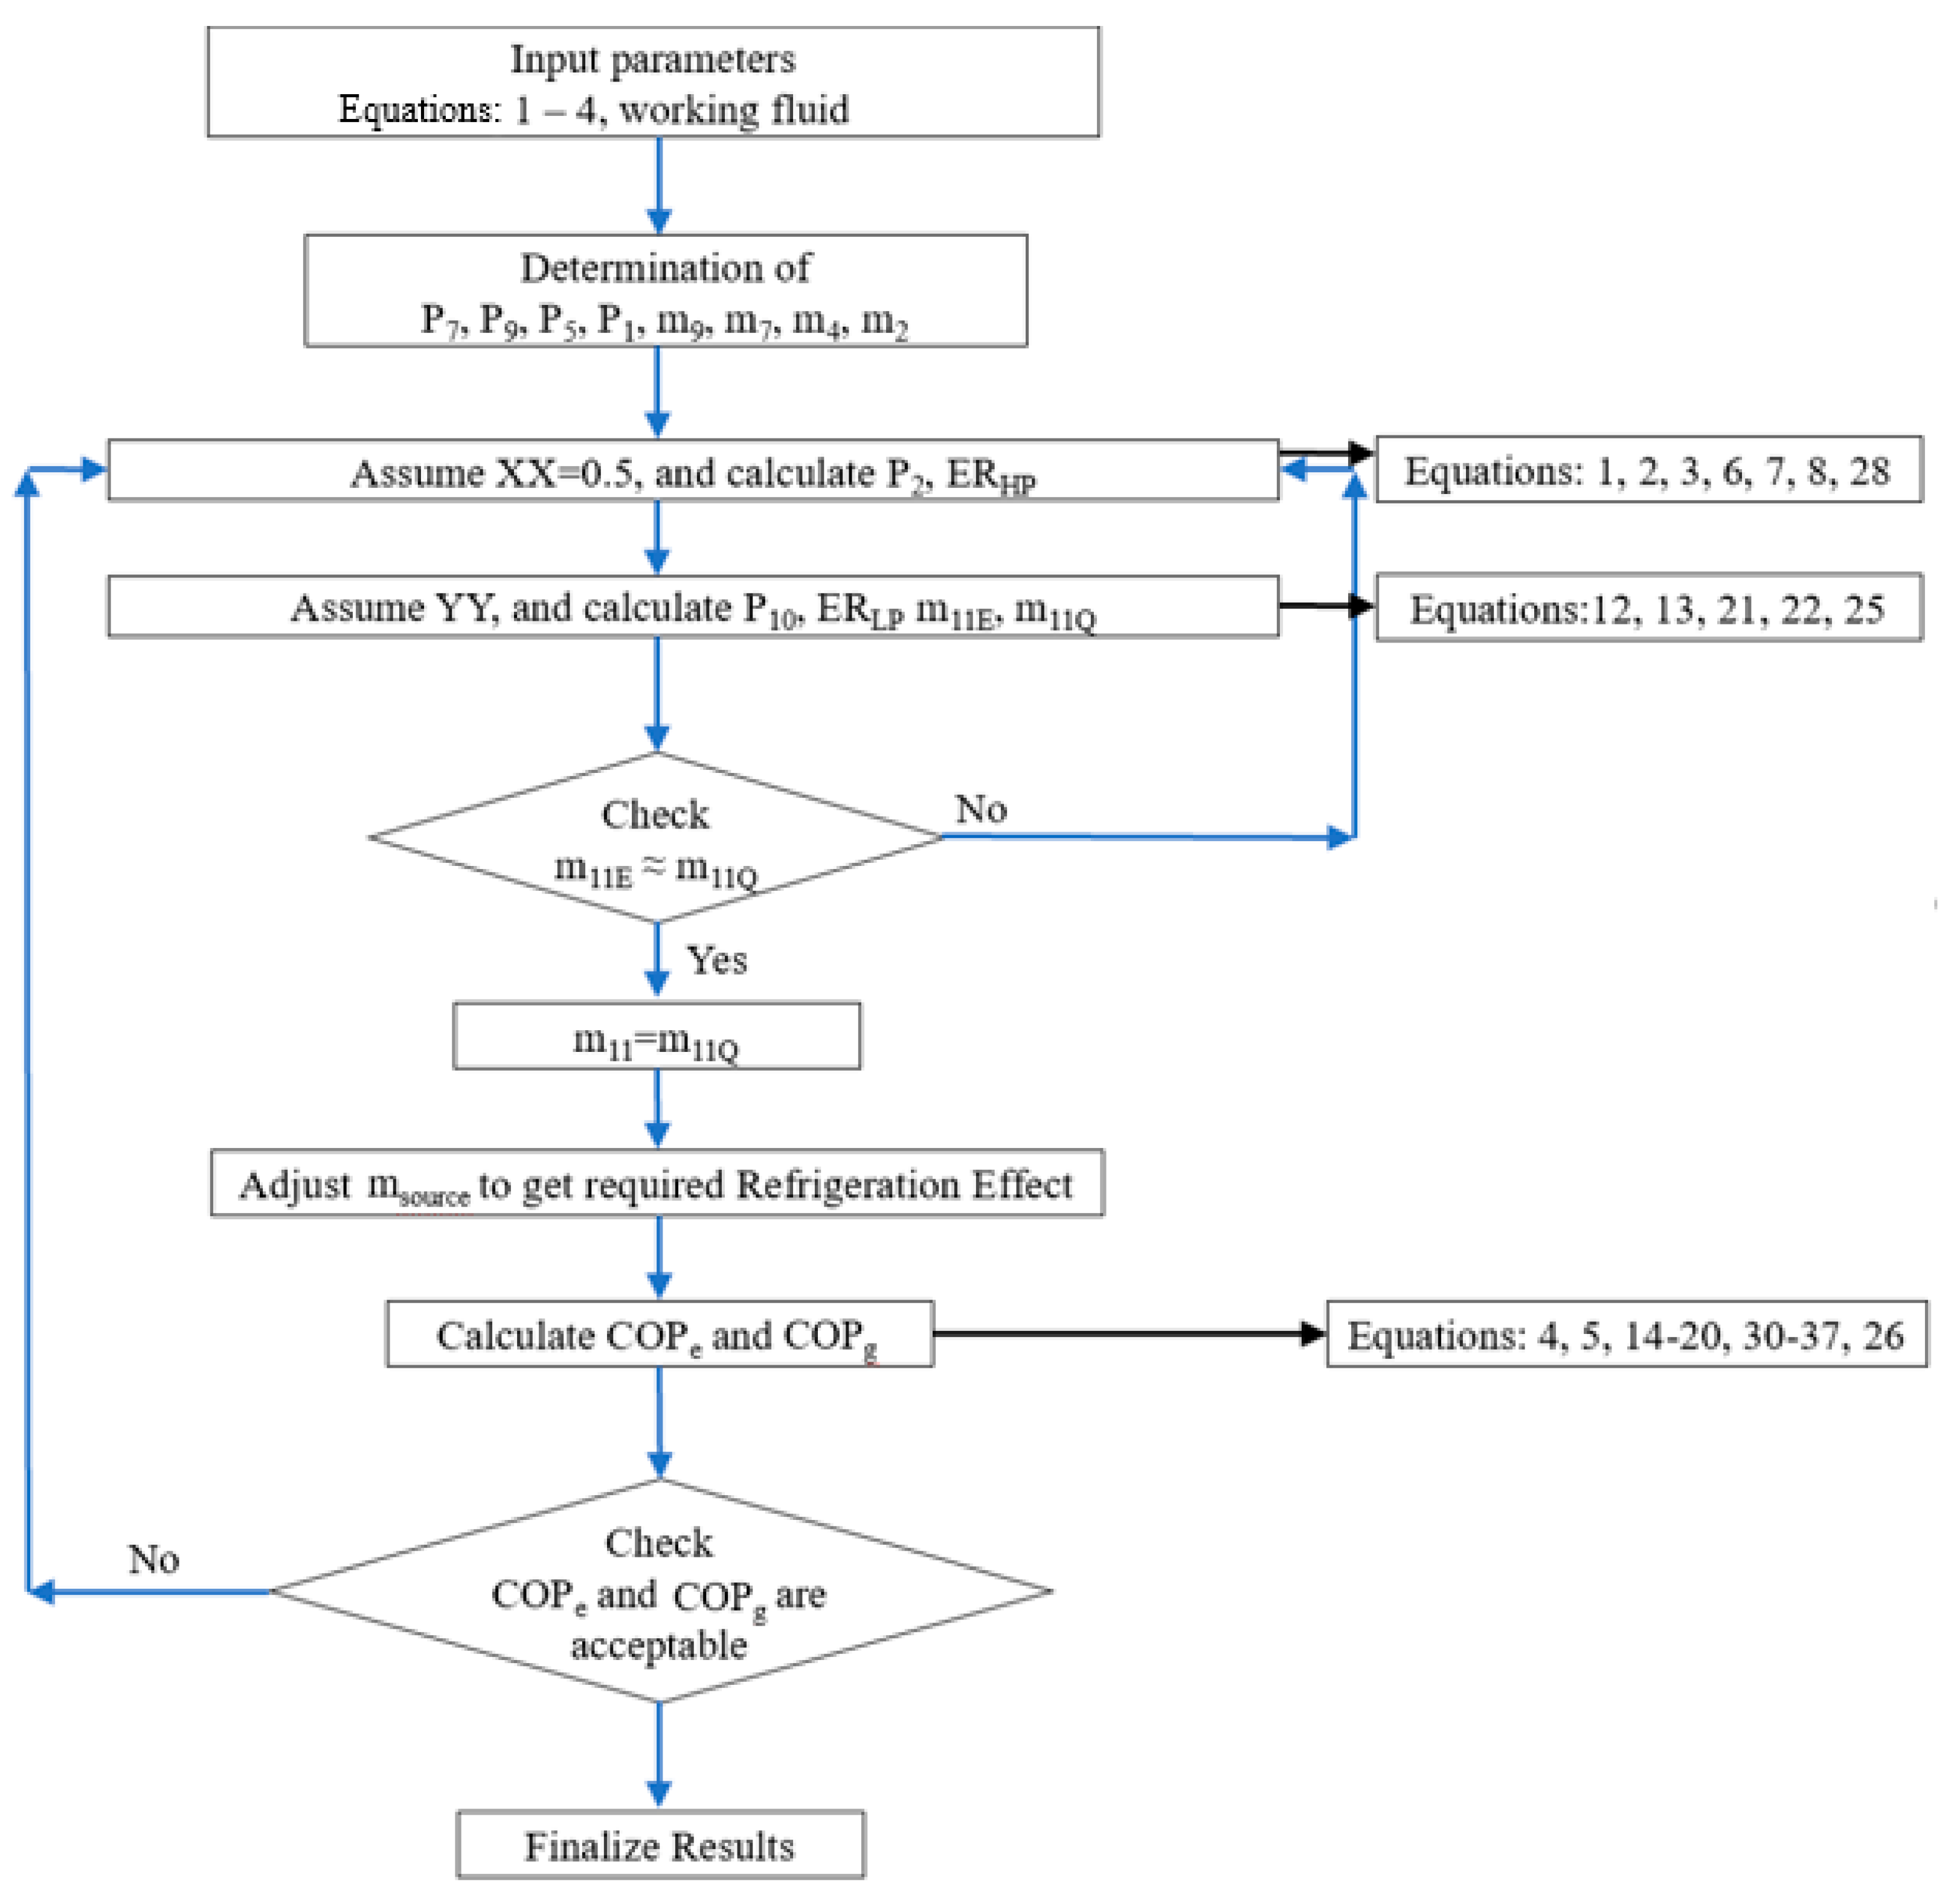
Figure 7 shows the computational flow diagram of the EES model. After getting the input parameters the EES codes can determine all the pressures except P10 and therefore it is possible to use the ejector model to use the entrainment ratio of the HP ejector. As discussed earlier, the YY is selected such that m11E is equal to m11Q to attain mass balance in the system circuits. An initial value of XX and YY are assumed and the system model is solved, and this iterative process is repeated until m11E becomes equal to m11Q. After the system’s operating pressures conditions are finalized, the output of the system can be varied based on the flow rate of heating water which has a linear relation. The flow rate of heating water just alters the size of the system and does not affect the operating conditions. After the required sizing of the system is achieved, the results are recorded.
The ejector model can calculate the entrainment ratio only when all three pressures (motive, suction, and delivery) are known. For the HP ejector, the motive and delivery pressures are known from external inputs, but its suction pressure is not known. For the LP ejector, the suction pressure is known from an external input, but its motive and delivery pressures need to be calculated first by our model to be able to calculate the entrainment ratio. To find the suction pressure of the HP ejector and the delivery pressure of the LP ejector, the total compression load is divided among the two ejectors and the compressor. More information on the system modelling for ejectors has been studied by Riaz et al. [15].

3. Results and Discussion

3.1. Validation of the Used Analytical Ejector Model

The details of the used analytical model, which has been developed in the EES, are available in details in our previous publication F. Riaz et al. [40]. To validate the proposed model, its results have been compared with the published data.
Figure 8 represents good agreement with the experimental data (on-design performance case) published by Federico et al. [41] with an average error of 3%.
To further validate, another published set of data for R245fa based ejector’s analytical results data from Zheng et al. [28] is used. A good agreement with an error of about 5.7% is obtained as shown in Figure 9.
As shown, the good agreement indicates the reliability of the new analytical model.

3.2. Validation of EBSILON Model with EES Model

For the validation, an EES model of the proposed system is developed so that the simulation results of the EBSILON model can be compared with the EES model. The details of modelling of a thermodynamic system and its integration with the developed ejector model can be found in the reference F. Riaz et al. [40]. For validation, both EES and EBSILON models have been simulated for the same working conditions as discussed in the section of EBSILON modelling. The T-s diagram shown in Figure 10, represents the EES system modelling results. As shown, the pressure values are the same as those used in the EBSILON model, for example, the ejector motive pressure (P9) is 5 bar and evaporator pressure (P3) is 1 bar.
The comparison of calculated results of both systems is given in the table below. As indicated by the low values of percentage difference (or error), there is a very good agreement between the EES results with EBSILON. In EBSILON, there are built-in models for components, like heat exchangers and expander etc., while in EES all the components are modelled by using their governing equations. A very good match of these results from the EES and EBSILON model ensures that all the EBSILON model has been set-up correctly. The average difference for the values shown in Table 1 is just 1.9% which means that the developed model can be used with confidence for the system design, optimization, and parametric studies.

3.3. Performance Comparison

For comparison, a base case has been selected. The base case system is designed for 10 kW of refrigeration effect at the evaporator temperature of 5 °C and a condenser temperature of 45 °C, while the heat source temperature is characterized by the generator temperature of 90 °C which is same as used by Yingjie Xu et al. [4] for their ejection-compression system (ECS). For the base case, the performance comparison of the proposed system with various other systems reported in the literature is given below in Table 2.
The main purpose of the proposed system is to maximize the utilization of available heat, that is, bring the temperature of heating (source) stream to the lowest value possible. This also means that the focus of the proposed system is to maximize the COPe value. The COPg is less important as the systems is designed for waste heat and for maximum heat utilization. The proposed EVCC system is producing better COPe value as compared to other systems. Additionally, the COPg value is high enough and second to only ECS and this is because of the difference of the design (component configurations) of the two systems. The ECS cannot extract enough heat from the source stream and therefore its COPe value is on the lower side and hence the COPg value is on the higher side. The better COPg indicates that a smaller solar collector area will be needed as compared to the other systems.

3.4. Parametric Study and Optimization

3.4.1. Effect of Evaporator Pressure

Figure 11 shows the effect of evaporator temperature on the electrical coefficient of performance (COPe). The COPe of the proposed system increases with the increase of evaporation temperature. As compared to the conventional VCC, the increase of COP for the presented novel cycle is much more as we move towards higher evaporation temperatures.
With the increase in evaporation temperature, the saturation pressure of the working fluid in the evaporator increases, which decreases the overall compression ratio for the system. Both the ejectors of the novel system experience decrease in their individual compression ratios hence their entrainment ratios increase which increases the electrical and global COP. Qsource is the heat supplied by the heating stream. The constant Qsource line indicates that there is no effect of evaporator temperature on the heat extracted from the heating source stream.
For EVCC, the electrical power consists of mechanical compressor power and pumps power for two vapour generators. With the increase in evaporation pressure, the pressure ratio across mechanical compressor decreases. Hence, as the COP increases with the evaporation temperature, this means that the electrical power required by the mechanical compressor decreases to produce the same refrigeration effect of 10 kW.

3.4.2. Effect of Condenser Pressure

The condensation temperature is varied from 35 °C to 50 °C and its effect on COP, heat input and electricity input, has been studied and the results are compared with conventional VCC.
Figure 12 shows the effect of condenser temperature on COPe. With the decrease in condenser temperature, the COPe of the proposed EVCC increases more rapidly as compared to VCC. With the decrease in condenser temperature, the condensation pressure decreases hence the total compression ratio of the system decreases which in turn means that the mechanical compressor also has a lesser compression ratio to work with. This decreases the electrical input and increases the COPe. Since in the proposed system there are two ejectors and the entrainment ratio of the ejector is a strong function of compression ratio, therefore, the entrainment ratio of both the ejectors increase. At 50 °C condenser temperature, the entrainment ratios of downstream (higher pressure) and upstream (lower pressure) ejector are 0.38 and 0.07 respectively, whereas for 35 °C, these values are 1.01 and 0.21 respectively. At 50 °C condenser temperature, the COPe of EVCC is 67.5% higher than conventional VCC while at 35 °C, the COPe of EVCC is 86.0% higher than conventional VCC. As the proposed system is more suitable for industrial waste heat applications, it is proposed to use the water-cooled condenser rather than the air-cooled condenser. In the tropical conditions of Singapore, the water-cooled condenser can be designed to the operator at the condensation temperature of about 35 °C at which the proposed EVCC gives a much higher COP as shown in Figure 12.
Figure 12 also shows the effect of condensation temperature on electrical power. As explained earlier, with the decrease in condenser pressure, the pressure ratio across mechanical compressor decreases. Furthermore, due to the increased entrainment ratio of a low-pressure ejector, the mass flow rate passing through the mechanical compressor decreases a little which further decreases the electrical input to compressor, but this effect is not very significant. Hence, as the COP increases with decreasing condenser temperature, the electrical power required by the mechanical compressor decreases to produce the same refrigeration effect of 10 kW.

3.4.3. Effect of HT Generator Temperature

The temperature of the high-temperature generator is limited by the temperature of the available heat source. If a higher temperature heat source is available, then the high-temperature generator can be operated at a higher temperature and pressure. In the proposed EVCC system, the temperature and pressure of the low-temperature generator are limited by the mass balance of the system. Its pressure is set to have a suitable entrainment ratio which will allow enough mass flow supplied to the mechanical compressor which is equal to entrainment capacity of a high-pressure ejector.
For fixed evaporator and condenser temperatures, the overall compression ratio of the cooling system remains constant. When the temperature of the high-temperature generator changes, only the motive pressure of a high-pressure (HP) ejector changes while its compression ratio remains the same. The figure shows the effect of changing the temperature of a high-pressure generator on COPe. Clearly, for conventional VCC, the COPe does not change. The COPe of the proposed EVCC changes considerably, and for higher temperatures of the HP generator, the COP is higher. Although the compression ratio for the mechanical compressor is not changing, the mass flow rate is reducing which is reducing the electrical power needed to run the compressor and hence the COP is increasing. Figure 13 also shows this decrease of electrical power with increasing an HP generator temperature.

4. Conclusions

Low-grade heat is abundantly available as solar energy and as industrial waste heat which can be converted into cooling by the proposed EEVCRC system which has been modelled, compared, analyzed, and optimized using EES. The ejector model used in EES simulations of the system is a new analytical model which gives an on-design optimal performance of ejectors for the available working conditions. The system gives better performance than all the three systems it has been compared with. The sensitivity analysis found that the COP of the proposed system increases exponentially at lower condensation temperatures and higher evaporator temperatures, making it very suitable for industrial water-cooled systems and higher temperature cooling applications. At 50 °C condenser temperature, the electrical COP of EEVCRC is 50% higher than conventional VCC while at 35 °C, the electrical COP of EEVCRC is 90% higher than conventional VCC. For the higher temperature heat source, and hence the higher generator temperatures, the electrical COP of EEVCRC increases linearly while there is no increase in the electrical COP for ECS. It is found that by using the second ejector at the upstream of the electrical compressor, the electrical COP is increased by 49.2% as compared to a single ejector system. At 50 °C condenser temperature, the electrical COP of EVCC is 67.7% higher than conventional VCC while at 35 °C, the electrical COP of EVCC is 85.6% higher than conventional VCC. For the higher temperature heat source, and hence the higher generator temperatures, the electrical COP of EVCC increases linearly. The relatively better global COP indicates that a small solar collector will be needed if this system is driven by solar thermal energy.

5. Patents

A patent application has been submitted to the Industry Liaison Office (ILO) of the National University of Singapore (ILO REF: 2020-120) in July 2020. The ILO will be filing the patent with the Singapore Registry of Patents.

Author Contributions

Conceptualization: F.R. Methodology: F.R. Software: F.R. and K.H.T. Validation: F.R. Formal analysis: F.R. and K.H.T. investigation: F.R. and K.H.T. Resources: P.S.L. Data curation: F.R., K.H.T. and M.F. Writing—original draft preparation: F.R. and K.H.T. writing—review and editing: F.R., M.F. and M.I. visualization: F.R., M.F. and M.I. supervision: P.S.L. project administration: F.R. and P.S.L. funding acquisition: F.R. and P.S.L. All authors have read and agreed to the published version of the manuscript.

Funding

This research received no external funding.

Conflicts of Interest

The authors declare no conflict of interest.

Abbreviations

0DZero Dimensional1-DOne Dimensional
2DTwo DimensionalCCPCombined Cooling and Power
CFDComputational Fluid DynamicsCOPCo-efficient of Performance
COPeElectrical Co-efficient of PerformanceCOPgGlobal Co-efficient of Performance
EESEngineering Equation SolverERSEjector Refrigeration System
EORCEjector Enhanced Organic Rankine CycleEREntrainment Ratio
hEnthalpy (J/kg)HPHigh Pressure
HRVGHeat Recovery Vapour GeneratorHTHigh Temperature
HTGHigh Temperature GeneratorkIsentropic Exponent
LTLow TemperatureLTGLow Temperature Generator
LPLow PressuremMass flow tare (kg/s)
NXPNozzle Exit Position [m or mm]ORCOrganic Rankine Cycle
PPressure (Pa or bar)PPTDPinch Point Temp Difference (°C)
QcondenserHeat Rejected by Condenser (kW)QrefrigerationRefrigeration Effect (kW or RT)
QsourceTotal Heat Supplied by Heat Source to the System [kW]sSpecific Entropy (J kg−1 K−1)
TTemperature(°C)
Tsource,outTemperature of exiting hot water (heating source)(°C)VCCVapour Compression Cycle
WexpanderExpander Work Output(kW)ηEfficiency
XXDefined in equation 28. Fraction of pressure difference between evaporator & condenser for finding P2
YYDefined by equation 21. Fraction of pressure difference between condenser & evaporator for finding value of P10

References

  1. Mao, N.; Pan, D.; Li, Z.; Xu, Y.; Song, M.; Deng, S.S. A numerical study on influences of building envelope heat gain on operating performances of a bed-based task/ambient air conditioning (TAC) system in energy saving and thermal comfort. Appl. Energy 2017, 192, 213–221. [Google Scholar] [CrossRef]
  2. Global Demand for Air-Conditioning to Triple by 2050: Report, Business News & Top Stories—The Straits Times. Available online: https://www.straitstimes.com/business/global-demand-for-air-conditioning-to-triple-by-2050-report (accessed on 6 December 2018).
  3. Hamzaoui, M.; Nesreddine, H.; Aidoun, Z.; Balistrou, M. Experimental study of a low grade heat driven ejector cooling system using the working fluid R245fa. Int. J. Refrig. 2018, 86, 388–400. [Google Scholar] [CrossRef]
  4. Xu, Z.; Wang, R. Comparison of absorption refrigeration cycles for efficient air-cooled solar cooling. Sol. Energy 2018, 172, 14–23. [Google Scholar] [CrossRef]
  5. Gorjian, S.; Ebadi, H.; Calise, F.; Shukla, A.; Ingrao, C. A review on recent advancements in performance enhancement techniques for low-temperature solar collectors. Energy Convers. Manag. 2020, 222, 113246. [Google Scholar] [CrossRef]
  6. Chen, Q.; Alrowais, R.; Burhan, M.; Ybyraiymkul, D.; Shahzad, M.W.; Li, Y.; Ng, K.C.; Qian, C.; Yong, L. A self-sustainable solar desalination system using direct spray technology. Energy 2020, 205. [Google Scholar] [CrossRef]
  7. Bellos, E.; Tzivanidis, C. Optimum design of a solar ejector refrigeration system for various operating scenarios. Energy Convers. Manag. 2017, 154, 11–24. [Google Scholar] [CrossRef]
  8. Megdouli, K.; Tashtoush, B.; Nahdi, E.; Elakhdar, M.; Mhimid, A.; Kairouani, L. Performance analysis of a combined vapor compression cycle and ejector cycle for refrigeration cogeneration. Int. J. Refrig. 2017, 74, 517–527. [Google Scholar] [CrossRef]
  9. Xu, Y.; Jiang, N.; Wang, Q.; Han, X.; Gao, Z.; Chen, G. Proposal and thermodynamic analysis of an ejection–compression refrigeration cycle driven by low-grade heat. Energy Convers. Manag. 2017, 145, 343–352. [Google Scholar] [CrossRef]
  10. Wang, H.; Cai, W.; Wang, Y.; Yan, J.; Wang, L. Experimental study of the behavior of a hybrid ejector-based air-conditioning system with R134a. Energy Convers. Manag. 2016, 112, 31–40. [Google Scholar] [CrossRef]
  11. Kawamoto, Y.; Ogata, G.; Shan, Z. Ejector Energy-Saving Technology for Mobile Air Conditioning Systems. SAE Int. J. Passeng. Cars Mech. Syst. 2017, 10, 102–110. [Google Scholar] [CrossRef]
  12. Wang, L.; Cai, W.; Wang, X.; Lin, C.; Yan, J. Experimentation and cycle performance prediction of hybrid A/C system using automobile exhaust waste heat. Appl. Therm. Eng. 2016, 94, 314–323. [Google Scholar] [CrossRef]
  13. Sokolov, M.; Hershgal, D. Enhanced ejector refrigeration cycles powered by low grade heat. Part 1. Systems characterization. Int. J. Refrig. 1990, 13, 351–356. [Google Scholar] [CrossRef]
  14. Sokolov, M.; Hershgal, D. Enhanced ejector refrigeration cycles powered by low grade heat. Part 2. Design procedures. Int. J. Refrig. 1990, 13, 357–363. [Google Scholar] [CrossRef]
  15. Sokolov, M.; Hershgal, D. Enhanced ejector refrigeration cycles powered by low grade heat. Part 3. Experimental results. Int. J. Refrig. 1991, 14, 24–31. [Google Scholar] [CrossRef]
  16. Arbel, A.; Sokolov, M. Revisiting solar-powered ejector air conditioner—The greener the better. Sol. Energy 2004, 77, 57–66. [Google Scholar] [CrossRef]
  17. Sun, D.-W. Solar powered combined ejector-vapour compression cycle for air conditioning and refrigeration. Energy Convers. Manag. 1997, 38, 479–491. [Google Scholar] [CrossRef]
  18. Chesi, A.; Ferrara, G.; Ferrari, L.; Tarani, F. Suitability of coupling a solar powered ejection cycle with a vapour compression refrigerating machine. Appl. Energy 2012, 97, 374–383. [Google Scholar] [CrossRef]
  19. Petrenko, V.; Huang, B.-J.; Chen, G. Design-theoretical study of cascade CO2 sub-critical mechanical compression/butane ejector cooling cycle. Int. J. Refrig. 2011, 34, 1649–1656. [Google Scholar] [CrossRef]
  20. Pridasawas, W.; Lundqvist, P. An exergy analysis of a solar-driven ejector refrigeration system. Sol. Energy 2004, 76, 369–379. [Google Scholar] [CrossRef]
  21. Chen, J.; Jarall, S.; Havtun, H.; Palm, B. A review on versatile ejector applications in refrigeration systems. Renew. Sustain. Energy Rev. 2015, 49, 67–90. [Google Scholar] [CrossRef]
  22. Khennich, M.; Sorin, M.; Galanis, N. Equivalent Temperature-Enthalpy Diagram for the Study of Ejector Refrigeration Systems. Entropy 2014, 16, 2669–2685. [Google Scholar] [CrossRef] [Green Version]
  23. Pridasawas, W. Solar-Driven Refrigeration Systems with Focus on the Ejector Cycle. Ph.D. Thesis, Royal Institute of Technology, KTH, Stockholm, Sweden, 2006. [Google Scholar]
  24. Chou, S.; Yang, P.; Yap, C. Maximum mass flow ratio due to secondary flow choking in an ejector refrigeration system. Int. J. Refrig. 2001, 24, 486–499. [Google Scholar] [CrossRef]
  25. Li, X.; Zhao, C.; Hu, X. Thermodynamic analysis of Organic Rankine Cycle with Ejector. Energy 2012, 42, 342–349. [Google Scholar] [CrossRef]
  26. Chen, X.; Su, Y.; Omer, S.; Riffat, S. Theoretical investigations on combined power and ejector cooling system powered by low-grade energy source. Int. J. Low Carbon Technol. 2015, 11, 466–475. [Google Scholar] [CrossRef] [Green Version]
  27. Zhang, K.; Chen, X.; Markides, C.N.; Yang, Y.; Shen, S. Evaluation of ejector performance for an organic Rankine cycle combined power and cooling system. Appl. Energy 2016, 184, 404–412. [Google Scholar] [CrossRef] [Green Version]
  28. Zheng, B.; Weng, Y. A combined power and ejector refrigeration cycle for low temperature heat sources. Sol. Energy 2010, 84, 784–791. [Google Scholar] [CrossRef]
  29. Scott, D.; Aidoun, Z.; Bellache, O.; Ouzzane, M. CFD Simulations of a Supersonic Ejector for Use in Refrigeration Applications. Refrig. Air Cond. 2008, 1–8. [Google Scholar] [CrossRef]
  30. Huang, B.-J.; Chang, J.; Wang, C.; Petrenko, V. A 1-D analysis of ejector performance. Int. J. Refrig. 1999, 22, 354–364. [Google Scholar] [CrossRef]
  31. Varga, S.; Oliveira, A.C.; Diaconu, B. Numerical assessment of steam ejector efficiencies using CFD. Int. J. Refrig. 2009, 32, 1203–1211. [Google Scholar] [CrossRef]
  32. Rusly, E.; Aye, L.; Charters, W.; Ooi, A. CFD analysis of ejector in a combined ejector cooling system. Int. J. Refrig. 2005, 28, 1092–1101. [Google Scholar] [CrossRef]
  33. Chen, J.; Havtun, H.; Palm, B. Investigation of ejectors in refrigeration system: Optimum performance evaluation and ejector area ratios perspectives. Appl. Therm. Eng. 2014, 64, 182–191. [Google Scholar] [CrossRef]
  34. Varga, S.; Oliveira, A.C.; Diaconu, B. Influence of geometrical factors on steam ejector performance—A numerical assessment. Int. J. Refrig. 2009, 32, 1694–1701. [Google Scholar] [CrossRef]
  35. Chunnanond, K.; Aphornratana, S. An experimental investigation of a steam ejector refrigerator: The analysis of the pressure profile along the ejector. Appl. Therm. Eng. 2004, 24, 311–322. [Google Scholar] [CrossRef]
  36. Aphornratana, S.; Eames, I.W. A small capacity steam-ejector refrigerator: Experimental investigation of a system using ejector with movable primary nozzle. Int. J. Refrig. 1997, 20, 352–358. [Google Scholar] [CrossRef]
  37. Eames, I.W.; Ablwaifa, A.E.; Petrenko, V. Results of an experimental study of an advanced jet-pump refrigerator operating with R245fa. Appl. Therm. Eng. 2007, 27, 2833–2840. [Google Scholar] [CrossRef]
  38. Keenan, H.; Neumann, E.P.; Lustwerk, F. An investigation of ejector design by analysis and experiment. J. Appl. Mech. 1950, 17, 299–309. [Google Scholar]
  39. Munday, J.T.; Bagster, D.F. A New Ejector Theory Applied to Steam Jet Refrigeration. Ind. Eng. Chem. Process. Des. Dev. 1977, 16, 442–449. [Google Scholar] [CrossRef]
  40. Riaz, F.; Lee, P.S.; Chou, S.K. Thermal modelling and optimization of low-grade waste heat driven ejector refrigeration system incorporating a direct ejector model. Appl. Therm. Eng. 2020, 167, 114710. [Google Scholar] [CrossRef]
  41. Mazzelli, F.; Milazzo, A. Performance analysis of a supersonic ejector cycle working with R245fa. Int. J. Refrig. 2015, 49, 79–92. [Google Scholar] [CrossRef]
Figure 1. Sketch of an ejector [21].
Sustainability 12 08178 g001
Figure 2. Modes of operation of a fixed geometry ejector (modified from [30]).
Sustainability 12 08178 g002
Figure 3. The schematic of the novel configuration of ejector enhanced vapour-compression cooling system driven by low-grade heat and electricity.
Sustainability 12 08178 g003
Figure 4. P-h diagram of the novel configuration of ejector enhanced vapour compression cooling system driven by low-grade heat and electricity.
Sustainability 12 08178 g004
Figure 5. Comparison between YY (defined by equation 21, it is a fraction of pressure difference between condenser and evaporator for finding correct value of P10) and the mass flow rates from ejector and from the quality perspective for finding the correct value of m11.
Sustainability 12 08178 g005
Figure 6. Comparison between XX (fraction of pressure difference between evaporator and condenser for defining the compression load shared by electrical compressor and P2) and electrical co-efficient of performance (COPe) and COPg (COP_global).
Sustainability 12 08178 g006
Figure 7. Computational flow diagram for the Engineering Equation Solver (EES) model of novel enhanced vapour compression cycle (EVCC).
Sustainability 12 08178 g007
Figure 8. Validation of the proposed ejector analytical model with the experimental data of Federico et al.
Sustainability 12 08178 g008
Figure 9. Ejector model validation with published data of Zheng et al.
Sustainability 12 08178 g009
Figure 10. T-s diagram of EES model results produced for validation with EBSILON.
Sustainability 12 08178 g010
Figure 11. Effect of evaporation temperature on COP and Q (heat).
Sustainability 12 08178 g011
Figure 12. Effect of condenser temperature on COP and Q (heat).
Sustainability 12 08178 g012
Figure 13. Effect of HP generator temperature on COP and Q (heat).
Sustainability 12 08178 g013
Table 1. EES and EBSILON models comparison.
Calculated ValuesEES ModelEBSILON ModelDifference/Error (%)
Refrigeration effect (kW)24.423.92.1
Expander work output (kWe)4.64.875.5
System output (kWe)8.548.661.4
Overall system efficiency (%)3.463.562.8
Temp. of rejected heating water (°C)59.6760.050.63
Expander mass flow (m6) (kg/s)0.1520.1520
Ejector motive mass flow (m9) (kg/s)1.031.0220.8
Table 2. Comparison of our proposed EVCC system with other systems at the base case.
Te (°C)Tc (°C)Tg (°C)Qref (kW)COPeCOPg
Conventional VCC54590103.77-
Cascade ejection-compression system (CECS) [17]54590105.581.18
Ejection-Compression system (ECS) [9]54590104.672.88
Enhanced Ejector Refrigeration System (EERS) [15]54590105.52.16
Our proposed system (EVCC)54590108.2062.32

