Prevalence and Clustering Patterns of Pro-Environmental Behaviors among Canadian Households in the Era of Climate Change


1
School of Kinesiology and Health Studies, Queen’s University, Kingston, ON K7L 3N6, Canada
2
Department of Gender Studies, Queen’s University, Kingston, ON K7L 3N6, Canada
3
School of Health and Rehabilitation Sciences, The University of Queensland, Brisbane, QLD 4072, Australia
*
Author to whom correspondence should be addressed.
Sustainability 2020, 12(19), 8218; https://0-doi-org.brum.beds.ac.uk/10.3390/su12198218
Submission received: 11 September 2020
/
Revised: 25 September 2020
/
Accepted: 2 October 2020
/
Published: 6 October 2020
(This article belongs to the Section Social Ecology and Sustainability)
Abstract
:This study examined the prevalence and clustering patterns of pro-environmental behaviors that are conducive to socially and environmentally sustainable living among Canadians. Cross-sectional data from the 2015 Households and the Environment Survey (HES) were used. Prevalence was calculated by province and each pro-environmental behavior. Observed/expected prevalence ratios were computed to assess clustering patterns and logistic regression analyses were performed to examine the pairwise associations. Among 8816 Canadian households, prevalence of engaging in pro-environmental behaviors ranked as the following: engaging in green consumer behavior (88%), composting food/yard waste (84%), being active outdoors (82%), gardening (72%), and recycling electronics (45%). While only 14% engaged in ≤2 pro-environmental behaviors, 25.1% of Canadians engaged in all pro-environmental behaviors. By province, British Columbia was the greenest province (81%), followed by Ontario (77%) and Nova Scotia (76.9%) while the least green provinces were Newfoundland and Labrador (62.9%), Saskatchewan (69.2%), and New Brunswick (68%). The most apparent clustering of behaviors was found between recycling electronics and gardening (Observed/Expected: 3.65, 95% CI: 1.98–5.32). Pairwise associations between any two pro-environmental behaviors were statistically significant for all possible combinations (Odds ratios ranged 1.23–2.24). Prevalence of engaging in different sets of pro-environmental behaviors varied greatly by province. Sub-optimal clustering of pro-environmental behaviors and varying pairwise synergetic associations were observed in Canadian households. To promote more holistic, sustainable lifestyles and create sociocultural environments that are conducive to the environment in the era of climate change, future work should investigate barriers and opportunities in adopting more pro-environmental behaviors in Canadian households.
1. Introduction
Canada is one of the largest producers of greenhouse gases (GHG) pollution per capita in the world [1]. There are upstream drivers that led to climate change such as the capitalist economic model and industry activities [2], as well as household-generated GHG [3]. In the Canadian context, 46% of GHG is attributable to direct and indirect household emissions [4], and household-generated waste accounts for approximately 33% of total waste disposal [5]. While much emphasis is put on the upstream efforts in reducing GHG emissions such as developing renewable energy and rethinking about the capitalist economic model [3,6,7], radically transforming the dominant consumption-oriented societies is simultaneously needed to avoid serious social and environmental upheaval.
Pro-environmental behavior (PEB), also known as green-, sustainable-, or environmentally-friendly (eco-friendly) behavior, is defined as behaviors in which individuals take protective actions toward the environment [8]. PEBs include responsibly engaging with outdoors or recycling household waste and recycling but also can be adaptive responses to the impact of climate change such as purchasing sustainable products (e.g., local food, green cleaning products), conserving water or energy, or changing travel modes (e.g., from driving to walking or cycling) to buying an electric vehicle or building an off-grid home [8,9,10,11]. With anthropogenic climate change becoming a more pressing issue, recent climate assessment reports such as the IPCC [3] and scholarly work have begun to use the term “climate change adaptive behavior” [10,11,12], which is defined as any behavior individuals can engage in to buffer the hazardous impacts of climate change [10] that leads to dual benefits of climate change mitigation and sustainability [3]. Previous literature suggested that PEBs, as part of climate change adaptive behavior, may positively contribute to environmental sustainability [13].
As the world is facing serious environmental degradation and subsequent environmental and health inequities [14,15], it is imperative that all individuals adopt sustainable lifestyles, particularly those who are privileged. However, recent polling in a sample of Canadians has demonstrated that while the majority were concerned about climate change, most were reluctant to make major adjustments in their daily lives and preferred to make small changes, such as recycling or walking/cycling instead of driving [16]. Similarly, when the 3R’s (reduce, reuse, recycle) practice was examined among Ontarians, higher proportions of people were engaging in recycling materials than reducing household waste or reusing materials because reducing and reusing require bigger lifestyle sacrifices than recycling [17]. Indeed, many municipalities in most Canadian provinces/territories have implemented the 3R campaign but saw little success over the years [18]. This is likely because the lifestyle of Canadians is greatly shaped by the capitalist economic model and subsequently led to excessive consumption, which led to environmental damage [19].
Globally, as the severity of climate change accelerates, adaptation to climate change is becoming an urgent issue [3]. As part of a potential solution, individual- and household-level engagement with adaptive actions to reduce the threats of climate change is suggested [10]. Consequently, developing interventions and policies that can better support individuals and households to engage in climate change adaptive behavior is necessary [20,21]. A recent meta-analysis study based on data from 23 countries indicated that descriptive norms, negative affect, perceived self-efficacy and outcome efficacy of adaptive actions are the most relevant motivators while knowledge and experience were not [10]. However, out of 106 studies included, only two studies were from Canada pertaining to wildfire mitigation, and one of them was also flagged as an outlier in the analysis due to contextual differences with other studies. The lack of relevant evidence from Canada compared to other countries and heterogeneity of Canadian data may be because of the geographical privilege that Canada holds in relation to climate change. Specifically, Canada is situated in the North–Western Hemisphere and though no country in the world will be able to avoid the consequences of climate change, Canada is likely more protected from climate change than other countries that are more vulnerable to climate change economically or geographically [22].
Together, a much needed inquiry is an early response in order to develop appropriate strategies for climate change adaption to first determine prevalence and patterns of everyday household activities and practice pertaining to the environment among Canadians. By doing so, tailored information on possible ways to maximize their PEB can be provided to households. Furthermore, monitoring the clustering patterns of different PEBs can inform in developing effective population-level strategies for individuals engaging in different sets of PEBs. Therefore, the purpose of this study was to examine the prevalence and co-occurrence of PEB in Canadian households. Given that PEB may vary by provincial jurisdictions [23,24], the prevalence of PEB were examined by province. We included both behaviors that are known to be conventional PEB (e.g., recycling, engaging with outdoors, gardening, composting food and garden waste) and behaviors that can be adaptive responses to climate change impacts (e.g., green consumer behaviors); however, we used the term PEB interchangeably in this paper to denote both conventional PEB and climate change adaptive behaviors.
2. Materials and Methods
2.1. Source and Participants
Secondary data from the 2015 Households and the Environment Survey (HES) from the Environment Accounts and Statistics Division of Statistics Canada were used [25]. The survey was conducted between October 2015 and January 2016 as part of the Canadian Community Health Survey (CCHS) [26]. The HES repeated cross-sectional surveys that were first conducted in 1991, 1994, and 2006, and bi-annually between 2007 and 2017 (data published up to 2015). The HES was administered to a sub-sample of households from the first two quarters and part of the third quarter of the 2015 CCHS by using the computer-assisted telephone interviewing (CATI) system. The CCHS collected data from individuals aged ≥12 years living in private dwellings in the ten provinces and three territories in Canada. Key inclusion criteria for participant recruitment was any household in Canada. However, households located in Yukon, Northwest Territories, and Nunavut; households located on reserves and in other Aboriginal settlements in the provinces; and households consisting entirely of full-time members of the Canadian Armed Forces were excluded. Institutions and households in certain remote regions were also excluded. Multistage stratified cluster design was used for sampling in all provinces and territories except for Prince Edward Island (PEI) where Simple Random Sampling was used for sampling. After considering the length of data collection period and potential seasonal effects, a total of 21,956 households from the first six months of the 2015 CCHS and an additional portion of the third quarter were considered as eligible to participate. Among those, 21,348 households were in the scope of the HES, and 14,939 (70% recruitment rate) participated in the study. Further details regarding CCHS and HES questionnaire design, sampling and interview procedures are available from Statistics Canada [25]. HES is conducted under the authority of the Statistics Act, Revised Statutes of Canada, 1985, Chapter S-19 [25].
2.2. Measures
Self-reported data on Canadian household practices with respect to kitchen/yard waste management, disposal of electronics, gardening, outdoor activities, and consumer behaviors were used to indicate PEBs in this study. These five PEBs were determined based on the availability in the HES dataset and the relevancy to this study. The 2015 HES questionnaire is available elsewhere [25].
2.2.1. Composting Waste
Composting of kitchen and yard waste was measured by asking participants to report whether their household separated kitchen or yard waste (e.g., leaves, plants, or grass clippings) from the rest of the garbage, put out for compost collection, and taken to a depot or put in a compost bin or pile during the past 12 months (response options: yes/no/don’t know). “Don’t know” was recoded as missing.
2.2.2. Recycling Electronics
Recycling of electronics was measured by asking participants to report on whether any of the household members disposed a computer, printer, TV/monitor, AV equipment, cellular phone, and/or gaming equipment during the past 12 months. Participants were also asked to report on how they disposed of electronics (i.e., garbage, took/sent to a depot, returned to a supplier, donated, repaired or sold them, still had them, or other). It was categorized into recycling or reusing electronics if it was taken to a depot, returned to a supplier, donated, repaired, or resold.
2.2.3. Gardening
Gardening was measured by asking participants to report on whether any of the household members grew vegetables, herbs, fruits, or flowers for personal use outside in the yard, on a balcony or porch, community garden, indoors or at the rooftop of their house during the past 12 months (response options: yes/no/don’t know). “Don’t know” was recoded as missing.
2.2.4. Outdoor Activities
Participation in outdoor activities and the type of activities were measured by asking participants if they or their household participated in outdoor activities close to their home during the past 12 months (response options: yes/no/don’t know). Outdoor activities included walking, hiking, bicycling, ATV, skiing/snowboarding, snowmobiling, cross-country skiing, hunting, fishing, camping, picnicking/BBQ, skating, hockey/curling, bird watching/photo shooting, going to the park, mountain climbing, sliding, geocaching, badminton/tennis, and other. “Don’t know” was recoded as missing.
2.2.5. Green Consumer Behavior
Green consumer behavior was measured by asking participants if they or their household typically purchased foods advertised as being locally grown or produced when they are available (or in season), purchased environmentally-friendly or ‘green’ cleaning products, and used their own bags or containers to carry groceries during the past 12 months (response options: always/often/sometimes/rarely/never/don’t know). The responses were dichotomized to always/often and sometimes/rarely/never and “don’t know” was recoded as missing.
2.2.6. Covariates
Area of residence (10 provinces), Census Metropolitan Area (CMS) (CMS vs. non-CMS), the highest level of education in the household (High school or less/some post-secondary/university), age group of the household members (<18 years/18–64 years/65+ years), the total number of people in the household (1 to 4+ persons), and household income were included as covariates. Household income was measured by first asking participants to estimate their total household income from all members and all sources, before taxes and deductions during the year ending December 31, 2014. Interviewers were instructed that income can come from various sources such as from work, investments, pensions or government (e.g., Employment Insurance, Social Assistance, Child Tax Benefit and other income such as child support, spousal support (alimony), and rental income). Then participants were asked to select the income groups that their household falls into. The income groups included “<$40,000”, “$40,000–$79,999”, “$80,000 and above”, and “don’t know”. “Don’t know” was recoded as missing.
2.3. Statistical Analysis
All analyses were conducted after accounting for population weights of the HES. Weighting for the HES was developed based on CCHS sub-weight, HES initial weight, HES non-response adjustment, and calibration [25] to adjust for non-response and the varying probability of selection. Frequency statistics were conducted to describe sample characteristics. Chi-squared tests were run to examine differences between samples included and excluded (due to missing cases) in the main analyses. Prevalence of PEBs were analyzed in the total sample and by province. Prevalence rates and their 95% confidence intervals (95% CI) of individual and all possible combinations of five PEBs (i.e., composting waste, recycling/reusing electronics, gardening, outdoor activities, green consumer behaviors) were calculated using frequency statistics. Specifically, each of the five PEBs was coded as 1 (“yes”) or 0 (“no”). They were then summed to generate in index ranging between 0 (“none”) to 5 (“practicing all five PEBs”).
Observed (O)/expected (E) prevalence ratios and 95% CI were calculated to examine the clustering of PEBs. The observed proportions of 32 different combinations of the PEBs were estimated. The expected proportion was calculated by multiplying the individual probabilities of each behavior based on their occurrence. A ratio (O/E) greater than “1” suggests the presence of clustering [27]. A series of logistic regression analyses were conducted to examine the associations between pairs of PEBs after controlling for area of residence (province), CMS, highest level of education in the household, age group of the household members, the total number of people in the household, and household income. Odds ratios (OR) and 95% CI were calculated. IBM SPSS Version 26.0 (IBM Corp., Armonk, NY, USA, 2020) was used for all analyses and SPSS Complex Samples was utilized to take account for the multistage stratified cluster design of the HES. Statistical significance was set at p < 0.05.
3. Results
Among 14,939 households that participated in the interview, 8816 households provided complete information on the key variables, and thus formed the analytical sample for the analyses. The included households (n = 8816) reported higher income (55.9% vs. 44.3%; p < 0.001), higher education (71.6% vs. 64.8%; p < 0.001), and more younger people (<18 years: 31.5% vs. 27.7%; 18–64 years: 86.4% vs. 80.2%) than the households excluded (n = 6123) from the analyses. Generally, high prevalence of PEBs were reported among Canadians ranging between 44.8% and 88.3% (Table 1).
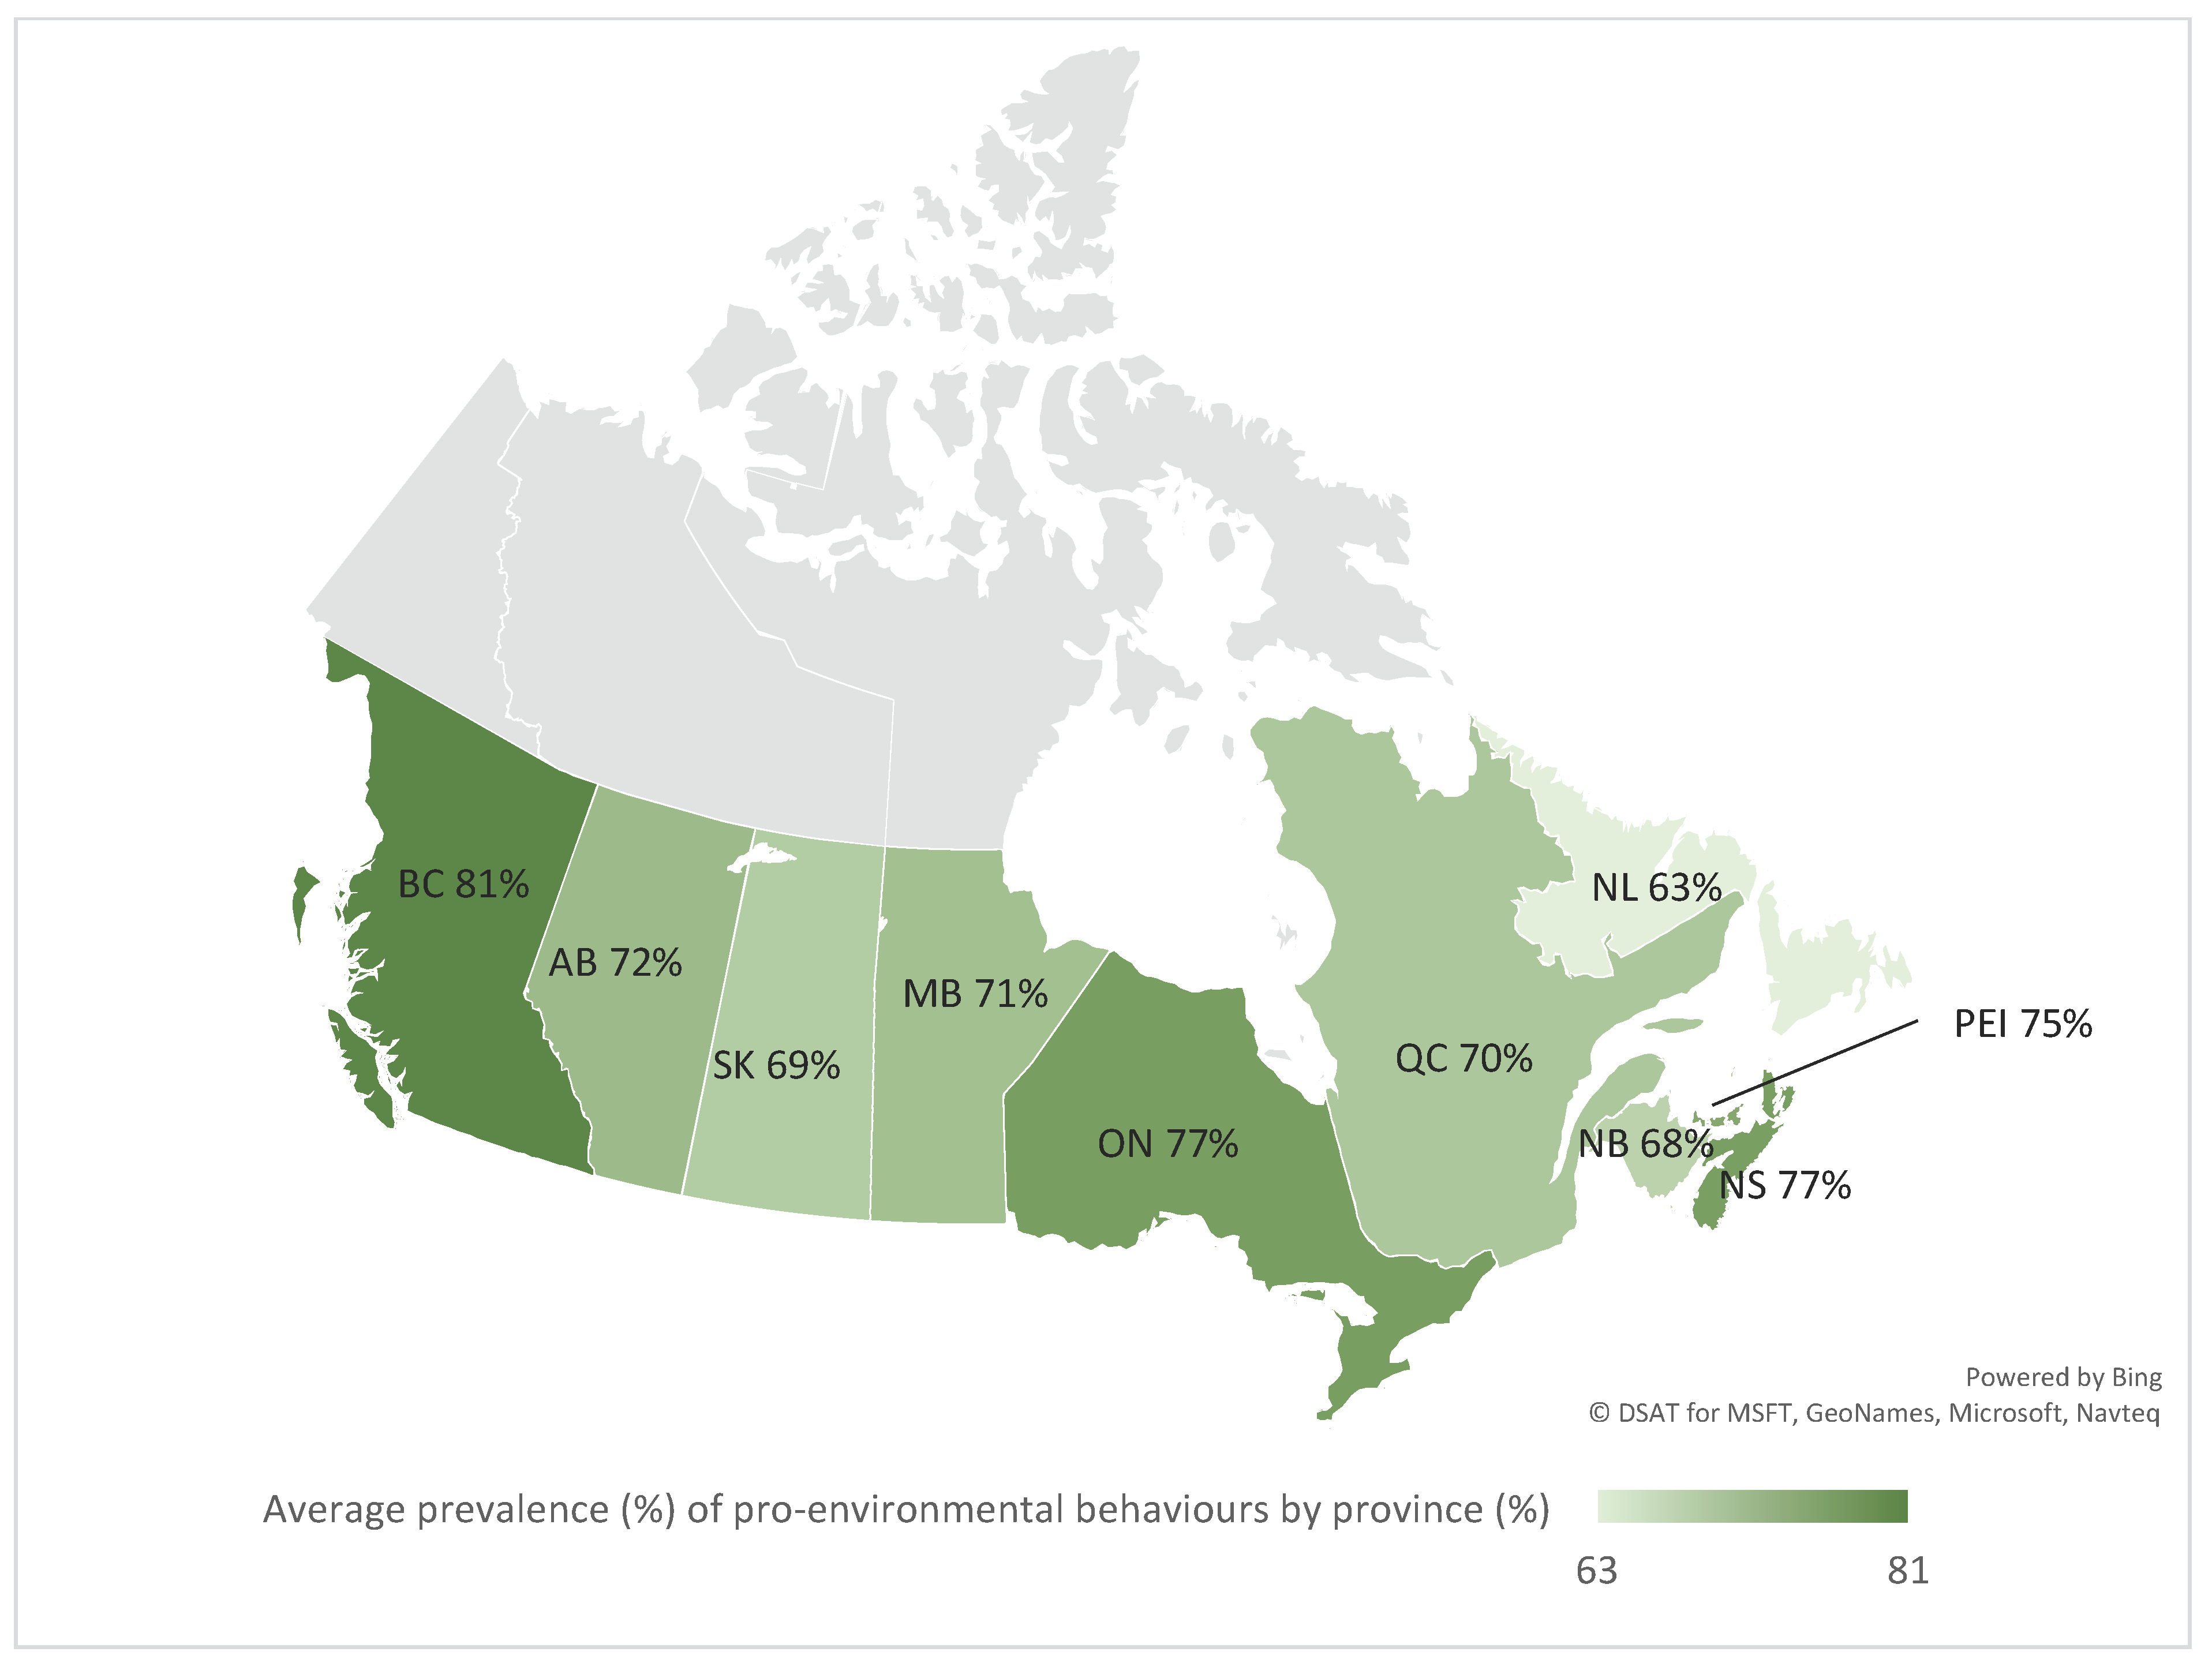
By province (Figure 1, Table A1), British Columbia was the greenest province with 81% of households engaging in PEBs on average, followed by Ontario (77%) and Nova Scotia (76.9%). The least green provinces were Newfoundland and Labrador (NL) (62.9%), Saskatchewan (69.2%), and New Brunswick (68.0%). When stratified by PEB, significant differences by province were observed for composting (p < 0.001), recycling or reusing electronics (p = 0.001), gardening (p = 0.001), outdoor activities (p < 0.001), and green consumer behavior (p < 0.001).
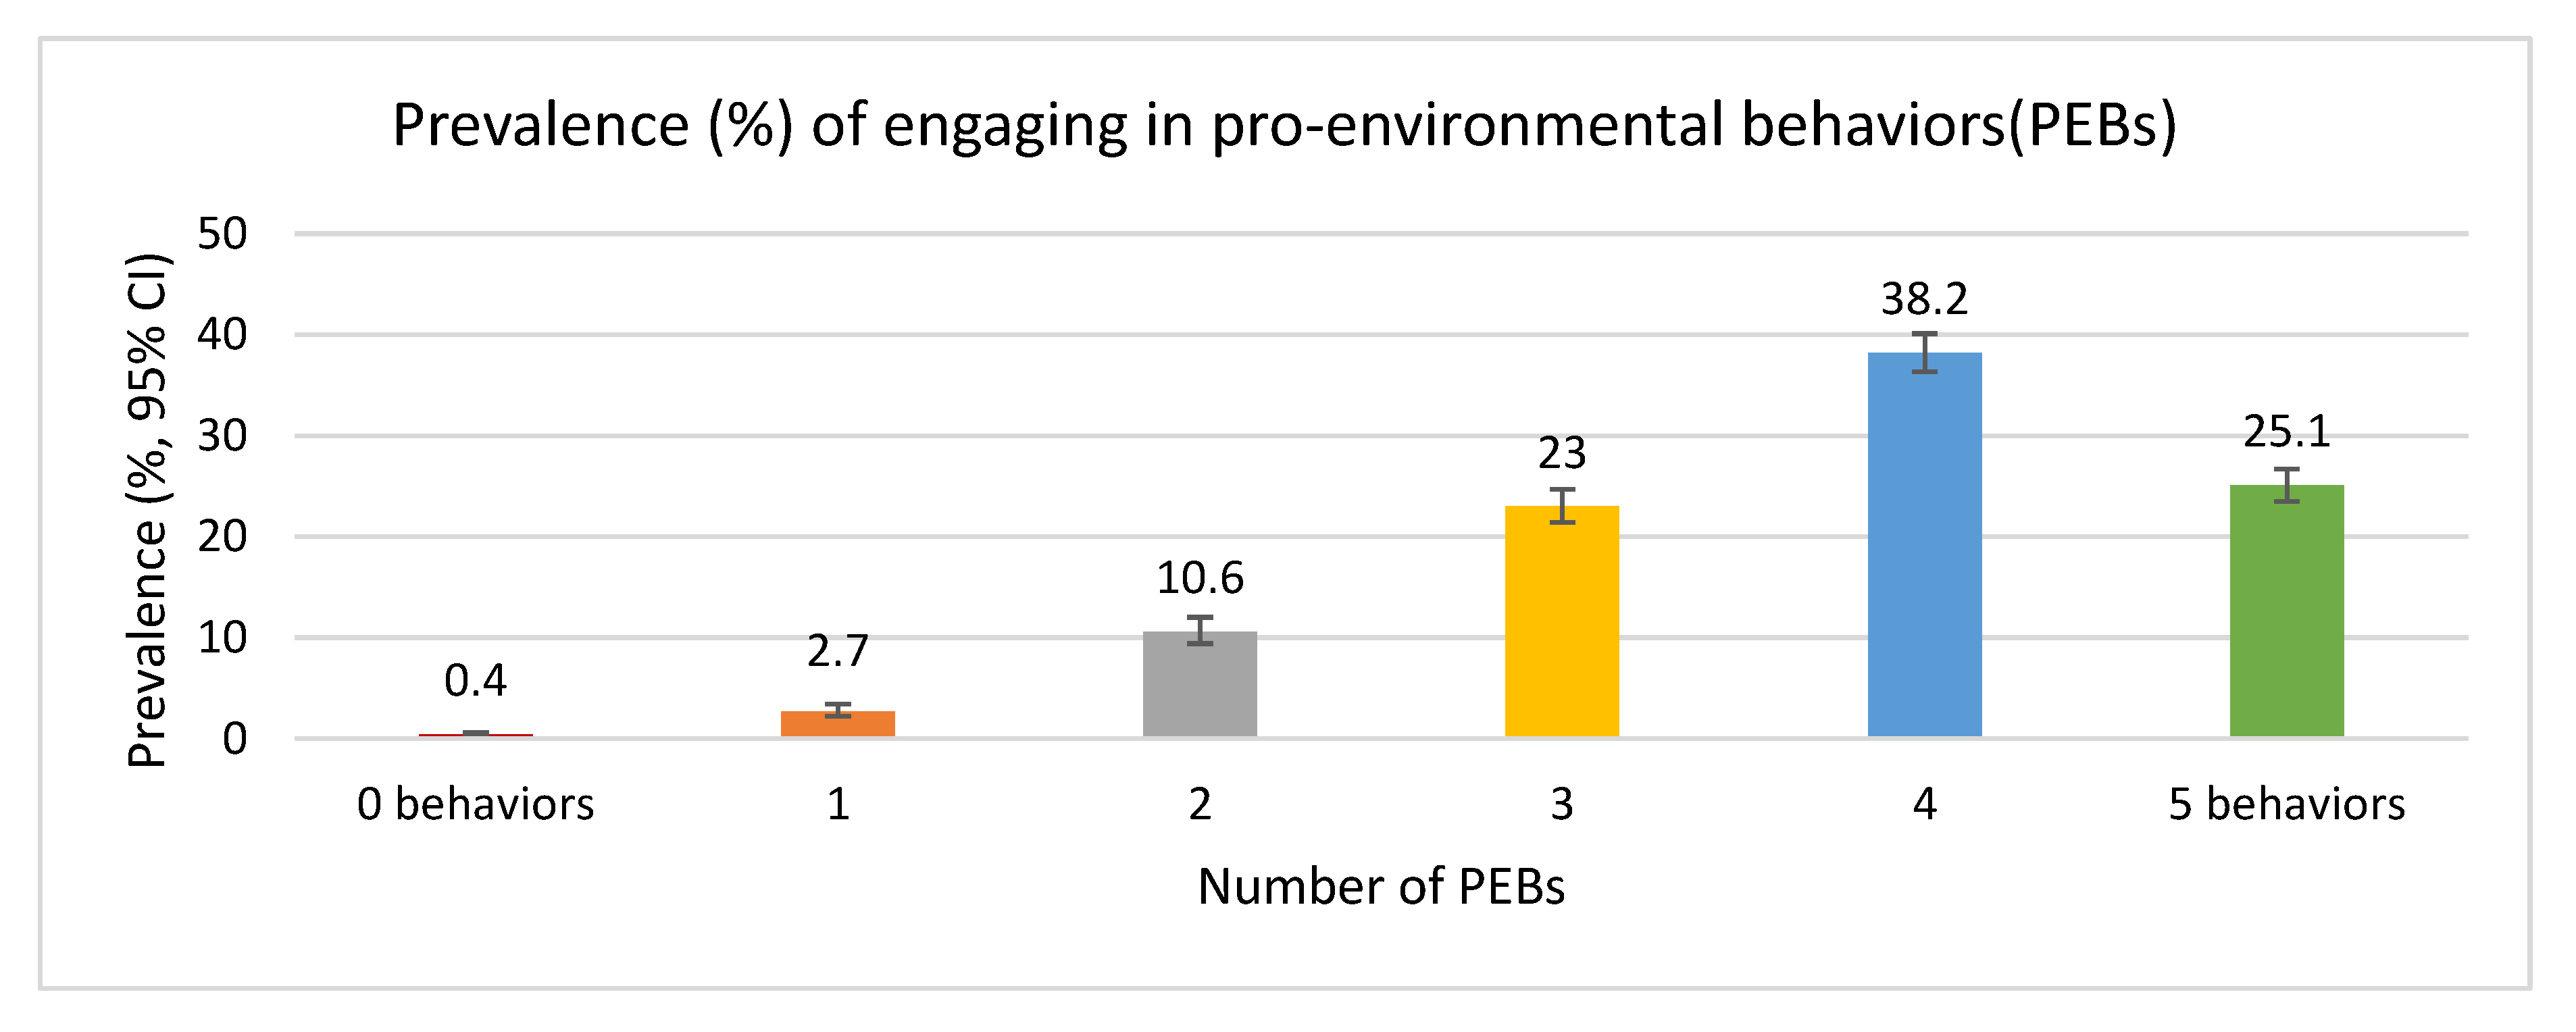
Prevalence of engaging in a different number of PEB is illustrated in Figure 2 and Table A2. On average, only 3.1% engaged in none (0.4%, 95% CI: 0.3–0.6%) or one type of PEB (2.7%, 95% CI: 2.2–3.4). A total of 23.0% (95% CI: 9.4–12.0) engaged in at least three PEBs, 38.2% (95% CI: 36.3–40.1) engaged in at least four PEBs, and a quarter (25.1%, 95% CI: 23.5–26.7) of Canadian households engaged in all five PEBs. By province, prevalence of engaging in zero PEBs was low in general (0.0–2.2%). Engaging in all five PEBs was the lowest in New Brunswick (10.1%), followed by Newfoundland and Labrador (15%), Québec (18.2%), and Saskatchewan (19.9%).
Table 2 presents the clustering patterns of PEBs in Canadian households. The most apparent clustering of behaviors was found between recycling electronics and gardening (O/E: 3.65, 95% CI: 1.98–5.32). Gardening and green consumer behavior (O/E: 1.27, 95% CI: 1.03, 1.50), recycling electronics and outdoor activities (O/E: 1.66, 95% CI: 1.13, 2.18), composting waste and outdoor activities (O/E: 1.20, 95% CI: 1.02, 1.39), composting waste and recycling electronics (O/E: 1.51, 95% CI: 1.01, 2.01), and composting waste, gardening and outdoor activities (O/E: 1.20, 95% CI: 1.06, 1.34) also tended to cluster.
Table 3 describes the pairwise associations between any combinations of two PEBs. After controlling for area of residence (province), CMS, highest level of education in the household, age group of the household members, the total number of people in the household, and household income, all possible pairwise combinations showed statistically significant and positive associations. In particular, gardening showed positive and synergetic associations with other PEBs. Specifically, the strongest association was found between gardening and green consumer behavior (OR: 2.24, 95% CI: 1.74–2.89), followed by with composting (OR: 2.07, 95% CI: 1.68–2.57) and with engaging in outdoor activities regularly (OR: 2.02, 95% CI: 1.6–2.53).
4. Discussion
This study was the first to investigate the prevalence and clustering patterns of five PEBs (i.e., composting kitchen and yard waste, recycling electronics, gardening, outdoor activities, and green consumer behaviors) in a large sample of Canadian households. Most Canadian households (86.3%) engaged in more than three PEBs. The clustering of different combinations of PEBs was shown when two PEBs was considered; however, co-occurring patterns were only marginal when more than three PEBs were considered and rather, they tended not to cluster. Similarly, when pairwise associations were observed, the households engaging in one PEB were likely to engage in another PEB.
Our findings demonstrated that households undertaking PEB vary greatly across provinces in Canada. Specifically, households in British Columbia were almost 30% more likely to engage in PEB than households in Newfoundland and Labrador. A recent Canadian study [24] also indicated that participating in home energy efficiency audits was the lowest in Newfoundland and Labrador with only 5% of the households participating in the audit. The Newfoundland and Labrador province is the largest producer of crude oil in Eastern Canada, therefore, has been in a center of debate when it comes to sustainability. Low prevalence of PEB reported by households in Newfoundland and Labrador compared to other provinces may be explained by the fact that the continuing prosperity of oil and gas industry is closely related to the province’s economy and the livelihood of its people in the province. Similar patterns were observed in another oil-producing province—Saskatchewan, ranked at the bottom for outdoor activities (76%) and green consumer behavior (72%). However, this was not the case for Alberta where only composting waste (77%) and green consumer (80%) were below the average of the overall Canadian households (83% and 84%, respectively). Other than PEBs examined in this study, it is also known that, compared to the average of workers taking public transit or using active modes of transport (walking or cycling) in urban cities (15%), the corresponding prevalence in St. John’s, the capital of Newfoundland and Labrador, and two cities in Saskatchewan (Regina and Saskatoon) was 9% and 11%, respectively [28]. On top of making sufficient considerations on potential barriers to PEBs (e.g., long winter, cold weather, lack of infrastructure), more upstream work may be needed to yield actual engagement in PEBs among citizens in these two provinces.
Varying patterns were observed for clustering of different combinations of PEBs. Clustering was observed between five different combinations of pairwise PEBs (e.g., recycling electronics + gardening, composting + outdoor activities). Some non-clustering of PEBs were also observed. Lifestyle is a cluster of activities or behaviors that collectively reflects a particular aspect of identity or core values of an individual or a group [29]. A sustainable lifestyle may consist of several related activities that are known to be conducive for the protection of the environment [30,31]. Though the clustering of PEBs was sub-optimal in Canadian households, the likelihood of two behaviors co-occurring was evident particularly between recycling electronics and gardening. In addition, pairwise associations were all significant with small to medium effect. These findings may reflect Canadians’ hesitation on making major changes in their lifestyle to reduce their environmental impacts [32]. PEBs included in our study, such as using reusable shopping bags, engaging in more outdoor activities, or gardening may not require extensive investment of time or money; thus, future pro-environment campaigns and strategies may include taking small steps by targeting these behaviors simultaneously among Canadians and exploring ways to achieve and maintain potential long-term lifestyle changes.
Several factors may influence people engaging in PEB: sociodemographic factors such as age, gender, income, or education levels [23,33], psychological factors such as motivation, moral obligations, and normative concerns [13], and contextual/structural factors such as access to supporting infrastructure (e.g., policy, recycling facilities, the quality of public transport, or the market supply and pricing of goods) [23,34]. Given that these factors interact with one another to influence behavior, it is important to investigate determinants of PEB and practices within varying levels of socio-ecological modelling. Recent reviews noted that research on upstream determinants for PEB and climate change adaptive behaviors has been largely lacking [10,13]. Therefore, future work may focus on examining the effect of macro-level factors (e.g., environmental policy changes such as carbon prices, electric vehicle rebate, community initiatives conduit to sustainability) on household-level behaviors.
It is also noteworthy to mention that even people with environmental concerns and awareness might not be willing to make substantial lifestyle changes, but they may be more willing to accept policy changes that are conducive to the environment such as higher carbon taxes or more stringent building codes [35]. There is a wide variety of measures that can be introduced by the government to influence household-level PEBs, from economic instruments to direct regulation, labeling, information campaigns, provision of environment-friendly public goods such as public transportation or bicycle paths [36]. In Canada specifically, implementing robust measures for the oil and gas industry may also be considered. To begin with, it is known that the oil and gas companies are favorably treated under the federal income tax system of Canada and set to pay low rates of taxes because the Canadian Association of Petroleum Producers has been lobbying the federal government for more tax breaks to improve their global market competitiveness. For example, based on the data collected by the Guardian, a Canadian oil company, Suncor, paid six times less taxes to Canada than they pay to the UK government [37]. Alberta’s Rural Municipalities Association recently reported that Alberta oil and gas companies are not willing to pay $175 million in outstanding tax debt because there are only a few consequences for not paying them [38]. With this regard, future research may consider conducting a quasi-experiment study when new provincial or federal policies and regulations related to the regional level of climate change action are being introduced.
The main strength of this study is the use of a large and nationally representative sample of Canadian households. However, some caveats should be noted. This study is based on cross-sectional data; thus, causal associations between PEB (one behavior causing the other) remains uncertain. Longitudinal and quasi-experimental studies are warranted that examine the potential synergetic effects of behavioral clustering and its long-term sustainability. The HES data are based on national surveys but some limitations can be noted. All responses were self-reported by one of the household members who participated in the survey; therefore, the responses may not reflect every individual’s behavior in each household. Moreover, information bias such as recall bias and reporting bias due to social desirability may have contributed to under- or over-reporting each of PEBs. However, controlling for confounders as well as the use of a large dataset may have attenuated the potential biases. That being said, included sample in the analysis compared to excluded was potentially younger families with higher income and education levels. The prevalence estimates may have been different if we included more individuals with low income, low education levels, and older populations. Lastly, this study only provided a snapshot of five PEBs among Canadians at the household level due to the limited availability and relevancy that HES data provided. Future work should further explore the trends of more PEBs as well as climate change adaptative behaviors over time, and their clustering patterns, to inform intervention efforts that could contribute to sustainability and climate change adaptation.
5. Conclusions
Most Canadian household members engaged in more than two out of five PEBs. However, co-occurrence of more than three PEBs was only marginal. To promote a more holistic, sustainable lifestyle and create sociocultural environments that are conducive to sustainable living in the era of climate change, future work should investigate province-specific barriers and opportunities for Canadians in adopting more PEBs and potential interventions that can lead to long-term, sustainable behavioral change using more robust study designs (e.g., longitudinal, quasi-experimental).
Author Contributions
Conceptualization, E.-Y.L.; methodology, E.-Y.L. and A.K.; software, E.-Y.L. and A.K.; validation, E.-Y.L. and A.K.; formal analysis, E.-Y.L. and A.K.; investigation, E.-Y.L.; resources, E.-Y.L.; data curation, E-Y.L. and A.K.; writing—original draft preparation, E.-Y.L.; writing—review and editing, E.-Y.L. and A.K.; visualization, E.-Y.L.; supervision, E.-Y.L.; project administration, E.-Y.L.; funding acquisition, E.-Y.L. All authors have read and agreed to the published version of the manuscript.
Funding
This research was funded by Queen’s University, Office of Vice-Principal Research, Queen’s Research Opportunity Fund (QROF), Catalyst Fund grant number 6028922.
Conflicts of Interest
The authors declare no conflict of interest.
Appendix A

Table A1.
Prevalence (%) of five pro-environmental behaviors (average and individual) in Canadian households by province, 2015 Households and the Environment Survey (HES) (n = 8816).
Table A1.
Prevalence (%) of five pro-environmental behaviors (average and individual) in Canadian households by province, 2015 Households and the Environment Survey (HES) (n = 8816).
| Prevalence (%) of Individual Pro-Environmental Behaviors by Province | |||||
|---|---|---|---|---|---|
| Compost | Recycle | Garden | Outdoor | Green | |
| Newfoundland and Labrador | 61.2 | 36.7 | 54.5 | 84.5 | 77.4 |
| Prince Edward Island | 99.4 | 47.6 | 69.2 | 84.5 | 84.0 |
| Nova Scotia | 94.2 | 45.0 | 64.7 | 85.5 | 87.4 |
| New Brunswick | 81.1 | 21.7 | 73.1 | 84.4 | 79.8 |
| Québec | 68.4 | 43.7 | 68.2 | 76.6 | 92.7 |
| Ontario | 94.4 | 45.2 | 72.3 | 82.1 | 90.9 |
| Manitoba | 88.8 | 37.0 | 73.2 | 76.8 | 80.8 |
| Saskatchewan | 74.1 | 50.2 | 73.3 | 76.2 | 72.2 |
| Alberta | 76.6 | 46.1 | 72.4 | 85.7 | 79.5 |
| British Columbia | 96.0 | 50.4 | 79.5 | 88.6 | 90.4 |
Table A2.
Prevalence (%) of engaging in pro-environmental behaviors (average and individual) in Canadian households by province, 2015 Households and the Environment Survey (HES) (n = 8816).
Table A2.
Prevalence (%) of engaging in pro-environmental behaviors (average and individual) in Canadian households by province, 2015 Households and the Environment Survey (HES) (n = 8816).
| Prevalence (%) of Engaging in Pro-Environmental Behaviors by Province | ||||||
|---|---|---|---|---|---|---|
| 0 Behaviors | 1 | 2 | 3 | 4 | 5 Behaviors | |
| Newfoundland and Labrador | 1.6 (0.6, 4.5) | 7.7 (3.6, 15.6) | 22.5 (15.0, 32.3) | 26.1 (18.1, 36.1) | 27.2 (18.6, 37.9) | 15.0 (9.3, 23.1) |
| Prince Edward Island | 0.0 | 0.0 | 16.2 (7.7, 30.8) | 22.7 (14.9, 32.9) | 29.4 (20.9, 39.6) | 31.8 (21.5, 44.1) |
| Nova Scotia | 0.0 | 1.7 (0.5, 5.8) | 9.9 (5.6, 16.9) | 21.3 (14.6, 30.0) | 36.2 (29.4, 43.7) | 30.8 (24.9, 37.5) |
| New Brunswick | 2.2 (0.7, 7.2) | 4.3 (2.1, 8.6) | 9.4 (6.0, 14.6) | 29.5 (21.4, 39.0) | 44.4 (35.3, 53.9) | 10.1 (6.0, 16.6) |
| Québec | 0.6 (0.3, 1.2) | 4.1 (2.9, 5.8) | 13.5 (10.7, 16.9) | 27.0 (23.9, 30.4) | 36.6 (33.1, 40.3) | 18.2 (15.8, 20.9) |
| Ontario | 0.1 (0.1, 0.3) | 1.9 (1.1, 3.5) | 8.3 (6.5, 10.6) | 19.6 (17.3, 22.2) | 42.6 (39.3, 45.9) | 27.4 (24.7, 30.4) |
| Manitoba | 0.9 (0.3, 2.8) | 2.7 (1.1, 6.1) | 11.6 (7.9, 16.7) | 29.1 (22.3, 36.9) | 35.6 (28.6, 43.3) | 20.2 (14.2, 27.9) |
| Saskatchewan | 0.2 (0.1, 1.0) | 4.3 (1.5, 11.7) | 15.2 (9.2, 24.1) | 29.8 (21.7, 39.3) | 30.7 (23.1, 39.4) | 19.9 (14.5, 26.7) |
| Alberta | 0.6 (0.3, 1.6) | 3.0 (1.8, 4.9) | 14.8 (11.1, 19.5) | 25.7 (19.8, 32.6) | 28.7 (23.5, 34.5) | 27.2 (21.9, 33.2) |
| British Columbia | 0.3 (0.1, 1.0) | 1.1 (0.5, 2.1) | 4.3 (2.8, 6.7) | 17.6 (14.0, 22.0) | 41.2 (35.7, 46.9) | 35.5 (30.8, 40.5) |
References
- The World Bank. World development indicators. Available online: http://datatopics.worldbank.org/world-development-indicators/ (accessed on 1 September 2020).
- Wainwright, J. Climate change, capitalism, and the challenge of transdisciplinarity. Ann. Assoc. Am. Geogr. 2010, 100, 983–991. [Google Scholar] [CrossRef]
- Intergovernmental Panel on Climate Change. IPCC Fifth Assessment Report. 2017. Available online: https://www.ipcc.ch/assessment-report/ar5/ (accessed on 1 September 2020).
- Milito, A.; Gagnon, G. EnviroStats: Greenhouse gas emissions—A focus on Canadian households. EnviroStats 2008, 2, 3–6. [Google Scholar]
- Statistics Canada. Human Activity and the Environment. Available online: https://www150.statcan.gc.ca/n1/en/catalogue/16-201-X (accessed on 1 September 2020).
- Minister of Environment and Climate Change. Canadian Environmental Sustainability Indicators: Greenhouse Gas Emissions. Available online: www.ec.gc.ca/indicateurs-indicators/default.asp?lang=En&n=FBF8455E-1 (accessed on 1 September 2020).
- Boyd, B. Working together on climate change: Policy transfer and convergence in four Canadian provinces. Publius J. Federalism 2017, 47, 546–571. [Google Scholar] [CrossRef]
- Krajhanzl, J. Environmental and proenvironmental behavior. Sch. Heal. Heal. Educ. Int. Exp. 2010, 21, 251–274. [Google Scholar]
- Jackson, T. Motivating Sustainable Consumption: A Review of Evidence on Consumer Behaviour and Behavioural Change. Available online: http://citeseerx.ist.psu.edu/viewdoc/download?doi=10.1.1.337.433&rep=rep1&type=pdf (accessed on 1 September 2020).
- Van Valkengoed, A.M.; Steg, L. Meta-analyses of factors motivating climate change adaptation behaviour. Nat. Clim. Chang. 2019, 9, 158–163. [Google Scholar] [CrossRef]
- Carman, J.P.; Zint, M.T. Defining and classifying personal and household climate change adaptation behaviors. Glob. Environ. Chang. 2020, 61, 102062. [Google Scholar] [CrossRef]
- Grothmann, T.; Patt, A. Adaptive capacity and human cognition: The process of individual adaptation to climate change. Glob. Environ. Chang. 2005, 15, 199–213. [Google Scholar] [CrossRef]
- Steg, L.; Vlek, C. Encouraging pro-environmental behaviour: An integrative review and research agenda. J. Environ. Psychol. 2009, 29, 309–317. [Google Scholar] [CrossRef]
- Boyce, J.K. Inequality as a cause of environmental degradation. Ecol. Econ. 1994, 11, 169–178. [Google Scholar] [CrossRef] [Green Version]
- Warner, K.; Hamza, M.; Oliver-Smith, A.; Renaud, F.; Julca, A. Climate change, environmental degradation and migration. Nat. Hazards 2010, 55, 689–715. [Google Scholar] [CrossRef]
- The Enviroethics Institute. Canadian Public Opinion about Climate Change. 2014. Available online: https://davidsuzuki.org/wp-content/uploads/2017/09/focus-canada-2014-canadian-public-opinion-climate-change.pdf (accessed on 1 September 2020).
- University of Waterloo. Are Canadians really connecting with environmental issues? Canadian Index of Wellbeing. Available online: https://uwaterloo.ca/canadian-index-wellbeing/blog/post/are-canadians-really-connecting-environmental-issues (accessed on 1 September 2020).
- Lewis, J.; Hayes, M. Reduce, reuse, recycle, rejected: Why Canada’s recycling industry is in crisis mode. The Globe and Mail, 22 May 2019. [Google Scholar]
- Katz-Rosene, R. Capitalism, the climate crisis, and Canada’s “relations of mobility”: Theoretical interventions in ecological political economy. Altern. Routes 2015, 25, 33–54. [Google Scholar]
- Ban, J.; Zhou, L.; Zhang, Y.; Brooke Anderson, G.; Li, T. The health policy implications of individual adaptive behavior responses to smog pollution in urban China. Environ. Int. 2017, 106, 144–152. [Google Scholar] [CrossRef] [PubMed]
- Kievik, M.; Gutteling, J.M. Yes, we can: Motivate Dutch citizens to engage in self-protective behavior with regard to flood risks. Nat. Hazards 2011, 59, 1475–1490. [Google Scholar] [CrossRef] [Green Version]
- Becklumb, P. Climate Change and Forced Migration: Canada’s Role; Parliamentary Information and Research Service: Ottawa, ON, Canada, 2020; Volume 11. [Google Scholar]
- Das, R.; Richman, R.; Brown, C. Demographic determinants of Canada’s households’ adoption of energy efficiency measures: Observations from the Households and Environment Survey, 2013. Energy Effic. 2018, 11, 465–482. [Google Scholar] [CrossRef] [Green Version]
- Gamtessa, S.; Guliani, H. Are households with pro-environmental behaviours more likely to undertake residential energy efficiency audits? Evidence from Canada. Energy Effic. 2019, 12, 735–748. [Google Scholar] [CrossRef]
- Statistics Canada. Households and the Environment Survey, 2015 [Canada]: Study Documentation. 2015. Available online: https://www23.statcan.gc.ca/imdb/p2SV.pl?Function=getSurvey&SDDS=3881 (accessed on 1 September 2020).
- Statistics Canada. Canadian Community Health Survey-Annual Component (CCHS). Available online: https://www23.statcan.gc.ca/imdb/p2SV.pl?Function=getSurvey&SDDS=3226 (accessed on 1 September 2020).
- Galán, I.; Rodríguez-Artalejo, F.; Tobías, A.; Díez-Gañán, L.; Gandarillas, A.; Zorrilla, B. Clustering of behavior-related risk factors and its association with subjective health. Gac. Sanit. 2005, 19, 370–378. [Google Scholar]
- Statistics Canada. Table 1.a Proportion of workers commuting to work by car, truck or van, by public transit, on foot, or by bicycle, census metropolitan areas. 2011. Available online: https://www12.statcan.gc.ca/nhs-enm/2011/as-sa/99-012-x/2011003/tbl/tbl1a-eng.cfm (accessed on 1 September 2020).
- Veal, A.J. The concept of lifestyle: A review. Leis. Stud. 1993, 12, 233–252. [Google Scholar] [CrossRef]
- Longo, C.; Shankar, A.; Nuttall, P. “It’s not easy living a sustainable lifestyle”: How greater knowledge leads to dilemmas, tensions and paralysis. J. Bus. Ethics 2019, 154, 759–779. [Google Scholar] [CrossRef]
- Tripathi, A.; Singh, M.P. Determinants of sustainable/green consumption: A review. Int. J. Environ. Technol. Manag. 2016, 19, 316–358. [Google Scholar] [CrossRef]
- Grenier, É. Canadians Are Worried about Climate Change, but Many Don’t Want to Pay Taxes to fight It: Poll. Available online: https://www.cbc.ca/news/politics/election-poll-climate-change-1.5178514 (accessed on 1 September 2020).
- Stets, J.E.; Biga, C.F. Bringing identity theory into environmental sociology. Sociol. Theory 2003, 21, 398–423. [Google Scholar] [CrossRef] [Green Version]
- Corraliza, J.A.; Berenguer, J. Environmental values, beliefs, and actions: A situational approach. Environ. Behav. 2000, 32, 832–848. [Google Scholar] [CrossRef]
- Kollmuss, A.; Agyeman, J. Mind the Gap: Why do people act environmentally and what are the barriers to pro-environmental behavior? Environ. Educ. Res. 2002, 8, 239–260. [Google Scholar] [CrossRef] [Green Version]
- Organization for Economic Co-operation and Development. Greening Household Behaviour: Overview from the 2011 Survey, OECD Studies on Environmental Policy and Household Behaviour. Available online: https://www.oecd.org/env/consumption-innovation/greening-household-behaviour-2014.htm (accessed on 1 September 2020).
- Lukacs, M. Revealed: Oil giants pay billions less tax in Canada than abroad. Available online: https://www.theguardian.com/environment/true-north/2017/oct/26/revealed-oil-giants-pay-billions-less-tax-in-canada-than-abroad (accessed on 1 September 2020).
- Low, B.; Media Release. Unpaid Taxes Owed from Oil and Gas Companies to Rural Municipalities Continue to Increase. Available online: https://rmalberta.com/news/unpaid-taxes-owed-from-oil-and-gas-companies-to-rural-municipalities-continue-to-increase/ (accessed on 1 September 2020).
Figure 1.
Prevalence (%) of five pro-environmental behaviors (average and individual) in Canadian households by province, 2015 Households and the Environment Survey (HES) (n = 8816). BC: British Columbia, AB: Alberta, SK: Saskatchewan, MB: Manitoba, ON: Ontario, QC: Québec, NB: New Brunswick, PEI: Prince Edward Island, NS: Nova Scotia, NL: Newfoundland and Labrador. Note: Data were not available in territories in grey.

Figure 2.
Prevalence (%) of engaging in pro-environmental behaviors (average) in Canadian households, 2015 Households and the Environment Survey (HES) (n = 8816).
Figure 2.
Prevalence (%) of engaging in pro-environmental behaviors (average) in Canadian households, 2015 Households and the Environment Survey (HES) (n = 8816).

Table 1.
Sample characteristics of Canadian households, 2015 Households and the Environment Survey (HES) (n = 8816).
Table 1.
Sample characteristics of Canadian households, 2015 Households and the Environment Survey (HES) (n = 8816).
| Total | |
|---|---|
| n = 8816 | |
| Province (population weight; %, 95% CI) | |
| Newfoundland/Labrador (NL) | 1.8 (1.4, 2.2) |
| Prince Edward Island (PEI) | 0.4 (0.3, 0.5) |
| Nova Scotia (NS) | 2.5 (2.1, 2.9) |
| New Brunswick (NB) | 2.2 (1.8, 2.6) |
| Québec (QC) | 24.6 (23.0.26.3) |
| Ontario (ON) | 37.9 (36.0, 39.8) |
| Manitoba (MB) | 3.4 (2.9, 4.0) |
| Saskatchewan (SK) | 3.4 (2.8, 4.0) |
| Alberta (AB) | 12.2 (10.9, 13.8) |
| British Columbia (BC) | 11.6 (10.5, 12.9) |
| Census Metropolitan Area (CMS) | 80.8 (79.6, 82.0) |
| Household characteristics | |
| Household income (%, 95% CI) | |
| <$40,000 | 14.5 (13.2, 15.8) |
| $40,000–$79,999 | 29.6 (28.0, 31.4) |
| $80,000 and above | 55.9 (54.0, 57.8) |
| Highest level of education (%, 95% CI) | |
| High school graduate or less | 15.9 (14.6, 17.2) |
| Some post-secondary | 12.6 (11.2, 14.10 |
| University graduate and more | 71.6 (69.8, 73.3) |
| Household member (%, 95% CI) | |
| <18 years | 35.1 (33.3, 37.0) |
| 18–64 years | 86.4 (85.3, 87.5) |
| 65 years and above | 23.2 (21.7, 24.7) |
| Total number of people in household (persons, n) | 2.66 (2.62, 2.71) |
| In the past year… (%, 95% CI) | |
| Composted waste | 84.4 (83.0, 85.7) |
| Kitchen waste | 59.7 (57.8, 61.6) |
| Yard waste | 78.9 (77.3, 80.5) |
| Recycled electronics | 44.8 (42.9, 46.8) |
| Garbage | 2.5 (2.0, 3.3) |
| Took/sent to a depot | 33.5 (31.7, 35.3) |
| Returned them to a supplier | 7.4 (6.5, 8.4) |
| Donated | 10.1 (8.9, 11.5) |
| Repaired or sold them | 1.4 (1.0, 1.9) |
| Still have them | 1.4 (1.0, 1.9) |
| Grew vegetables, herbs, etc. | 71.8 (70.0, 73.5) |
| Outside in the yard | 64.0 (62.2, 65.8) |
| On a balcony, porch | 19.6 (18.2, 21.1) |
| Community | 2.8 (2.2, 3.5) |
| Indoors | 15.5 (14.2, 16.9) |
| Rooftop | 0.7 (0.5, 1.2) |
| Engaged in outdoor activities | 81.7 (80.1, 83.2) |
| Walking | 58.2 (56.3, 60.2) |
| Hiking | 17.5 (16.1, 19.0) |
| Bicycling | 26.5 (24.9, 28.2) |
| Engaged green consumer behavior | 88.3 (86.9, 89.5) |
| Purchased locally sourced food | 57.7 (55.7, 59.6) |
| Purchased green cleaning products | 39.7 (37.7, 41.6) |
| Used own grocery bags | 72.8 (70.9, 74.6) |
CMS: St. John’s, Halifax, Moncton, Saint John, Saguenay, Québec, Sherbrooke, Trois-Rivières, Montreal, Ottawa/Gatineau, Kingston, Peterborough, Oshawa, Toronto, Hamilton, St. Catharines, Kitchener, Brantford, Guelph, London, Windsor, Barrie, Grand Sudbury, Thunder Bay, Winnipeg, Regina, Saskatoon, Calgary, Edmonton, Kelowna, Abbotsford, Vancouver, Victoria. Composted kitchen/yard waste: collected privately, depot compost, compost bin, garden, compost other. Disposed electronics for recycle or reuse: took/sent to a depot, returned them to a supplier, donated, repaired or sold them. Electronics: computers, printer/fax, TV/computer display, AV equipment, cellular phone, gaming equipment.
Table 2.
Clustering patterns of pro-environmental behaviors in Canadian households, 2015 Households and the Environment Survey (HES) (n = 8816).
Table 2.
Clustering patterns of pro-environmental behaviors in Canadian households, 2015 Households and the Environment Survey (HES) (n = 8816).
| # | Compost | Recycle | Garden | Outdoor | Green | n | O% | E% | O/E Ratio (95% CI) |
|---|---|---|---|---|---|---|---|---|---|
| 0 | – | – | – | – | – | 49 | 0.41 | 0.56 | 0.73 (0.49, 0.97) |
| 1 | – | – | – | – | + | 90 | 1.02 | 1.02 | 1.00 (0.80, 1.21) |
| 1 | – | – | – | + | – | 62 | 0.83 | 0.70 | 1.18 (0.91, 1.45) |
| 1 | – | – | + | – | – | 17 | 0.16 | 0.19 | 0.81 (0.38, 1.23) |
| 1 | – | + | – | – | – | 15 | 0.22 | 0.17 | 1.32 (0.74, 1.90) |
| 1 | + | – | – | – | – | 45 | 0.51 | 0.51 | 0.99 (0.70, 1.28) |
| 2 | – | – | – | + | + | 210 | 2.44 | 2.38 | 1.02 (0.89, 1.16) |
| 2 | – | – | + | – | + | 88 | 1.27 | 1.00 | 1.27 (1.03, 1.50) |
| 2 | – | – | + | + | – | 39 | 0.40 | 0.44 | 0.89 (0.60, 1.19) |
| 2 | – | + | – | – | + | 35 | 0.47 | 0.40 | 1.18 (0.82, 1.53) |
| 2 | – | + | – | + | – | 23 | 0.43 | 0.26 | 1.66 (1.13, 2.18) |
| 2 | – | + | + | – | – | 5 | 0.21 | 0.06 | 3.65 (1.98, 5.32) |
| 2 | + | – | – | – | + | 229 | 2.95 | 2.60 | 1.13 (1.00, 1.27) |
| 2 | + | – | – | + | – | 128 | 1.75 | 1.45 | 1.20 (1.02, 1.39) |
| 2 | + | – | + | – | – | 54 | 0.67 | 0.61 | 1.10 (0.82, 1.37) |
| 2 | + | + | – | – | – | 23 | 0.39 | 0.26 | 1.51 (1.01, 2.01) |
| 3 | – | – | + | + | + | 313 | 3.76 | 3.55 | 1.06 (0.95, 1.17) |
| 3 | – | + | – | + | + | 119 | 1.12 | 1.35 | 0.83 (0.67, 0.99) |
| 3 | – | + | + | – | + | 45 | 0.41 | 0.51 | 0.81 (0.55, 1.07) |
| 3 | – | + | + | + | – | 22 | 0.18 | 0.25 | 0.70 (0.35, 1.05) |
| 3 | + | – | – | + | + | 607 | 6.95 | 6.89 | 1.01 (0.93, 1.09) |
| 3 | + | – | + | – | + | 381 | 4.71 | 4.32 | 1.09 (0.99, 1.19) |
| 3 | + | – | + | + | – | 229 | 3.12 | 2.60 | 1.20 (1.06, 1.34) |
| 3 | + | + | – | – | + | 142 | 1.52 | 1.61 | 0.94 (0.78, 1.10) |
| 3 | + | + | – | + | – | 72 | 0.83 | 0.82 | 1.02 (0.78, 1.25) |
| 3 | + | + | + | – | – | 35 | 0.40 | 0.40 | 1.02 (0.69. 1.35) |
| 4 | – | + | + | + | + | 225 | 2.63 | 2.55 | 1.03 (0.90, 1.16) |
| 4 | + | – | + | + | + | 2093 | 24.24 | 23.74 | 1.02 (0.98, 1.06) |
| 4 | + | + | – | + | + | 534 | 6.54 | 6.06 | 1.08 (1.00, 1.17) |
| 4 | + | + | + | – | + | 278 | 3.15 | 3.15 | 1.00 (0.88, 1.12) |
| 4 | + | + | + | + | – | 174 | 1.59 | 1.97 | 0.80 (0.67, 0.94) |
| 5 | + | + | + | + | + | 2435 | 25.08 | 27.62 | 0.91 (0.88. 0.94) |
Positive (+) sign: presence of behavior; negative sign (-): absence of behavior.
Table 3.
Associations between pairs of pro-environmental behaviors in Canadian households, 2015 Households and the Environment Survey (HES) (n = 8816).
Table 3.
Associations between pairs of pro-environmental behaviors in Canadian households, 2015 Households and the Environment Survey (HES) (n = 8816).
| Pairwise Combinations of Pro-Environmental Behaviors | Prevalence (%, 95% CI) | OR (95% CI) |
|---|---|---|
| Gardening and green consuming | 65.3 (63.4, 67.1) | 2.24 (1.74, 2.89) ** |
| Gardening and compost | 63.0 (61.1, 64.8) | 2.07 (1.68, 2.57) ** |
| Gardening and outdoor activities | 61.0 (59.1, 62.9) | 2.02 (1.62, 2.53) ** |
| Recycle of electronics and green consuming | 40.9 (39.1, 42.8) | 1.74 (1.34, 2.24) ** |
| Compost and outdoor activities | 70.1 (68.3, 71.9) | 1.56 (1.20, 2.02) ** |
| Compost and green consuming | 75.1 (73.4, 76.8) | 1.56 (1.18, 2.06) * |
| Compost and recycle of electronics | 39.5 (37.7, 41.4) | 1.53 (1.29, 1.98) ** |
| Recycle of electronics and outdoor activities | 38.2 (36.4, 40.1) | 1.53 (1.24, 1.90) ** |
| Outdoor activities and green consuming | 72.8 (70.9, 74.5) | 1.49 (1.10, 2.00) * |
| Recycle of electronics and gardening | 33.5 (31.7, 35.3) | 1.23 (1.03, 1.46) * |
All analyses were adjusted for population size of the province, Census Metropolitan Area, household income, highest level of education in the household, age group of respondents, and the total number of people in the household. * p < 0.01; ** p < 0.001.
© 2020 by the authors. Licensee MDPI, Basel, Switzerland. This article is an open access article distributed under the terms and conditions of the Creative Commons Attribution (CC BY) license (http://creativecommons.org/licenses/by/4.0/).
Share and Cite
MDPI and ACS Style
Lee, E.-Y.; Khan, A. Prevalence and Clustering Patterns of Pro-Environmental Behaviors among Canadian Households in the Era of Climate Change. Sustainability 2020, 12, 8218. https://0-doi-org.brum.beds.ac.uk/10.3390/su12198218
AMA Style
Lee E-Y, Khan A. Prevalence and Clustering Patterns of Pro-Environmental Behaviors among Canadian Households in the Era of Climate Change. Sustainability. 2020; 12(19):8218. https://0-doi-org.brum.beds.ac.uk/10.3390/su12198218
Chicago/Turabian StyleLee, Eun-Young, and Asaduzzaman Khan. 2020. "Prevalence and Clustering Patterns of Pro-Environmental Behaviors among Canadian Households in the Era of Climate Change" Sustainability 12, no. 19: 8218. https://0-doi-org.brum.beds.ac.uk/10.3390/su12198218
Note that from the first issue of 2016, this journal uses article numbers instead of page numbers. See further details here.