Indicators for Post-Disaster Search and Rescue Efficiency Developed Using Progressive Death Tolls


1
Department of Soil and Water Conservation, National Chung Hsing University, Taichung 40227, Taiwan
2
Faculty of Agriculture, Kyushu University, Fukuoka 812-8581, Japan
3
NCKU Hydraulic and Ocean Engineering R&D Foundation, Tainan 70499, Taiwan
4
Innovation and Development Center of Sustainable Agriculture, National Chung Hsing University, Taichung 40227, Taiwan
*
Author to whom correspondence should be addressed.
Sustainability 2020, 12(19), 8262; https://0-doi-org.brum.beds.ac.uk/10.3390/su12198262
Submission received: 4 September 2020
/
Revised: 6 October 2020
/
Accepted: 6 October 2020
/
Published: 8 October 2020
(This article belongs to the Special Issue Natural and Human-Made Hazards Impacts on Urban Areas and Infrastructure)
Abstract
:Search and rescue (SAR) is often the focus during the post-disaster response phase. It is operated under the principle of the “golden 72 h”; however, the actual efficiency of each operation lacks a standard for review. On the basis of continuously updated death toll data during the SAR cases of 51 earthquakes and 10 rainfall-induced disasters, this study developed indicators corresponding to various death tolls for reviewing the time costs and the progress of different stages of SAR. Through analysis of the established indicators, the results showed that said indicators are capable of evaluating the efficiency of SAR. These indicators also revealed that earthquake cases, with or without serious secondary disasters (e.g., tsunamis), significantly affected SAR efficiency. The regression results showed that the SAR efficiency of rainfall-induced disasters is much lower than that of earthquake disasters. Additionally, it was shown that the first casualty reports are typically late and that SAR works last a long time, highlighting the difficulty and possible delay of SAR works during rainfall-induced disasters. Previous studies and analyses might have been able to make subjective descriptions of each SAR operation; however, this study quantitatively indicates the difference between actual and expected efficiency under specific death tolls.
1. Introduction
Natural hazards often cause disasters that have a severe adverse impact on the lives and livelihoods of humans [1]. Looking at the average number of deaths globally over the past few decades, approximately 60,000 people have died from natural hazards every year [2]. Low-frequency, high-impact events such as earthquakes are not preventable, but the loss of such a high number of human lives is. Disaster-related deaths could be reduced through earlier prediction, more resilient infrastructure, emergency preparedness, and response systems [2]. Disasters severely disrupt normal socioeconomic activities and cause damage and possible casualties. Some studies have attempted to quantify the damage, for example, in terms of monetary losses and the number of people killed [3,4,5]. However, the total number of deaths of a disaster can only represent the degree of impact of said disaster, rather that reveal the progress of the search and rescue (SAR) process; hence, the quantitative efficiency of the SAR of each post-disaster response remains unknown. In the wake of a disaster, time is crucial, and SAR work should be carried out promptly. To save lives within the effective treatment period, quick organization of local self-aid groups and external rescue teams is essential.
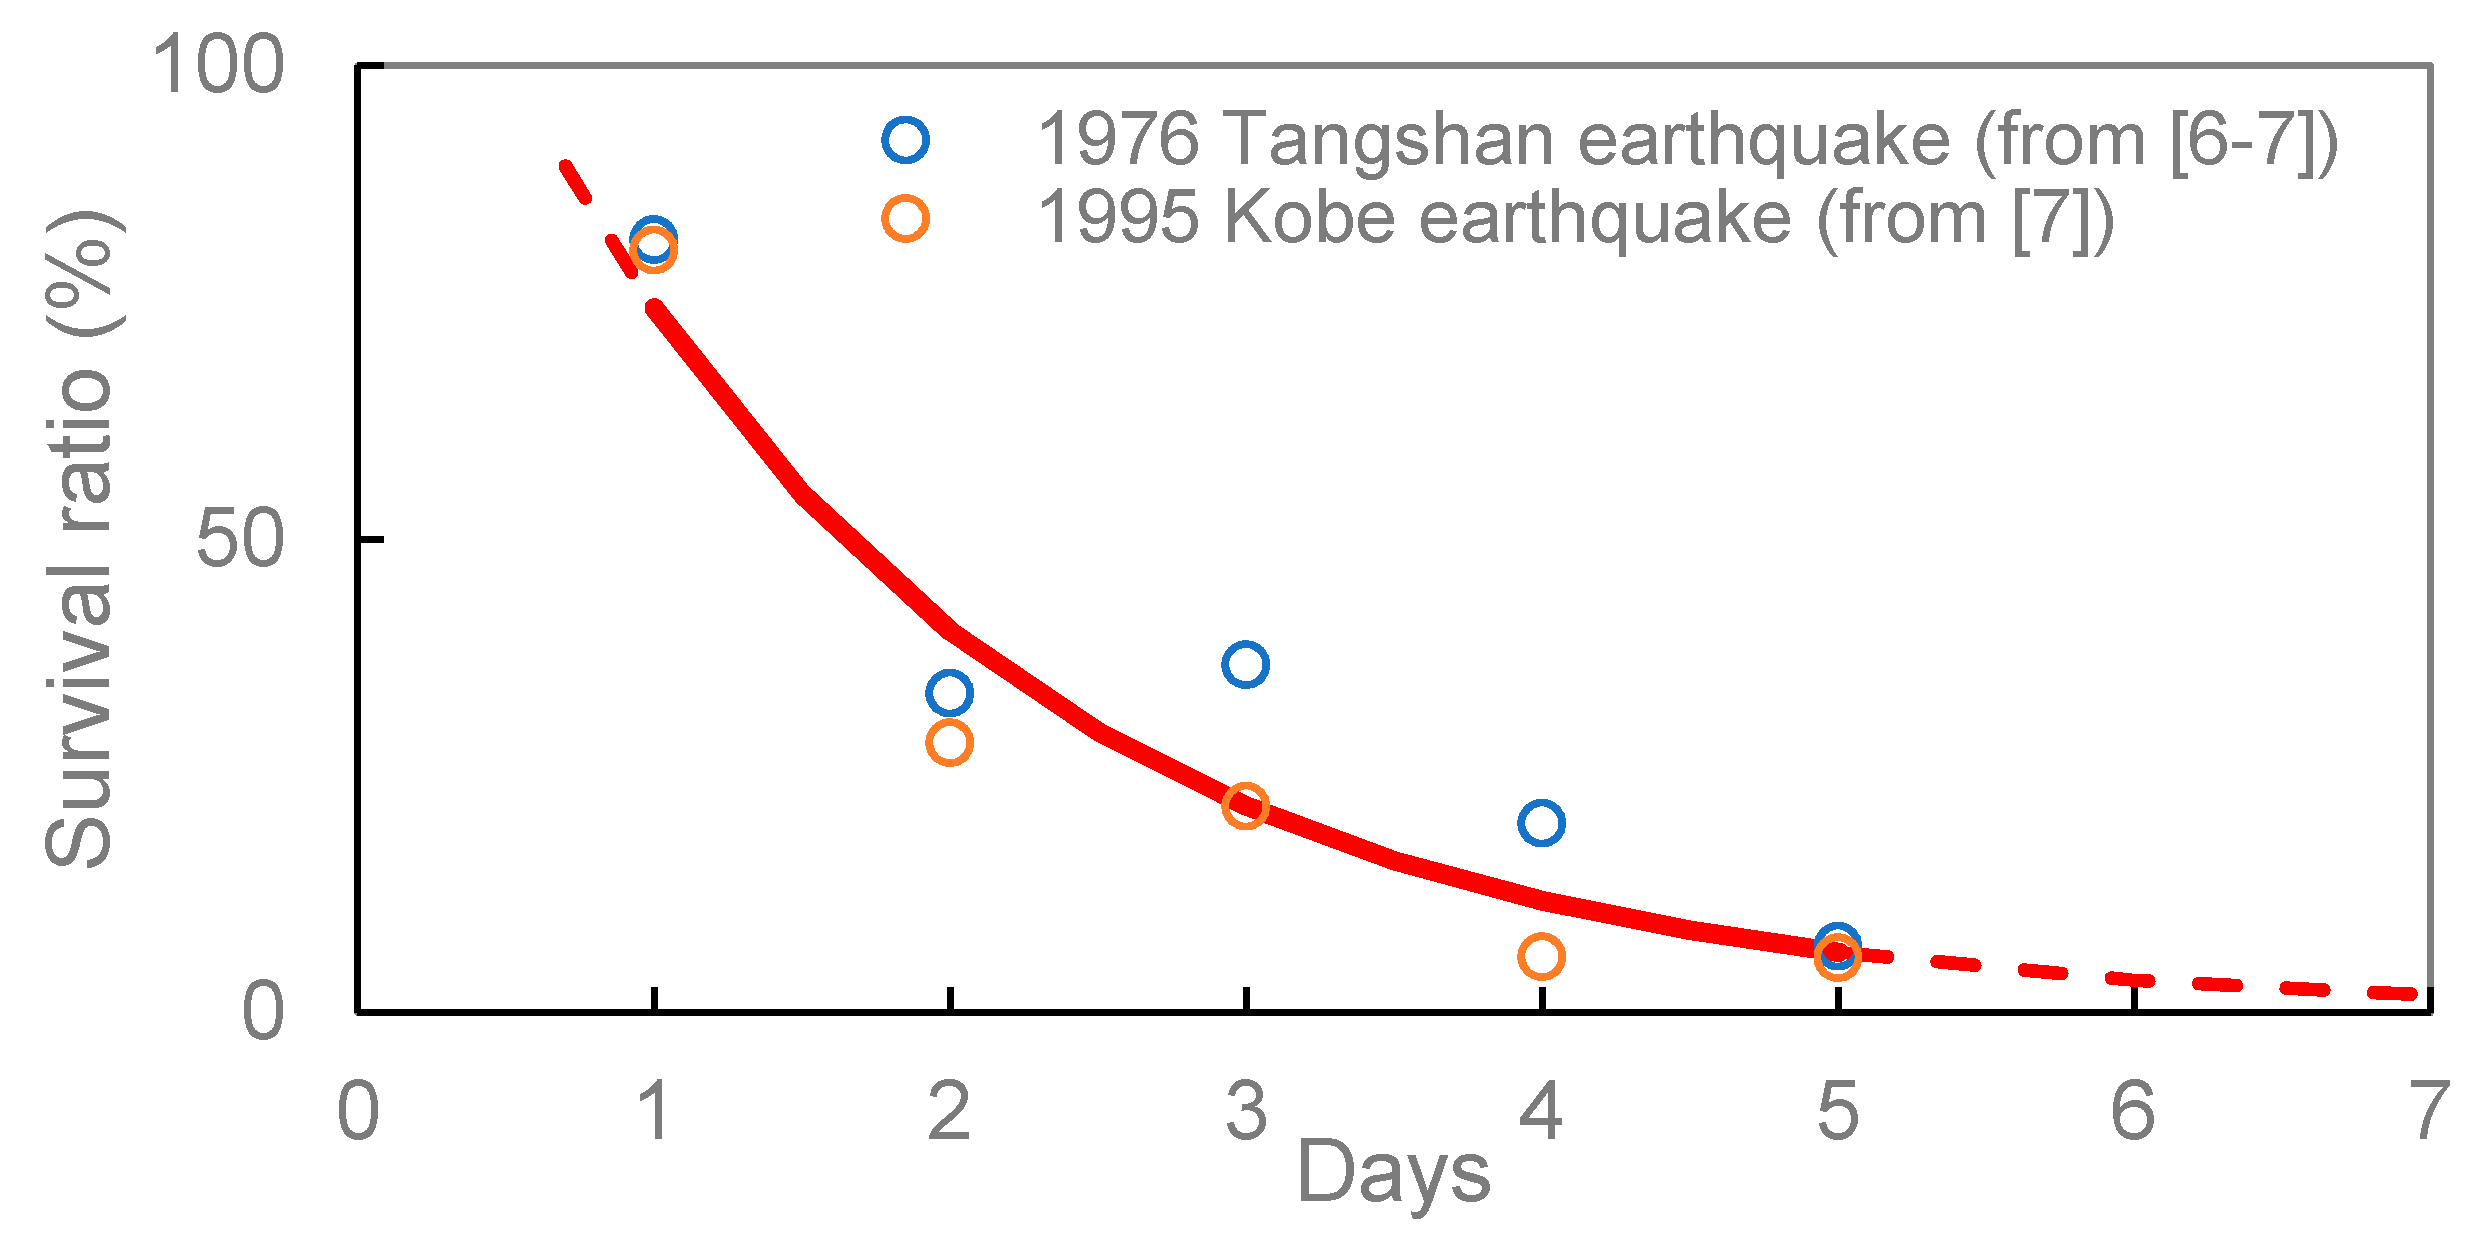
For example, when an earthquake occurs, many people are instantly killed or hurt, and some are buried in collapsed buildings. For those seriously injured, their wounds can quickly deteriorate and become fatal if they are not rescued and given medical care in time. Generally, the survival rate of victims decays rapidly [6,7], as indicated by the two fatal earthquakes in Figure 1. On average, the survival ratio of people rescued within 24 h after an earthquake is 74%, while it is 22% on the third day and 6% on the fifth day. This decline in survival ratio is also affected by the collapse of buildings and the health status of victims [8,9]. Nonetheless, the first 72 h [10] are considered the most critical with regard to current practices.
Studies have indicated that many more victims could survive if SAR medical care was delivered timely [11] and the probability of being released alive declined dramatically over time [12]. The effects of SAR on death toll have long been recognized and researched [13,14]. Considering that the survival ratio of trapped victims declines significantly with rescue time, the chance of survival of victims should be higher if more resources (e.g., personnel and equipment) are introduced into the rescue operation at an early stage. A greater disaster necessitates more resources to sustain the efficiency of SAR work. Moreover, factors such as weather, topography, environment, and traffic flow may interfere with rescue efficiency. The actual rescue efficiency is influenced by disaster intensity (i.e., the number of people to be rescued), the input of rescue resources, in situ obstacles, and decision-making outcomes. Therefore, reviewing and quantifying the rescue rate remains a challenge at present.
Recently, media and the internet have become real-time resources for providing coverage of SAR work. In response to the community’s concerns, the progress of SAR work is also announced to the public through media. During SAR procedures, both survivors and dead bodies are gradually discovered; thus, the cumulative number of deaths discovered during this process can symbolize the progress of SAR work because, when all victims are found, the SAR can be considered finished. If the number of recovered bodies represents progress in a specific period, the SAR efficiency would then be the progress divided by the time costs. The efficiency of the whole SAR process can be estimated by updating the number of deaths and the corresponding time.
Through collecting death tolls from past disasters (earthquakes and rainfall-induced mass movement), classified on the basis of the type of disaster and the magnitude of the death toll, this study explored the relationship between the number of deaths and the SAR efficiency via regression analysis. This study also developed indicators for quantifying the SAR efficiency of a single disaster event. Some previous studies have conducted regression analyses on a few earthquake disasters [15,16,17,18]. However, as these were limited to earthquake disasters, data were scarce. Death tolls vary greatly across different earthquake disasters, ranging from single digits to hundreds of thousands; hence, more data are crucial.
2. Materials and Methods
2.1. Collected Disasters
A total of 51 earthquakes and 10 rainfall-induced disasters were used in this study. Table 1 shows the earthquake disasters collected from the China Earthquake Database, the National Center for Environmental Information (NCEI) [19], and the Google search engine. The death tolls represent the number of disaster deaths reported by official authorities. Table 2 lists rainfall-induced disasters collected from The Emergency Events Database (EM-DAT) [20] and the SAR process data from the media.
2.2. The Death Toll Curve and Its Characteristics
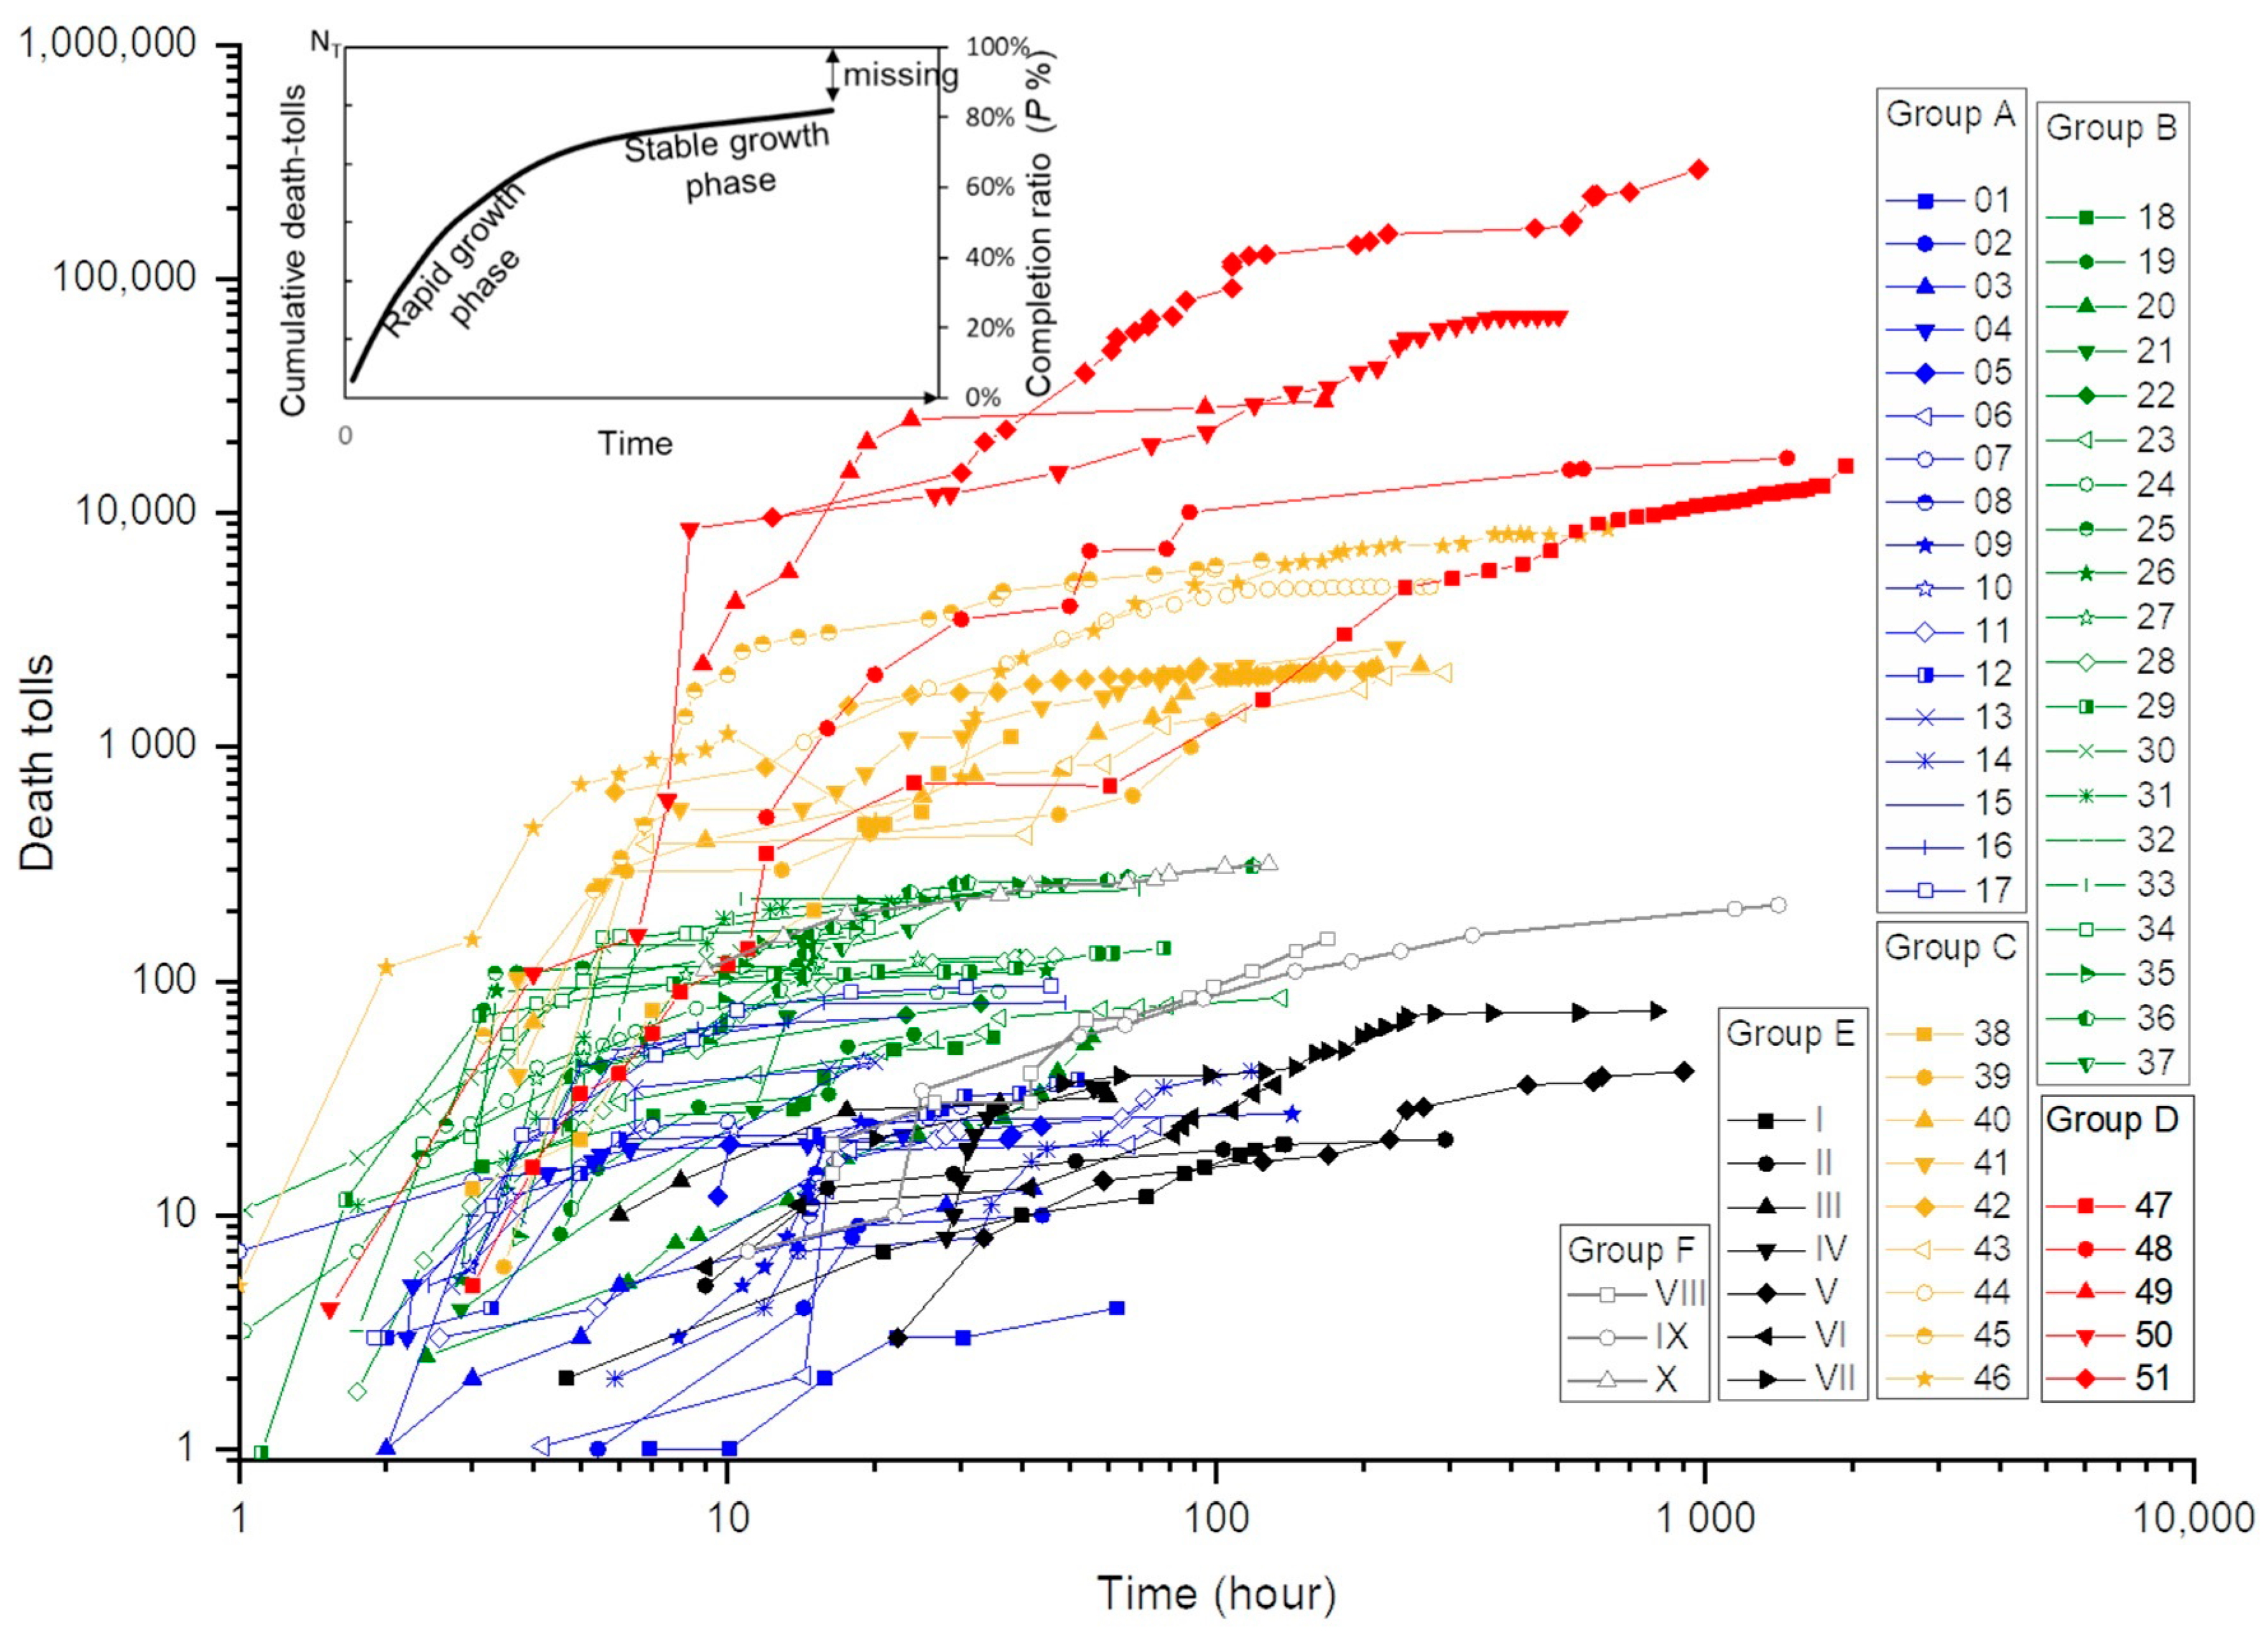
To emphasize the differences in SAR efficiency among different magnitudes of death tolls, disasters were categorized according to these magnitudes, as shown in Table 1; the death toll curves are shown in Figure 2. The death tolls and the corresponding time are presented mainly according to announcements by the relevant authority for disaster response, obtained from the China Earthquake Database or the media. Group A represents earthquake disasters with less than 100 fatalities, plotted in blue; Group B represents earthquake disasters with 100–1000 fatalities, plotted in green; Group C represents earthquake disasters with 1000–10,000 fatalities, plotted in yellow; lastly, Group D represents earthquake disasters with > 10,000 fatalities, plotted in red. In general, the cumulative death toll initially increased rapidly. With time, not only did the probability of recovery decrease, but the number of people found also decreased. Subsequently, the SAR efficiency decreased gradually. Tang et al. [16,21] highlighted that the death toll curves reported in earthquakes have two phases: a rapid growth phase and a stable growth phase.
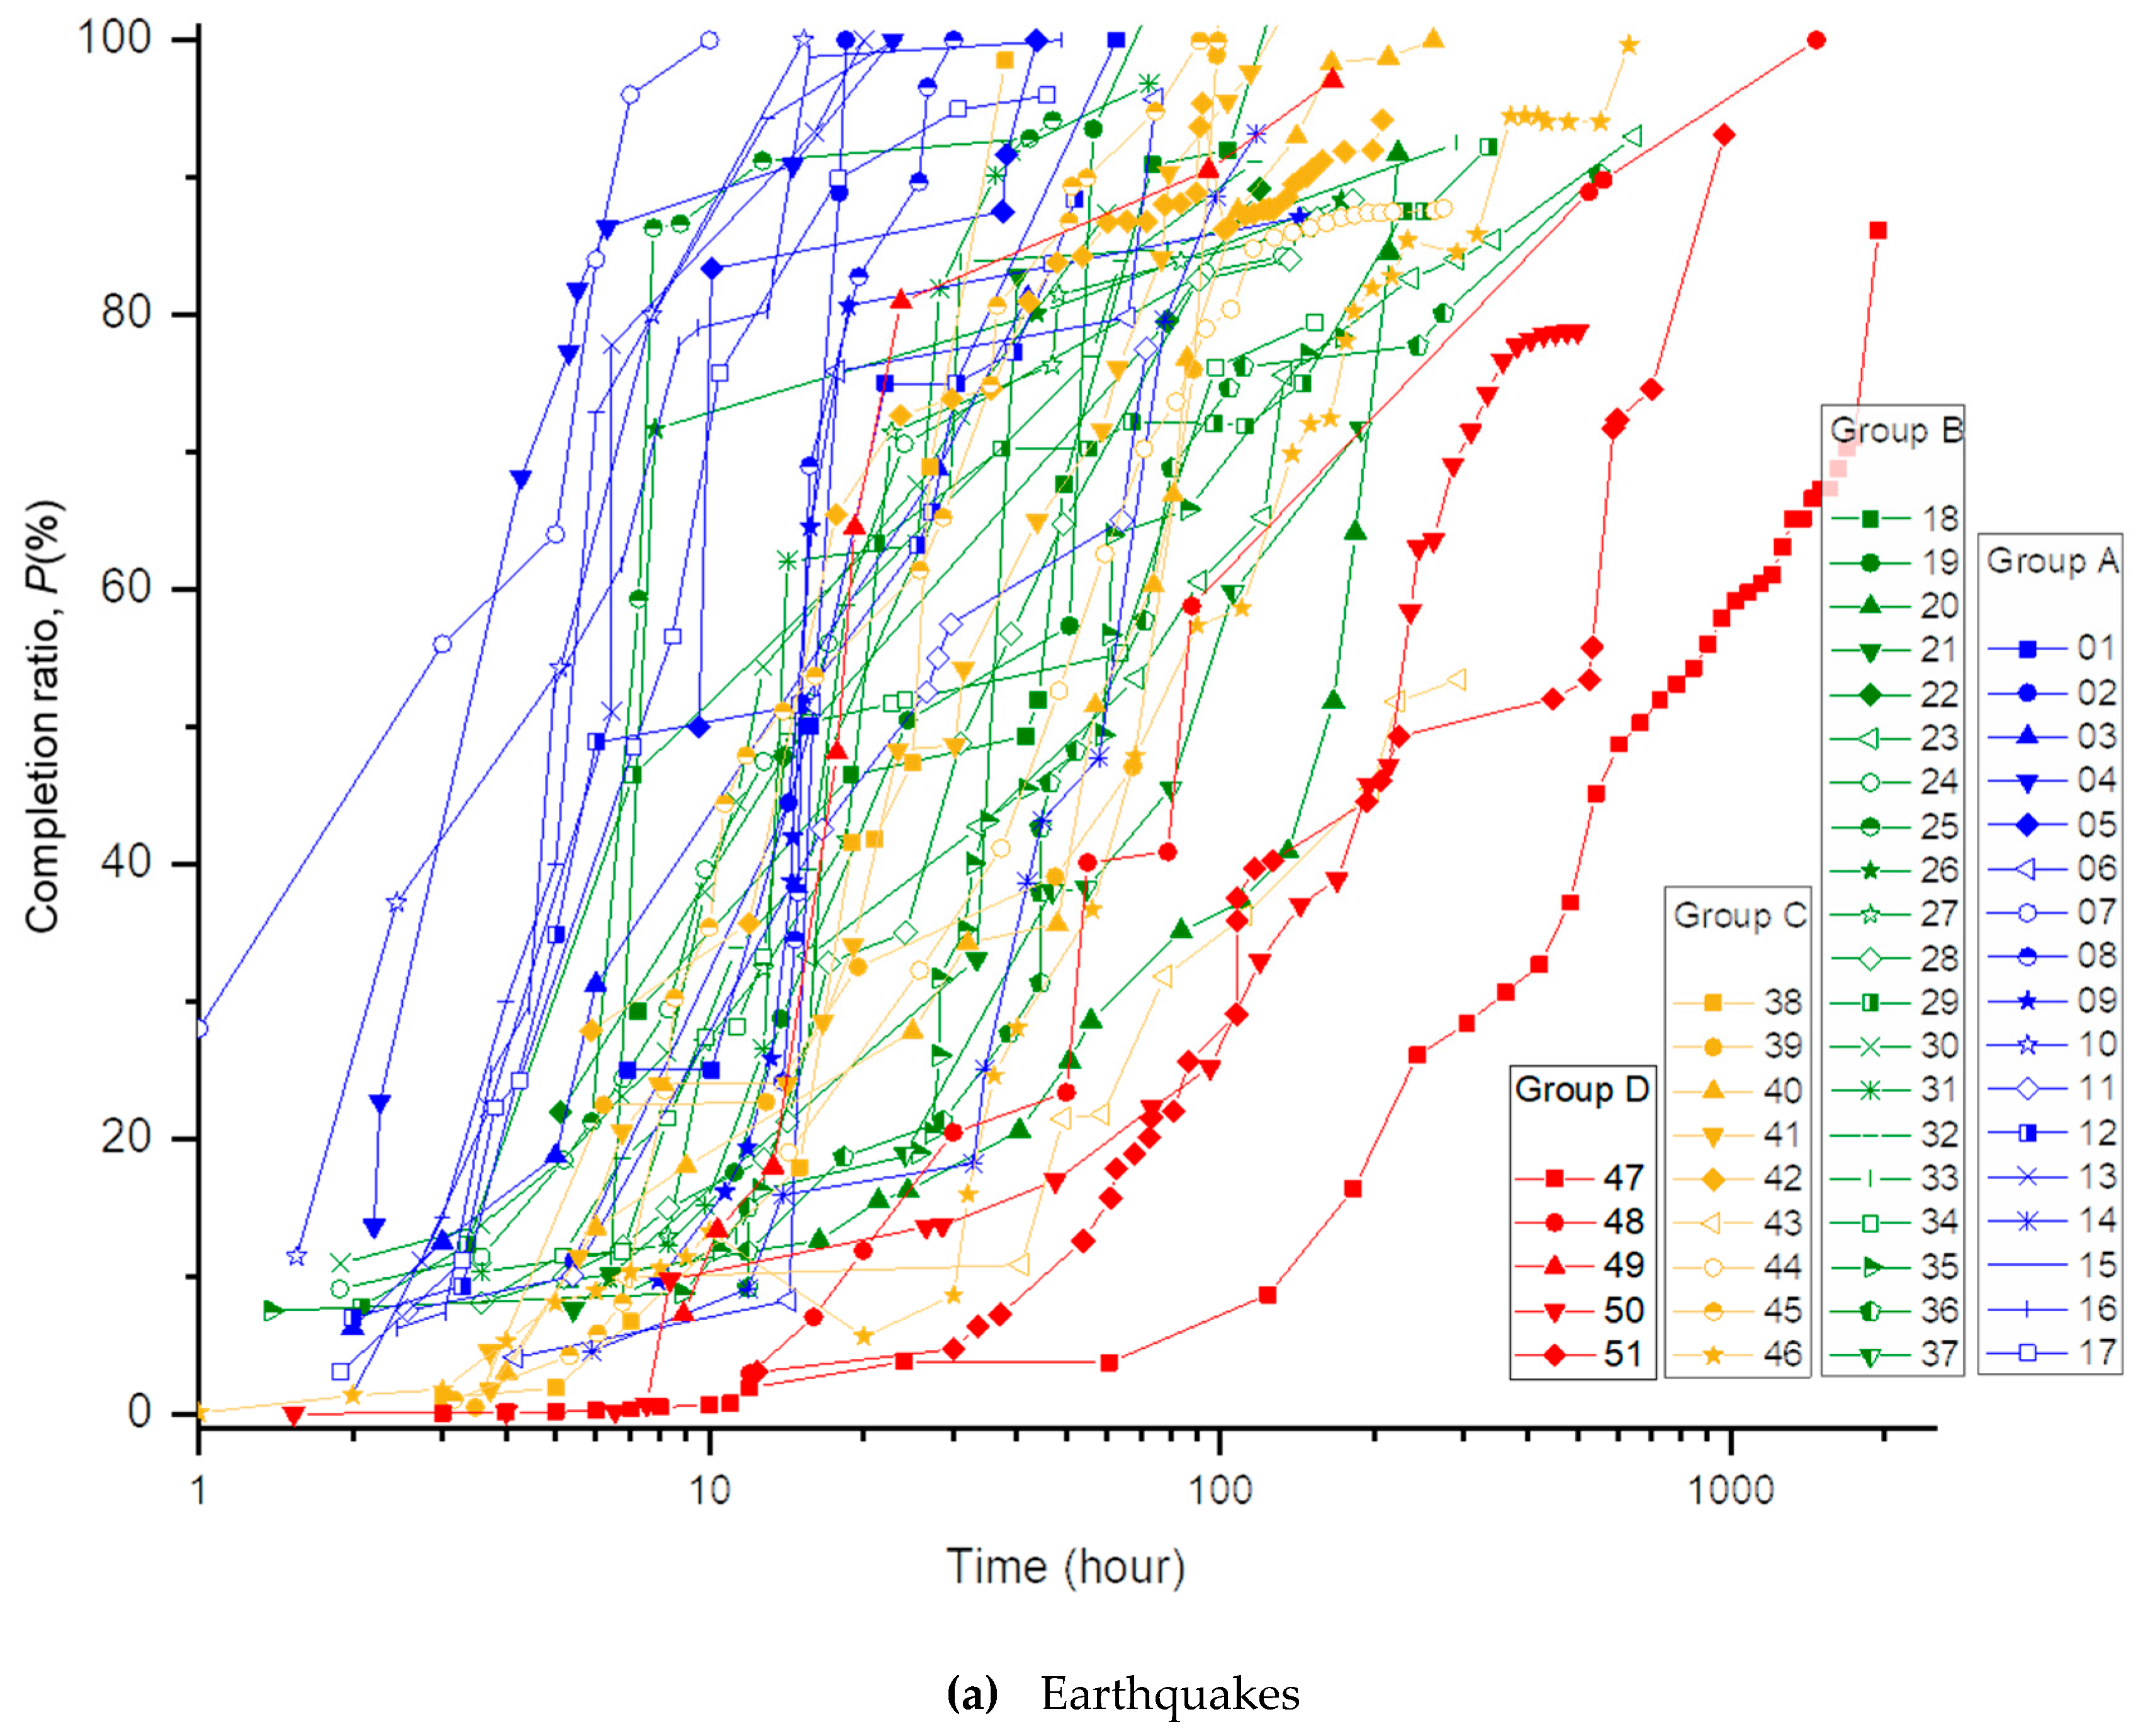
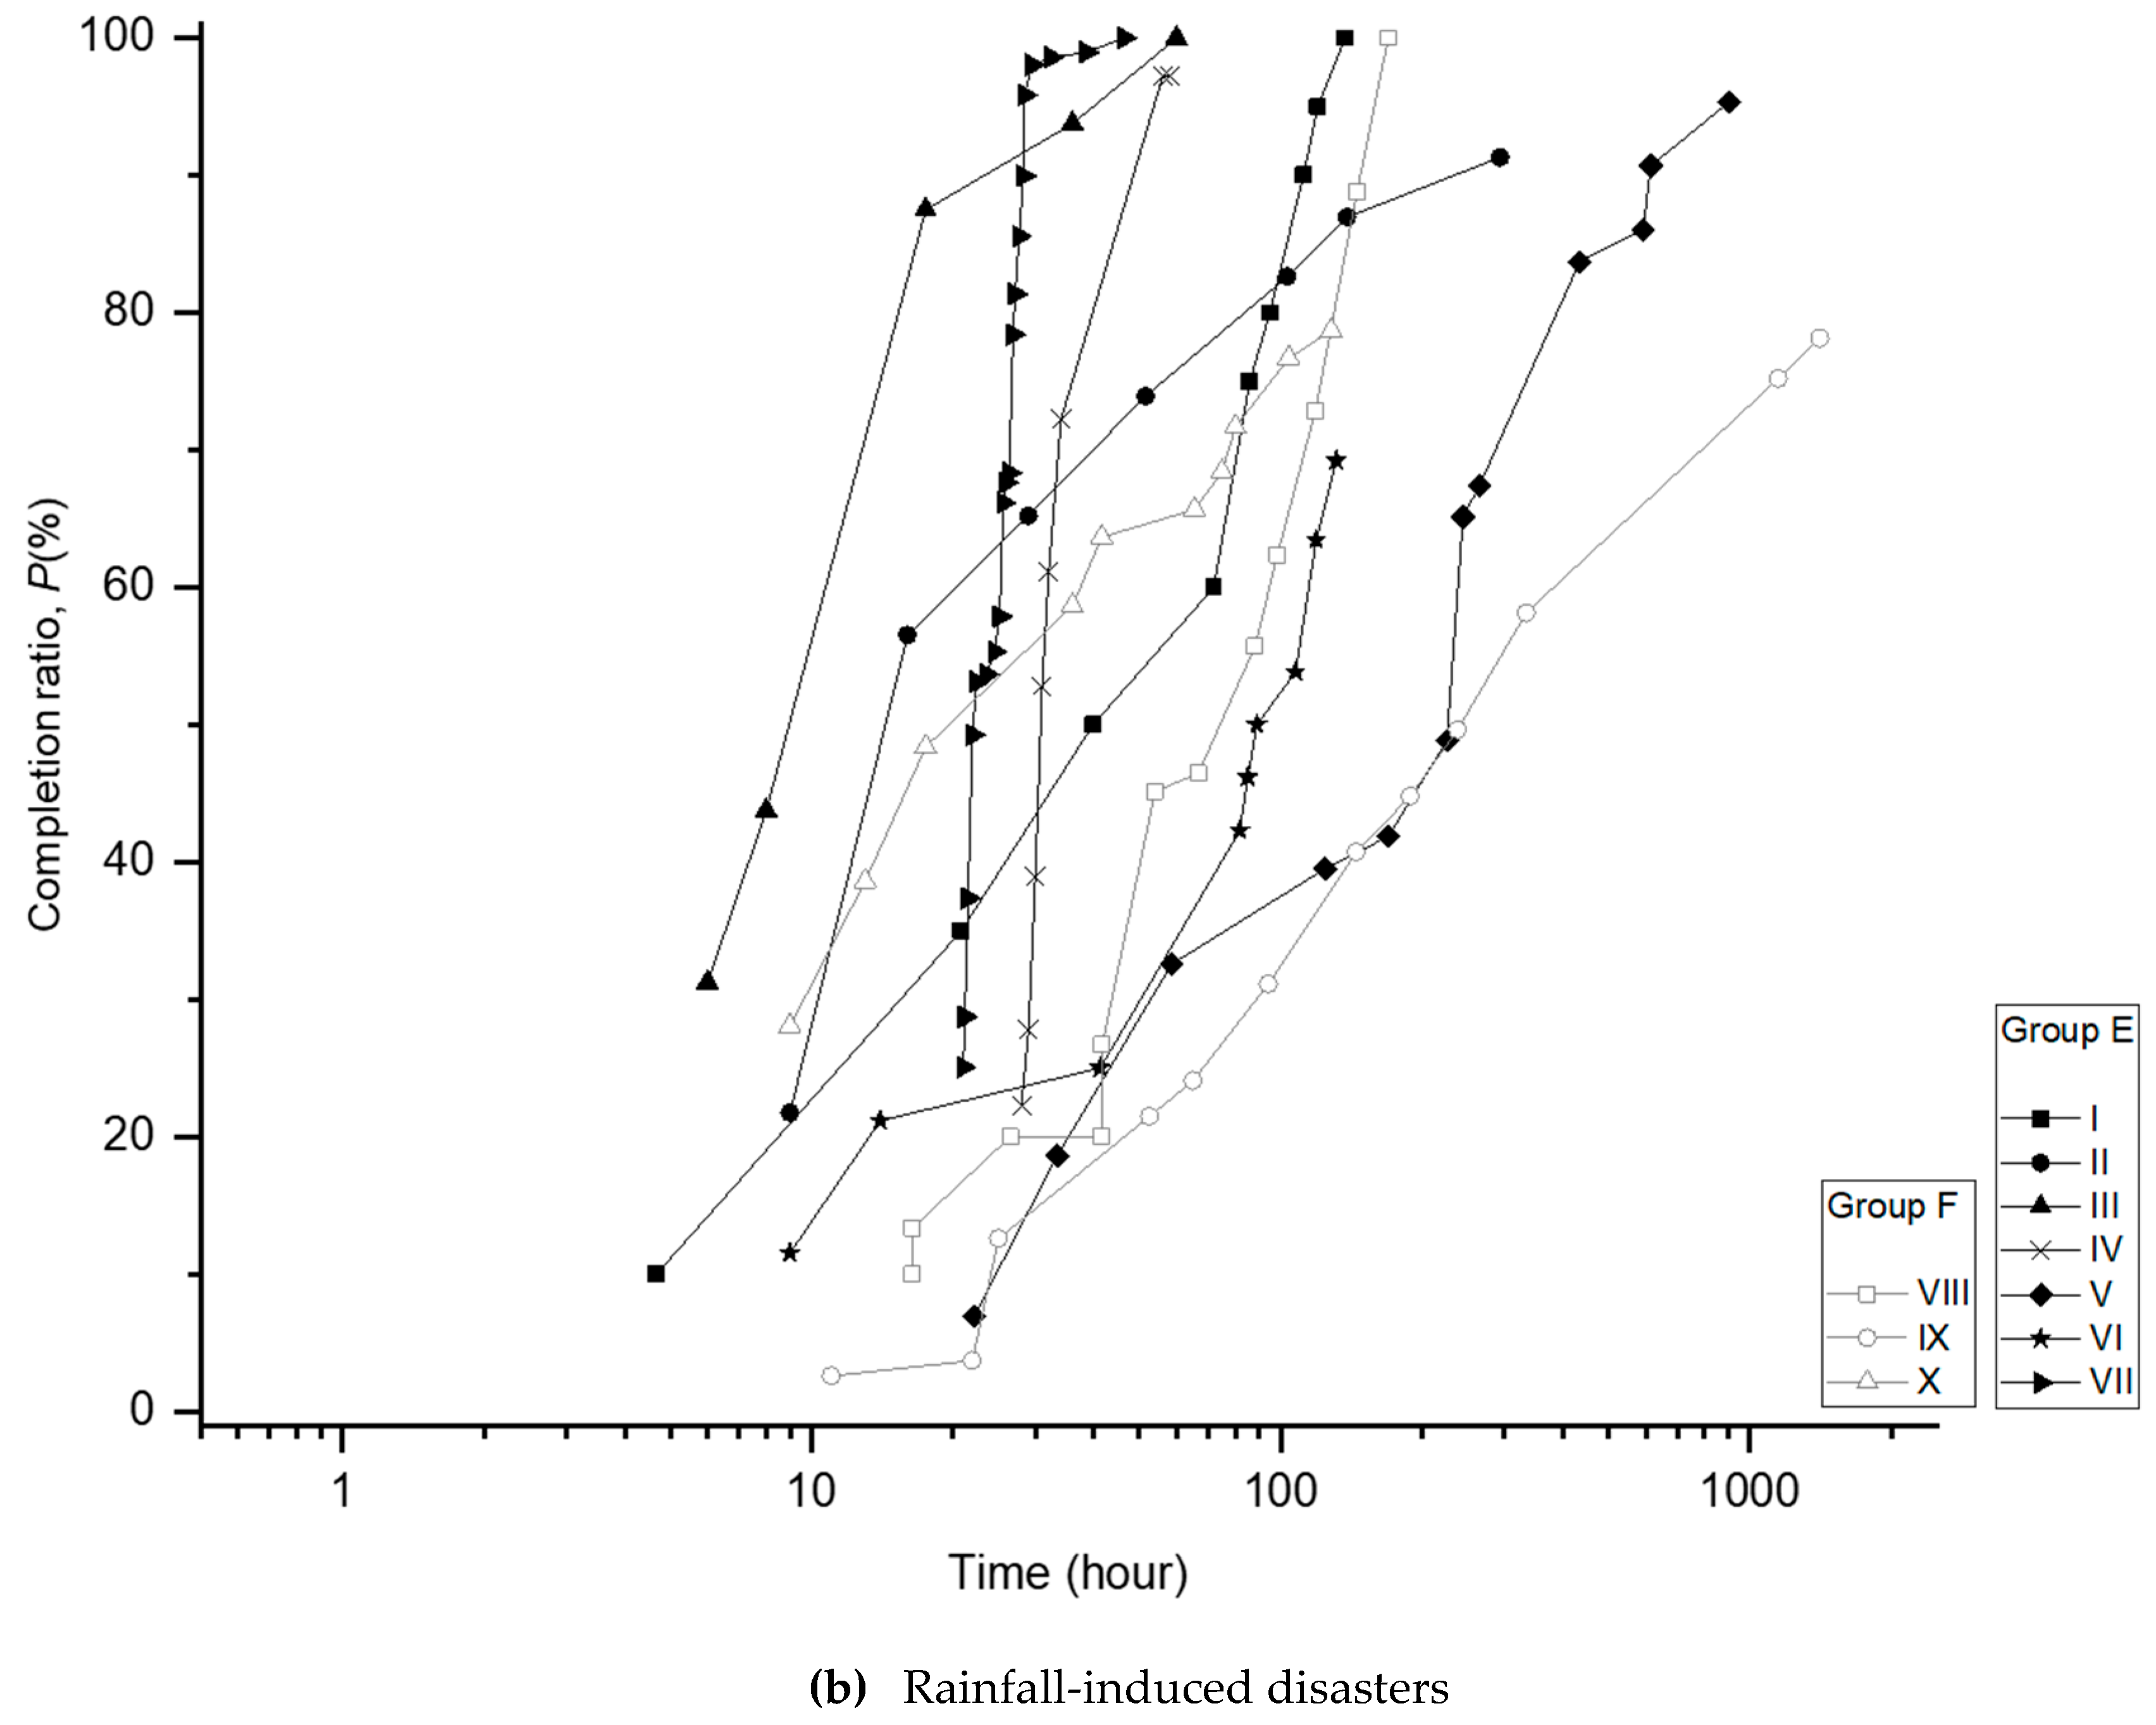
The death tolls of the 51 collected earthquake events were converted into completion ratios (cumulative death toll (N) divided by the final death toll (NT)). Sometimes, not all of the victims are found upon completion of SAR work; hence, the completion ratio may not always reach 100%. Herein, generally, the curves showed an inverse relationship between magnitude and completion ratio. The completion ratio curves for rainfall-induced disasters are shown in Figure 3b.
3. Regression Analysis
A population exponential growth equation, commonly used to describe growth constraints, was selected to describe the curve .
where is the time, is the cumulative number of deaths found at time t, is the final death toll, and is a coefficient, where represents a growing number of people. Equation (1) is consistent with the finding that the death toll increases rapidly in the early stage, before gradually stabilizing [16,21] and approaching the asymptote over time.
To solve the derivative of Equation (1), the following ordinary differential equation can be obtained:
where the term on the left, i.e., , represents the SAR efficiency rate as a function of the completion ratio of the entire rescue work (unit: %∙T−1), while the right term reveals that the efficiency of SAR work worsens with a lower number of people left to be found. Therefore, the value of is a coefficient directly proportional to efficiency, whereby a higher value of denotes a higher efficiency ().
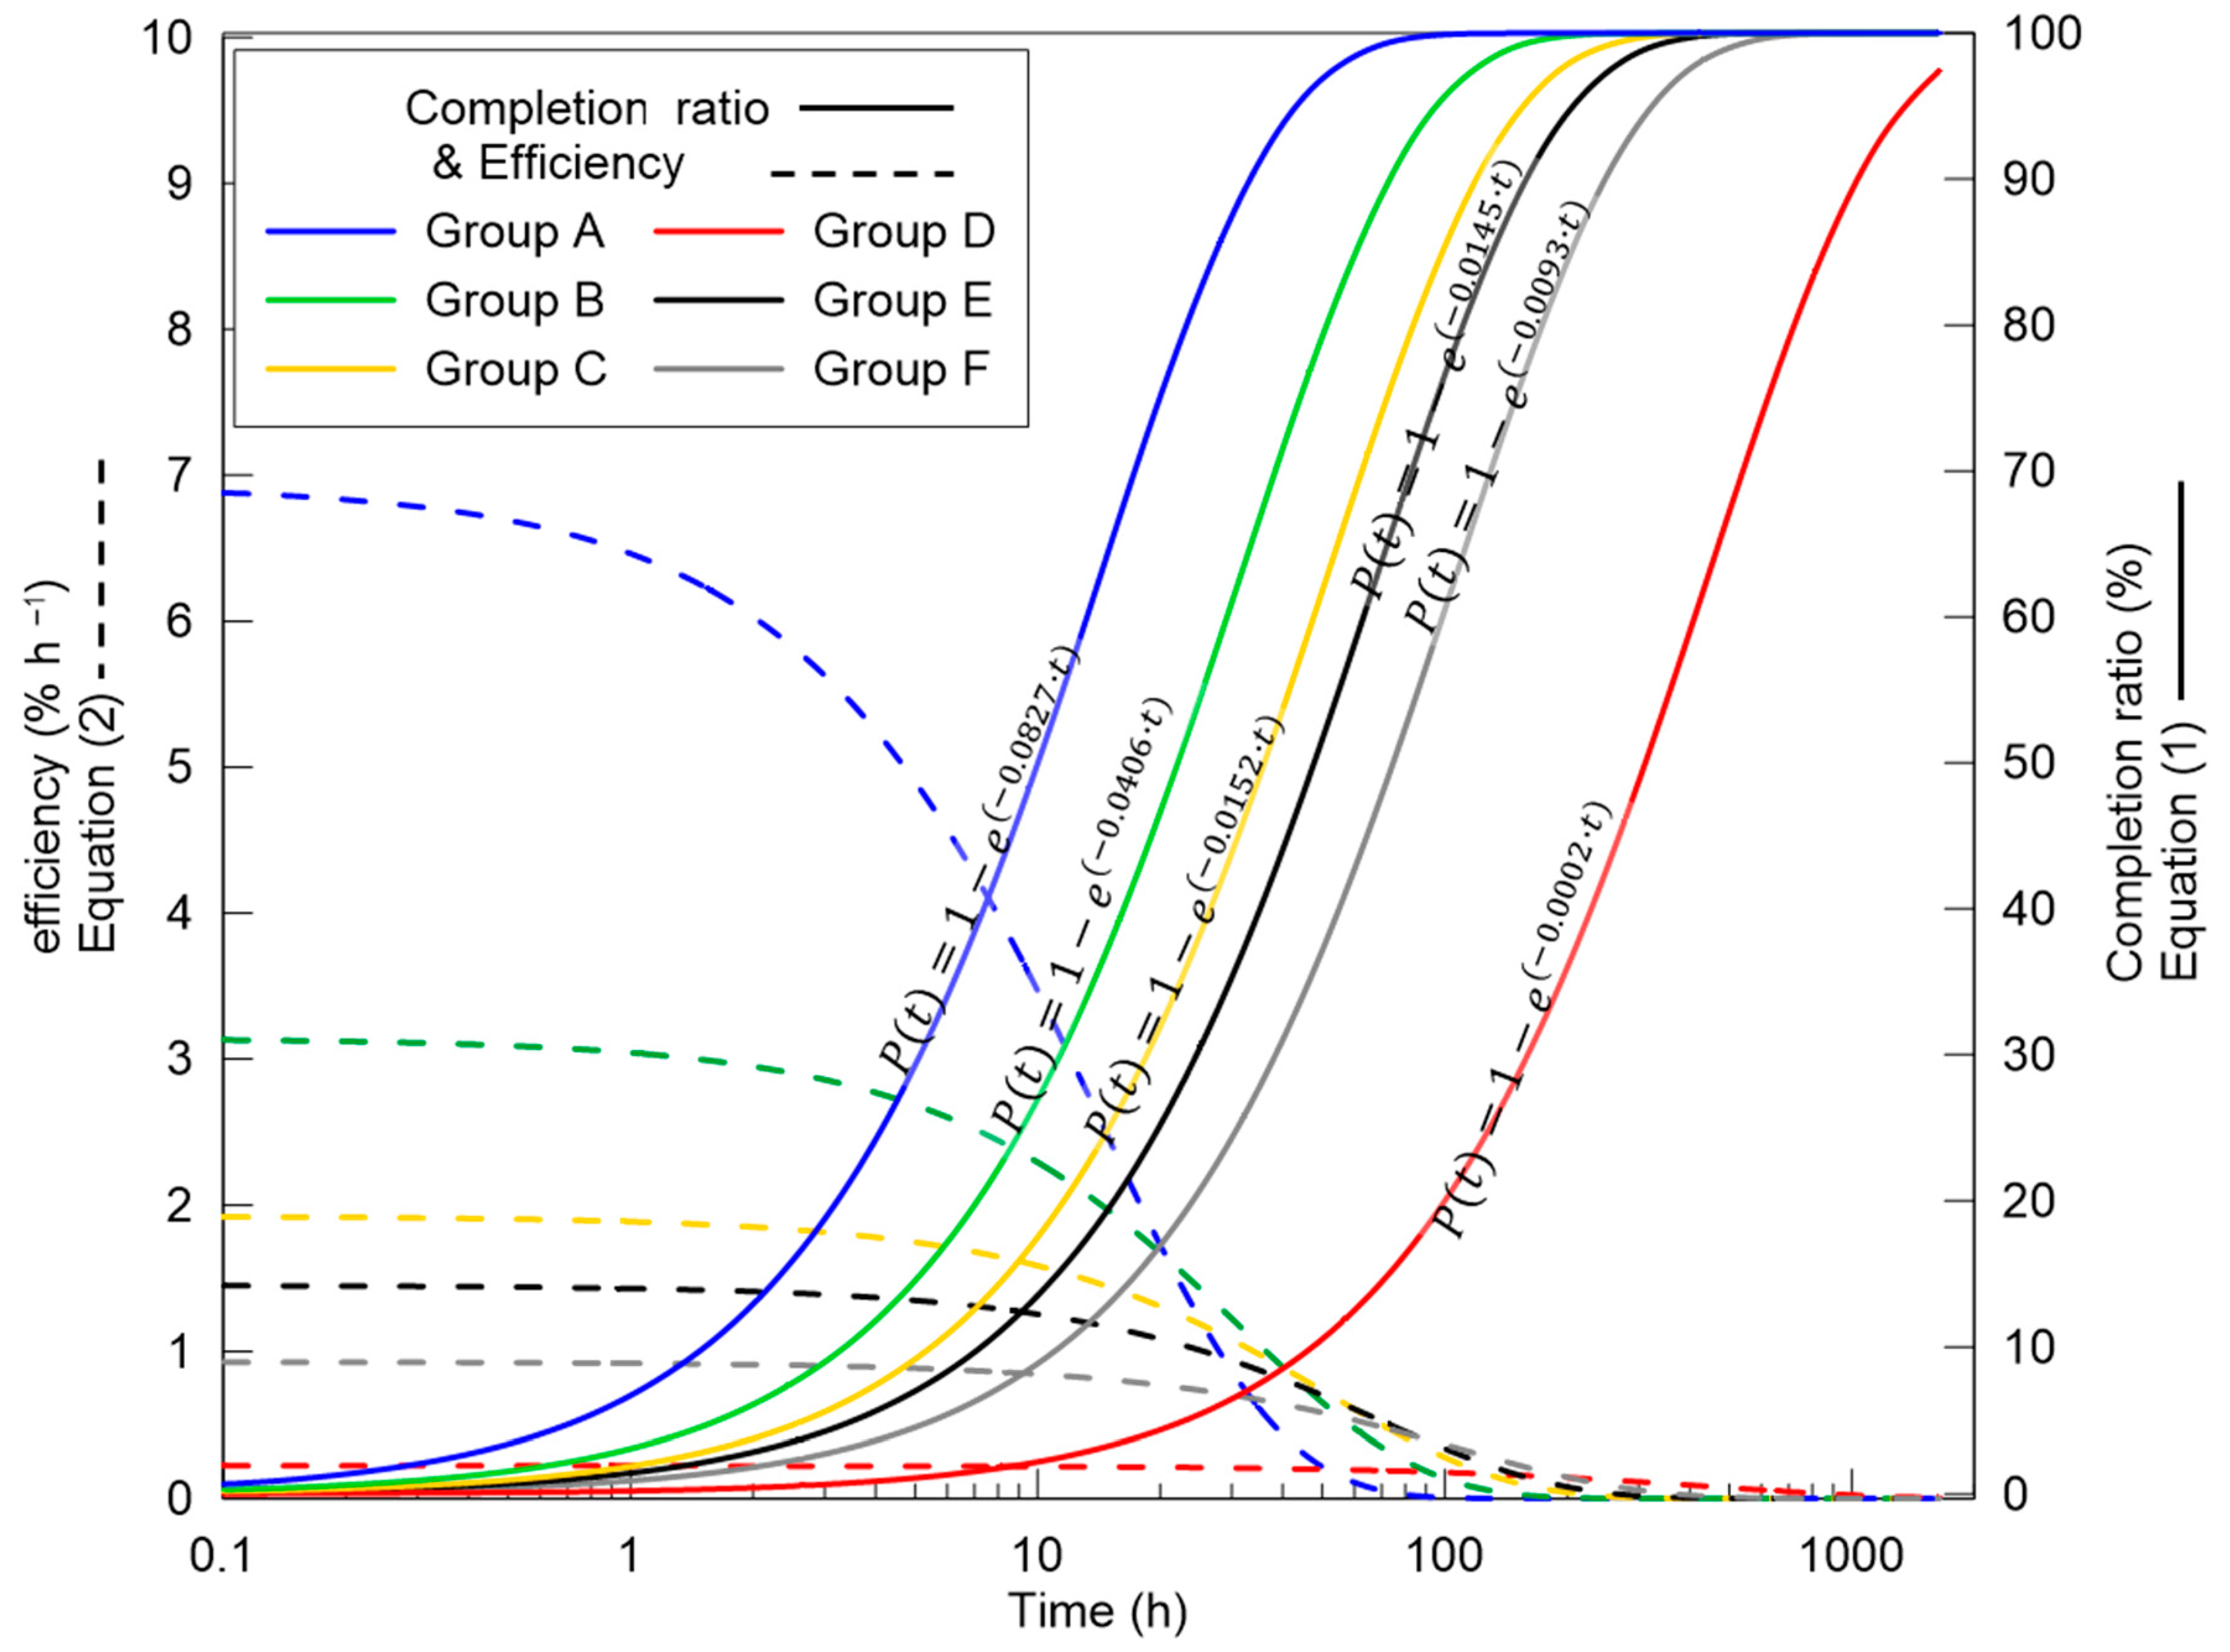
The regressions of all groups are presented in Figure 4, where the time-varying efficiency following Equation (2) is also presented. The values of the undetermined coefficient in Equations (1) and (2) are 0.0827, 0.0406, 0.0151, and 0.0002 for Groups A to D, respectively. The values of coefficient for Groups E and F are 0.0145 and 0.0093, respectively, indicating that rainfall-induced cases have a lower SAR efficiency when compared to the earthquake cases at the same level (Groups A and B).
A general observation drawn from Figure 4 is that, regardless of the disaster magnitude, it takes more time for SAR to approach a completion ratio of , regardless of a possible increase in SAR resources. In addition, the efficiency is higher in the beginning, before decreasing over time as the difficulty increases.
4. Indicators
The “golden 72 h” rule is currently the most widely used rule in SAR operations. However, this principle cannot interpret the ideal progress at a certain time or the ideal time to achieve a certain completion ratio. Moreover, it fails to evaluate the SAR efficiency, which leads to a lack of quantitative indicators for the SAR operation. Hence, through the regression of many disasters (listed in Table 1 and Table 2), indicators for assessing SAR efficiency in relation to earthquakes and rainfall-triggered disasters with different death tolls are proposed.
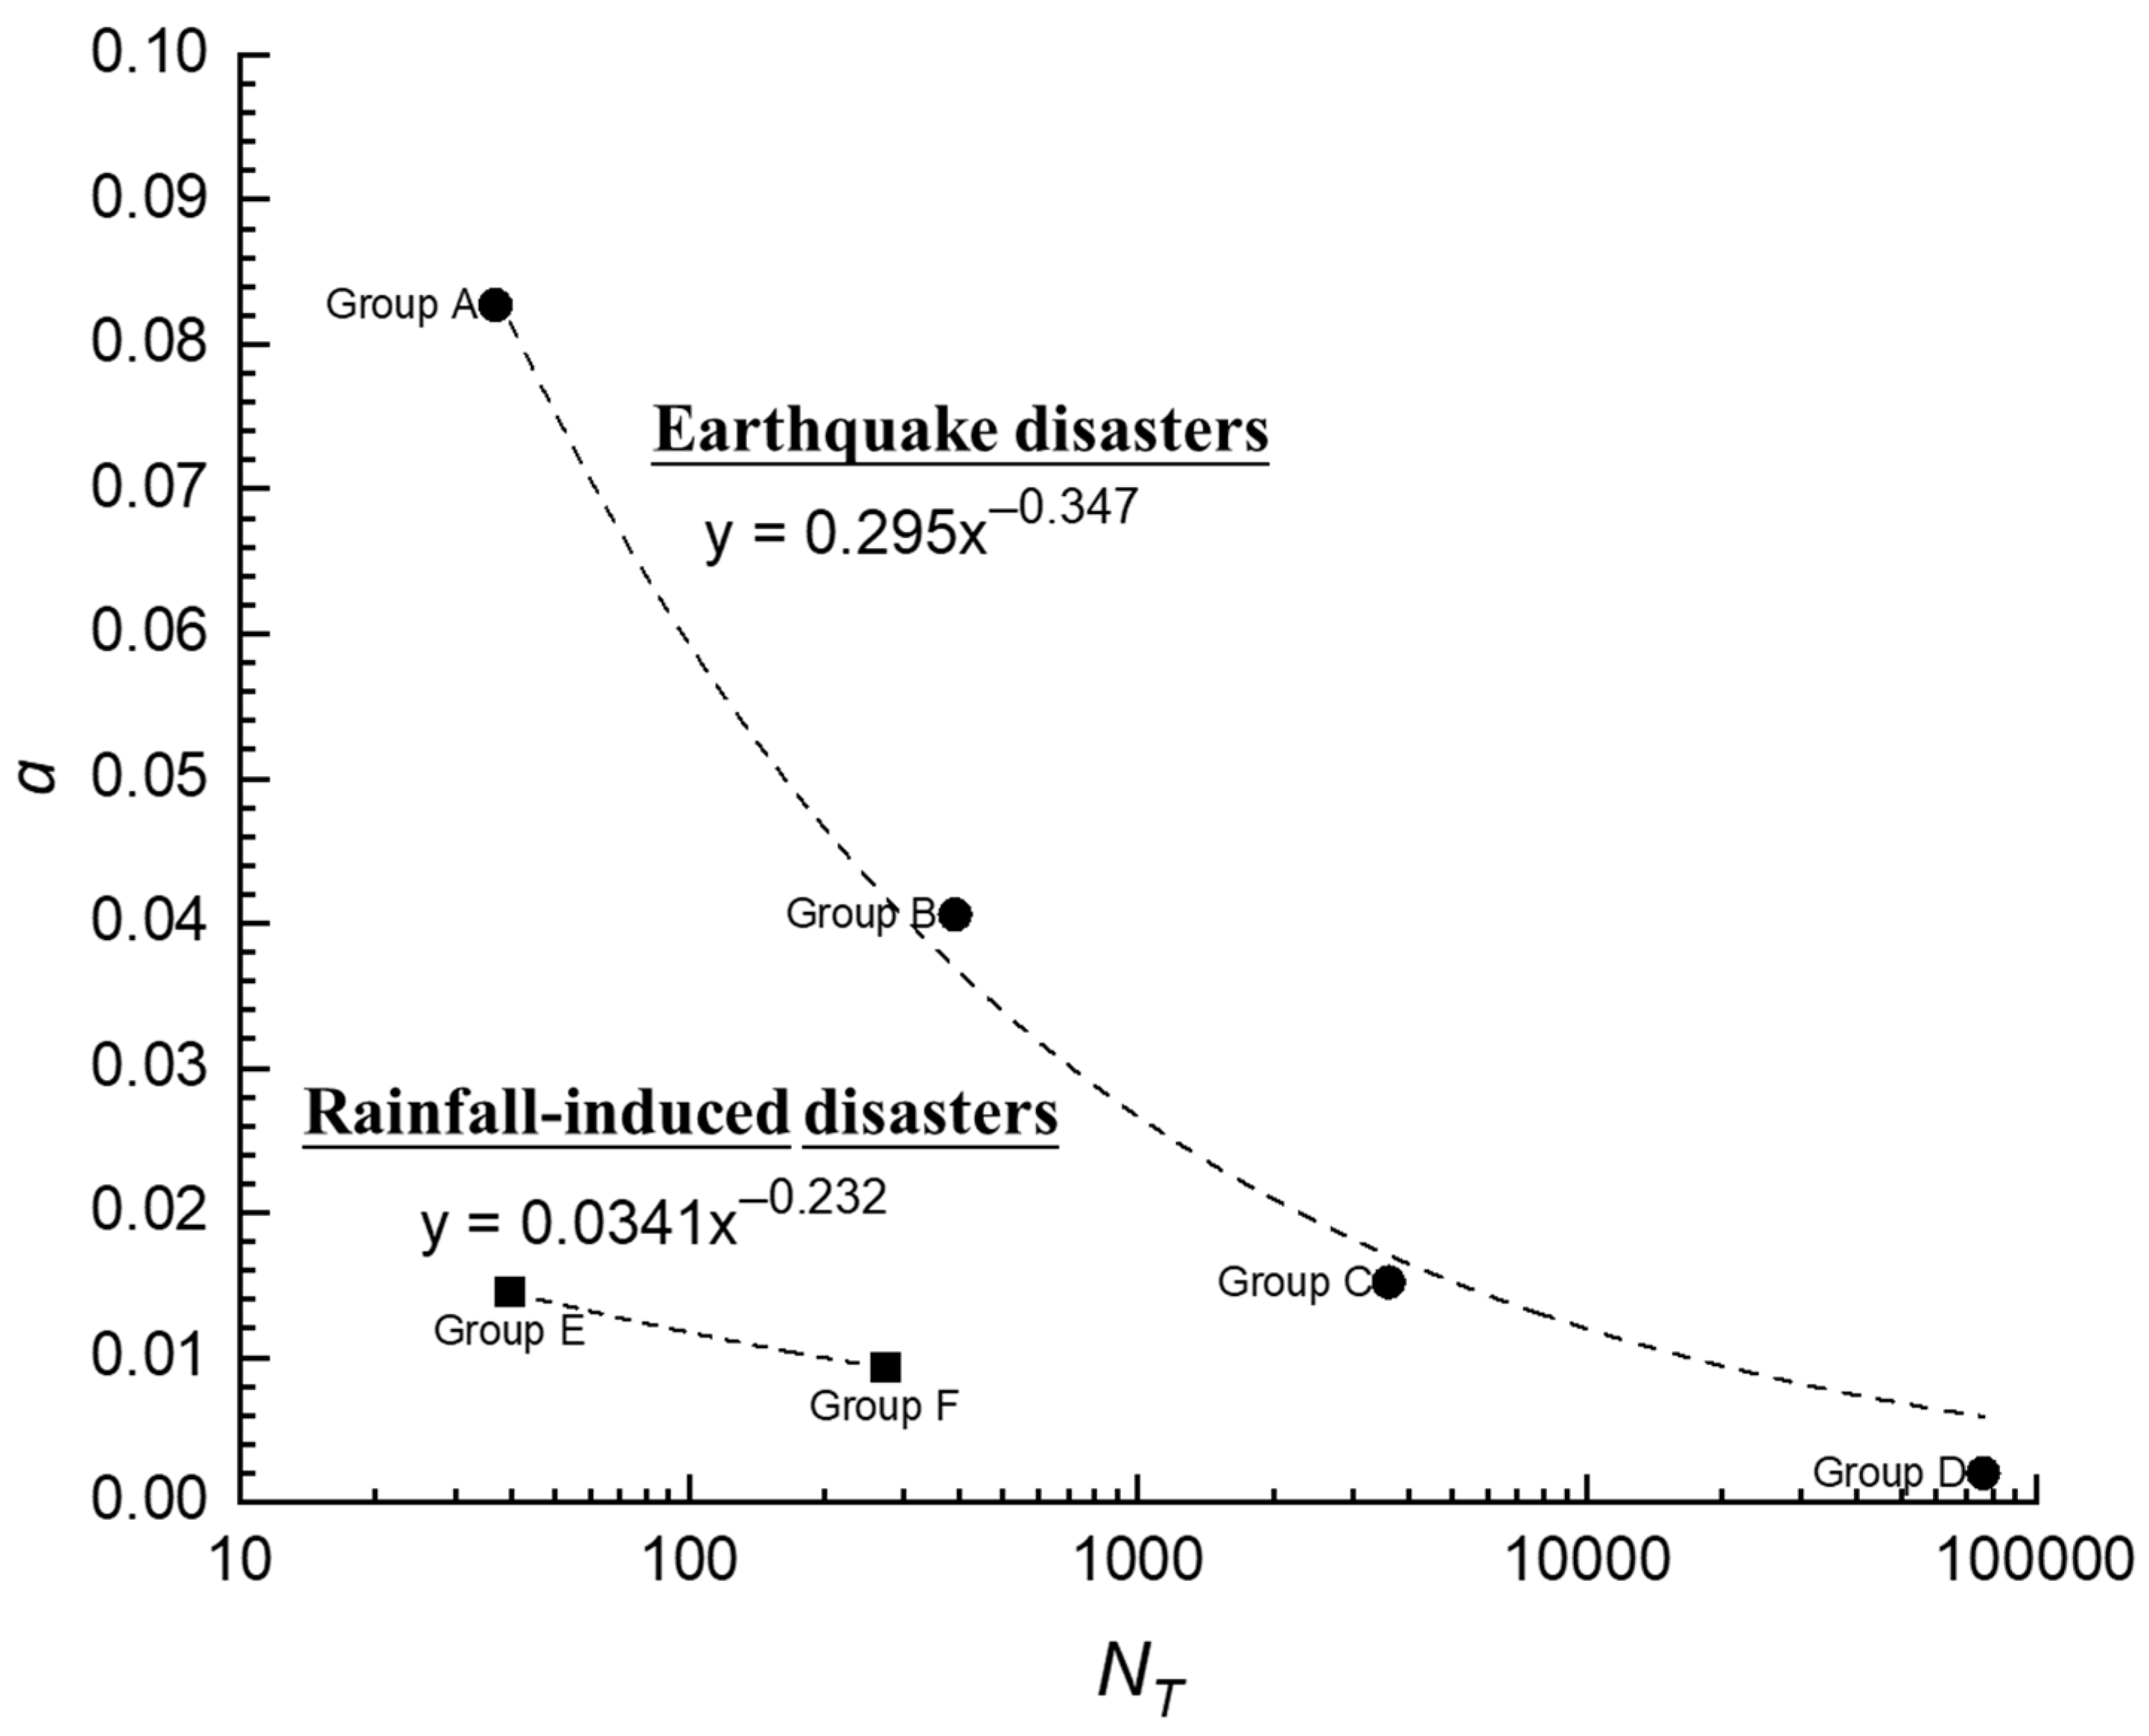
We found a correlation between SAR efficiency and death toll, whereby the SAR efficiency is determined using the value. The relationship between death toll and is presented in Figure 5, where the relationship between both variables can be represented as follows:
Figure 5 and Equations (3a) and (3b) reveal the difference in efficiency between earthquake and rainfall-induced cases under the same NT, indicating that the SAR efficiency for earthquake cases is usually greater than that for rainfall-induced cases. In addition, decreases more rapidly for earthquake cases than for rainfall-induced cases. Lastly, an increase in NT indicates that the magnitude of death tolls seriously affects the SAR efficiency for earthquake cases.
Substituting Equations (3a) and (3b) into Equation (1) yields the following relationships:
Equation (4) reveals that, under a certain death toll (with NT known), P = X%, given that the ideal X% progress time tX% can be obtained (for either earthquake or rainfall-triggered cases). Then, tX% can be used as the expected time of SAR work with a given number of fatalities.
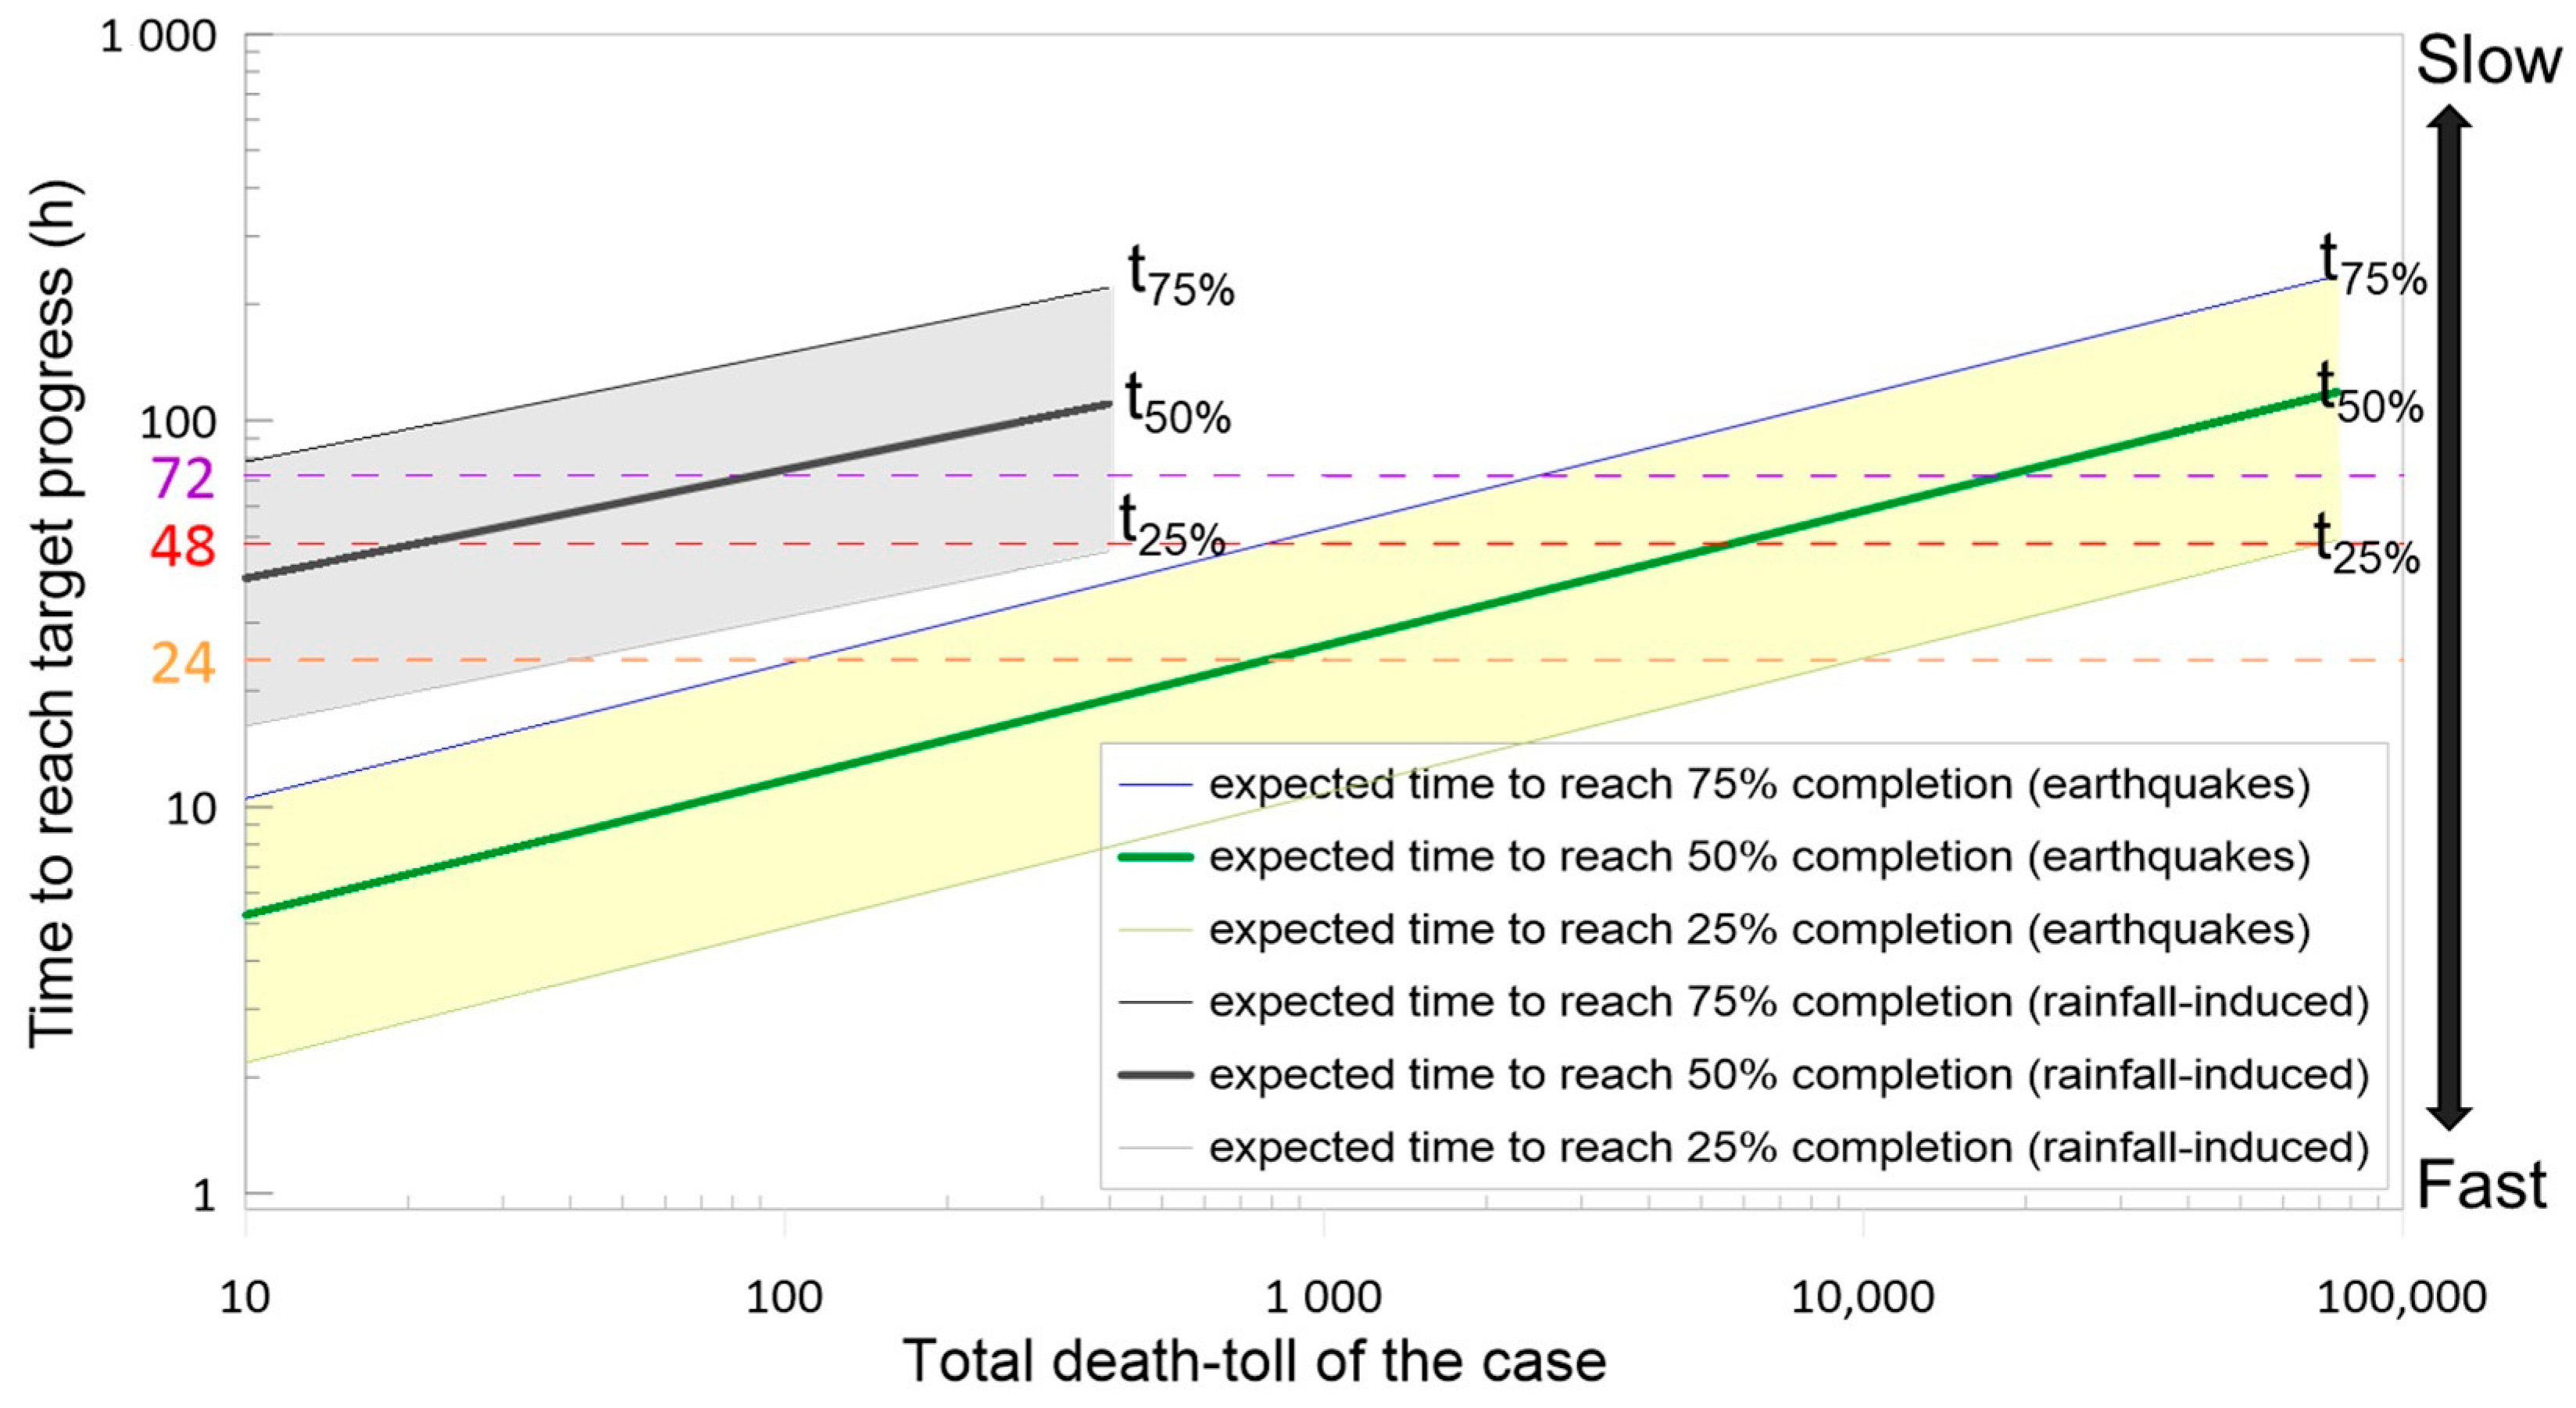
Taking earthquakes as an example, if X% in Equation (4a) is equivalent to 25%, 50%, or 75%, then, upon substituting the number of death tolls into NT, the time indicators of said 25%, 50%, and 75% can be obtained (Figure 6). If the practical time of the SAR work is shorter than the time indicator, the practical efficiency will be higher than expected. Inversely, if the practical time is longer, the practical efficiency will be lower than expected.
Time indicators are suitable for review after a disaster, while the other indicators are proposed to focus on the progress of the golden 72 h. Substituting t = 72 h into Equation (4a,b), as shown in Figure 7, illustrates the ideal completion ratio at 72 h. Following a similar procedure for the expected ratios at 24 and 48 h, progress indicators are also presented. When the death toll exceeds 10,000 people (for earthquake cases), theoretically, approximately 57% of the SAR work should be complete in 72 h; alternatively, when the death toll is approximately 200, theoretically, approximately 88% of the SAR work should be complete in 72 h.
The calculated time and progress indicators of rainfall-induced disasters are shown in Figure 6 and Figure 7, respectively. Comparing the two disasters shows that, under the same magnitude of death toll, rainfall-induced cases require 5–7-fold more time to reach the same progress seen for earthquake cases (as shown in Figure 6). The expected completion ratios at 24, 48, and 72 h for rainfall-induced cases are lower than those for earthquake cases, (e.g., for approximately 200 deaths, approximately 57% of the SAR work is expected to be complete for rainfall-induced cases, compared to the 88% for earthquake cases).
Progress indicators can be used not only for post-event review of whether the golden 72 h were fully utilized, but also to estimate the target progress during the golden rescue time after roughly determining the number of victims or deaths when a disaster occurs. In addition, it can be seen from Figure 7 that the golden 72 h may be too generous for earthquake cases with a low death toll. When the death toll is < 200, the SAR completion at 48 h nears 90%. Therefore, considering the loss of life of those trapped while injured, it is more appropriate to plan SAR work for most victims within 24–48 h for earthquake cases with a lower death toll.
5. Discussion
By applying data from 51 earthquakes (see Table 1) to Figure 6 and Figure 7, the SAR performance of each case could be determined, as shown in Figure 8 and Figure 9. Cases No. 43 (2018 Sulawesi, Indonesia) and No. 47 (2011 Honshu, Japan) had an obvious delay, as both of them triggered deadly tsunamis, affecting SAR operations and increasing the number of deaths. Among the events involving many casualties, tsunamis represented one of the secondary disasters with great impact on the SAR efficiency. In contrast, among cases with a higher death toll, the SAR efficiency of cases No. 42 (1999 Nantou, Taiwan) and No. 45 (2006 Java, Indonesia) was better than the rest, because these two cases were associated with mild secondary disasters. Statistical investigation of case No. 42 (1999 Nantou, Taiwan) shows that, within 24 h of the earthquake, fire rescue personnel spent 80–90% of their time undertaking earthquake rescue, with approximately 10% of their time devoted to the main accompanying disasters, e.g., fire disasters [22]. However, another case in Taiwan, i.e., No. 20 (2016 Tainan, Taiwan), showed inefficient results, with delays mainly occurring in the early stage. Referring to the scenes described in the media, local SAR personnel mentioned that the disaster relief team decided to manually break through upon the detection of life signals in one or two spots, but spent much more time than expected (i.e., requested 1 h but spent 10 h [18]), which explains the low efficiency. Additionally, in case No. 14 (2018 Hokkaido, Japan), 85% of the victims were buried by triggered collapses [23]; thus, this disaster may have similar characteristics in terms of SAR efficiency to rainfall-induced disasters (Figure 10). Case No. 49 (2003 Southeastern Iran) showed good efficiency in the early stage, but this worsened over time. According to Ibrion et al. [24,25], the SAR work organized by the government was slow, while the initial SAR was mostly executed by local residents [26]. Residents actively participated in the SAR work and mobilized community relief organizations, which is a major feature of emergency disaster management in developing countries [21]. Generally, Figure 8 and Figure 9 show similar functions and are consistent with the above case details; however, Figure 8 provides an efficiency assessment of the whole SAR process, while Figure 9 focuses on the first 24, 48, and 72 h, which are considered crucial for saving lives.
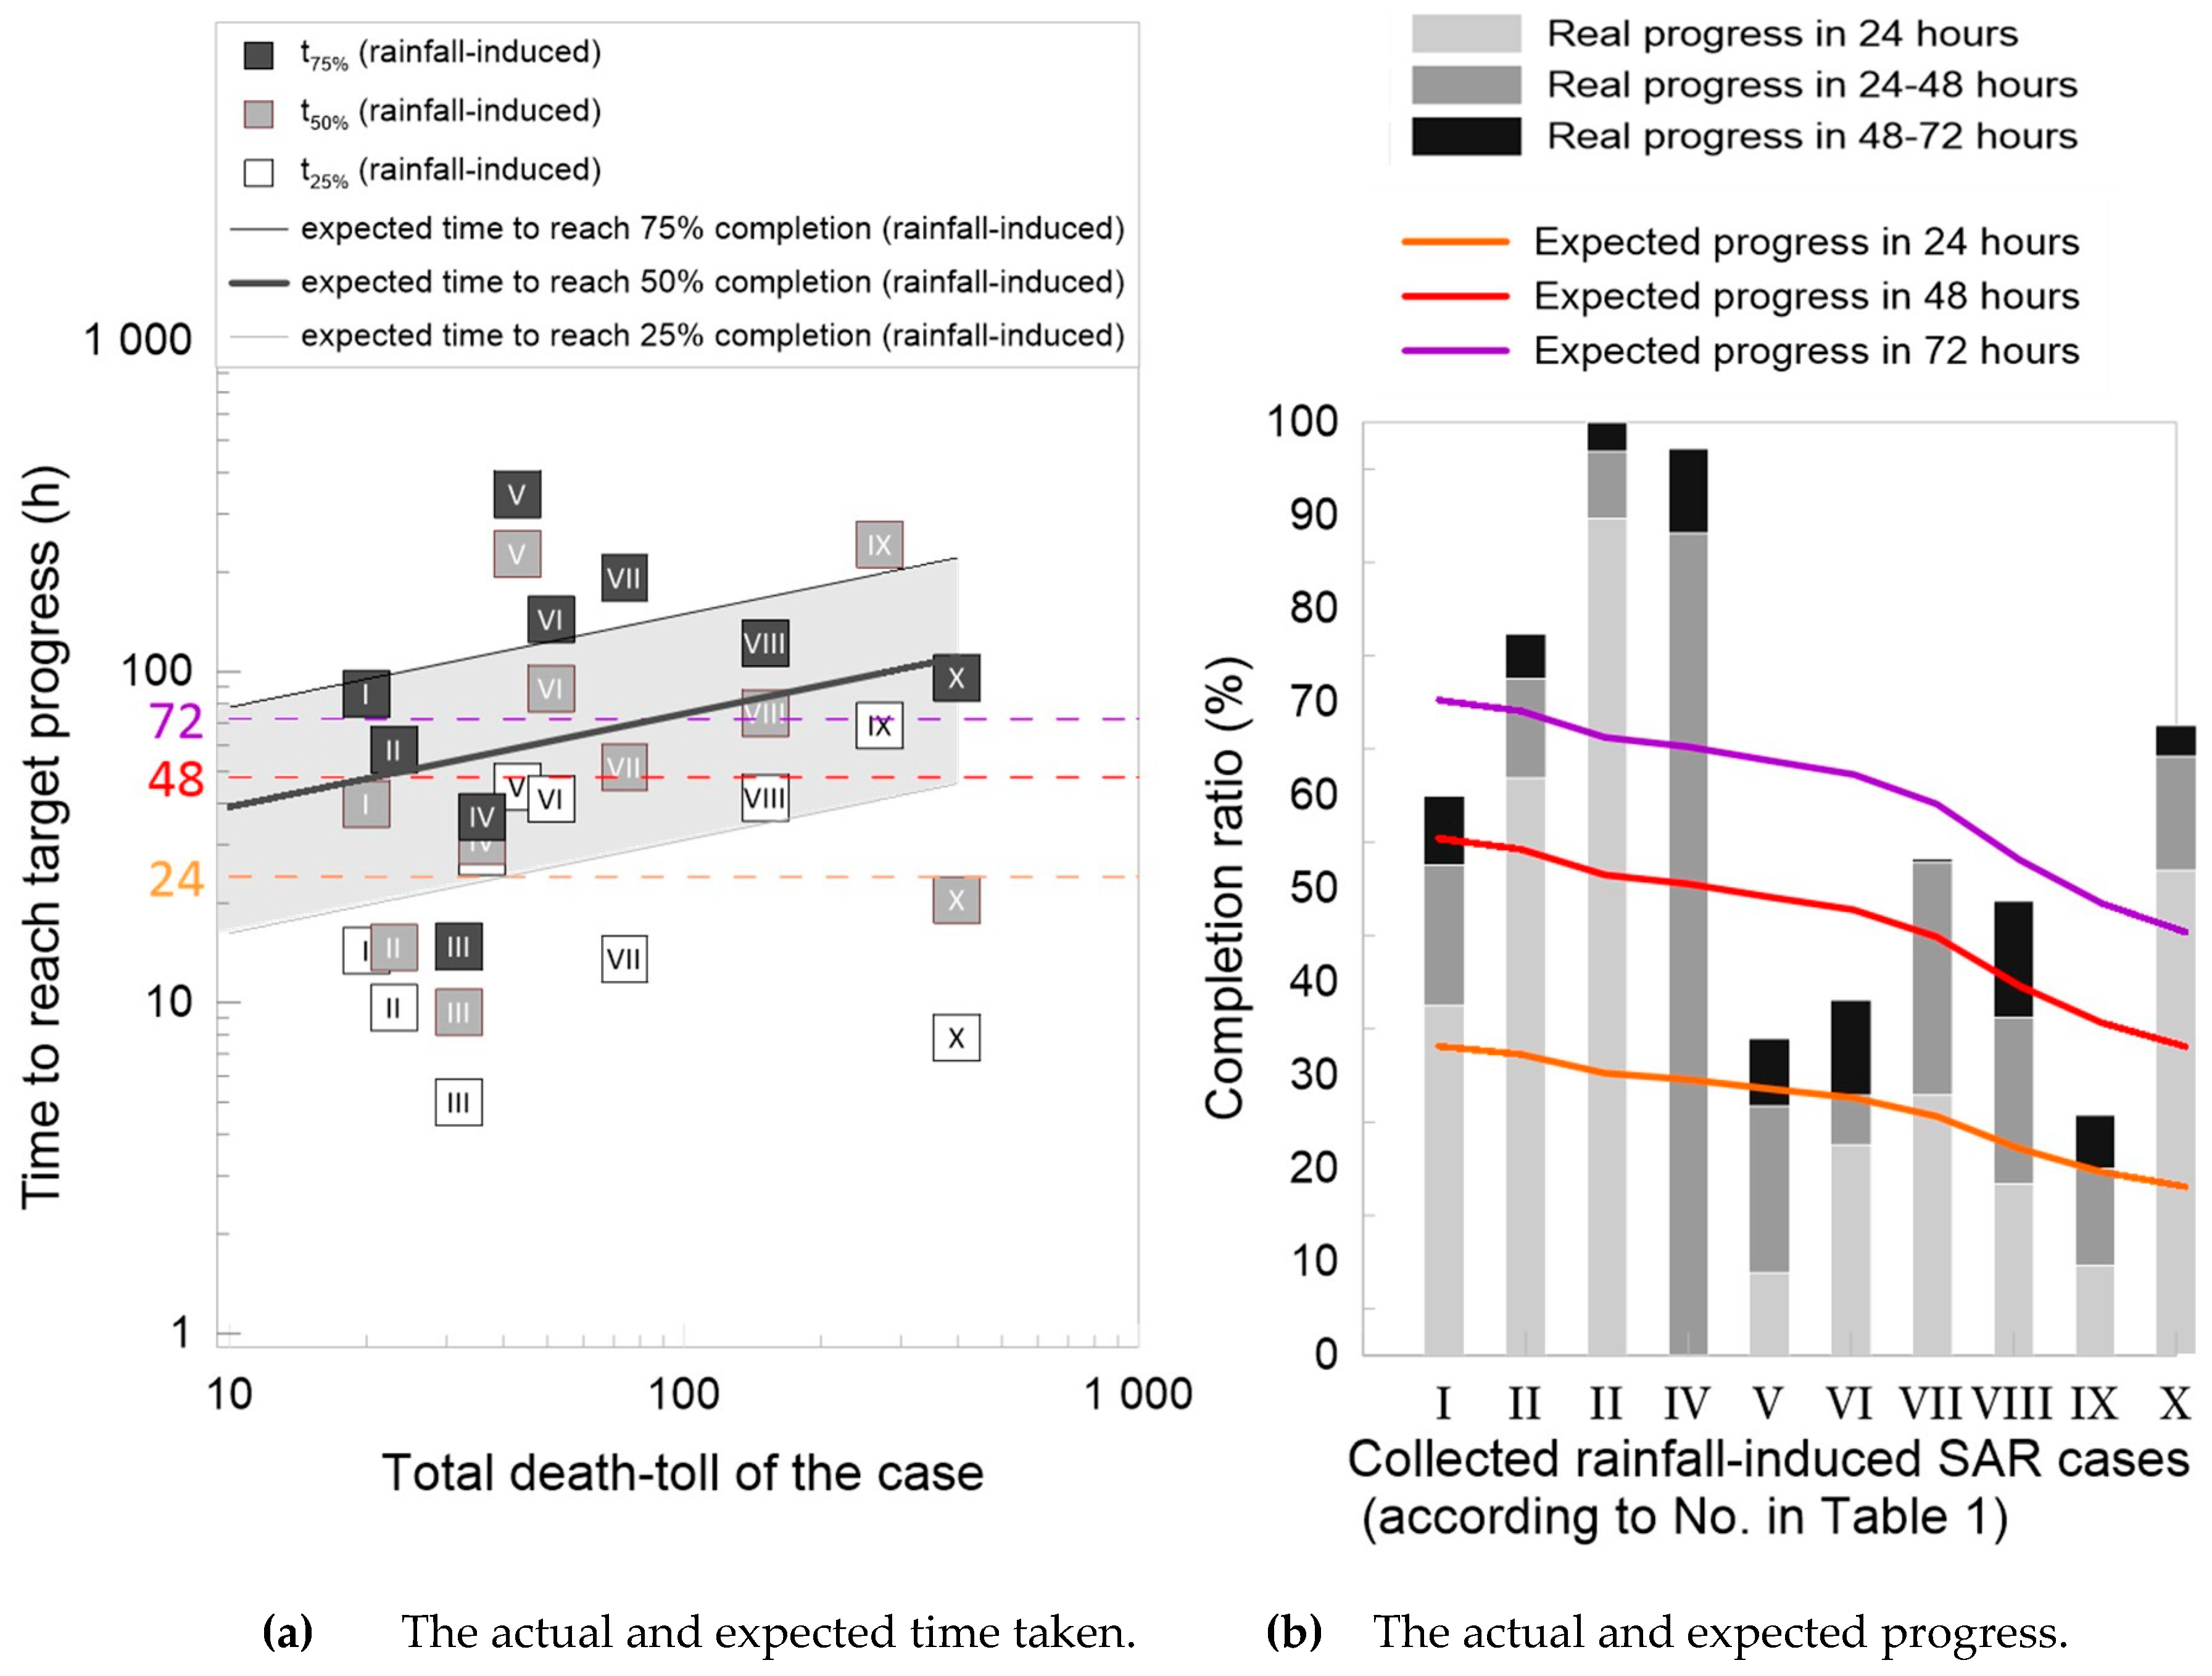
Following similar steps, Figure 10a,b was produced for rainfall-induced disasters. These cases lack details related to the SAR progress; hence, the results cannot be verified. However, it can be observed that the completion ratios were much lower than seen for earthquake cases having the same magnitude of death tolls. To further elaborate on the difference between these two kinds of disasters, Figure 11 is presented. Figure 11a presents cases of both disasters with fewer than 100 deaths, and Figure 11b presents cases with 100–1000 deaths. There can be seen a remarkable difference (in these figures) between the starting points of death curves for rainfall-induced disasters and earthquakes. Usually, the curves for earthquake disasters started after approximately 3 h on average, while those for rainfall-induced disasters started reporting casualties after approximately 10 h. It can also be seen in Figure 11 that the SAR time of rainfall-triggered disasters was longer than that of earthquake disasters. The low efficiency shown in Figure 10 and Figure 11 indicates the difficulty faced during relief operations following rainfall disasters. This can be attributed to challenges related to weather, communication, geographical location, and obstacles faced during SAR. The geographical locations of such disasters (usually adjacent to hillsides) and the persistent rainfall often cause the obstruction of traffic, thereby delaying the arrival of rescue teams. Large amounts of earth and stone need to be removed manually, causing more obstacles for rescue and lowering the SAR efficiency of such disasters.
It is worth noting that SAR work may be affected by many other factors and each SAR action is unique. However, the way in which to measure the influence of these factors was not the focus of this study. The presented indicators can only indicate the difference between the investigated case and the standard. Any differences would necessitate additional study, which would require more data and details for every scenario. This study was based on the principle of actively rescuing survivors and searching for the dead, while assuming that the treatment of survivors (including medical emergencies) complies with the basic principles of SAR work. If the SAR work is carried out only by nonactive means, such as death estimations, the results may not be consistent with the concept of this study. Different countries or regions may have different conventions of operation; however, this study covered earthquakes in 15 different countries and rainfall-induced disasters in six countries. In addition, the estimate of the total number of deaths has great influence on the calculation of the completion ratio and efficiency.
6. Conclusions
Rescue efficiency after a disaster is often the focus of many stakeholders; however, it is hard to quantify this efficiency, thereby resulting in SAR reviews typically being subjective. This study aimed to develop indicators that can provide standards for evaluating the speed of SAR work. This represents the first measure of efficiency for large-scale disasters using death tolls to denote progress. In total, 51 earthquakes and 10 rainfall-induced disasters were classified and grouped by the type of disaster and the magnitude of the death toll, and regression analysis was performed to obtain the time and progress indicators that could be used to assess SAR efficiency. Therefore, the main contribution of this study is the provision of quantitative indicators. Moreover, the reasons behind the differences between the actual efficiency and the expected efficiency of each SAR operation need further examination, with more details of the SAR work and the environmental conditions. By applying the presented indicators to the collected cases and discussing whether the results could be explained by the related literature, it was shown that, in high death toll cases, the severity of secondary disasters such as tsunamis has a great influence on SAR efficiency. Although previous studies highlighted the impacts of disasters such as tsunamis on SAR work, they could not quantitatively specify differences with theoretical values as in this study.
In comparing the magnitude of earthquakes and rainfall-induced disasters using cumulative curves, we found remarkably different characteristics. In the former, casualties were usually reported in approximately 3 h, while in the latter they were not reported until after approximately 10 h. This could be attributed to the weather, traffic, location, and difficulty faced when removing obstacles. The regression analysis showed that rainfall-induced disaster cases have a lower efficiency compared to earthquake disasters of the same magnitude. The results of this study show the value of progressive death tolls and the corresponding time. These indicators have the potential to be modified in the future if further details of SAR work in different scenarios (weather, terrain, environment, etc.) are revealed.
Author Contributions
Conceptualization, H.O.; data curation, Y.-Y.C.; investigation, H.-E.C.; methodology, Y.-Y.C., H.O., and S.-C.C.; supervision, S.-C.C.; writing—original draft, Y.-Y.C.; writing—review and editing, H.-E.C. and S.-C.C. All authors have read and agreed to the published version of the manuscript.
Funding
This research was funded by the Ministry of Science and Technology, Taiwan (MOST 109-2811-B-005-506).
Acknowledgments
We thank Ms. Ting-Yeh Wu for her assistant to the study and appreciate Samkele Tfwala and MDPI English Editing for language editing.
Conflicts of Interest
The authors declare no conflict of interest.
References
- Glade, T.; Alexander, D.E. Classification of natural disasters. In Encyclopedia of Natural Hazards; Bobrowsky, P.T., Ed.; Springer: Dordrecht, The Netherland, 2013. [Google Scholar]
- Ritchie, H.; Roser, M. Natural Disasters. Our World Data 2014. Available online: https://ourworldindata.org/natural-disasters (accessed on 2 September 2020).
- Foster, H.D. Assessing disaster magnitude: A social science approach. Prof. Geogr. 1976, 28, 241–247. [Google Scholar] [CrossRef]
- Keller, A.; Wilson, H.; Al-Madhari, A. Proposed disaster scale and associated model for calculating return periods for disasters of given magnitude. Disaster Prev. Manag. Int. J. 1992, 1. [Google Scholar] [CrossRef]
- Re, M. Topics Geo Annual Review: Natural Catastrophes 2005; Munich Reinsurance Group: Munich, Germany, 2006. [Google Scholar]
- Comfort, L.K. Self organization in disaster response: The Great Hanshin, Japan earthquake of January 17, 1995. In Self Organization in Disaster Response: The Great Hanshin, Japan Earthquake of January 17, 1995; US University of Colorado, Natural Hazards Center: Colorado, CO, USA, 1995. [Google Scholar]
- Jianguo, G. A Study on the Theory of Earthquake Emergency Rescue in China. South China J. Seismol. 2006, 1, 118–125. (In Chinese) [Google Scholar]
- Rodríguez, H.; Quarantelli, E.L.; Dynes, R.R.; Andersson, W.A.; Kennedy, P.A.; Ressler, E. Handbook of Disaster Research; Springer: Dordrecht, The Netherland, 2007; Volume 643. [Google Scholar]
- Quon, T.K.; Laube, J.A. Do faster rescues save more lives. Risk Anal. 1991, 11, 291–301. [Google Scholar] [CrossRef]
- Lien, Y.-N.; Jang, H.-C.; Tsai, T.-C. A MANET based emergency communication and information system for catastrophic natural disasters. In Proceedings of the 2009 29th IEEE International Conference on Distributed Computing Systems Workshops, Montreal, QC, Canada, 22–26 June 2009; IEEE: New York, NY, USA, 2009; pp. 412–417. [Google Scholar]
- Kunkle, R.F. Medical care of entrapped patients in confined spaces. In Proceedings of the International Workshop on Earthquake Injury Epidemiology: Implications for Mitigation and Response, Baltimore, MD, USA, 10–12 July 1989; pp. 338–344. [Google Scholar]
- Noji, E. Medical consequences of earthquakes: Coordinating medical and rescue response. Disaster Manag. 1991, 4, 32–40. [Google Scholar]
- Schweier, C. Geometry based estimation of trapped victims after earthquakes. In Proceedings of the International Symposium on Strong Vrancea Earthquakes and Risk Mitigation, Bucharest, Romania, 4–6 October 2007; pp. 4–6. [Google Scholar]
- Weber, M. Rural areas may suffer disproportionately in quakes. Temblor 2020. [Google Scholar] [CrossRef]
- Li, Y.; Wu, Z.; Zhao, Y. Estimating the number of casualties in earthquakes from early field reports and improving the estimate with time. Nat. Hazards 2011, 56, 699–708. [Google Scholar] [CrossRef]
- Tang, B.; Chen, Q.; Liu, X.; Liu, Z.; Liu, Y.; Dong, J.; Zhang, L. Rapid estimation of earthquake fatalities in China using an empirical regression method. Int. J. Disaster Risk Reduct. 2019, 41, 101306. [Google Scholar] [CrossRef]
- Wu, X.; Gu, J. A modified exponential model for reported death toll during earthquakes. Earthq. Sci. 2009, 22, 159–164. [Google Scholar] [CrossRef] [Green Version]
- Chou, L.L. Pulverizers Chewed off the Wall to Keep the Body Intact. China Times [Online], 14 February 2016. Available online: https://www.chinatimes.com/newspapers/20160214000222-260501?chdtv (accessed on 2 September 2020).
- NCEI National Geophysical Data Center/World Data Service (NGDC/WDS): NCEI/WDS Global Significant Earthquake Database. NOAA National Centers for Environmental Information. Available online: https://www.ngdc.noaa.gov/hazel/view/hazards/earthquake/search (accessed on 2 September 2020).
- EM-DAT, CRED/UCLouvain, Brussels, Belgium. Available online: http://www.emdat.be (accessed on 2 September 2020).
- Zhang, L. Modeling the Injury Flow and Treatment After Major Earthquakes; Springer: Dordrecht, The Netherland, 2016. [Google Scholar]
- Lin, Y.S.; Hsu, C.M.; Chou, Y.Z. Recognition Research on 921 Earthquake Disasters and Fire Rescue under Time Sequence. Public Adm. Policy 2003, 37, 1–27. [Google Scholar]
- Yamagishi, H.; Yamazaki, F. Landslides by the 2018 Hokkaido Iburi-Tobu Earthquake on September 6. Landslides 2018, 15, 2521–2524. [Google Scholar] [CrossRef] [Green Version]
- Ibrion, M.; Mokhtari, M.; Nadim, F. Earthquake disaster risk reduction in Iran: Lessons and “lessons learned” from three large earthquake disasters—Tabas 1978, Rudbar 1990, and Bam 2003. Int. J. Disaster Risk Sci. 2015, 6, 415–427. [Google Scholar] [CrossRef] [Green Version]
- Movahedi, H. Search, rescue, and care of the injured following the 2003 Bam, Iran, earthquake. Earthq. Spectra 2005, 21, 475–485. [Google Scholar] [CrossRef]
- Yang, J.; Chen, J.; Liu, H.; Zheng, J. Comparison of two large earthquakes in China: The 2008 Sichuan Wenchuan Earthquake and the 2013 Sichuan Lushan Earthquake. Nat. Hazards 2014, 73, 1127–1136. [Google Scholar] [CrossRef] [Green Version]
Figure 1.
Survival ratio of victims during earthquakes.

Figure 2.
Cumulative death toll curves for earthquake cases (51) and rainfall-induced cases (10).

Figure 3.
Completion-ratio curves for the reported death tolls: (a) earthquakes; (b) rainfall-induced disasters.
Figure 3.
Completion-ratio curves for the reported death tolls: (a) earthquakes; (b) rainfall-induced disasters.


Figure 4.
The time-related search and rescue (SAR) completion ratio and efficiency rate of each group.
Figure 4.
The time-related search and rescue (SAR) completion ratio and efficiency rate of each group.

Figure 5.
Relationship between coefficient and deaths.

Figure 6.
Time indicators of 25%, 50%, and 75% completion of SAR work for earthquakes and rainfall-induced disasters.
Figure 6.
Time indicators of 25%, 50%, and 75% completion of SAR work for earthquakes and rainfall-induced disasters.

Figure 7.
Progress indicators of SAR work at 24, 48, and 72 h for earthquakes and rainfall-induced disasters.
Figure 7.
Progress indicators of SAR work at 24, 48, and 72 h for earthquakes and rainfall-induced disasters.

Figure 8.
The expected and actual time taken in each SAR case.

Figure 9.
The actual and expected progress at 24, 48, and 72 h of each SAR case.

Figure 10.
The actual and expected time costs and progress for the collected rainfall-induced cases.
Figure 10.
The actual and expected time costs and progress for the collected rainfall-induced cases.

Figure 11.
Comparison between earthquake and rainfall-induced cases with the same magnitude of death toll as a function of the time of the first report.
Figure 11.
Comparison between earthquake and rainfall-induced cases with the same magnitude of death toll as a function of the time of the first report.


Table 1.
List of collected earthquake disasters.
| No. | Case Name | Year | Death Toll | Group |
|---|---|---|---|---|
| 1 | Nei Mongol, China | 2003 | 4 | A (< 100) |
| 2 | Gansu, China | 2003 | 9 | |
| 3 * | Central, Chile | 2015 | 15 | |
| 4 | Yanjin, China | 2006 | 22 | |
| 5 | Mansehra, Pakistan | 2004 | 24 | |
| 6 | Sichuan, China | 2017 | 25 | |
| 7 | Yunnan, China | 2011 | 25 | |
| 8 | Campobasso, Italy | 2002 | 29 | |
| 9 | Baku, Azerbaijan | 2000 | 31 | |
| 10 | Tehran, Iran | 2004 | 35 | |
| 11 | Honshu, Japan | 2004 | 40 | |
| 12 | Panzhihua, China | 2008 | 43 | |
| 13 | Afyon, Turkey | 2002 | 44 | |
| 14 | Hokkaido, Japan | 2018 | 44 | |
| 15 | Dorud, Iran | 2006 | 70 | |
| 16 | Yunnan, China | 2012 | 81 | |
| 17 | Gansu, China | 2013 | 94 | |
| 18 | Southern Peru | 2001 | 103 | B (100–1000) |
| 19 | Sumatra, Indonesia | 2000 | 103 | |
| 20 | Tainan, Taiwan | 2016 | 117 | |
| 21 | Hindu Kush, Afghanistan | 2002 | 166 | |
| 22 | Bingol, Turkey | 2003 | 177 | |
| 23 * | Christchurch, New Zealand | 2011 | 181 | |
| 24 | Longman, China | 2013 | 196 | |
| 25 | Xinjiang, China | 2003 | 261 | |
| 26 | Ab Garm, Iran | 2002 | 261 | |
| 27 | San Juan Tepezontes, El Salvador | 2001 | 315 | |
| 28 | Northern Rome, Italy | 2009 | 309 | |
| 29 | Yunnan, China | 1996 | 322 | |
| 30 | Hindu Kush, Afghanistan | 2015 | 399 | |
| 31 * | Ica, Peru | 2007 | 514 | |
| 32 | Kerman, Iran | 2005 | 612 | |
| 33 | Al Hoceima, Morocco | 2004 | 628 | |
| 34 | Ludian, China | 2014 | 615 | |
| 35 * | Java, Indonesia | 2006 | 802 | |
| 36 | San Miguel, El Salvador | 2001 | 844 | |
| 37 | Bolu, Turkey | 1999 | 894 | |
| 38 | Sumatra, Indonesia | 2009 | 1117 | C (1000–10,000) |
| 39 | Sumatra, Indonesia | 2005 | 1313 | |
| 40 | Yushu, China | 2010 | 2220 | |
| 41 | Algiers, Algeria | 2003 | 2266 | |
| 42 | Nantou, Taiwan | 1999 | 2297 | |
| 43 * | Sulawesi, Indonesia | 2018 | 3879 | |
| 44 | SW Honshu, Japan | 1995 | 5502 | |
| 45 | Java, Indonesia | 2006 | 5749 | |
| 46 | Kathmandu, Nepal | 2015 | 8200 | |
| 47 * | Honshu, Japan | 2011 | 18,434 | D (>10,000) |
| 48 | Izmit, Turkey | 1999 | 17,118 | |
| 49 | Southeastern Iran | 2003 | 43,000 | |
| 50 | Wenchuan, China | 2008 | 87,652 | |
| 51 * | Sumatra, Indonesia | 2004 | 227,899 |
* Triggered serious tsunami.
Table 2.
List of the collected rainfall-triggered disasters (including landslides, debris flow, and mudflow).
Table 2.
List of the collected rainfall-triggered disasters (including landslides, debris flow, and mudflow).
| No. | Case Name | Year | Death Tolls | Group |
|---|---|---|---|---|
| I | Shanxi, China | 2019 | 20 | E (<100) |
| II | California, United States of America (USA) | 2018 | 23 | |
| III | Cauca, Colombia | 2019 | 32 | |
| IV | Taining, China | 2016 | 36 | |
| V | Oso, USA | 2014 | 43 | |
| VI | Guizhou, China | 2019 | 51 | |
| VII | Hiroshima, Japan | 2014 | 74 | |
| VIII | Pune, India | 2014 | 151 | F (100–1000) |
| IX | Brazil Mining Dam | 2019 | 270 | |
| X | Mocoa, Colombia | 2017 | 399 |
© 2020 by the authors. Licensee MDPI, Basel, Switzerland. This article is an open access article distributed under the terms and conditions of the Creative Commons Attribution (CC BY) license (http://creativecommons.org/licenses/by/4.0/).
Share and Cite
MDPI and ACS Style
Chiu, Y.-Y.; Omura, H.; Chen, H.-E.; Chen, S.-C. Indicators for Post-Disaster Search and Rescue Efficiency Developed Using Progressive Death Tolls. Sustainability 2020, 12, 8262. https://0-doi-org.brum.beds.ac.uk/10.3390/su12198262
AMA Style
Chiu Y-Y, Omura H, Chen H-E, Chen S-C. Indicators for Post-Disaster Search and Rescue Efficiency Developed Using Progressive Death Tolls. Sustainability. 2020; 12(19):8262. https://0-doi-org.brum.beds.ac.uk/10.3390/su12198262
Chicago/Turabian StyleChiu, Yen-Yu, Hiroshi Omura, Hung-En Chen, and Su-Chin Chen. 2020. "Indicators for Post-Disaster Search and Rescue Efficiency Developed Using Progressive Death Tolls" Sustainability 12, no. 19: 8262. https://0-doi-org.brum.beds.ac.uk/10.3390/su12198262
Note that from the first issue of 2016, this journal uses article numbers instead of page numbers. See further details here.