Recurring Patterns and Blueprints of Industrial Symbioses as Structural Units for an IT Tool


1
Institute of Environmental Communication, Leuphana University Lüneburg, Universitätsallee 1, 21335 Lüneburg, Germany
2
Industrial Environmental Informatics Unit, Department Engineering-Technology and Life, Hochschule für Technik und Wirtschaft (HTW) Berlin, University of Applied Science, Treskowallee 8, 10318 Berlin, Germany
*
Author to whom correspondence should be addressed.
Sustainability 2020, 12(19), 8280; https://0-doi-org.brum.beds.ac.uk/10.3390/su12198280
Submission received: 23 August 2020
/
Revised: 24 September 2020
/
Accepted: 28 September 2020
/
Published: 8 October 2020
Abstract
:Industrial Symbiosis (IS) deals with the set-up of advanced circular/cascading systems, in which the energy and material flows are prolonged for multiple material and energetic (re-)utilization within industrial systems. To facilitate the technology-enabling environment of IS systems, this work deals with the identification of recurring patterns in IS systems of specific IS case studies and deduction of elementary blueprints and structural units, setting an initial cornerstone to pool and synthesize existing IS knowledge and to deploy this knowledge base in an Information Technology (IT)-supported IS tool, which would remarkably advance the scope of action and development of IS systems. An explorative cross-case analysis was conducted by investigating 80 IS case studies in depth in order to illuminate recurring (key) patterns in IS systems by generalizing and abstracting IS main structures, compositions, resource exchange activities and measures. It has been shown that similar IS sectoral partnerships and resource exchanges have recurrently formed in different regions and hence, generalizable patterns can be deduced. This study identified common IS compositions, sector clusters and key/core/anchor entities and synthesized a content basis for a database of an IS resource exchange catalog based on existing/available IS information, which can be used in an IT-supported IS tool. It contains information of specific IS resource exchanges, broken down by industrial sectors, differentiating providing and receiving sectors and which respective exchanged waste flows were processed into which secondary material/product. Once this fundamental information/data base is incorporated and applied in an IT-supported IS tool, it enables the facilitated recommendation of potential IS partners and IS actions to optimize existing IS cases or to initiate IS development. Especially, first IS germ cells of (key) entities can be derived and connected to each other considering individual circumstances and (geographical) business environments.
1. Introduction
Today’s era is called “the Anthropocene” [1], as human activities have become the main driver of global change. Global challenges such as climate change, increasing freshwater consumption, chemical pollution [2] and limited resource availability have emerged and triggered social, governmental and economic activities. In order to stay within the planetary boundaries [2], ecosystem functioning and services to human societies need to be maintained in a safe operating range. These complex and partly interdependent challenges need to be approached in an appropriate and comprehensively sophisticated way to meet the multi-faceted perspectives of sustainable development. This encompasses, among other things, fields of action for reduction of wastes, emissions, primary resource and energy consumption. So circularity and resource efficiency measures are emerging priorities on the European Union (EU) policy agenda [3].
One of the application concepts in industrial contexts is Industrial Symbiosis (IS), which deals with the set-up of advanced circular/cascading systems, in which the energy and material flows are prolonged for multiple material and energetic (re-)utilization within industrial systems. IS is a collaborative cross-sectoral approach to connect compatible resource input and output flows of production systems across different companies in order to optimize the resource use through exchanges of material, energy, water (and non-material exchanges such as human resources and joint management processes), while generating ecological, technical, social and economic beneficial synergies [4,5,6].
Beside the economic motivation of companies (e.g., cost savings), especially environmental regulations are considered to be pushing forces for companies to increase/improve their environmental performances and to become involved in IS systems [7,8]. But several hindering factors for companies to develop IS measures have been recognized, among others, there is a general lack of awareness of IS concepts [7,8,9], a lack of knowledge of IS possibilities, a lack of information sharing among locators [7,9], a lack of an institutional support for integration, coordination and communication, a lack of technology and infrastructure readiness [7] and difficulties in reaching agreements [8] and reaching fair cost/benefit allocation among the entities.
When it comes to practical implementation/initiation processes of IS, inter-organizational communication and information exchange is crucial [9,10]. Ref. [11] examined 17 IS tools in their study, whereat most of them are either inoperative or not publicly available today. Most of the investigated IS tools focus on output-input matchings of various resource flows among industrial actors, functionality and technical opportunities, but do not provide comprehensive decision support [11]. Ref. [12] studied 20 European IS supporting information technology tools and pointed out, that the newer IT tools developed in Europe considered the improvement potentials identified by [11]. Nevertheless, [12] stated, that “matchmaking tools and assessment methodologies hold the most promise for innovation for academia, IT tool developers and the facilitators of industrial symbiosis”. All investigated tools focus on the as-is analysis of the IS system and the identification of IS measures. However, possible future scenarios as well as conceivable transformation paths from the actual state to the desired target vision (e.g., zero waste park) are not addressed at all and represent a substantial research and knowledge gap.
To date, many research studies were conducted to investigate various IS systems and to gain knowledge about IS opportunities and (initiation and operating) mechanisms, but as [13] pointed out, there are difficulties to extract and process useful information from the extensive available sources of data and knowledge. Especially companies still struggle to retrieve easy-to-understand information [14] and to integrate current IS knowledge into business processes [15]. All the mentioned observations have driven the current work, which aims to facilitate the technology-enabling environment for IS initiation, management and continuous improvement as a mean to exhaustively exploit IS potentials for leveraging sustainable industrial development and to provide easy-to-use business support to industrial actors and to increase user friendliness and IS adoption in industrial systems, because the barriers of inter alia lack of knowledge of IS possibilities, a lack of information sharing among companies are significantly lowered. This study is embedded in an overarching project, addressing the development of a holistic Information Technology (IT)-supported IS tool covering an information exchange platform among industrial actors, system analysis (identification of IS potentials via quantitative methods such as Material Flow Analysis), transformation simulation (e.g., dynamic supply-demand match makings within an IS system) and sustainability goal-setting [16]. As inter-company information exchange is crucial to identify and implement IS opportunities [9,10,17,18,19], the proposed IT-supported IS tool shall provide companies with easy-to-understand, structured and specific information as well as specific recommendations for actions regarding potential IS activities to business users. Within this project an IS expert system, which is to be integrated into the IT-supported IS tool [16] and a hybrid-approach of agent-based modelling (ABM) and Reinforcement learning (Machine Learning technique) for simulating the dynamics of IS systems [20] are being developed. An expert system is a computer program that derives recommendations for action from a knowledge/data base like a human expert [21]. ABM deals with computer-aided modelling and simulation of (inter-/re-)actions of autonomous agents (which represent individuals or collective entities/groups) in order to assess their effects on the entire system [22].
So this foundation work is needed, on the one hand, to apply existing knowledge/data base to the expert system which enables the recommendation of IS activities, facilitating input-output/supply-demand matchings and further IS potentials in the specific area under consideration, and on the other hand, to derive suitable rule definitions for the virtual agents of the hybrid-ABM to interact properly and to converge to possible scenarios of goal-defined states of IS systems (e.g., “zero-waste IS parks”). To facilitate the technology-enabling environment of IS systems, this work deals with the identification of recurring patterns in IS systems of specific IS case studies and deduction of elementary blueprints and structural units of IS systems, setting an initial cornerstone to pool and synthesize existing IS knowledge and to deploy this knowledge base in an IT-supported IS tool, which would remarkably advance the scope of action and development of IS systems.
2. Methods
This research focus to approach answers of the research question (RQ): Which recurring patterns can be identified in existing Industrial Symbiosis systems and which elementary blueprints and structural units can be deduced for the deployment in an IT-supported tool? Therefore, an explorative cross-case analysis was conducted by investigating 80 IS case studies in depth (see full list in Table 1) in order to illuminate recurring (key) patterns in IS systems by generalizing and abstracting IS main structures, compositions, resource exchange activities and measures.
For each case study, the following information is extracted in the form of an exploration and evaluation matrix:
- IS main structures and compositions:
- Participating sector-specific entities: were documented for the investigation of recurring composition patterns in IS systems in order to identify repetitious cooperating IS industries (specific IS sector clusters) for the facilitated recommendation of potential IS partners and blueprint-IS network constellations.
- IS key/core/anchor entities: were detected based on the identified IS sector clusters.
- IS structures: and characteristics, attributes and causations were abstracted in order to break down elementary IS archetype formations, which can be used to build structural IS systems.
- IS activities and measures:
- Material, energy, (waste) water, knowledge and utility exchanges: The different exchange types and their relative occurrence are identified. Material exchanges were defined as material, solid waste, by-product and residual flows which were exchanged between at least two entities. Energy exchanges were defined as all energy flows between at least two entities covering thermal, steam, (process/waste) water for heating or cooling reasons, power/electricity, (bio-)gas, (bio-)fuel flows. (Waste) water exchanges were defined as all (process/waste) water flows which were used as secondary raw material or process water in another entity. Knowledge exchanges were defined as all coordinated information, data and knowledge/expertise sharing between at least two entities through for example an organizational (network) unit, third party consultancy or an (IT-supported) information system. Utility sharing was defined as shared infrastructure and services which are operated/organized jointly, e.g., joint management of procurement and disposal/recycling processes, kindergarten, cafeteria.
Common IS resource exchanges: mapping of compatible output-input flows in order to synthesize an IS resource exchange catalog for the facilitated recommendation of blueprint IS resource flow connections and measures in an IT-supported IS tool.
Case studies were selected with the non-probability sampling technique of purposive sampling.
Purposive sampling, also known as selective sampling, was chosen to be able to draw theoretical, analytic and logical generalizations from the sample of IS case studies [23]. As a purposive sampling technique, the maximum variation sampling, also known as heterogeneous sampling, was applied in order to cover a diverse set of IS case studies and clusters as well as a wide range of IS system attributes concerning structure/composition and resource exchange activities, enabling the investigation and identification of common and recurring IS patterns across the sample case [23]. Therefore, it was ensured to collect case studies from different authors, publication periods and geographical regions, whereas each location-based case study was explicitly considered once. Case studies were chosen once they provided detailed descriptions of the investigated IS system concerning composition of the involved entities, exchanged resources and their respective connectivities (including papers presenting feasible/potential/suggested, planned and implemented IS measures, whereat most of the analyzed case studies are operational IS systems). The initial sample size of 80 case studies was predetermined by the authors. Among them are 46 case studies provided by the IS database Total Resource and Energy Efficiency Management System for Process Industries (MAESTRI), a library of IS case studies and linked exchanges, which contains 424 reported IS exchanges [24]. The entire dataset sums up to 617 IS resource exchanges. The processes of qualitative data collection and analysis were conducted simultaneously.
Publications were sourced from the following databases such as ResearchGate, google scholar, Scopus, Thomson Reuters Web of Knowledge, CORE, Semantic Scholar and Directory of Open Access Journals. The queries searched the following terms “industrial symbiosis” and “(smart/eco) industrial park”. Only publications in English and German were included in the study due to reasons of language comprehension.
The gathered qualitative and categorical data were analyzed and visualized with RStudio (RStudio is an open source tool for data science and statistical analysis and visualization (https://rstudio.com/)), using the following R packages: library(networkD3), library(igraph), library(reshape2), library(readxl), library(ggplot2), library(ggpubr), library(tm), library(tau), library(plyr), library(dplyr), library(readr), library(plotly). The balloon plot of Figure 1 (visualizing multivariate categorical data), the network plots (Publicly available online: https://www.codementor.io/@jhwatts2010/counting-words-with-r-ds35hzgmj) of Figure 2 and 4 and the radar plot (Publicly available online: https://www.codementor.io/@jhwatts2010/counting-words-with-r-ds35hzgmj) of Figure 3 were implemented with publicly available R codes which were adapted to the dataset. The IS network clusters were developed by mapping respective Nomenclature of Economic Activities (NACE) (Full list of NACE codes: http://www.export.gov.il/files/EEN/ListNACEcodes.pdf) codes to a source and target edge-list (a two-column matrix defined by start and end vertices).

Table 1.
List of analyzed case studies (alphabetically sorted by regions and IS/Eco-Industrial Park (EIP) names).
Table 1.
List of analyzed case studies (alphabetically sorted by regions and IS/Eco-Industrial Park (EIP) names).
| Nr. | References | IS/EIP Name | Region of IS System |
|---|---|---|---|
| 1 | [25] | Heavy Industrial District Gladstone | Australia |
| 2 | [26] | Kwinana Industrial Park | Australia |
| 3 | [27] | Ecopark Hartberg | Austria |
| 4 | [28] | Waste disposal network Styria | Austria |
| 5 | [29] | Industrial Symbiosis Cluster Koekhoven | Belgium |
| 6 | [30] | Norte Fluminense industrial area | Brazil |
| 7 | [31] | Steelmaking, Cement Manufacturing, Zinc Smelting Cluster | Brazil |
| 8 | [32] | Burnside Industrial Park | Canada |
| 9 | [33] | Beijiang Power Plant Complex | China |
| 10 | [34] | Circuit board industry in Suzhou New District | China |
| 11 | [35] | Guitang Group | China |
| 12 | [19] | Gujiao Eco-Industrial Park | China |
| 13 | [36] | Hai Hua Industrial Symbiosis | China |
| 14 | [37] | Harbin Yingbin Eco-Industrial Park | China |
| 15 | [38] | Hazardous waste symbiosis network | China |
| 16 | [39] | Iron and steel industrial Park in Gansu | China |
| 17 | [40] | Jinan City | China |
| 18 | [41] | Liuzhou City | China |
| 19 | [42] | Lubei National Eco-industrial Demonstration Park | China |
| 20 | [43] | Midong | China |
| 21 | [44] | Nanning Sugar Co. Ltd. | China |
| 22 | [45] | Qijiang Industrial Park | China |
| 23 | [46] | Rizhao Economic and Technology Development Area | China |
| 24 | [47] | Shenyang Economic and Technological Development Zone | China |
| 25 | [48] | Smeltery | China |
| 26 | [42] | Suzhou Industrial Park | China |
| 27 | [49] | Tianjin Economic & Technical Development Area (TEDA) | China |
| 28 | [50] | Yongcheng | China |
| 29 | [51] | Sustainable Industrial Network Program (SINP) | Colombia |
| 30 | [52] | Industrial Area of Aalborg | Denmark |
| 31 | [53] | Kalundborg | Denmark |
| 32 | [54] | Monfort Boys Town Integrated Biosystem | Fiji |
| 33 | [5] | Kymi Mill in Kouvola | Finland |
| 34 | [55] | Pulp and paper mill on the river Kymijoki in Kuusankoski | Finland |
| 35 | [56] | Rantasalmi Eco-industrial Park | Finland |
| 36 | [57] | Uimaharju | Finland |
| 37 | [58] | Harjavalta industrial eco park | Finland |
| 38 | [59] | Dunkirk | France |
| 39 | [60] | Industrial Symbiosis in an Industrial zone | France |
| 40 | [28] | Recycling Network Ruhr Area | Germany |
| 41 | [28] | Waste disposal network Emden-Dollart Port | Germany |
| 42 | [61] | Nea Karvali | Greece |
| 43 | [6] | Mysuru | India |
| 44 | [62] | Business cluster in Mysore in the State of Karnataka | India |
| 45 | [63] | Cement Industry | Indonesia |
| 46 | [64] | Halmahera Eco-Industrial Estate | Indonesia |
| 47 | [65] | Abruzzo Region - Bussi Chemical Site (BCS) | Italy |
| 48 | [66] | Agro-Food context of IS in L‘Aquila | Italy |
| 49 | [66] | Automotive context of IS in Chieti | Italy |
| 50 | [67] | Tanneries in S. Croce sull´Arno | Italy |
| 51 | [68] | Taranto industrial district | Italy |
| 52 | [69] | Waste Electrical and Electronic Equipment (WEEE) cluster | Italy |
| 53 | [70] | Eco-Town Kawasaki | Japan |
| 54 | [71] | Tanegashima | Japan |
| 55 | [72] | Three major polluting industries | Mauritius |
| 56 | [59] | Altamira-Tampico industrial corridor | Mexico |
| 57 | [73] | Eco-Industrial Park in Mongstad | Norway |
| 58 | [74] | Hayatabad Industrial Estate | Pakistan |
| 59 | [75] | Reguengos de Monsaraz Industrial Symbiosis Network | Portugal |
| 60 | [76] | Relvão Eco Industrial Park | Portugal |
| 61 | [77] | Barceloneta | Puerto Rico |
| 62 | [77] | Guayama Industrial Symbiosis | Puerto Rico |
| 63 | [78] | Ten IS systems | several |
| 64 | [79] | Food Waste Industrial Symbiosis Network | Singapore |
| 65 | [80] | Ulsan Eco-Industrial Park | South Korea |
| 66 | [81] | Forssjö | Sweden |
| 67 | [82] | Händelö | Sweden |
| 68 | [56] | Jämtland | Sweden |
| 69 | [83] | Landskrona Industrial Symbiosis | Sweden |
| 70 | [81] | Mönsterås | Sweden |
| 71 | [84] | Norrköping | Sweden |
| 72 | [85] | Sotenäs IS network | Sweden |
| 73 | [81] | Värö | Sweden |
| 74 | [86] | Ecosite Geneva | Switzerland |
| 75 | [87] | Iskenderun Bay | Turkey |
| 76 | [88] | Humber Region Industrial Symbiosis Programme (HISP) | United Kingdom |
| 77 | [88] | West Midlands Industrial Symbiosis Programme (WISP) | United Kingdom |
| 78 | [89] | By-Product Synergy Central Gulf Coast Project | USA |
| 79 | [90] | Food Cycling in New Haven | USA |
| 80 | [91] | General Motors | USA |
3. Results
3.1. Patterns in Industrial Symbiosis Structures and Compositions
3.1.1. Industrial Symbiosis Compositions, Clusters and Key Entities
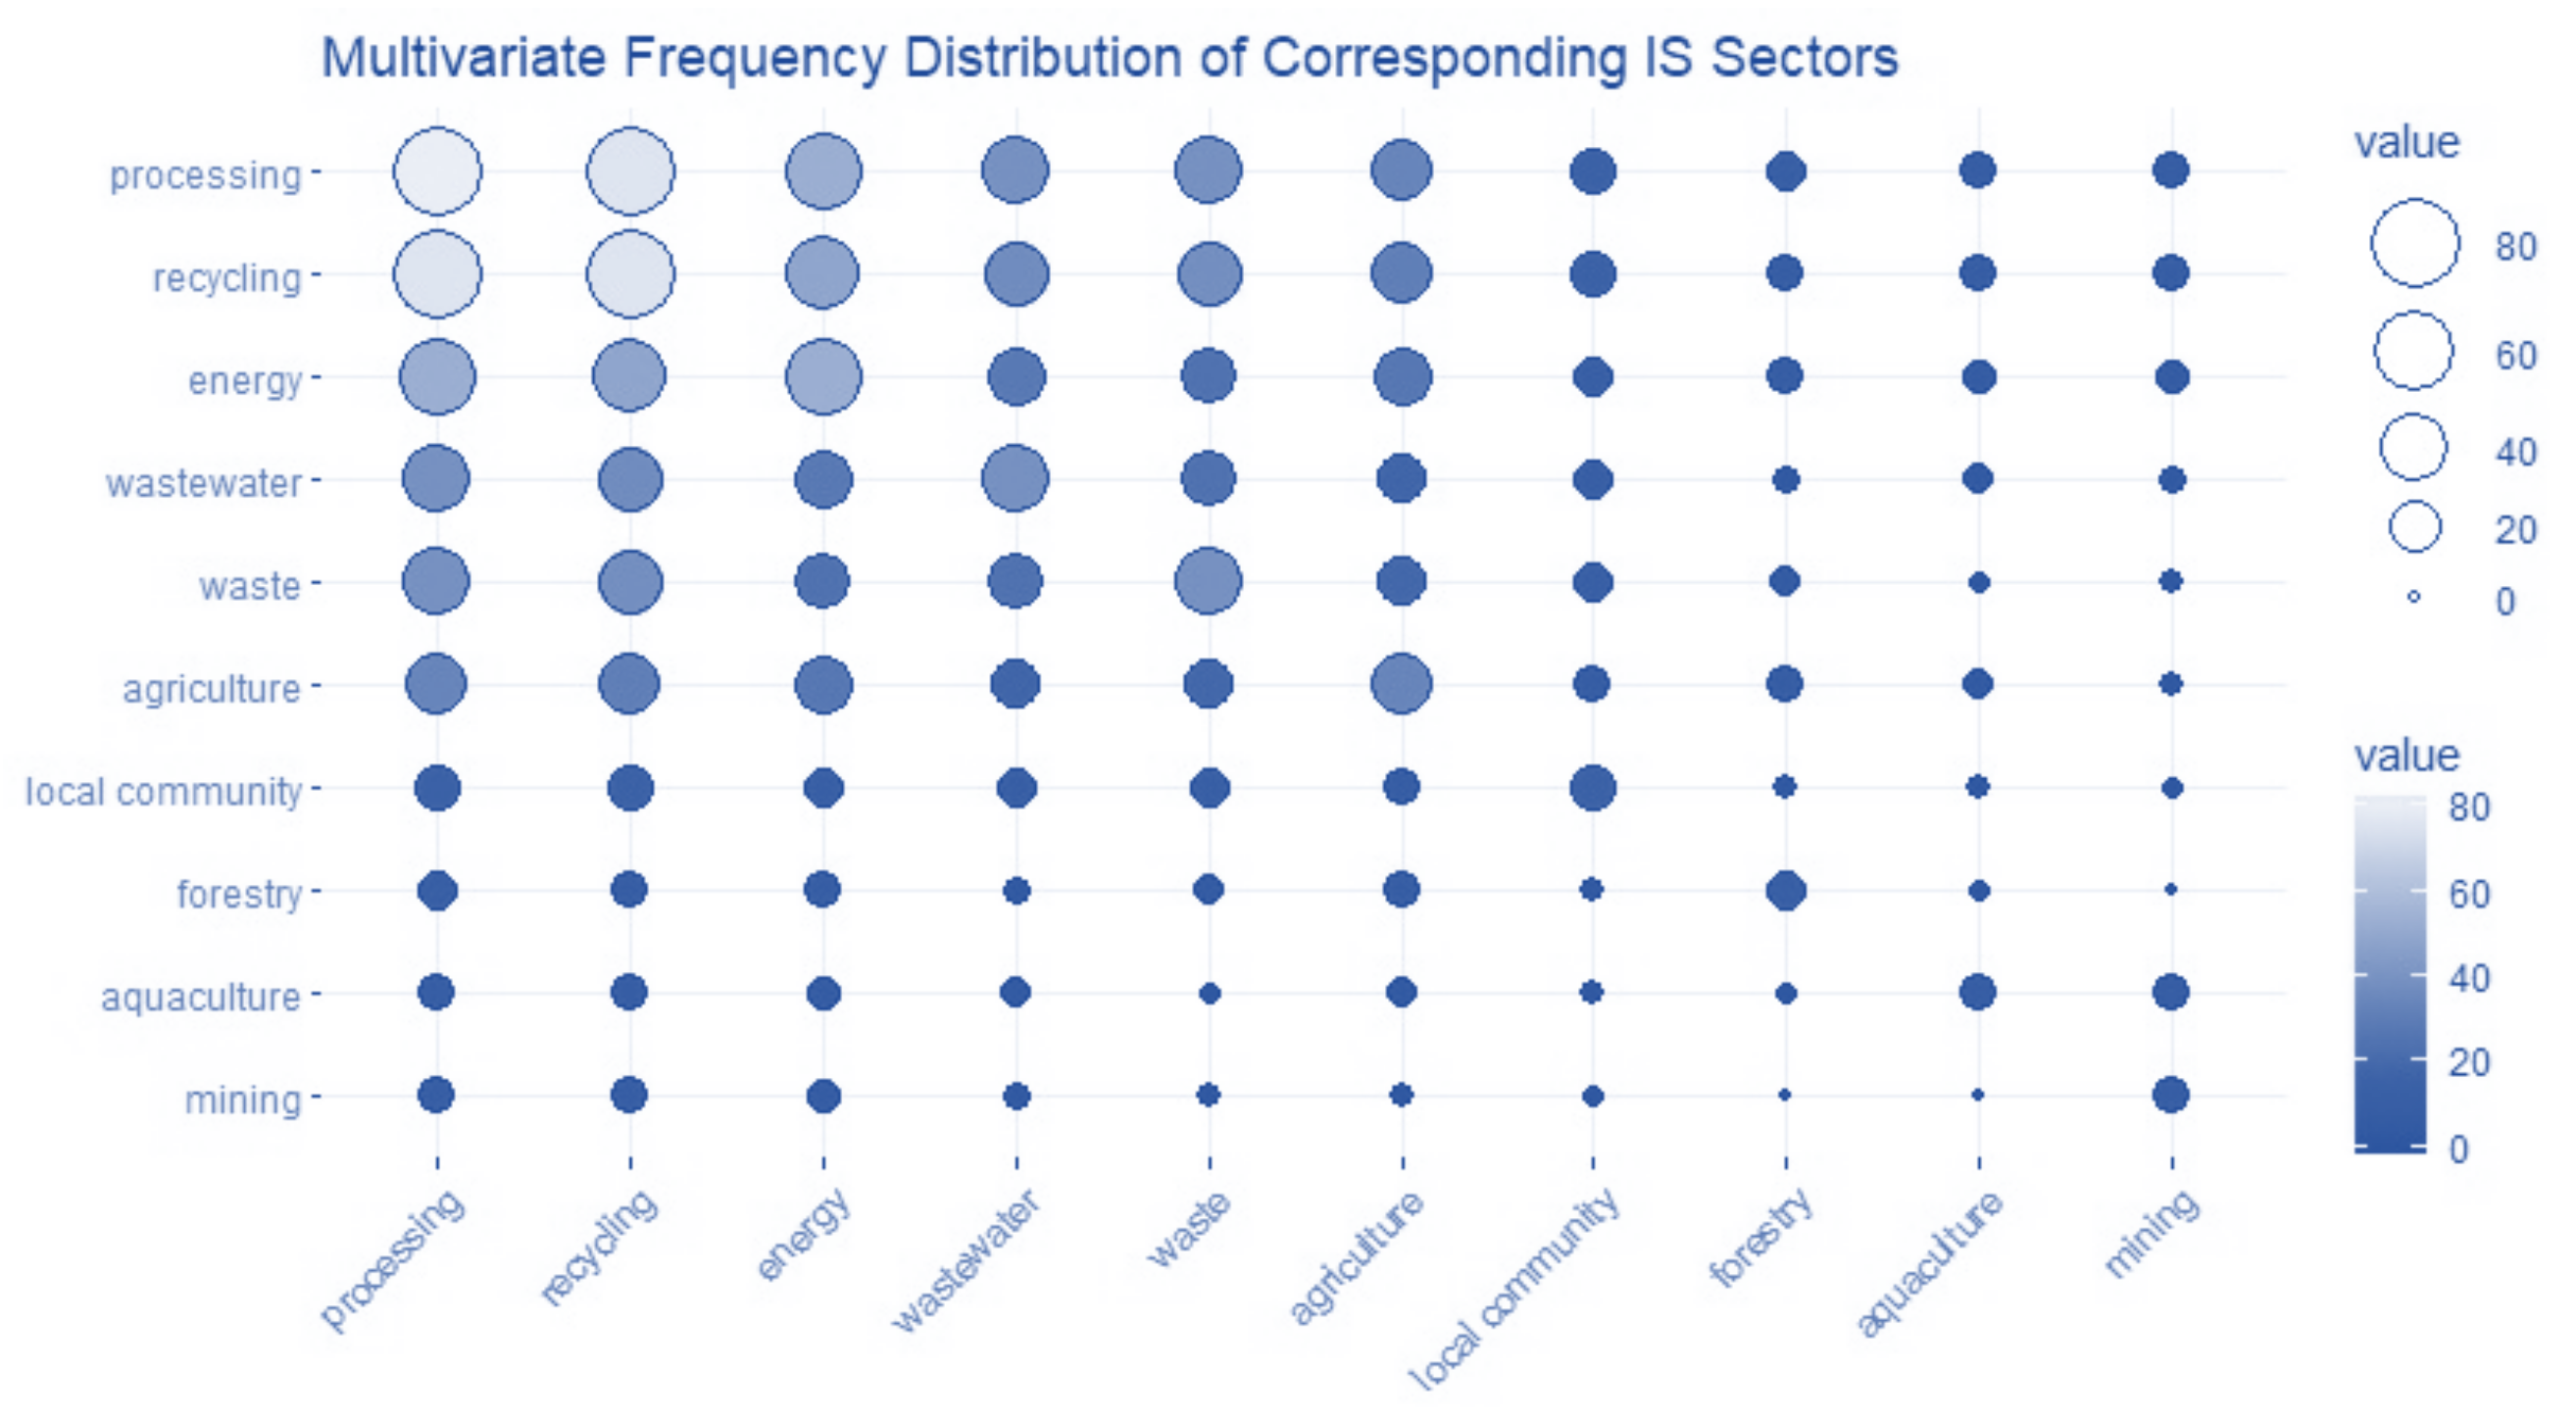
The cross-case analysis revealed recurring (key) patterns in existing IS systems concerning IS structures, compositions/clusters and resource exchanges. The multivariate frequency distribution in Figure 1 shows the occurrence of corresponding IS sectors in the investigated 80 case studies. In all 80 case studies were processing and manufacturing entities present, in 76 cases recycling and recovering entities, in 53 energy producing entities, in 39 wastewater treatment entities, in 39 waste treatment entities, in 34 agricultural entities, in 15 urban/local entities, in 10 forestry entities, in 9 aquacultural entities and in 9 cases mining entities were involved. The first quarter top left shows the main industry clusters that participate together in IS systems. It points out the fundamental functioning of an IS system, which mimics the essential mechanisms of ecological resource metabolisms, covering producers (e.g., primary resource extraction/production, agriculture, energy industries), primary/secondary/n consumers (e.g., processing and manufacturing industries) and destruents/remineralizers (e.g., water and resource recycling).
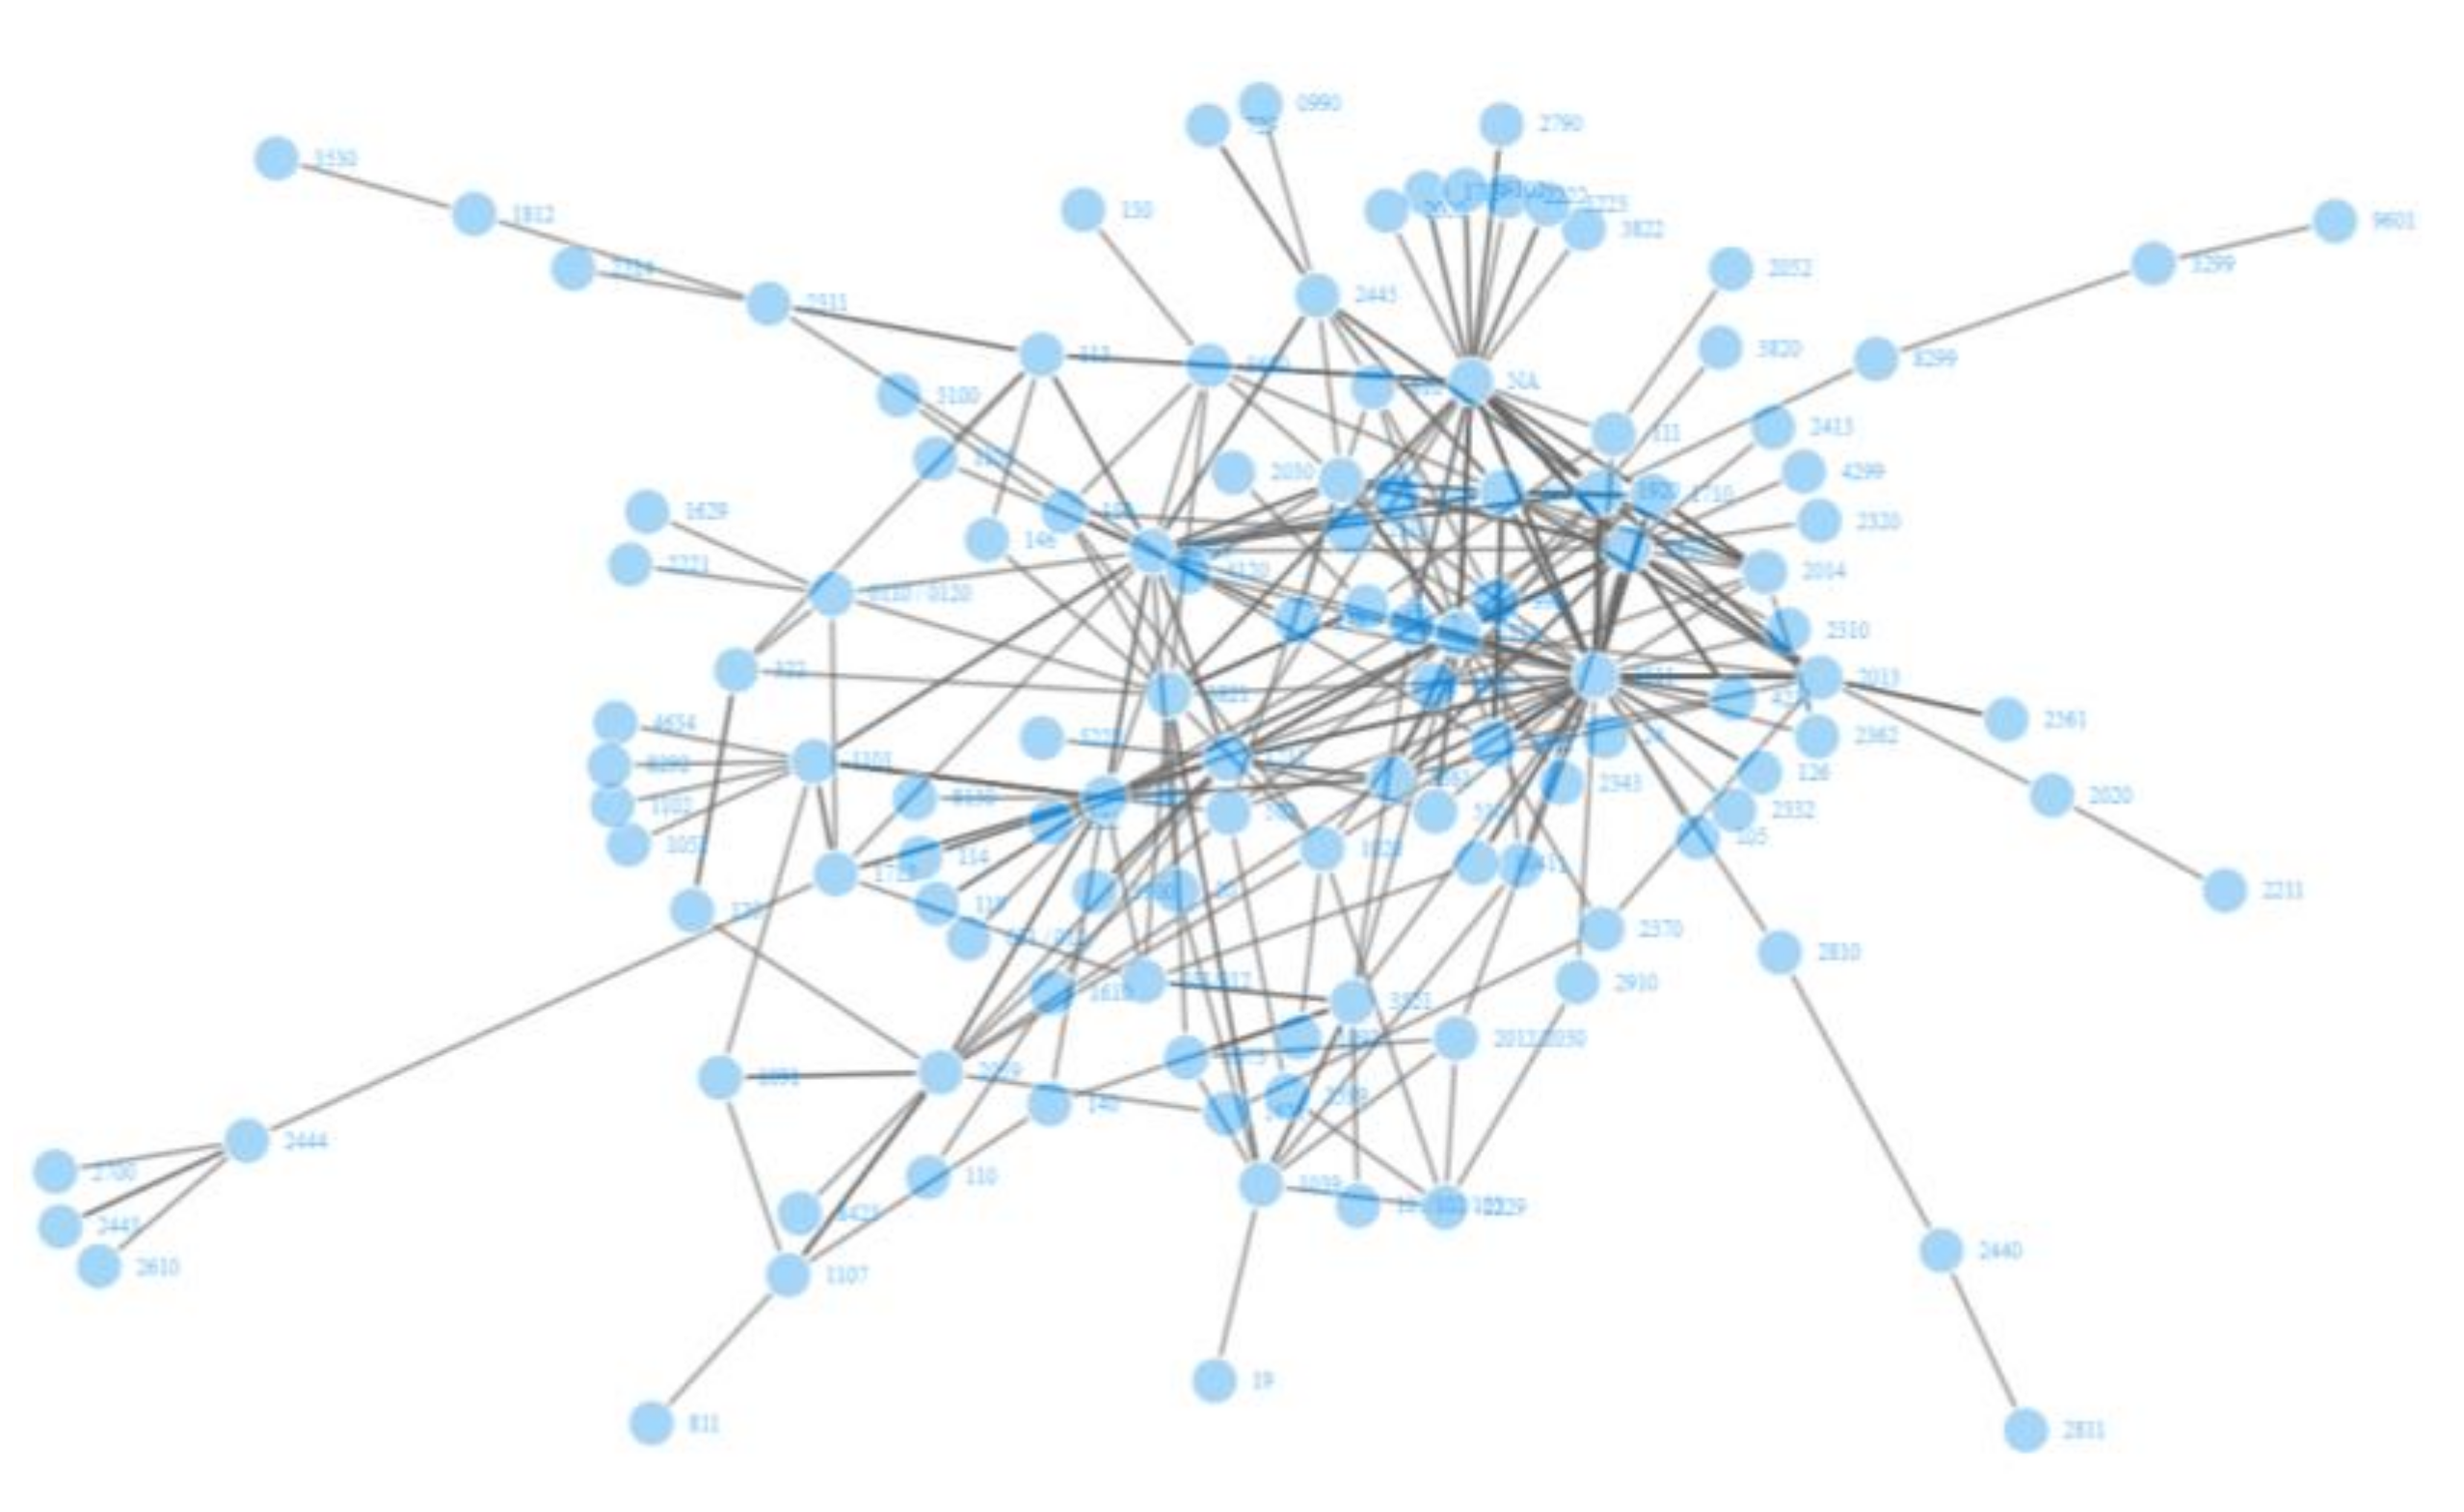
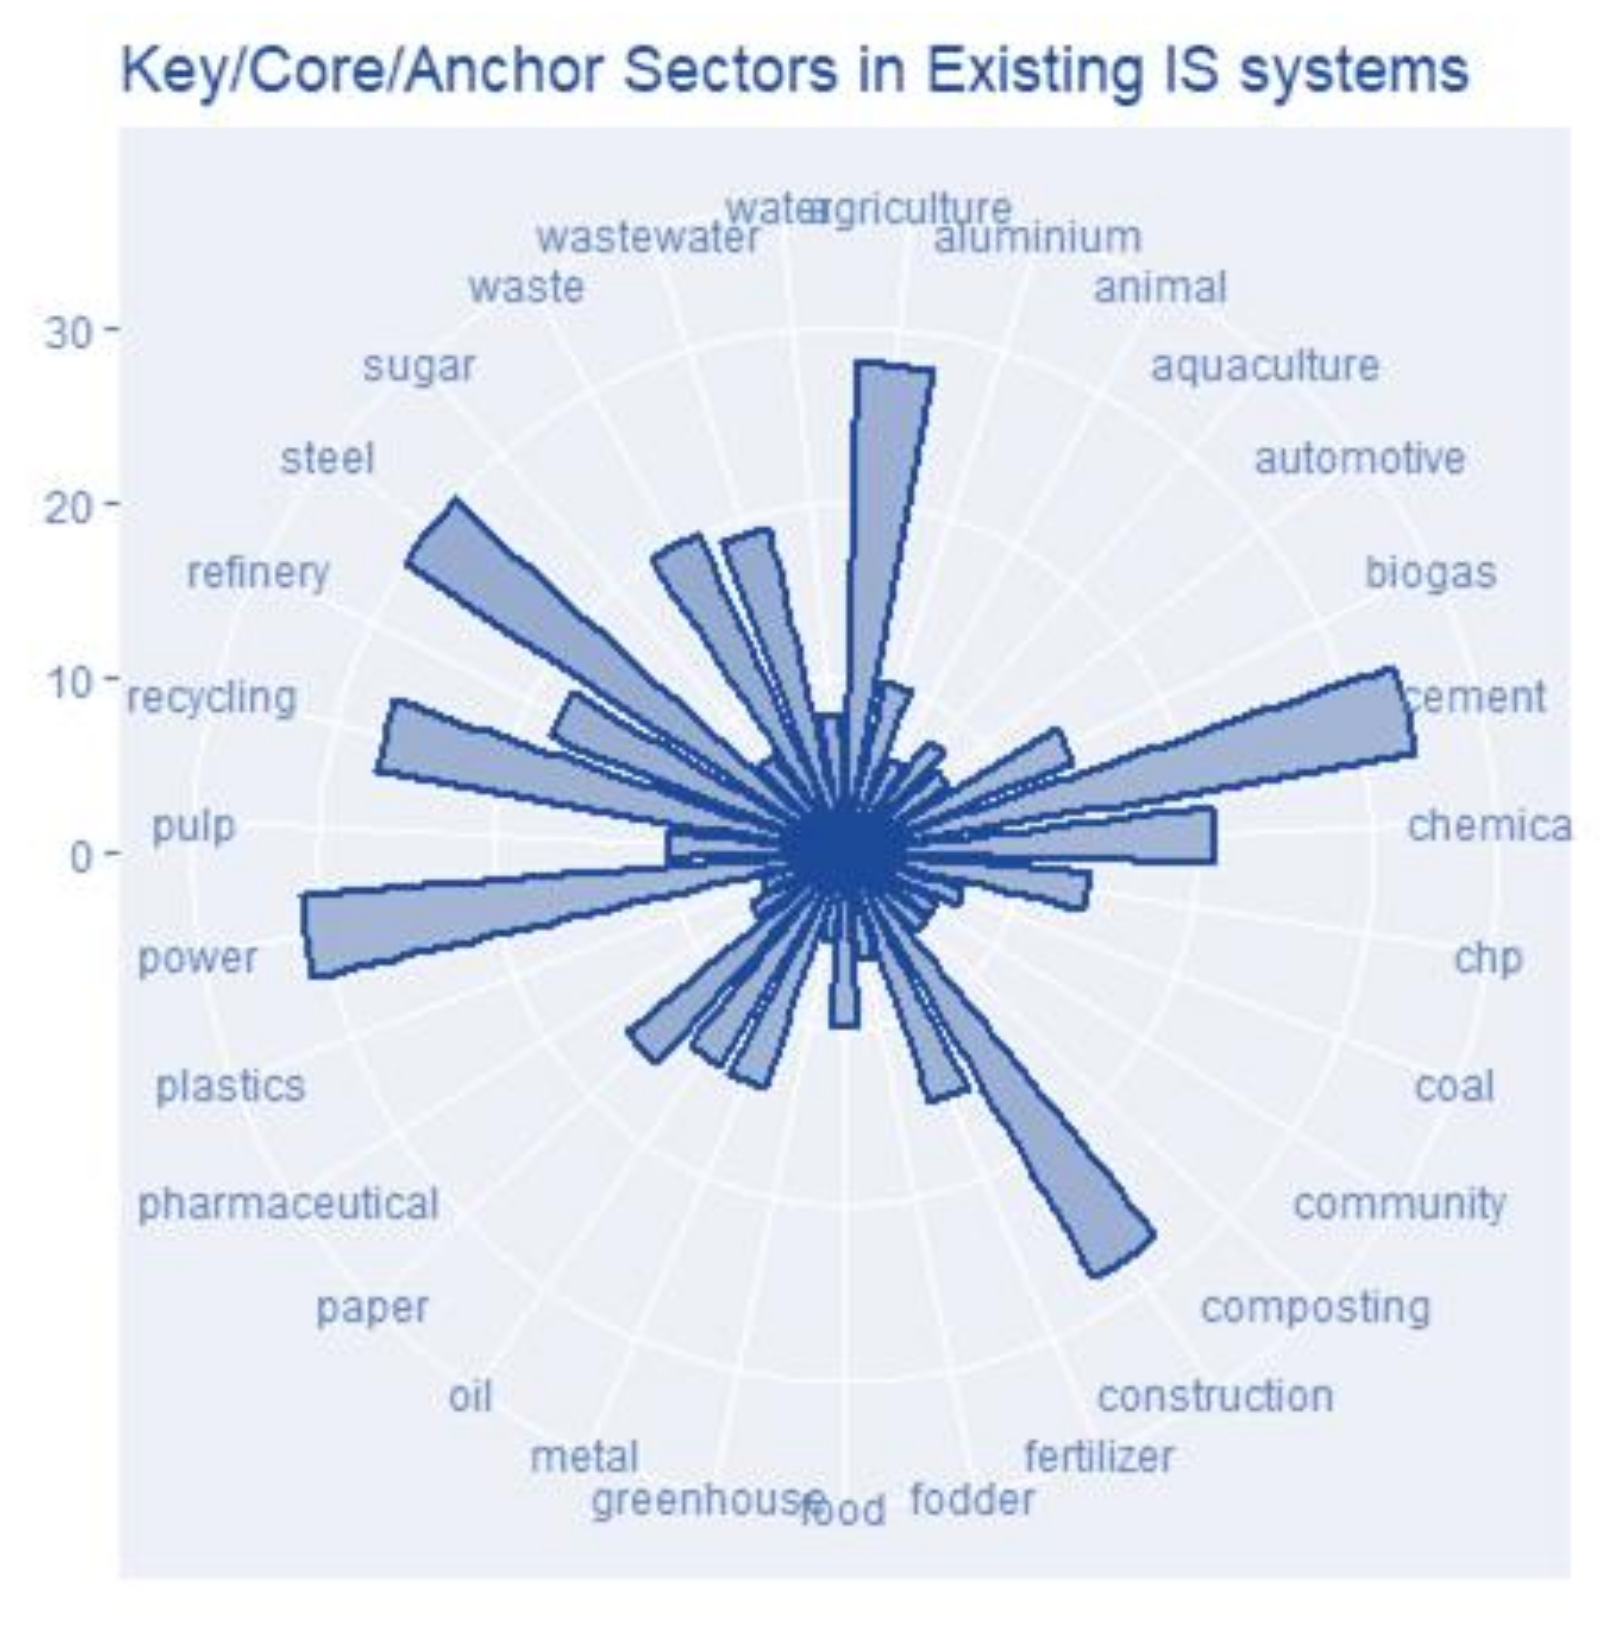
Each entity in an IS system can act as an originator/provider and/or receiver of IS resource exchanges. Having analyzed 617 IS resource exchanges with their respective providing and receiving sectors, the following network diagram resulted (Figure 2). It appears to be very interconnected and to have a core center of multiple anchor entities/sectors with multilateral connections to associated entities/sectors in the periphery. Based on the underlying dataset, this indicates that there are several (key) clusters and sectors in IS systems, which strongly function as key connections between different IS cluster networks. Together with Figure 3, it is shored up that predominantly the key sectors comprise:
- NACE code 0110: Growing of non-perennial crops,
- NACE code 1020: Processing and preserving of fish, crustaceans and mollusks,
- NACE code 1081: Manufacture of sugar,
- NACE code 1101: Distilling, rectifying and blending of spirits,
- NACE code 1710: Manufacture of pulp, paper and paperboard,
- NACE code 1920: Manufacture of refined petroleum products,
- NACE code 2015: Manufacture of fertilizers and nitrogen compounds,
- NACE code 2059: Manufacture of other chemical products,
- NACE code 2351: Manufacture of cement,
- NACE code 2410: Manufacture of basic iron and steel and of ferro-alloys,
- NACE code 3511: Production of electricity,
- NACE code 3521: Manufacture of gas,
- NACE code 3821: Treatment and disposal of non-hazardous waste,
- NACE code 4120: Construction of residential and non-residential buildings,
- NACE code 4211: Construction of roads and motorways,
- NACE code NA: urban entities.
This results are close to congruent to the findings of [14].
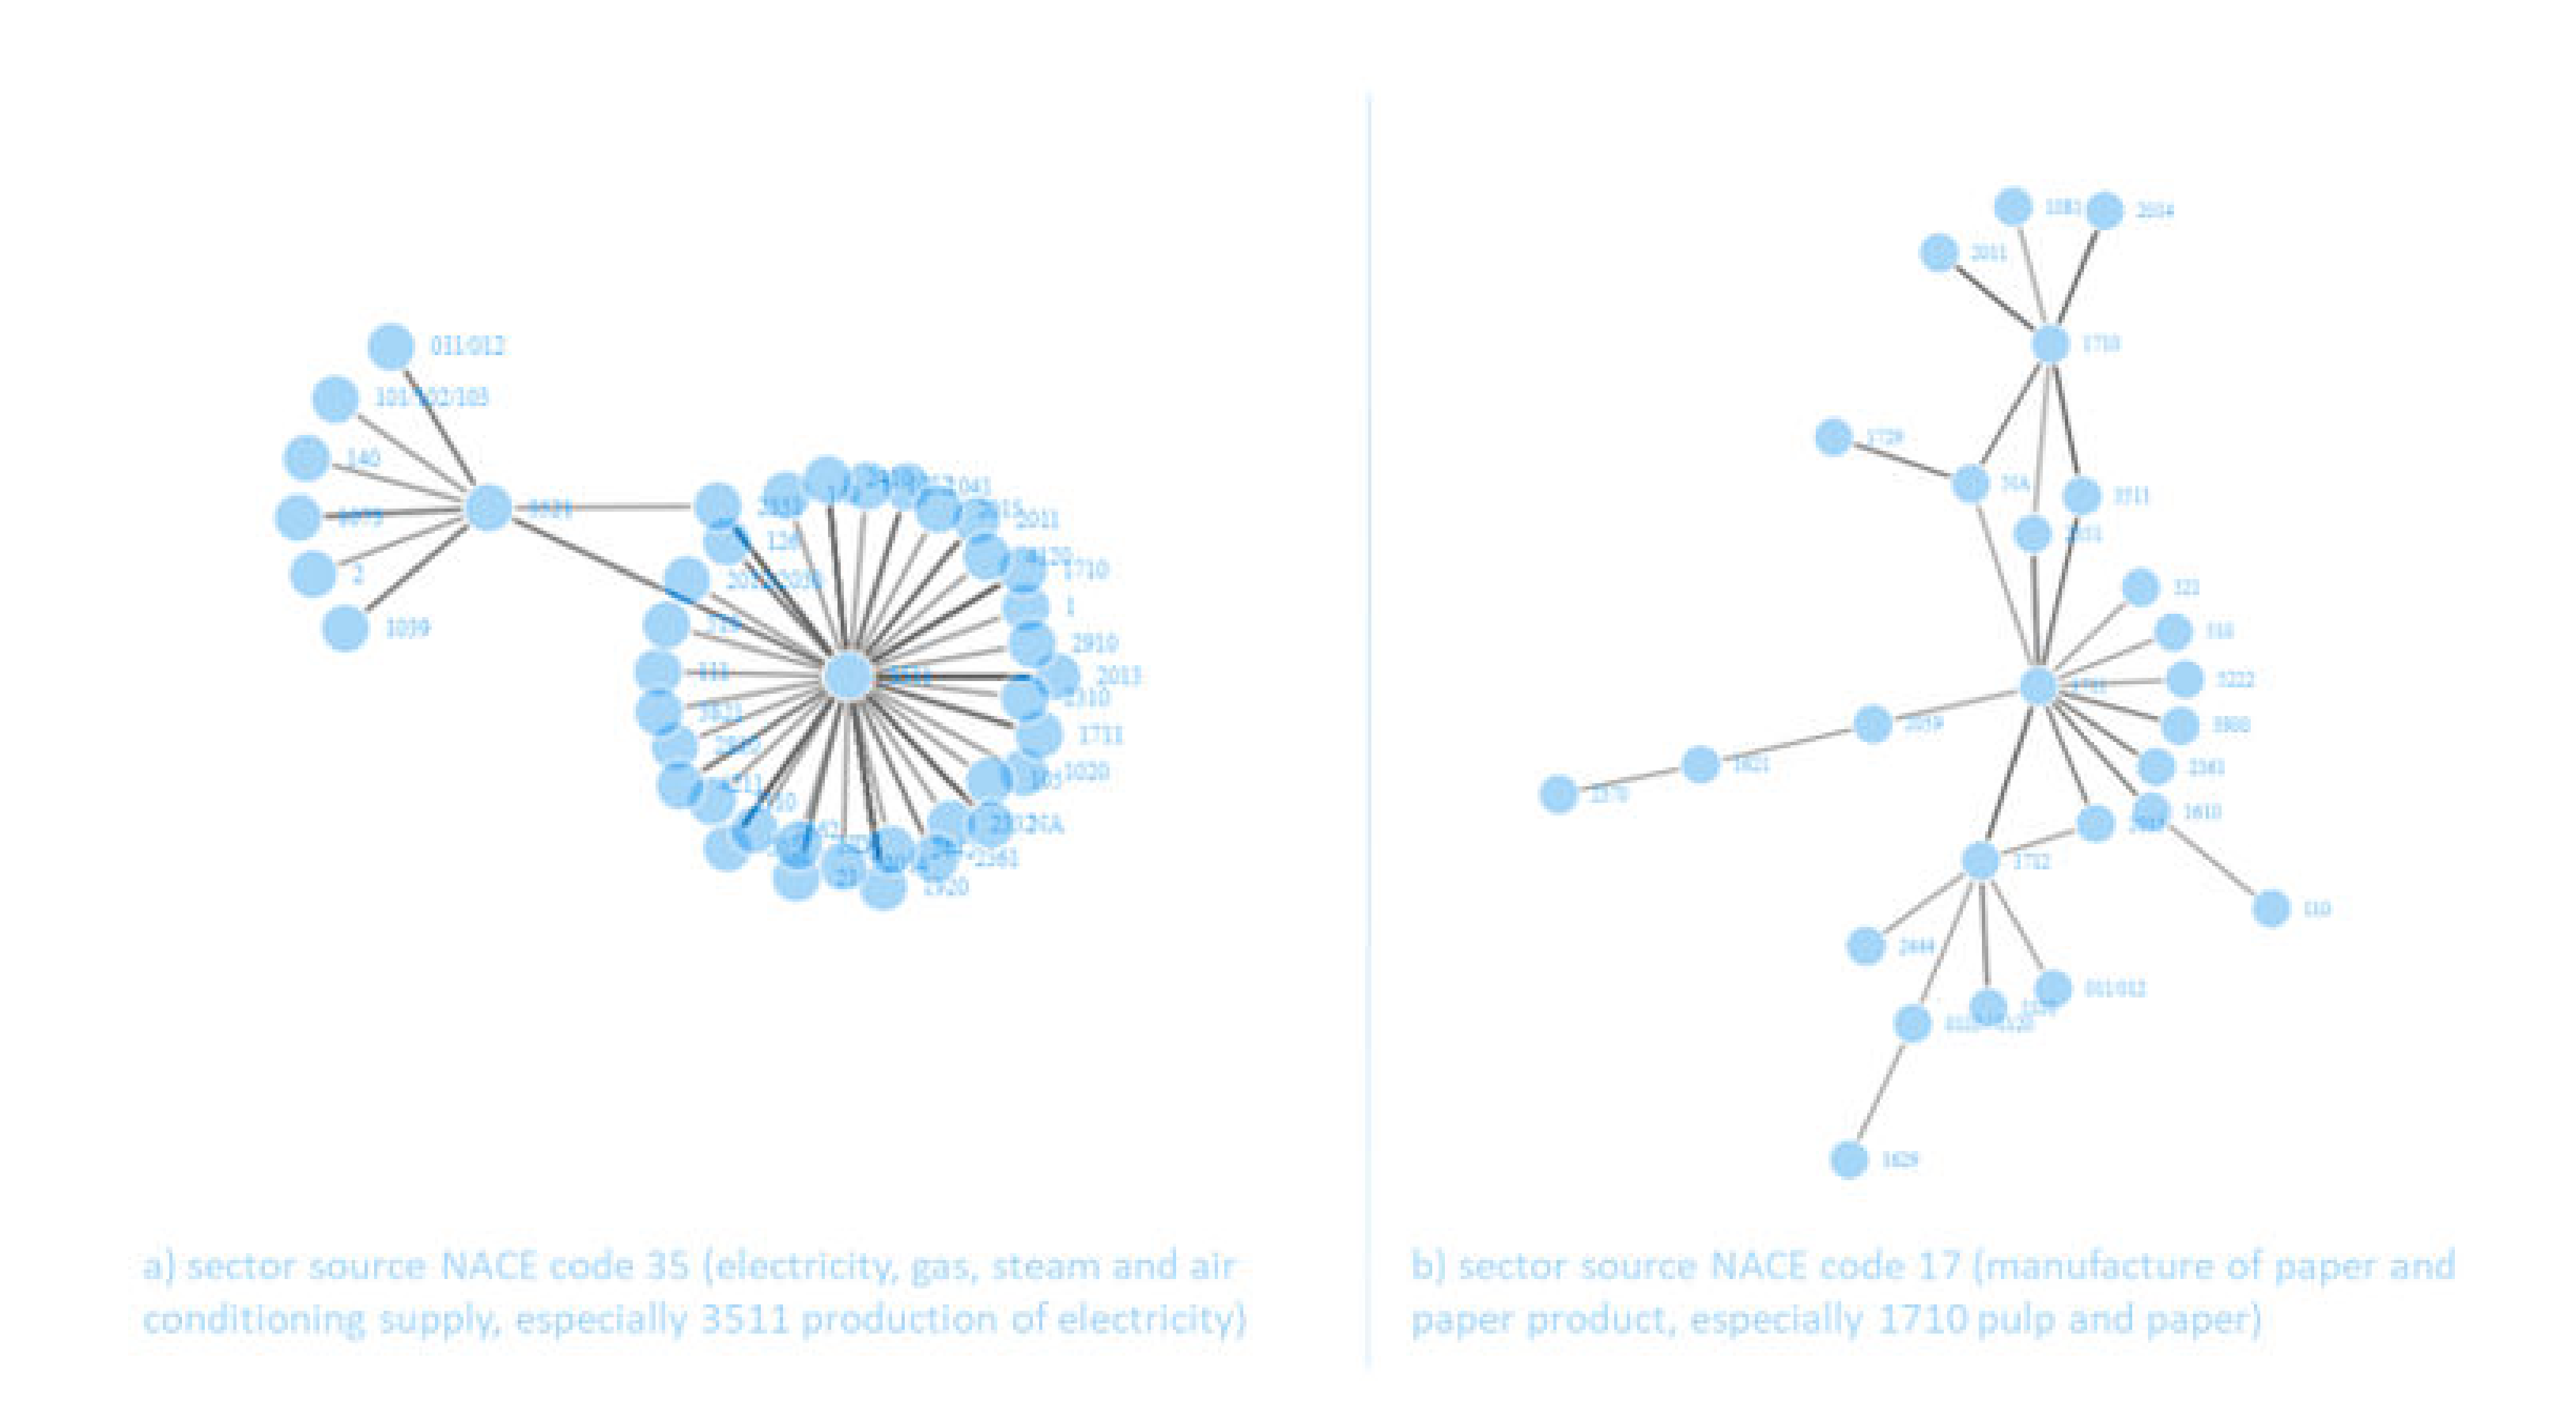
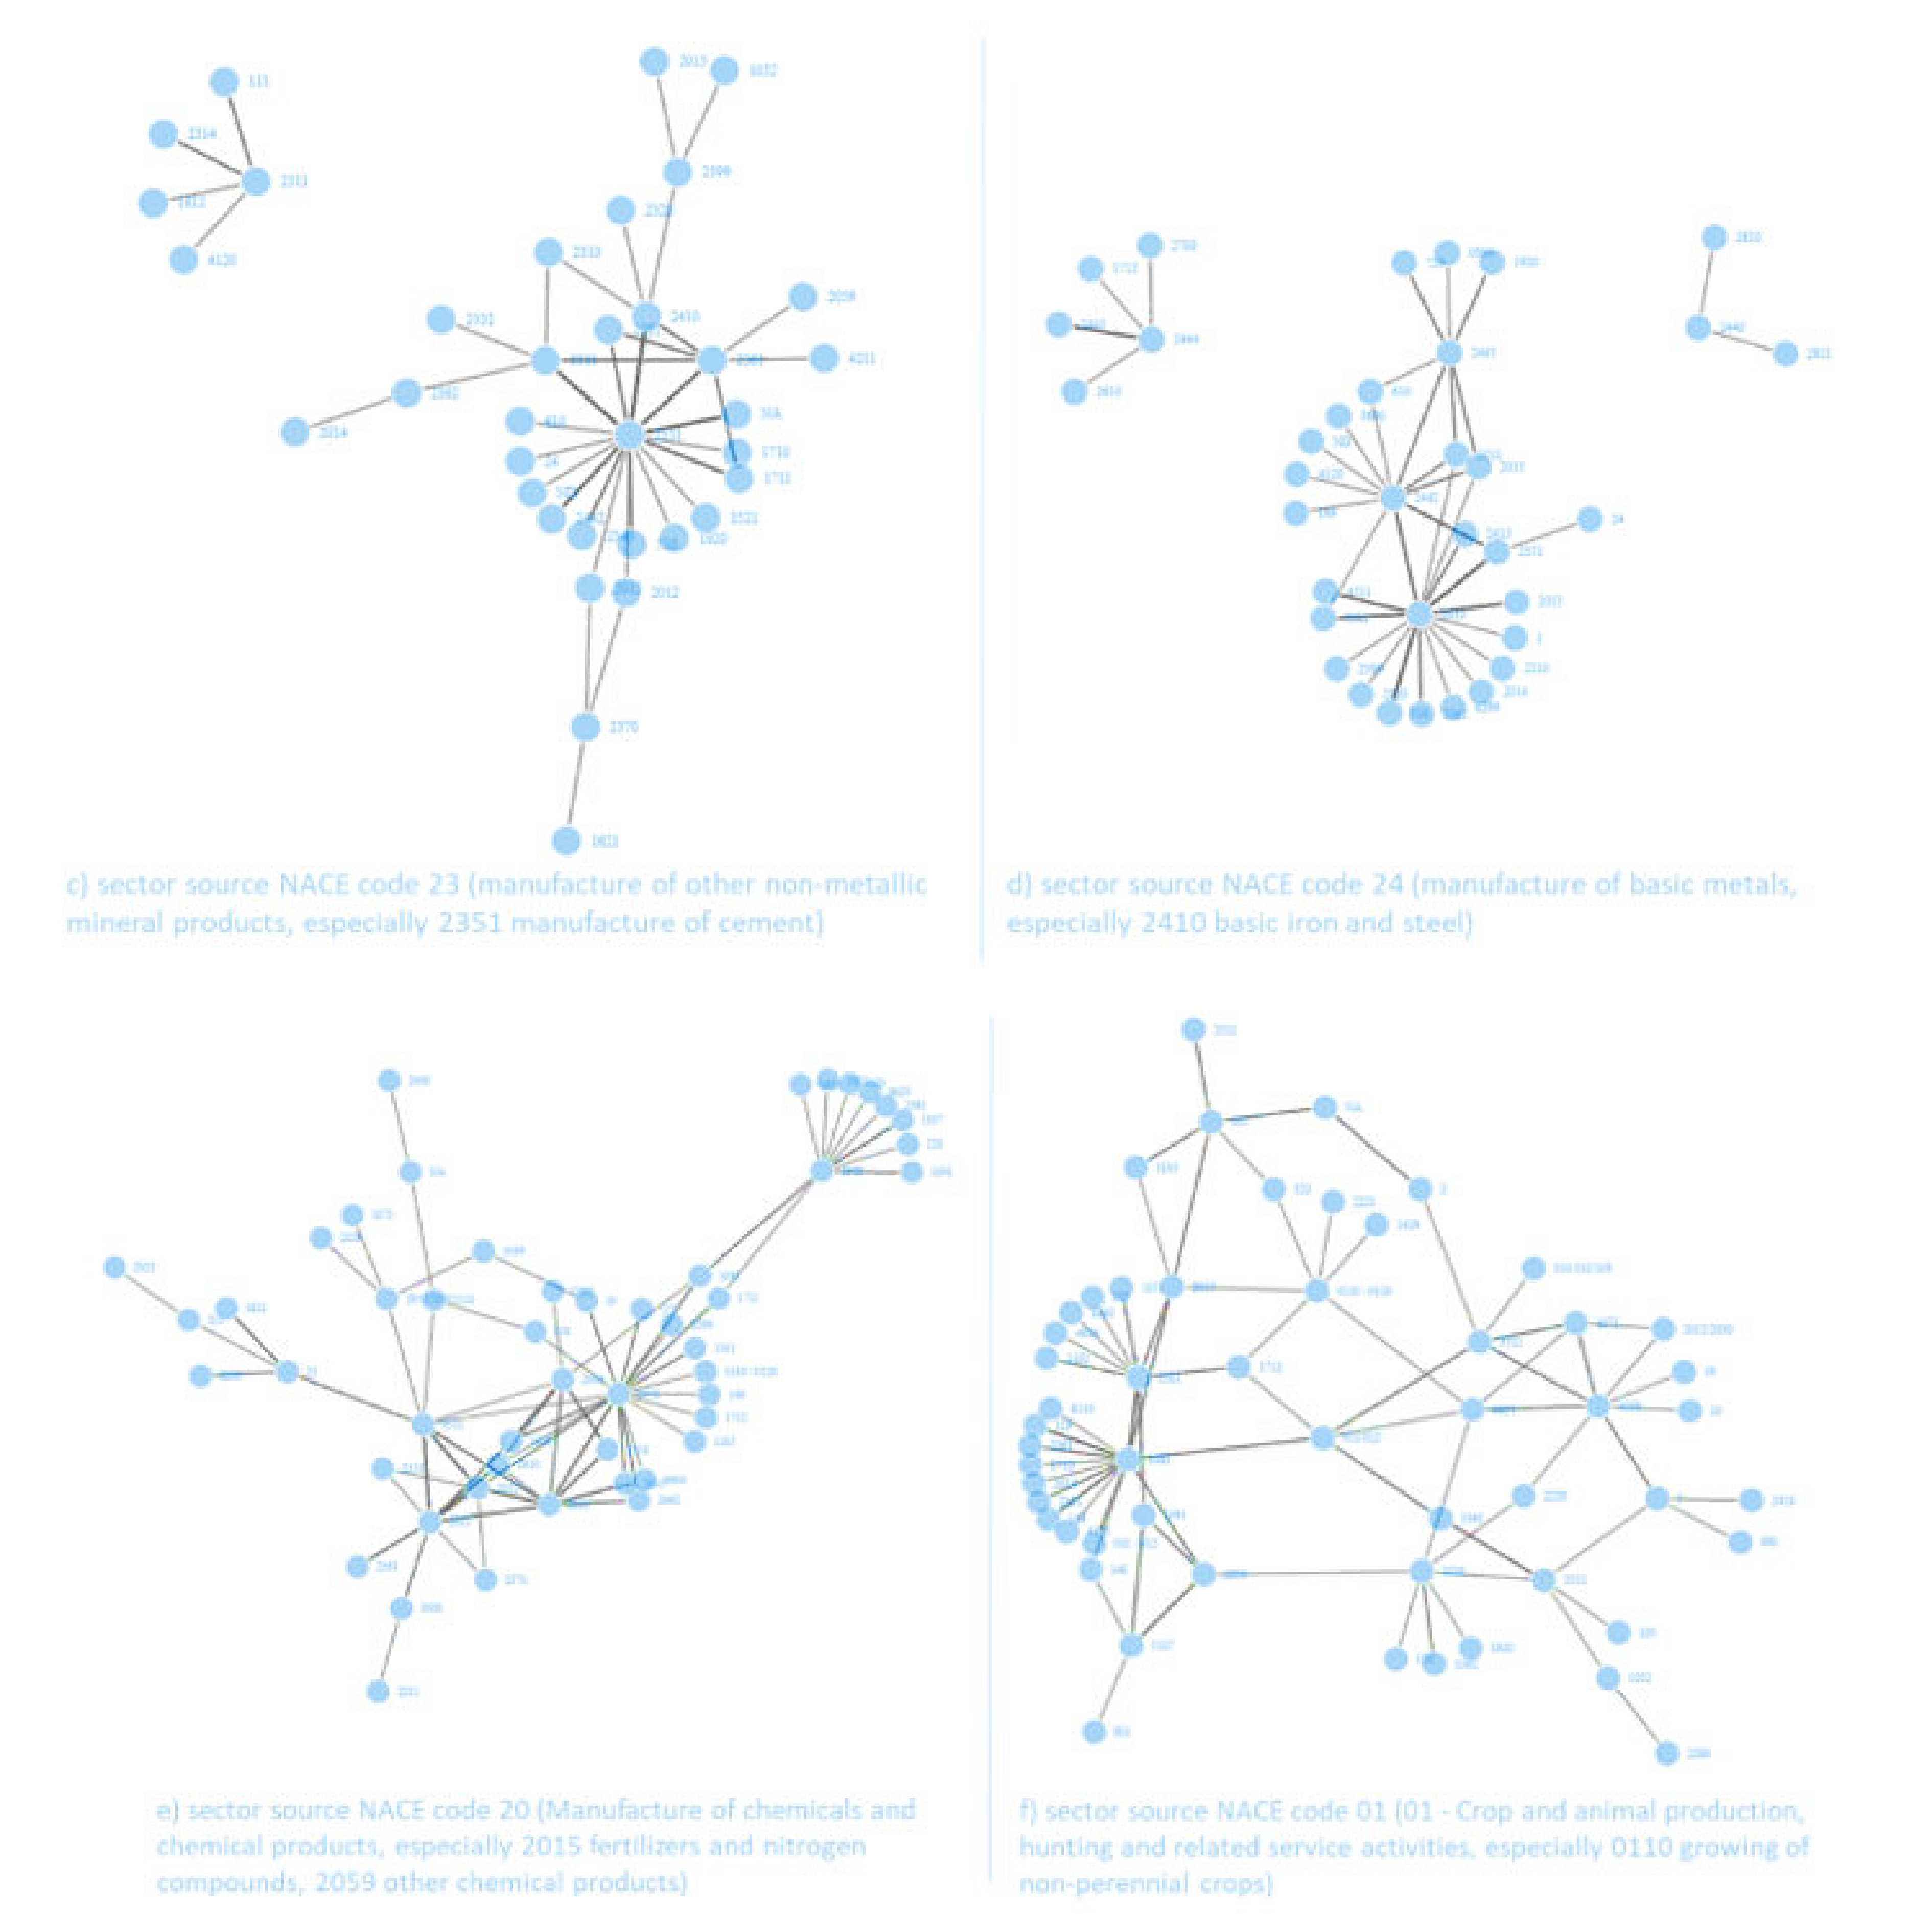
As the network diagram in Figure 2 is very complex and hard to comprehend, detailed network diagrams of six exemplary key IS sector clusters were created to depict their in-depth relationships. Figure 4a presents the network around NACE code 35 (electricity, gas, steam and air conditioning supply) with its subfield 3511 production of electricity, it is outstanding due to its centrality in the entire IS cluster structure and is connected as a providing sector to a distributed set of receiving sectors, mainly in the manufacturing field. For example, [82] explored the Händelö IS in Sweden, which contains an ethanol, biogas and combined heat and power (CHP) plant, producing renewable biofuels, district heating and electricity, supplying various industries and the local community.
Figure 4b displays the network cluster around NACE code 17 (manufacture of paper and paper products) with its subfield 1710 manufacture of pulp, paper and paperboard, which is mainly linked to the fields of cement (2351), concrete (2361), energy (3511), chemical production (2059/2015) and urban entities (NA). Materials of (waste) wood and (waste) paper are much-demanded in different sectors not only for material but first of all for energetic re-utilization. For example, [5] investigated a Finnish IS network, centered around a pulp and paper mill, which includes a chlorine dioxide, a calcium carbonate, a hydrogen peroxide, a water purification, a wastewater treatment and a power plant, fired with wood residues and pulp and paper sludge. The power plant provides heat and electricity for the pulp and paper mill and the local town [5]. The three chemical plants supply the pulp and paper mill with chemicals and the chlorine dioxide and the calcium carbonate plants obtain energy and purified water from the pulp and paper mill [5]. The calcium carbonate plant reuse the carbon dioxide emissions from the flue gases of the pulp and paper mill as a raw material [5].
Figure 4c,d illustrate the intertwined and close relationships of the cement (23) and metal (24) industries, in which especially blast furnace (BF) and steel slags are donated to be processed as cement, concrete, bricks and tiles additives. Also industries of basic metals, chemicals/fertilizers, energy, coke and refined petroleum products conglomerate to an IS cluster. For example, [70] studied the Kawasaki Eco-town in Japan, which is an IS system of metal, concrete, cement, ammonia and paper production. The steel company reprocessed plastic wastes to feed it as reducing agents and fuels to the BF for steel production, whereas the concrete company reused plastic wastes as secondary raw materials for the manufacturing of concrete formwork [70]. The (paper) sewage sludge, BF and steel slag, surplus soil from construction sites, soot dust/(coal) fly ash and burnt residues/incineration ash from the local incinerators are inserted as alternative raw materials for cement production, while plastic wastes and waste tires are predominantly used as fuel alternatives to coal [70].
Figure 4e,f show the strong relationship between the chemical/fertilizing sector and agriculture, which is a big receiving sector for many waste types that can be reprocessed into fertilizers or soil additives. Sugar production (1081) is directly linked to agricultural production (011/012), especially through sugarcane farming, from that a variety of other sectors are connected, e.g., alcohol production (1101). For example, the Guitang Group in China established an IS system consisting of entities of sugarcane farming, sugar mill/refinery, cement, alkali recovery, calcium carbonate, alcohol, pulp and paper and fertilizer production [35]. The sugarcane from the farming fields are transferred to the sugar mill and refinery, where the waste outputs of molasses are further processed in the alcohol plant and the alcohol residues are forwarded to the production of compound fertilizer, which is directed back to the sugarcane fields [35]. The other waste outputs (carbonation filter mud and bagasse) of the sugar mill and refinery are processed in the cement production, whereas bagasse is passed on to the pulp and paper mill (as 60% of the bagasse has fibers long enough for paper-making) and the short fibers of the pith are used as fuel in a CHP plant [35]. The carbon dioxide emissions of the sugar refinery are used as input material for the calcium carbonate plant, which again is connected to the cement mill. The alkali recovery plant recycles the waste from the pulping operation (black liquor), generating a white sludge which is additionally used in the cement mill [35].
Across the investigated case studies, it crystallizes out that repetitious relationships among various (key) sectors exist and are well reflected in the network diagrams.
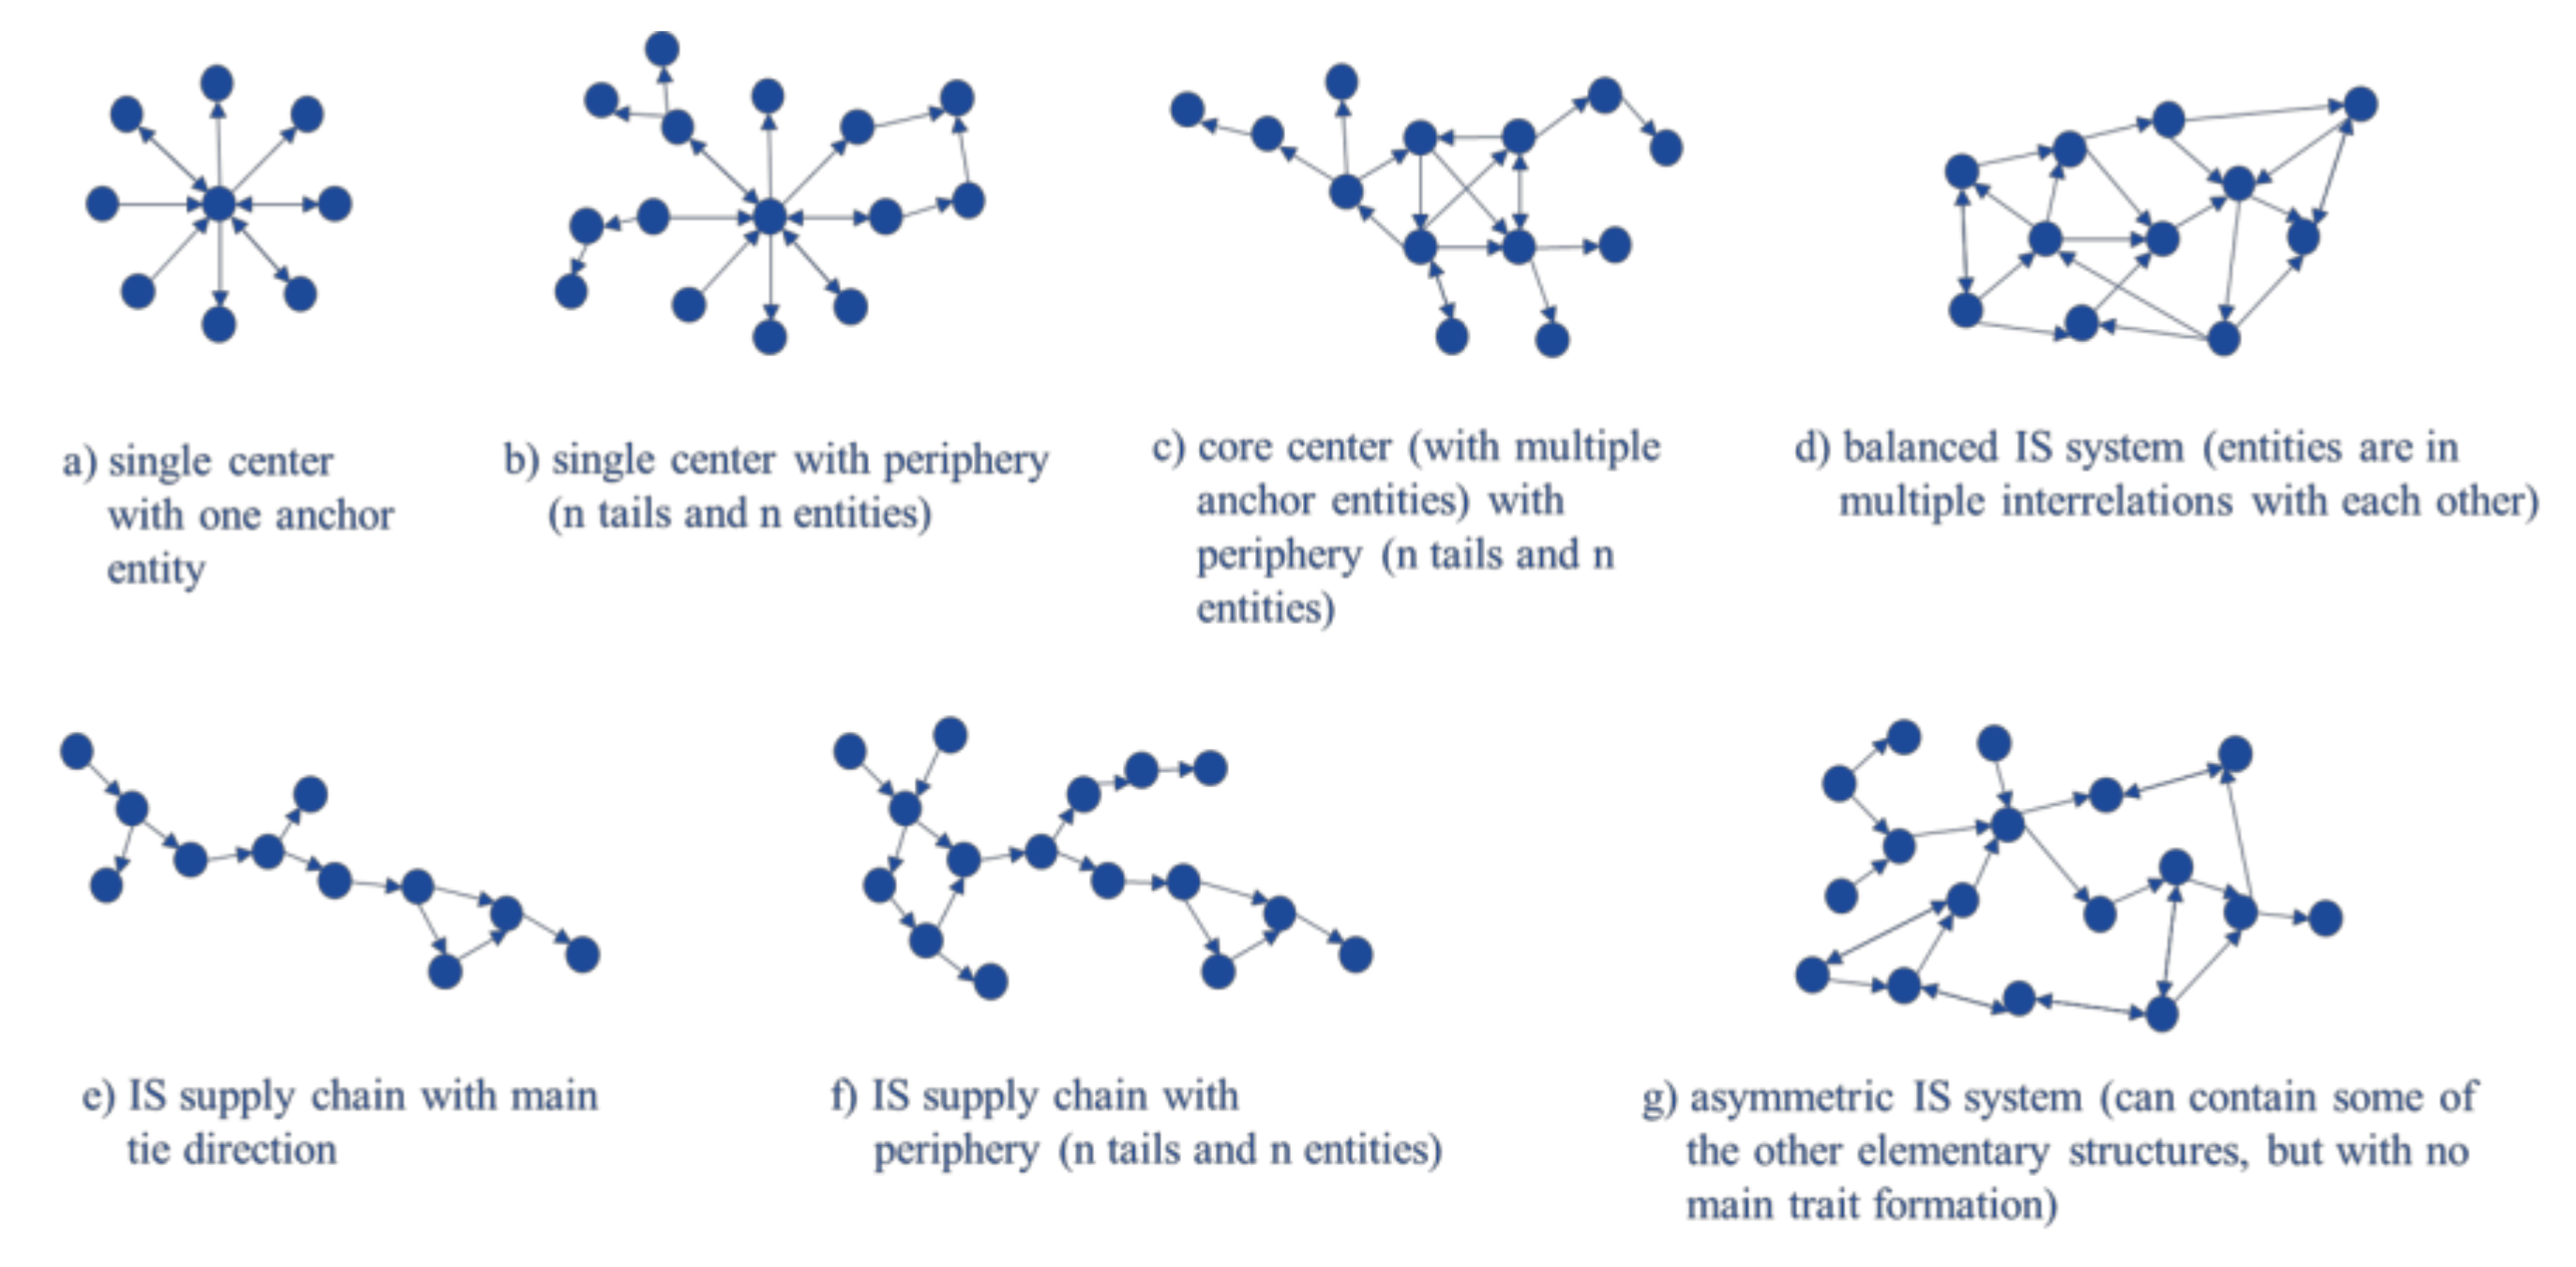
3.1.2. Classification of Structural Industrial Symbiosis Archetype Formations
Based on the 80 analyzed case studies, the following classification of structural IS archetype formations was deduced. The structural formation depends on the (geographical) business environments and possible IS resource exchange connections, the number of connections (connected entities) and the tie direction, shaping various archetype structures as displayed in Figure 5. Each classified structure was generalized and simplified to demonstrate the various elementary IS formations, which an IS system can be built on. The following case examples are chosen to display each representative/universal archetype and do not describe the specific case constellation structure.
For example, the case of Shanghai Wujing in China suits to Figure 5a single center with one anchor entity of a coking plant with linked sectors of chemical plants (e.g., carbon, hydrogen peroxide, chlor-alkali) [78].
Ref. [56] studied the Rantasalmi Eco-industrial Park in Finland, which can represent the single center with periphery in Figure 5b. The IS cluster consists of mechanical wood processing industries with the single center of a log house manufacturer, whereas all the waste wood is recovered for the generation of heating and electricity for industries and the local community [56].
The case of the Kalundborg Symbiosis in Denmark matches to Figure 5c, as it comprises a core center with multiple anchor entities with periphery. The core center covers predominantly a power station, a pharmaceutical and wastewater treatment plant and an oil refinery, whereas the periphery is connected to agricultural farms, fish, fertilizer, gypsum board and cement production, Kalundborg city, nickel and vanadium recovery [53].
The case of Harjavalta Industrial Eco-Park in Finland represents the balanced IS system in Figure 5d, as the main participating entities maintain multiple resource interrelationships from the sectors of copper and nickel flash smelters, nickel chemical, hydrogen, sulphuric acid and energy production and the town of Harjavalta [58].
Figure 5e can be introduced by the case example of Händelö in Sweden, in which the local town, the CHP plant, ethanol and biogas plants are structured in a supply chain with main tie direction [82].
Ref. [44] studied the IS of the Nanning Sugar Industry in China, which incorporated affiliated companies centered around their core business of sugar production to (re-)process/circulate the residual and waste streams of the mother company, extending their own business to an IS supply chain with periphery which again is shaped as branched off IS supply chains, see Figure 5f. Enterprises of cane farming, paper, alcohol, health products and cement industry were all located at the upstream or the downstream of the main sugar production, which led to reduced costs and pollution controlling fees and environmental impacts, created new jobs and innovation for advanced business models, ensured the supply of raw materials and material quality [44].
Ref. [76] analyzed the case of Relvão Eco-Industrial Park in Portugal, which can be mapped to Figure 5g asymmetric IS system as this has no main trait formation. The main sectors are dealing with waste management and resource recovery (e.g., battery and plastic recycler, disassembler, waste management and wastewater treatment plants) and are linked to fertilizer, pulp and paper production and agricultural farms [76].
Ref. [78] investigated ten IS systems with the method of social network analysis (SNA), identifying the structure, connectivity, density and power relationships. They found out, that in China, most IS systems are joint-enterprise types, and are centered on one or a few large-scale enterprises (with core and affiliated relationships). [78] concluded that the entities involved interact strongly with each other, the input and output flows and their respective material exchanges are more balanced and transparent among the IS structure, because they belong to a single legal economic entity and lower the informational, trust, organizational and decision barriers. In contrast, during the development of other IS systems, most enterprises remained legally and economically independent, and the IS relationships among them were established (spontaneously) by means of contracts and agreements [78].
3.2. Industrial Symbiosis Activities and Measures
3.2.1. Industrial Symbiosis Resource Exchanges
Based on the conducted cross-case analysis the following systematized IS activities were identified:
Non-material exchanges: sharing of knowledge/expertise (e.g., an experienced company in auditing of various corporate certifications or management methods such as change and lean management can share its expertise with less experienced companies), utilities/infrastructure (e.g., joint organization/usage of kindergartens, cafeterias, shuttle-services for employee commuting, etc.), joint management services (e.g., procurement of same resources, disposal/recycling processes). Ref. [83] studied the Landskrona Industrial Symbiosis Programme (LISP) in Sweden, in which inter-organizational collaboration comprised non-material synergies such as management routines, new business arrangements, collective bargaining, and envisioning joint goals towards sustainable development.
More common in IS systems are physical resource exchanges of materials, energy and water:
- Materials:
- Secondary raw/substitute material exchanges: companies use waste flows of other entities as secondary raw/substitute, auxiliary and operating materials. Ref. [27] investigated an Austrian IS system, in which the manufacturer of cellulose insulation collected wastepaper from onsite companies to re-process it for material (re-)utilization. Ref. [57] presented a Finnish case study, in which a pulp mill fed its bark residues to a combined heat and power plant (CHP) for energetic utilization.
- gaseous waste/aerosols: can be directly (or various substances are extracted out/treated beforehand) transferred to other companies as secondary raw, auxiliary and operating materials. Ref. [62] examined an Indian business cluster in Mysore, in which inter alia the CO2 emissions from a distillery are forwarded to a CO2 bottling facility. Aerosol waste flows such as (coal) fly ash can be inserted as cement [25,36] or soil additive [57,68].
- sludge/slag: can be directly (or various substances are extracted out/treated beforehand) forwarded to other companies as secondary raw materials. Ref. [41] presented a Chinese IS case study of an iron and steel industry which transferred its blast furnace and steel slag to a cement company.
- Energy:
- electricity: energy producing companies (as their core or side business, for example with an onsite CHP plant) transfer power to other entities. Ref. [58] showed a Finnish IS network, mainly covering copper and nickel flash smelters, nickel chemical producer, energy producer, hydrogen plant, sulphuric acid plant and the town of Harjavalta, which has implemented energy cascading and material exchanges.
- Water:
- (waste/process) water: companies forward their (process) water to other entities for direct (or in the meantime treated water) utilization. Ref. [44] presented a Chinese case study, in which industrial process and white water of paper production was recovered to re-utilize it in pulp production. Wastewater from a food processing company (e.g., olives, cereals, fruits and vegetables) can be further used for the fertilized irrigation of agricultural land [68,77] or further processed into a fertilizer product.
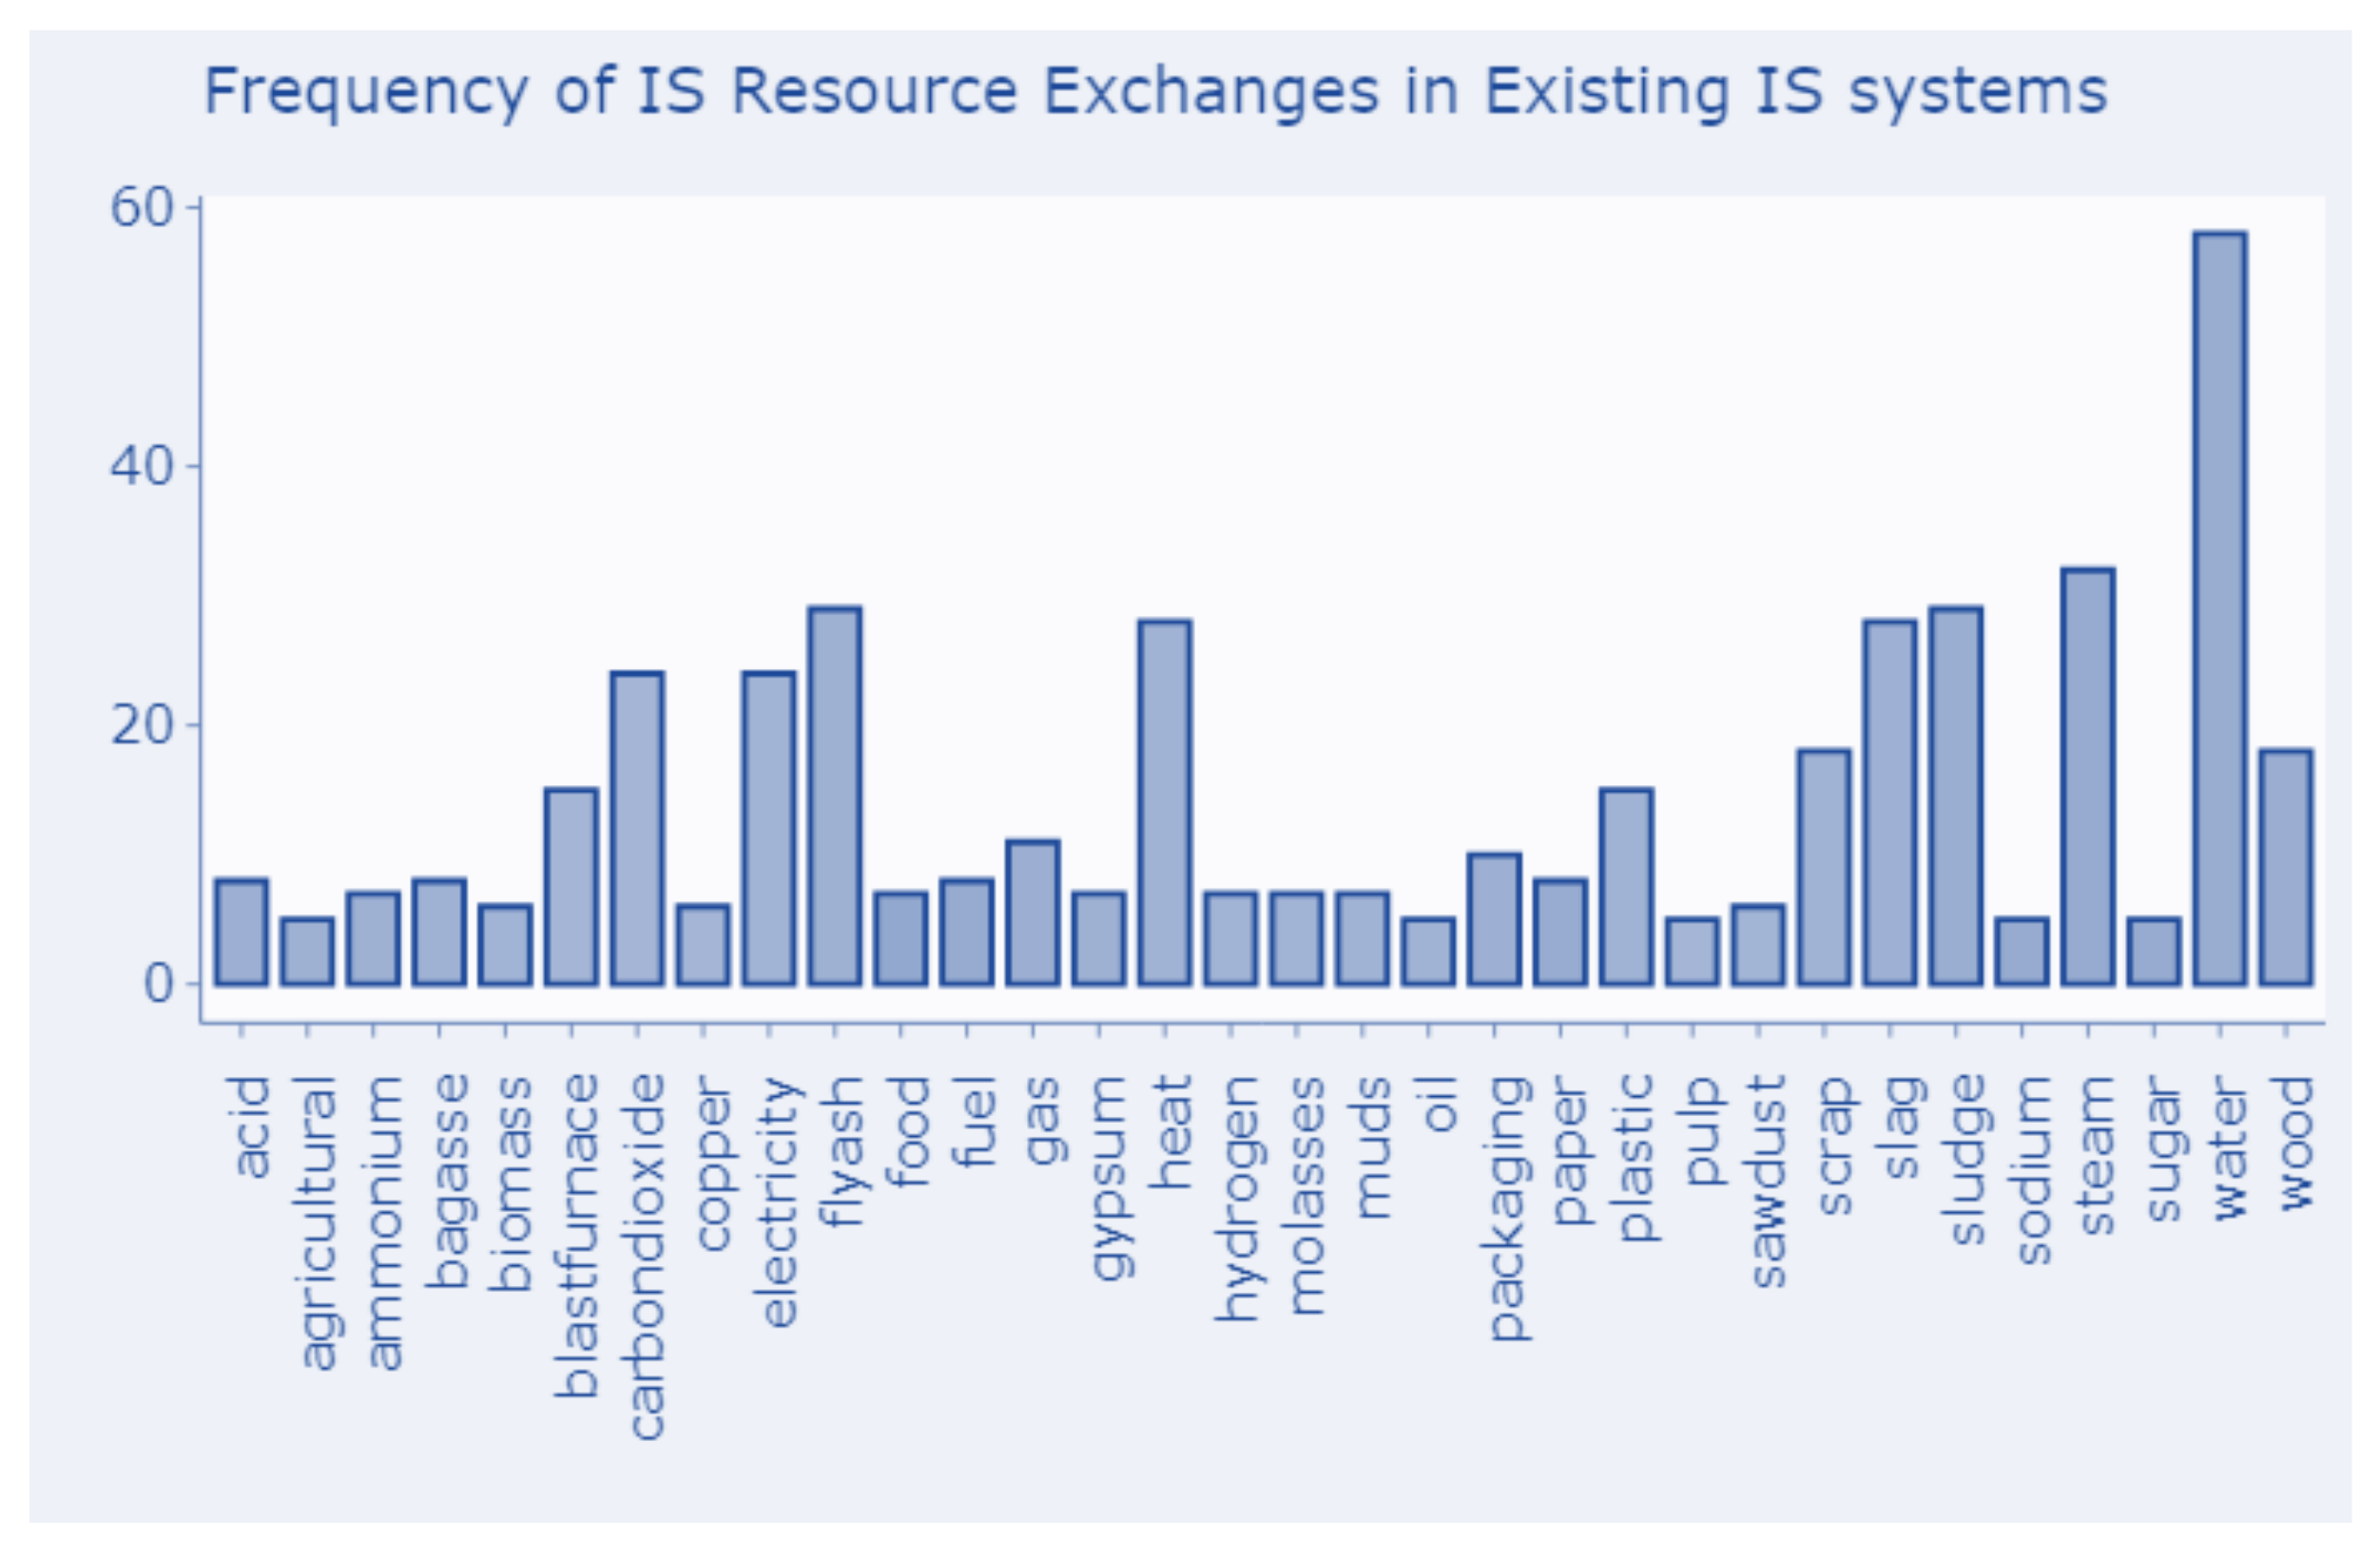
In all investigated 80 case studies material exchanges took place, in 78% of the case studies energy exchanges were recorded (biogas plants were included in an IS system in 15 of 80 case studies and 16 of 80 case studies incorporated a CHP power plant), 61% of the case studies comprised water exchanges (including wastewater) and 11% mentioned utility sharing and 9% knowledge exchange. So utility sharing and knowledge exchanges do not occur often in the examined case studies. However, it does not necessarily mean that there is no utility sharing and/or knowledge exchange in the IS systems, it only means that it was not investigated or explicitly mentioned in the case studies. But nevertheless, it can indicate that previous IS systems focus predominantly on physical resource exchanges. Figure 6 illustrates the frequency of detailed IS resource exchanges in the 80 case studies (whereas resource exchanges were included once they occur > = 5%). It points out that (hot) water (including wastewater) is the most frequent exchange type, followed by steam, sludge, blast furnace and steel slag, (coal) fly ash, heat, electricity, carbon dioxide, (metal) scraps and (waste) plastics. Energy-intensive industries, such as iron and steel, cement, etc. often use (plastic) wastes from local communities, municipalities and other industries for energetic (re-)utilization in their plants [41,70]. Especially (coal) fly ash and steam were passed on to cement plants and oil refineries. The cement, concrete and (road) construction industries appear to be main receiving sectors of various industrial wastes such as solid (mineral/metal and organic) waste streams (e.g., organic dried sewage sludge, steel and BF slag). Steam was mainly generated by power plants (including CHP plants), which was directly used for heating of various manufacturing processes. Materials with relatively high market values such as (precious) metals (e.g., copper, aluminum) or materials which are technically and economically easier to recycle (e.g., plastics, glass, paper) are more likely to be recovered for material and energetic re-utilization.
3.2.2. Industrial Symbiosis Resource Exchange Catalog
In order to provide better knowledge diffusion and experience transfer, practical cases of IS and detailed physical resource exchanges (including material, water, energy) found in literature was pooled in an IS dataset (which can be the content basis for a relational database), creating a catalogue of IS resource exchanges and activities which can serve as elementary blueprint pieces. This systematized approach opens up the access from technology-enabling environments (e.g., IT-supported IS tools) to pool and (semi-)automatically process information/data in order to facilitate the identification of potential IS cooperation partners and further IS activities [16]. This recommendation can initialize further action of the business user to initiate business negotiations for possible IS connections among suitable cooperation partners. The recorded data entries of the MAESTRI database of IS resource exchanges were complemented with the additionally analyzed case studies to a total of 617 IS resource exchanges. The information/dataset contains information of specific IS measures, broken down by industrial sectors (e.g., NACE codes), differentiating providing and receiving sectors and which respective exchanged waste flows were processed into which secondary material/product. Table 2 shows an exemplary excerpt of the developed IS resource exchange catalog.
4. Discussion and Conclusions
Existing IS tools have concentrated on IS identification and specific matchmakings among economic entities [11,12]. However, possible future scenarios such as zero waste parks/regions as well as corresponding transformation pathways from the actual to the desired target state are rarely or not covered by existing tools. This proposed IS tool facilitates the technology-enabling environment for IS initiation, management and continuous improvement as a mean to exhaustively exploit IS potentials for leveraging sustainable industrial development and to provide easy-to-use business support to industrial actors and to increase user friendliness and IS adoption in industrial systems, triggered by inter alia lack of knowledge of IS possibilities and lack of information sharing among companies. This study is embedded in an overarching project, dealing with the development of a holistic IT-supported IS tool covering an information exchange platform among industrial actors, system analysis (identification of IS potentials via quantitative methods such as Material Flow Analysis), transformation simulation (e.g., dynamic supply-demand match makings within an IS system) and sustainability goal-setting [16].
This paper has introduced the structural and systematic approach, how an IT-supported IS tool can deploy already existing information and to enable data-driven simulation of transformation pathways. It has been shown that similar IS sectoral partnerships and resource exchanges have recurrently formed in different regions and hence, generalizable patterns, elementary blueprints and structural units can be deduced from existing IS case studies. This work revealed that the fundamental functioning of an IS system mimics the essential mechanisms of ecological resource metabolisms, covering producers, primary/secondary/n consumers and destruents/remineralizers. The most frequent key sectors in IS systems comprise agriculture/aquaculture, power, pulp and paper, iron and steel, construction, chemical as well as waste treatment/recycling industries. Also repetitious resource exchanges and structural formations occurred in IS systems. Once this fundamental information base is incorporated and applied in an IT-supported IS tool, it enables the facilitated recommendation of potential IS partners and IS actions to optimize existing IS cases or to initiate IS development. Especially, first IS germ cells of key sectors/entities can be derived and connected to each other considering individual circumstances and (geographical) business environments.
The existing (scientific) literature and the corresponding knowledge about IS systems already provides a first basis for pooling such information in knowledge bases such as MAESTRI [24], to which IT-supported IS tools should have access in order to facilitate and outline further IS exchanges and connections [16,20,93]. Additionally, once the developed IS resource exchange catalog is linked to an IT-supported IS tool, in which companies can enter their production input-output information, specific recommendations for potential IS partners and respective IS resource exchanges can be suggested by mapping compatible input-output resource flows of the entered data and the underlying IS data base. The structural IS classification of IS systems is one of the crucial factors to create templates/blueprints for IS structures and IS actions, which can be used later in IT-supported IS tools. The as-is state can be matched with the as-shall or as-can states (blueprints), considering indicator systems with which the actual performance can be tracked towards the desired future target state [94], and corresponding IS activities and (missing) links between entities can be implemented in order to increase IS performance, system adaptability and resilience.
Future research should further elaborate (sector-specific) blueprint scenarios of (optimally utilized) IS systems in order to advance the technology-enabling environments of IT-supported IS tools. The development of generalizable templates/basic (sector-specific) blueprints is promising to significantly drive the dynamics and speed of (further) development of IS systems. Therefore, sector-specific material, water and energy blueprint profiles can be compiled as [95] specified in particular for a petrochemical refinery. This research revealed that previous IS studies have strongly focused on specific sectors such as chemical/pharmaceutical, (heavy) metal, cement, pulp and paper, sugar refining industries. This means that if future scientific studies explore IS systems that include sectors that have not or rarely been investigated so far, it would broaden the perspectives of IS application opportunities and this could be a further gain of knowledge to shed light on supplementary IS potentials and connection possibilities and may be additional key clusters and entities can be detected.
However, IS is mainly dealing with waste, residual and by-product flows which depend on company-performances and are therefore fluctuating in amount and quality. Within the production processes, flows of primary raw materials, operating and auxiliary materials and process water/steam can be contaminated with various substances. This complicates the recyclability, circularity and reutilization of materials, water and steam and can narrow the further IS cascading application field. Ref. [45] analyzed the Qijiang Industrial Park in China and pointed out that upstream resource exchanges influence the entire IS system to a large extent due to fluctuations in material flows and quality in particular, especially for downstream companies, it is made difficult to respond in short term in an adequate manner. This poses high vulnerability and risk factors relating to supply security and material/product quality. Building resource exchange networks may create vulnerabilities by a higher degree of interdependencies among the entities and their performances, so the power relations between the IS participants need to be considered carefully as well as the level of trust and how the IS community interfere with each other regarding transparency and information exchange [96,97]. Via an IT-supported IS tool information exchange concerning material and energy flow management (including quality and amounts) can be (partly) tackled in order to enable the companies to react properly and in a timely manner to variations. The resilience and sustainability of an IS system can be increased by establishing backup systems by introducing redundant or similar entities [97] and increasing the diversity and heterogeneous business settings, in order to ensure multi-functionality, flexibility and plasticity of the IS network [98]. Refs. [99,100] stated that the greater the inter-firm dependency among the companies in an IS network, the greater the risk of vulnerability and instability. Redundant entities with multiple connections in an IS context may support a higher resilience of the IS system, provided that the power relations are relatively balanced.
Nevertheless, planning, implementation and operation of IS activities need to be carefully and comprehensively evaluated. IS should not only be considered as an instrument to reduce resource scarcity and waste streams, but all sustainability dimensions (society, ecology, economy) should also be taken into account for further utilization and recycling options in order to avoid possible further negative consequences resulting from IS-induced activities. Socio-ecological-economic effects of IS measures should be assessed/estimated within and also beyond the IS scope in order to evaluate the overall sustainability effectiveness, as issues may be shifted out of the IS scope, and then may occur elsewhere.
Author Contributions
Conceptualization, A.R.-L.; methodology, A.R.-L.; validation, A.R.-L. and V.W.; formal analysis, A.R.-L.; investigation, A.R.-L.; resources, A.R.-L.; data curation, V.W.; writing—original draft preparation, A.R.-L.; writing—review and editing, A.R.-L. and V.W.; visualization, A.R.-L.; supervision, V.W.; project administration, V.W.; funding acquisition, V.W. All authors have read and agreed to the published version of the manuscript.
Funding
This research received no external funding.
Acknowledgments
We would like to thank the journal members for the possibility to publish this work and we thank all the anonymous reviewers for their constructive and valuable comments to improve this paper.
Conflicts of Interest
The authors declare no conflict of interest.
References
- Crutzen, P.J. Geology of mankind. Nature 2002, 415, 23. [Google Scholar] [CrossRef] [PubMed]
- Rockström, J.; Steffen, W.; Foley, J.A. A safe operating space for humanity. Nature 2009, 461, 472–475. [Google Scholar] [CrossRef] [PubMed]
- EEA (European Environment Agency). More from less—Material resource efficiency in Europe. EEA report No 10/2016; European Environment Agency: Copenhagen, Denmark, 2016. [Google Scholar]
- Van Berkel, R.; Fujita, T.; Hashimoto, S.; Geng, Y. Industrial and urban symbiosis in Japan: Analysis of the Eco-Town program 1997-2006. J. Environ. Manag. 2009, 90, 1544–1556. [Google Scholar] [CrossRef] [PubMed]
- Sokka, L.; Lehtoranta, S.; Nissinen, A.; Melanen, M. Analyzing the Environmental Benefits of Industrial Symbiosis: Life Cycle Assessment Applied to a Finnish Forest Industry Complex. J. Ind. Ecolol. 2011, 15, 137–155. [Google Scholar] [CrossRef]
- Chertow, M.; Gordon, M.; Hirsch, P.; Ramaswami, A. Industrial symbiosis potential and urban infrastructure capacity in Mysuru, India. Environ. Res. Lett. 2019, 14. [Google Scholar] [CrossRef]
- Bacudio, L.R.; Benjamin, M.F.D.; Eusebio, R.C.P.; Holaysan, S.A.K.; Promentilla, M.A.B.; Yu, K.D.S.; Aviso, K.B. Analyzing barriers to implementing industrial symbiosisnetworks using DEMATEL. Sustain. Prod. Consum. 2016, 7, 57–65. [Google Scholar] [CrossRef]
- Ji, Y.; Liu, Z.; Wu, J.; He, Y.; Xu, H. Which factors promote or inhibit enterprises’ participation in industrial symbiosis? An analytical approach and a case study in China. J. Clean. Prod. 2020, 244, 118600. [Google Scholar] [CrossRef]
- Sakr, D.; Baas, L.; El-Haggar, S.; Huisingh, D. Critical success and limiting factors for eco-industrial parks: Global trends and Egyptian context. J. Clean. Prod. 2011, 19, 1158–1169. [Google Scholar] [CrossRef]
- Ismail, Y. Industrial Symbiosis at Supply Chain. Int. J. Bus. Econ. Law 2014, 4. ISSN 2289-1552. [Google Scholar]
- Grant, G.B.; Saeger, T.P.; Massard, G.; Nies, L. Information and communication technology for industrial symbiosis. J. Ind. Ecol. 2010, 5, 5–753. [Google Scholar] [CrossRef]
- Maqbool, A.S.; Mendez Alva, F.; Van Eetvelde, G. An Assessment of European Information Technology Tools to Support Industrial Symbiosis. Sustainability 2019, 11. [Google Scholar] [CrossRef] [Green Version]
- Yeo, Z.; Masi, D.; Low, J.S.C.; Ng, Y.T.; Tan, P.S.; Barnes, S. Tools for promoting industrial symbiosis: A systematic review. J. Ind. Ecolol. 2019, 23, 1087–1108. [Google Scholar] [CrossRef] [Green Version]
- Jato-Espino, D.; Ruiz-Puente, C. Fostering Circular Economy Through the Analysis of Existing Open Access Industrial Symbiosis Databases. Sustainability 2020, 12, 952. [Google Scholar] [CrossRef] [Green Version]
- Kosmol, L. Sharing is caring—Information and knowledge in industrial symbiosis: A systematic review. In Proceedings of the 21st Conference on Business Informatics (CBI), Moscow, Russia, 15–17 July 2019; pp. 21–30. [Google Scholar]
- Lütje, A.; Wohlgemuth, V. Requirements Engineering for an Industrial Symbiosis Tool for Industrial Parks Covering System Analysis, Transformation Simulation and Goal Setting. Adm. Sci. 2020, 10, 10. [Google Scholar] [CrossRef] [Green Version]
- Heeres, R.R.; Vermeulen, W.J.V.; de Walle, F.B. Eco-industrial park initiatives in the USA and the Netherlands: First lessons. J. Clean. Prod. 2004, 12, 985–995. [Google Scholar] [CrossRef]
- Isenmann, R. Beitrag betrieblicher Umweltinformatik für die Industrial Ecology—Analyse von BUISSoftware-Werkzeugen zur Unterstützung von Industriesymbiosen. In IT-gestütztes Ressourcen- und Energiemanagement; Gómez, J.M., Lang, C., Eds.; Springer: Berlin/Heidelberg, Germany, 2013. [Google Scholar] [CrossRef]
- Song, X.; Geng, Y.; Dong, H.; Chen, W. Social network analysis on industrial symbiosis: A case of Gujiao eco-industrial park. J. Clean. Prod. 2018, 193, 414–423. [Google Scholar] [CrossRef]
- Lütje, A.; Willenbacher, M.; Engelmann, M.; Kunisch, C.; Wohlgemuth, V. Exploring the system dynamics of industrial symbiosis (IS) with machine learning (ML) techniques—A framework for a hybrid-approach. In Advances and New Trends in Environmental Informatics—ICT for Sustainable Solutions; Schaldach, R., Simon, K.-H., Weismüller, J., Wohlgemuth, V., Eds.; Springer Nature Switzerland AG: Basel, Switzerland, 2019; pp. 117–130. [Google Scholar]
- Cecelja, F.; Raafat, T.; Trokanas, N.; Innes, S.; Smith, M.; Yang, A.; Zorgios, Y.; Korkofygas, A.; Kokossis, A. e-Symbiosis: Technology-enabled support for industrial symbiosis targeting SMEs and innovation. J. Clean. Prod. 2014. [Google Scholar] [CrossRef] [Green Version]
- Livet, P.; Phan, D.; Sanders, L. Why do we need Ontology for Agent-Based Models. In Complexity and Artificial Markets; Springer-Verlag: Berlin/Heidelberg, Germany, 2008; pp. 133–145. [Google Scholar]
- Sharma, G. Pros and cons of different sampling techniques. Int. J. Appl. Res. 2017, 3, 749–752. [Google Scholar]
- Evans, S.; Benedetti, M.; Holgado Granados, M. Library of Industrial Symbiosis case studies and linked exchanges. 2017. Available online: https://www.repository.cam.ac.uk/handle/1810/267849 (accessed on 12 February 2020).
- Golev, A.; Corder, G.; Giurcob, D.P. Industrial symbiosis in Gladstone: A decade of progress and future development. J. Clean. Prod. 2014, 84, 421–429. [Google Scholar] [CrossRef]
- Van Beers, D.; Bossilkov, A.; Corder, G.; Van Berkel, R. Industrial Symbiosis in the Australian Minerals Industry—The Cases of Kwinana and Gladstone. J. Ind. Ecolol. 2007, 11, 55–72. [Google Scholar] [CrossRef] [Green Version]
- Liwarska-Bizukojc, E.; Bizukojc, M.; Marcinkowski, A.; Doniec, A. The conceptual model of an eco-industrial park based upon ecological relationships. J. Clean. Prod 2009, 17, 732–741. [Google Scholar] [CrossRef]
- Kaluza, B.; Blecker, T. Interindustrielle Unternehmensnetzwerke in der betrieblichen Entsorgungslogistik; University of Duisburg: Duisburg, Germany, 1996; Discussion Papers of the department of Economics. [Google Scholar]
- Verguts, V.; Dessein, J.; Dewulf, A.; Lauwers, L.; Werkman, R.; Termeer, C.J.A.M. Industrial symbiosis as sustainable development strategy: Adding a change perspective. Int. J. Sustain. Dev. 2016, 19, 15–35. [Google Scholar] [CrossRef]
- Santos, V.E.N.; Magrini, A. Biorefining and industrial symbiosis: A proposal for regional development in Brazil. J. Clean. Prod. 2018, 177, 19–33. [Google Scholar] [CrossRef]
- Sellitto, M.A.; Murakami, F.K. Industrial Symbiosis: A Case Study Involving a Steelmaking, a Cement Manufacturing, and a Zinc Smelting Plant. Chem. Eng. Trans. 2018, 70. [Google Scholar] [CrossRef]
- Liu, Z.; Adams, M.; Cote, R.P.; Geng, Y.; Li, Y. Comparative study on the pathways of industrial parks towards sustainable development between China and Canada. Resour. Conserv. Recycl. 2018, 128, 417–425. [Google Scholar] [CrossRef]
- Li, P.-m. A case study of Industrial Symbiosis: The Beijiang power plant complex in Tianjing, China. In Proceedings of the International Conference on E-Business and E-Government (ICEE), Shanghai, China, 6–8 May 2011. [Google Scholar]
- Wen, Z.; Meng, X. Quantitative assessment of industrial symbiosis for the promotion of circular economy: A case study of the printed circuit boards industry in China’s Suzhou New District. J. Clean. Prod. 2015, 90, 211–219. [Google Scholar] [CrossRef]
- Zhu, Q.; Côté, R.P. Integrating green supply chain management into an embryonic eco-industrial development: A case study of the Guitang Group. J. Clean. Prod. 2004, 12, 1025–1035. [Google Scholar] [CrossRef]
- Cui, H.; Liu, C.; Côté, R.; Liu, W. Understanding the evolution of industrial symbiosis with a system dynamics model. A case study of Hai Hua Industrial Symbiosis China. Sustainability 2018. [Google Scholar] [CrossRef] [Green Version]
- Fangliang, L.; Xiujuan, Y. An ALB model of Eco-Industrial Parks. Appl. Mech. Mater. 2013, 274, 485–489. [Google Scholar] [CrossRef]
- Wu, J.; Guo, Y.; Li, C.; Qi, H. The redundancy of an industrial symbiosis network: A case study of a hazardous waste symbiosis network. J. Clean. Prod. 1016, 149, 49–59. [Google Scholar] [CrossRef]
- Wu, J.; Pu, G.; Ma, Q.; Qi, H.; Wang, R. Quantitative environmental risk assessment for the iron and steel industrial symbiosis network. J.Clean. Prod. 2017, 157, 106–117. [Google Scholar] [CrossRef]
- Fraccascia, L.; Albino, V.; Di Bari, P.; Giannoccaro, I. Circular economy at the urban level View project SHAREBOX-Implementation of an IT platform for secure management of resource sharing View project. 2017. Available online: http://openarchive.enea.it/bitstream/handle/10840/9067/V2017_SUN-Proceedings.pdf?sequence=1 (accessed on 12 February 2020).
- Sun, L.; Spekkink, W.; Cuppen, E.; Korevaar, G. Coordination of industrial symbiosis through anchoring. Sustainability 2017, 9. [Google Scholar] [CrossRef] [Green Version]
- Mathews, J.A.; Tan, H. Progress toward a circular economy in China. J. Ind. Ecol. 2011, 15, 435–457. [Google Scholar] [CrossRef]
- Guo, B.; Geng, Y.; Sterr, T.; Dong, L.; Liu, Y. Evaluation of promoting industrial symbiosis in a chemical industrial park: A case of Midong. J. Clean. Prod. 2016, 135, 995–1008. [Google Scholar] [CrossRef]
- Yang, S.; Feng, N. A case study of industrial symbiosis: Nanning Sugar Co., Ltd. in China. Resour. Conserv. Recycl. 2008, 52, 813–820. [Google Scholar] [CrossRef]
- Li, B.; Xiang, P.; Hu, M.; Zhang, C.; Dong, L. The vulnerability of industrial symbiosis: A case study of Qijiang Industrial Park, China. J. Clean. Prod. 2017, 157, 267–277. [Google Scholar] [CrossRef]
- Yu, F.; Han, F.; Cui, Z. Evolution of industrial symbiosis in an eco-industrial park in China. J. Clean. Prod. 2015, 87, 339–347. [Google Scholar] [CrossRef]
- Geng, Y.; Liu, Z.; Xue, B.; Dong, H.; Fujita, T.; Chiu, A. Emergy-based assessment on industrial symbiosis: A case of Shenyang Economic and Technological Development Zone. Environ. Sci. Pollut. Res. 2014, 21, 13572–13587. [Google Scholar] [CrossRef]
- Yuan, Z.; Shi, L. Improving enterprise competitive advantage with industrial symbiosis: Case study of a smeltery in China. J. Clean. Prod. 2009, 17, 1295–1302. [Google Scholar] [CrossRef]
- Shi, H.; Chertow, M.; Song, Y. Developing country experience with eco-industrial parks: A case study of the Tianjin Economic-Technological Development Area in China. J. Clean. Prod. 2010, 18, 191–199. [Google Scholar] [CrossRef]
- Lu, C.; Wang, S.; Wang, K.; Gao, Y.; Zhang, R. Uncovering the benefits of integrating industrial symbiosis and urban symbiosis targeting a resource-dependent city: A case study of Yongcheng, China. J. Clean. Prod. 2020, 255, 120210. [Google Scholar] [CrossRef]
- Park, J.; Duque-Hernández, J.; Díaz-Posada, N. Facilitating business collaborations for industrial symbiosis: The pilot experience of the sustainable industrial network program in Colombia. Sustainability 2018, 10, 3637. [Google Scholar] [CrossRef] [Green Version]
- Sacchi, R.; Ramsheva, Y.K.; Konstantinova Ramsheva, Y. The effect of price regulation on the performances of industrial symbiosis: A case study on district heating. Int. J. Sustain. Energy Plan. Manag. 2017, 14, 39–56. [Google Scholar] [CrossRef]
- Jacobsen, N.B. Applications and Implementation Industrial Symbiosis in Kalundborg, Denmark A Quantitative Assessment of Economic and Environmental Aspects. 2006. Available online: http://mitpress.mit.edu/jie (accessed on 12 February 2020).
- Chertow, M.R. Industrial Symbiosis: Literature and Taxonomy. Annu. Rev. Energy Environ. 2000, 25, 313–337. [Google Scholar] [CrossRef] [Green Version]
- Pakarinen, S.; Mattila, T.; Melanen, M.; Nissinen, A.; Sokka, L. Sustainability and industrial symbiosis—The evolution of a Finnish forest industry complex. Resour. Conserv. Recycl. 2010, 54, 1393–1404. [Google Scholar] [CrossRef]
- Saikku, L. Eco-industrial parks: A Background Report for the Ecoindustrial Park Project at Rantasalmi; Regional Council of Etelä-Savo: Mikkeli, Finland, 2006. [Google Scholar]
- Korhonen, J.; Snäkin, J.-P. Analysing the evolution of industrial ecosystems: Concepts and application. Ecol. Econ. 2005, 52, 169–186. [Google Scholar] [CrossRef]
- Jyrki, H. Harjavalta Industrial Eco Park—A Success Story of the Industrial Ecology in the Area of Metallurgical Industry to Increase Regional Sustainability; University of Oulu: Oulu, Finland, 2009. [Google Scholar]
- Morales, E.M.; Diemer, A.; Cervantes, G.; Carrillo-González, G. “By-product synergy” changes in the industrial symbiosis dynamics at the Altamira-Tampico industrial corridor: 20 Years of industrial ecology in Mexico. Resour. Conserv. Recycl. 2019, 140, 235–245. [Google Scholar] [CrossRef]
- Hein, A.; Jankovic, M.; Feng, W.; Farel, R.; Yune, J.; Yannou, B. Stakeholder Power in Industrial Symbioses: A Stakeholder Value Network Approach. J. Clean. Prod. 2017, 148, 923–933. [Google Scholar] [CrossRef]
- Gaidajis, G.; Kakanis, I. Examination of Industrial Symbiosis Potential Interactions in an Industrial Area Of NE Greece. J. Eng. Sci. Technol. Rev. 2015, 8, 130–135. [Google Scholar] [CrossRef]
- Bain, A.; Shenoy, M.; Ashton, W.; Chertow, M. Industrial symbiosis and waste recovery in an Indian industrial area. Resour. Conserv. Recycl. 2010, 54, 1278–1287. [Google Scholar] [CrossRef]
- Ulhasanah, N.; Goto, N. Preliminary Design of Eco-City by Using Industrial Symbiosis and Waste Co-Processing Based on MFA, LCA, and MFCA of Cement Industry in Indonesia. Int. J.Environ. Sci. Dev. 2013, 553–561. [Google Scholar] [CrossRef]
- Aswie, V.; Ariastita, P.; Setyasa, P.; Andriani, N.; Malaysia, P. Development Halmahera as a New Sustainable Future City with Industrial Symbiosis Infiltration Concept. In Proceedings of the ASEAN Youth Conference, Kuala Lumpur, Malysia, 16–17 December 2017; Volume 1. [Google Scholar]
- Taddeo, R.; Simboli, A.; Morgante, A. Implementing eco-industrial parks in existing clusters. Findings from a historical Italian chemical site. J. Clean. Prod. 2012, 33, 22–29. [Google Scholar] [CrossRef]
- Taddeo, R.; Simboli, A.; Morgante, A. The Development of Industrial Symbiosis in Existing Contexts. Experiences From Three Italian Clusters. Ecol. Econ. 2017, 139, 55–67. [Google Scholar] [CrossRef]
- Daddi, T.; Nucci, B.; Iraldo, F. Using Life Cycle Assessment (LCA) to measure the environmental benefits of industrial symbiosis in an industrial cluster of SMEs. J. Clean. Prod. 2017, 147, 157–164. [Google Scholar] [CrossRef]
- Notarnicola, B.; Tassielli, G.; Renzulli, P.A. Industrial symbiosis in the Taranto industrial district: Current level, constraints and potential new synergies. J. Clean. Prod. 2016, 122, 133–143. [Google Scholar] [CrossRef]
- Marconi, M.; Gregori, F.; Germani, M.; Papetti, A.; Favi, C. An approach to favor industrial symbiosis: The case of waste electrical and electronic equipment. Procedia Manuf. 2018, 21, 502–509. [Google Scholar] [CrossRef]
- Hashimoto, S.; Fujita, T.; Geng, Y.; Nagasawa, E.; Hashimoto, A.S.; Nagasawa, D.E. Realizing CO2 emission reduction through industrial symbiosis: A cement production case study for Kawasaki. Resour. Conserv. Recycl. 2010, 54, 10–704. [Google Scholar] [CrossRef] [Green Version]
- Kikuchi, Y.; Kanematsu, Y.; Ugo, M.; Hamada, Y.; Okubo, T. Industrial Symbiosis Centered on a Regional Cogeneration Power Plant Utilizing Available Local Resources: A Case Study of Tanegashima. J. Ind. Ecol. 2016, 20, 276–288. [Google Scholar] [CrossRef] [Green Version]
- Mauthoor, S. Uncovering industrial symbiosis potentials in a small island developing state: The case study of Mauritius. J. Clean. Prod. 2017, 147, 506–513. [Google Scholar] [CrossRef]
- Zhang, X.; Strømman, A.H.; Solli, C.; Hertwich, E.G. Model-centered approach to early planning and design of an eco-industrial park around an oil refinery. Environ. Sci. Tech. 2008, 42, 4958–4963. [Google Scholar] [CrossRef]
- Khan, N.H.; Nafees, M.; Saeed, T.; Khan, A.; Bashir, A. Industrial Symbiosis and Industrial Waste Management in Wood-Based Industries. J. Ind. Pollut. Control 2018, 34, 2152–2158. [Google Scholar]
- Barroso, J.L. Potential for Implementing an Industrial Symbiosis Network in Rural Portugal. Master’s Thesis, The International Institute for Industrial Environmental Economics, Lund, Sweden, 2007. ISSN 1401-9191. [Google Scholar]
- Costa, I.; Ferrão, P. A case study of industrial symbiosis development using a middle-out approach. J. Clean. Prod. 2010, 18, 984–992. [Google Scholar] [CrossRef]
- Chertow, M.R.; Ashton, W.S.; Espinosa, J.C. Industrial symbiosis in Puerto Rico: Environmentally related agglomeration economies. Reg. Stud. 2008, 42, 1299–1312. [Google Scholar] [CrossRef]
- Zhang, Y.; Zheng, H.; Chen, B.; Yang, N. Social network analysis and network connectedness analysis for industrial symbiotic systems: Model development and case study. Fron. Earth Sci. 2013, 7, 169–181. [Google Scholar] [CrossRef]
- Kerdlap, P.; Choong Low, J.S.; Steidle, R.; Loong Tan, D.Z.; Herrmann, C.; Ramakrishna, S. Collaboration Platform for Enabling Industrial Symbiosis: Application of the Industrial-Symbiosis Life Cycle Analysis Engine. Procedia CIRP 2019, 80, 655–660. [Google Scholar] [CrossRef]
- Behera, S.K.; Kim, J.H.; Lee, S.Y.; Suh, S.; Park, H.S. Evolution of “designed” industrial symbiosis networks in the Ulsan Eco-industrial Park: “Research and development into business” as the enabling framework. J. Clean. Prod. 2012, 29–30, 103–112. [Google Scholar] [CrossRef]
- Wolf, A.; Petersson, K. Industrial symbiosis in the Swedish forest industry. Prog. Ind. Ecol. Int. J. 2007, 4, 348. [Google Scholar] [CrossRef] [Green Version]
- Martin, M.; Eklund, M.; Sokka, L. Industrial Symbiosis in the Biofuel Industry Quantification of the Environmental Performance and Identification of Synergies; Linköpings universitet Institutionen för ekonomisk och industriell utveckling & Linköpings universitet Tekniska högskolan (n.d.): Linkoping, Sweden, 2013. [Google Scholar]
- Mirata, M.; Emtairah, T. Industrial symbiosis networks and the contribution to environmental innovation: The case of the Landskrona industrial symbiosis programme. J. Clean. Prod. 2005, 13, 993–1002. [Google Scholar] [CrossRef]
- Hatefipour, S.; Baas, L.; Eklund, M. The Händelö area in Norrköping, Sweden Does it fit for Industrial Symbiosis Development? In Proceedings of the World Renewable Energy Congress, Linköping, Sweden, 8–13 May 2011. [Google Scholar]
- Martin, M.; Harris, S. Prospecting the sustainability implications of an emerging industrial symbiosis network. Resour. Conserv. Recycl. 2018, 138, 246–256. [Google Scholar] [CrossRef]
- Massard, G. Industrial symbioses: A New Strategy for Improving How Economic Activities Use Material and Energy Resources. Ph.D. Thesis, University of Lausanne, Lausanne, Switzerland, 2011. [Google Scholar]
- Alkaya, E.; Böğürcü, M.; Ulutaş, F. Industrial Symbiosis in Iskenderun Bay:A Journey from Pilot Applications to a National Program in Turkey. In Proceedings of the SYMBIOSIS, Athens, Greece, 19–21 June 2014. [Google Scholar]
- Mirata, M. Experiences from early stages of a national industrial symbiosis programme in the UK: Determinants and coordination challenges. J. Clean. Prod. 2004, 12, 967–983. [Google Scholar] [CrossRef]
- Francis, C.G. The chemical industry from an industrial ecology perspective. In Perspectives on Industrial Ecology; Bourg, D., Erkman, S., Eds.; Greenleaf Publishing Limited: Sheffield, UK, 2003. [Google Scholar]
- Alexander, D.; Benoit, C.; Malloch, I.; Noah, E. Food Cycling Within New Haven, Connecticut: Creating Opportunities for Economic, Civic, and Environmental Progress Through Industrial Symbiosis. Yale Sch. Env. Stud. Bull. 2001, 106, 379–412. [Google Scholar]
- Ali, K.A.; Wang, Y.; Alvarado, L.J. Facilitating industrial symbiosis to achieve circular economy using value-added by design: A case study in transforming the automobile industry sheet metal waste-flow into Voronoi facade systems. J. Clean. Prod. 2019, 234, 1033–1044. [Google Scholar] [CrossRef]
- Earley, K. Industrial symbiosis: Harnessing waste energy and materials for mutual benefit. Renew. Energy Focus 2015, 16, 75–77. [Google Scholar] [CrossRef]
- Lütje, A.; Willenbacher, M.; Möller, A.; Wohlgemuth, V. Enabling the identification of industrial symbiosis (IS) through information communication technology (ICT). In Proceedings of the the 52nd Hawaii International Conference on System Sciences (HICSS), Maui, HI, USA, 8–11 January 2019; pp. 709–719. [Google Scholar] [CrossRef] [Green Version]
- Lütje, A.; Wohlgemuth, V. Tracking Sustainability Targets with Quantitative Indicator Systems for Performance Measurement of Industrial Symbiosis in Industrial Parks. Admin. Sci. 2020, 10, 1. [Google Scholar] [CrossRef] [Green Version]
- Cervo, H.; Ferrasse, J.-H.; Descales, B.; van Eetvelde, G. Blueprint: A methodology facilitating data exchanges to enhance the detection of industrial symbiosis opportunities—Application to a refinery. Chem. Eng. Sci. 2019, 211, 115254. [Google Scholar] [CrossRef]
- Gibbs, D. Trust and networking in inter-firm relations: The case of eco-industrial development. Local Econ. 2003, 18, 222–236. [Google Scholar] [CrossRef]
- Van Capelleveen, G.; Amrit, C.; Yazan, D.M.; Amrit, C.; Yazan, D.M. A Literature Survey of Information Systems Facilitating the Identification of Industrial Symbiosis. In Science to Society; Otjacques, B., Hitzelberger, P., Naumann, S., Wohlgemuth, V., Eds.; Springer: Cham, Switzerland, 2018. [Google Scholar] [CrossRef]
- Chopra, S.; Khanna, V. Understanding resilience in industrial symbiosis networks: Insights from network analysis. J. Environ. Manag. 2014, 141, 86–94. [Google Scholar] [CrossRef]
- Fleig, A.-K. Eco-industrial parks, a strategy towards industrial ecology in developing and newly industrialized countries. 2000. Available online: http://www.meso-nrw.de/toolkit/Downloads/etc-11.pdf (accessed on 12 February 2020).
- Zhu, J.; Ruth, M. Exploring the resilience of industrial ecosystems. J. Environ. Manag. 2013, 122, 65–75. [Google Scholar] [CrossRef]
Figure 1.
Balloon plot showing the multivariate frequency distribution of corresponding IS sectors.

Figure 2.
Network diagram of cooperating IS sector clusters.

Figure 3.
Radar plot of occurrence of key/core/anchor sectors in IS systems (sectors with > = 5% occurrence were included).
Figure 3.
Radar plot of occurrence of key/core/anchor sectors in IS systems (sectors with > = 5% occurrence were included).

Figure 4.
Six exemplary network diagrams of IS clusters with specific sector source NACE codes.


Figure 5.
Classification of structural IS archetype formations.

Figure 6.
Frequency of IS resource exchanges in existing IS systems (resource exchanges with > = 5% occurrence were included).
Figure 6.
Frequency of IS resource exchanges in existing IS systems (resource exchanges with > = 5% occurrence were included).

Table 2.
Exemplary excerpt of the IS resource exchange catalog (alphabetically sorted by exchanged waste flow and providing sector).
Table 2.
Exemplary excerpt of the IS resource exchange catalog (alphabetically sorted by exchanged waste flow and providing sector).
| Providing Sector | Receiving Sector | Exchanged Waste Flow | Processed into/Used as |
|---|---|---|---|
| automotive industry | aluminum smelter | aluminum scrap | aluminum |
| animal processing | biodiesel production | animal residues | biodiesel |
| CHP power plant | fertilizing industry | ash | fertilizer: ash pellets |
| sugar refinery | pulp plant | bagasse | pulp |
| pulp and paper plant | power plant | bark | biofuel |
| pulp mill | CHP power plant | bark | energy |
| pulp mill | pellet production | bark | pellets |
| iron and steel industry | cement industry | BF and steel slag | cement additive |
| sugar refinery | cement industry | bio sludge | cement additive |
| pulp plant | alkali recovery | black liquid | alkali |
| pulp production | boiler plant | bleaching water | heated water |
| CHP plant | landscaping | bottom ash | soil additive |
| power plant | bricks manufacturer | bottom ash | bricks additive |
| biogas plant | greenhouse | CO2 emissions | CO2 plant growth gas |
| burning facility | greenhouse | CO2 emissions | CO2 plant growth gas |
| distillery | CO2 bottling facility | CO2 emissions | CO2 raw material |
| ethanol production | algae production | CO2 emissions | algae |
| pulp and paper plant | calcium carbonate plant | CO2 emissions | calcium carbonate additive |
| power plant | cement & construction | coal fly ash | cement additive |
| aquaculture | power plant | cooling water | cooling water |
| cement industry | hospital | cooling water | cooling water |
| refinery | power plant | cooling water | process cooling water |
| algae production | fertilizing industry | dead algae/microbes | fertilizer |
| power plant | chemical industry | deminerlized water | process water |
| wastewater treatment plant | cement industry | dried sewage sludge | cement additive |
| hydropower plant | pulp and paper plant | electricity | process energy |
| biogas plant | agriculture | fermentation residuals | compost |
| aquaponic | compost facility | fish solids | compost |
| CHP power plant | cement industry | fly ash | cement additive |
| power plant | agriculture | fly ash | soil quality improvement and fertilizer |
| power plant | glass and glass-ceramic production | fly ash | ceramic additiv |
| power plant | production of bricks | fly ash | bricks additive |
| power plant | road construction | fly ash | concrete additive |
| chemical industry | plaster board manufacturer | gypsum | gypsum board |
| CHP power plant | cement industry | gypsum | cement additive |
| CHP plant | desalination plant | low pressure steam | process steam |
| animal farm | biogas plant | manure | biogas |
| animal farm | fertilizing industry | manure | manure pellets |
| sugar cane refinery | alcohol distillery | molasses | alcohol |
| algae ponds | fish farming | nutrient rich water | fish feeding |
| algae production | fish farm | nutrient rich water | fish |
| biogas plant | algae production | nutrient rich water | algae |
| fish farm | vegetable farm | nutrient rich water | vegetables |
| agroethanol plant | animal farming | organic residuals | fodder |
| agro-food industry | agriculture | organic residuals | fertilizer |
| biogas plant | agriculture | organic residuals | fertilizer |
| pulp and paper plant | fertilizing industry | organic residuals | fertilizer |
| fish farming | local farms | organic residues | animal feeding |
| local farms | biogas plant | organic waste | biogas |
| CHP power plant | chemical industry | steam | process steam |
| power plant | various industries | steam | process heat |
| automotive industry | metal casting | steel/iron scraps | steel/iron |
| various industries | steel industry | steel/iron scraps | steel/iron |
| power plant | industrial landfills | waste ash | stabilizer |
| power plant | road construction | waste ash | aggregate material |
| power plant | electricity production | waste heat | process heat |
| power plant | fish farm | waste heat | heat |
| power plant | olive mill | waste heat | process heat |
| power plant | urban entities | waste heat | district heating |
| CHP power plant | greenhouse | waste heat/steam | organic food |
| local communities | iron and steel industry | waste plastics | fuel material |
| local communities | waste-to-energy plant | waste plastics | power |
| agro-food industry | agriculture | waste water | fertilized irrigation |
| chlorine dioxide plant | calcium carbonate plant | waste water | process water |
| pig farming | biogas plant | waste water | biogas |
| power plant | various industries | waste water | process water |
© 2020 by the authors. Licensee MDPI, Basel, Switzerland. This article is an open access article distributed under the terms and conditions of the Creative Commons Attribution (CC BY) license (http://creativecommons.org/licenses/by/4.0/).
Share and Cite
MDPI and ACS Style
Rohde-Lütje, A.; Wohlgemuth, V. Recurring Patterns and Blueprints of Industrial Symbioses as Structural Units for an IT Tool. Sustainability 2020, 12, 8280. https://0-doi-org.brum.beds.ac.uk/10.3390/su12198280
AMA Style
Rohde-Lütje A, Wohlgemuth V. Recurring Patterns and Blueprints of Industrial Symbioses as Structural Units for an IT Tool. Sustainability. 2020; 12(19):8280. https://0-doi-org.brum.beds.ac.uk/10.3390/su12198280
Chicago/Turabian StyleRohde-Lütje, Anna, and Volker Wohlgemuth. 2020. "Recurring Patterns and Blueprints of Industrial Symbioses as Structural Units for an IT Tool" Sustainability 12, no. 19: 8280. https://0-doi-org.brum.beds.ac.uk/10.3390/su12198280
Note that from the first issue of 2016, this journal uses article numbers instead of page numbers. See further details here.