Article

Measurement of Polycentric County-Level Areas in a Rapid Urbanization Region from a Public Service Perspective

Department of Regional and Urban Planning, Zhejiang University, Hangzhou 310058, China
*
Author to whom correspondence should be addressed.
Sustainability 2020, 12(19), 8285; https://0-doi-org.brum.beds.ac.uk/10.3390/su12198285
Submission received: 8 September 2020 / Revised: 27 September 2020 / Accepted: 28 September 2020 / Published: 8 October 2020

Abstract

:
Despite various studies regarding polycentric development at metropolis or even larger spatial scales, there is little systematic analysis regarding the rapid urbanization area at the county-level scale. Therefore, this study explored polycentric development in 52 county-level administrative units in Zhejiang Province, China, from a public service perspective. Based on point-of-interest data, our analysis detected the intra-county urban centers and measured their polycentric characteristics. According to the number, scale, and equilibrium value of intra-county polycentricity, the 52 county-level units were classified into three types using a two-step cluster algorithm method. The empirical results suggest that polycentric characteristics vary in the rapid urbanization area, and the spatial distribution of typological units is characterized by agglomeration. Topographical condition, fixed assets investment, public transportation, and residential consumption ability are highly associated with the classification of polycentric urban areas. The conclusion of this study would help local governments initiate better urban development policies and provide potential research directions for further studies about the relationship of inter-county urban centers.

Graphical Abstract

1. Introduction

As urbanization continues worldwide, urban areas have become the major habitat of human beings. World Urbanization Prospects 2018 from the Department of Economic and Social Affairs of the United Nations stated that approximately 55% of the total global population lives in urban areas. With the increasing growth of urban populations, changes in urban spatial structures are inevitable. In the early 20th century, urban sociologist Burges proposed a concentric ring model based on the study of Chicago, wherein an urban area is divided into five functional regions from the center to the marginal areas [1]. A group of economists and geographers, including Hurd and Alonso, explored this spatial structure model from the perspective of land economics [2,3]. In the concentric ring model, the urban center is the only core area of a city and contains retail and service sectors. However, Harris and Ullman proposed multiple urban centers, one of which would remain the main core while the rest are considered sub-cores [4]. With the continuous expansion of the urban scale, agglomeration diseconomy would promote the dispersion of economic activities, and suburbanization would lead the urban population to migrate to the periphery of cities [5,6]. Megalopolises have emerged in the world’s busiest bay areas, including Tokyo, New York, and the Greater London Metropolitan Area. Geographically nearby cities with various types and scales have formed urban agglomerations via transportation networks in North America and Western Europe [7]. Both megalopolises and urban agglomerations blur the boundaries between cities. Therefore, the urban spatial structure transformation must adapt to much wider and more diverse geographical scales, instead of only the intra-city scale.
Recently, researchers, including Hall and Meijers, highlighted a new urban form called polycentric urban regions (PURs) [8,9]. Polycentric urban regions are regional city clusters that may still be physically separate but clearly function with interdependence [10]. Polycentric urban regions refer more to the inter-city and transregional scales compared to the concentric ring model and the multi-center model. Owing to the abundant empirical studies in high-rate urbanization regions, PURs are always closely related to sustainable development and social justice, forming a more competitive and vibrant regional urban area [8,9,10,11]. Thus, PURs have become a normative guideline for regional development and the urbanization process for many policy makers. Among the 29 countries participating in the European Spatial Planning Observation Network (ESPON) project, 18 countries regarded polycentric development as the primary policy of national spatial planning [12]. In 1992, Tokyo Metropolitan Planning planned seven new urban centers in its surrounding counties, Kiyu, Chiba, Kanagawa, and Ibaraki, to form a multi-core urban area. However, some scholars also illustrated the disadvantages of the polycentric development, such as the decrease of cultural, leisure, and sports amenities [13].
With the exception of the PURs in developed countries, polycentric regional development has also been observed in developing countries, including India, Indonesia, and China. In these rapid urbanization areas, concentration of population and production factors not only blur the boundary between cities but also blur the boundaries between urban and rural areas. McGee used the term “Desakota” to describe urban–rural integration areas that contain cities or towns as urban centers and rural areas along major traffic corridors [14]. Similarly, PURs in the Pearl River Delta or Yangtze River Delta of China, which have been extensively studied, are embodied by hundreds of towns and villages [5,15,16]. In terms of actual population density, these towns always have more than 100,000 permanent residents, which basically corresponds to the small city scale in Europe or the USA. Due to the large number of small and medium-sized enterprises (SMEs) gathering in towns, there are sufficient local job opportunities, thereby ensuring that the residents do not need to search for jobs in the surrounding big cities [17]. As the centers of local regions, these towns form a complex urban center system that has multiple hierarchies and scales with the large cities from a wider regional scale perspective, which is similar to the central place theory described [18].
Therefore, this study focuses on the urban center and regional polycentricity of the rapid urbanization areas in China, which is the most populous and rapidly urbanizing country in the world. After the Reform and Opening-Up policy proposed in 1978, China’s urbanization rate has increased from less than 20% to more than 50% over the past 40 years. Decentralization and local government competition have contributed to Chinese urbanization and further created remarkable economic development [19]. With the “New Form of Urbanization Strategy”, multi-center regional development was one of the main goals in China’s national urbanization plans. In addition, a large number of cities, regardless of their scale, planned the construction of satellite towns or new urban centers [20]. For example, Beijing has moved part of its city administrative functions to Tongzhou, a sub-center in the metropolitan area, and is actively building a more distant regional development core named Xiong’an. Meanwhile, some small cities, such as Yiwu, which is not even a prefectural-level city, were considered for polycentric development to meet the booming needs of urban households and industrial plants. However, previous studies paid more attention to the big cities [5,15,16,20], making their measurement of polycentricity an inaccurate identification of urban centers from different scales and hierarchies. In China, every prefecture-level city consists of urban districts and some independent county-level administrative units. While previous research used prefecture-level cities as a whole research object, it is common to ignore the urban centers within the county-level administrative units. Therefore, the resultant identification results, which are not in accordance with the actual urban spatial structure, do not reflect the importance of the local towns obtaining industry and service sectors for regional development. Because PURs are increasingly proposed as development guidelines for cities of different sizes, a systematic analysis of polycentricity from various hierarchies would help local governments initiate better polycentric development policies as well as drafting more realistic spatial plans.
This study explored a polycentricity analysis from the county-level scale in the rapid urbanization areas of China using high-precision big data from a digital map. More specifically, the spatial structure of urban areas within a county-level scale was analyzed and organized. Herein, the definition and measurement of urban centers and polycentricity as well as the classification method for PURs is evaluated. Based on the analysis results, we discuss the spatial characteristics of polycentricity and PURs, and their correlation with socioeconomic factors and topographical conditions, before concluding with a summary of the methodological limitations and future research prospects. This study takes Zhejiang Province as the study area, which is a coastal province at the forefront of China’s rapid urbanization. As Zhejiang Province is one of the provinces with the best county-level economic development in China, the analysis results and conclusion could serve as an important reference for the future development of other Chinese provinces and other developing countries.

2. Materials and Methods

2.1. Definition and Measurement of Urban Centers

The connotation of an urban center is a collection of various center types, including a commercial center, central business center district, and employment center [1,6,21,22]. As previously mentioned, early urban structure research focused on urban commerce centers or financial centers based on the land rent theory [1]. Later, more attention was paid to employment or settlement centers with the emergence of suburbanization [21,22,23]. Thus, it seems that we can identify different urban centers and observe diverse center spatial structures in the same city from distinct perspectives, although it is not difficult to find that the geographical distribution of different urban centers frequently overlaps. With the growing agglomeration of public service facilities in urban areas, urban centers also act as places for entertainment and social communication, except for areas used for working, shopping, or housing, thereby promoting the gradual involvement of urban centers in the public service sector [24].
In addition, the geospatial identification of urban centers is conducted by the spatial analysis of urban centers. Methods for identifying urban centers mainly include the threshold method, the parametric model method, and the nonparametric estimation method [23,25,26,27]. Among these, the threshold method is the most widely used. Researchers set the urban center identification threshold according to specific indicators, such as employment density, population scale, job concentration, and housing equilibrium ratio [5,21,22,28]. With the increased use of big data, academics can now measure urban centers on a microscopic scale. Point-of-interest (POI) data, formally known as the real geographic POI, are a commonly used data source [29,30]. In some existing studies, scholars proved that POI data with high spatial precision and small geospatial granularity provide a fairly good spatial expression ability that can support the urban center recognition method [29,30,31].
Thus, the urban centers were identified from the public service function perspective using POI data. There are three steps involved in this measurement. First, one must set a fishnet grid over the entire area of the empirical region. As the average 5 min walking distance of a human being is approximately 300 m, each basic grid is set to be a 300 m square, which also considers that two adjacent urban branch roads in Chinese cities should be spaced 150–300 m apart according to the Chinese “Code for Design of Urban Road Engineering (CJJ37-2012)”. Then, the kernel density value of POIs (KOP) in each grid is used as the numeric tag based on a kernel density analysis of the POI data. Second, the grids are selected as candidates according to their POI kernel density with a 600 m search radius, to smoothly fit the spatial influence of public facilities. The total number of candidate grids for each county-level administrative unit is 10% of the entire grid that covers the entire construction land in this unit [31]. Third, the urban center boundaries are established as follows (Figure 1). If there are other candidate grids within 600 m of a candidate grid, they are merged as a new grid group, Gi. Grids that are blocked by open space or located diagonally should not be separated. In that case, if there are no other candidate grids within 600 m around Gi and the area of Gi is greater than or equal to 180,000 m2, it is determined to be an independent urban center, Ci. If not, the grids are deleted as their land scale is too small to be considered an independent center.

2.2. Definition and Measurement of Polycentricity

Similar to the definition of an urban center, polycentricity can be explained from a wide range of disciplines. Herein, we mainly observe and discuss polycentricity from a morphological perspective. Therefore, for an individual city, polycentricity means that some intra-city urban centers emerge in the same urban area [32]. Polycentricity from an inter-city scale or wider regional scale is based on the various urban centers coming from one or more cities [15,16]. Previous studies mainly used polycentricity as a descriptive indicator of urban spatial characteristics, wherein if the spatial distribution of urban centers was more balanced, it would be deemed more polycentric. This creates two critical problems: identifying the data that represent the individual characteristics of each urban center and measuring the “balance” among the urban centers. Regarding the first issue, Section 2.1 summarizes the abundant types of urban characteristics that express the socioeconomic, political, or functional dimensions of urban centers based on a literature review. For the second problem, scholars usually prefer to use a clear indicator to explain the relative relationship between urban centers [10,21,33]. However, excessive simplified measurement equations often lead to the loss of original information and the destruction of the data resource structure, which affect the final result. For example, the polycentricity numerical value of a city with two urban centers may be the same as that of a city with four urban centers according to a previous measurement. This measurement cannot illustrate that the spatial features of the urban center system are different. Therefore, by adopting the morphological definition of urban centers, this research analyzed the polycentricity of county-level administrative areas through a comprehensive index, including the spatial distribution balance P j , total scale S U M j , and the quantity of urban centers N U M j .
N U M j is the number of identified urban centers in a county-level administrative unit j. When a specific region contains more urban centers, it commonly means that the polycentricity of this region is more balanced. In addition, it is highly related to advanced urban development and high urbanization levels. S U M j is the sum of the POI kernel density of all the urban centers in the county-level administrative unit j, as follows:
S U M j = 1 i K O P i j
where K O P i j is the POI kernel density of urban center i in county j. Because S U M j characterizes the size of the total urban centers in one unit, it can be used to compare the scale difference among various county-level centers. A larger scale urban center indicates a more powerful service capacity and a broader range of functional radiation [29]. P j can be measured as follows:
P j = 1 σ o b s σ m a x
where P j is the polycentricity of unit j, σ o b s represents the standard deviation of the KOP of the unit j, and σ m a x represents the maximum standard deviation of the two center city where one center has “no importance” and the other has the maximum observed “importance”. According to Equation (2), P j represents the overall relationship between public centers within county j. Thus, the value range of P j is 0 to 1, and the equilibrium tends to balance as the value increases [5].

2.3. Classification of Polycentric Units and their Differential Factor Analysis

Based on the estimation of the aforementioned indicators, we still need to distinguish the homogeneity and heterogeneity among the urban centers of the research units. Thus, a two-step cluster algorithm method was introduced. This algorithm is a typical distance-based clustering method and is an optimization of the balanced iterative reducing and clustering using hierarchies (BIRCH) method [34]. Compared with commonly used clustering methods, such as BIRCH and K-means, this two-step cluster algorithm automatically calculates the optimal number of clusters, thereby enhancing the practicality of the algorithm [35]. This algorithm can combine the three variables, creating an intuitive and effective dimensionality reduction for these urban center characteristics.
Using N U M j , S U M j , and P j as features and inputting each county-level unit as an individual sample, the decision tree outputs sub-clusters. Then, the log-likelihood distance is used to calculate the distance between the sub-clusters, and they are cohesively structured one-by-one using the agglomerative hierarchical clustering method. Finally, the optimal cluster number is determined using the Bayesian information criterion [36]. Subsequently, the algorithm calculates the log-likelihood distance between the samples and clusters to determine their attributes and evaluate the cluster model using the silhouette coefficients. The result of the two-step cluster algorithm method places research units with similar characteristics into the same group and clearly expresses the diversity between the different urban center development of county-level administrative units in the rapid urbanization area.
To determine why the county-level units can be classified into different types, we must consider the factors used for classification. As this process implies that we want the regulation derived from this model to have a promotion value, the tree model was used to represent the classification. Further, as a single decision tree is likely to fall into overfitting, and the current data set is not sufficient to support the division of the training set and prediction, bagging based on bootstrap sampling is an effective method to reduce sample disturbance [37]. Bagging is an ensemble learning method that integrates multiple decision trees in parallel, utilizing voting to achieve a simple average of the classification results of multiple decision trees. In this study, we used the extended change of bagging, random forest (RF), to achieve the county-level urban center system classification [38]. Random forest introduces random attribute selection based on bagging. Specifically, a general decision tree selects an optimal attribute in the current attribute set when selecting division conditions (assuming there are d attributes). For each node, a subset containing k attributes is randomly selected from the attribute set, and then an optimal classification attribute is selected from this subset as the division condition. Thus, k controls the randomness, and the recommended value of k is log2d [38]. Compared with the general bagging method, RF balances the disturbance from both the samples and the attributes, thus further improving the generalization performance in practice, lest it becomes stuck in an overfitting situation. Therefore, based on the RF method, we used the classified types of each county-level unit as the input nominal variables. We sorted 11 social economic indicators and topographical indicators related to urban center development as classification variables based on previous studies [5,15,27,39,40], including the value-added of primary industry (PI), value-added of secondary industry (SI), value-added of tertiary industry (TI), permanent resident population (POP), general public budget expenditure (GPBE), investment in fixed assets (IFA), total retail sales of consumer goods (TRS), per capita disposable income of urban resident (DIUR), household deposits (HD), number of public bus stops (PBS), and average elevation (AE). The output results indicate the importance of the characteristic variables in the classification model, and if the significance value is beyond 0.75, the effect of the corresponding variable is considered significant.

2.4. Study Area

Zhejiang Province, which is between the longitudes 118°01′–123°10′ and the latitudes 27°02′–31°11′, is located in the east coastal area of China (Figure 2). It covers approximately 105,500 km2 and, in 2017, had 56.57 million residents. Zhejiang’s GDP is nearly 730 billion US dollars, which is as much as that of Turkey or Switzerland. As one of the most economically developed provinces in China, the Zhejiang Province government provides administrative power over the county-level government via a creative management method called the “Province Governing County System” [41]. This decentralization system reduces the vertical management stratum and mitigates conflicts of interest between the prefecture city government and county-level government, thereby bridging the gap of policy and financial support from the central government. Therefore, Zhejiang Province has rapidly realized industrialization and urbanization through the bottom-up development model, becoming a typical representation of local development competition with Chinese characteristics [42]. During this rapid urbanization, county-level administrative regions gradually generated their own growth poles and further developed toward a polycentric mode. Therefore, using Zhejiang Province as the study area provides diverse research samples for analyzing the spatial structure and geographical heterogeneity of county-level polycentricity. Considering that Zhejiang Province has 19 county-level cities and 33 counties, 52 research samples were used in this study. The remaining 11 urban districts are treated as a comparative analysis group in the following sections.

2.5. Data Source

Three kinds of data were used in this study: internet big data, spatial data, and census data. Internet big data mainly refers to the POI data, which were captured from Amap via the Amap API on 12 August 2018. As a leading provider of digital map, navigation, and location services in China, Amap had more than 100 million users per day in 2018, making it the most popular digital map service provider in China. Meanwhile, the precise POI data classification method adopted by Amap can provide accurate POI data points to fit the diversity and accuracy needs of this research. According to the definition of urban center in our paper, 10 categories of POI data were selected to characterize the service function of urban centers: food and beverages (FB), public facilities (PF), shopping (SP), finance and insurance services (FIS), science/culture and education services (SES), daily life services (DLS), sports and recreation (SR), governmental organizations and social groups (GS), accommodation services (AS), and medical services (MS). Among them, FB, SP, FIS, DLS, and AS are commercial service facilities; PF, SES, SR, and MS are public service facilities; and GS represents administrative facilities. It is obvious that the actual number of POIs in each category is significantly different, as seen in Figure 3. The number of SP POIs is the largest, while FB and DLS rank the second and third place, respectively. The sum of these three categories of POIs accounts for more than 80% of the total POI data we used.
The spatial data were taken from the digital map of Zhejiang Province, which was obtained from the Urban Research Center of Zhejiang Province (Hangzhou, China). It provides the administrative boundary of every county-level unit and the geographic information of Zhejiang Province. The construction land area of each unit in the urban center identification process is calculated from this data set. The census data contain the overall social and economic statistics of Zhejiang Province we used in this study, such as the county-level gross domestic product and the population, which was mainly derived from “The Statistical Yearbook of Zhejiang Province in 2018” and “The Statistical Yearbook of Shaoxing in 2018”.

3. Results

3.1. County-Level Urban Center Identification

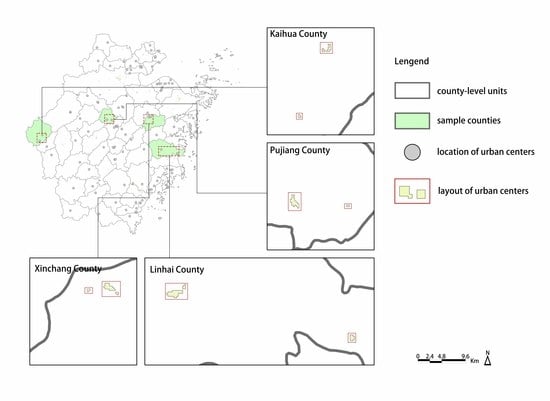
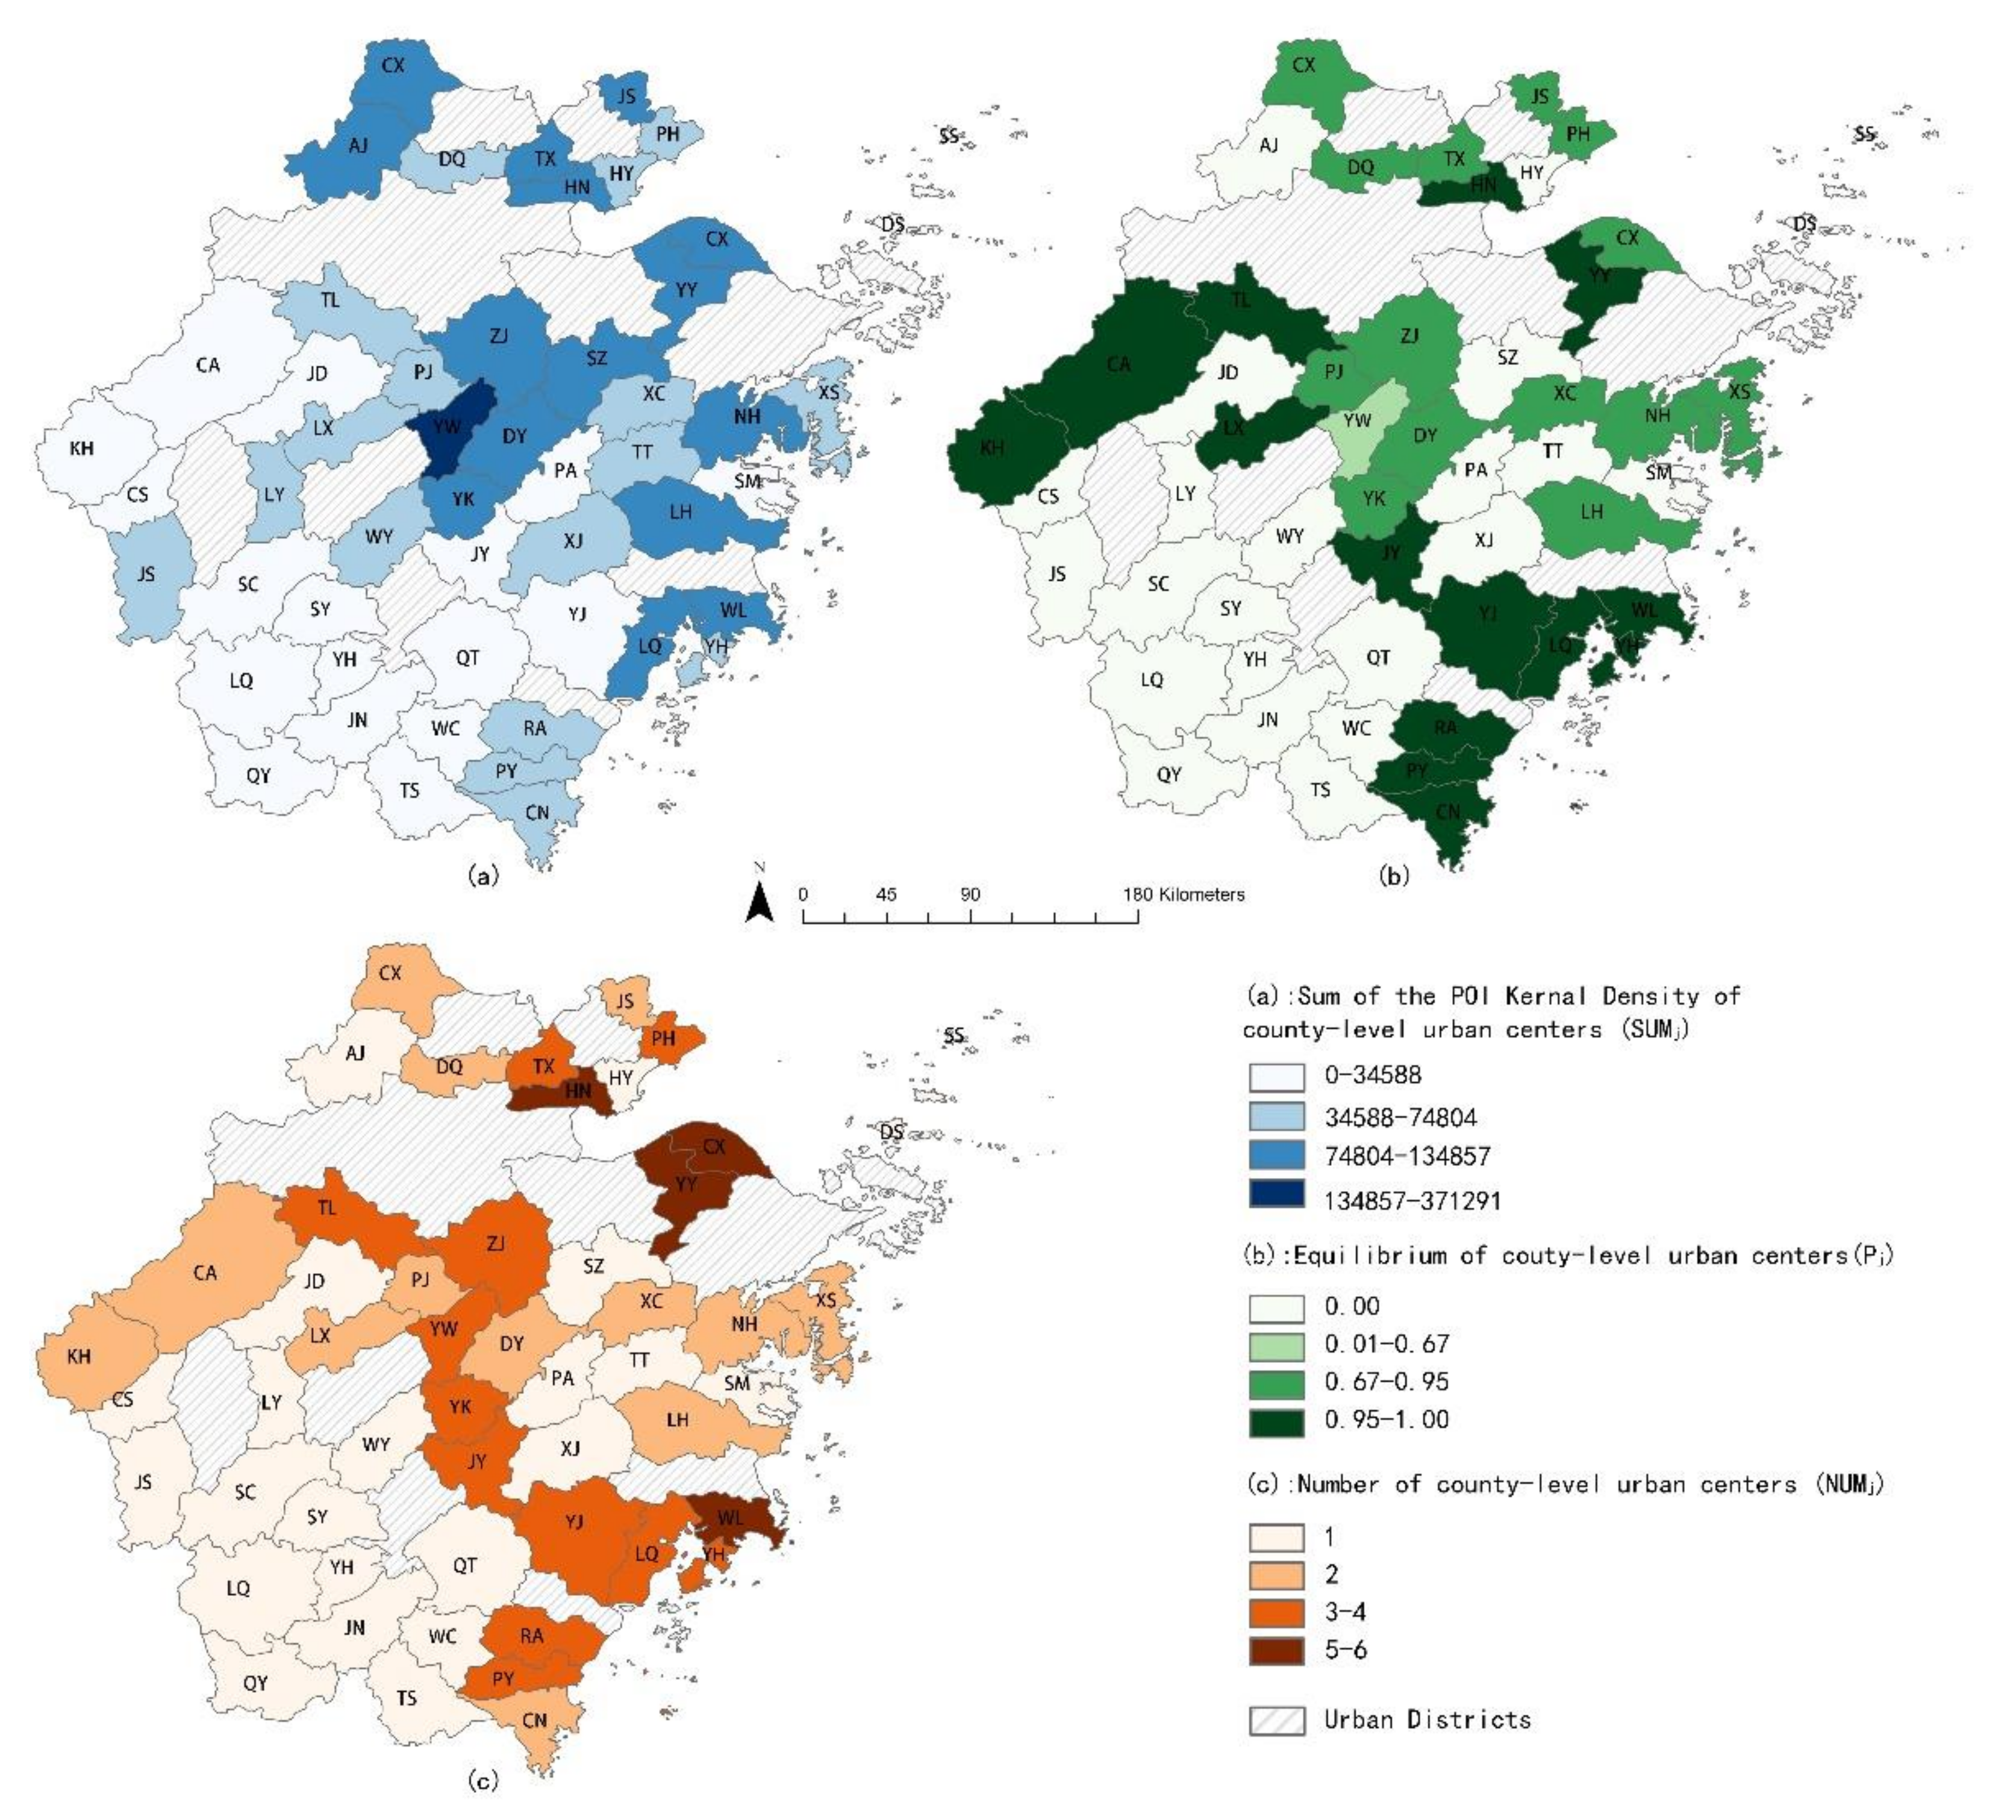
In total, 115 county-level urban centers were identified using the aforementioned measurement in Zhejiang Province, with an average of two urban centers per administrative unit. Note that the scale of each urban center varies significantly. The largest county-level urban center is located in Yiwu, which has a total KOP of over 300,000, while the smallest has a KOP of only 2000 and is located in Pinghu. The average KOP in urban centers was 27,019.88. Most of the county-level urban centers are concentrated in the coastal areas of Zhejiang Province, especially in the Hangzhou Bay region. In order to gain a better understanding of the county-level urban centers, we introduced the urban districts of prefectural cities as a control group. Compared with the control group, the average and minimum values of the two groups were relatively approximate, while the maximum urban center of the control group was more than twice that of the county-level group, as seen in Table 1. Meanwhile, the standard deviation of the county-level group was smaller than that of the control group, which means that the scale of county-level urban centers fluctuates less. Thus, the county-level urban centers are an indispensable part of the whole urban center system in the rapid urbanization area.

3.2. Polycentric Characteristics of County-Level Units
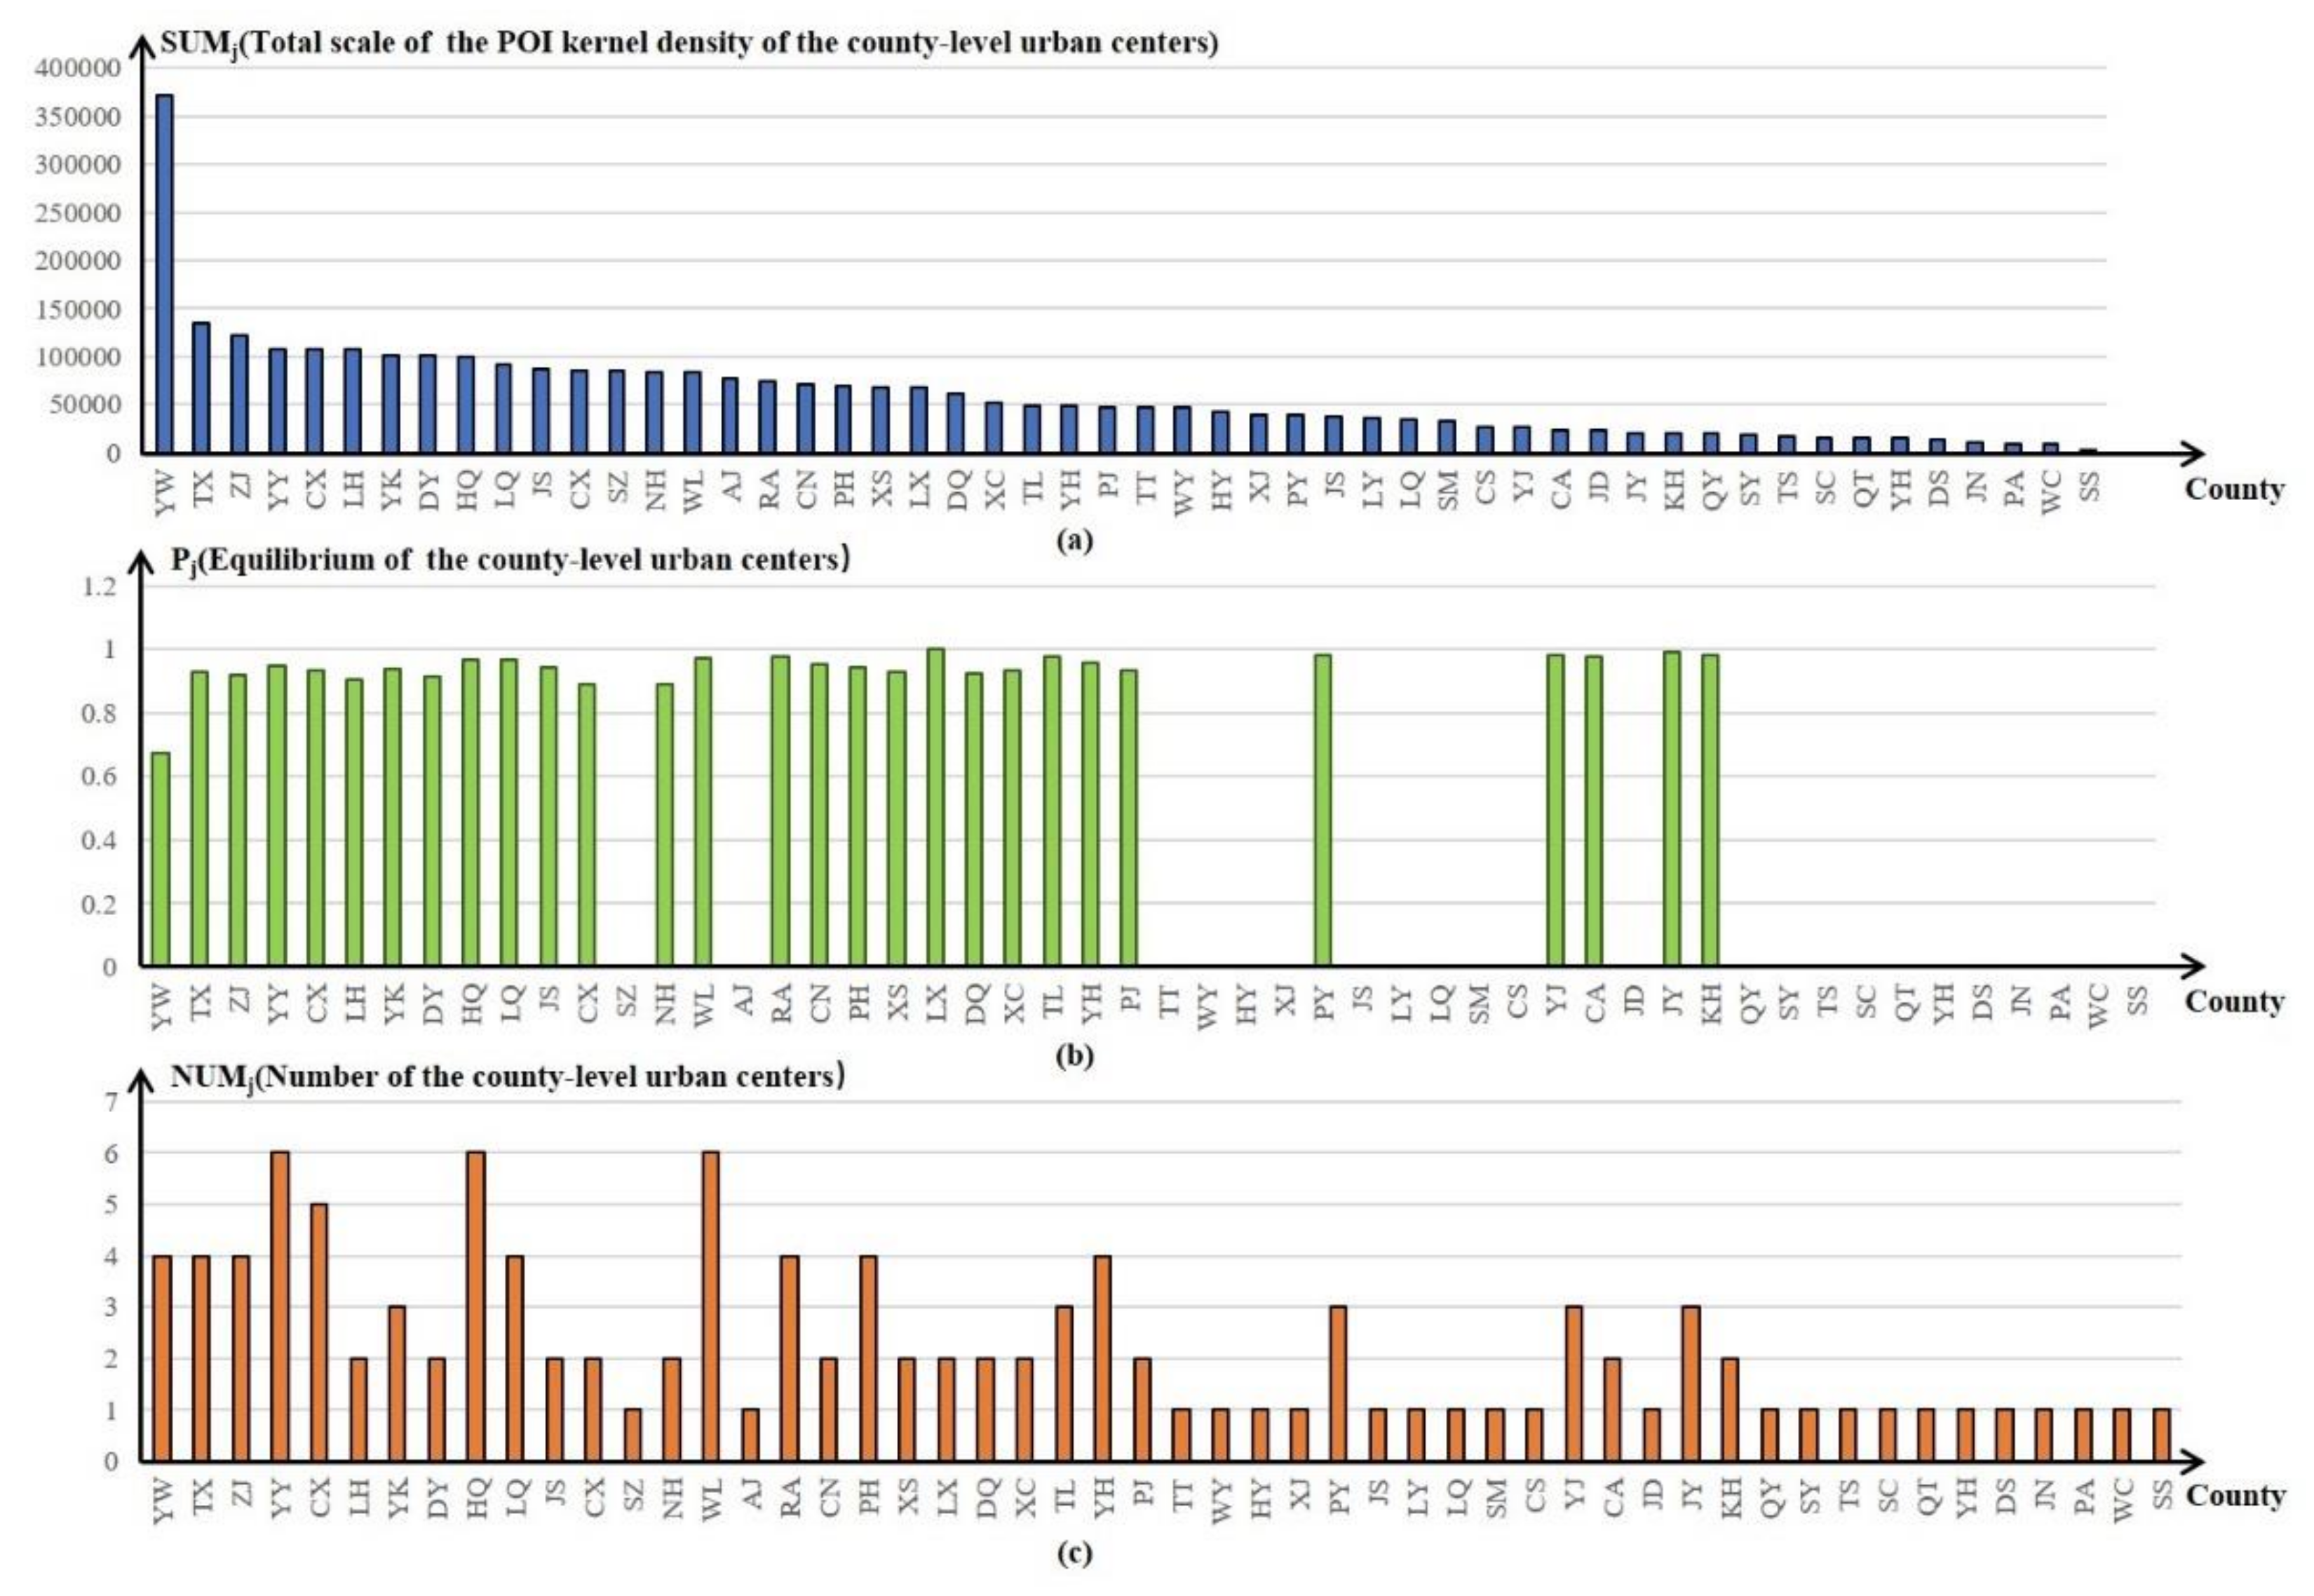
First, S U M j varies greatly among the different counties. By sorting the S U M j of all the units in descending order, it is not difficult to find that Yiwu is at the top of the sequence with great superiority as it has an ultra-large scale, which is 2.75 times that of the next largest, while the following counties decline steadily. Meanwhile, the P j of the county-level units showed the opposite effect. The average P j of the total 52 units is less than 0.5, as shown in Table 2. If we exclude the county-level units with P j equal to 0, the average P j is more than 0.9, expressing the well-balanced structure of the county-level urban centers in China’s rapid urbanization area. If we set the P j of each unit to the same order of S U M j (Figure 4), it stabilizes in an interval close to 1 after a period of volatile rise. Note that in Lanxi, which has two urban center structures, the equilibrium of the urban centers is nearly equal to 1 because it has two similar-scale urban centers. The N U M j of urban centers fluctuates between 1 and 6. Among them, 23 counties had only one center, which means they might be at the primary stage of urban center development and cannot even be considered as PURs. According to the P j and S U M j values, the growth of the urban centers is not monotonic but instead has some volatile characteristics. Based on the Pearson test, the correlation coefficient between S U M j and P j is 0.61, indicating a strong link. At the same time, the correlation coefficient between N U M j and the above two indicators is 0.64 and 0.74 respectively, also showing a significant correlation. Thus, there is strong collinearity among these three indicators.
Compared to the control group, there were less polycentric values of the county-level units than those of the urban districts in terms of scale and quantity. The average value of N U M j in the control group was almost 6 times that of the county-level units, and the average scale of the county-level units was approximately one-eighth that of the control group. In particular, the Hangzhou district, which is the largest district in Zhejiang Province, had 35 identified urban centers, while its S U M j of KOP was more than 4 times that of the largest county-level unit Yiwu. Conversely, the county-level units had a more balanced structure of urban centers than the urban district, considering that the average value of P j (PURs) in the county-level group was more than that of the urban districts. This indicates that the county-level urban centers have their own characteristics compared with the prefectural cities, proving that studying county-level polycentricity in rapid urbanization areas is meaningful and necessary.
In Zhejiang Province, as shown in Figure 5, the spatial distribution of the county-level units with three urban center characteristics had regional agglomeration features. Whether via the S U M j or N U M j , the county-level administrative units in the southwest area of Zhejiang Province expressed relatively small values. Conversely, the county-level units with relatively larger S U M j and N U M j values and a relatively smaller P j were concentrated in the central and coastal areas of Zhejiang Province.

3.3. Three Types of Polycentric County-Level Administrative Units

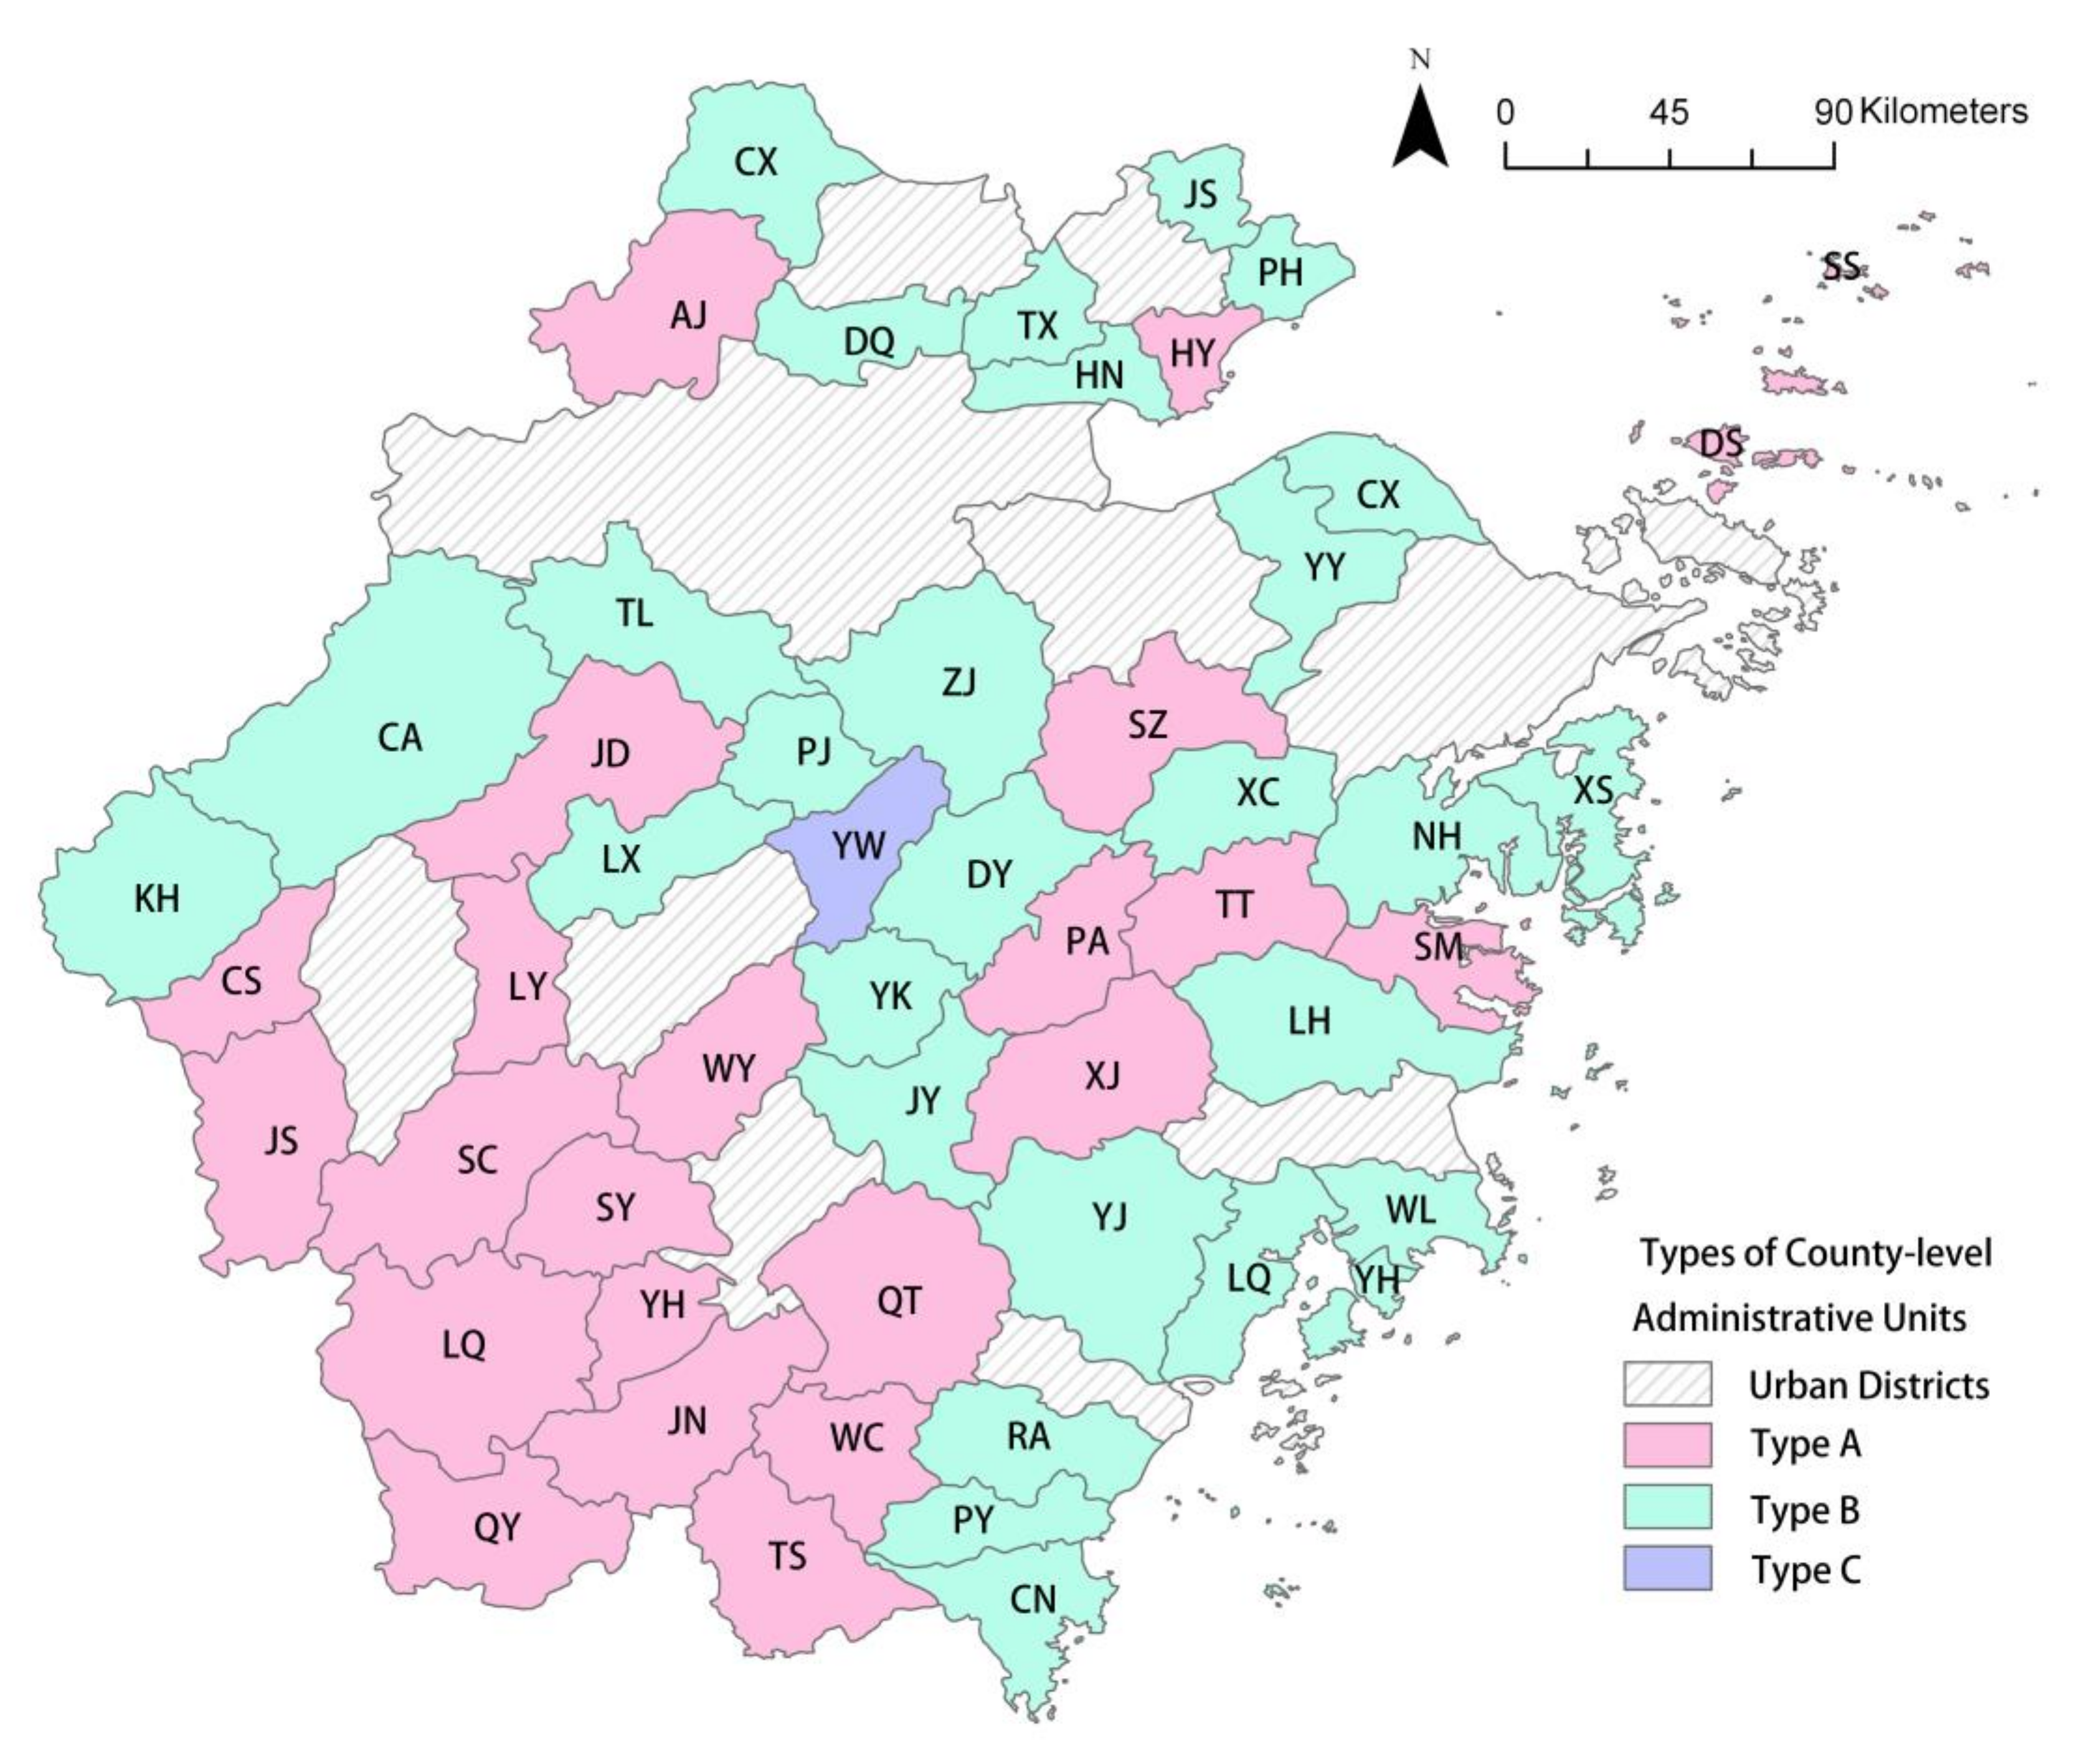
Based on the two-step cluster algorithm method, we can obtain more general spatial features of polycentric county units. The silhouette coefficient of the two-step cluster algorithm is 0.84, meaning that the clusters perform quite well with large cluster distances and tight intra-cluster distances. In this study, 52 county-level units were divided into three different types based on the cluster algorithm results.
The first type (Type A) contained 23 units, nearly half of the total amount, all of which had one urban center. The second type (Type B) contained 28 units. Compared with the counties in Type A, the N U M j values of the counties in Type B were between 2 and 6. Note that the smallest value of P j in those counties was beyond 0.88, indicating the well balanced polycentriciy. Meanwhile, this kind of county-level urban center structure was not observed in Yiwu, where the P j is only 0.67. As the total scale of urban centers in Yiwu was larger than the other 51 studied units and its P j was the smallest, Yiwu itself was classified as the third type (Type C).
In general, P j had the largest influence on the cluster algorithm, contributing a 73% rate. The contribution of S U M j accounted for 18%, while the remaining 9% was contributed by the N U M j . Therefore, it seems that spatial structure is a crucial characteristic of the county-level urban centers, similar to the general spatial characteristics of polycentric urban center systems in big cities [17,39].

3.4. Factors for Polycentric Classification

As Type C only had one unit, we mainly analyzed the 51 units that belonged to Types A and B. Therefore, the analysis was simplified to a binary classification focusing on the difference between single-center units and multi-center units. Using the RF method, the number of trees was 100, and the depth of trees was 10. We set the maximum feature number as 4.
The training model accuracy was more than 92%, reflecting its excellent classification ability. There were three units classified incorrectly in the simulation result. Haiyan and Shenzhou, which originally belonged to Type A, were erroneously categorized as Type B, while Pujiang, originally belonging to Type B was allocated to Type A. Figure 6 shows that 10 factors contributed to the classification, four of which (PBS, TRS, IFA, and AE) had significant impacts.
The results of the classification factor analysis indicated that economic development (IFA), topographical features (AE), public transportation (PBS), and consumption ability (TRS) are significant to county-level polycentricity. It is worth noting that the above four factors in this study represent the differential characteristics between two types of county-level polycentricity. Considering the fact that the county-level units in Type A are all single-center units while Type B contains 28 multi-center units, those four indicators are the most important socioeconomical and topographical indicators correlating to the emergence of PURs in the rapid urbanization area.
Our analysis suggests that the county-level units in mountainous areas with high average elevation are less likely to have a multi-center structure. Although the county-level units in Type A always have large administrative land scale, the complexity of their topography affects appropriate construction land, which is concentrated in the valleys and basins, limiting the urban land expansion. On the other hand, the county-level units in Type B always have relatively large area of plains, affording enough expansion space for urban development. Intra-county public transportation also helps to explain the emergence of PURs. The county-level units with more public bus stops are more likely to have a polycentric urban center system. Although Zhejiang Province is the most developed province in China, the number of private cars per capita was 0.18 in 2019, far lower than that in developed countries, such as the USA and Japan. Public transportation was still the first choice for a large part of local population in the county-level units. The rapid population stream relying on a mature public transportation network can disperse population to different urban areas or even the adjacent towns. Conversely, a weakened public transportation system would promote the population concentration and further attract the agglomeration of service facilities in one specific urban area because of the inconvenience of obtaining public services for local people. More importantly, due to the rapid economic development, the Type B counties all had strong development vitality. The average income of citizens continued to increase, and consumption activities were gradually enriched. In addition, local economic development promoted local government revenue and ensured sufficient investment in public facilities [43,44]. At the same time, enterprises also have enough funds to invest in fixed assets to achieve reproduction. These factors all contributed to county-level polycentric emergence. Conversely, the economic development of the Type A counties lagged compared with those in Type B, leading to fewer job opportunities. The siphon effect of the surrounding counties with rapid economic development caused population outflow, further affecting consumption activities [45,46]. Therefore, the relatively slow economic development and lower consumption abilities of the local population in Type A counties could not support the formation of a multi-center spatial structure.

4. Discussion

We identified county-level urban centers and measured their polycentricity, wherein 52 county-level units were divided into three types. As shown in Figure 7, the 23 units with only one urban center in Type A were mainly located in the south and west regions of Zhejiang Province, while most of the Type B counties were distributed in the east and north coastal areas. Compared to the prefectural-level cities in China, which belong to the control group in this study, or previous works, the probability of polycentric spatial structure emergence in the county-level administrative units with rapid urbanization is far lower. Among 318 prefectural-level cities in the empirical study by Liu, only 46 cities had a single urban center, accounting for 14% of the total [5]. However, in Zhejiang Province, which is one of the most developed regions in China, almost half of the counties did not have a multi-center structure. Based on the classification analysis results, for those counties with relatively high elevation and complex terrain conditions, strengthening the agglomeration of facilities in the central urban area may be a more appropriate means of urban spatial development. In the southwest mountain area of Zhejiang Province, the local governments recently proposed the urban development goal called “Small County and Big City”. This development strategy precisely focuses on the continuous concentration of the population and productive factors in the county-level central urban area by relocating the remote settlements with poor traffic conditions and insufficient development potential. Local governments can provide various high-quality public facilities through centralized assets investment, instead of the enormous expenditure on the vast village roads and infrastructures. At the same time, the agglomeration of population can also promote the development of the urban service sector, providing more jobs for local people. At the present stage of the urbanization, monocentric development may be the best approach for those county-level units belonging to Type A. Meanwhile, with the continuous expansion of central urban area, the polycentric development would be a suitable spatial structure for them in the future. It would be useful to evaluate whether the economic development level, fixed assets investment, and residential consumption ability can support the multi-center development before implementation of the polycentric plans if those local governments have a strong willingness. Furthermore, the county-level PURs had a more balanced spatial structure compared to the prefectural ones. This suggests that part of the county-level administrative units in the Chinese rapid urbanization area possessed a self-developing urban center system. The existing studies, which only paid attention to the prefectural cities, ignored the significance of the county-level polycentric development because their identification of urban centers concentrated on the central urban districts.
It must be noted that the factors in above discussion correlate to the polycentric classification and do not directly influence the polycentric development. Previous studies have expended significant efforts on identifying the influencing factors of urban centers and polycentricity. Thus, physical, socioeconomic, and political factors, such as topography, GDP, and regional planning have been proven to be associated with polycentric development [5,27,39,40,47]. The selection of 11 factors in this study is also in accordance with those previous findings. Although the results of our research on the polycentric classification factors were similar to those of previous works, the meaning implied by our results differs from the existing impact factor analysis. Our analysis emphasizes the major difference between the PURs and the single-center area, rather than the impact mechanism for polycentric development.

5. Conclusions

This research improves upon the study of polycentric urban development by proposing an urban center measurement that is suitable for county-level studies in rapid urbanization areas from the public service perspective and introduces a comprehensive polycentricity index to determine the spatial characteristics of inter-county urban centers. We identified county-level urban centers for 52 county-level administrative units in Zhejiang Province, which is a typical rapid urbanization area in China. Based on three polycentricity indicators, these 52 units were divided into three types to distinguish the differential features between polycentric areas and single-center regions. The results suggest that the county-level urban center structure varies in number, scale, and equilibrium, and is strongly associated with socioeconomic factors and topographical condition. Nearly half of the county-level units in Zhejiang Province did not have polycentric urban form with relatively higher elevation, lower residential consumption ability, undeveloped public transportation systems, and less fixed assets investment, compared to the polycentric units. Unlike the big cities in the rapid urbanization area, polycentricity may be not the best urban spatial structure for all kinds of county-level administrative units. Considering that promoting socioeconomic development is long-term work involving huge investment, and that the topographical conditions are hard to change, local governments should carefully propose the urban space development goals and strategies according to their own conditions.
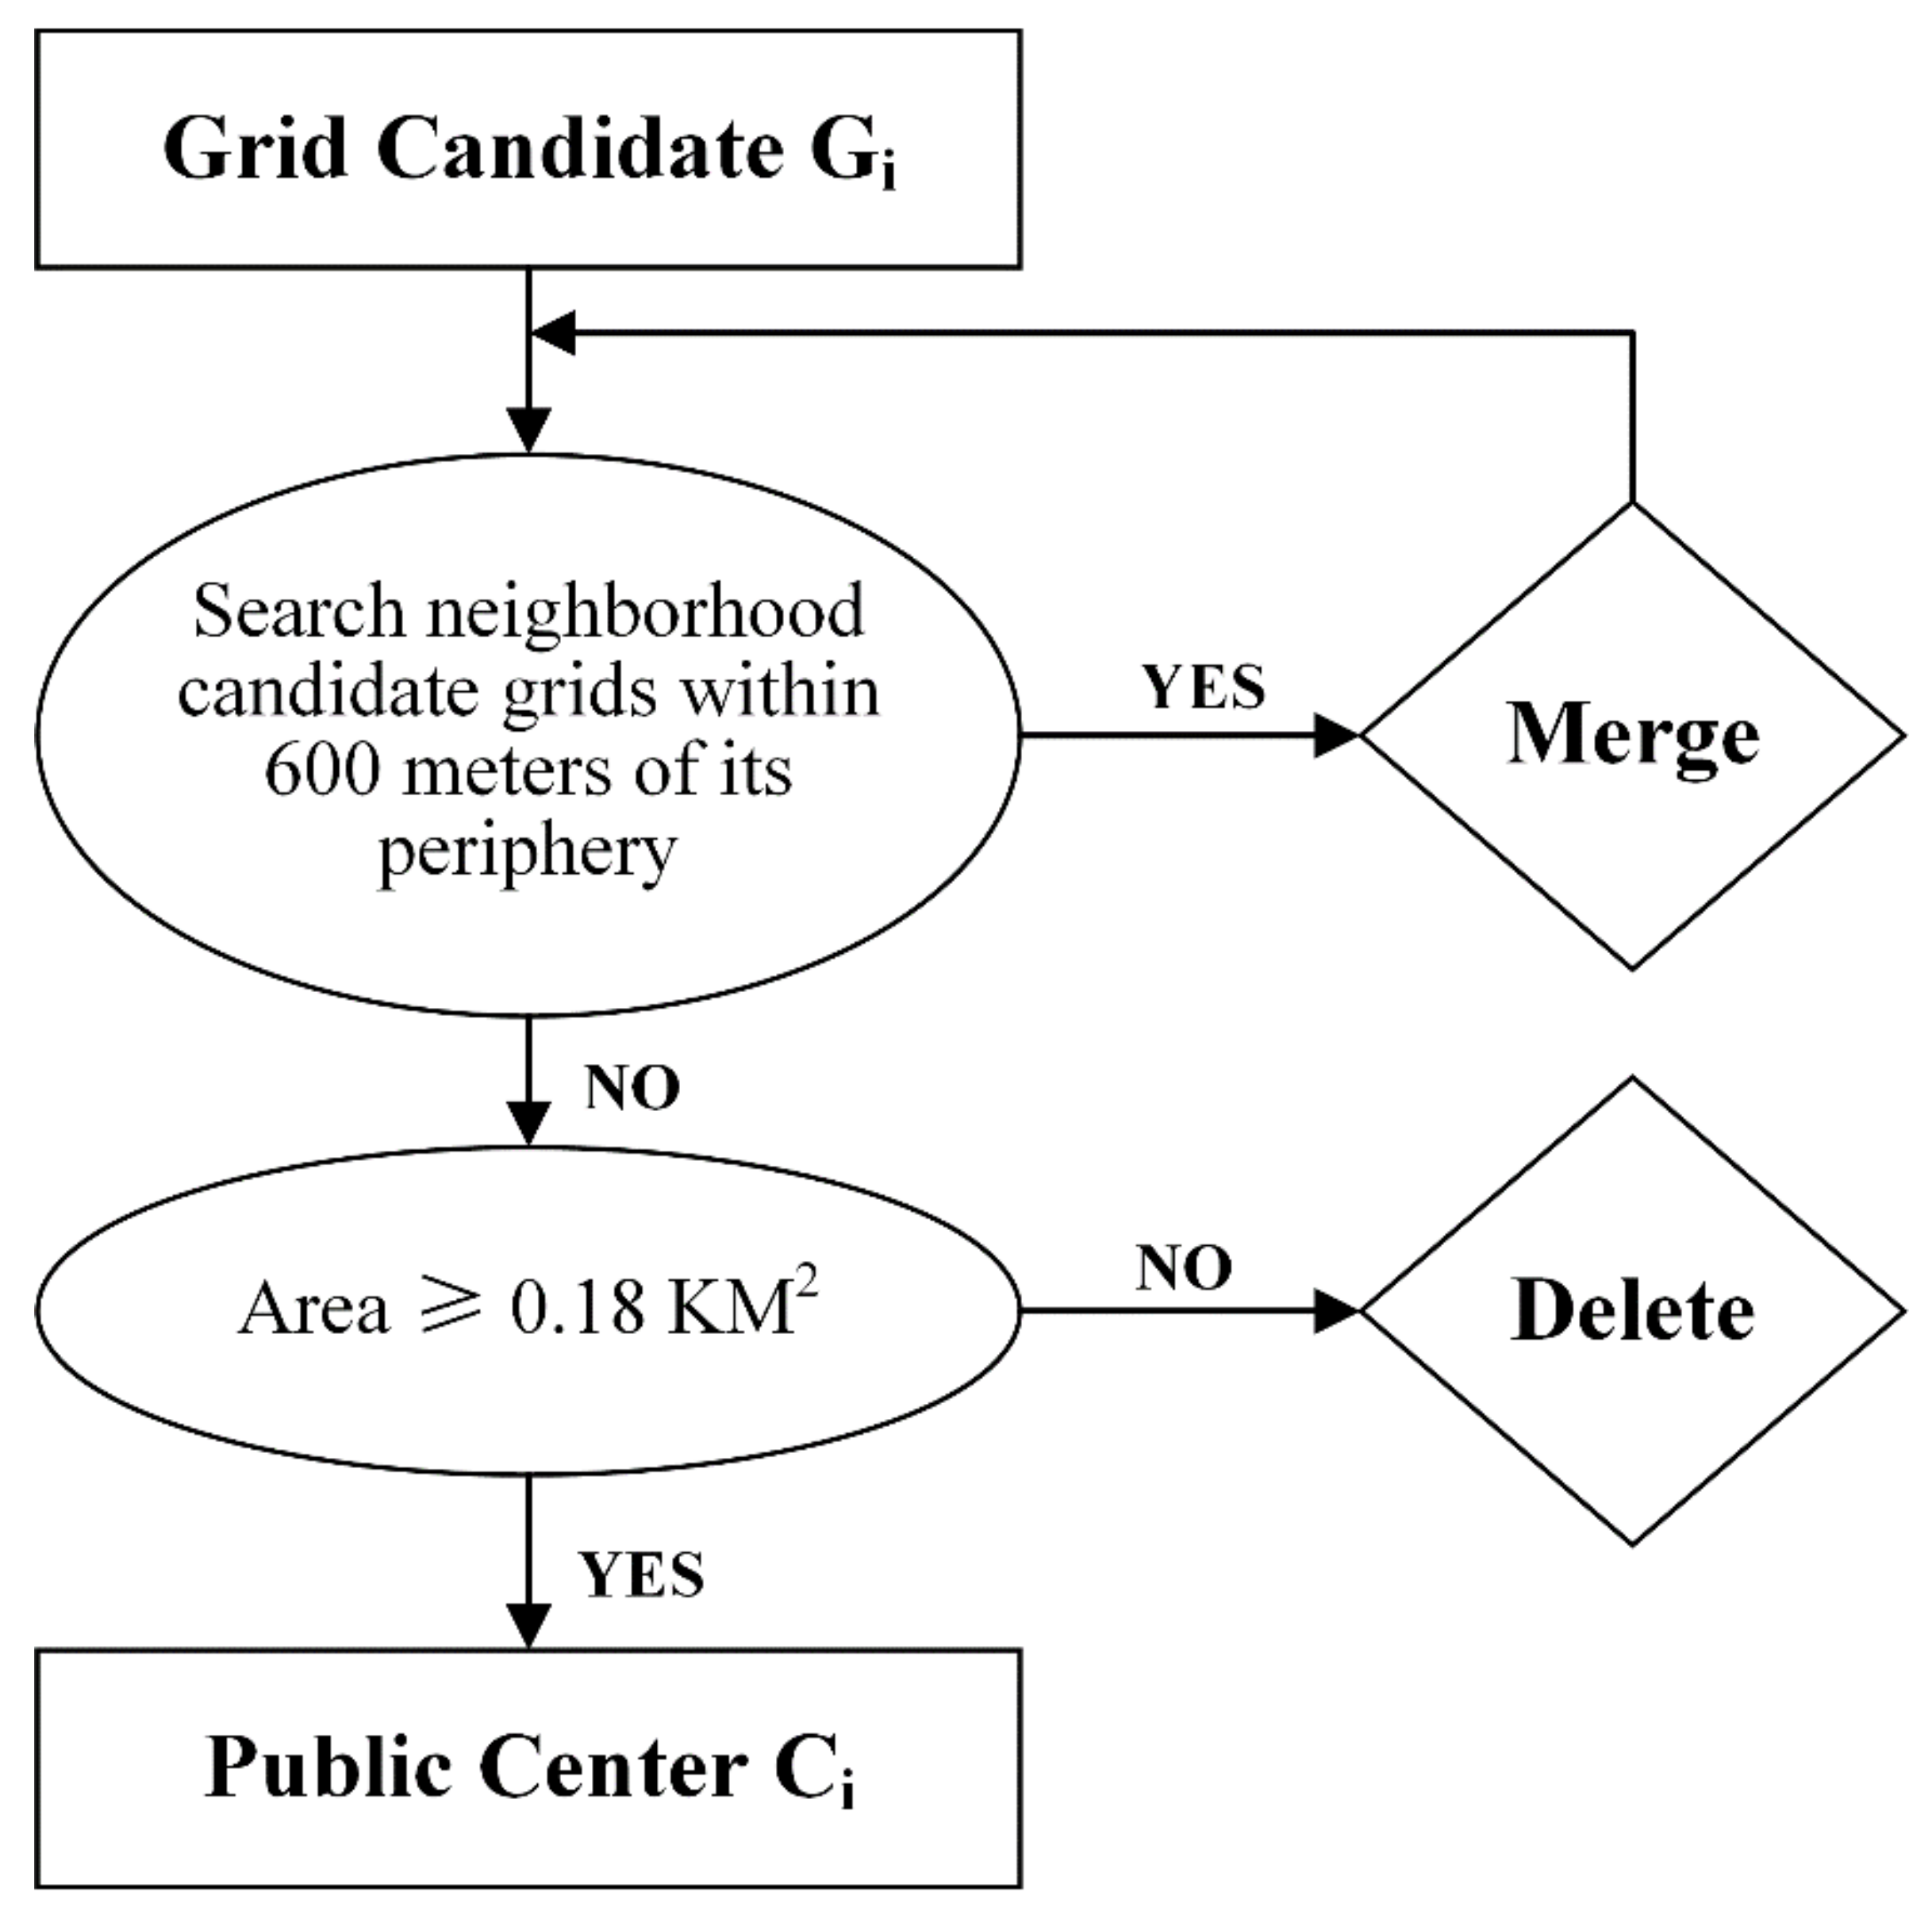
However, our study has several limitations, providing potential research directions for further studies. First, the measurements of urban centers and the polycentricity herein still have potential space for further comprehension. The two criteria of this threshold method (shown in Figure 1), including the search range and the minimum area, highly depend on practical experience and previous research. Using the minimum area of an urban center as an example, if the threshold land area is raised from 0.18 to 0.27 km2, that is to say, from two to three grids, the number of identified urban centers in Zhejiang Province would reduce by 19. In particular, for the Shensi county, there would be no urban centers identified in its administrative area. Future research could introduce comparable identification methods based on other big data or remote sensing data, such as luminous and demographic data, as the basis for verification. Using identification calibration in the empirical case study area, researchers can obtain a more reasonable standard for the threshold method to represent the urban center geographical boundary. Further, our study only revealed the spatial structure of county-level urban centers, ignoring the relationships at the inter-county level. The entire regional urban center system is composed of urban centers in prefectural cities and county-level areas, and the structure of urban centers is not only topographical but also functional. Previous studies have proposed some methods for distinguishing urban network by observing the flow among cities, such as information flow or population flow [16,48]. Nevertheless, from the county-level scale, obtaining data that can accurately represent the flows is still a very difficult problem, and there are few research teams that have proposed an effective approach. Therefore, further studies could use a correlation analysis based on appropriate county-level data, forming a relational polycentricity.

Author Contributions

Conceptualization, M.Z.; methodology, M.Z. and Y.R.; software, Y.R. and G.L.; validation, M.Z., Y.R. and G.L.; formal analysis, M.Z., G.L. and Q.C.; investigation, Y.R. and J.W.; resources, Q.C.; data curation, Y.R. and G.L.; writing—original draft preparation, M.Z., Y.R., G.L. and J.W.; writing—review and editing, M.Z. and Q.C.; visualization, Y.R., G.L. and J.W.; supervision, Q.C.; project administration, M.Z. and Q.C.; funding acquisition, Q.C. All authors have read and agreed to the published version of the manuscript.

Funding

This work was supported by the National Key R&D Program of China (2018YFD1100302), which is funded by the Ministry of Science and Technology of the People’s Republic of China.

Conflicts of Interest

The authors declare no conflict of interest, and they have no known competing financial interests or personal relationships that could have appeared to influence the work reported in this paper. The funders had no role in the design of the study; in the collection, analyses, or interpretation of data; in the writing of the manuscript; or in the decision to publish the results.

References

  1. Burges, E.W. The growth of the city. In The City; University of Chicago Press: Chicago, IL, USA, 1925; pp. 47–62. [Google Scholar]
  2. Hurd, R.M. Principles of City Land Values; Record and Guide: New York, NY, USA, 1905. [Google Scholar]
  3. Alonso, W. Location and Land Use. Toward a General Theory of Land Rent; Harvard University Press: Cambridge, MA, USA, 1964. [Google Scholar]
  4. Harris, C.D.; Ullman, E.L. The Nature of cities. Ann. Am. Acad. Political Soc. Sci. 1945, 242, 7–17. [Google Scholar] [CrossRef]
  5. Liu, X.; Wang, M. How polycentric is urban China and why? A case study of 318 cities. Landsc. Urban. Plan. 2016, 151, 10–20. [Google Scholar] [CrossRef]
  6. Anderson, N.B.; Bogart, W.T. The Structure of sprawl: Identifying and characterizing employment centers in polycentric metropolitan areas. Am. J. Econ. Sociol. 2001, 60, 147–169. [Google Scholar] [CrossRef]
  7. Fang, C.; Yu, D. Urban agglomeration: An evolving concept of an emerging phenomenon. Landsc. Urban. Plan. 2017, 162, 126–136. [Google Scholar] [CrossRef]
  8. Hall, P.; Qian, W. The polycentric metropolis: A western European perspective on megacity regions. J. Urban. Reg. Plan. 2009, 3, 1–17. [Google Scholar]
  9. Meijers, E.; Waterhout, B.; Zonneveld, W.A.M. Closing the gap: Territorial cohesion through polycentric development. Eur. J. Spat. Dev. 2007, 24, 1–24. [Google Scholar]
  10. Halbert, L.; Convery, F.J.; Thierstein, A. Reflections on the polycentric metropolis. Built Environ. 2006, 32, 110–113. [Google Scholar] [CrossRef]
  11. Homsy, G.; Warner, M.E. Cities and sustainability: Polycentric action and multilevel governance. Urban. Aff. Rev. 2015, 51, 46–73. [Google Scholar] [CrossRef] [Green Version]
  12. Wegener, M. Polycentric Europe: More efficient, more equitable and more sustainable. In Proceedings of the International Seminar on Welfare and Competitiveness in the European Polycentric Urban Structure, Florence, Italy, 7 June 2013; Volume 7, pp. 62–64. [Google Scholar]
  13. Meijers, E. Summing small cities does not make a large city: Polycentric urban regions and the provision of cultural, leisure and sports amenities. Urban. Stud. 2008, 45, 2323–2342. [Google Scholar] [CrossRef]
  14. McGee T, G. The Urbanization Process in the Third World; G. Bell and Sons, Ltd.: London, UK, 1971. [Google Scholar]
  15. Liu, X.; Derudder, B.; Wang, M. Polycentric urban development in China: A multi-scale analysis. Environ. Plan. B Urban. Anal. City Sci. 2018, 45, 953–972. [Google Scholar] [CrossRef]
  16. Liu, X.; Derudder, B.; Wu, K. Measuring polycentric urban development in China: An intercity transportation network perspective. Reg. Stud. 2016, 50, 1302–1315. [Google Scholar] [CrossRef]
  17. Xu, Z.; Lin, J.; Lin, D. Networking and innovation in SMEs: Evidence from Guangdong Province, China. J. Small Bus. Enterp. Dev. 2008, 15, 788–801. [Google Scholar] [CrossRef]
  18. Mulligan, G.F. Agglomeration and central place theory: A review of the literature. Int. Reg. Sci. Rev. 1984, 9, 1–42. [Google Scholar] [CrossRef]
  19. He, C.; Zhou, Y.; Huang, Z. Fiscal decentralization, political centralization and land urbanization in China. Urban Geogr. 2016, 37, 436–457. [Google Scholar] [CrossRef]
  20. Shi, Y. From a single center city to a multi-centers city—Spatial organization pattern of metropolitan development in China. Urban. Plan. Rev. 1999, 3, 3–5. [Google Scholar]
  21. Fernández-Maldonado, A.M.; Romein, A.; Verkoren, O.; Parente Paula Pessoa, R. Polycentric structures in Latin American metropolitan areas: Identifying employment sub-centres. Reg. Stud. 2014, 48, 1954–1971. [Google Scholar] [CrossRef]
  22. Dökmeci, V.; Berköz, L. Transformation of Istanbul from a monocentric to a polycentric city. Eur. Plan. Stud. 1994, 2, 193–205. [Google Scholar] [CrossRef]
  23. Redfearn, C.L. The topography of metropolitan employment: Identifying centers of employment in a polycentric urban area. J. Urban Econ. 2007, 61, 519–541. [Google Scholar] [CrossRef]
  24. Yang, J.; Zhang, B.; Shi, Y. Theoretical frameworks of urban center system development. Urban Plan. Forum 2012, 1, 33–39. [Google Scholar]
  25. Small, C.; Pozzi, F.; Elvidge, C.D. Spatial analysis of global urban extent from DMSP-OLS night lights. Remote Sens. Environ. 2005, 96, 277–291. [Google Scholar] [CrossRef]
  26. Cai, J.; Huang, B.; Song, Y. Using multi-source geospatial big data to identify the structure of polycentric cities. Remote Sens. Environ. 2017, 202, 210–221. [Google Scholar] [CrossRef]
  27. McMillen, D.P. Nonparametric employment subcenter identification. J. Urban Econ. 2001, 50, 448–473. [Google Scholar] [CrossRef]
  28. Garreau, J. Edge City: Life on the New Frontier; Doubleday, Anchor Books: New York, NY, USA, 1991. [Google Scholar]
  29. Lou, G.; Chen, Q.; He, K.; Zhou, Y.; Shi, Z. Using nighttime light data and POI Big Data to detect the urban centers of Hangzhou. Remote Sens. 2019, 11, 1821. [Google Scholar] [CrossRef] [Green Version]
  30. Deng, Y.; Liu, J.; Liu, Y.; Liu, J.; Luo, A. Detecting urban polycentric structure from POI data. ISPRS Int. J. Geo-Inf. 2019, 8, 283. [Google Scholar] [CrossRef] [Green Version]
  31. Yu, L.; Yu, T.; Wu, Y.; Wu, G. Rethinking the identification of urban centers from the perspective of function distribution: A framework based on point-of-interest data. Sustainability 2020, 12, 1543. [Google Scholar] [CrossRef] [Green Version]
  32. Lee, B. “Edge” or “edgeless” cities? Urban spatial structure in US metropolitan areas, 1980 to 2000. J. Reg. Sci. 2007, 47, 479–515. [Google Scholar] [CrossRef]
  33. Wen, H.; Tao, Y. Polycentric urban structure and housing price in the transitional China: Evidence from Hangzhou. Habitat Int. 2015, 46, 138–146. [Google Scholar] [CrossRef]
  34. Wu, X.; Zhan, F.B.; Zhang, K.; Deng, Q. Application of a two-step cluster analysis and the Apriori algorithm to classify the deformation states of two typical colluvial landslides in the Three Gorges, China. Environ. Earth Sci. 2016, 75, 146.s. [Google Scholar] [CrossRef]
  35. Chiu, T.; Fang, D.P.; Chen, J.; Wang, Y.; Jeris, C. A robust and scalable clustering algorithm for mixed type attributes in large database environment. In Proceedings of the Seventh ACM SIGKDD International Conference on Knowledge Discovery and Data Mining, San Francisco, CA, USA, 26–29 August 2001; pp. 263–268. [Google Scholar]
  36. Schwarz, G. Estimating the dimension of a model. Ann. Stat. 1978, 6, 461–464. [Google Scholar] [CrossRef]
  37. Breiman, L. Bagging predictors. Mach. Learn. 1996, 24, 123–140. [Google Scholar] [CrossRef] [Green Version]
  38. Breiman, L. Random forests. Mach. Learn. 2001, 45, 5–32. [Google Scholar] [CrossRef] [Green Version]
  39. Chen, Z.; Yu, B.; Song, W.; Liu, H.; Wu, Q.; Shi, K.; Wu, J. A new approach for detecting urban centers and their spatial structure with nighttime light. IEEE Trans. Geosci. Remote Sens. 2017, 55, 6305–6319. [Google Scholar] [CrossRef]
  40. Barau, A.S.; Maconachie, R.; Ludin, A.N.M.; Abdulhamid, A. Urban morphology dynamics and environmental change in Kano, Nigeria. Land Use Policy 2015, 42, 307–317. [Google Scholar] [CrossRef] [Green Version]
  41. Cui, F.; Chen, X. Regional economic development under the “Province Governing County” System—Taking Zhejiang province as an example. Econ. Geogr. 2012, 32, 1–7. [Google Scholar]
  42. Cui, G.; Ma, R. The development and mechanism of bottom-up urbanization in China. Acta Geogr. Sin. 1999, 54, 12–21. [Google Scholar]
  43. Chen, S.; Zhang, J. Efficiency of local government financial expenditure in China: 1978–2005. Soc. Sci. China 2008, 4, 65–78. [Google Scholar]
  44. Ong, L.H. State-led urbanization in China: Skyscrapers, land revenue and “concentrated villages”. In The China Quarterly; Cambridge University Press: London, UK, 2014; pp. 162–179. [Google Scholar]
  45. Deng, X.; Huang, J.; Rozelle, S.; Uchida, E. Growth, population and industrialization and urban land expansion of China. J. Urban Econ. 2008, 63, 96–115. [Google Scholar] [CrossRef]
  46. Liu, Z.; Gu, H. Evolution characteristics of spatial concentration patterns of interprovincial population migration in China from 1985 to 2015. Appl. Spat. Anal. Policy 2020, 13, 375–391. [Google Scholar] [CrossRef]
  47. Malý, J. Impact of polycentric urban systems on intra-regional disparities: A micro-regional approach. Eur. Plan. Stud. 2016, 24, 116–138. [Google Scholar] [CrossRef]
  48. Ye, L.; Duan, X.; Ou, X. The urban network structure of Jiangsu province based on the traffic and information flow. Sci. Geogr. Sin. 2015, 35, 1230–1237. [Google Scholar]
Figure 1. Spatial boundary identification process of urban centers.
Sustainability 12 08285 g001
Figure 2. Location of Zhejiang Province. Note: Abbreviations in this figure are the first letters of each county’s name; for example, YW represents Yi Wu. The same applies in subsequent figures.
Sustainability 12 08285 g002
Figure 3. Point-of-interest (POI) data for 10 categories in Zhejiang Province.
Sustainability 12 08285 g003
Figure 4. Statistics of three polycentric indicators. (a) Total point-of-interest kernel density scale of the county-level urban centers in Zhejiang Province. (b) Equilibrium value of county-level urban centers in Zhejiang Province. (c) Number of county-level urban centers in Zhejiang Province. Note the series of P j , S U M j and N U M j in the descending order of S U M j .
Sustainability 12 08285 g004
Figure 5. Spatial distribution of county-level units with polycentric characteristics. (a) Spatial distribution of county-level units with S U M j . (b) Spatial distribution of county-level units with P j . (c) Spatial distribution of county-level units with N U M j .
Sustainability 12 08285 g005
Figure 6. Contribution importance of 10 classification factors based on the random forest method.
Sustainability 12 08285 g006
Figure 7. Spatial distribution of different types of polycentric units in Zhejiang Province.
Sustainability 12 08285 g007
Table 1. Descriptive statistics of urban centers.
NumberValue RangeMinimumMaximumMeanStandard Deviation
County-Level Administrative Unit115315,335.652234.90317,570.5527,019.8835,375.86
The Control Group (Urban Districts of Prefectural Cities)133645,204.261977.16647,181.4236,258.2181,470.55
Table 2. Descriptive statistics of the polycentric indicators.
IndicatorMinimumMaximumMeanStandard Deviation
County-level administrative unit N U M j 1.006.002.211.45
P j t o t a l 0.001.000.520.47
P j   P U R s 0.671.000.940.06
S U M j 3073.42371,291.4059,755.4955,390.65
The control group (urban districts of prefectural cities) N U M j 1.0035.0012.8010.17
P j 0.751.000.860.07
S U M j 116,708.101,513,717.16471,020.50393,137.11

