Sustainable Urban Street Comprising Permeable Pavement and Bioretention Facilities: A Practice


1
Department of Highway and Railway Engineering, Southeast University, Nanjing 210096, China
2
Department of Civil Engineering, Monash University, Clayton, VIC 3800, Australia
3
Department of Civil and Environmental Engineering, the Hong Kong Polytechnic University, Hung Hom, Kowloon, Hong Kong
*
Author to whom correspondence should be addressed.
Sustainability 2020, 12(19), 8288; https://0-doi-org.brum.beds.ac.uk/10.3390/su12198288
Submission received: 1 September 2020
/
Revised: 1 October 2020
/
Accepted: 3 October 2020
/
Published: 8 October 2020
(This article belongs to the Special Issue Sustainability of Transport Infrastructures)
Abstract
:Roadside bioretention and permeable pavements have proven effectiveness in rainwater filtration and waterlogging mitigation, but conventional street design approach could not accommodate their work in conjunction. In this research, possible roadside facilities allowing water transmission from permeable pavements and bioretention to the pipe system are proposed. Hydraulic properties of the comprised elements were analyzed, including rainfall intensity, permeable pavements, soil layers and pipe systems. A transformation method was formulated to obtain a successive time-intensity formula from conventional design parameters to describe the rainfall behavior, and therefore the water retention capacity of the bioretention could be considered. A test section of 1.6 km combining permeable pavements and roadside bioretention was constructed, and its hydraulic performance was predicted based on the proposed design method and Storm Water Management Model (SWMM). The research results suggest that the bioretention facilities and permeable pavements cooperate well in the test section. In a light rain event, the proposed street has favorable performance in rainwater collection and filtration. In a relatively intense rainstorm event, the street collects and filters water in the initial stage, but will have similar hydraulic performance to a conventional street once the retention facilities are saturated. Thus, no reduction in diameters of drainage pipes from conventional designs is suggested in similar projects.
1. Introduction
Runoff from streets is a main source of water contamination in urban areas, as dozens of contaminants, typically TSS (total suspended solid), heavy metals and organic contaminants, have been reported to exist with a considerable amount in runoff from urban roads [1,2,3,4,5]. Characteristics of the road runoff in the early stage of rainfall events are mainly investigated in related research due to high density of contaminants [6,7]. Besides, waterlogging is another typical hazard caused by runoff due to insufficient processing capacity of pipeline system in extreme storm events [8,9]. Several urban hydrological planning concepts have been introduced for runoff purification and waterlogging mitigation [10], among which “Best Management Practices, BMPs” [3] and “Low Impact Development, LID” [1,5] in the United States, “Sustainable Urban Drainage System, SUDS” in Europe and “Sponge City, SPC” in China [11] have been widely reported and proven to be efficient. In various design concepts, permeable pavement and roadside bioretention facilities are recommended since they are more practical and cost-efficient compared to some other facilities; for example, the rain gardens are limited by space shortage in urban areas, and the green roofs require labor-consuming construction and maintenance.
The permeable pavement was originally introduced to address rainwater membrane on pavement surface and therefore improve skid resistance for safety while driving [12]; however, its performance in runoff purification and waterlogging mitigation have been noticed and evaluated [13,14], and several additives [15,16] have been developed to improve the purification performance of permeable asphalt concrete. In existing permeable pavement projects, the rainwater in the pavement structure is collected and discharged to the pipe system despite of the contamination, while it would be favorable if the collected rainwater could be transmitted to the bioretention for further purification before the discharge. The roadside bioretention is reported to have the most favorable performance among all LID practices, and it is usually comprised of designed plants, pipe systems and engineering soil layers [1,17]. However, the retention capacity of roadside bioretention is not included in existing codes for street design, therefore it needs to be estimated individually in the design of a street. Several tools have been developed to predict the runoff treatment and retention performance of bioretention, such as “National Storm-water Management Calculator, SWC”, “System for Urban Storm-water Treatment and Analysis Integration, SUSTAIN” and “Storm Water Management Model, SWMM”, which has developed an LID module in the latest version [18,19]. However, these hydraulic simulation tools are not specially developed for road engineering and they demand hydraulic backgrounds.
In existing projects, conjunction work of permeable pavement and roadside bioretention is limited, possibly because their connections need special design to allow rainwater transmission, which is not included in the present design code, and a practical tool is needed for road engineers to evaluate the hydraulic performance conveniently and systematically. This paper investigates the possible solutions for cooperative work of permeable pavement and bioretention facilities. Hydraulics of relevant elements including the rainfall, pavement, soil and bioretention are analyzed. A transformation method is formulated to obtain a successive time-intensity formula from conventional design parameters to describe the rainfall behavior, and therefore the water retention capacity of the bioretention could be considered. A convenient and practical method is developed to predict the hydraulic performance of such streets. A test section was also constructed with its hydraulic performance evaluated.
2. Street Structure
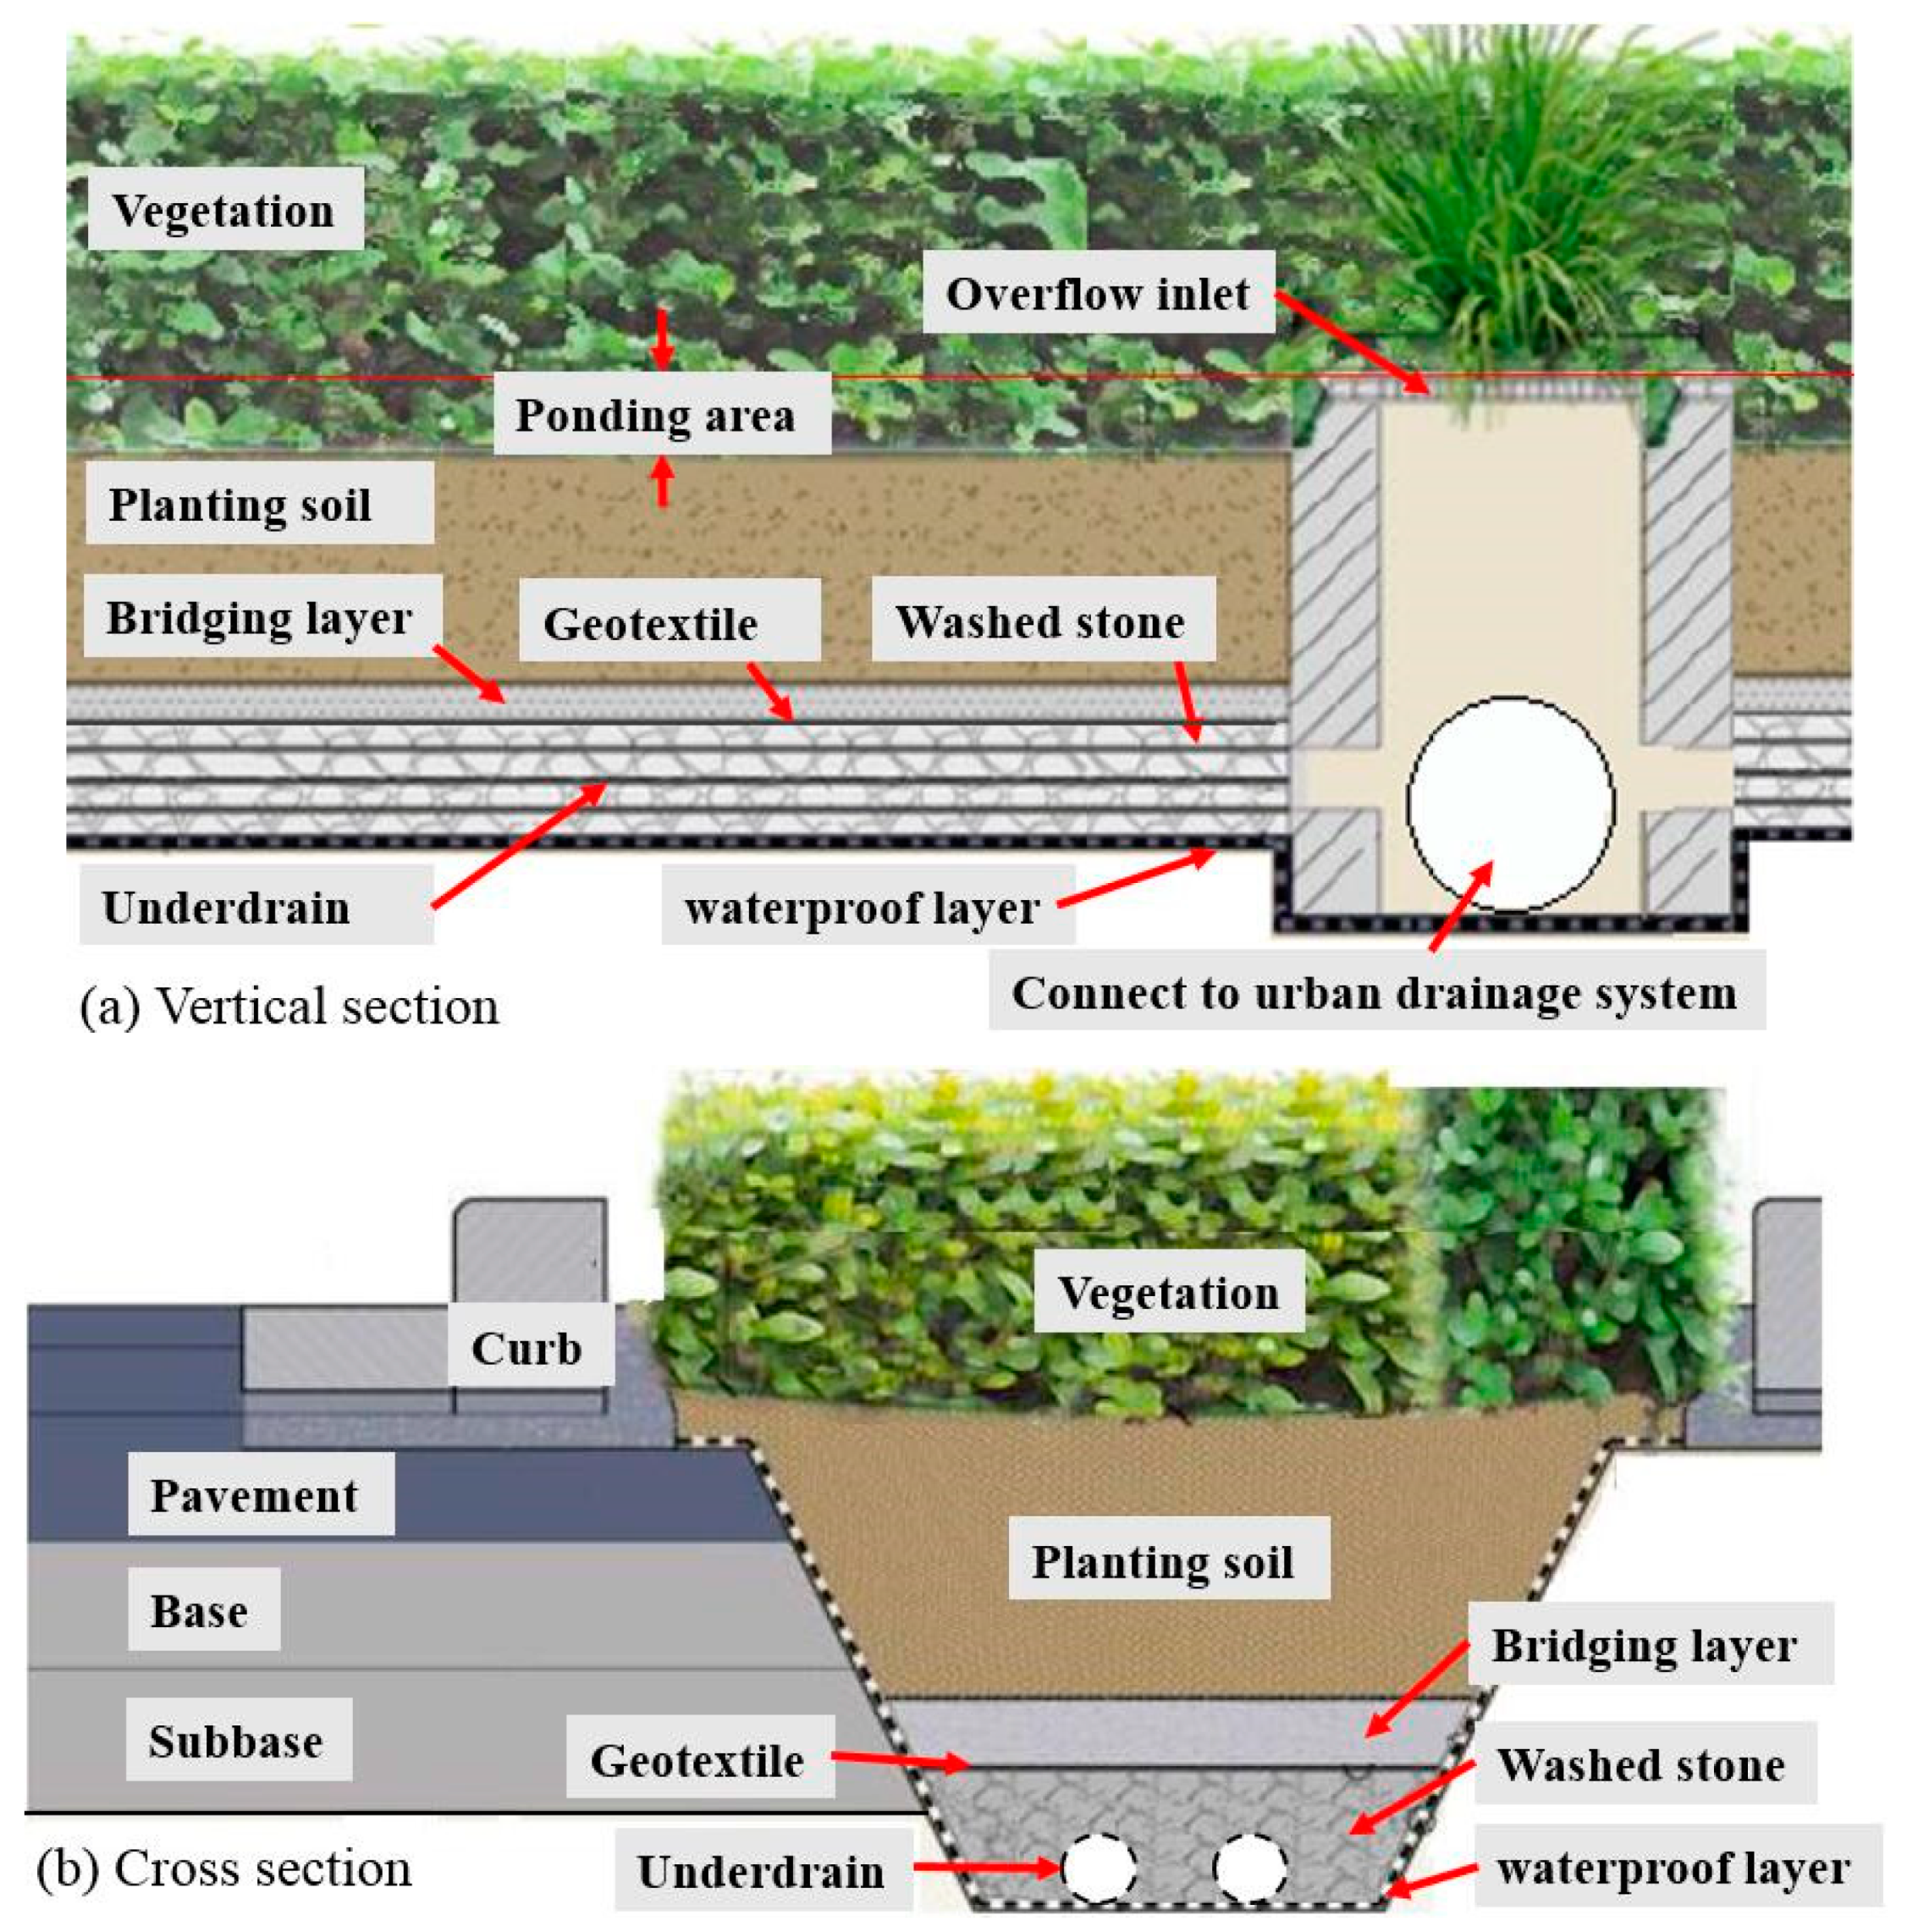
The structure and facilities of a typical roadside bioretention are presented in Figure 1. The ponding volume of the ponding area is controlled by the height of the overflow inlet as shown in Figure 1a. The vegetation needs special selection since ponding may happen frequently and the soil depth is limited by the underlying structures. Several herbaceous plants and undershrub such as Zinnia and Nandina domestica are generally planted instead of traditional street trees. In addition, the resistance of plants to salt should be considered as salt is usually used as the deicing agent for winter maintenance of pavement. The bridging layer is composed by medium-sized aggregates to create a separation between the planting soil and the underdrain facilities. An alternative geotextile as also shown in Figure 1a may provide a better separation but a potential clogging risk exists.
The washed stone and underdrain (perforated pipes) as shown in Figure 1b are for harvesting the filtered rainwater which will then be discharged, but in some cases, the water is stored for reuse [20]. When cooperating with compact pavement, the bioretention collects runoff through curbs with holes or gaps and no additional facilities are required. Permeable pavement has proven efficiency in road safety improvement, rainwater filtration and increasing the time of concentration, however the connection with bioretention needs specific design.
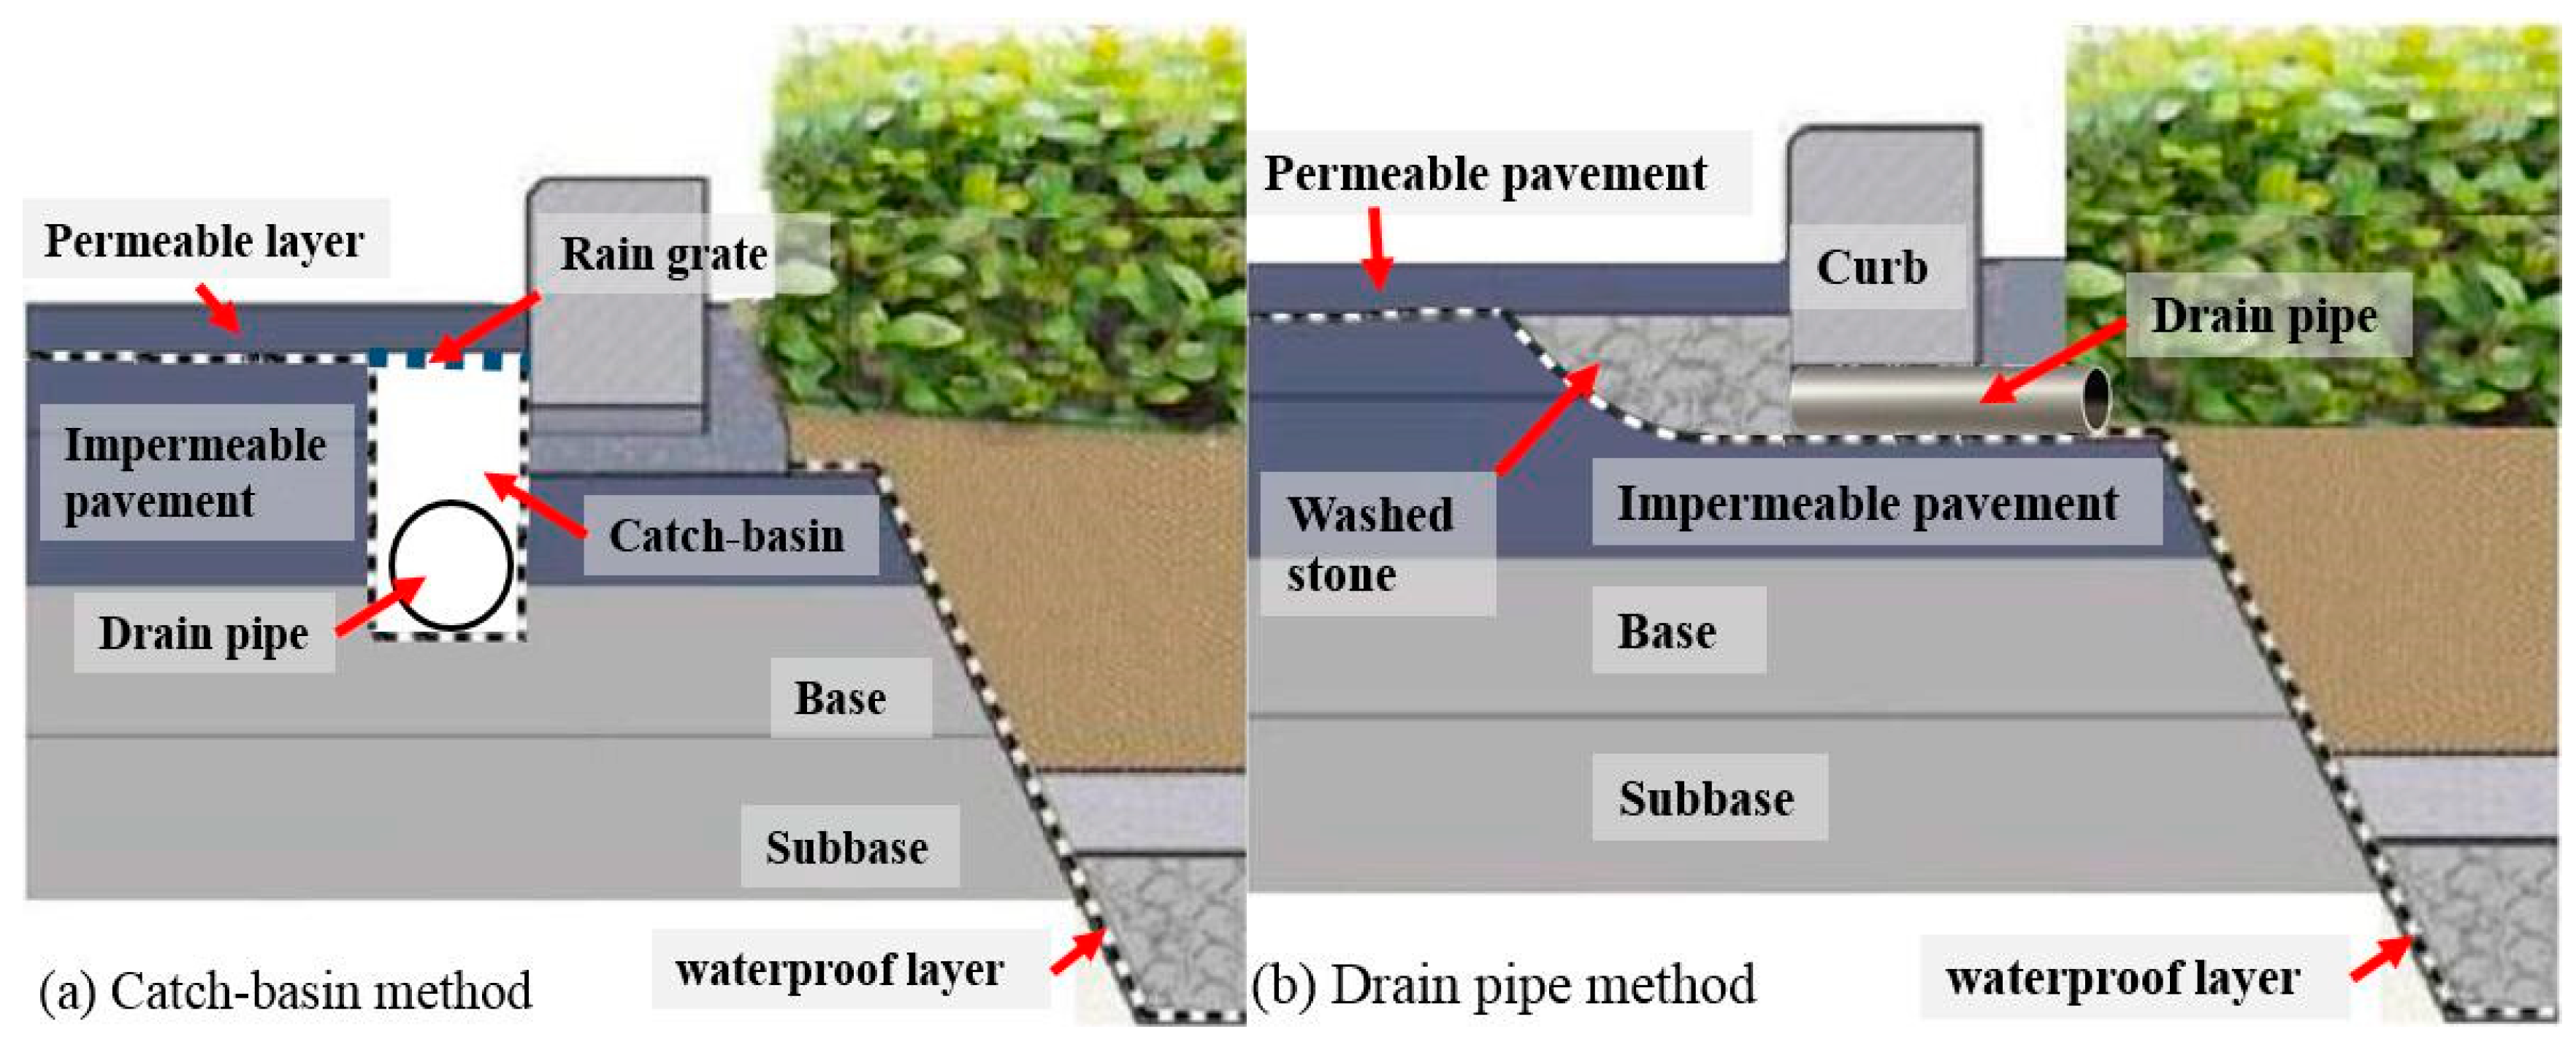
As shown in Figure 2a, one practical solution for permeable pavement with roadside bioretention is setting rain grates and catch-basins beneath the pavement, and introducing the curbs with gaps for bioretention. For street stability concerns, the permeable base and the permeable subbase are not suggested for streets although they may be used in sidewalks, parks or other pedestrian occasions; therefore, the base and the subbase in Figure 2a,b are impermeable. The drainage process for the street system in Figure 2a with the increasing intensity of a rain event has three stages. In the first stage, where the rainfall intensity is within the processing capacity of the permeable pavement, rainwater is filtered by pavement and collected through the rain grate to the catch basin. In the second stage, where the rainfall intensity is beyond the capacity of the pavement, the surface runoff develops and enters the bioretention through gaps or holes among the curbs. The runoff will then be filtered by the functional layers and enter the underdrain. In the last stage, where the processing capacity of the underdrain is saturated, the overflow develops and the rainwater will be collected through the overflow inlet.
Another practical method is presented in Figure 2b where a discontinuous washed stone layer is introduced to collect the filtered water from the permeable pavement, and the collected water is transported to bioretention through a drain pipe. A longitudinally continuous washed stone strip or perforated pipe would have more favorable water-collecting performance, but would lead to compaction problems in the surface pavement; therefore, the traffic loads need to be considered before utilization. This method is not applicable for thick permeable pavement as a backward flow from the bioretention to the pavement structure may happen. However, in an urban street with a thin permeable upper layer, this connection method is suggested since the rainwater from pavement structures could be filtered further by the bioretention and this method is implemented in the test section.
3. Method
A hydraulic analysis was conducted on the element concerned in the street design, including rainfall intensity, pavement and soil permeability, and ponding and overflow in the bioretention. The computational logic comprising these elements are presented and a calculation procedure based on C# was developed to help in the calculation.
3.1. Rainfall
In a conventional urban drainage design process, the required processing capacity or flow capacity (Q, m3/s) of the pipeline system is determined by the expected runoff as follows [21]:
where A is the catchment area in m2; q is the average rainfall intensity in mm/min; and is the runoff coefficient, a dimensionless factor taken as the ratio between the runoff and the precipitation. However, apart from drainage through the pipeline system, the pavement and bioretention can retain a certain amount of rainwater and mitigate the waterlogging risks. In order to take the retention capacity of bioretention into consideration, the time-intensity characteristic of the rainfall needs to be obtained, and a method is therefore formulated to build such time-intensity characteristic based on the average rainfall intensity (q). In the conventional street design method, the average rainfall intensity (q) is calculated by an empirical intensity-duration formula as seen in Equation (2) [22].
where t is the duration of rainfall in min; a, b and c are rainfall parameters, varying with meteorological localities and the return period. If the rain intensity at the moment of time ‘t’ (min) is assumed to be i(t), the average rainfall intensity, q (mm/min), can be written as:
Taking the derivative of both sides of Equation (3) gives:
The rain intensity at the moment of time ‘t’ can therefore written as:
In this model, the moment with the maximum rainfall intensity needs to be assigned, and a parameter r % is defined as the percentage of time before the maximum rainfall intensity appears, thus rainfall intensity before and after the maximum can be described as Equation (6) and Equation (7).
where the variable tb is the time before the moment with the maximum rainfall intensity, min; itb is the rainfall intensity at tb, mm/min; ta is the time after maximum rainfall intensity, min; and ita is the rainfall intensity at ta, mm/min.
3.2. Pavement
Hydraulic and mechanical performance of a permeable pavement has been well investigated in existing literatures to help in design, construction, maintenance and rainwater quality prediction [23] of permeable pavement projects. The main purpose of permeable pavement is to increase the skip resistance and filter the rainwater, while the retention capacity of the pavement is relatively limited. A runoff coefficient (namely the ratio between the volume of discharged rainwater and the precipitation received by the pavement [24,25]) is used to describe the retention capacity of pavement as shown in Equation (8). Considering structural differences among driveways, bicycle lanes and sidewalks, different runoff coefficients can be assigned to individual lanes in the calculation procedure.
where f is the weighted average runoff coefficient, dimensionless; fn is the runoff coefficient of the nth pavement, dimensionless; and wn is the width of the nth pavement, m. It should be mentioned that porous asphalt may gradually lose permeability due to void blocking and compaction, which could be reflected by an increased runoff coefficient. Therefore, Equation (8) is also valid in characterizing the hydraulic performance of pavement after long-time services.
3.3. Soil and Ponding Area
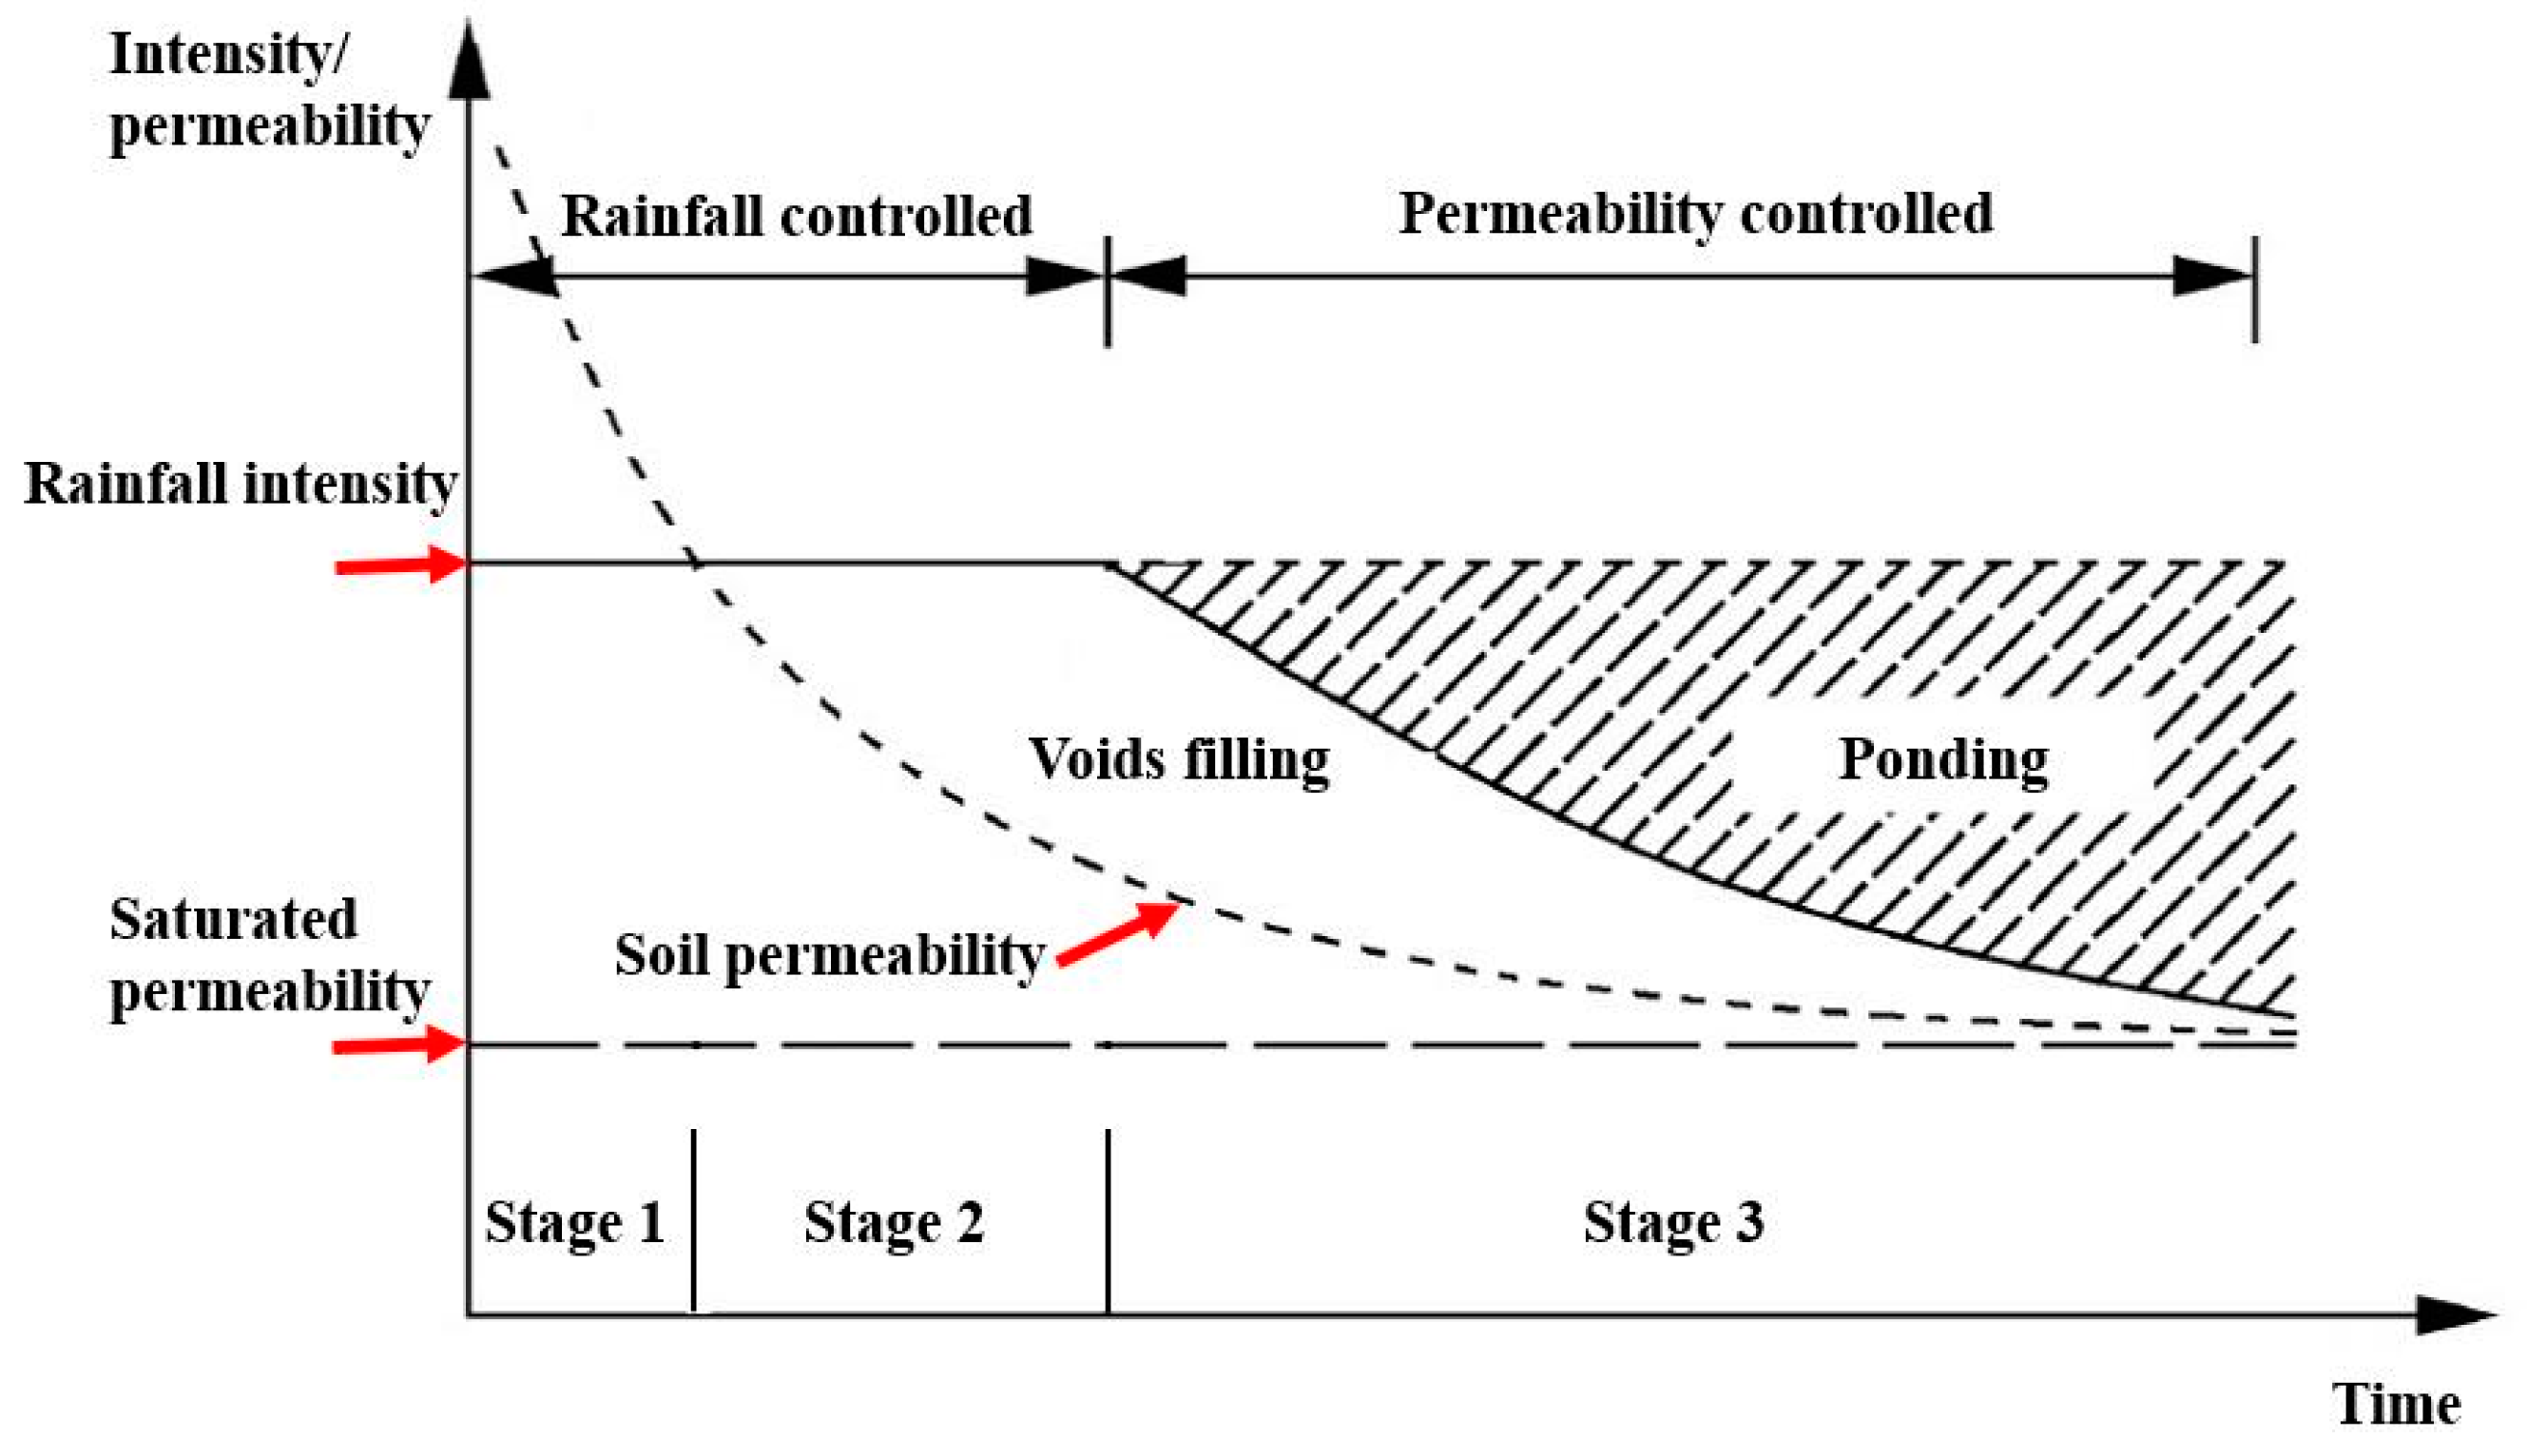
Soil layers are the main media for water filtration in the bioretention and several researches have been conducted for the filtration improvement. Aggregates including the bridging layer and the washed stone are also treated as soil in the design. Ponding happens when the soil layers are saturated. The relationships between the soil permeability, rainfall intensity and ponding are presented in Figure 3. The soil permeability will decrease with water content until saturation. Several theories have been developed to describe the relationship, such as Horton’s infiltration model [26]. The soil permeability is presented by a decreasing dashed line in Figure 3 and the saturated permeability is indicated by a horizontal dashed line. A storm event with constant rainfall intensity is presented in the figure by a horizontal line.
Three stages can be observed from Figure 3. In stage 1, the permeability of soil layers exceeds the rainfall intensity. In this stage, no ponding develops and the volume of water infiltrated is determined by the rainfall intensity. All water is absorbed by soil particles and no infiltration happens [27]. In stage 2, the rainfall intensity exceeds the soil permeability but ponding does not happen immediately and the excessive water will fill the voids in the soil. In stage 3, the voids are filled gradually and a bottom-top saturation happens in soil layers. Ponding develops gradually and the retention capacity of the ponding area is calculated as the volume of a quadrangular frustum pyramid considering the longitudinal slope of a street. Concrete dams could be constructed to contain more water if the slope is relatively sharp [1]. In the calculation procedure, two individual infiltration rates (before and after saturation) can be assigned to each soil layer [26].
3.4. Overflow
When the retention capacity of the ponding area is exceeded, overflow enters the drainage system through the overflow inlet without soil filtration. A hanging basket is usually installed at the overflow inlet for retention of leaves and major solid objects. Overflow capacity is determined by the discharge capacity of the pipe outlets, which can be predicted by the full pipe flow equation, an adapted version from Manning’s formula, as shown in Equation (9) [28]. The discharge capacity of the perforated pipes collecting in the underdrain is also calculated by Equation (9), while the Hazen-Williams equation [29] need to be introduced if pumps are utilized in drainage.
where C is the discharge capacity, m3/s; d is the pipe diameter, m; n is the Manning’s roughness coefficient, dimensionless; and S is the pipe slop, dimensionless.
3.5. Computational Logic
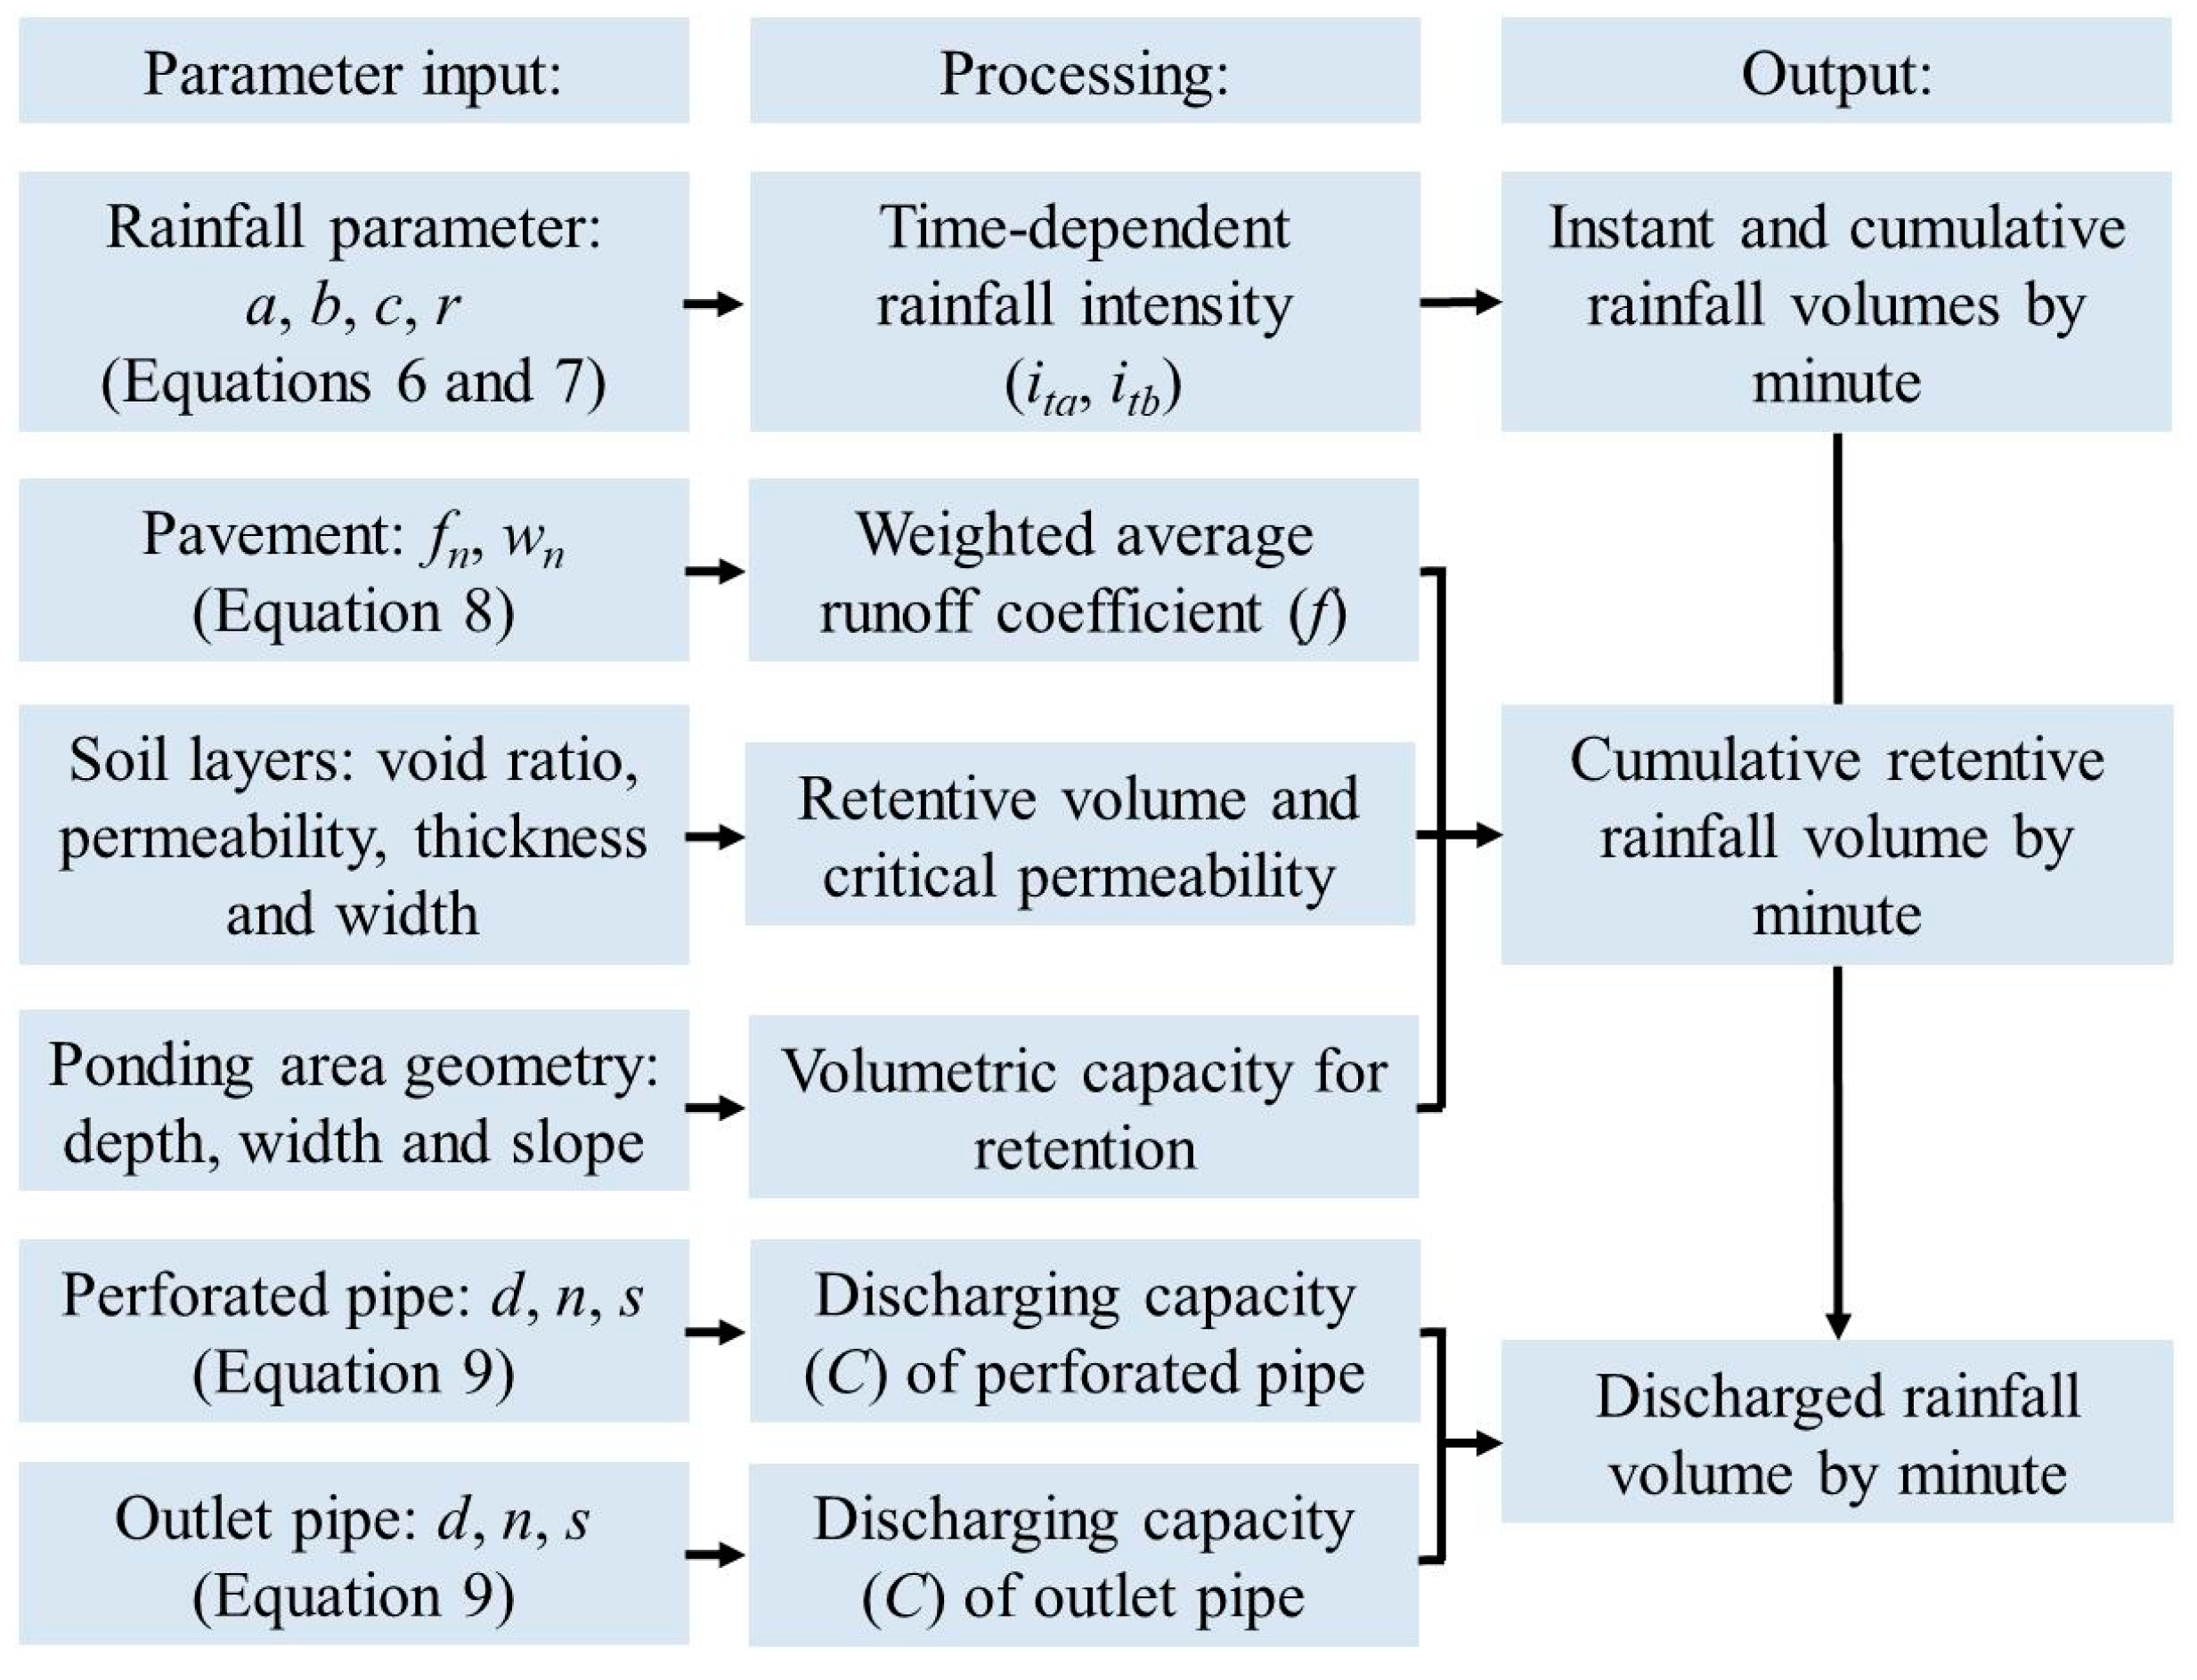
The computational logic of the calculation procedure is presented in Figure 4. Rainfall parameters (i.e., the average rainfall intensity (q) and the percentage of time before the maximum rainfall intensity (r)) are input at the beginning of the procedure, and these parameters are turned into a time-intensity series (i.e., a series of rainwater volume by minutes) according to Equations (6) and (7). The rainwater enters the bioretention after a reduction of pavement structures by weighted average runoff coefficient (see Equation (8)). In the computational logic, the rainwater is then absorbed by the soil layers and the status of the soil layers is judged after absorption of the rainwater produced in one minute, where the depths of different layers, permeability (i.e., infiltration rate) and water content for saturation need to be provided. The perforated pipe starts to work if all soil layers reach their field water capacity, and the discharge capacity of the pipe is determined by Equation (9). Ponding takes place when the soil layers are saturated or the infiltration rate is insufficient. Excessive water enters the drainage system directly through overflow inlet if the total ponding capacity is saturated. Also, the discharge capacity of the outlet pipes is determined by Equation (9). The calculation is realized by a software based on C#.
4. Shi-Yang Street Project
4.1. Project Description
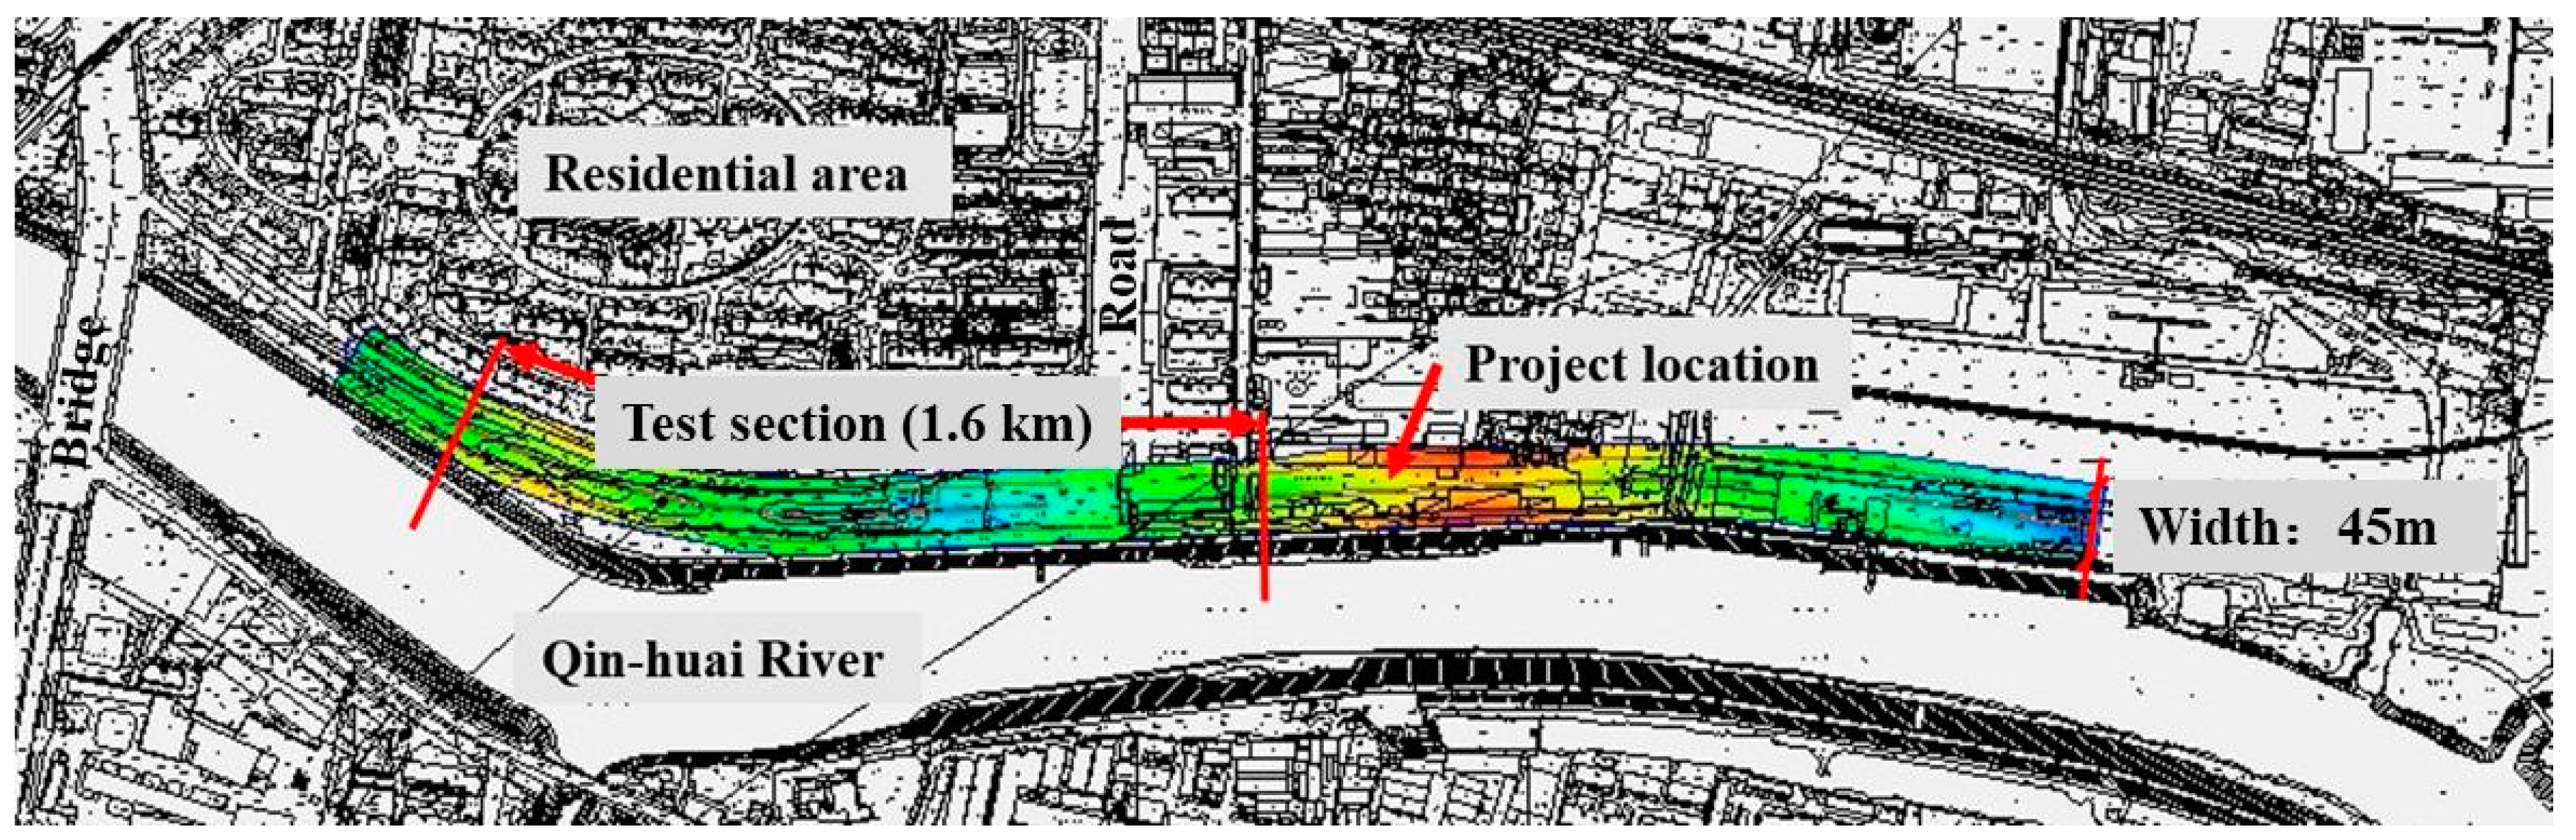
The test section is located at Nanjing (32.06° N, 118.80° E), Jiangsu Province, China. The city has a humid subtropical climate with damp conditions throughout the year and the waterlogging risk is a major concern in its urban planning. For example, several severe waterlogging events have been witnessed in recent years [9]. Shi-yang Street project is adjacent to the Qin-huai River, an important water system and scenery spot, as presented in Figure 5. Runoff from the street is collected and discharged to the Qin-huai River, which may intensify the waterlogging and bring contaminations to the river. Thus, a bioretention was constructed to improve the water quality and mitigate waterlogging problem.
This project had a total length of 3.1 km including a test section of 1.6 km that combined the permeable pavement and roadside bioretention. The total width of the street was 45 m, including sidewalks of 3.5 × 2 m, bicycle lanes of 3.5 × 2 m, driveways of 11.5 × 2 m, roadside bioretention of 2.5 × 2 m. The median divider with a width of 3 m was also used as a bioretention and was referred to as median bioretention. Permeable asphalt (PA) concrete with a nominal maximum aggregate size (NMAS) of 13.2 mm (i.e., PA-13) was utilized in bicycle lanes. High-viscosity asphalt was used for the PA-13 pavement and had a kinetic viscosity (60 °C) of 1.43 × 10⁵ Pa·s and a softening point of 91 °C. Underlying drainage pipes were installed inside the PA pavement to collect water. Dense graded asphalt concrete (AC) pavement was used in driveways considering heavy traffic loads. The NMAS for the AC was also 13.2 mm and the concrete was therefore referred as AC-13. The asphalt used for the AC concrete was styrene-butadiene-styrene (SBS) modified asphalt (PG 76–22). The air void ratios for the PA and AC concretes were 18.5% and 4.2%, respectively. Rutting resistance of the PA and AC concretes used in this test section in dry or saturated conditions was evaluated by repeated loading tests as described in literature [30], where cyclic pressure up to 700 kPa was applied to PA and AC concrete specimens in dry and saturated conditions and the increase in the strain of the specimens per load cycle was used as the indicator for rutting resistance, a slow increase in strain indicated superior rutting resistance. The results showed that for PA specimens, the ratio was 1.99 µε/cycle in a dry condition and 3.41 µε/cycle in a saturated condition, while for AC specimens, it was 0.08 µε/cycle and 0.13 µε/cycle in dry and saturated conditions respectively. The results suggest that AC concrete has much superior resistance to rutting than PA concrete, and rainwater is unfavorable for both types of concrete in terms of rutting resistance. Therefore, pavement structures were not suggested for rainwater retention and the rainwater needs to be drained out. PA concrete was not used in driveways for heavy traffic loads.
Traditional rainwater grates were replaced by gaps (0.3 m wide) between curbs to collect runoff from driveways and bicycle lanes. Ponding areas had a maximum depth of 15 cm while the overflow inlets were 5 cm above the planting soil. Charcoal (2%, by volume) was added to planting soil for water filtration. The total depth of the soil layers was about 70 cm including a geotextile layer and a 15 cm washed stone layer that contained a perforated pipe with a diameter of 10 cm. It should be mentioned that the proposed design increased the construction cost by only about 3%, mainly due to the added charcoal.
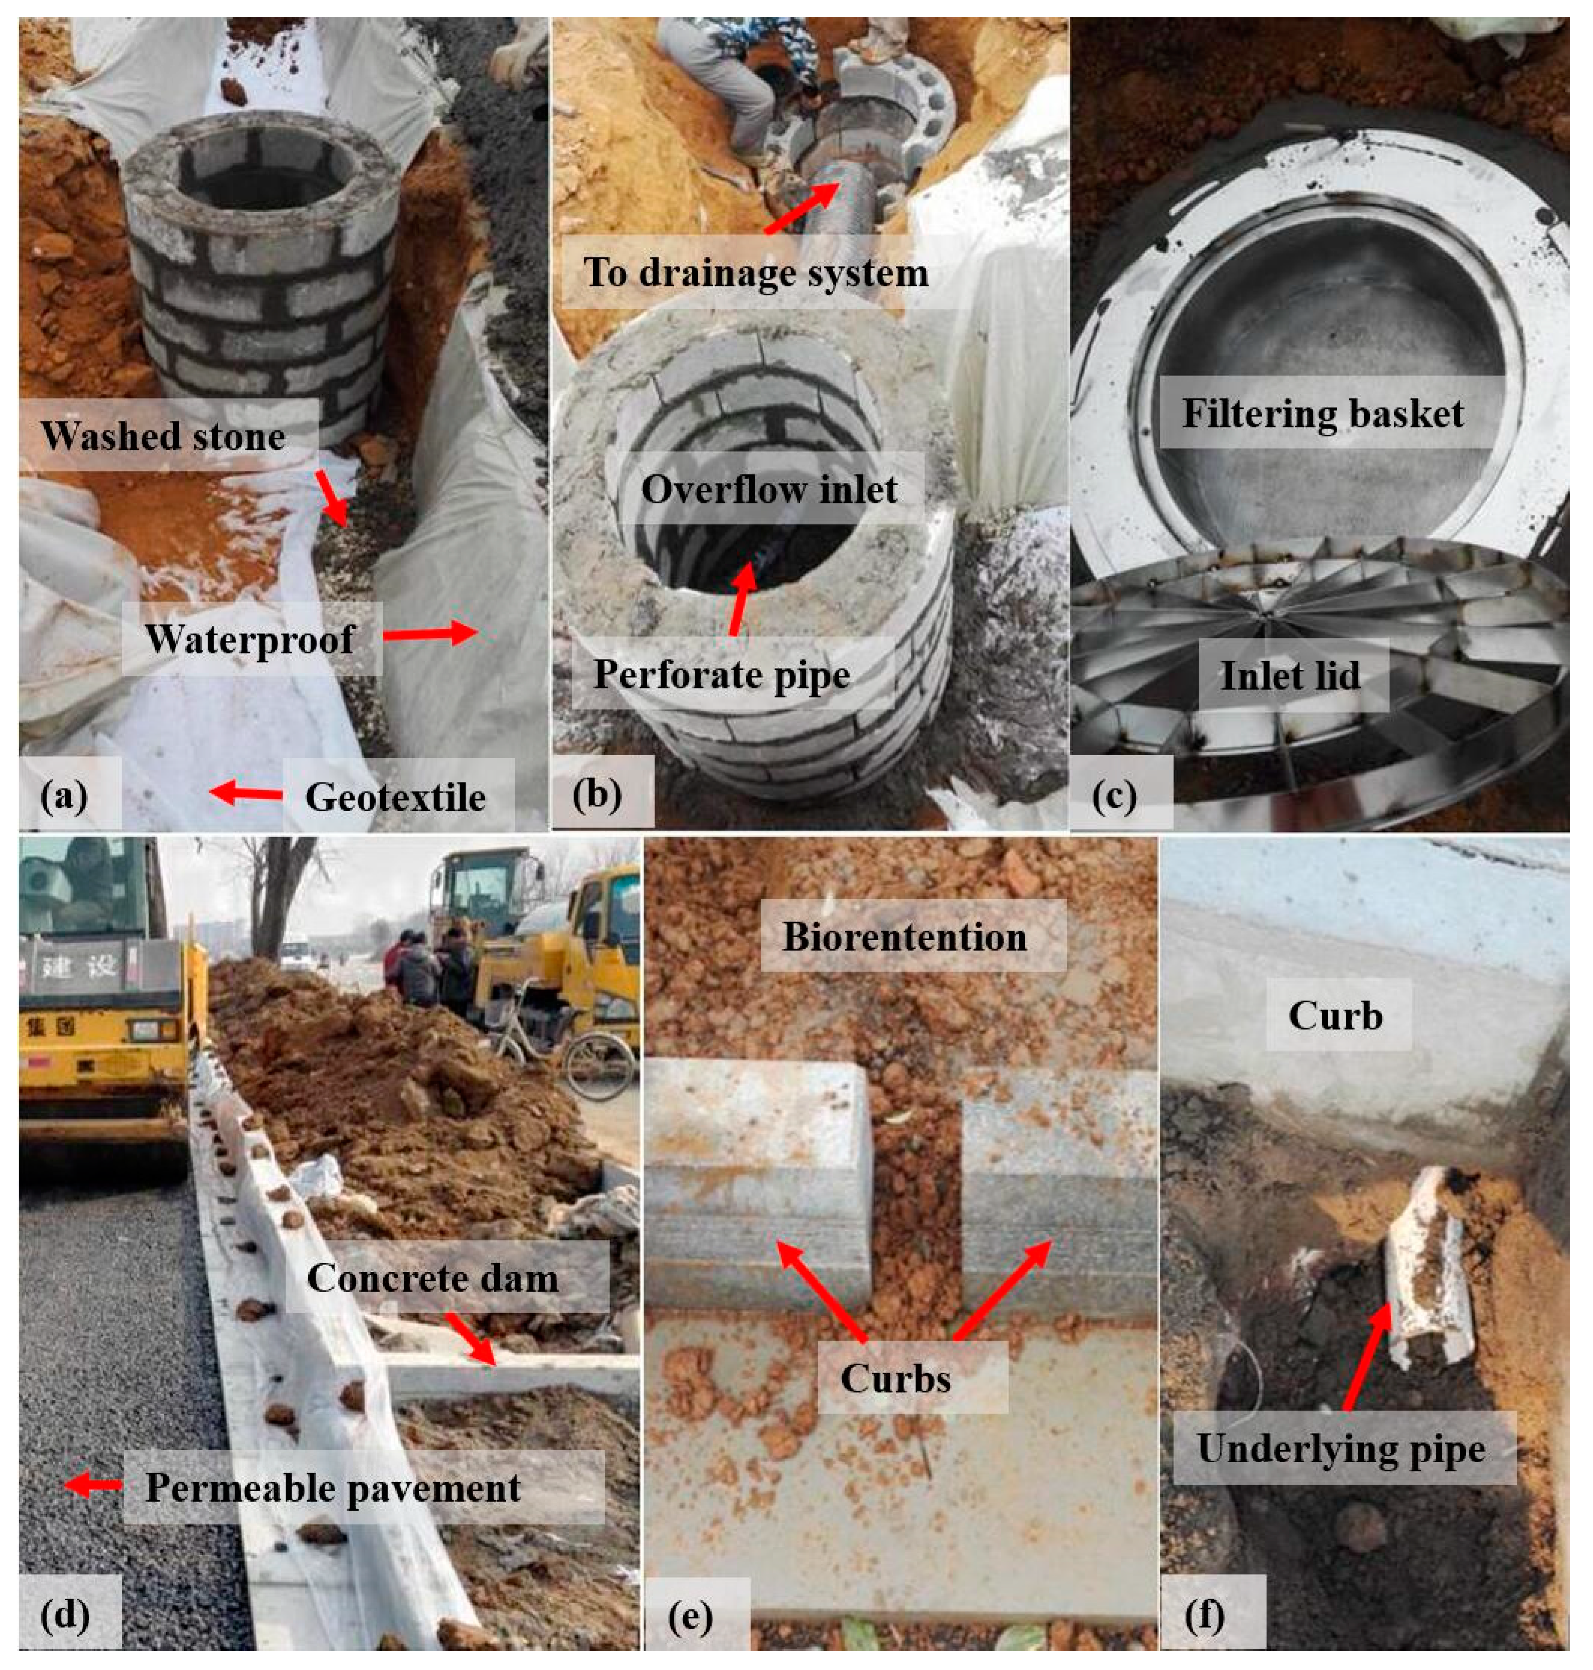
Construction details of the test section are presented in Figure 6. The main differences between the test and conventional street constructions lies in the permeable bicycle lanes and the roadside bioretention. Figure 6a shows the overflow inlet and general structure of the under layer of soil layers. The washed stone layer lies between a permeable geotextile and a waterproof layer. Connection between the overflow inlet and the drainage system is presented in Figure 6b, and the perforated pipe in washed stone layer can be observed. The inlet lid and filtering basket, as shown in Figure 6c, were set for retention of solid wastes in relatively large sizes. In street section with a sharp longitudinal slope, concrete dams as shown in Figure 6d were constructed to accommodate more rainwater. Relative narrow curb gaps, as shown in Figure 6e, were used since the longitudinal slope was small in the test section. Underlying pipes collecting water filtered by the permeable pavement were set as shown in Figure 6f.
4.2. Systematic Hydraulic Evaluation Based on SWMM
To show the working process of Storm Water Management Model (SWMM) and compare the hydraulic performance of conventional street and the proposed street design, models for the test section and a conventional street (i.e., a street without bioretention or permeable pavement) were established. The rainfall intensity formula of Nanjing issued by Nanjing Urban Administration Bureau is shown as Equation (10). It should be noted that Equation (10) is a specific case of Equation (2).
where q is the rainfall intensity, mm/min; P is the return period; and t is the time duration of rainfall, min, taken as 120 min in the models. The return period is 5 years and the duration of the rainfall is 120 min.
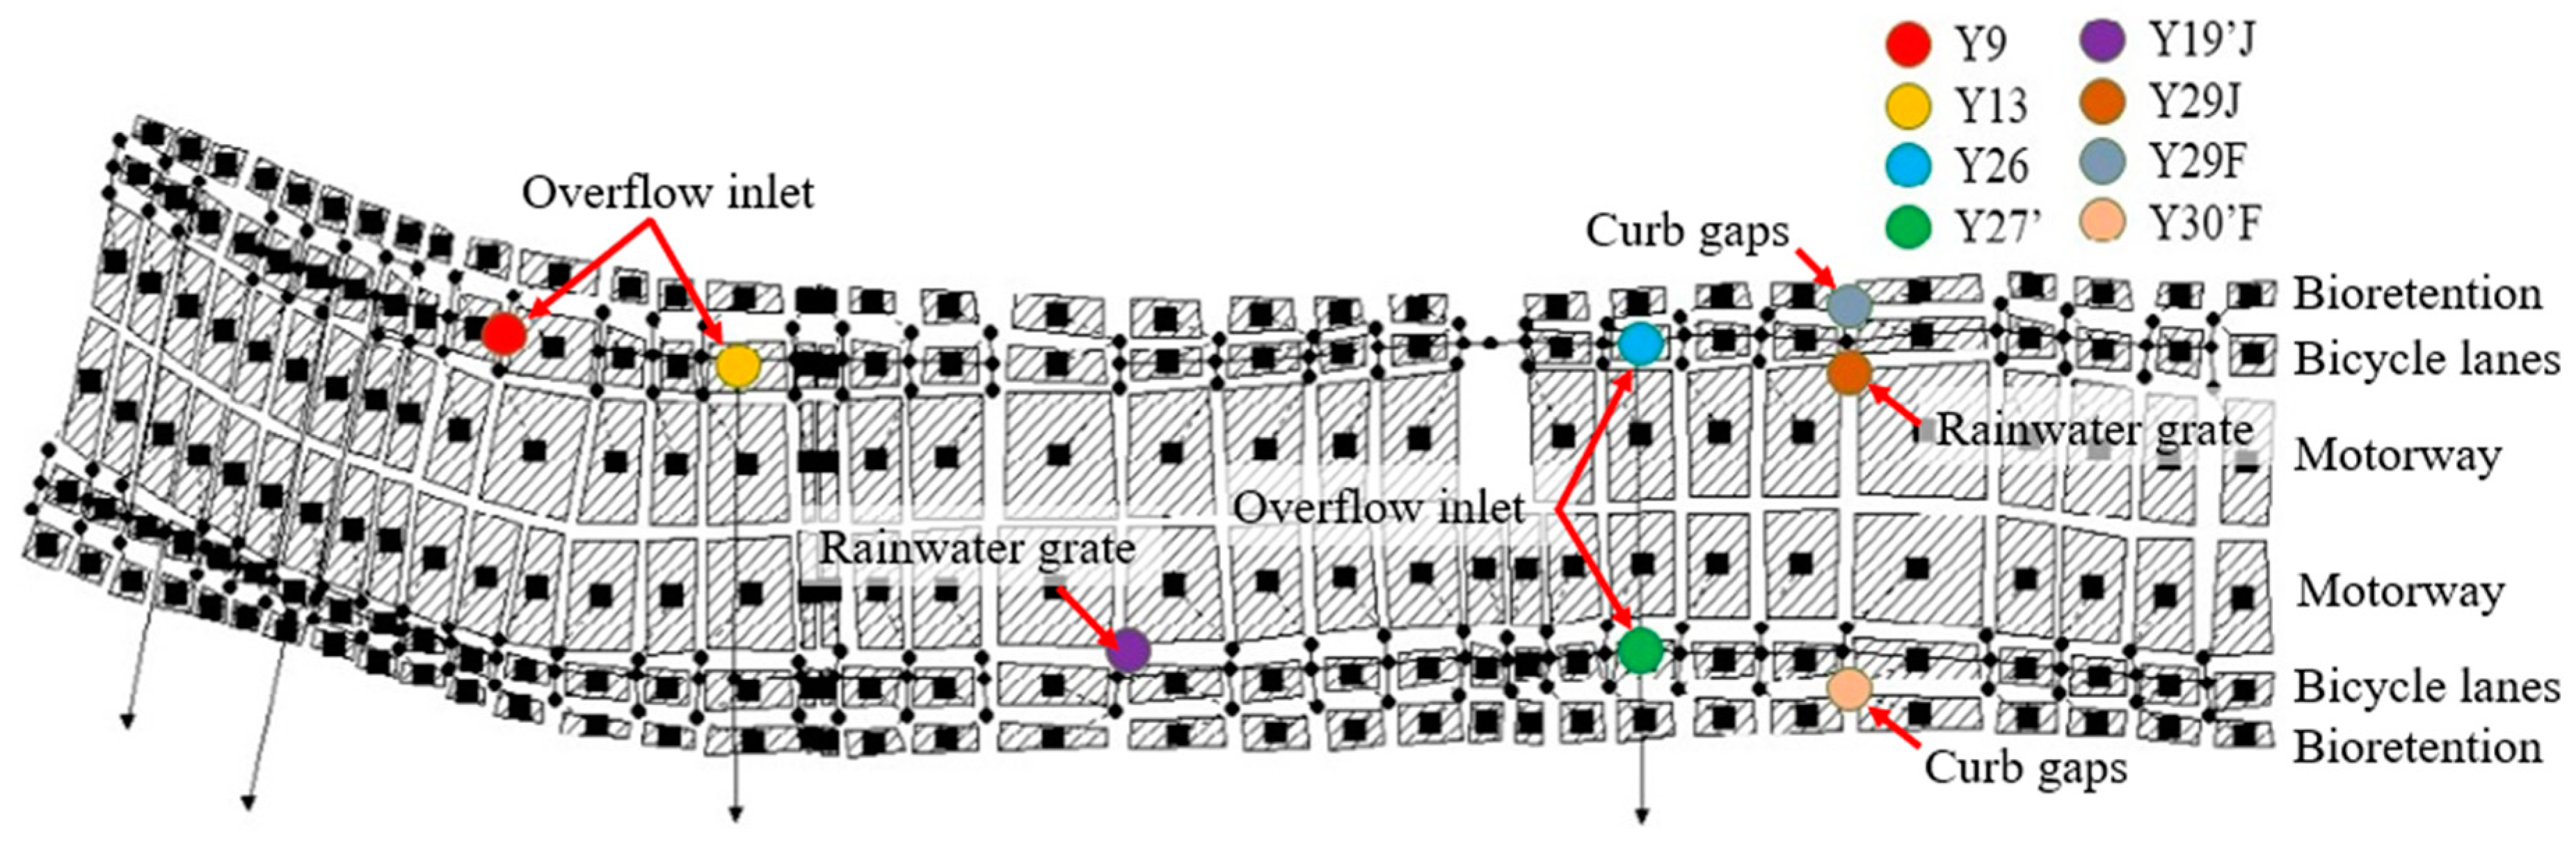
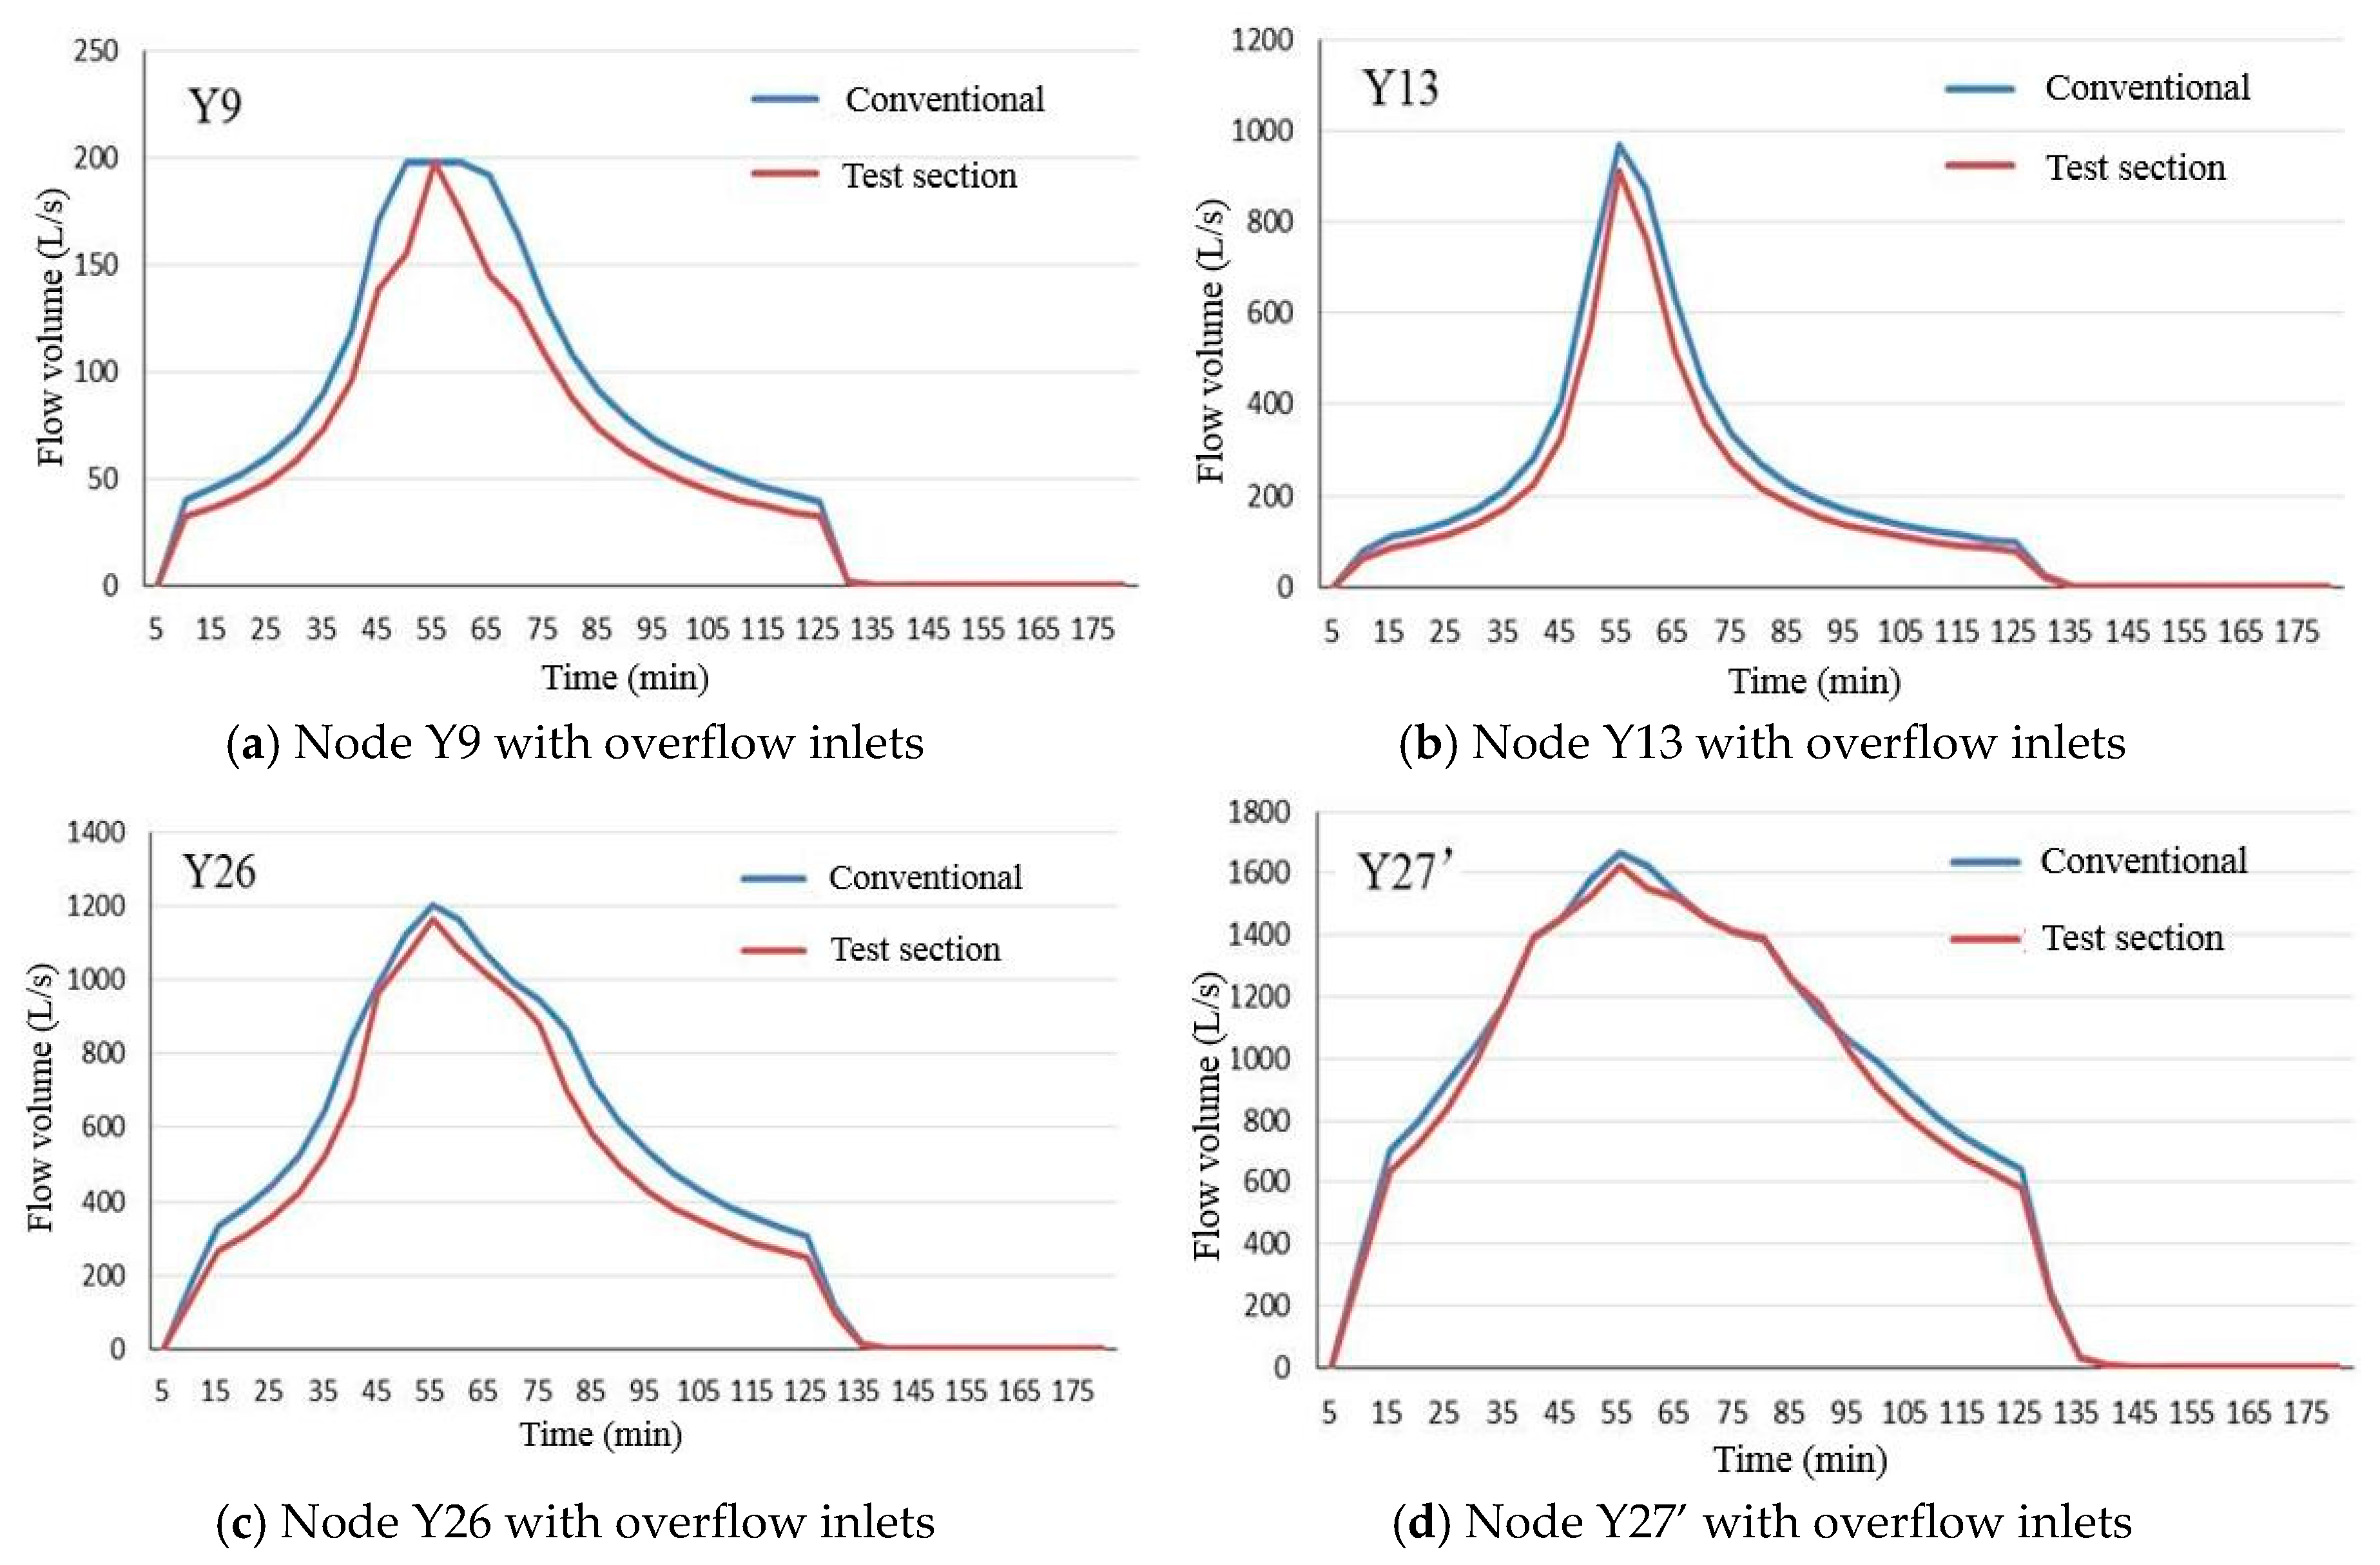
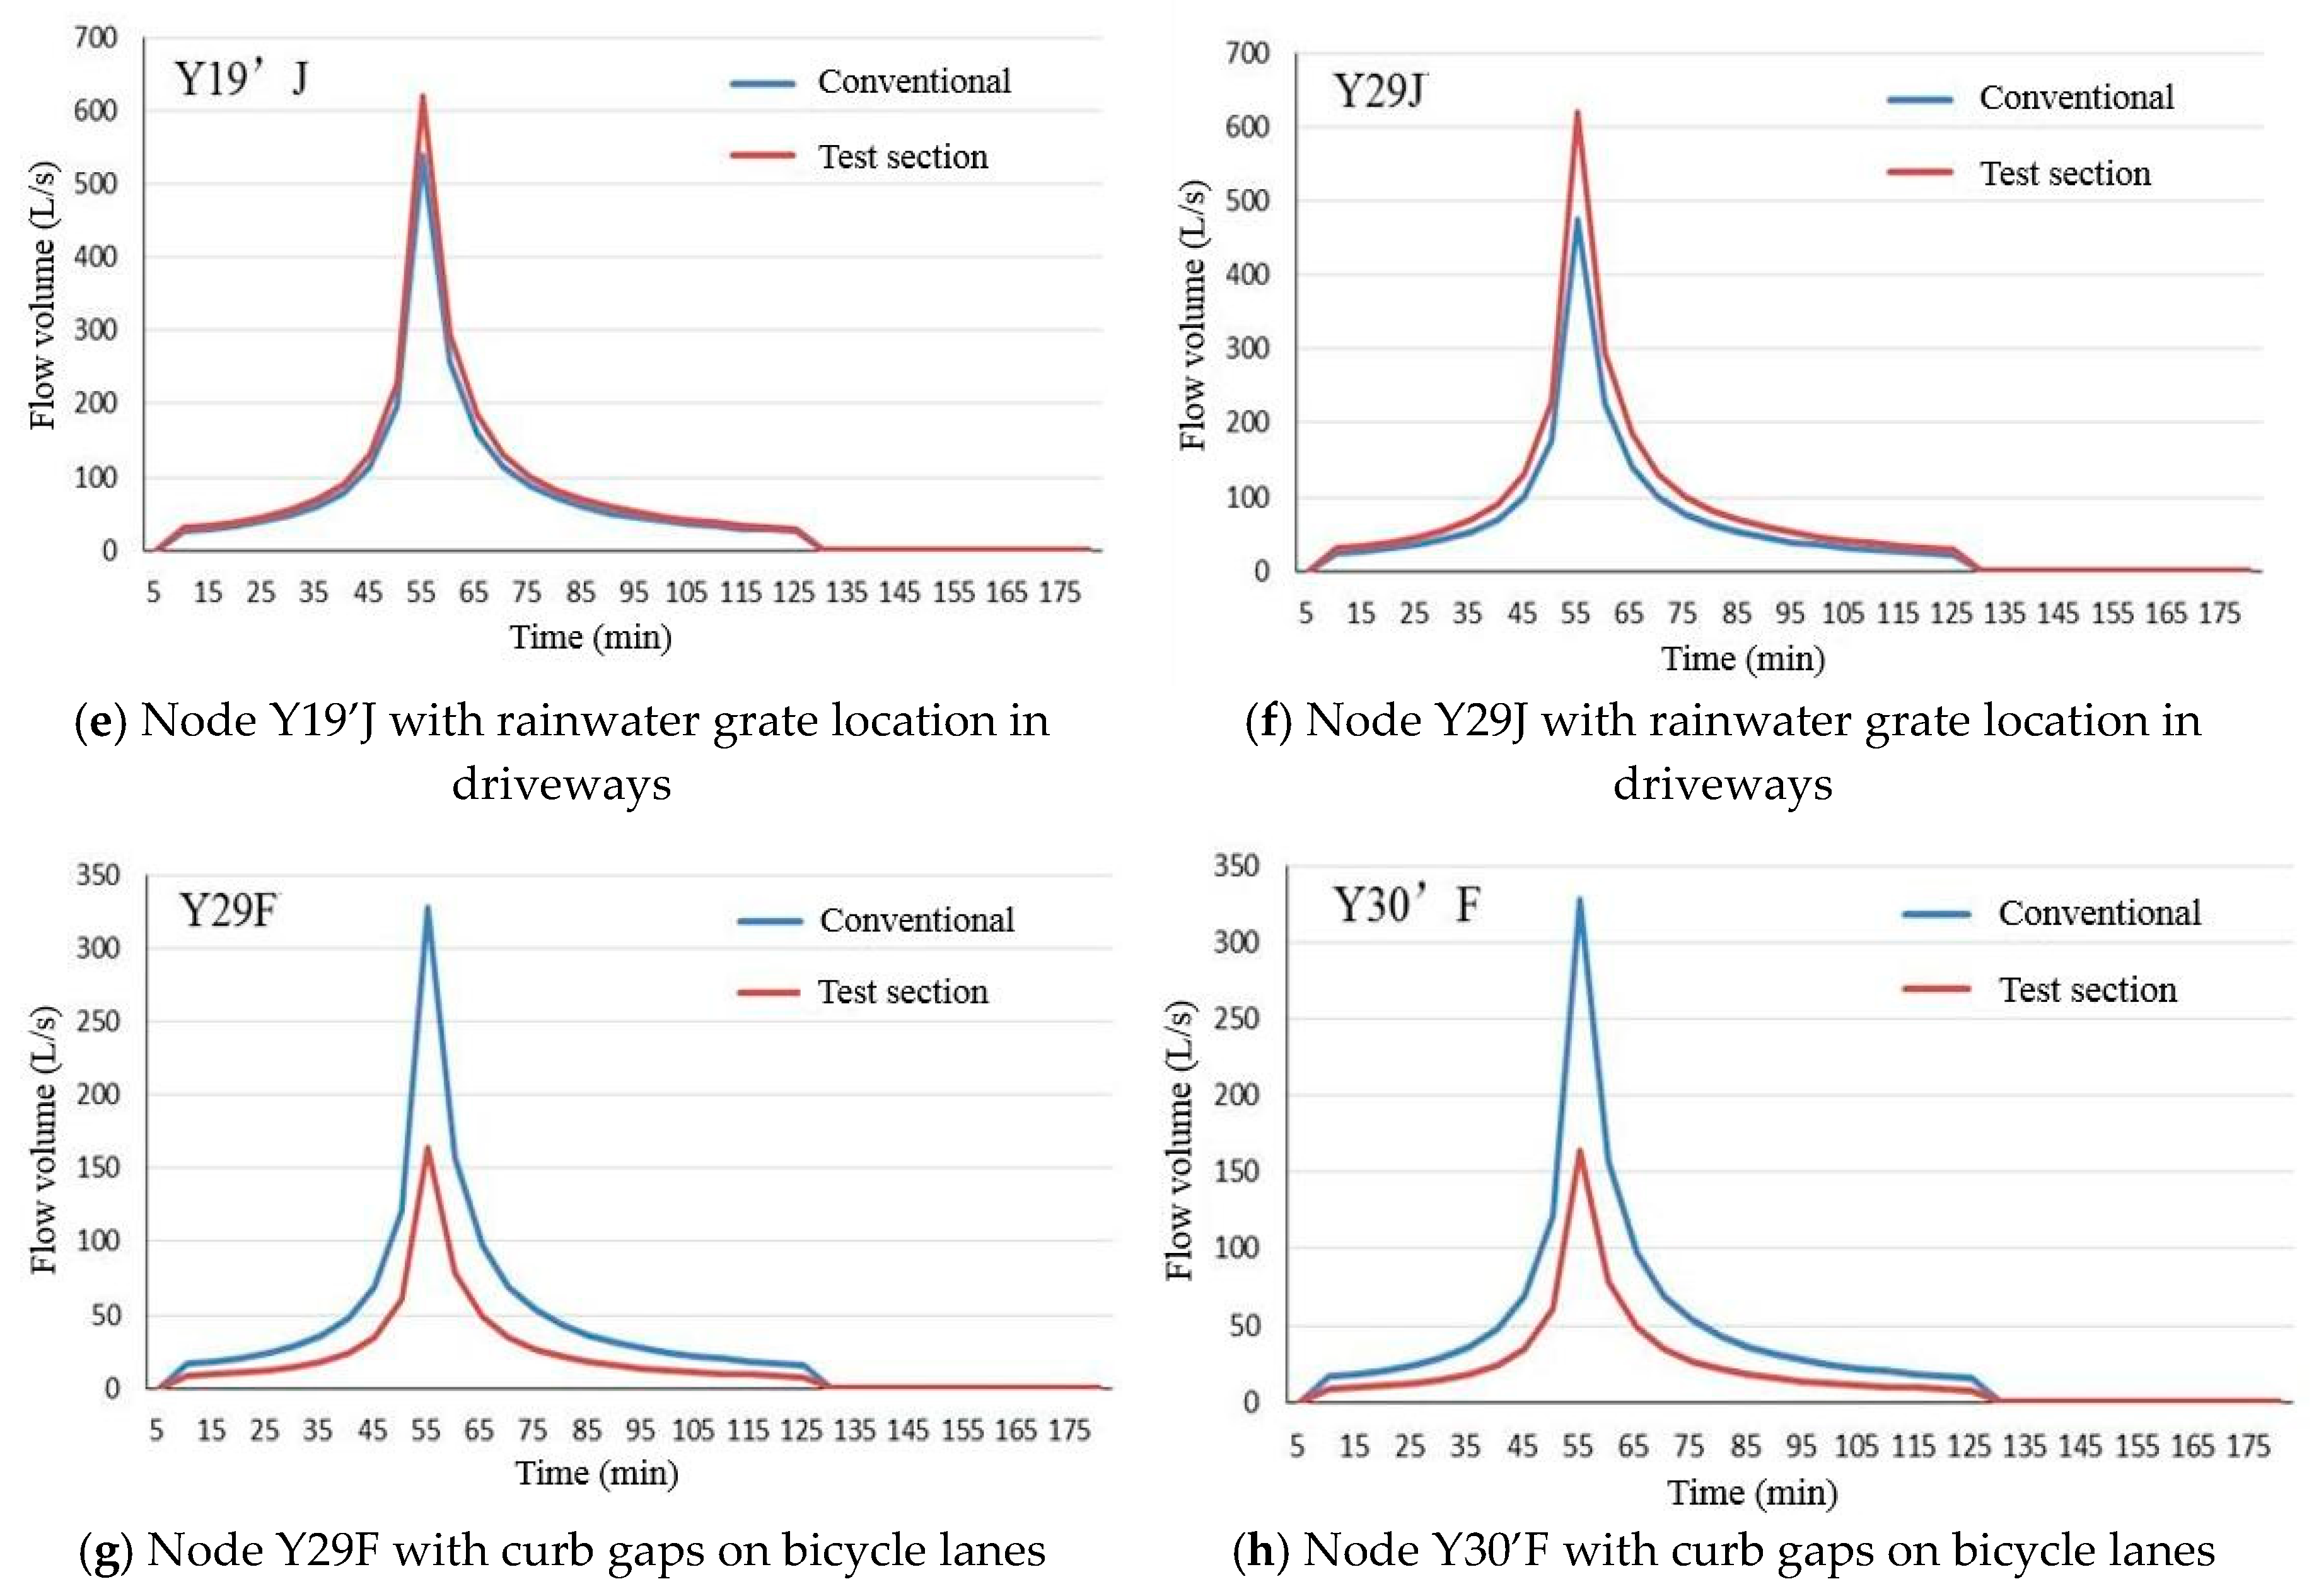
The model based on SWMM for the street region, including catchment area, nodes and partition, is shown in Figure 7. Eight nodes were selected for analysis, where nodes Y9, Y13, Y26 and Y27’ were overflow inlets in the test section or drainage system inlet in a conventional street; nodes Y19’J and Y29J were rainwater grate locations on driveways; and nodes Y29F and Y30’F were curb gaps on bicycle lanes. Flow volumes of the selected nodes were simulated to evaluate the waterlogging mitigation effect of the test section. In the modelling of the conventional streets, the pavement and the roadside strip were modelled as impermeable and the rainwater was all collected by the pipe system.
According to the results from SWMM, flow volumes of all selected nodes in the conventional street and the test section during a typical rainstorm with a return period of 5 years and 120-min duration (peak rainfall intensity 2.98 mm/min) are shown in Figure 8. As shown in Figure 8a–d, flow volumes of overflow inlets or the drainage system were only slightly reduced in the test section, indicating the effectiveness of these LID infrastructures in waterlogging mitigation during a relatively intense storm (for example with a 5-year return period) is limited. Thus, the same requirements for pipe diameters and slope gradient are still necessary. While curb gaps in driveways, as shown in Figure 8e,f, will have higher loads than conventional street due to less favorable drainage efficiency of curb gaps than rainwater grates, curb gaps have less blocking risks, thus they have less performance degradation in use. Flow volumes of curb gaps on bicycle lanes, as shown in Figure 8g,h, were obviously reduced as permeable materials are introduced in sidewalks and bicycle lanes. Both peak flow volume was reduced by about 52%.
4.3. Evaluation Based on the Proposed Calculation Procedure
Based on the proposed calculation procedure, a conventional street and a test section of 250 m were considered. The 0.55-m thick planting soil layer was divided into a 0.25 m layer and a 0.3 m layer to show the permeation process in soil layers. The street slope and pipe slope were taken as 0.3%. The diameter of the drainage pipe was taken as 0.6 m and the roughness coefficient was 0.2. A relatively intense rainstorm and a light rain were generated by Equations (6) and (7) with return periods of 5 years and 0.2 years respectively. For conventional streets, the pavement and the roadside strip were set as impermeable and the rainwater was all collected by the pipe system. The maximum intensity of the rainfall events were set at the 48th min.
According to the results from the proposed calculation procedure, flow volumes of the drainage pipes at a 5-year return period are shown in Figure 9a. During a 120 min rainfall, the soil layers and ponding area absorbed all rainwater in the first 34 min and no water entered the drainage system, but after the retention infrastructures were saturated, the hydraulic performance of the test section was almost the same as a conventional street. The result accords with the simulation results from the SWMM model. The slight flow reduction in the later period can be attributed to the runoff reduction by permeable pavement. Pavement runoff in the first several minutes are highly contaminative, thus, from the point of water filtration, the facilities are meaningful.
However, the test section had much better performance in the 0.2-year return period rainfall as depicted in Figure 9b. The drainage pipes began to collect rainwater at the 51st min and the peak flow was reduced from 7.1 m3/min to 4.0 m3/min. Meanwhile, the time when peak flow happens was delayed by 4 min from the 48th min to the 52nd min. Details in soil layers under the 120 min rainfall with 0.2-year return period are presented in Figure 9c. The upper layer of the planting soil reaches field water capacity at the 36th min and is saturated in the 50th min. Ponding area was filled up within 2 min after all soil layers were saturated and the facilities lose further retention capacity.
5. Conclusions
This paper proposes a street structure with permeable pavement and roadside bioretention. Detailed design for connection facilities between the pavement and bioretention is presented. A convenient calculation procedure was developed to predict the hydraulic performance of such street structures. A test section was also built. Simulation through the SWMM model and a calculation by the proposed procedure were conducted to compare the performance of the test section with a conventional street. Several conclusions can be drawn as follows:
- The bioretention facilities are able to collect the runoff at the initial stage of rainfall with different intensities. Therefore, the runoff at the initial stage containing a relatively higher amount of contaminants can be filtered and retained.
- The test section has favorable performance in rainwater collection for light rainfall (with short return period or duration). For example, in a 120-min rainfall event with 0.2-year return period, the peak flow is reduced from 7.1 m3/min to 4.0 m3/min, and no overflow develops in the first 50 min.
- For a relatively intense rainstorm (e.g., with a return period of 5 years), the proposed structure has only water filtration function while the effectiveness of waterlogging mitigation is quite limited. No reduction in diameter of drainage pipes is suggested. While the volume and quality of the rainwater including influx and outflow in the test section would be monitored after construction to evaluate the actual effectiveness of the facilities in retention and purification of rainwater.
Author Contributions
Conceptualization, Y.D. and X.G.; data curation, Y.D. and J.J.; formal analysis, Y.D. and J.J.; funding acquisition, Y.D.; investigation, Y.D. and Y.Z.; methodology, Y.D. and J.J.; project administration, X.G. and F.N.; resources, X.G.; software, X.G.; supervision, X.G. and F.N.; validation, Y.Z. and F.N.; visualization, Y.D.; writing—original draft, Y.D.; writing—review & editing, J.J. All authors have read and agreed to the published version of the manuscript.
Funding
This work was supported by the program of China Scholarships Council (No. 201606090204).
Acknowledgments
The authors acknowledge the financial support from the program of China Scholarships Council (No. 201606090204).
Conflicts of Interest
The authors declare no conflict of interest.
References
- Dietz, M.E. Low Impact Development Practices: A Review of Current Research and Recommendations for Future Directions. Water Air Soil Pollut. 2007, 186, 351–363. [Google Scholar] [CrossRef]
- Wei, Q.; Zhu, G.; Wu, P.; Cui, L.; Zhang, K.; Zhou, J.; Zhang, W. Distributions of typical contaminant species in urban short-term storm runoff and their fates during rain events: A case of Xiamen City. J. Environ. Sci. 2010, 22, 533–539. [Google Scholar] [CrossRef]
- Fassman, E.; Fassman-Beck, E.A. Stormwater BMP treatment performance variability for sediment and heavy metals. Sep. Purif. Technol. 2012, 84, 95–103. [Google Scholar] [CrossRef]
- Caschetto, M.; Barbieri, M.; Galassi, D.M.P.; Mastrorillo, L.; Rusi, S.; Stoch, F.; Di Cioccio, A.; Petitta, M. Human alteration of groundwater–surface water interactions (Sagittario River, Central Italy): Implication for flow regime, contaminant fate and invertebrate response. Environ. Earth Sci. 2013, 71, 1791–1807. [Google Scholar] [CrossRef]
- Shafique, M.; Kim, R. Low Impact Development Practices: A Review of Current Research and Recommendations for Future Directions. Ecol. Chem. Eng. S 2015, 22, 543–563. [Google Scholar] [CrossRef] [Green Version]
- Berndtsson, J.C. Storm water quality of first flush urban runoff in relation to different traffic characteristics. Urban Water J. 2013, 11, 284–296. [Google Scholar] [CrossRef]
- Cheng, J.; Yuan, Q.; YoungChul, K. Evaluation of a first-flush capture and detention tank receiving runoff from an asphalt-paved road. Water Environ. J. 2017, 31, 410–417. [Google Scholar] [CrossRef]
- Quan, R.-S.; Liu, M.; Lu, M.; Zhang, L.-J.; Wang, J.; Xu, S.-Y. Waterlogging risk assessment based on land use/cover change: A case study in Pudong New Area, Shanghai. Environ. Earth Sci. 2010, 61, 1113–1121. [Google Scholar] [CrossRef]
- Zhang, X.; Hu, M.; Chen, G.; Xu, Y. Urban Rainwater Utilization and its Role in Mitigating Urban Waterlogging Problems—A Case Study in Nanjing, China. Water Resour. Manag. 2012, 26, 3757–3766. [Google Scholar] [CrossRef]
- Fletcher, T.D.; Shuster, W.; Hunt, W.F.; Ashley, R.; Butler, D.; Arthur, S.; Trowsdale, S.; Barraud, S.; Semadeni-Davies, A.; Bertrand-Krajewski, J.-L.; et al. SUDS, LID, BMPs, WSUD and more – The evolution and application of terminology surrounding urban drainage. Urban Water J. 2014, 12, 525–542. [Google Scholar] [CrossRef]
- Li, X.; Li, J.; Fang, X.; Gong, Y.; Wang, W. Case Studies of the Sponge City Program in China. In Proceedings of the World Environmental and Water Resources Congress 2016, West Palm Beach, FL, USA, 22–26 May 2016; pp. 295–308. [Google Scholar]
- Dell’Acqua, G.; De Luca, M.; Lamberti, R. Indirect Skid Resistance Measurement for Porous Asphalt Pavement Management. Transp. Res. Rec. J. Transp. Res. Board 2011, 2205, 147–154. [Google Scholar] [CrossRef]
- Fassman, E.A.; Blackbourn, S.; Fassman-Beck, E.A. Urban Runoff Mitigation by a Permeable Pavement System over Impermeable Soils. J. Hydrol. Eng. 2010, 15, 475–485. [Google Scholar] [CrossRef]
- Bentarzi, Y.; Ghenaim, A.; Terfous, A.; Wanko, A.; Feugeas, F.; Poulet, J.; Mosé, R. Hydrodynamic behaviour of a new permeable pavement material under high rainfall conditions. Urban Water J. 2015, 13, 687–696. [Google Scholar] [CrossRef]
- Scholz, M. Water Quality Improvement Performance of Geotextiles within Permeable Pavement Systems: A Critical Review. Water 2013, 5, 462–479. [Google Scholar] [CrossRef] [Green Version]
- Barrett, M.; Katz, L.; Taylor, S. Removal of Dissolved Heavy Metals in Highway Runoff. Transp. Res. Rec. J. Transp. Res. Board 2014, 2436, 131–138. [Google Scholar] [CrossRef]
- Chen, X.; Peltier, E.; Sturm, B.S.; Young, C.B. Nitrogen removal and nitrifying and denitrifying bacteria quantification in a stormwater bioretention system. Water Res. 2013, 47, 1691–1700. [Google Scholar] [CrossRef]
- Jayasooriya, V.; Ng, A.W.M. Tools for Modeling of Stormwater Management and Economics of Green Infrastructure Practices: A Review. Water Air Soil Pollut. 2014, 225, 2055. [Google Scholar] [CrossRef] [Green Version]
- Rosa, D.J.; Clausen, J.C.; Dietz, M.E. Calibration and Verification of SWMM for Low Impact Development. JAWRA J. Am. Water Resour. Assoc. 2015, 51, 746–757. [Google Scholar] [CrossRef]
- Cheng, Y.; Wang, R. A novel stormwater management system for urban roads in China based on local conditions. Sustain. Cities Soc. 2018, 39, 163–171. [Google Scholar] [CrossRef]
- Dierkes, C.; Lucke, T.; Helmreich, B. General Technical Approvals for Decentralised Sustainable Urban Drainage Systems (SUDS)—The Current Situation in Germany. Sustainability 2015, 7, 3031–3051. [Google Scholar] [CrossRef] [Green Version]
- Chen, C. Rainfall Intensity-Duration-Frequency Formulas. J. Hydraul. Eng. 1983, 109, 1603–1621. [Google Scholar] [CrossRef]
- Drake, J.; Bradford, A.; Van Seters, T. Stormwater quality of spring–summer-fall effluent from three partial-infiltration permeable pavement systems and conventional asphalt pavement. J. Environ. Manag. 2014, 139, 69–79. [Google Scholar] [CrossRef] [PubMed]
- Ranieri, V. Runoff Control in Porous Pavements. Transp. Res. Rec. J. Transp. Res. Board 2002, 1789, 46–55. [Google Scholar] [CrossRef]
- Blume, T.; Zehe, E.; Bronstert, A. Rainfall—Runoff response, event-based runoff coefficients and hydrograph separation. Hydrol. Sci. J. 2007, 52, 843–862. [Google Scholar] [CrossRef]
- Verma, S. Modified Horton’s infiltration equation. J. Hydrol. 1982, 58, 383–388. [Google Scholar] [CrossRef]
- Jabro, J.; Evans, R.G.; Kim, Y.; Iversen, W.M. Estimating in situ soil–water retention and field water capacity in two contrasting soil textures. Irrig. Sci. 2008, 27, 223–229. [Google Scholar] [CrossRef]
- Elger, D.F.; Roberson, J.A. Engineering Fluid Mechanics; Wiley: Hoboken, NJ, USA, 2013. [Google Scholar]
- Liou, C.P. Limitations and Proper Use of the Hazen-Williams Equation. J. Hydraul. Eng. 1998, 124, 951–954. [Google Scholar] [CrossRef]
- Wang, X.; Gu, X.; Ni, F.; Deng, H.; Dong, Q. Rutting resistance of porous asphalt mixture under coupled conditions of high temperature and rainfall. Constr. Build. Mater. 2018, 174, 293–301. [Google Scholar] [CrossRef]
Figure 1.
Typical structure of roadside bioretention.

Figure 2.
Connections between permeable pavement and roadside bioretention.

Figure 3.
Relationships between soil permeability, rainfall intensity and ponding.

Figure 4.
Computational logic of the calculation procedure.

Figure 5.
Project location.

Figure 6.
Details in construction: (a) soil layers; (b) connection to drainage system; (c) outflow inlet; (d) concrete dams; (e) curb gap; (f) pipe under permeable pavement.
Figure 6.
Details in construction: (a) soil layers; (b) connection to drainage system; (c) outflow inlet; (d) concrete dams; (e) curb gap; (f) pipe under permeable pavement.

Figure 7.
Storm Water Management Model (SWMM) model for the test section.

Figure 8.
Flow volume of selected nodes.


Figure 9.
Details of street hydraulics: (a) 5-year return period; (b) 0.2-year return period; (c) details in soil layers.
Figure 9.
Details of street hydraulics: (a) 5-year return period; (b) 0.2-year return period; (c) details in soil layers.

© 2020 by the authors. Licensee MDPI, Basel, Switzerland. This article is an open access article distributed under the terms and conditions of the Creative Commons Attribution (CC BY) license (http://creativecommons.org/licenses/by/4.0/).
Share and Cite
MDPI and ACS Style
Dai, Y.; Jiang, J.; Gu, X.; Zhao, Y.; Ni, F. Sustainable Urban Street Comprising Permeable Pavement and Bioretention Facilities: A Practice. Sustainability 2020, 12, 8288. https://0-doi-org.brum.beds.ac.uk/10.3390/su12198288
AMA Style
Dai Y, Jiang J, Gu X, Zhao Y, Ni F. Sustainable Urban Street Comprising Permeable Pavement and Bioretention Facilities: A Practice. Sustainability. 2020; 12(19):8288. https://0-doi-org.brum.beds.ac.uk/10.3390/su12198288
Chicago/Turabian StyleDai, Yiqing, Jiwang Jiang, Xingyu Gu, Yanjing Zhao, and Fujian Ni. 2020. "Sustainable Urban Street Comprising Permeable Pavement and Bioretention Facilities: A Practice" Sustainability 12, no. 19: 8288. https://0-doi-org.brum.beds.ac.uk/10.3390/su12198288
Note that from the first issue of 2016, this journal uses article numbers instead of page numbers. See further details here.