Article

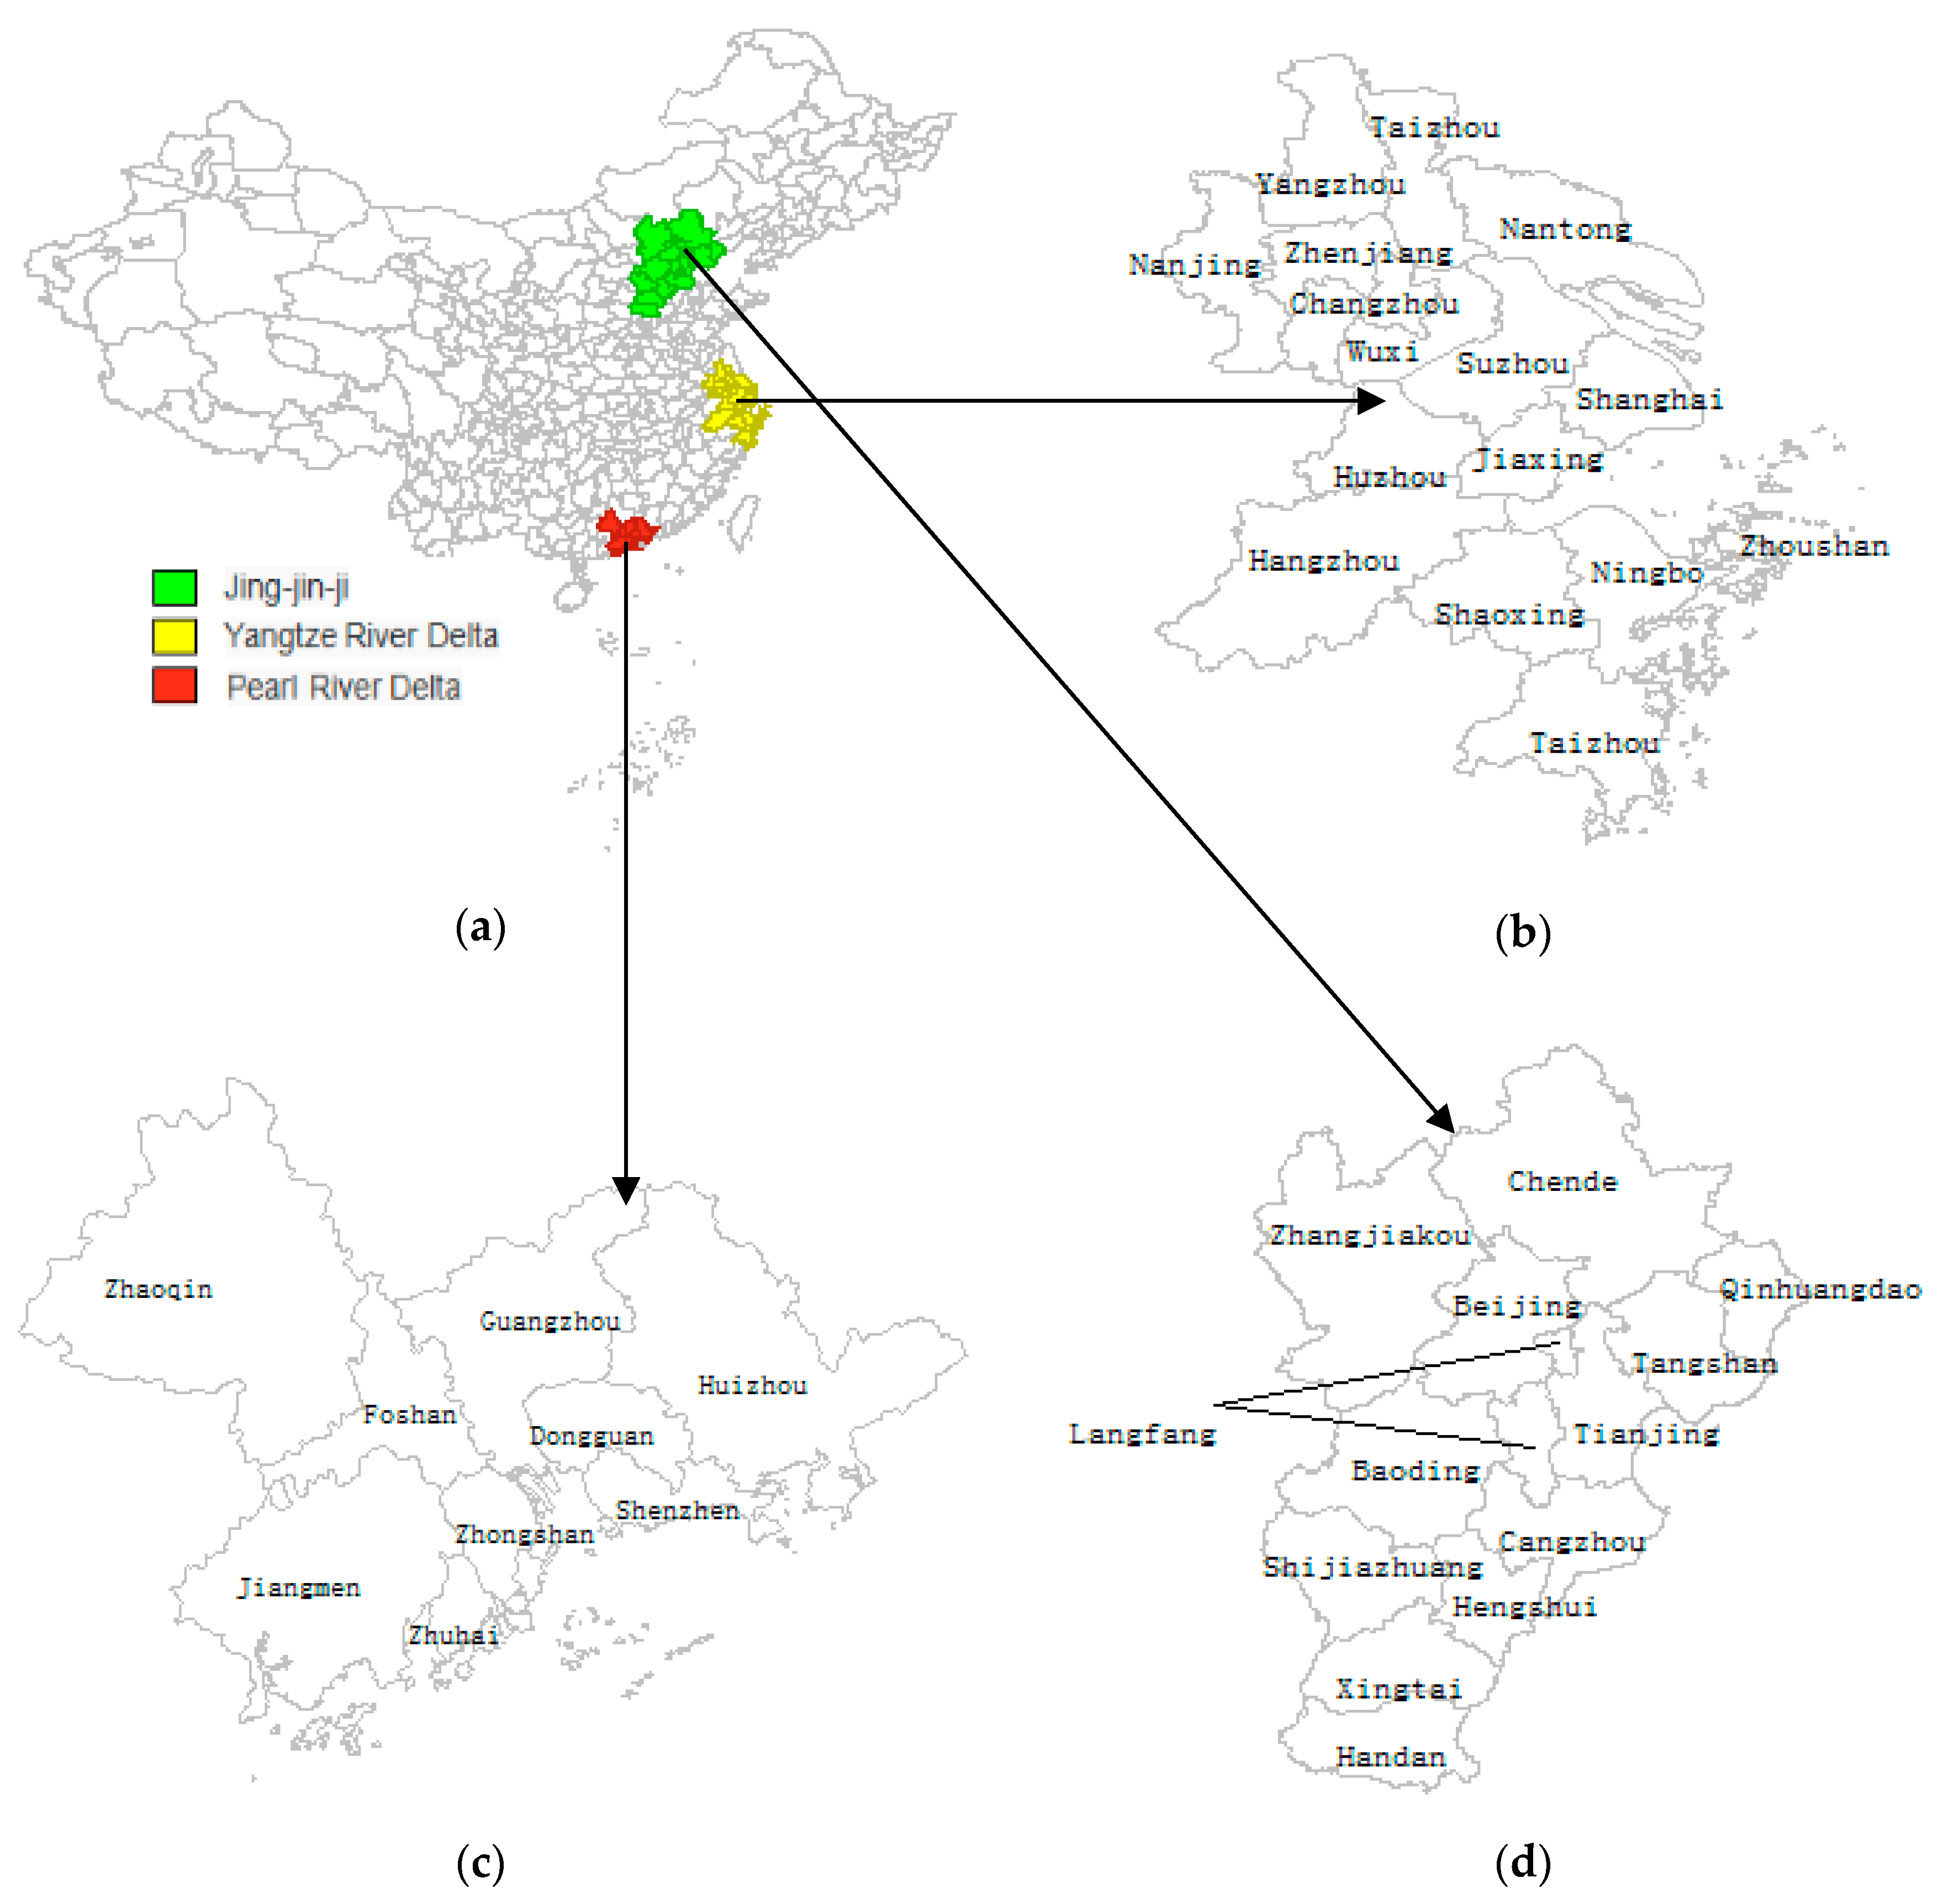
Does Population Mobility Contribute to Urbanization Convergence? Empirical Evidence from Three Major Urban Agglomerations in China

1
School of Management, China University of Mining and Technology, No. 1, College Rd., Tongshan Dist., Xuzhou 221116, China
2
UNC Program on Chinese Cities, University of North Carolina at Chapel Hill, 314 New East Building, CB 3140, Chapel Hill, NC 27599-3140, USA
*
Authors to whom correspondence should be addressed.
Sustainability 2020, 12(2), 458; https://0-doi-org.brum.beds.ac.uk/10.3390/su12020458
Submission received: 25 November 2019 / Revised: 3 January 2020 / Accepted: 5 January 2020 / Published: 7 January 2020

Abstract

:
Population mobility accelerates urbanization convergence and mitigates the negative impact of the spatial agglomeration effect on urbanization convergence, which is the most important conclusion in this paper. Taking 38 cities in China’s three urban agglomerations (the Yangtze River Delta, the Pearl River Delta, and the Beijing–Tianjin–Hebei region) from 2005 to 2016 as research subjects, the study first shows that there is a large gap in the level of urbanization between the three major urban agglomerations, but the gap has been constantly narrowed and presents a trend of absolute convergence and conditional convergence. Furthermore, without adding a population mobility variable, the combination of the diffusion effect of high-urbanization cities and the high growth rate of low-urbanization cities causes the inter-regional urbanization level to be continuously convergent in the Yangtze River Delta region; however, the combination of the agglomeration effect of high-urbanization cities and the high growth rate of low-urbanization cities causes the inter-regional urbanization to be divergent in the Pearl River Delta and the Beijing–Tianjin–Hebei region. Under the influence of population mobility, the “catch-up” effect in low-urbanization regions is greater than the agglomeration effect in high-urbanization regions, which promotes the continuous convergence of inter-regional urbanization.

1. Introduction

Cities, as the focus of regional economy, politics, culture, and transportation, form an attraction to the surrounding areas due to the numerous employment opportunities, the perfect infrastructure, and the good educational environment. These comparative advantages have prompted the flow of population from rural to urban areas. Urban and rural population mobility has become an important factor in promoting the rapid growth of urbanization rate at the population dimension [1], and the development of urbanization has also contributed to the movement and migration of population in the region [2]. By 2016, China’s floating population reached 245 million. Large-scale population mobility will become a significant phenomenon in China’s social development at present and even for a long time to come.
Since the reform and opening up, Chinese urbanization has developed at an unprecedented rate, the urbanization level has increased from 17.92% in 1978 to 57.35% in 2016, with an average annual growth rate of 1.03%. However, China covers a vast territory, with different resource endowment and technology levels in different regions, and the economic growth, industrialization level, and urbanization development of each region are unequal [3,4,5]. In 2016, the urbanization rates of Shanghai and Beijing were 87.9% and 86.5%, respectively; whereas the urbanization rates in Guizhou and Gansu were 44.15% and 44.69%, respectively, which were far below the national level. The increasing income gap between urban and rural areas, the uneven distribution of population and the unbalanced urban growth have become the most obvious characteristics of China’s urbanization development. The spatial migration and emigration of population is an important factor affecting the difference of urbanization level, promoting the transformation of land urbanization to population urbanization and solving the uneven distribution of population has become a crucial part of the construction of new-type urbanization [6].
It is worth mentioning that population mobility and urbanization are also affected by China’s special hukou system. Under the planned economy system, China has formed a household registration management system that distinguishes between urban and rural residents by non-agricultural and agricultural household registration [7]. Population migration is a phenomenon of permanent or long-term changes in the population’s place of residence when population moves out or in between regions; while population mobility is the temporary or short-term leaving the place of residence due to work and study without changing household registration. The flow of migrant workers is a special phenomenon of population mobility in China since the late 1970s, which has a great impact on the social economy and environment [8]. A large number of rural surplus laborers were transferred to cities, provided cities with many cheap laborers, eased the contradiction between supply and demand of labor in some industries, and promoted the development of agriculture, forestry, animal husbandry, and fisheries in the surrounding areas of the city. It can be said that the biggest impact of reform and opening up on China is not population migration, but population mobility [9]. However, the strict household registration system and the social welfare attached to the household registration make China’s urbanization level incomplete and unsustainable, and the agricultural household registration and urban population have unequal treatment in terms of employment and education [10,11]. With the rapid development of economy and society, the process of urbanization is accelerating, the floating population between urban and rural areas is increasing, and the phenomenon of residence-registration inconsistency is becoming more common, which is urgent to deepen the reform of the household registration system. The Opinions of the State Council on Further Promotion of Reform of the Household Registration System pointed out that actively enforcing the citizenization of agricultural migrants, including the overall plan to promote the settlement of about 100 million agricultural migrants in cities and towns, and the supporting policies of finance, land, and housing to support the citizenization of rural migrants. By 2016, there were 16 million people that had settled in cities, and the urbanization rate of household registration and permanent population had increased from 35.3% and 52.6% in 2012 to 41.2% and 57.35% in 2016, respectively. The gap between the urbanization rate of household registration and permanent population narrowed by 1.2 percentage points [12].
The literature on convergence mainly focuses on the research of economic growth and income level [13,14,15], and rarely involves the measurement of convergence of urbanization level. Although the issue of imbalanced urbanization level has been concerned by most scholars, there seems to be no general consensus on the impact of population mobility on urbanization convergence [16]. As Lin (2019) found: “… the large-scale population mobility have aggravated the regional imbalance of China’s urbanization development on the whole, but this effect is gradually decreasing with the decentralization of floating population.” This finding implies that the decentralization of population mobility and the tendency to move inland will balance the uneven growth of the urbanization rate, and the combination of internal pull and external push will reduce the regional differences of urbanization level [17].
The aim of this paper is to describe the changing trend of the urbanization level gap in the three state-level urban agglomerations and incorporate a spatial variable into the analysis of urbanization to further explore the impact of inter-regional population inflow and outflow on urbanization convergence. The research subjects are Yangtze River Delta urban agglomeration (including 16 cities: Shanghai, Nanjing, Suzhou, Wuxi, Changzhou, Nantong, Yangzhou, Zhenjiang, Taizhou, Hangzhou, Ningbo, Zhoushan, Taizhou, Jiaxing, Huzhou and Shaoxing, the specific situation is shown in Figure 1a,b), Pearl River Delta urban agglomeration (including nine cities: Zhaoqing, Jiangmen, Zhongshan, Dongguan, Huizhou, Shenzhen, Zhuhai, Guangzhou and Foshan, the specific situation is shown in Figure 1a,c), and Beijing–Tianjin–Hebei region (including 13 cities: Beijing, Tianjin, Shijiazhuang, Hengshui, Langfang, Xingtai, Zhangzhou, Baoding, Tangshan, Qinhuangdao, Handan, Chengde and Zhangjiakou, the specific situation is shown in Figure 1a,d), respectively. Further, Solow–Swan’s theory of economic growth convergence provided some inspiration for this paper [18,19], regions with lower levels of development will develop faster, and eventually the level of economic development will approach.
The structure of this paper is as follows: Section 2 presents a literature review of convergence, urbanization convergence, and the influencing factors that contribute to the imbalanced urban growth; Section 3 highlights methods and data sources; Section 4 first describes the spatial correlation characteristics of urbanization, then analyzes the situations of urbanization convergence, and finally explores the impact of population mobility on the narrowing urbanization gap; and Section 5 concludes the main results and implies some suggestions.

2. Literature Review

The theory of economic growth convergence originated from the neoclassical growth model of Solow–Swan. In 1986, Baumol and Abramovitz applied this theory to empirical research [20,21], regional convergence has gradually become an important topic. Currently, the studies of convergence and divergence mainly focus on economic growth, income, consumption expenditure, energy intensity, housing prices, and unemployment [22,23,24,25,26,27,28,29,30,31,32], and the types of convergence are various, including σ convergence (reflecting a decreasing trend of the urbanization level gap between regions or countries over time), β convergence (convergence only after controlling the factors affecting steady state), club convergence (convergence within subsamples), and stochastic convergence (examining whether the initial deviations from some hypothetical long-term equilibrium of an investigated indicator decrease over time). Correspondingly, the methods of measuring convergence are also different, such as CV sigma-convergence and beta-convergence, club convergence approach, Markov chain and spatial Markov chain methods, and econometric approach.
As one of the important driving forces of social and economic development, the regional difference of urbanization level is also a key topic. The convergence of urbanization mainly studies whether the areas with backward urbanization rates can reach or even surpass the developed regions with a faster growth rate [33]. In terms of the urbanization process, the population tends to migrate from backward areas to developed areas, and the persistence of differences in economic levels will lead to the divergent growth in urbanization level. For example, Taubenboeck et al. (2019) analyzed the urbanization patterns of 230 cities in Europe, revealing the significant differences of urbanization levels between Western and Eastern European cities, and concluded there is no “catch-up” growth in Eastern Europe urbanization or full convergence with Western Europe urbanization due to the reality of omnipresent socialist past [34]. In addition, the expansion of an inter-regional economic gap has led to the migration of rural population in backward areas, which increases the difficulty of enhancing the urbanization rate of populations in underdeveloped regions [16]. However, the convergence mechanism of economic factors and social factors and the orientation of national policies will gradually converge the level of urbanization. On one hand, the agglomeration of urban labor has economies of scale such as technological spillovers, but the excessive gathering of populations will produce negative effects such as environmental pollution and traffic congestion, when the negative effect of the transfer of rural population to urban areas is greater than the economic effect, the population migration will slow down or even stop; on the other hand, with the gradual convergence of the backward regions to the developed regions in economic development, coupled with policy support for underdeveloped regions, which will attract large-scale labor return. The push of the city and the pull of the countryside promote the convergence of urbanization level [35]. Liu et al. (2015) found that the urbanization levels converge in the low-income and middle-income regions in China, and the difference of urbanization level in various regions will gradually narrow until they reach the same steady state [36].
As for the influencing factors of imbalanced urban growth, many studies have been discussed from the perspective of natural endowment and regional institutional differences [29]. With the frequent flow of population in the regions, it is necessary to study the impact of population mobility on urbanization convergence. Su et al. (2018) and Chen et al. (2019) believed that population mobility has a significant impact on the structure and trends of regional differences. Population mobility increases inter-regional development differences and aggravates the phenomenon of “border effect”. Township enterprises are difficult to develop, resulting in a negative impact on urbanization convergence [37,38]. However, Bhagat and Mohanty (2009) and He et al. (2015) thought that population mobility has improved the urban and rural population structure of immigrants and emigration areas, promoted the urbanization rate, and reduced the inter-regional differences [39,40]. Meanwhile, spatial factors will also play a role in the process of population mobility affecting urbanization convergence, and relatively backward regions tend to replicate the path and scale of their neighbors’ urbanization development [41].
Based on the above literature, it can be seen that the existing studies mainly focus on the convergence of economic growth, whereas few studies discuss the relationship between population mobility and urbanization convergence, especially from the perspective of urban agglomerations. At present, there is an obvious spatial agglomeration trend in the distribution of the floating population in China: the population flows from the central and western regions to the eastern coastal areas, the Yangtze River Delta, the Pearl River Delta, and the Beijing–Tianjin–Hebei region are the main concentrated areas, and the attraction of central cities in the western regions is also constantly improving [42]. The floating population and its effect on the urbanization gap are one of the core issues in the process of urbanization [43]. Furthermore, each urban agglomeration is an open system, and the flow of factors such as population is impermanent. In this case, it is necessary to explore whether there is a spatial effect of population mobility on urbanization. Therefore, taking the 38 cities of the Yangtze River Delta, the Pearl River Delta, and the Beijing–Tianjin–Hebei region from 2005 to 2016 as research subjects, this paper uses the spatial Durbin panel model to analyze the impact of population mobility on urbanization convergence, and hopes to complement existing literature and provide guidance for the government to make decisions.

3. Methodology and Data

3.1. Methodology

Considering the spatial dependence of observations, the model is based the work of Elhorst (2014) [44] and combines other empirical research methods. There are two types of convergence: σ convergence and β convergence, and β convergence includes absolute convergence and conditional convergence. We use the σ coefficient to calculate the σ convergence level of urbanization, measure the absolute convergence level of urbanization with an econometric model containing spatial factor, and explore the conditional convergence of urbanization by constructing a spatial panel data model.

3.1.1. Setting of Spatial Weight Matrix

The spatial weight matrix expresses the adjacent relationships among the spatial units. In general, the spatial weight matrix is mostly determined from the geographical location, which is usually defined by the adjacent criterion and the distance criterion. Considering that population mobility and urbanization distribution are not simple adjacent relationships, we chose the distance spatial weight matrix. According to Elhorst (2010) [45], an inverse distance matrix W and each element wij are defined as:
w i j = { 1 d i j i j 0 i = j ,
where dij is the distance between location i and location j, and the selected distance metric is Euclidean Distance.

3.1.2. Convergence Test

Convergence analysis is a common topic in the study of regional economy, the basic idea is that the backward economy will develop faster than the developed economies because of the law of diminishing marginal utility, and eventually the economic level of different economies will converge to a steady state. The convergence model mainly includes σ convergence and β convergence.
(1) σ Convergence
σ convergence suggests that the differences of economic level in various economies tend to decline over time. The measurement methods include σ coefficient, Theil Entropy Index (TEI), and Coefficient of Variation (CV). According to the applicability of methods and data characteristics, we used the σ coefficient to measure σ convergence, which is defined as:
σ = ( ln y i t ln y t ¯ ) 2 n .
Here, yit is the urbanization rate of region i in the t period; y ¯ t is the average urbanization rate of all regions; n is the number of regions, and t is time variable.
(2) β Convergence
β convergence reflects the negative correlation between economic development and initial economic level in different economies. Specifically, the regions with backward economic incomes are growing faster than those with higher economic levels, forming a phenomenon of catch-up with the rich regions. The β convergence is divided into absolute convergence and conditional convergence. Absolute convergence suggests that if different regions have the same economic base, they eventually reach the same steady state level. Conditional convergence assumes that different economies will converge to their respective levels of stability, that is, backward regions may converge to their own steady state level rather than converge to developed regions.
The three major urban agglomerations in China are vast, and the spatial heterogeneity and correlation of variables are common in different cities. It may result in the estimation errors without considering the spatial factors in the model estimation, so we introduced the spatial econometric methods to modify the traditional regression model. Combined with data type characteristics of the panel, this paper chose spatial econometric models to test β convergence. There are three main models in spatial econometric, including Spatial Lag Model (SLM), Spatial Error Model (SEM), and Spatial Durbin Model (SDM). SDM not only considers the spatial correlation of the dependent variable, but also reflects the spatial correlation of the independent variables. Based on the research objective of exploring the impact of population mobility between regions on urbanization gap in this paper, we initially selected SDM for analysis. Firstly, in order to explore whether there is a convergence trend of urbanization development, the classical model for testing β absolute convergence was adopted:
Model   1 :   l n y i , t y i , t 1 = β 0 l n y i , t 1 + ρ W l n y i , t y i , t 1 + φ 0 W l n y i , t 1 + ε i , t .
Here, y is the urbanization rate, y i , t y i , t 1 measures the convergence [46]; W represents the spatial weight matrix; β0 is the coefficient of independent variable; ρ is the spatial regression coefficient of dependent variable; φ0 represents the spatial regression coefficient of independent variable; εit is the random error term, and i and t denote the region i at period t.
In addition, economic growth (gdp), industrial structure (ind), income level (income) together with infrastructure construction (road) are considered as potential factors that may have an impact on urbanization convergence [47,48,49]. The conditional convergence model with corresponding explanatory variables are as follows:
Model   2 :   l n y i . t y i , t 1 = β 0 l n y i , t 1 + j = 1 4 β j l n X j + φ 0 W l n y i , t 1 + j = 1 4 φ j W l n X j + ε i , t .
Here, W is the spatial weight matrix; Xj is the independent variables, j = 1, 2, 3, 4, which represents gdp, ind, income, and road; βj is the regression coefficients of independent variables; φj represents the spatial regression coefficients of independent variables, and εit is the error term.
Floating population is the core subject of urbanization in China and the major contributor to the growth of urban scale. The β conditional convergence in Model 3 further adds a population mobility variable to explore the impact of population mobility on urbanization convergence. Finally, the spatial econometric model of analyzing the impact of population mobility on urbanization convergence is as shown in Equation (5).
Model   3 :   l n y i , t y i , t 1 = β 0 l n y i , t 1 + j = 1 5 β j l n X j + ρ W l n y i , t y i , t 1 + φ 0 W l n y i , t 1 + j = 1 5 φ j W l n X j + ε i , t .
Here, y is the urbanization rate; W is the spatial weight matrix; Xj adds the population mobility variable, j = 1, 2, 3, 4, 5, which represents gdp, ind, income, road, and people, respectively.

3.2. Data Description

The research subjects of this paper are 38 cities including 16 cities in the Yangtze River Delta, 9 cities in the Pearl River Delta, and 13 cities in the Beijing–Tianjin–Hebei region, and the time dimension of each observation is from 2005 to 2016. The data of population, income, and road area are all from the China City Statistical Yearbook. The data of GDP and added value of secondary industry and tertiary industry are derived from Jiangsu Statistical Yearbook, Zhejiang Statistical Yearbook, Guangdong Statistical Yearbook, Beijing Statistical Yearbook, Tianjin Statistical Yearbook, and Hebei Statistical Yearbook. Urbanization is a complex system whose development is influenced by many factors. In this study, we finally selected five representative indicators to explore whether these factors are narrowing or expanding the urbanization gap from the five aspects of population, economy, industry, salary, and environment. The specific descriptions of each variable in the convergence model are as follows:
(1)
Urbanization (urban): household registration system, a unique population management policy in China. Since its establishment in the 1950s, the Chinese hukou system has categorized citizens according to both place of residence and eligibility for certain socioeconomic benefits (the latter via designation as either “agricultural” or “non-agricultural” residents) [50]. Permanent resident refers to the population living at home all years or more than 6 months, which is the actual population in an administrative area, including those who have household registration and are actually living there (registered population), as well as those who do not have household registration but are actually living there (floating population); while registered population means the population who has a household registration and actually lives in the administrative area, in which the seat of the household registration is consistent with the place of residence [9]. Due to the different statistical ranges of urban population under different population indicators, there are also two different measures of urbanization rate in China: one is to measure the proportion of urban registered population to the total population [51]; another is to measure the proportion of urban permanent residents to the total population [52]. Notably, the first method generally underestimates the level of urbanization in various regions. Meanwhile, the permanent residents index is a statistical caliber commonly used in the international census, and today’s census in China is also counted and summarized on the basis of the permanent residents indicator. Therefore, we used the second method to measure the urbanization rate.
(2)
Population mobility (people): there are two types of population mobility in China because of the household registration system: one is the flow of population with changes in household registration; the other is the flow of population without changes in household registration. According to the statistical caliber of permanent resident and registered population in China, we know that the permanent resident = registered population + floating population, in which the floating population is non-registered. Considering the lack of population mobility data at the city level, the phenomenon of residence-registration inconsistency is becoming more common and the flow of population without changes in household registration is the main component of population mobility in China, so the population mobility is roughly expressed as the flow of population without changes in household registration. This paper mainly analyzes the impact of population mobility without household registration changes on urbanization, and the regional population mobility by calculating the annual net population inflow, in which the net population inflow is equal to the permanent resident minus the registered population. The unit of population mobility is 104 people.
(3)
Economic growth (gdp): GDP per capita is a scale indicator to measure the level of economic development, and the unit is yuan/person. Urbanization rate is closely related to economic development, in the process of urbanization, the combination of rural push (such as poverty) and urban pull (such as high income) drives a large number of rural people to enter cities and towns [53], resulting in a significant increase in consumption demand and a change in consumption patterns accompanied by the increase in population in cities, and then gradually upgrades the consumption structure, thereby stimulating economic development. Meanwhile, urbanization construction will generate huge investment needs for infrastructure, public service facilities, and housing construction. Under the premise of sufficient physical-material resources, the growth of consumption and investment will make urbanization an important engine for expanding domestic demand in the future, and provide continuous momentum for China’s economic development. Furthermore, accelerated urbanization will not only increase the construction of urban transportation, communications, cultural, and entertainment infrastructure, but also promote the development of consumer services (commerce, catering, tourism) and productive services (finance, insurance, logistics). The development of various industries will provide a lot of new employment opportunities. Conversely, the rapid development of economy will attract more laborers to gather in cities and towns, provide abundant labor resources for the improvement of the secondary and tertiary industries, which will prosper the rural and urban economies and further promote the development of urbanization, this is, the higher the level of economic development, the higher the urbanization level, so the expected symbol is positive.
(4)
Industrial structure (ind): represented by the ratio of the sum of the added value of secondary industry and tertiary industry to the gross national product. The increasing production industry and consumer service industry will generate a large number of employment opportunities and absorb many laborers in the primary industry. The inflow of labor will have a positive impact on the urbanization development.
(5)
Income level (income): measured by the disposable income per capita, the unit is yuan/person. High income level in cities is the main pull power to attract the flow of rural people, the higher the disposable income per capita, the stronger the willingness of the population to flow to cities. On the other hand, the expansion of the urban-rural income gap has also caused a series of social problems that hinder the development of urbanization. Therefore, the expected symbol of the impact of income on urbanization is determined by empirical analysis.
(6)
Infrastructure construction (road): is equal to the ratio of road area to the total population, and the unit is m2/person. The perfect infrastructure construction provides a convenient transportation environment and distribution channels to promote economic development, which in turn has a positive impact on urbanization.
Due to the limitation of data acquisition, there is no direct statistics on the floating population index, so the population mobility variable in this paper is indirectly calculated by subtracting the registered population from the permanent residents. Relatively, this method is simple and one-sided. Therefore, we will focus on proposing a more comprehensive and dynamic method to reflect the inter-regional population mobility in future research. In addition, urbanization includes not only population urbanization, but also land urbanization and economic urbanization, while we mainly studied population urbanization due to space limitations and applicability to research objectives. The exploration of urbanization development from multiple perspectives will also be an important direction for our research.

4. Empirical Results and Discussion

4.1. Empirical Results

4.1.1. The Spatial Autocorrelation Analysis of Urbanization

From a spatial perspective, the urbanization distribution between regions is not balanced, showing a certain spatial correlation or heterogeneity, so we first tested the spatial autocorrelation of urbanization using Moran’s I index [54]. The results are shown in Table 1. The Moran’s I values are negative from 2005 to 2016 in the Yangtze River Delta urban agglomeration. In 2016, the value is −0.2799 at the 5% significance level, showing a strong spatial negative correlation. However, the Moran’s I value in the Beijing–Tianjin–Hebei region is significantly positive and presents a rising trend in general, indicating that the spatial positive correlation of urbanization is increasing. Similarly, there is a spatial positive correlation in the Pearl River Delta urban agglomeration. In terms of the absolute value of Moran’s I, the spatial correlation of urbanization in the Yangtze River Delta is the highest, which is greater than 0.2, whereas the absolute value of Moran’s I in the Beijing–Tianjin–Hebei region is about 0.1, and the absolute value of Moran’s I in the Pearl River Delta is the lowest.

4.1.2. Analysis of Urbanization Convergence

To analyze the variation and convergence of urbanization level, the σ coefficients of urbanization level in the Yangtze River Delta, the Pearl River Delta, and the Beijing–Tianjin–Hebei region are presented in Figure 2. From 2005 to 2016, there are some differences in the urbanization level among the three major urban agglomerations, but the σ coefficients of the Yangtze River Delta, the Pearl River Delta, and the Beijing–Tianjin–Hebei region show a downward trend, which indicates that the gap of urbanization level within each urban agglomeration is gradually narrowing. Therefore, we can preliminarily judge the urbanization level of each urban agglomeration is convergent. Notably, we cannot explain the type of convergence and the stability of this convergence based on the results in Figure 2. Therefore, we constructed spatial econometric models to further explore the urbanization convergence of the three major urban agglomerations.
According to the research of Elhorst (2010) [45], before using a spatial panel econometric model, it is necessary to determine whether there is a spatial effect, and then determine the type of spatial effect (spatial error or spatial lag), and finally determine the type of panel data model (fixed effect or random effect). The results of spatial autocorrelation analysis in Table 1 show that there are spatial effects of the urbanization development in the three major urban agglomerations. Further, whether there is spatial lag effect or spatial error effect can be determined by Likelihood Ratio (LR) test and Wald test: (1) construct and estimate the spatial Durbin panel model; (2) test the null hypothesis H 0 1 : the spatial Durbin panel model can be simplified as the spatial lag panel model; H 0 2 : the spatial Durbin panel model can be simplified as the spatial error panel model. If these two assumptions are rejected at the same time, a spatial Durbin panel model should be established. The results in Table 2 show that the LR test and the Wald test of the Yangtze River Delta, the Pearl River Delta, and Beijing–Tianjin–Hebei region all passed the significance test at the level of 5%. Therefore, we selected the spatial Durbin panel model. In addition, as the selection of a fixed effect or random effect model is measured by Hausman test, we chose a fixed effect model based on the results of Table 2. Finally, this paper used the fixed-effect spatial Durbin panel model to analyze the urbanization convergence of Yangtze River Delta, Pearl River Delta, and Beijing–Tianjin–Hebei region, as well as the relationship between population mobility and urbanization convergence.
In order to explore the characteristics of absolute convergence in the Yangtze River Delta, the Pearl River Delta, and the Beijing–Tianjin–Hebei region, we estimated Model 1 using the common panel model and spatial Durbin panel model in Table 3. After adding the spatial variable, the goodness of fit of Model 1 is significantly improved, and the spatial lag coefficients of the explanatory variable and the dependent variable are significant at the level of 5%, which indicates that the spatial Durbin panel model is more effective compared with the common panel model. In Table 3, the spatial lag term coefficients ρ of Yangtze River Delta and Pearl River Delta in the spatial Durbin panel model are 0.292 and −0.793, respectively, which are significant at the level of 1%. The value ρ of Beijing–Tianjin–Hebei region is not significant, so there is no obvious adjacent spatial spillover effect in urbanization convergence. The coefficients of lnyi,t−1 in the Yangtze River Delta, the Pearl River Delta, and the Beijing–Tianjin–Hebei region are −0.193, −0.399, and −0.147, respectively, which are all negative at the 1% significance level, and the urbanization level has absolute convergence.

4.1.3. The Impact of Population Mobility on Urbanization Convergence

The urbanization development of China’s three major urban agglomerations has absolute β convergence characteristics. Why does the inter-regional urbanization level tend to be convergent despite the differences in urbanization level in different regions? Which factors lead to the phenomenon of convergence? This part focuses on the causes of urbanization convergence. Model 2 examines the impact of economy, industrial structure, income, and infrastructure on urbanization convergence, and Model 3 adds a population mobility variable. The estimated results are shown in Table 4. Compared with the absolute β convergence results in Table 3, the fitting effect and explanatory ability of the model are improved after the control variables are added.
In Model 2, without considering the impact of population mobility variable on urbanization convergence, the coefficients of lnyi,t−1 in Yangtze River Delta, Pearl River Delta, and Beijing–Tianjin–Hebei region are −0.354, −0.635, and −0.189, respectively, all of which are significant at the 1% level, indicating that the regions with lower initial urbanization levels have higher growth rates, and there is conditional β convergence of urbanization level in the three major urban agglomerations. Consistent with the estimated results of absolute convergence in Model 1, the convergence rate of urbanization in Pearl River Delta is much faster than that in Yangtze River Delta and Beijing–Tianjin–Hebei region. However, the spatial lag term coefficient ρ of Pearl River Delta in spatial Durbin panel model is −0.74 and is significant at the level of 1%, which shows that the regions with high urbanization will negatively affect the regions with low urbanization levels. Similarly, the spatial lag term coefficient ρ in Beijing–Tianjin–Hebei region is also negative, but the positive diffusion effect of urbanization development in Yangtze River Delta is not significant.
In Model 3, adding the population mobility variable, the influence coefficients of population mobility variable in Yangtze River Delta, Pearl River Delta, and Beijing–Tianjin–Hebei region on urbanization growth rate are −0.0009, −0.0002, and −0.0001, respectively, which are significant at the level of 5%, showing that population mobility has a negative impact on the urbanization growth rate and there is a convergent effect. Similarly, at the significance level of 1%, the coefficients of lnyi,t−1 in Yangtze River Delta, Pearl River Delta, and Beijing–Tianjin–Hebei region are −0.375, −0.673, and −0.292, respectively, and the absolute values of β0 in the three major urban agglomerations have significantly improved, indicating that population mobility accelerates the convergence of urbanization. Furthermore, the coefficients of W*people in Yangtze River Delta, Pearl River Delta, and Beijing–Tianjin–Hebei region are −0.003, −0.0002, and 0.0001, respectively, whereas the estimated coefficients of W*people in Pearl River Delta and Beijing–Tianjin–Hebei are not significant. According to the estimated results of the model, the factors affecting the urbanization convergence in various urban agglomerations are not consistent except for the population mobility variable: in the Yangtze River Delta urban agglomeration, the coefficient of lnroad is −0.0001, and the coefficient of W*lnroad is 0.0003, the road infrastructure has a significant negative correlation with urbanization convergence. In the Pearl River Delta urban agglomeration, the influence of industrial structure on the urbanization development is divergent, and there is a positive spatial spillover effect on the urbanization development in the surrounding areas. In the Beijing–Tianjin–Hebei urban agglomeration, the economic level has a positive effect on the urbanization growth at the significance level of 5%.

4.2. Discussion

4.2.1. Discussion on the Results of Spatial Autocorrelation

In the Yangtze River Delta urban agglomeration, there is a significant spatial agglomeration effect in the development of urbanization, and the local urbanization development will reduce the urbanization rate of the neighboring areas. The more obvious the spatial agglomeration effect, the more divergent the urban growth between regions. In the Pearl River Delta urban agglomeration and the Beijing–Tianjin–Hebei region, the increase of urbanization rate will enhance the neighbors’ urbanization level, which shows the urbanization level has a significant diffusion effect. The more obvious the spatial diffusion effect, the regional differences in urbanization levels will gradually narrow, and the urbanization rate between regions will present a convergence trend [16]. Specifically, in the Yangtze River Delta urban agglomeration, population mobility improves the urbanization level in economically developed regions and reduces the urbanization rate in less developed areas; while the improvement of urban level will drive the development of surrounding cities in the Beijing–Tianjin–Hebei region and the Pearl River Delta urban agglomeration, which shows a significant spatial diffusion effect but the spatial positive correlation is relatively weak.

4.2.2. Discussion on the Results of Urbanization Convergence

Firstly, based on the results of absolute β convergence, the urbanization levels in the Yangtze River Delta, the Pearl River Delta, and the Beijing–Tianjin–Hebei region also have spatial correlation. The spatial lag term coefficient ρ reflects that the urbanization level of a region is affected by the urban growth of neighboring regions. In essence, this is the diffusion or agglomeration effect between various elements in different regions [55]. If the diffusion effect is greater than the agglomeration effect, which means that the regions with high urbanization levels produces a positive impact on the regions with low urbanization rates. The coefficient ρ of Yangtze River Delta is obviously greater than 0, indicating that the urbanization development of Yangtze River Delta has a diffusion effect; while the lag term coefficient ρ of Pearl River Delta is significantly less than 0, showing that the urbanization development of Pearl River Delta has an agglomeration effect.
In addition, based on the analysis of absolute σ convergence and β convergence, we know that the urban growth between three major urban agglomerations is imbalanced, but the development trend of urbanization has absolute convergence. At this stage, due to the imbalance of regional development, the different employment opportunities and educational conditions in various regions have led to great differences in urbanization development between regions. Whereas, with the deepening of inter-regional cooperation, the areas with low urbanization level and relatively backward development attract more and more population inflow due to the advantages of environment and resources, so the urbanization rate has been improved, and the growth rate of urbanization level is higher than that of developed regions where urbanization development has reached a stable state, forming a phenomenon of catching up with the high urbanization level [55]. The combination of the diffusion effect of high-urbanization cities and the high growth rate of low-urbanization cities promote the continuous convergence of inter-regional urbanization. In particular, the spatial effect increases the convergence rate except for the Pearl River Delta, which means that the combination of the agglomeration effect of high-urbanization cities and the high growth rate of low-urbanization cities produces continuous divergence of inter-regional urbanization. The results are consistent with the exploration of Liu et al. (2019), which provides some evidence that the agglomeration of large cities is not conducive to the inter-regional convergence of urbanization efficiency [55].

4.2.3. Discussion on the Impact of Population Mobility on Urbanization Convergence

Without considering the population mobility variable, there is conditional β convergence of urbanization level in the Yangtze River Delta, the Pearl River Delta, and the Beijing–Tianjin–Hebei region, and the β convergence rate of Pearl River Delta urban agglomeration is the highest. The Pearl River Delta urban agglomeration locates in the south-central part of Guangdong Province and at the estuary of the Pearl River, and it is the earliest pilot area of China’s reform and opening up. The economic strength is strong, and the surrounding small cities are also well developed under the leadership of big cities. With the transfer of human resources and knowledge technology in developed regions to underdeveloped regions, the economic development of small and medium size cities has been promoted, which objectively helps to narrow the gap of urbanization level between different regions [56]. However, the reality is that the local development of Pearl River Delta will strengthen the polarization between regions and weaken the convergence of urbanization levels. Therefore, considering the spatial correlation between regions, in order to increase the convergence of unbalanced urban growth in different cities, it is necessary to enhance the inter-regional cooperation and coordination of economic growth and urban development.
Considering the population mobility variable, population mobility contributes to the convergence of urbanization, the higher the net population inflow, the slower the urbanization growth rate of the region, while the lower the net population inflow, the faster the regional urbanization growth rate.
The reason that population mobility has an important role in promoting the urbanization convergence is due to a lot of rural population pouring into the city which causes city overload and hinders the urbanization development of cities with higher urbanization levels. Whereas the population is mainly characterized by net outflow and low inflow in areas with low urbanization level, the large outflow of rural population and the emergence of “reverse urbanization” have led to a rapid increase of urbanization rate in low-urbanized areas [57]. Moreover, in terms of the reality of population distribution, the population will inflow and outflow no matter whether it is economically developed or economically backward, but the inflow population in developed regions will be much larger than the outflow population. The outflow of populations has obvious polarization characteristics in spatial distribution, but this feature is weakened with the decentralization of the floating population. Compared with the population outflow, the spatial agglomeration of population inflow is more significant, and the population is concentrated in economically developed regions, but the backward regions are also increasing their attraction on the floating population due to the advantages of resources and environment. The decentralization of population mobility and the shift of urban centers will gradually alleviate the overall imbalance of urban development [58].
The population mobility in Yangtze River Delta has a negative spatial correlation with urbanization convergence, and the cities with frequent population flow will produce a diffuse effect on the neighbor’s urbanization development, which will balance the urban growth and facilitate the urbanization convergence, while the spatial spillover effect of population mobility in Pearl River Delta and Beijing–Tianjin–Hebei urban agglomerations on urbanization convergence is slight. Moreover, urbanization level has an agglomeration effect, and the higher urbanization level will attract the aggregation of various elements in the neighboring cities, which will be detrimental to the convergence of inter-regional urbanization. Furthermore, population mobility not only improves urbanization convergence, but also mitigates the adverse effects of the spatial agglomeration effect on urbanization convergence. Under the influence of population mobility, the combination of the agglomeration effect of high-urbanization cities and the high growth rate of low-urbanization cities will also promote the continuous convergence of inter-regional urbanization [55].
In addition to population mobility variable, other factors also have an impact on urbanization convergence. For instance, road infrastructure has a positive direct effect and a negative spatial effect on urbanization convergence in the Yangtze River Delta urban agglomeration. The infrastructure development level is an important driving force for the urbanization process [47], providing a strong guarantee for the development of all residents’ lives and economic construction in the city. The highly improved infrastructure construction strengthens the relation between urban and rural areas and narrows the regional urbanization gap. Then, the increase of road area has a positive spatial spillover effect on the urbanization convergence in adjacent regions, and the city with more complete infrastructure construction will attract the gathering of various elements in the surrounding cities. When the city with high urbanization is saturated, the concentration of elements will bring a crowding effect, which is not conducive to the urbanization convergence. On the other hand, it increases the economic strength of the surrounding cities and enhances the urbanization convergence in the surrounding areas [49].
The imbalance of industrial structure development between regions leads to the imbalance of urban growth in the Pearl River Delta urban agglomeration. With the continuous improvement of the income of urban residents, the income gap between urban and rural regions is also shrinking. At the beginning, the widening income gap between urban and rural areas indicates that cities and towns are superior to rural areas, and rural populations migrate to cities and towns in order to seek better employment opportunities and higher incomes. However, rural productivity is constantly improving, coupled with the high consumption level of urban regions compared with rural regions, the comparative advantage of choosing urban life is gradually decreasing, which leads to the decline of urbanization growth rate [48]. Meanwhile, the increase of income level has increased the absorption capacity of neighboring regions to populations, thus reducing the urban growth in native cities and benefiting the inter-regional urbanization convergence.
Economic development is an important factor affecting urbanization convergence [47]. The economic development has provided sufficient financial support for urban construction, increased the attractiveness of cities, and the expansion of the inter-regional economic gap has caused the rural population and even the urban population in backward regions to migrate to economically developed regions, which has made it difficult to increase the urbanization rate of populations in underdeveloped regions. The divergence of inter-regional economic development has aggravated the divergence of urbanization level. At the same time, economic development and urbanization convergence have positive spatial correlation, and the agglomeration effect of economic development is not conducive to coordinated development between cities.

5. Conclusions and Policy Implications

5.1. Conclusions

This paper explored the impact of population mobility on urbanization convergence in China’s three major urban agglomerations from spatial perspective, and the main conclusions are as follows:
(1)
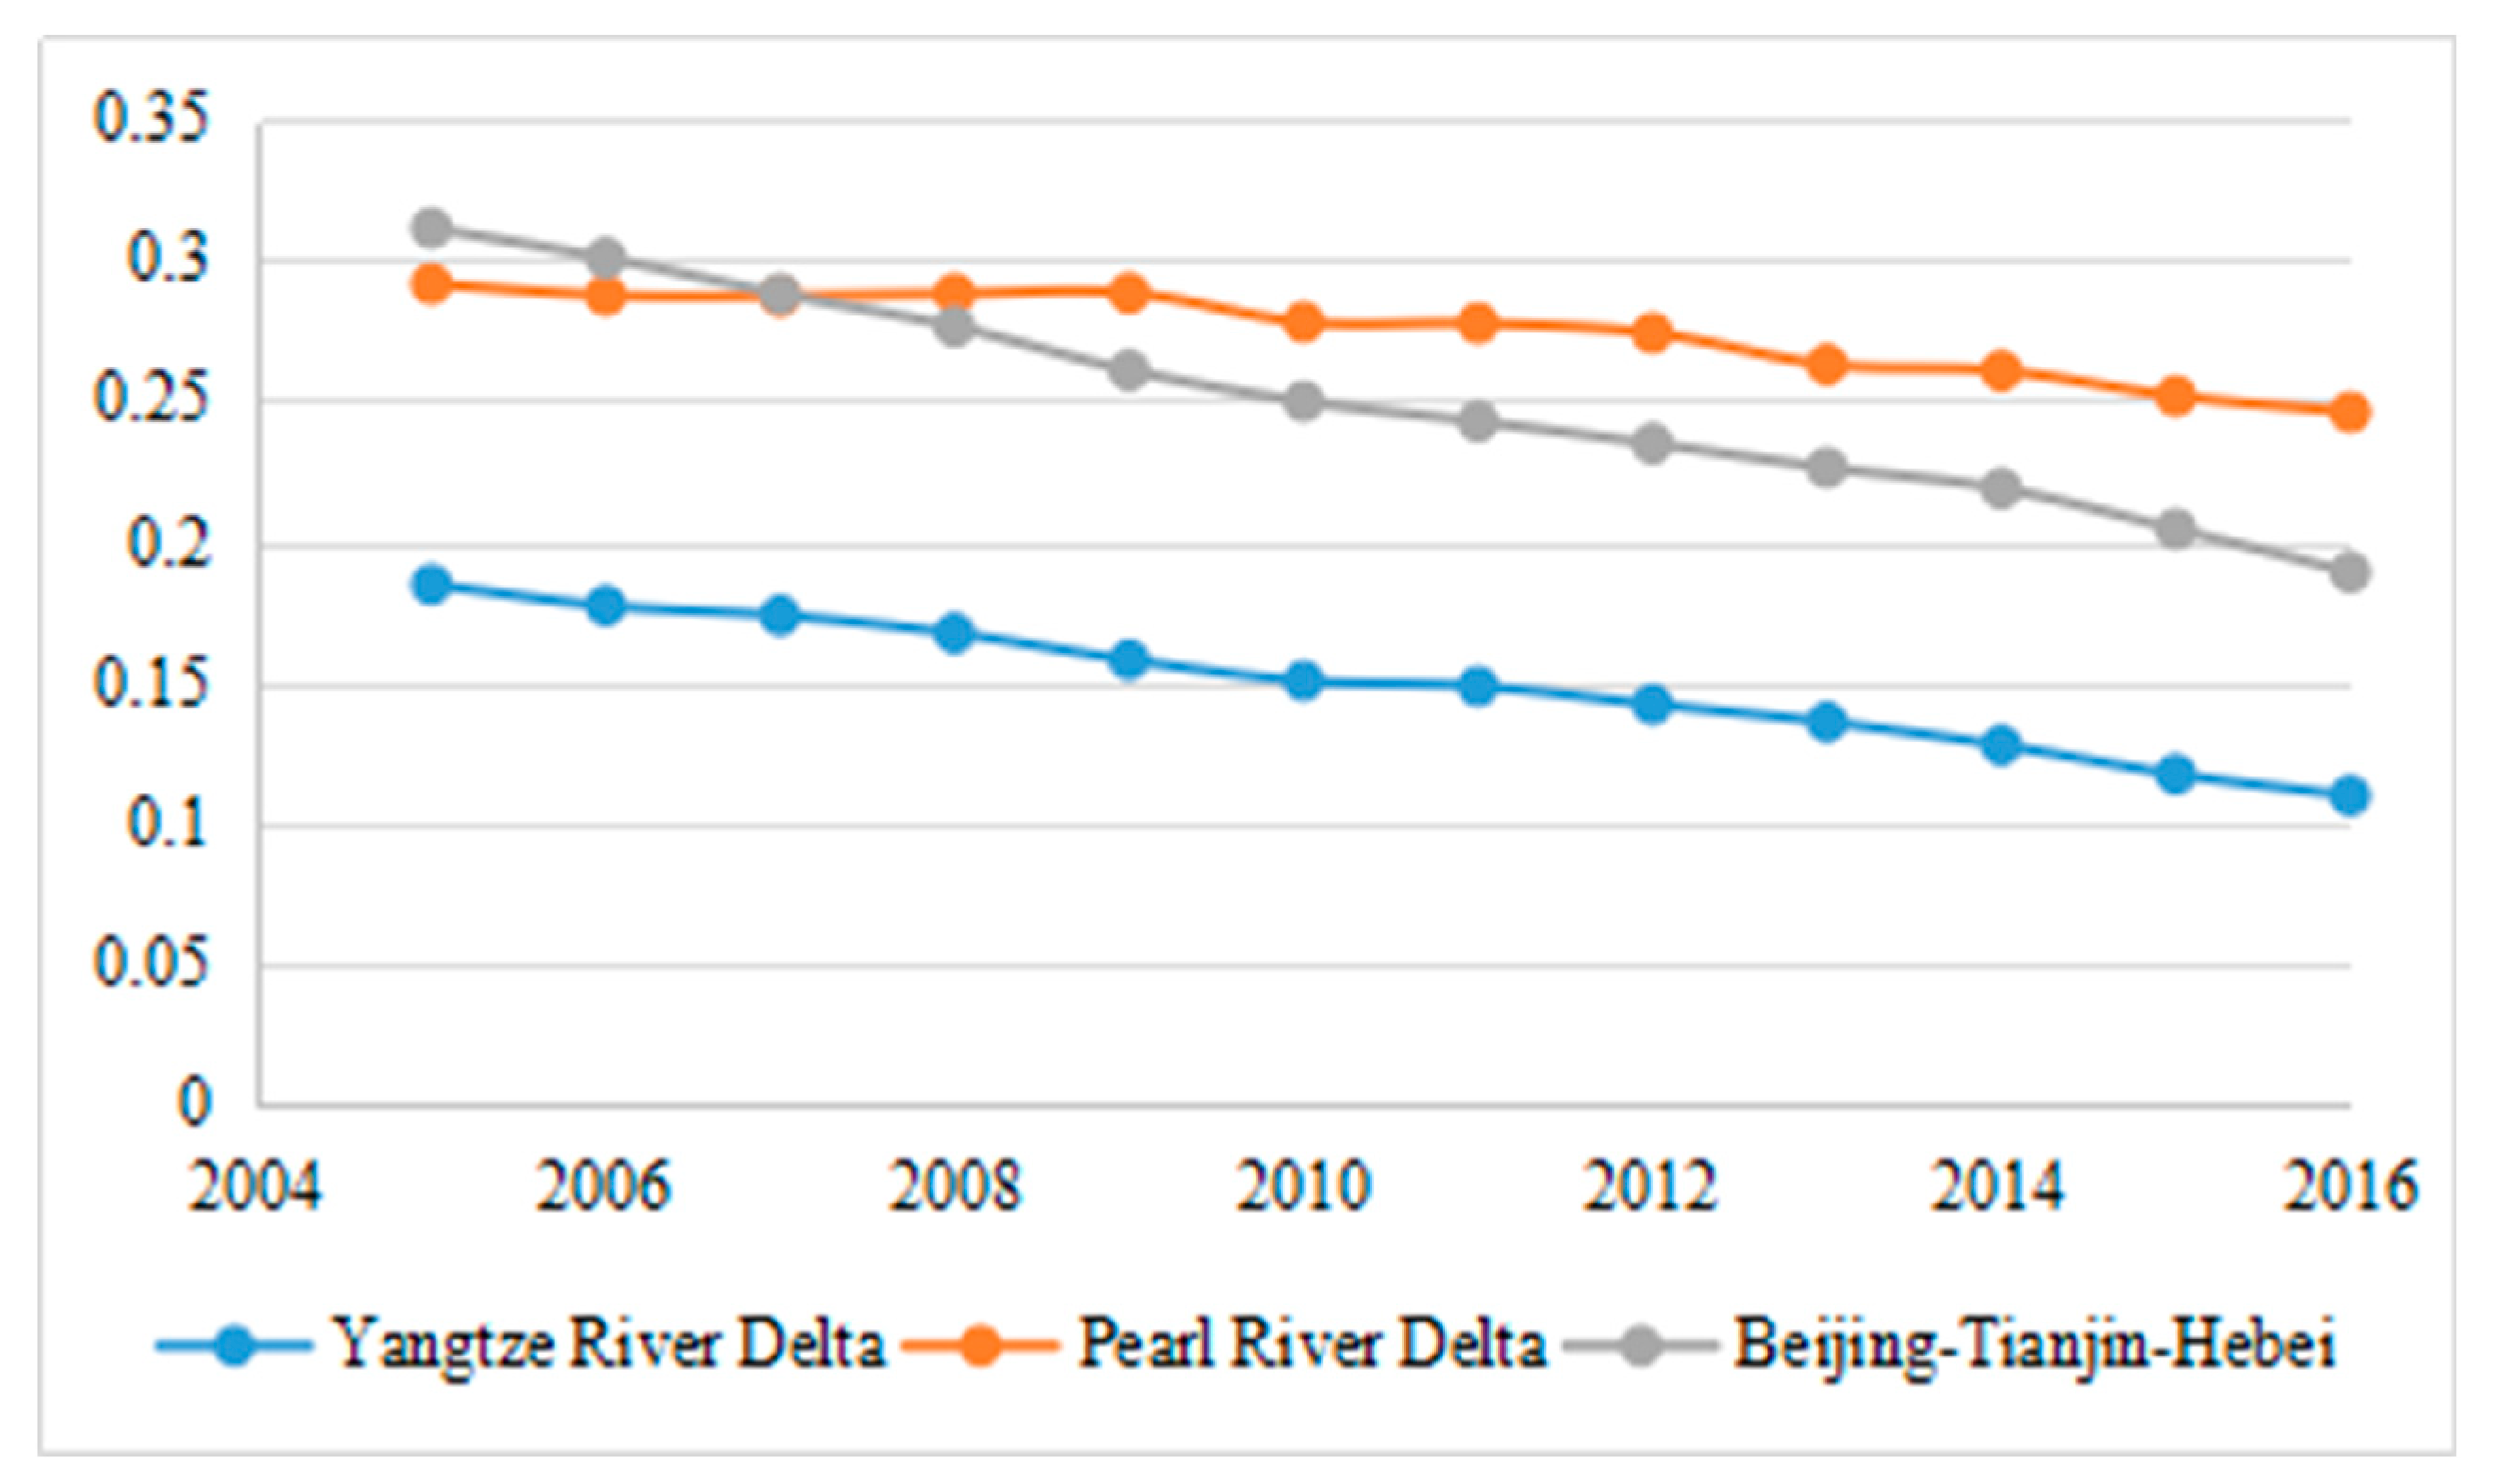
Change trends of urbanization level show the differences in the three major urban agglomerations: the urbanization development level in Pearl River Delta is the highest, followed by Yangtze River Delta, and the urbanization development in Beijing–Tianjin–Hebei is the lowest.
(2)
Either absolute or conditional, urbanization level is converging. Compared to absolute β convergence, the speed of conditional β convergence is faster.
(3)
Two possible mechanisms of urbanization are discussed in our article: the urbanization convergence in Yangtze River Delta has a spatial diffusion effect, and the urbanization gap between regions is gradually decreasing; however, the urbanization convergence in Pearl River Delta and Beijing–Tianjin–Hebei region show a spatial agglomeration effect, and the urbanization development between regions is divergent.
(4)
Population mobility accelerates the urbanization convergence, narrows the positive impact of spatial agglomeration effects on urbanization regional differences, and realizes the continuous convergence of inter-regional urbanization levels under the combination of the agglomeration effect of high-urbanization cities and the high urban growth of low-urbanization cities.
(5)
The effects of other factors on urbanization convergence in various regions are not homogeneous: the road infrastructure construction in Yangtze River Delta is negatively correlated with the urbanization growth rate; the industrial development and urban growth in Pearl River Delta has a positive effect on urban growth, whereas the increase in income level has reduced the urbanization divergence; and the economic development in Beijing–Tianjin–Hebei region has a positive correlation with the growth rate of urbanization.

5.2. Policy Implications

Based on the above conclusions, there are some policy implications:
(1)
Further strengthen inter-regional cooperation and exchanges. Economically developed urban agglomerations can provide financial support to surrounding areas, offer more employment opportunities and better infrastructure, while resource-rich urban agglomerations can provide resource support, thereby eliminating the barriers of factor flow and information exchange between regions, promoting the coordinated development between cities, and making the factor diffusion effect greater than the agglomeration effect. The governments in various regions should actively seek inter-regional cooperation and mutual assistance, learn from the successful models in the process of urbanization development in neighboring regions, and formulate policies appropriate to the urbanization development of the region in accordance with local conditions to achieve a win-win situation between regions.
(2)
Build new countryside and small towns. The large influx of rural populations into cities not only promotes the rapid development of the economy of the inflow area, but also alleviates the poverty situation in the rural areas, helps the transfer of the rural areas from the primary industry to the secondary and tertiary industries, and promotes the adjustment of the rural industrial structure and the rational allocation of resources. On one hand, continuously narrowing the development gap between urban and rural areas and promoting coordinated and sustainable development requires the support and pulling effect of developed urban areas on rural areas; on the other hand, rural areas also need to take advantage to actively promote the construction of new countryside and small towns. Therefore, to reduce the regional disparity and guide the orderly flow of populations, it is necessary to vigorously enhance the productivity of the outflow areas.
(3)
Strengthen regional coordination and integration. The coordinated development of urban agglomerations is an important part of the healthy and sustainable development of urban agglomerations. This paper shows that the urbanization of the three major urban agglomerations has convergence, but there are still problems of uncoordinated development. For example, the development gradient in the Beijing–Tianjin–Hebei region is large, the core cities are over-polarized, while the development of small- and medium-sized cities is insufficient. The hierarchical structure of coordinated development of large, medium, and small cities and towns has not yet been formed. In order to achieve sustainable regional development, different urban agglomerations should also strengthen cooperation and promote industrial division of labor between cities.
(4)
Urbanization is not only a process of population movement from rural to urban, but also a process of changing the lifestyles, social culture, and consumption concept of rural populations. Population mobility is an important factor in reducing the urbanization difference in China, we should guide and plan the orderly flow of populations among regions, pay more attention to people’s livelihood, and achieve people-oriented high-quality urbanization.
(5)
Different areas should focus on the role of other factors in promoting the urbanization convergence. For example, the Yangtze River Delta urban agglomeration can continue to strengthen the construction of urban road infrastructure, exert the diffusion effect of traffic factors, and promote inter-regional coordinated development; the realization of balanced urban development in Pearl River Delta needs to optimize and upgrade the industrial structure, focus on the development of the service industry, and constantly narrow the differences in disposable income per capita between urban and rural regions; however, the urbanization convergence in Beijing–Tianjin–Hebei region can depend on the balance of regional economic development in order to promote the economic growth in the less developed regions through the support of preferential policies and the promotion of advanced technologies, and weaken the spatial agglomeration effect of cities with high economic levels.
Compared to previous studies, our findings provide some contributions. First, we examined the impact of population mobility on urbanization convergence rather than describing the features and trends of urbanization convergence alone [59], and many important policy implications are inferred on the basis of the analysis of the influencing factors that lead to the convergence of urbanization. Secondly, we explored the issue of urbanization convergence at the scale of urban agglomeration, whereas previous studies discussed this issue from the perspective of province or municipality, which addresses a gap in existing research regarding this scale. Moreover, we added a spatial factor and considered inter-regional interaction, which makes the conclusion more comprehensive and reliable [16]. Finally, the empirical research process of this paper is completely repeatable, which provides simple guidance for in-depth research in later studies. In addition to the impact of population mobility on urbanization convergence, we can explore the impact of other factors on urbanization convergence in future research, or analyze the impact of population mobility on regional differences in environmental governance with the environment as a hot issue [60].

Author Contributions

Conceptualization, F.W. and J.L.; Data curation, X.L. and X.Y.; Formal analysis, W.F.; Funding acquisition, F.W. and J.L.; Methodology, W.F., X.L. and X.Y.; Supervision, F.W.; Writing—original draft, W.F.; Writing—review and editing, F.W. and J.L. All authors have read and agreed to the published version of the manuscript.

Funding

This work was supported by the Think Tank of Energy Mining Economy (2018 Project for Cultural Evolution and Creation of CUMT, China) (Grant No. 2018WHCC01).

Conflicts of Interest

The authors declare no conflict of interest.

References

  1. Shang, J.; Li, P.F.; Li, L.; Chen, Y. The relationship between population growth and capital allocation in urbanization. Technol. Forecast. Soc. Chang. 2018, 135, 249–256. [Google Scholar] [CrossRef]
  2. De Sherbinin, A.; Schiller, A.; Pulsipher, A. The vulnerability of global cities to climate hazards. Environ. Urban. 2007, 19, 39–64. [Google Scholar] [CrossRef] [Green Version]
  3. Buhaug, H.; Urdal, H. An urbanization bomb? Population growth and social disorder in cities. Glob. Environ. Chang. 2013, 23, 1–10. [Google Scholar] [CrossRef]
  4. Gu, C.; Hu, L.; Cook, L.G. China’s urbanization in 1949–2015: Processes and driving forces. Chin. Geogr. Sci. 2017, 27, 847–859. [Google Scholar] [CrossRef]
  5. Yuan, J.J.; Lu, Y.L.; Ferrier, R.C.; Liu, Z.Y.; Su, H.Q.; Meng, J.; Song, S.; Jenkins, A. Urbanization, rural development and environmental health in China. Environ. Dev. 2018, 28, 101–110. [Google Scholar] [CrossRef]
  6. Chen, M.X.; Liu, W.D.; Lu, D.D. Challenges and the way forward in China’s new-type urbanization. Land Use Policy 2016, 55, 334–339. [Google Scholar] [CrossRef]
  7. Song, Y. What should economists know about the current Chinese hukou system? China Econ. Rev. 2014, 29, 200–212. [Google Scholar] [CrossRef]
  8. Colas, M.; Ge, S.Q. Transformations in China’s internal labor migration and hukou system. J. Labor Res. 2019, 40, 296–331. [Google Scholar] [CrossRef]
  9. Qiao, X.C. Household registration system, urbanization and great population flow. Popul. Econ. 2019, 5, 1–17. [Google Scholar]
  10. Sun, P.J.; Song, W.; Xiu, C.L.; Liang, Z.M. Non-coordination in China’s urbanization: Assessment and affecting factors. Chin. Geogr. Sci. 2013, 23, 729–739. [Google Scholar] [CrossRef] [Green Version]
  11. Yuan, B.C.; Li, J.N.; Wang, Z.G.; Wu, L. Household registration system, migration, and inequity in healthcare access. Healthcare 2019, 7, 61. [Google Scholar] [CrossRef] [PubMed] [Green Version]
  12. SOHU.com. Available online: http://www.sohu.com/a/157036471_120702 (accessed on 14 July 2017).
  13. Quah, D.T. Empirics for economic growth and convergence. Eur. Econ. Rev. 1996, 40, 1353–1375. [Google Scholar] [CrossRef]
  14. Li, F.; Li, G.D.; Qin, W.S.; Qin, J.; Ma, H.T. Identifying economic growth convergence clubs and their influencing factors in China. Sustainability 2018, 10, 2588. [Google Scholar] [CrossRef] [Green Version]
  15. DiCecio, R.; Gascon, C.S. Income convergence in the United States: A tale of migration and urbanization. Ann. Reg. Sci. 2010, 45, 365–377. [Google Scholar] [CrossRef]
  16. Liu, T.Y.; Su, C.W.; Jiang, X.Z. Convergence of China’s urbanization. J. Urban Plan. Dev. 2015, 141, 05014026. [Google Scholar] [CrossRef]
  17. Lin, Y.F. Analysis of regional urbanization level differences under the influence of population mobility—Based on the provincial data from 2000 to 2015. China Acad. J. Electron. Publ. House 2019, 1, 416–424. [Google Scholar]
  18. Solow, R.M. A Contribution to the Theory of Economic Growth. Q. J. Econ. 1956, 70, 65–94. [Google Scholar] [CrossRef]
  19. Swan, W. Economic Growth and Capital Accumulation. Econ. Rec. 1956, 32, 334–361. [Google Scholar] [CrossRef]
  20. Baumol, W.J. Productivity growth, convergence, and welfare: What the long—Run data show. Am. Econ. Rev. 1986, 76, 1072–1085. [Google Scholar]
  21. Abramovitz, M. Catching up, forging ahead, and falling behind. J. Econ. Hist. 1986, 46, 385–406. [Google Scholar] [CrossRef]
  22. Ahmad, M.; Hall, S.G. Economic growth and convergence: Do institutional proximity and spillovers matter? J. Policy Model. 2017, 39, 1065–1085. [Google Scholar] [CrossRef] [Green Version]
  23. Haupt, H.; Schnurbusa, J.; Semmler, W. Estimation of grouped, time-varying convergence in economic growth. Econom. Stat. 2018, 8, 141–158. [Google Scholar] [CrossRef]
  24. Cabral, R.; Castellanos-Sosa, F.A. Europe’s income convergence and the latest global financial crisis. Res. Econ. 2019, 73, 23–34. [Google Scholar] [CrossRef]
  25. Ganong, P.; Shoag, D. Why has regional income convergence in the U.S. declined? J. Urban. Econ. 2017, 102, 76–90. [Google Scholar] [CrossRef] [Green Version]
  26. Wang, X.; Shao, S.; Li, L. Agricultural inputs, urbanization, and urban-rural income disparity: Evidence from China. China Econ. Rev. 2019, 55, 67–84. [Google Scholar] [CrossRef]
  27. Kong, J.N.; Phillips, P.C.B.; Sul, D.Y. Weak σ-convergence: Theory and applications. J. Econom. 2019, 209, 185–207. [Google Scholar] [CrossRef] [Green Version]
  28. Ozturk, A.; Cavusgil, S.T. Global convergence of consumer spending: Conceptualization and propositions. Int. Bus. Rev. 2019, 28, 294–304. [Google Scholar] [CrossRef]
  29. Mishra, V.; Smyth, R. Convergence in energy consumption per capita among ASEAN countries. Energy Policy 2014, 73, 180–185. [Google Scholar] [CrossRef]
  30. Yu, S.W.; Hu, X.; Fan, J.L.; Cheng, J.H. Convergence of carbon emissions intensity across Chinese industrial sectors. J. Clean Prod. 2018, 194, 179–192. [Google Scholar] [CrossRef]
  31. Holmes, M.J.; Otero, J.; Panagiotidis, T. Property heterogeneity and convergence club formation among local house prices. J. Hous. Econ. 2019, 43, 1–13. [Google Scholar] [CrossRef]
  32. Kristic, I.R.; Dumancic, L.R.; Arcabic, V. Persistence and stochastic convergence of euro area unemployment rates. Econ. Model. 2019, 76, 192–198. [Google Scholar] [CrossRef]
  33. Mulligan, G.F. Revisiting the urbanization curve. Cities 2013, 32, 113–122. [Google Scholar] [CrossRef]
  34. Taubenboeck, H.; Gerten, C.; Rusche, K.; Siedentop, S.; Wurm, M. Patterns of Eastern European urbanisation in the mirror of Western trends—Convergent, unique or hybrid? Environ. Plan. B-Urban Anal. City Sci. 2019, 46, 1206–1225. [Google Scholar] [CrossRef] [Green Version]
  35. Wang, S.L.; Tan, S.K.; Yang, S.F.; Lin, Q.W.; Zhang, L. Urban-biased land development policy and the urban-rural income gap: Evidence from Hubei Province, China. Land Use Policy 2019, 87, 104066. [Google Scholar] [CrossRef]
  36. Liu, T.Y.; Su, C.W.; Jiang, X.Z. Is China’s urbanization convergent? Singap. Econ. Rev. 2015, 61, 1550058. [Google Scholar] [CrossRef]
  37. Su, Y.Q.; Tesfazion, P.; Zhao, Z. Where are the migrants from? Inter- vs. intra-provincial rural-urban migration in China. China Econ. Rev. 2018, 47, 142–155. [Google Scholar] [CrossRef] [Green Version]
  38. Chen, M.X.; Gong, Y.H.; Lu, D.D.; Ye, C. Build a people-oriented urbanization: China’s new-type urbanization dream and Anhui model. Land Use Policy 2019, 80, 1–9. [Google Scholar] [CrossRef]
  39. Bhagat, R.B.; Mohanty, S. Emerging pattern of urbanization and the contribution of migration in urban growth in India. Asian Popul. Stud. 2009, 5, 5–20. [Google Scholar] [CrossRef]
  40. He, C.F.; Chen, T.M.; Mao, X.Y.; Zhou, Y. Economic transition, urbanization and population redistribution in China. Habitat Int. 2016, 51, 39–47. [Google Scholar] [CrossRef]
  41. Mourao, P.R. ‘Keeping up with the (Portuguese) Joneses’—A study on the spatial dependence of municipal expenditure. Appl. Econ. 2019, 51, 3689–3709. [Google Scholar] [CrossRef]
  42. Bao, S.M.; Bodvarsson, O.B.; Hou, J.W.; Zhao, Y.H. The regulation of migration in a transition economy: China’s Hukou system. Contemp. Econ. Policy 2011, 29, 564–579. [Google Scholar] [CrossRef] [Green Version]
  43. Crankshaw, O. Causes of urbanisation and counter-urbanisation in Zambia: Natural population increase or migration? Urban Stud. 2018, 41, 2245–2272. [Google Scholar] [CrossRef]
  44. Elhorst, J.P. Spatial Economics: From Cross-Sectional Data to Spatial Panels; Springer-Verlag Berlin Heidelberg Publisher: Berlin, Germany, 2014; pp. 38–84. [Google Scholar]
  45. Elhorst, J.P. Applied spatial econometrics: Raising the bar. Spat. Econ. Anal. 2010, 5, 1742–1780. [Google Scholar] [CrossRef]
  46. Rios, V.; Gianmoena, L. Convergence in CO2 emissions: A spatial economic analysis with cross-country interactions. Energy Econ. 2018, 75, 222–238. [Google Scholar] [CrossRef]
  47. Maparu, T.S.; Mazumder, T.N. Transport infrastructure, economic development and urbanization in India (1990–2011): Is there any causal relationship? Transp. Res. Pt. A-Policy Pract. 2017, 100, 319–336. [Google Scholar] [CrossRef]
  48. Wu, D.J.; Rao, P. Urbanization and income inequality in China: An empirical investigation at provincial level. Soc. Indic. Res. 2017, 131, 189–214. [Google Scholar] [CrossRef]
  49. Zeng, C.; Song, Y.; Cai, D.W.; Hu, P.Y.; Cui, H.T.; Yang, J.; Zhang, H.X. Exploration on the spatial spillover effect of infrastructure network on urbanization: A case study in Wuhan urban agglomeration. Sustain. Cities Soc. 2019, 47, 101476. [Google Scholar] [CrossRef]
  50. Congressional Executive Commission on China. Available online: https://www.cecc.gov/publications/issue-papers/cecc-special-topic-paper-chinas-household-registration-system-sustained (accessed on 7 October 2005).
  51. Cai, J.M.; Zheng, M.S.; Liu, Y. Measurement and international comparison of China’s real urbanization level. China Rev. Political Econ. 2019, 10, 95–128. [Google Scholar]
  52. Lin, S.F.; Sun, J.; Marinova, D.; Zhao, D.T. Effects of population and land urbanization on China’s environmental impact: Empirical analysis based on the extended STIRPAT model. Sustainability 2017, 9, 825. [Google Scholar] [CrossRef] [Green Version]
  53. Jedwab, R.; Christiaensen, L.; Gindelsky, M. Demography, urbanization and development: Rural push, urban pull and … urban push? J. Urabn Econ. 2017, 98, 6–16. [Google Scholar] [CrossRef] [Green Version]
  54. Moran, P.A.P. Notes on continuous stochastic phenomena. Biometrika 1950, 37, 17–23. [Google Scholar] [CrossRef] [PubMed]
  55. Liu, W.; Zhang, Y.L.; Tian, H.Y.; Deng, S.K. Study on the convergence of urbanization efficiency and its influencing factors. J. Chin. Three Gorges Univ. (Humanit. Soc. Sci.) 2019, 41, 72–78. [Google Scholar]
  56. Liu, F.Y.; Liu, C.Z. Regional disparity, spatial spillover effects of urbanisation and carbon emissions in China. J. Clean. Prod. 2019, 241, 118226. [Google Scholar] [CrossRef]
  57. Xu, W.P.; Xia, S.W. Convergence of urbanization in China: Theoretical hypotheses and empirical research. Popul. Econ. 2016, 214, 1–9. [Google Scholar]
  58. Salvador, G.A. Rapid development as a factor of imbalance in urban growth of cities in Latin America: A perspective based on territorial indicators. Habitat Int. 2016, 58, 127–142. [Google Scholar]
  59. Yu, J.; Fang, D.C. Research on the convergence of China’s urbanization Level—An empirical analysis based on panel data. J. Jilin Bus. Technol. Coll. 2013, 29, 11–15. [Google Scholar]
  60. Wang, Z.B.; Liang, L.W.; Sun, Z.; Wang, X.M. Spatiotemporal differentiation and the factors influencing urbanization and ecological environment synergistic effects within the Beijing-Tianjin-Hebei urban agglomeration. J. Environ. Manag. 2019, 243, 227–239. [Google Scholar] [CrossRef]
Figure 1. Location of the Yangtze River Delta, the Pearl River Delta, and the Beijing–Tianjin–Hebei urban agglomeration. (a) Location map of the three major urban agglomerations; (b) map of the Yangtze River Delta; (c) map of the Pearl River Delta; and (d) map of the Beijing–Tianjin–Hebei region.
Sustainability 12 00458 g001
Figure 2. The σ coefficients of Yangtze River Delta, Pearl River Delta, and Beijing–Tianjin–Hebei.
Sustainability 12 00458 g002
Table 1. The Moran’s I values of urbanization in Yangtze River Delta, Pearl River Delta, and Beijing–Tianjin–Hebei.
RegionYangtze River DeltaPearl River DeltaBeijing–Tianjin–Hebei
2005−0.2307 **−0.07830.0784 *
[0.04][0.23][0.08]
2006−0.2142 *0.02830.1131 **
[0.05][0.14][0.04]
2007−0.2103 *0.03310.1551 **
[0.05][0.12][0.03]
2008−0.2078 *0.02530.1528 *
[0.08][0.11][0.06]
2009−0.2018 *0.0003 *0.1459 *
[0.08][0.07][0.07]
2010−0.2403 **0.0073 *0.1214 *
[0.04][0.08][0.07]
2011−0.2521 **0.0055 *0.1241 **
[0.03][0.06][0.04]
2012−0.2460 **0.0097 *0.1230 *
[0.04][0.07][0.06]
2013−0.2594 **0.0058 *0.1175 *
[0.02][0.09][0.06]
2014−0.2634 **0.0108 *0.1214 *
[0.03][0.07][0.08]
2015−0.2710 **0.0155 *0.1173 **
[0.02][0.09][0.03]
2016−0.2799 **0.0174 *0.1184 *
[0.02][0.09][0.07]
Note: p values in parentheses [ ]; *, **, and *** represent significant levels at 10%, 5%, and 1%, respectively.
Table 2. The results of LR, Wald, and Hausman test.
MethodsYangtze River DeltaPearl River DeltaBeijing–Tianjin–Hebei
LR TestSpatial lag55.1570 ***69.8294 ***15.6949 **
[0][0][0.02]
Spatial error61.2812 ***67.7412 ***14.4657 **
[0][0][0.02]
Wald TestSpatial lag58.3724 ***104.3313 ***14.3901 **
[0][0][0.02]
Spatial error65.8891 ***87.8122 ***13.0892 **
[0][0][0.04]
Hausman Test−102.3438 ***40.4775 ***186.1655 ***
[0][0][0]
Note: p values in parentheses [ ]; *, **, and *** represent significant levels at 10%, 5%, and 1%, respectively.
Table 3. The results of absolute β convergence.
VariablesCommon Panel ModelSpatial Durbin Panel Model
Yangtze River DeltaPearl River DeltaBeijing–Tianjin–HebeiYangtze River DeltaPearl River DeltaBeijing–Tianjin–Hebei
l n y i , t 1 −0.102 ***−0.401 ***−0.047 **−0.193 ***−0.399 ***−0.147 ***
[0][0][0.02][0][0][0]
W l n y i , t 1 −0.150 *0.630 **0.214 **
[0.09][0.03][0.04]
W l n y i , t y i , t 1 0.292 ***−0.793 ***−0.018
[0][0][0.85]
Obs.192108156192108156
R20.2890.35320.22980.58940.42230.3917
Note: p values in parentheses [ ]; *, **, and *** represent significant levels at 10%, 5%, and 1%, respectively.
Table 4. Estimation results of the impact of population mobility on urbanization convergence.
VariablesYangtze River DeltaPearl River DeltaBeijing–Tianjin–Hebei
Model 2Model 3Model 2Model 3Model 2Model 3
lnyi,t−1−0.354 ***−0.375 ***−0.635 ***−0.673 ***−0.189 ***−0.292 ***
[0][0][0][0][0][0]
lngdp0.0090.0060.0280.0060.018 ***0.018 **
[0.47][0.62][0.64][0.91][0][0.01]
lnind0.3020.346 *1.399 ***1.373 ***−0.030−0.017
[0.12][0.07][0][0][0.13][0.19]
lnincome0.0350.078−0.170 ***−0.156 ***0.0160.006
[0.56][0.19][0][0][0.47][0.46]
lnroad−0.0001 **−0.0001 ***−0.013−0.0140.0070.012
[0.02][0][0.42][0.33][0.58][0.38]
People−0.0009 **−0.0002 **−0.0001 **
[0.04][0.04][0.01]
Wlnyi,t−1−0.328 ***−0.352 ***−0.606 **−0.837 ***0.1540.167
[0][0][0.03][0][0.16][0.23]
Wlngdp0.077 ***0.071 ***0.0390.030.010.011
[0][0][0.87][0.88][0.42][0.37]
Wlnind−0.031−0.0208.406 ***9.110 ***−0.065 **−0.046 **
[0.93][0.95][0][0][0.02][0.03]
Wlnincome0.305 ***0.344 ***−0.520 ***−0.490 ***0.034 **0.035 *
[0][0][0][0][0.04][0.06]
Wlnroad0.0003 ***0.0002 ***−0.0040.015–0.027−0.024
[0][0][0.94][0.74][0.25][0.34]
Wpeople−0.003 ***−0.00020.0001
[0][0.82][0.86]
W l n y i , t y i , t 1 0.006−0.051−0.740 ***−0.990 ***−0.246 **−0.285 ***
[0.94][0.56][0][0][0.02][0]
Obs.192192108108156156
R20.70140.71990.75160.7910.53580.564
Note: p values in parentheses [ ]; *, **, and *** represent significant levels at 10%, 5%, and 1%, respectively.

