Urban Housing Density and Infrastructure Costs


Faculty of Built Environment, Tampere University, Korkeakoulunkatu 5, FI-33720 Tampere, Finland
*
Author to whom correspondence should be addressed.
Sustainability 2020, 12(2), 497; https://0-doi-org.brum.beds.ac.uk/10.3390/su12020497
Submission received: 2 December 2019
/
Revised: 31 December 2019
/
Accepted: 6 January 2020
/
Published: 8 January 2020
(This article belongs to the Collection Sustainable Built Environment)
Abstract
:Urbanisation is one of the most significant global megatrends and, as a result, major cities are facing multiple challenges. In this study, we contribute to the sustainable urban development debate and examine the relation between housing density and infrastructure costs. The analysis is based on four hypothetical design prototypes and a consistent cost calculation framework. Based on the results, infrastructure costs per capita are the highest in low-density areas and the lowest in high-density areas, if parking is excluded. However, if also construction costs of parking structures are included, the costs per capita are the highest in high-density areas. Considering the notably high cost impact of parking structures and people’s limited willingness to pay for parking, municipally zoned parking requirements in urban areas are likely to result in non-optimal land use. Furthermore, construction in poor soil conditions may only be considered feasible if the floor area ratio and residential densities are relatively high. Beyond the cost benefits, the number of residents that may be accommodated is crucial and higher density in central urban locations should be promoted. We also suggest the cost of urban greenness to be reasonable relative to its many reported benefits and conclude that denser urban structure should not be pursued at the expense of green spaces.
1. Introduction
Urbanisation is one of the most significant global megatrends and, as a result, rapidly growing cities are simultaneously facing not only great opportunities but also new kinds of challenges. Generally, economies of agglomeration are associated with positive production gains [1]. Such positive gains are also beneficial to urban residents as, for example, a large job market in urban locations provides better opportunities for employment. Together with other agglomeration benefits, such as better access to specialized services and public facilities, they attract more and more people to relocate to rapidly growing urban areas. However, the impacts of agglomeration are not only positive but, in addition to notable benefits, also significant diseconomies of agglomeration (i.e., dispersion forces) are observed in growing urban areas [2]. A good example of such diseconomies are increasing land and housing prices that decrease the opportunities of low-income households to reside in central locations.
Interestingly, the recent declaration of New Urban Agenda [3] raises adequate and affordable housing for all as one of the most central objectives of urban policies. Even if housing is universally recognized one of the most fundamental human needs, all major cities are struggling with the problem of increasing housing prices and, as a result, the lack of affordable housing. The underlying mechanism behind increasing housing prices is suggested to be that, in rapidly growing areas, housing demand is increasing faster than supply, which tends to drive up housing prices [4]. For example, in the Finnish capital region that provides the contextual environment for this study, the increasing demand of housing and rising housing prices have boosted the trend towards smaller housing units, which has provoked a heated debate on whether such approach serves long-term development needs. As recent forecasts suggest that urbanisation trend will continue both globally [5] and locally in Finland [6], a well-grounded strategy to steer urban land use towards sustainable direction is needed.
An extensive body of previous literature focuses on environmental impacts of urbanisation. The leading idea is often that climate change calls for more effective land use and improved service networks in an attempt to reduce GHG emissions from transport and housing. Many studies support this view, discussing the opportunities that density offers for more efficient energy use and lower GHG emissions [7,8,9]. However, at the same time, researchers have also recognized that due to people’s lifestyles and behaviour it is not self-evident that denser urban structure results in reduced greenhouse gas emissions [10,11]. Although many studies focus on the environmental sustainability, it is crucial to understand that there are also other aspects of sustainability and, in particular, that sustainable development is only achievable if the economic boundaries of urban development are properly understood.
The importance of economic perspective has also been recognized in previous studies and there is an extensive body of literature that has explored urbanisation related phenomena from the economic point of view. For example, the impact of smart growth [12], urban sprawl [13], and population density [14] on public finance and expenditures has been studied, supporting the view that more compact urban structure is more desirable. Similarly, Vihola and Kurvinen [15] find that, from the perspective of municipal economics, densifying urban structure to be more profitable than constructing new greenfield areas. Despite the manifold previous literature on the economic impacts of urban development, there are no systematic calculation-based studies exploring the impacts of housing density on infrastructure costs. Leaning on Finnish urban planning framework, this study addresses this gap in the knowledge and contributes to better understanding of economic feasibility of different land use options by analysing their sensitivity to floor area ratio, residential density, requirements for parking and soil conditions. As a result, strategical suggestions towards sustainable urban land use are provided.
2. Research Approach
This study seeks to contribute to better understanding of economic feasibility of different land use alternatives. Specifically, sensitivity to floor area ratio, residential density, requirements for parking and soil conditions are in the central focus. Urban development projects usually have individual characteristics, which makes them highly case sensitive. Also, estimates for agglomeration benefits have been reported to be dependent on their empirical context [1]. With this in mind, a case study approach was adopted as the most suitable research strategy to examine the impact of housing density on infrastructure costs and sensitivity of costs to various factors of interest. However, the complexity of real-world cases makes controlling for all the various characteristics and related path-dependencies very difficult if not impossible. Thus, to allow a reliable examination of the variables of interest, the research design was carefully constructed using hypothetical design prototypes as case studies. Such approach allows better comparability between different cases as all the changing factors between the cases may be controlled, which is not possible when dealing with real-world cases. Next, a description of the Finnish land use planning framework, the principles of infrastructure provision, the applied design principles and the hypothetical design prototypes will follow.
2.1. Finnish Land Use Planning Framework
The actual regulations of Finnish land use planning are defined in Land Use and Building Act that was last reformed in 2000. The reformed planning law put emphasis on participatory and interaction aspects, for example, by requiring land use planners to draw up an individual participation and assessment scheme for each planning process [16]. Based on the Finnish planning law, the statutory land use planning system comprises three different levels of land use plans, including (i) regional land use plans, (ii) local master plans and (iii) local detailed plans. The most detailed-level plan is always considered legally binding but, when drawing up more detailed level plans, the city planners still have to make sure that they are in line with the more general level plans [17]. Another distinctive feature of the Finnish urban planning system is that the municipalities have a monopoly over land use planning within their jurisdiction.
Due to the legal implications of statutory land use planning, the planning process is often considered too inflexible and time-consuming to fit the needs for strategic land use planning. As a result, improved strategic quality of urban planning has been sought from different kinds of informal strategic plans that are prepared outside the statutory planning system, including land-use development schemes, regional visions and structural plans, and thematic master plans [18]. Moreover, particular agreements on land use, housing and transport (MAL) have been concluded in an attempt to not only achieve better strategical collaboration between municipalities in major urban regions but also to enhance collaboration between the state and municipalities to achieve the state objectives for land use [19].
Even though informal strategic plans provide improved flexibility for land use development they have been criticized for the lack of legal guarantee for openness, fairness and accountability; thus, generating a legitimacy problem as informally generated strategic objectives are transferred to the subsequent statutory planning process [18]. Consequently, addressing this issue of smoothly interlinking informal strategic urban plans with statutory land-use planning is one of the challenges of the ongoing preparation of a new comprehensive reform of the Finnish Land Use and Building Act.
2.2. Provision of Infrastructure
Based on the Finnish planning law, municipalities are responsible for the provision of public infrastructure that is necessary for the development of areas with local detailed plans [20]. Such public infrastructure includes street areas, green spaces, public spaces and usually also water supply and sewerage. However, the municipalities are not responsible for the provision of other utility service networks such as power distribution and communications network and district heating network. Instead, these networks are provided by municipal utility companies and funded by network connection fees and user charges. Differing from the funding of other public infrastructure that the municipalities are obliged to provide, the charge based funding approach also applies to water supply and sewerage.
The funding of infrastructure costs also depends on who owns the land that is under detailed planning. In the case of public land development, which is widely used in Finland, the municipality first acquires undeveloped land, then services the land with the needed public infrastructure and finally sells subdivided developable building plots to private developers [21]. If the market prices for plots are high enough, such approach provides the municipality with an effective way to cover the land development costs. On the other hand, in the case when the planned land is privately owned, the Land Use and Building Act legislates for landowners’ responsibility to contribute to the costs of public infrastructure if they gain substantial benefit from the new plan [16]. The primary policy is that the municipality and the landowner conclude a land use agreement on the mutual rights and obligations. However, if the land use agreement is not reached, the municipality has a legal right to collect development compensation from the landowner. The development compensation is based on the value increase that the new detailed plan induces for the landowner and the maximum amount of the compensation may not exceed 60 per cent of the value increase. Importantly, the law only sets the upper limit for development compensations and the local authorities may apply lower compensations, which is often the case. Particularly, major cities usually apply lower compensation rates and define higher limits for the so called substantial benefit. For example, the City of Helsinki charges development compensation fees of 50 per cent only for the value that exceeds the amount of 700,000 euros. Municipalities may also provide special reductions in order to promote infill projects which is well-grounded as infill usually causes less infrastructure costs. In the case of Helsinki, this means that in alterations of detailed plans the development compensation rate is 35 per cent of the value increase that exceeds 1 million euros.
It is also important to notice that, differing from the other pieces of infrastructure in this study, the non-public parking spaces are built at the developer’s expense even though the number of parking spaces is regulated by the statutory land use planning. As the construction cost of structured parking is relatively high, the developers tend to allocate a proportion of the construction costs for parking to housing prices. Such approach results in a situation where those who do not have a car are in effect subsidizing the financing of parking structures.
2.3. General Design Principles
Four hypothetical design prototypes with different area densities were constructed to form a basis for the analysis. A prerequisite for each design prototype was that even if they are hypothetical they should be realistic and feasible in real world, meaning that they are designed to fulfil the requirements of the Finnish land use planning regulations and aim to contribute to development of high-quality urban environment. Another important guideline for the design process was that each design prototype should be fitted in a 200 m × 200 m grid cell (total area of 4 hectares) in a way that allows putting together a desired number of such identical puzzle pieces; thus, flexibly building residential areas of various sizes. Using such hypothetical design prototypes as a basis for the analysis, instead of selecting case areas for the study from among existing residential neighbourhoods, allows more stable experimental setting for comparing different design solutions. Being able to control which factors differ between the cases is in the key role in our attempt to understand the impact of different infrastructure related variables on the cost efficiency. Those factors include street areas, power distribution and communications network, district heating network, and water supply and sewerage. The street areas and networks are dimensioned based on valid instructions and guidelines, such as [22,23,24]. Furthermore, costs of parking and supplementary green spaces are taken into account. A more detailed discussion on their dimensioning will follow below.
2.4. Regulation and Realisation of Parking
Conventionally, Finnish municipalities have regulated the minimum number of required parking spaces through zoning regulations. The required number of parking spaces in a city block is usually linked to the centrality of location, accessibility of public transport and the magnitude of built floor area (e.g., [25]). In dense urban areas, this usually results in underground parking garages, which notably increase infrastructure costs. Thus, non-market-driven requirements and the high construction costs of underground parking have resulted in a common practice where parking spaces are subsidized by allocating a certain proportion of the parking costs to housing. Such approach is detrimental, resulting in a deadweight loss as housing prices increase even for those who do not have any use for the parking spaces. Furthermore, Soininvaara [26] has stated that parking requirements may, particularly in central areas where a big proportion of people do not have a car, result in lower floor area ratio than would be optimal. This has happened, for example, in the district of Jätkäsaari in the City of Helsinki where economics of zoning would not have been feasible anymore if more apartments and, as a result, a higher number of even more expensive parking spaces were required.
According to literature review in [27], as part of an ongoing policy shift, many European cities are lowering the parking requirement in order to influence the levels of vehicle ownership and car use. This trend has also been visible in Finland where the tendency has recently been from regulatory parking towards a more market-driven approach and, for example, the City of Helsinki has set a market-driven parking system as a central goal in its latest city strategy [28]. Justification for a market-driven parking system, instead of the current regulatory practice, has been discussed, for example, in [29]. A central perspective the proponents use in the justification of market-driven approach is that parking may not be considered as a subjective right like, for example, health care and day care. In other words, if parking is seen as a regular commodity, parking investments should be made only when they are financially feasible. For example, in the Helsinki Metropolitan Area where the public transport is covered by an extensive bus, tram, underground and local train network it is not self-evident that all people really need or are willing to pay for parking spaces. Despite the potentially decreased willingness to pay for parking, there have still been concerns that parking restraints would make central areas less attractive and, thus, discourage economic development. According to Marsden [30], however, research does not provide any support for such assumptions.
In this research, we study the impact of parking space regulations on infrastructure costs of housing areas by adopting a regular contemporary parking requirement for central locations of one parking space per 120 square m as the starting point. The sensitivity to changes is examined by comparing cases where the proportion of shared cars varies between 0 and 80 percent, assuming that one shared car accounts for five private cars. To get some perspective for interpreting the results, it is good to notice that 20 percent proportion of shared cars is equivalent to a situation where the minimum requirement for parking is one parking space per 143 square m. While 80 percent proportion of shared cars is equivalent to a situation where the minimum requirement for parking is one parking space per 338 square m.
In terms of parking, construction costs may not be enough to perceive the overall economic impact but opportunity costs (e.g., [31]) are yet another important perspective that should be taken into account when making decisions. Due to opportunity costs, for example, above ground parking is not always as affordable as the simplest calculations only based on construction costs may suggest. Such situations occur when scarcity of land restricts options and demands choices. In other words, if we choose to build above ground parking, our choice excludes other potential land use options, such as building another block of flats instead. Now, if we make the decision only based on construction costs of parking spaces, we neglect the opportunity costs of other potential land use options. Such opportunity costs may be, for example, the value of positive cash flow from another block of flats. Thus, by taking also opportunity costs into account, we may end up concluding that underground parking option is a better choice after all. However, in numerical terms, this research is restricted to studying only infrastructure costs, yet the impact of opportunity costs is discussed.
2.5. Importance of Green Spaces
Denser urban structure is universally adopted as one of the major goals for urban development but the importance of sufficient urban green spaces as an essential part of such denser structure is also widely recognized and discussed. Access and exposure to urban greenness is associated with many positive health effects, including but not restricted to positive birth outcomes [32,33], developmental effects [34], depression and mental health [35], reduced mortality [36], and physical activity [37]. Moreover, some studies [38,39] have even attempted to quantify the importance of green spaces in financial terms, suggesting notable financial benefits. Although such estimates are hardly precise, they provide yet another perspective that further confirms the importance of green spaces. In summary, the above-mentioned pieces of research suggest that the importance of green infrastructure for quality of urban areas and human well-being should be taken seriously and potential risks from not investing in green infrastructure should be considered real; thus, the green spaces are an essential component of infrastructure costs to be taken under scrutiny in this study.
The Finnish legal framework does not provide any unambiguous guidelines for the sufficient amount of green spaces in urban areas; thus, regulatory frameworks in other countries were explored to estimate a sufficient reference amount for green spaces. In particular, the focus was on regulations in locations that are generally perceived to be attractive. For example, the minimum requirement for urban green spaces in Italy varies between 9–16 square m of green space per resident [40]. In the administrative region of Emilia-Romagna, which is known of its attractive urban regions, such as Bologna, the requirement for green spaces is 16 square m per resident. To get perspective on the impact of construction costs of green spaces on infrastructure costs of residential areas, 16 square m of green space per resident was adopted as a reference amount for green spaces also in the design prototypes of this study. In the denser areas, this means that supplementary green spaces should be easily accessible within a decent proximity in order to fulfil this requirement. Consequently, resulting in additional green infrastructure costs in such areas. While, in the less dense areas, natural green spaces and yard areas will fulfil the reference value without any supplementary investments in green spaces.
Considering green spaces from the perspective of developers is somewhat problematic as business economic approach often considers investing in such areas a marginal (additional) cost that does not directly induce positive cash flow. At the same time, studying investments in green spaces from a wider economic perspective (e.g., from a point of view of a municipality), based on the literature review, reveals notable economic benefits. Hence, from a wider perspective when also considering different well-being factors and their cost saving effects, opportunity cost of not investing in sufficient amount of green spaces is likely to be much higher than the total cost of a sufficient investment in green spaces and the opportunity costs in relation to such investment. As greenness is associated with more attractive neighbourhoods, investing in greenness should create prerequisites for a positive circle of development. However, as was the case with parking, numerical analyses in this study are restricted to construction costs, although also the impact of opportunity costs is discussed.
2.6. Description of Design Prototypes
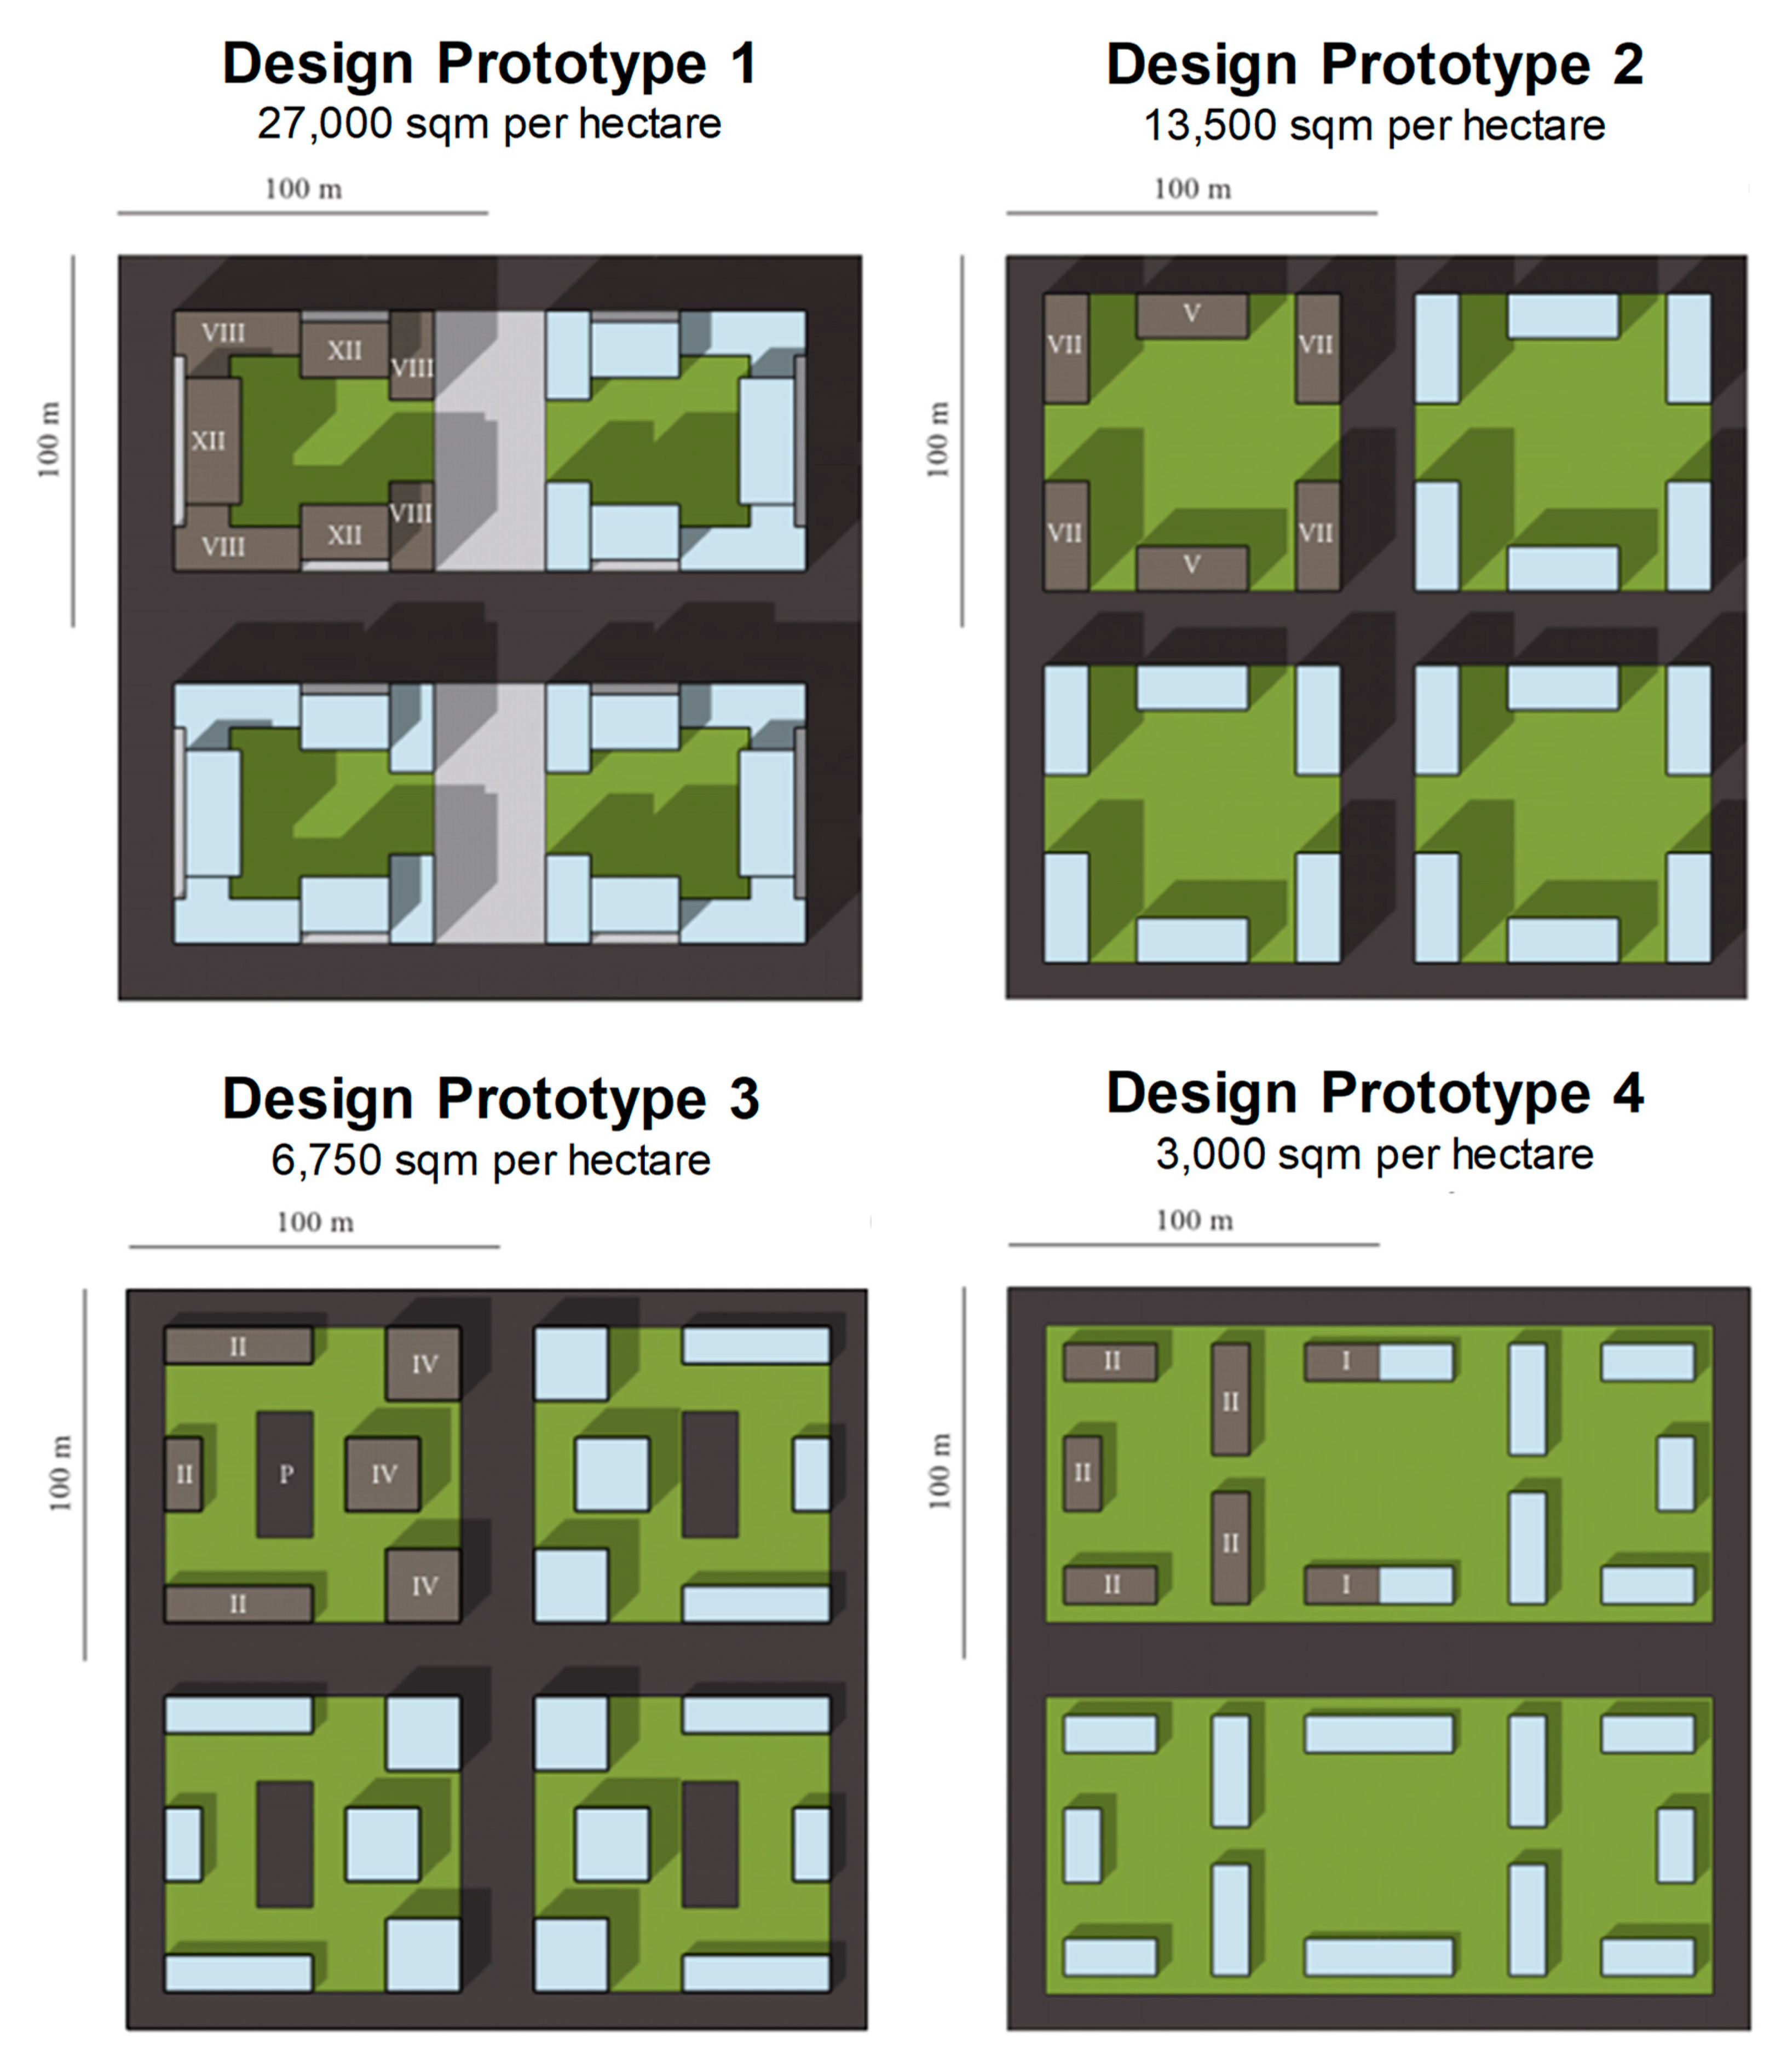
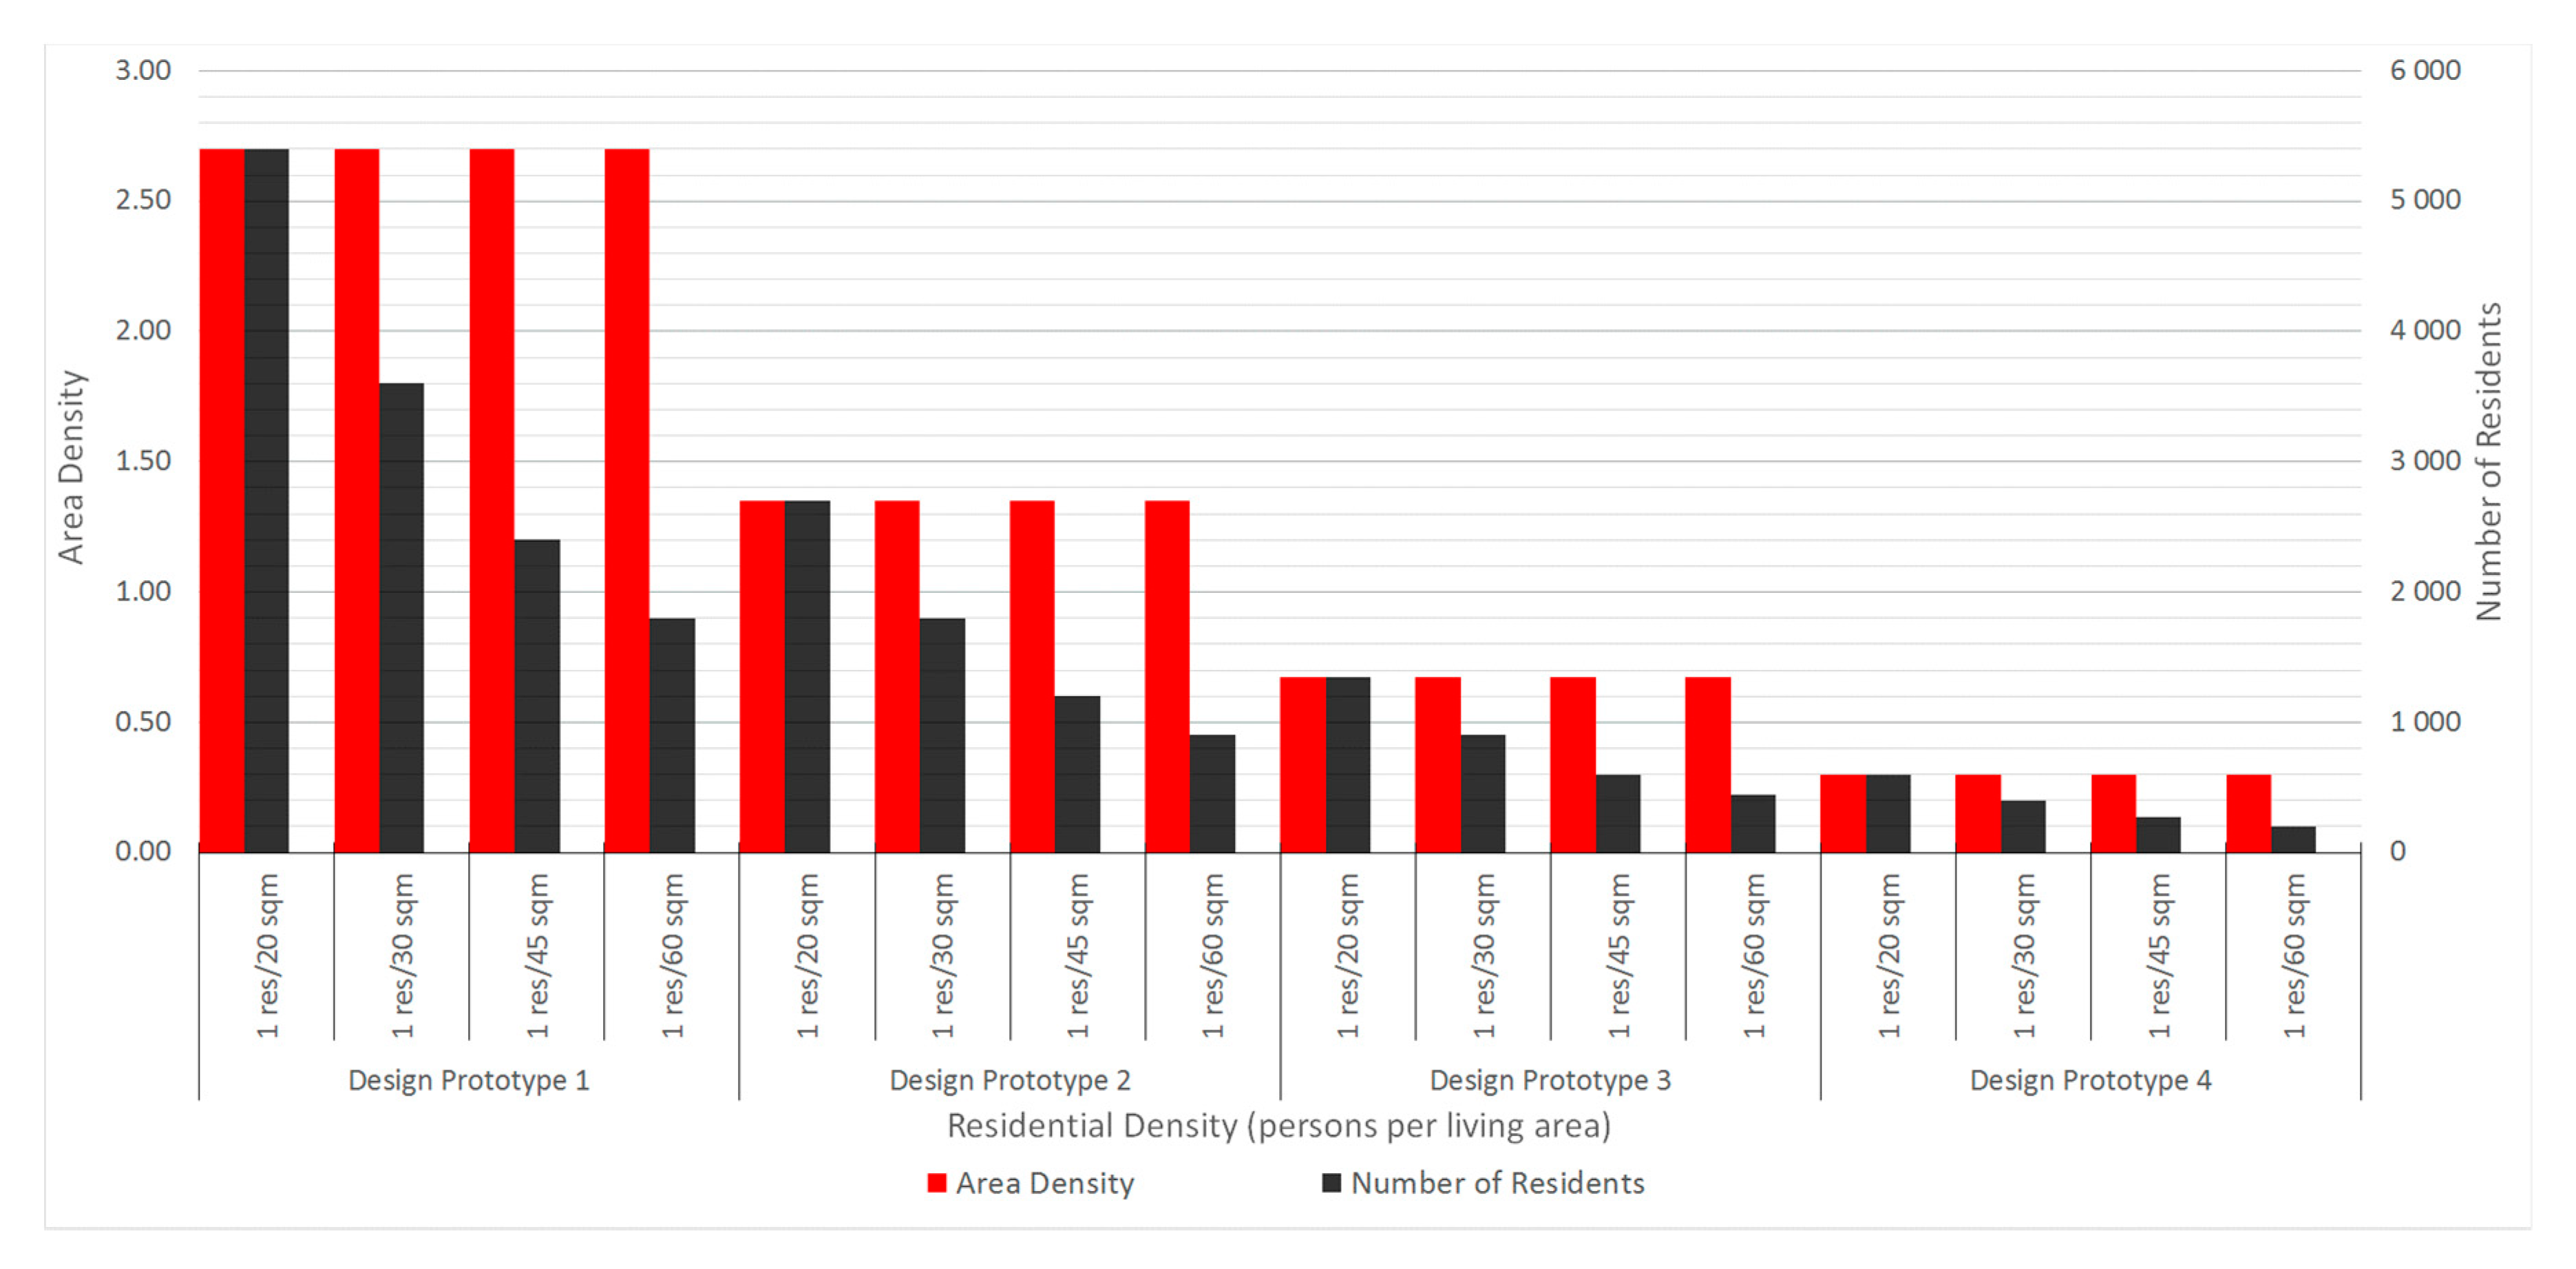
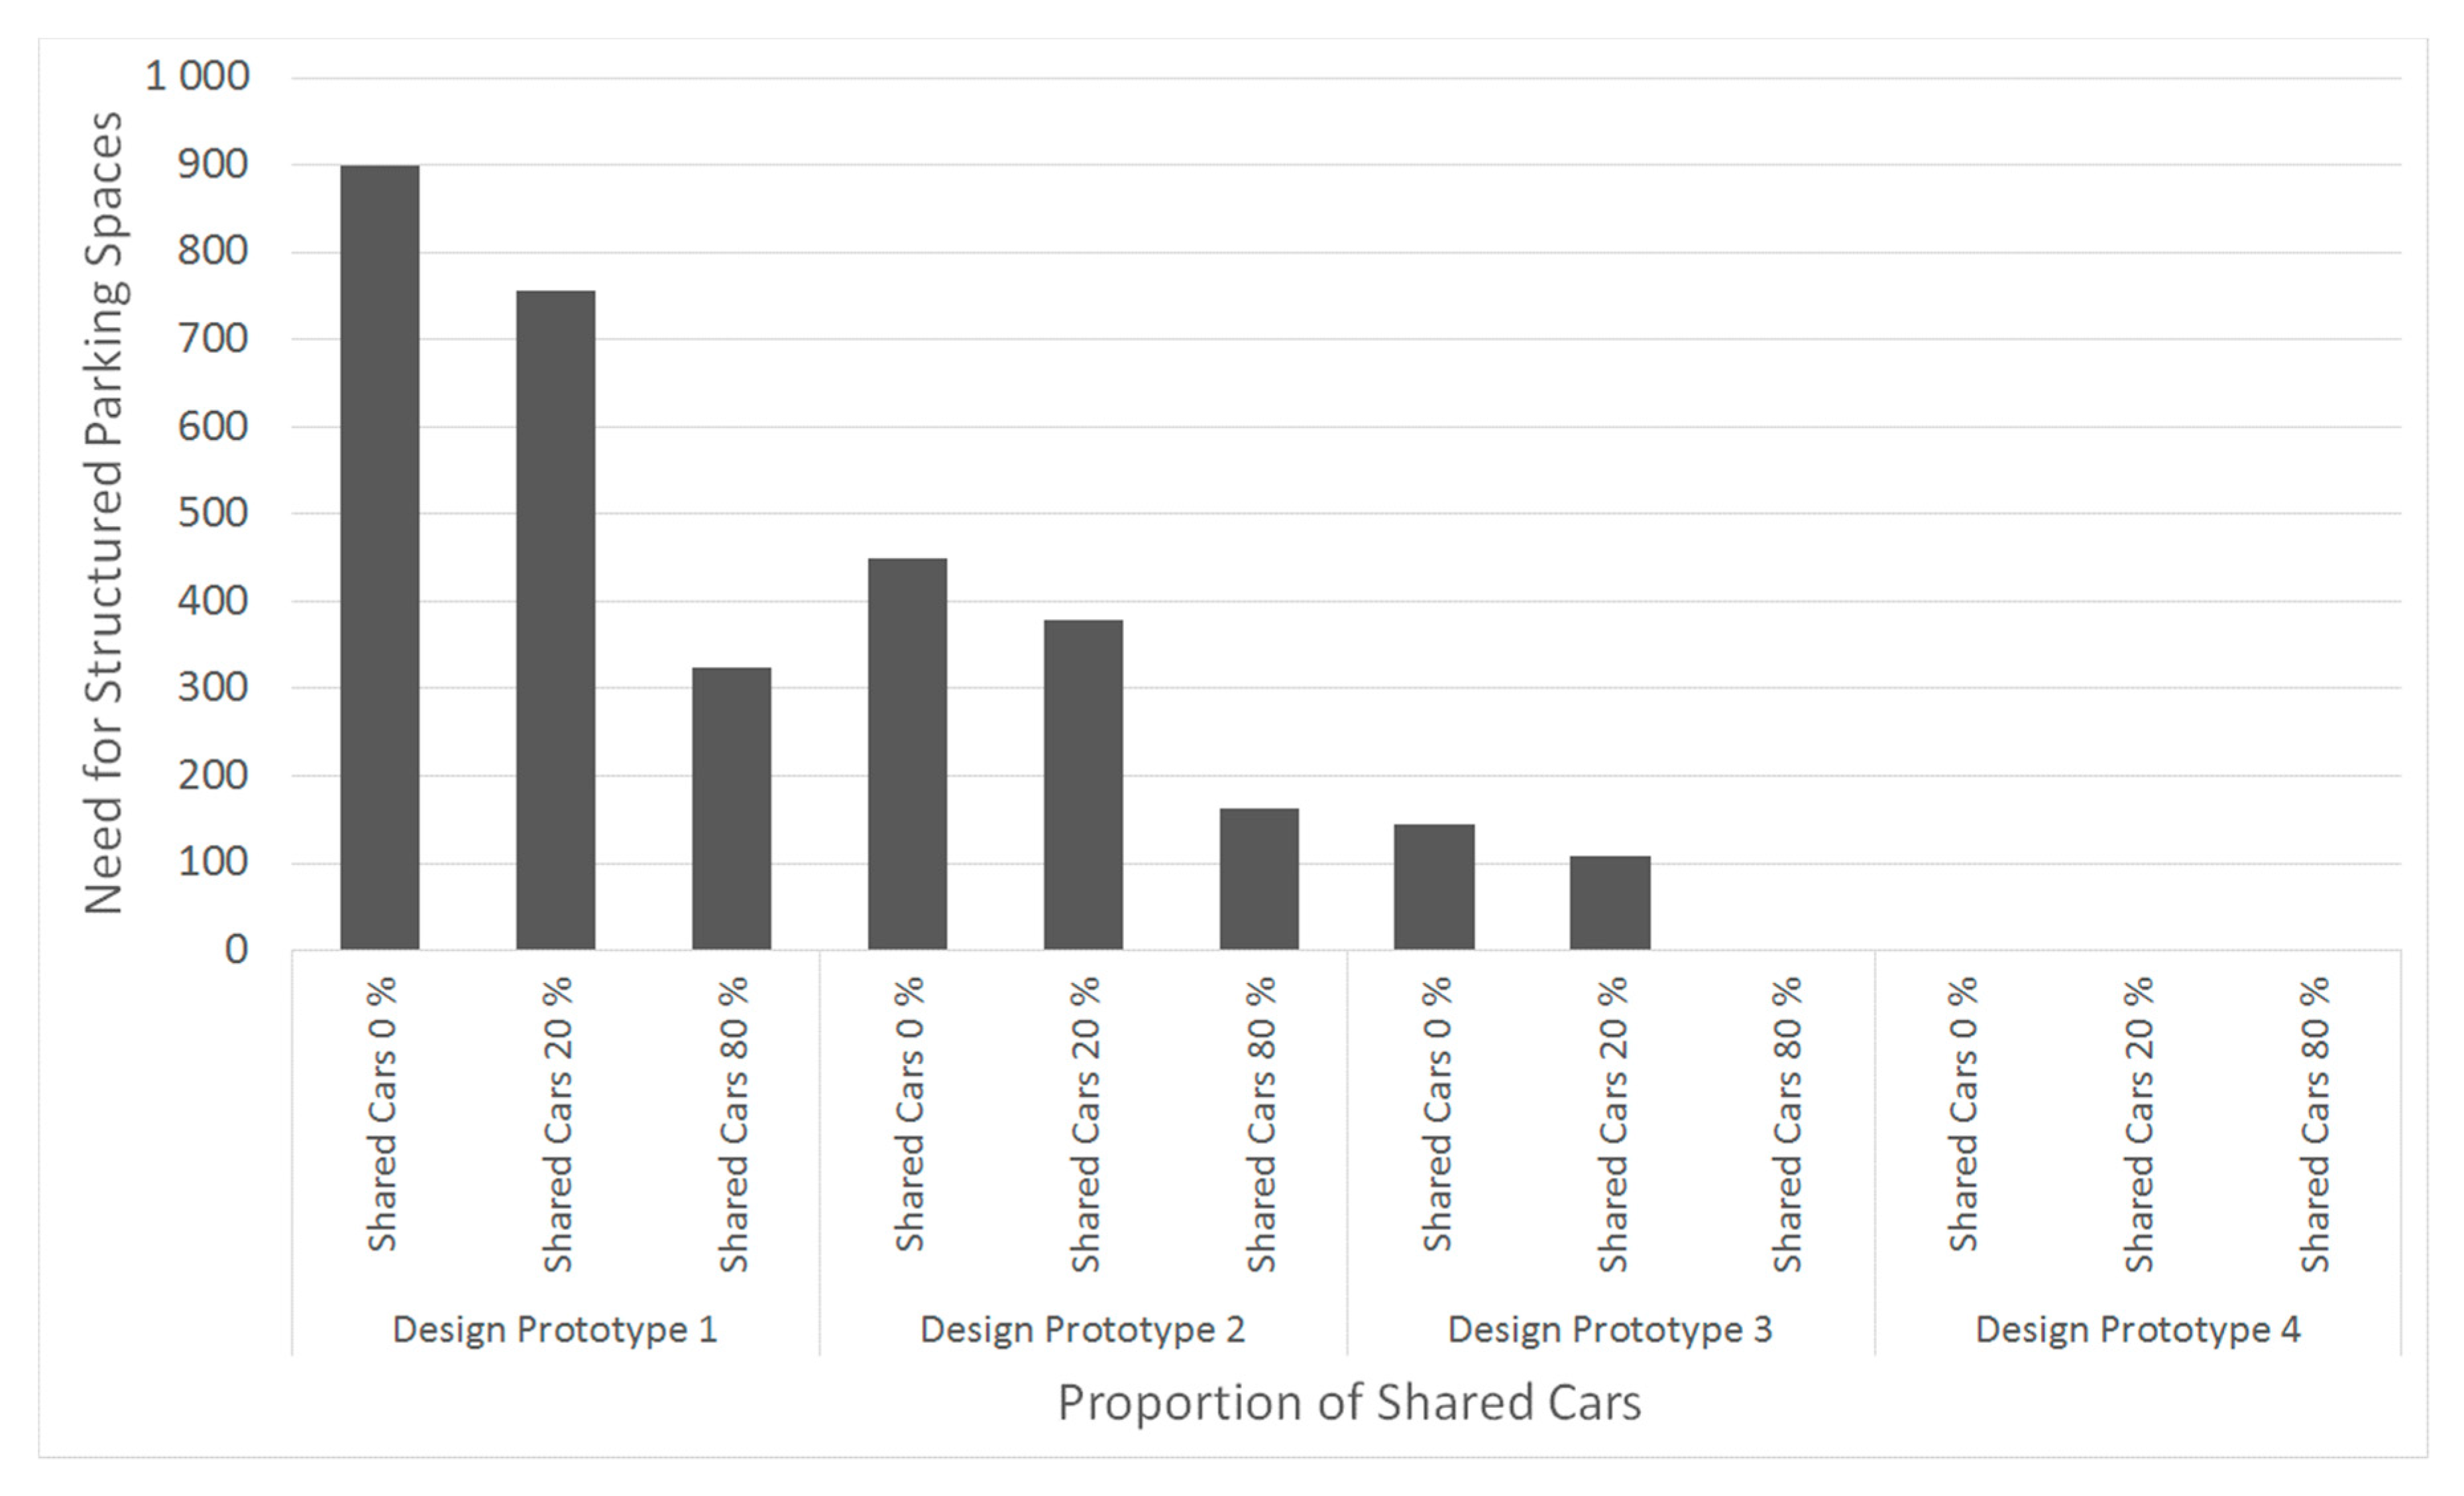
In the previous chapters, design principles for the case areas were explained while this chapter focuses on describing the main characteristics of the designed areas. Figure 1, Figure 2 and Figure 3 provide with a general description on each design prototype. First, the design prototypes are illustrated in Figure 1. Second, Figure 2 depicts area density (measured by floor area ratio) and potential number of residents in the cases of different residential densities in each design prototype. Finally, Figure 3 designates the need for structured parking when a municipal requirement of one parking space per 120 square m is applied and proportion of shared cars varies between 0 and 80 percent. Next, a short description of each design prototype will follow.
Design Prototype 1 is the densest, with an area density of 2.7, equalling 27,000 square m per hectare and 108,000 square m per the entire designed area of four hectares. Housing is placed in four identical city blocks of the size of 70 m × 70 m. Each city block is comprised of mid-rise perimeter buildings of varying heights of from 8 to 12 floors. Due to the high area density, all required parking spaces are accommodated in underground parking garages to be located under each city block. If the requirement for parking spaces is set to a modern urban level of one parking space per 120 square m and the proportion of shared cars varies between 0% to 80% (it assumed that one shared car accounts for five private cars), the need for structured parking varies between 324 and 900 parking spaces. Design Prototype 1 can accommodate from 1800 up to 5400 residents as the residential density varies between one resident per 60 square m and one resident per 20 square m.
Design Prototype 2 is the second densest with the area density of 1.35, equalling 13,500 square m per hectare and 54,000 square m per the entire designed area of four hectares. Housing is placed in four identical city blocks of the size of 80 m × 80 m. Each city block is comprised of separate slab blocks of varying heights of from 5 to 7 floors. Due to the relatively high area density, all required parking spaces are accommodated in underground parking garages to be located under each city block. The required number of structured parking spaces is varying between 164 and 452 as the proportion of shared cars changes as described above. As residential density is varying as described above, Design Prototype 2 can accommodate from 900 to 2700 residents.
Design Prototype 3 is notably less dense with the area density of 0.675, equalling 6750 square m per hectare and 27,000 square m per the entire designed area of four hectares. Housing is placed in four identical city blocks of the size of 80 m × 80 m. Each city block is comprised of three separate four-floor-high point blocks and three townhouse-like housing blocks that are two-floor-high. In this design prototype, 80 parking spaces may be accommodated above ground in the centre of each city block. While the required number of structured underground parking spaces is varying between 0 and 145 as the proportion of shared cars varies between 0 and 80 percent. As residential density is varying as described above, Design Prototype 3 can accommodate from 448 to 1344 residents.
Design Prototype 4 is notably less dense with the area density of 0.3, equalling 3000 square m per hectare and 12,000 square m per the entire designed area of four hectares. In this area, housing is placed in two identical city blocks of the size of 160 m × 80 m. Each city block is comprised of one-storey or two-storey townhouses. Due to the lower area density, all required parking spaces are accommodated above ground on the streets and driveways. Depending on the proportion of shared cars, the number of required parking spaces varies between 36 and 100. As residential density is varying as described above, Design Prototype 4 can accommodate from 200 to 600 residents.
3. Calculation Procedure
In this research, costs of infrastructure for housing are in the central focus, including street areas, power distribution and communications network, district heating network, and water supply and sewerage. Furthermore, costs of parking and supplementary green spaces are taken into account as described in the Section 2. The calculation procedure and its underlying assumptions are described in Section 3.
3.1. Calculating Costs of Infrastructure
The first step in calculating infrastructure costs for the design prototypes was to determine the quantities of different components of infrastructure. In order to do this, dimensions for different networks were defined based on valid instructions and guidelines (e.g., [22,23,24]). Next, the unit prices for each component of cost were collected from the construction cost database of the Fore infrastructure management system, which was developed and is maintained by a company named Rapal Oy. Providing access to up-to-date price information based on a wide range of real infrastructure projects, unit prices from the Fore construction cost database should allow calculating a realistic target budget for various infrastructure investments. In the interest of transparency, Fore infrastructure management system was only used to collect the unit prices while the analyses themselves were computed in Excel spreadsheets. In doing so, the researchers could maintain a full control on the analysis, which would not have been possible if a non-transparent commercial calculation approach was used.
As unit prices and quantities for each component are determined, total costs may be calculated by simply multiplying them with each other. However, comparing design prototypes with different densities based on total costs does not make sense but a more comparable cost measure is needed for the comparisons. One option would be to compare costs per floor area but such approach would totally escape the impact of residential density and is, thus, not applicable in this context. As residents are the main variable of interest when studying housing, costs per capita were considered the most suitable functional unit for the comparison purposes as it not only accounts for floor area ratio but also for residential density.
3.2. Analysing Sensitivity to Factors of Interest
The central focus of this study is to better understand which are the most important factors affecting the cost efficiency of infrastructure. In order to add on the knowledge, sensitivity to following factors were included in the analysis: Floor area ratio, residential density, ground conditions, number of parking spaces and supplementary green spaces. Each of these components is further described below.
3.2.1. Floor Area Ratio and Residential Density
As urbanisation is strongly ongoing trend, in not only Finland [6], but also globally [5], cities and municipalities are highly interested in increasing the effectiveness of land use to accommodate as many new residents as possible. This makes floor area ratio and residential density, which both depict intensity of land use, some of the most interesting variables in this analysis.
Floor area ratio describes the total floor area of buildings in relation to the size of land area where the buildings are built while residential density depicts how many square m there are per one resident. Floor area ratio varies between design prototypes so that density is the highest (2.7) in Design Prototype 1 and the lowest (0.3) in Design Prototype 4. Whereas all four residential densities are tested in each design prototype, including 1 person per 20 square m, 1 person per 30 square m, 1 person per 45 square m, and 1 person per 60 square m. To put the numbers into a perspective, an average residential density in the City of Helsinki in 2017 was 1 person per 41 square m while, in the less dense regions, the average residential density was some 1 person per 46 square m (Official Statistics of Finland, 2019). While floor area ratio of 2.7 is equivalent to a high-density urban areas and 0.3 equals to a housing area with a relatively low density.
When calculating construction costs, changes in floor area ratio have a greater impact in the calculation procedure as floor area ratio affects the structure of entire area, meaning that each design prototype requires an individual dimensioning for utilities. While changes in residential density mainly affect the number of residents that may be accommodated in the area and have, thus, a more straightforward impact on the costs per capita.
3.2.2. Ground Conditions
Ground conditions have a notable impact on infrastructure costs, meaning that construction costs vary a great deal depending on where new housing is built; thus, studying cost sensitivity to ground conditions is of high importance. Based on Koskinen [41], in the Finnish capital, the City of Helsinki, the most common types of land available for development are non-cohesive soil with high bearing capacity and soft clay soil: Around one third of entire land area in Helsinki being soft clay. Lately, also urban fill areas, which are typically now vacant former harbour areas, have been under development. Furthermore, also rocky lands and peatlands are currently exploited in Helsinki. As the design prototypes of this study stem from Finnish planning regulations, current soil conditions for undeveloped land in Helsinki are adopted as the basis for ground condition sensitivity analysis.
In Helsinki, due to the ground conditions of currently available land, more affordable subgrade reinforcement methods, such as vertical drainage and preloading embankments, are usually not enough to secure subgrade stability for utilities and buildings. In particular, soft clay and fill areas often require use of more expensive methods, such as piled slabs, to allow stable subgrade for utility networks. Piled slabs are widely used despite their high construction costs as they are perceived as the only option when the height of embankment is more than five m and soil stabilization is no more possible [41].
To reveal the impact of ground conditions on infrastructure costs, six different ground condition scenarios were calculated for each of the design prototypes. In order to do this, unit prices for different subgrade reinforcement strategies were acquired from the construction cost database of Fore infrastructure management system. For conciseness, only the results for two most common conditions are reported in this paper, including non-cohesive soil with high bearing capacity and soft clay soil. However, due to their notable cost differences, these two selected scenarios are highly illustrative in depicting the great cost impact of ground conditions.
3.2.3. Shared Cars and Parking
Denser urban structure is perceived to dampen the need for parking and, recently, the trend in urban areas has been towards a decreased number of parking spaces. As there are divergent views, parking has, however, become a substantial component of policy debate, making it an important part of the sensitivity analysis in this study. As design prototypes follow the Finnish urban planning practice, the basis for parking sensitivity analysis as well is adopted from the guidelines of the City of Helsinki. At present, parking space requirements for blocks of flats in Helsinki vary between one parking space per 100 square m and one parking space per 150 square m [25]. For example, the minimum number of parking spaces, in suburban areas that are located in close vicinity to a metro or train station, is one parking space per 120 square m, which was adopted as the starting point for this study. Also, the guideline for shared cars is in line with our assumption of that one shared car accounts for five private parking spaces. However, the City Planning Department of Helsinki restricts the right of deduction so that at maximum only 10 percent of the required number of parking spaces may be reduced while, in this study, we have a wider perspective, testing the cost effect of proportions of shared cars from 0 up to 80 percent.
The cost effect of parking spaces is analysed individually for each design prototype. As the requirement is defined based on floor area, the number of residents accommodated in the area does not affect the number of parking spaces but the number of parking spaces varies between design prototypes due the different floor area ratios. In each design prototype, the following proportions of shared cars are tested: 0%, 20% and 80%. Even if the idea is to test the impact of different proportions of shared cars it is good to notice that, at the same time, 20 percent proportion of shared cars is equivalent to a situation where the minimum requirement for parking is one parking space per 143 square m. While 80 percent proportion of shared cars is equivalent to a situation where the minimum requirement for parking is one parking space per 338 square m. In other words, the impact of different municipal parking requirements is simultaneously tested as well.
As the structure of each design prototype differs, also the parking structures were individually designed to fit each area and, furthermore, unit prices were determined based on each design. Yet, another aspect of ground conditions, namely ground water table, is important to be studied in the case of underground parking. That is, high ground water table requires retaining walls, which have a high impact on the construction costs. Consequently, the costs of underground parking structures are calculated in the case of both regular and high ground water table. Unit prices of underground parking structures are calculated based on Laakeristo [42].
3.2.4. Green Spaces
Previous research and practice have shown the importance of sufficient green spaces as a significant component of attractive urban areas; thus, including green spaces in the sensitivity analysis of this study is well-grounded. The impacts of green spaces are discussed in more detail in Section 2. As Finnish regulations do not provide any clear threshold for the sufficient amount of green spaces, an indicative value of 16 square m per resident was adopted from Musolino and Panuccio [40]. The unit costs were calculated for different ground conditions and the need for green spaces was assumed to vary as a function of floor area and residential density, i.e., how many residents live in the area.
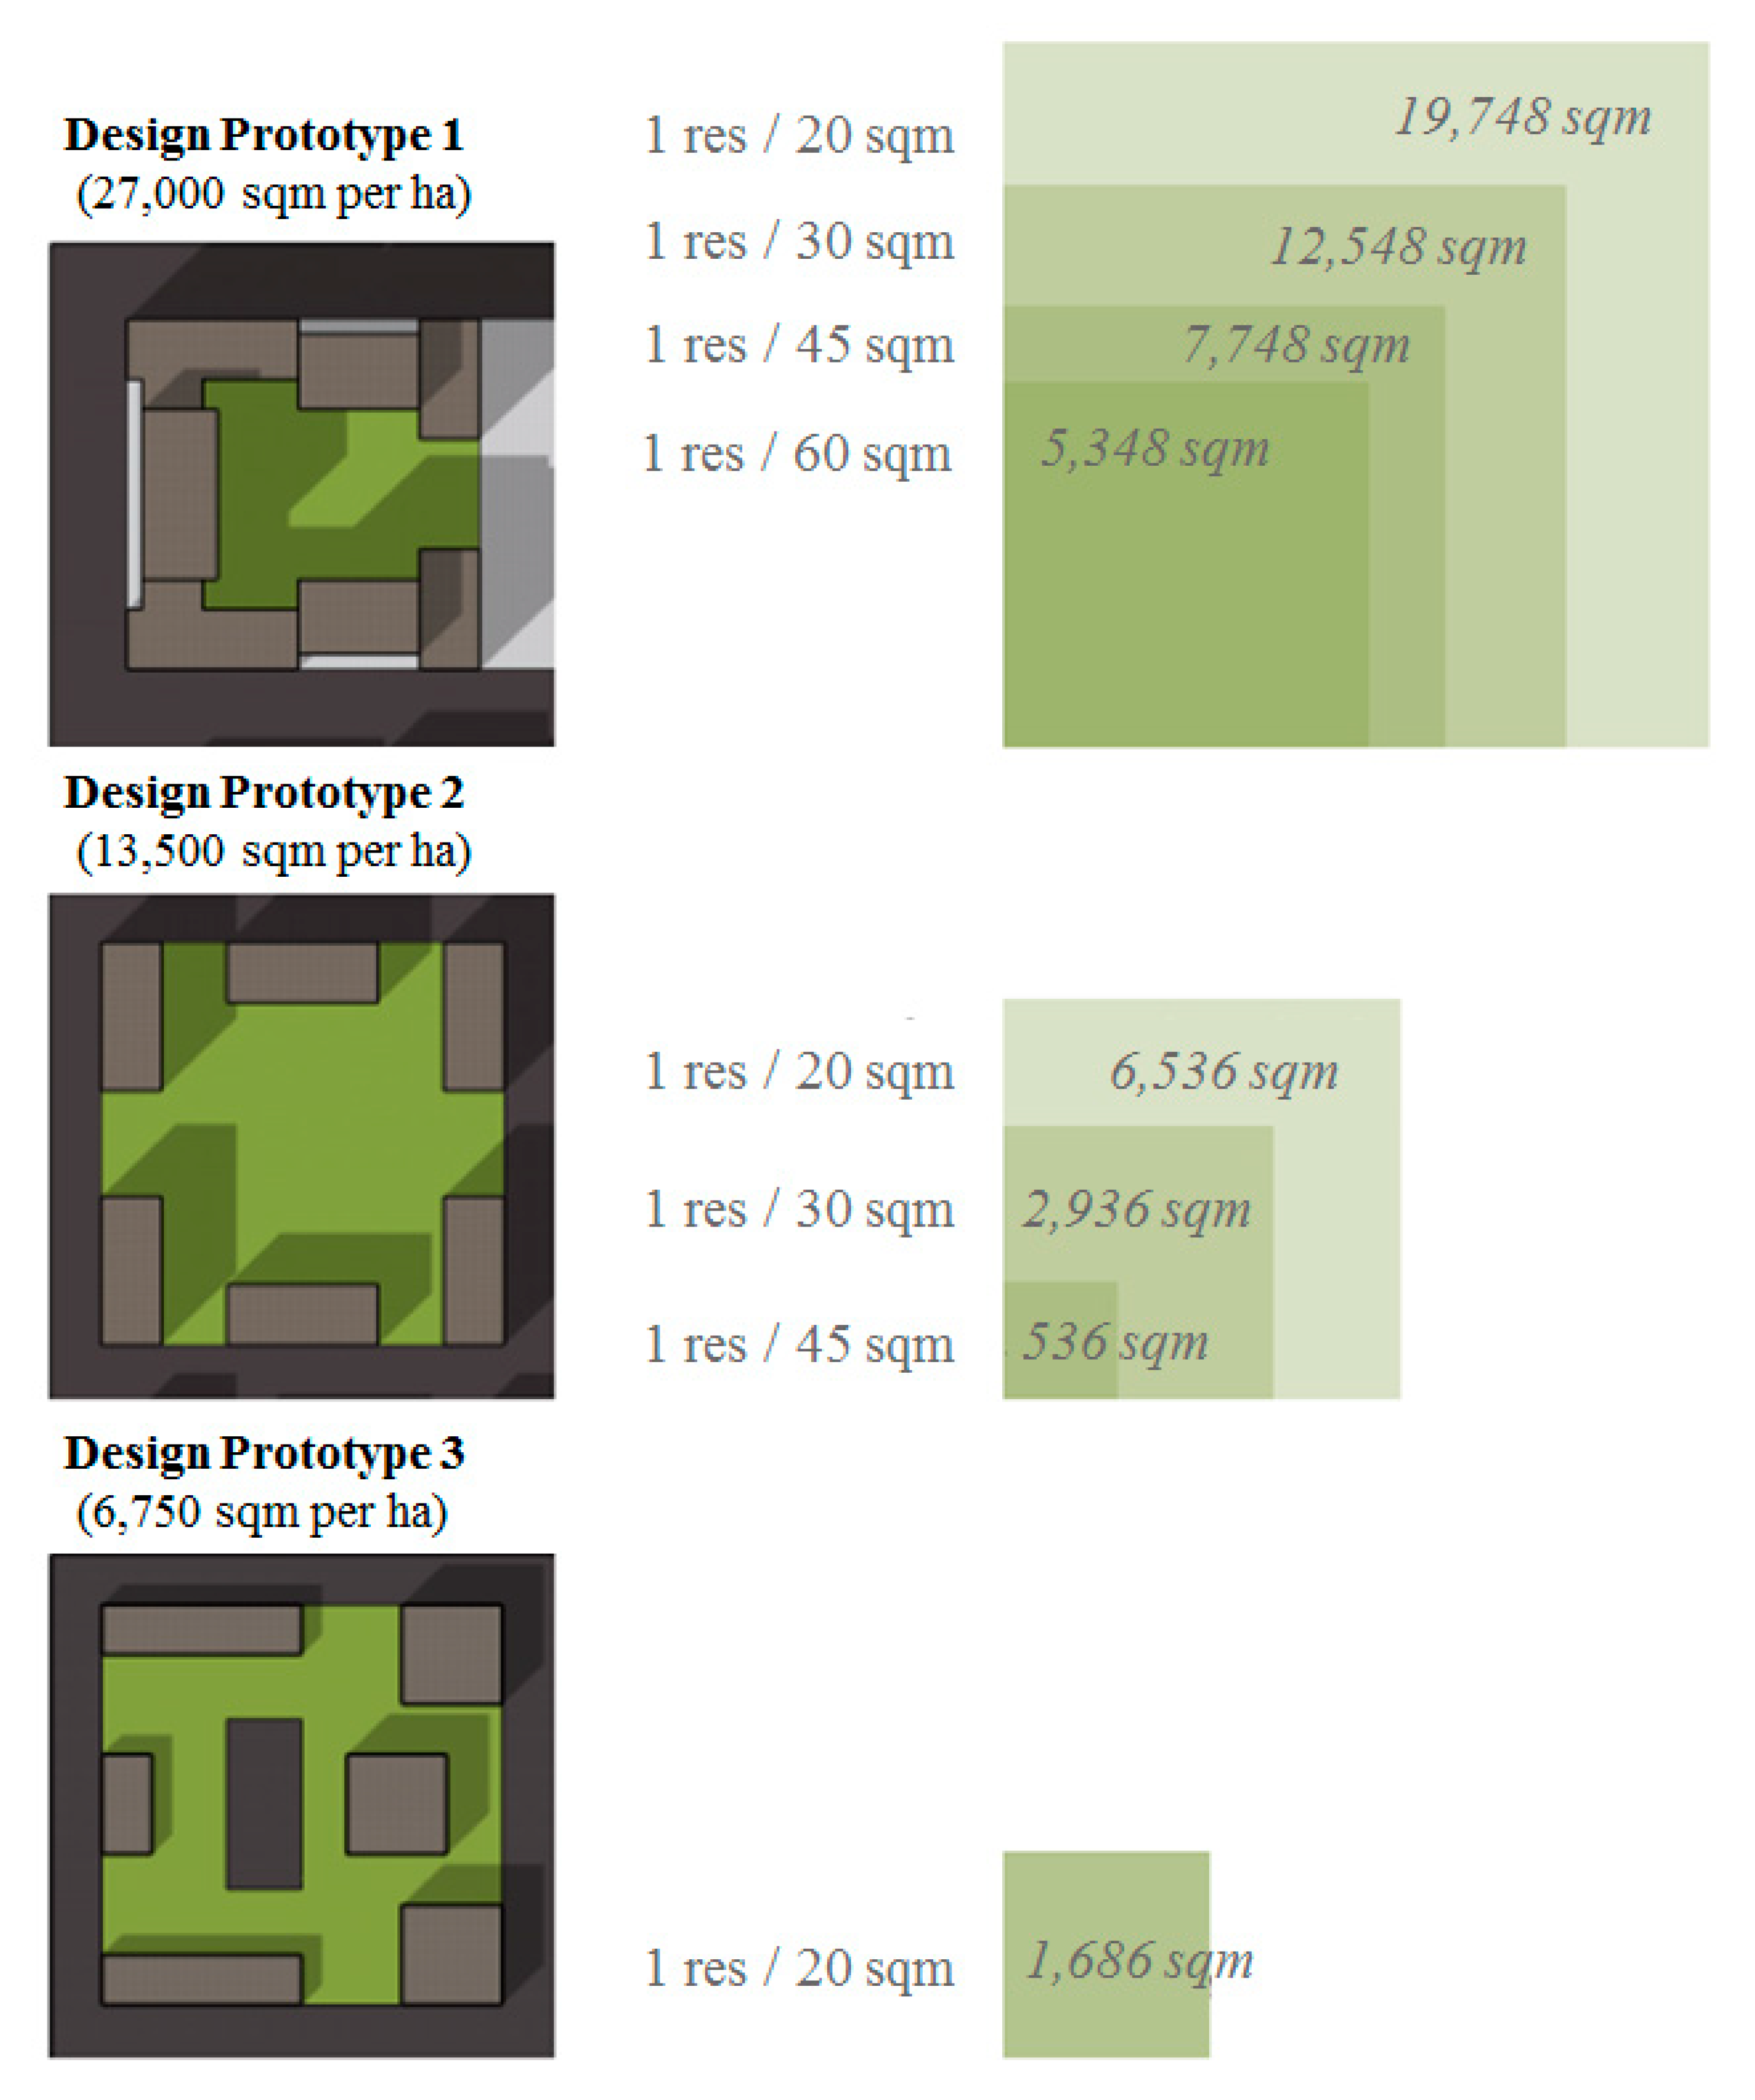
Figure 4 illustrates the need of additional green spaces that must be allocated outside the design prototypes if the threshold for green spaces is 16 square m per resident. Design Prototype 4, the lowest density area, is missing from the figure as the yard areas alone fulfil the threshold for sufficient amount of green spaces with all the included residential densities. For other design prototypes, the green squares next to the city block of each design prototype depict the need of additional green spaces relative to the size of one hectare (100 m × 100 m) sized city block as the residential density varies. In Design Prototype 3, additional green spaces have to be allocated only when residential density is 1 resident per 20 square m. While, in Design Prototype 2, additional green spaces are not only needed when the residential density is 1 resident per 60 square m. In Design Prototype 1, additional green spaces have to be allocated in the case of all included residential densities.
It is important to notice that the selected threshold for green spaces is not necessary the best option in all cases but the optimal amount of green spaces may vary case by case and depends, for example, on the characteristics of the area and accessibility to existing green spaces. However, including the cost of additional green spaces in the analysis provides an insight of possible cost effects for an important planning component that should not be forgotten in the decision-making process.
4. Results
In this section, the main results of this study are reported. In the interest of brevity, the focus is restricted to two common types of ground conditions in Helsinki Metropolitan Area: Cohesive soil with high bearing capacity and clay soil with low bearing capacity. Results from these two common ground condition cases are illustrative to demonstrate the great cost impact of soil conditions; thus, facilitating discussion on prerequisites for profitability when the ground conditions are demanding.
To make the results meaningful, the costs are reported per capita, which is the most suitable functional unit to depict how cost-efficient different options are in order to serve the needs of new residents in growing urban areas. Another advantage is that costs per capita also allow sensitivity analysis in relation to residential density, which is one of the present-day political hot potatoes.
4.1. Ground Conditions with High Bearing Capacity
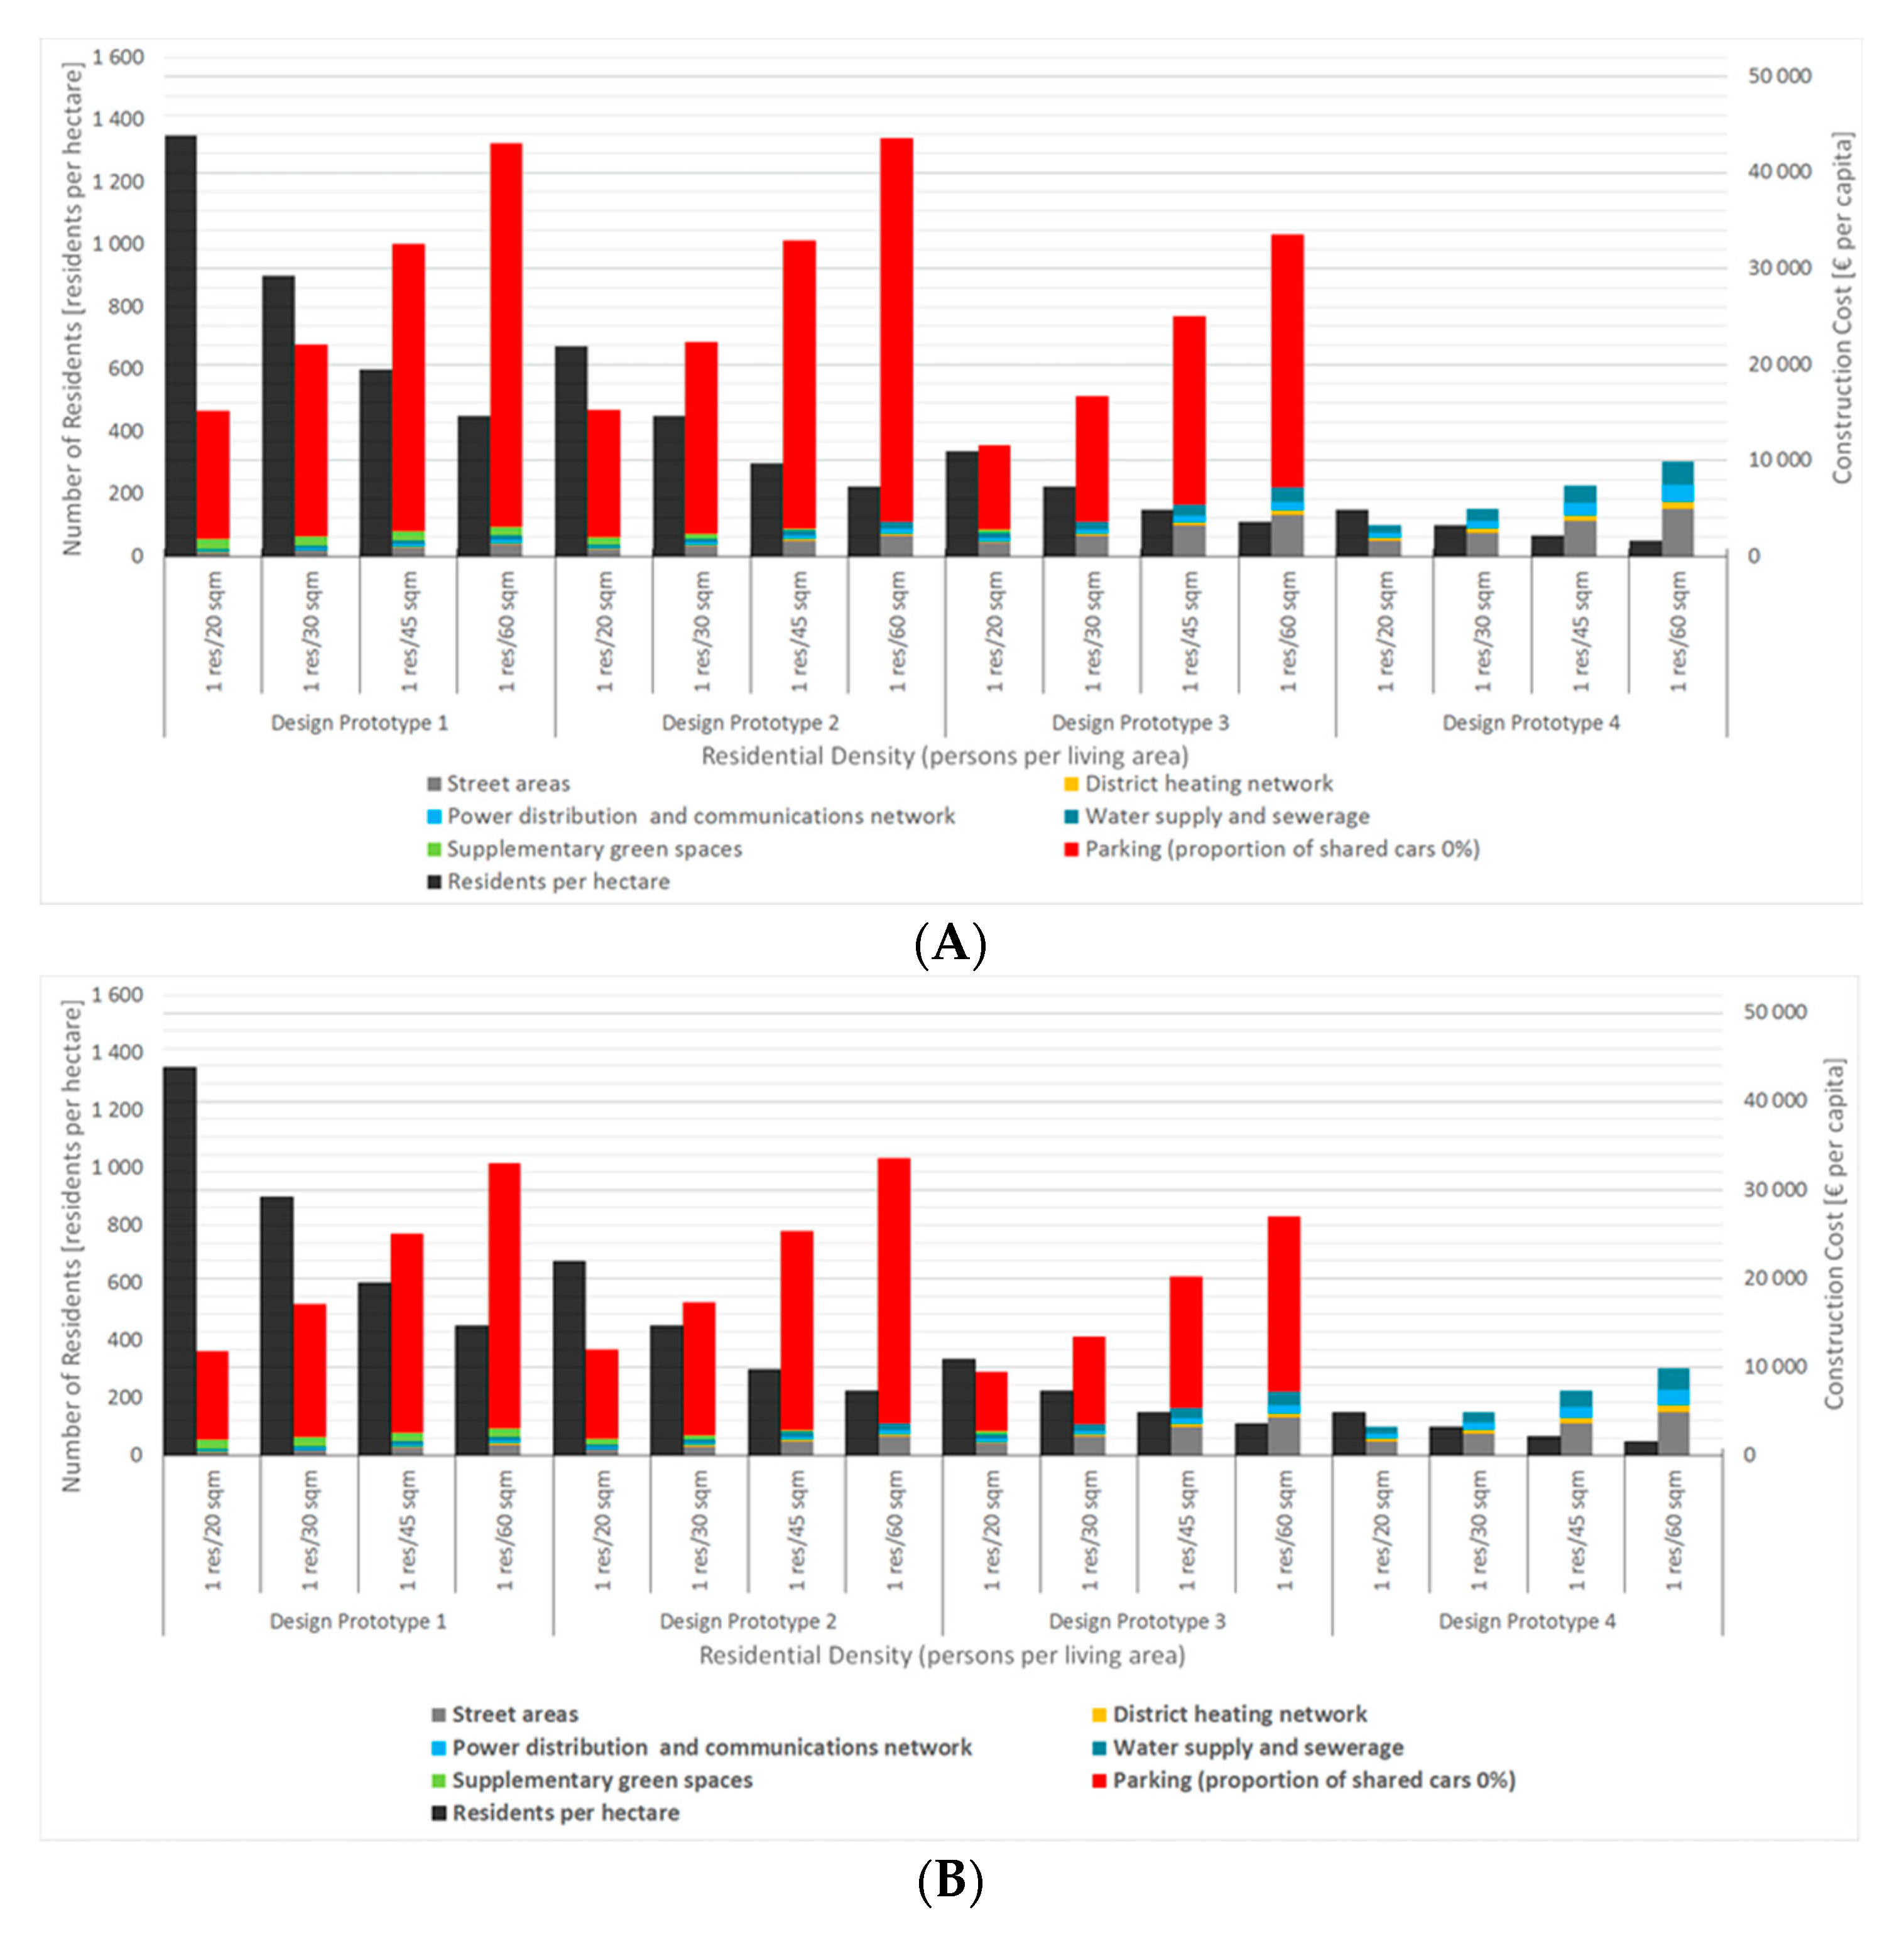
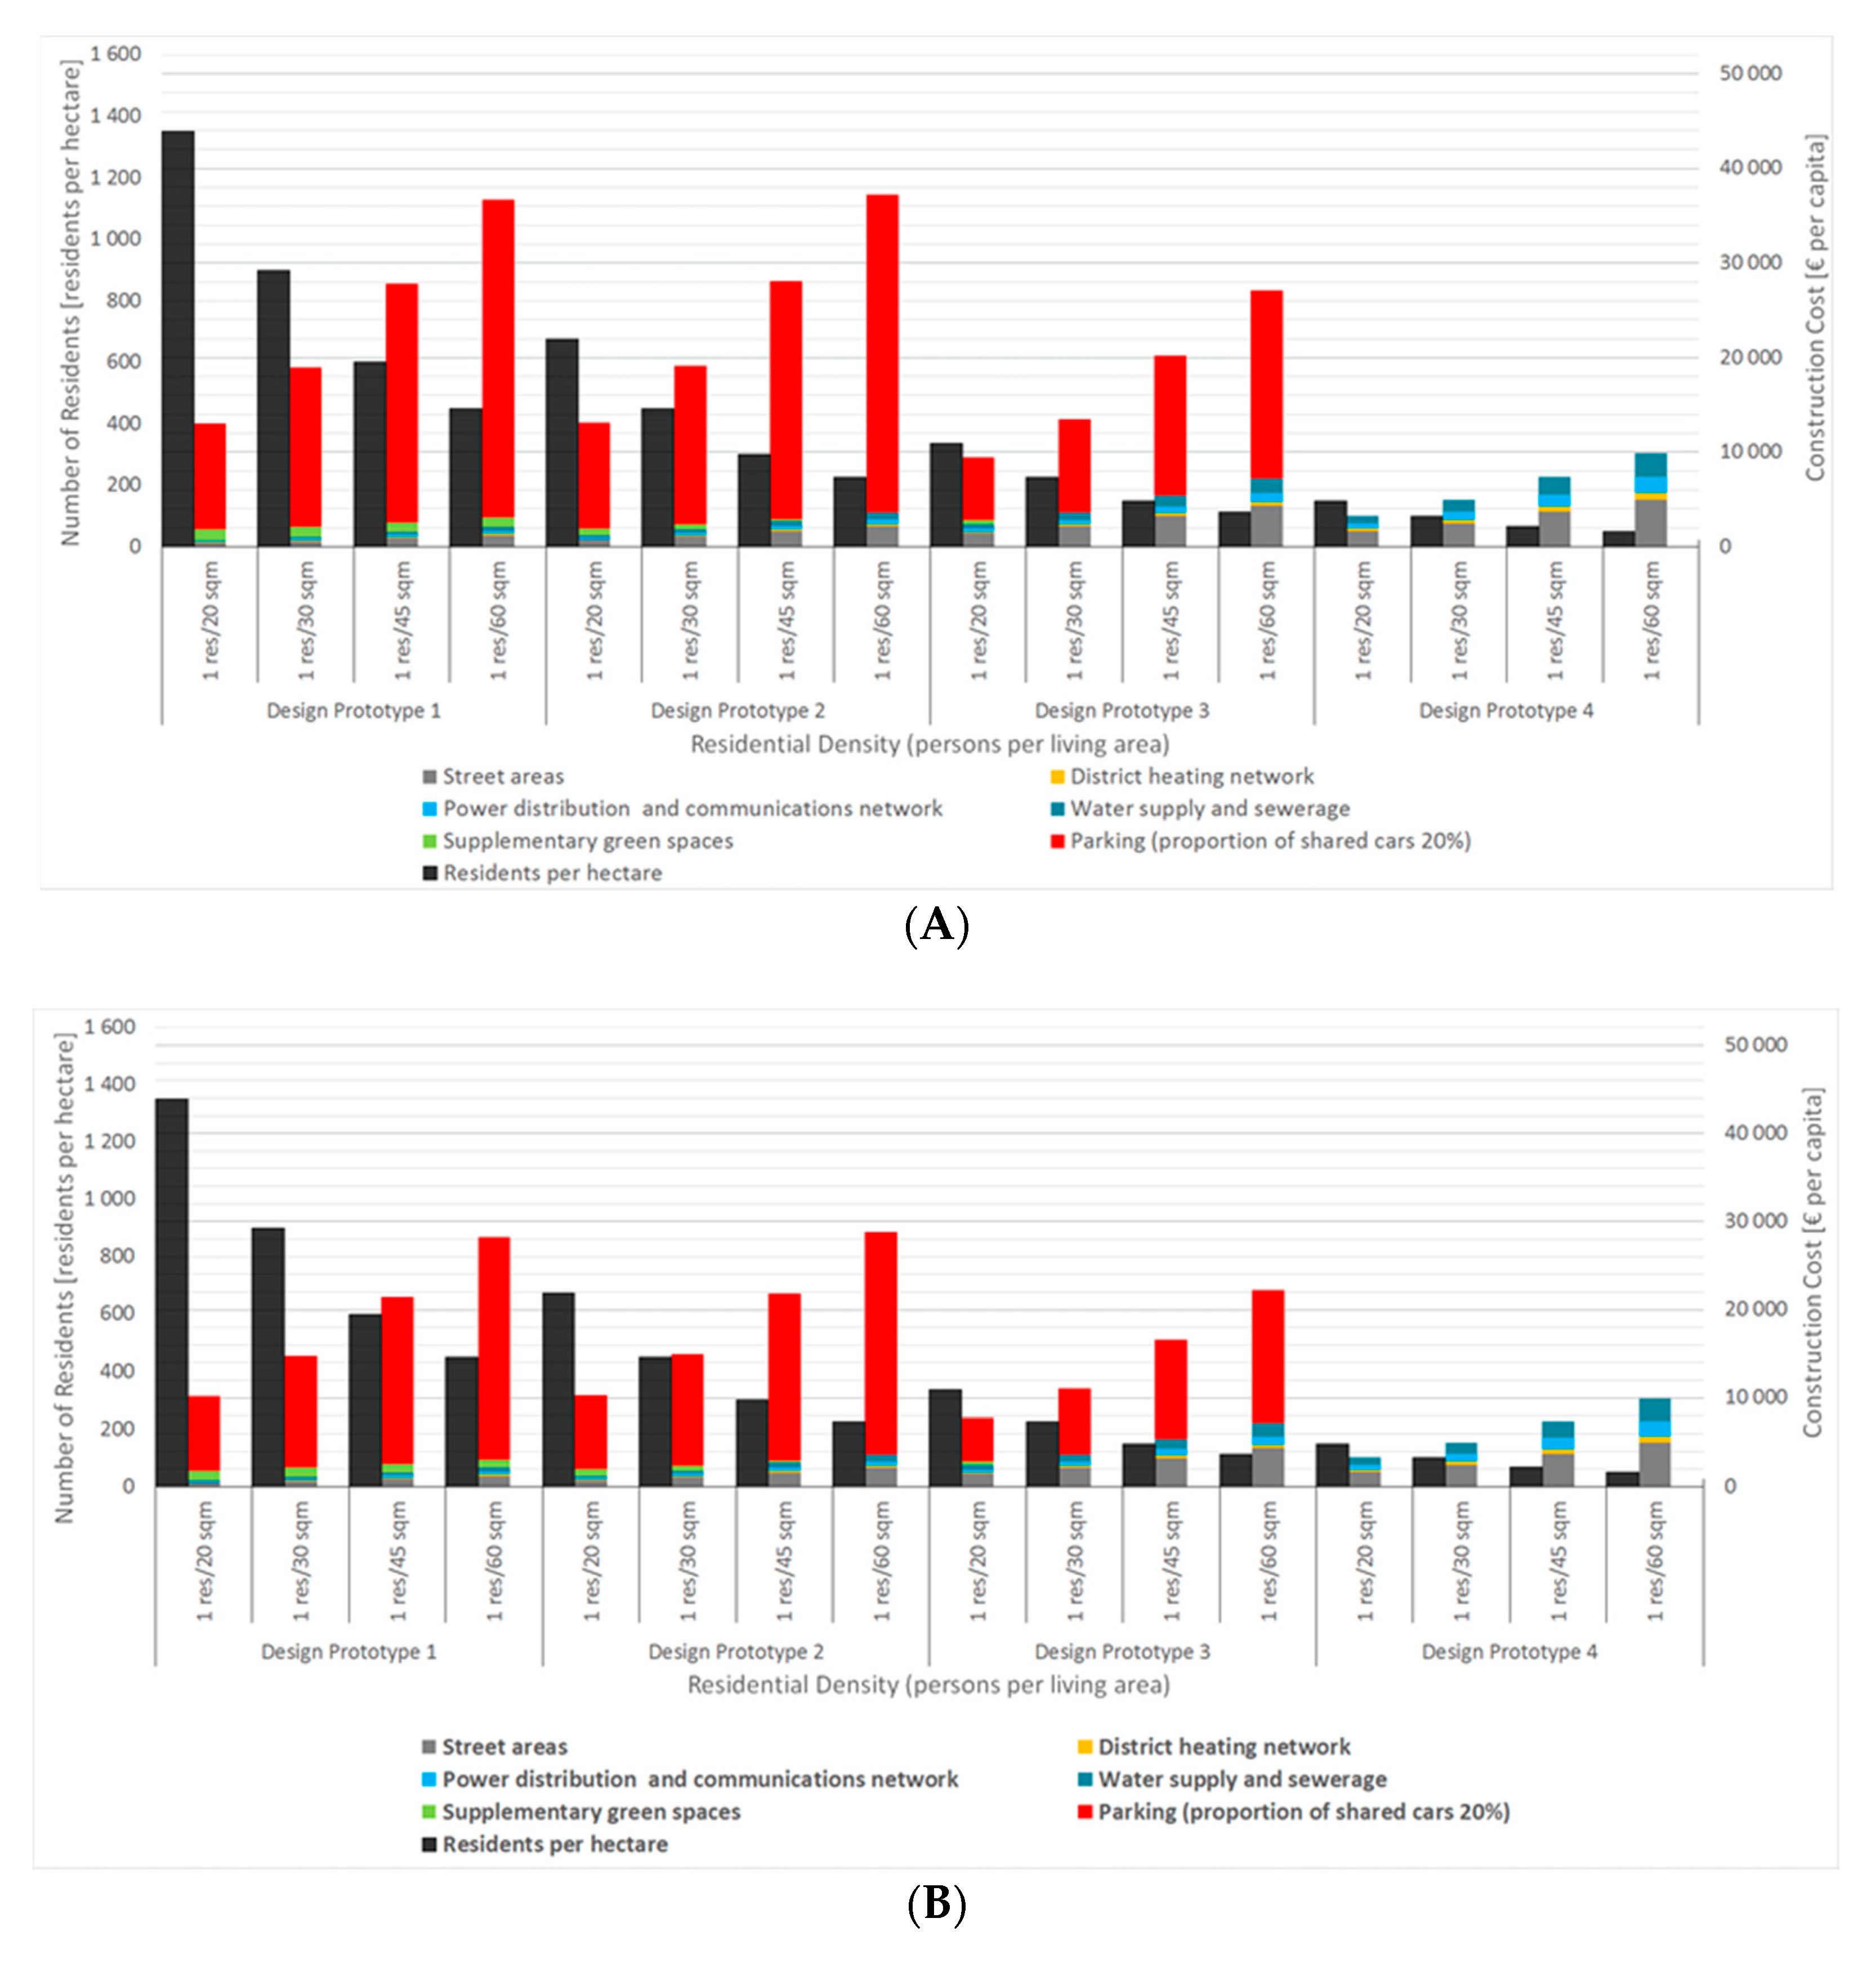
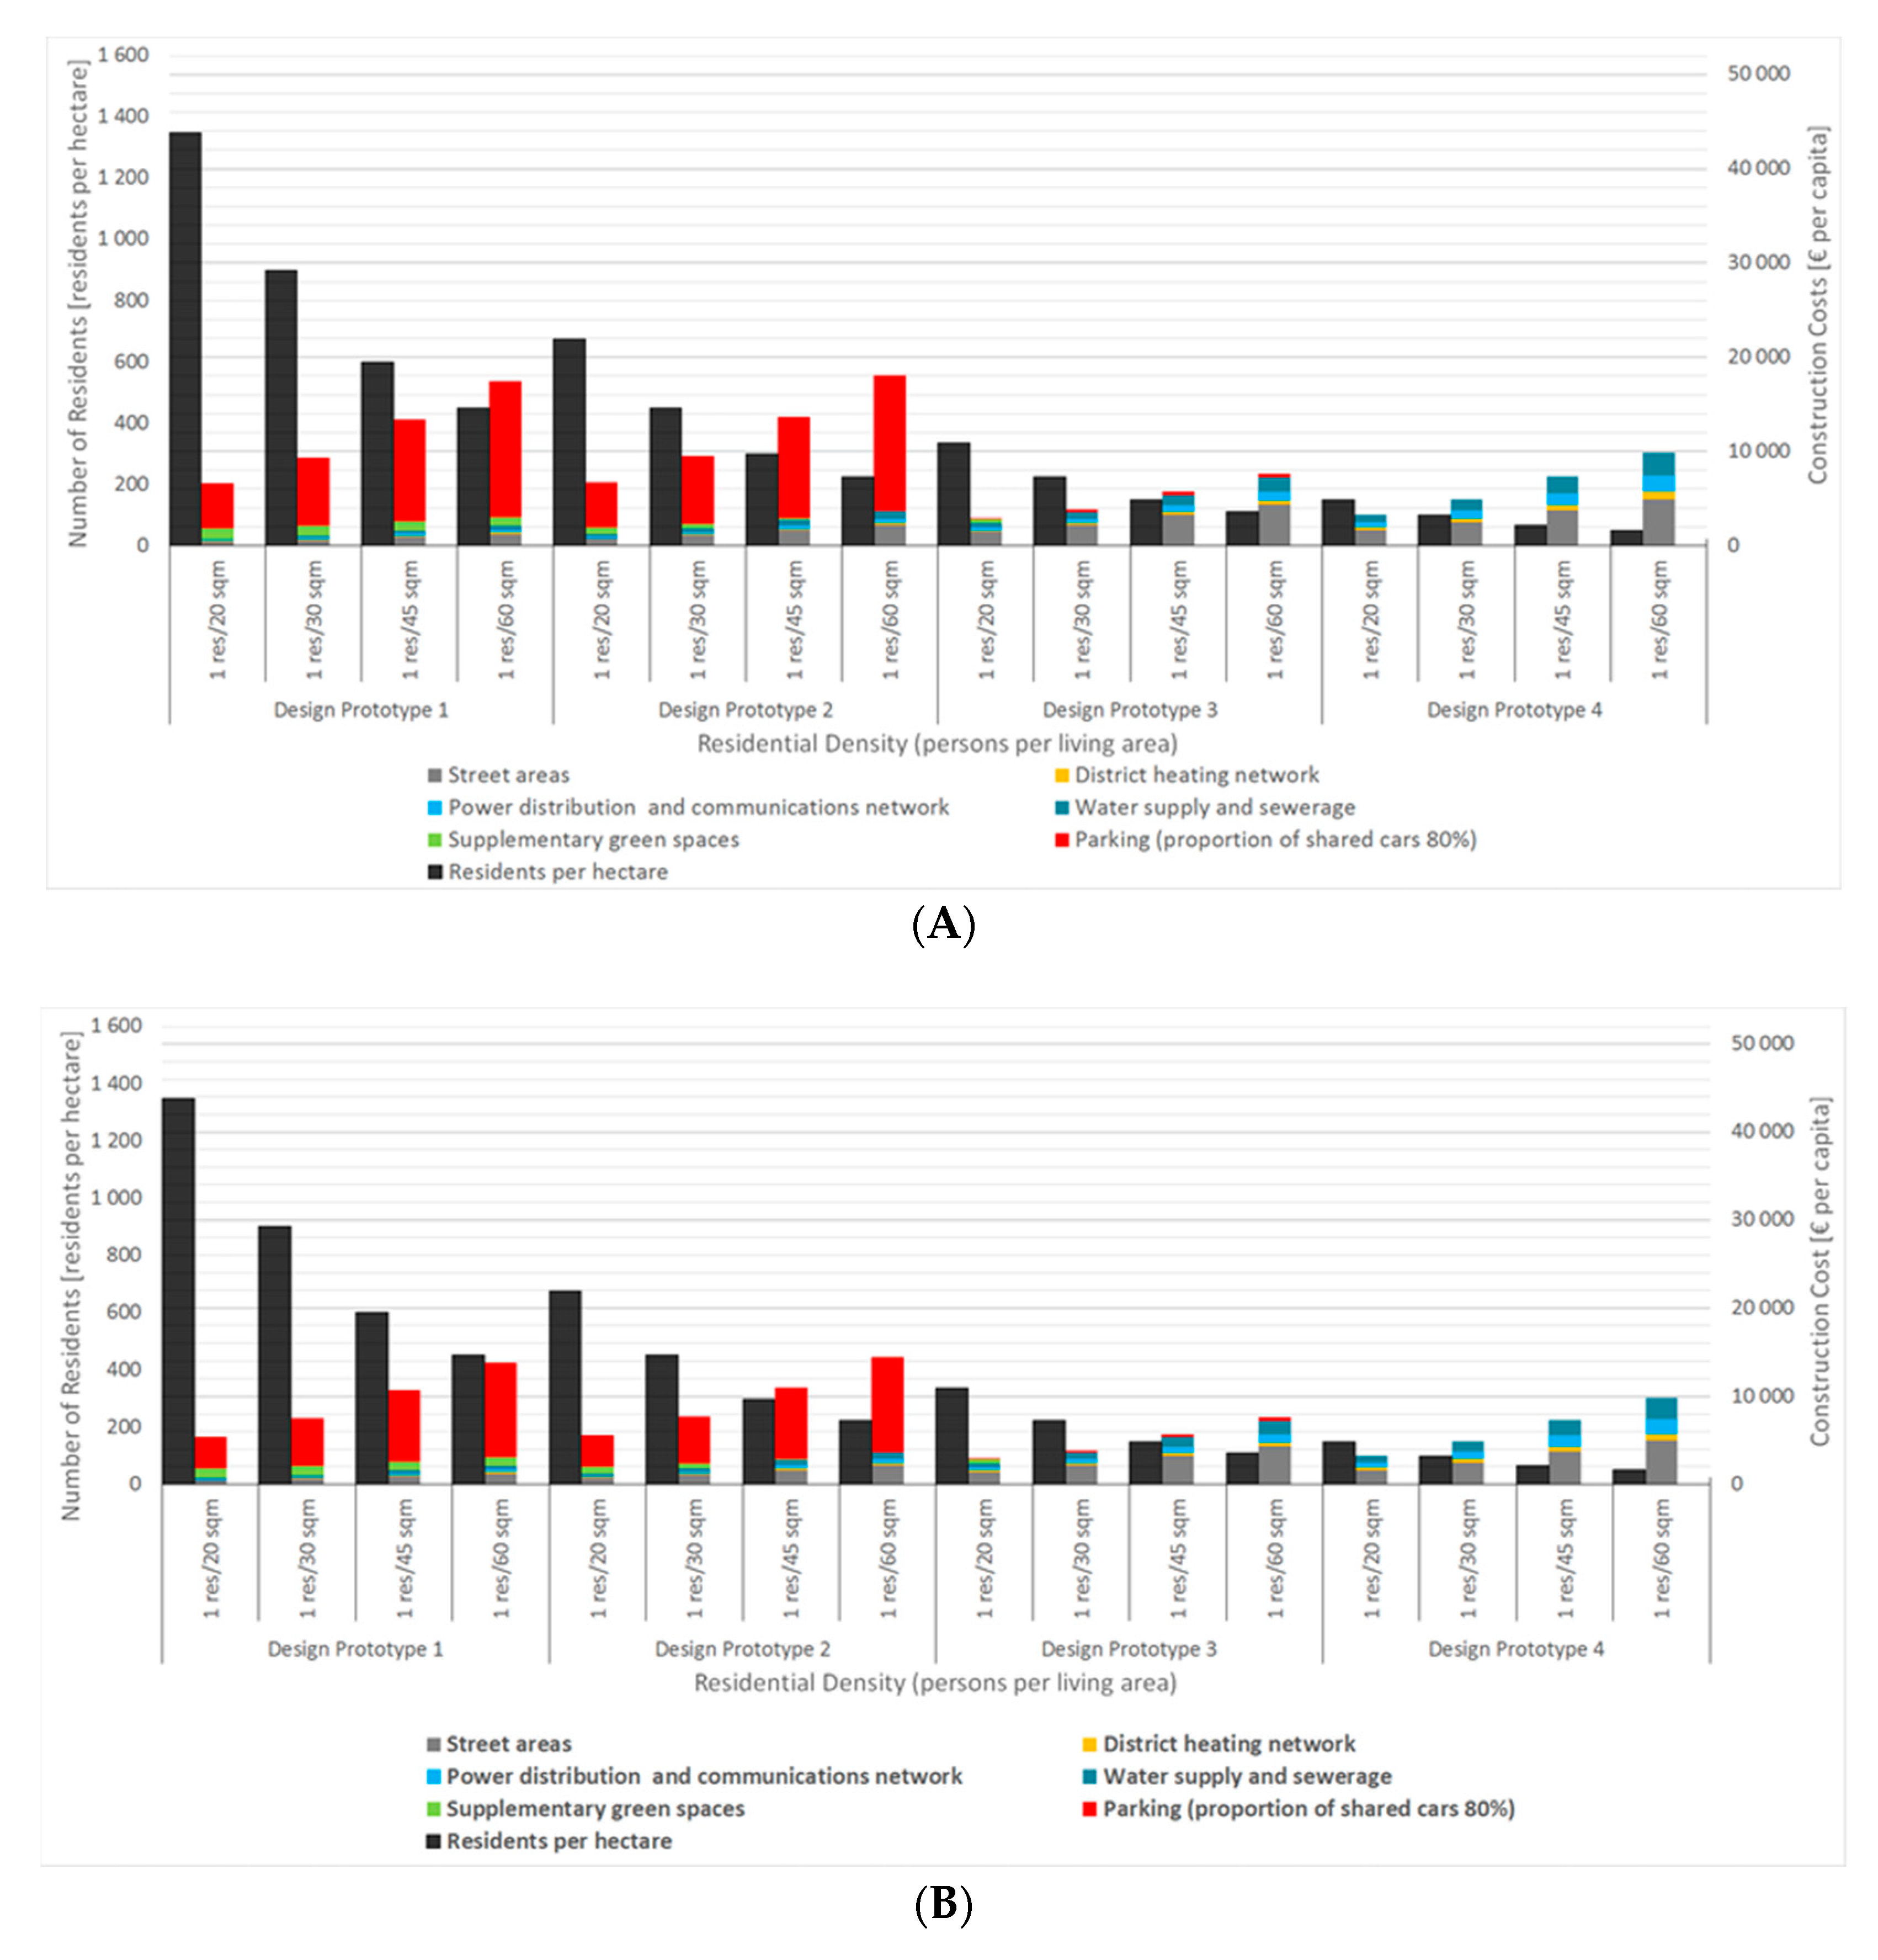
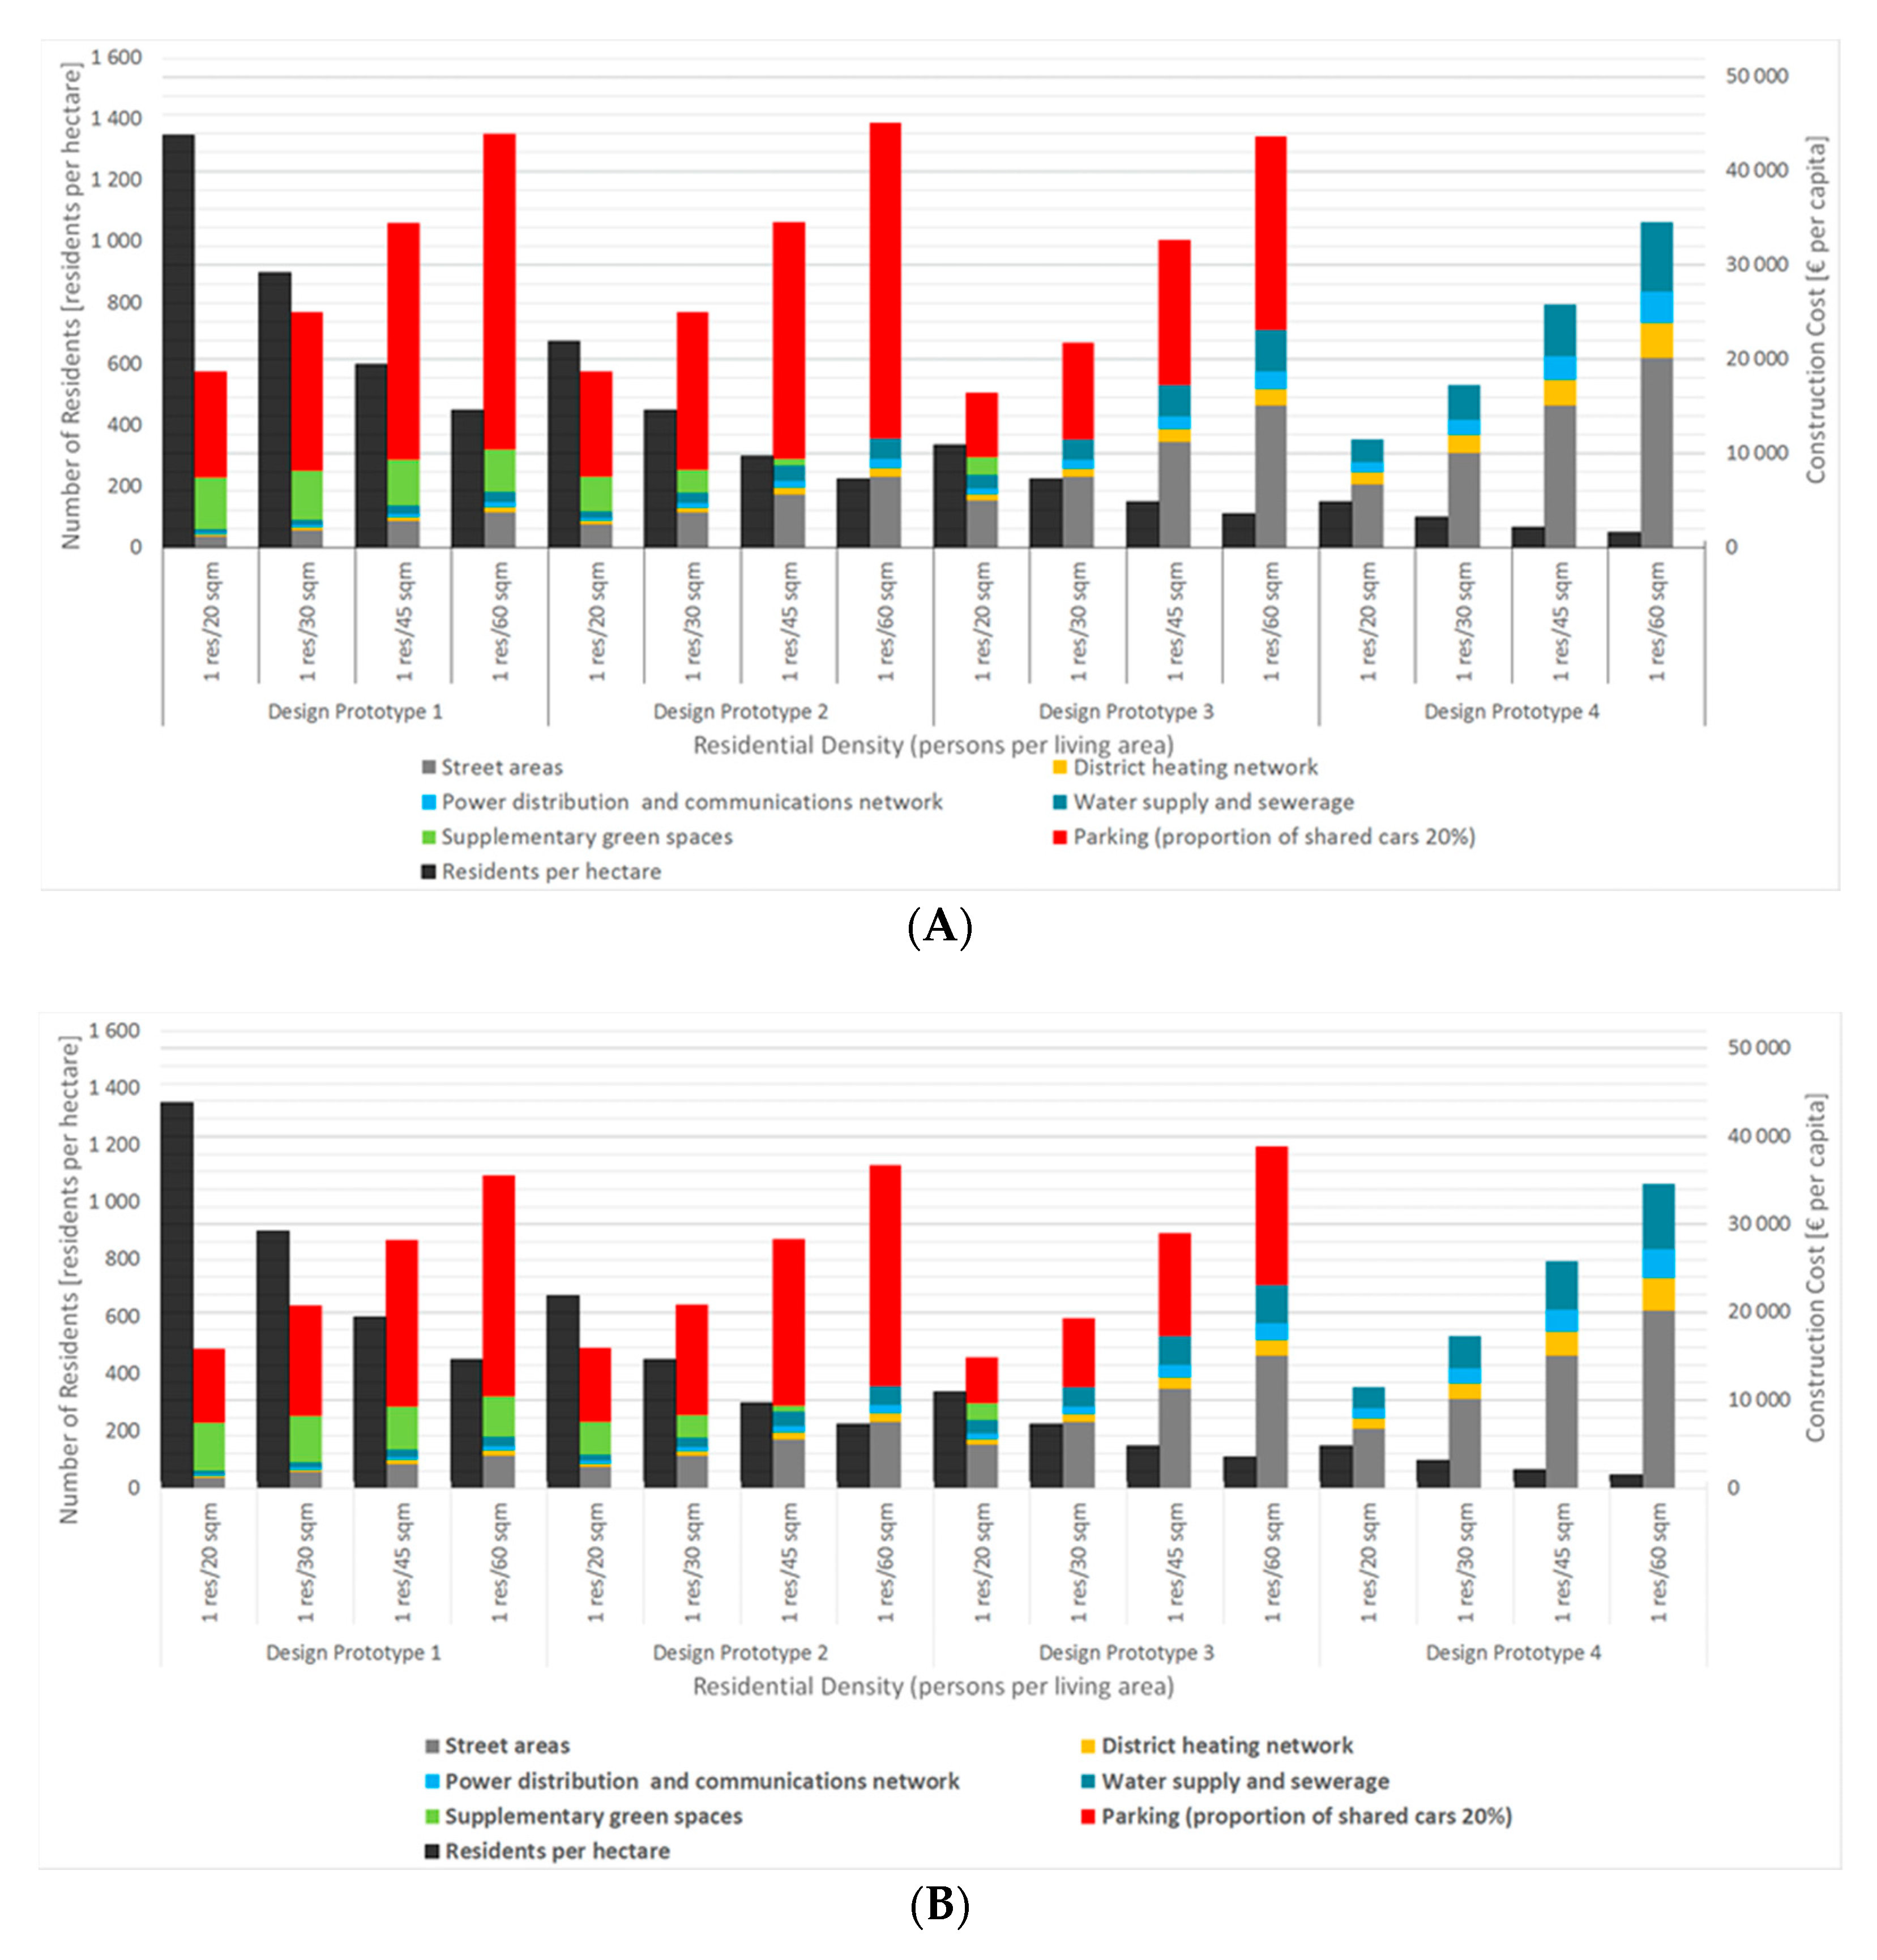
Figure 5, Figure 6 and Figure 7 illustrate results from the analysis when building on non-cohesive soil with high bearing capacity and proportion of shared cars varies between 0 and 80 percent. In each figure, the costs are reported for ground conditions with both high (A) and low (B) groundwater table. The results indicate that construction costs per capita for street areas and utilities in lower density areas are notably higher than in higher density areas, even if the costs for additional green spaces are taken into account. At the same time, however, the magnitude of construction costs of underground parking spaces is of different order, making the total costs to be the highest in denser areas. In particular, in such cases where groundwater table is high, as required special structures increase the unit price of one underground parking space from approximately 60,000 euros to 80,000 euros, including project tasks (36%) and VAT (24%). Higher proportion of shared cars effectively decreases the need of parking spaces and, thus, significantly lowers the costs. Similar cost saving effect is achieved if the proportion of shared cars increases from 0 percent to 80 percent or, alternatively, the requirement for parking spaces is dropped from one parking space per 120 square m to one parking space per 338 square m.
In addition to the costs per capita, another important dimension of the results is how many residents per hectare each land use option is able to accommodate. In Figure 5, Figure 6 and Figure 7 that is indicated by the black left-hand side columns. The potential number of residents notably varies between the design prototypes. For example, with the lowest residential density, Design Prototype 1 accommodates 450 residents per hectare and, with the highest residential density, 1350 residents per hectare. While the potential number of residents in Design Prototype 4, with the same residential densities, are 50 residents per hectare and 150 residents per hectare, respectively.
4.2. Demanding Ground Conditions with Low Bearing Capacity
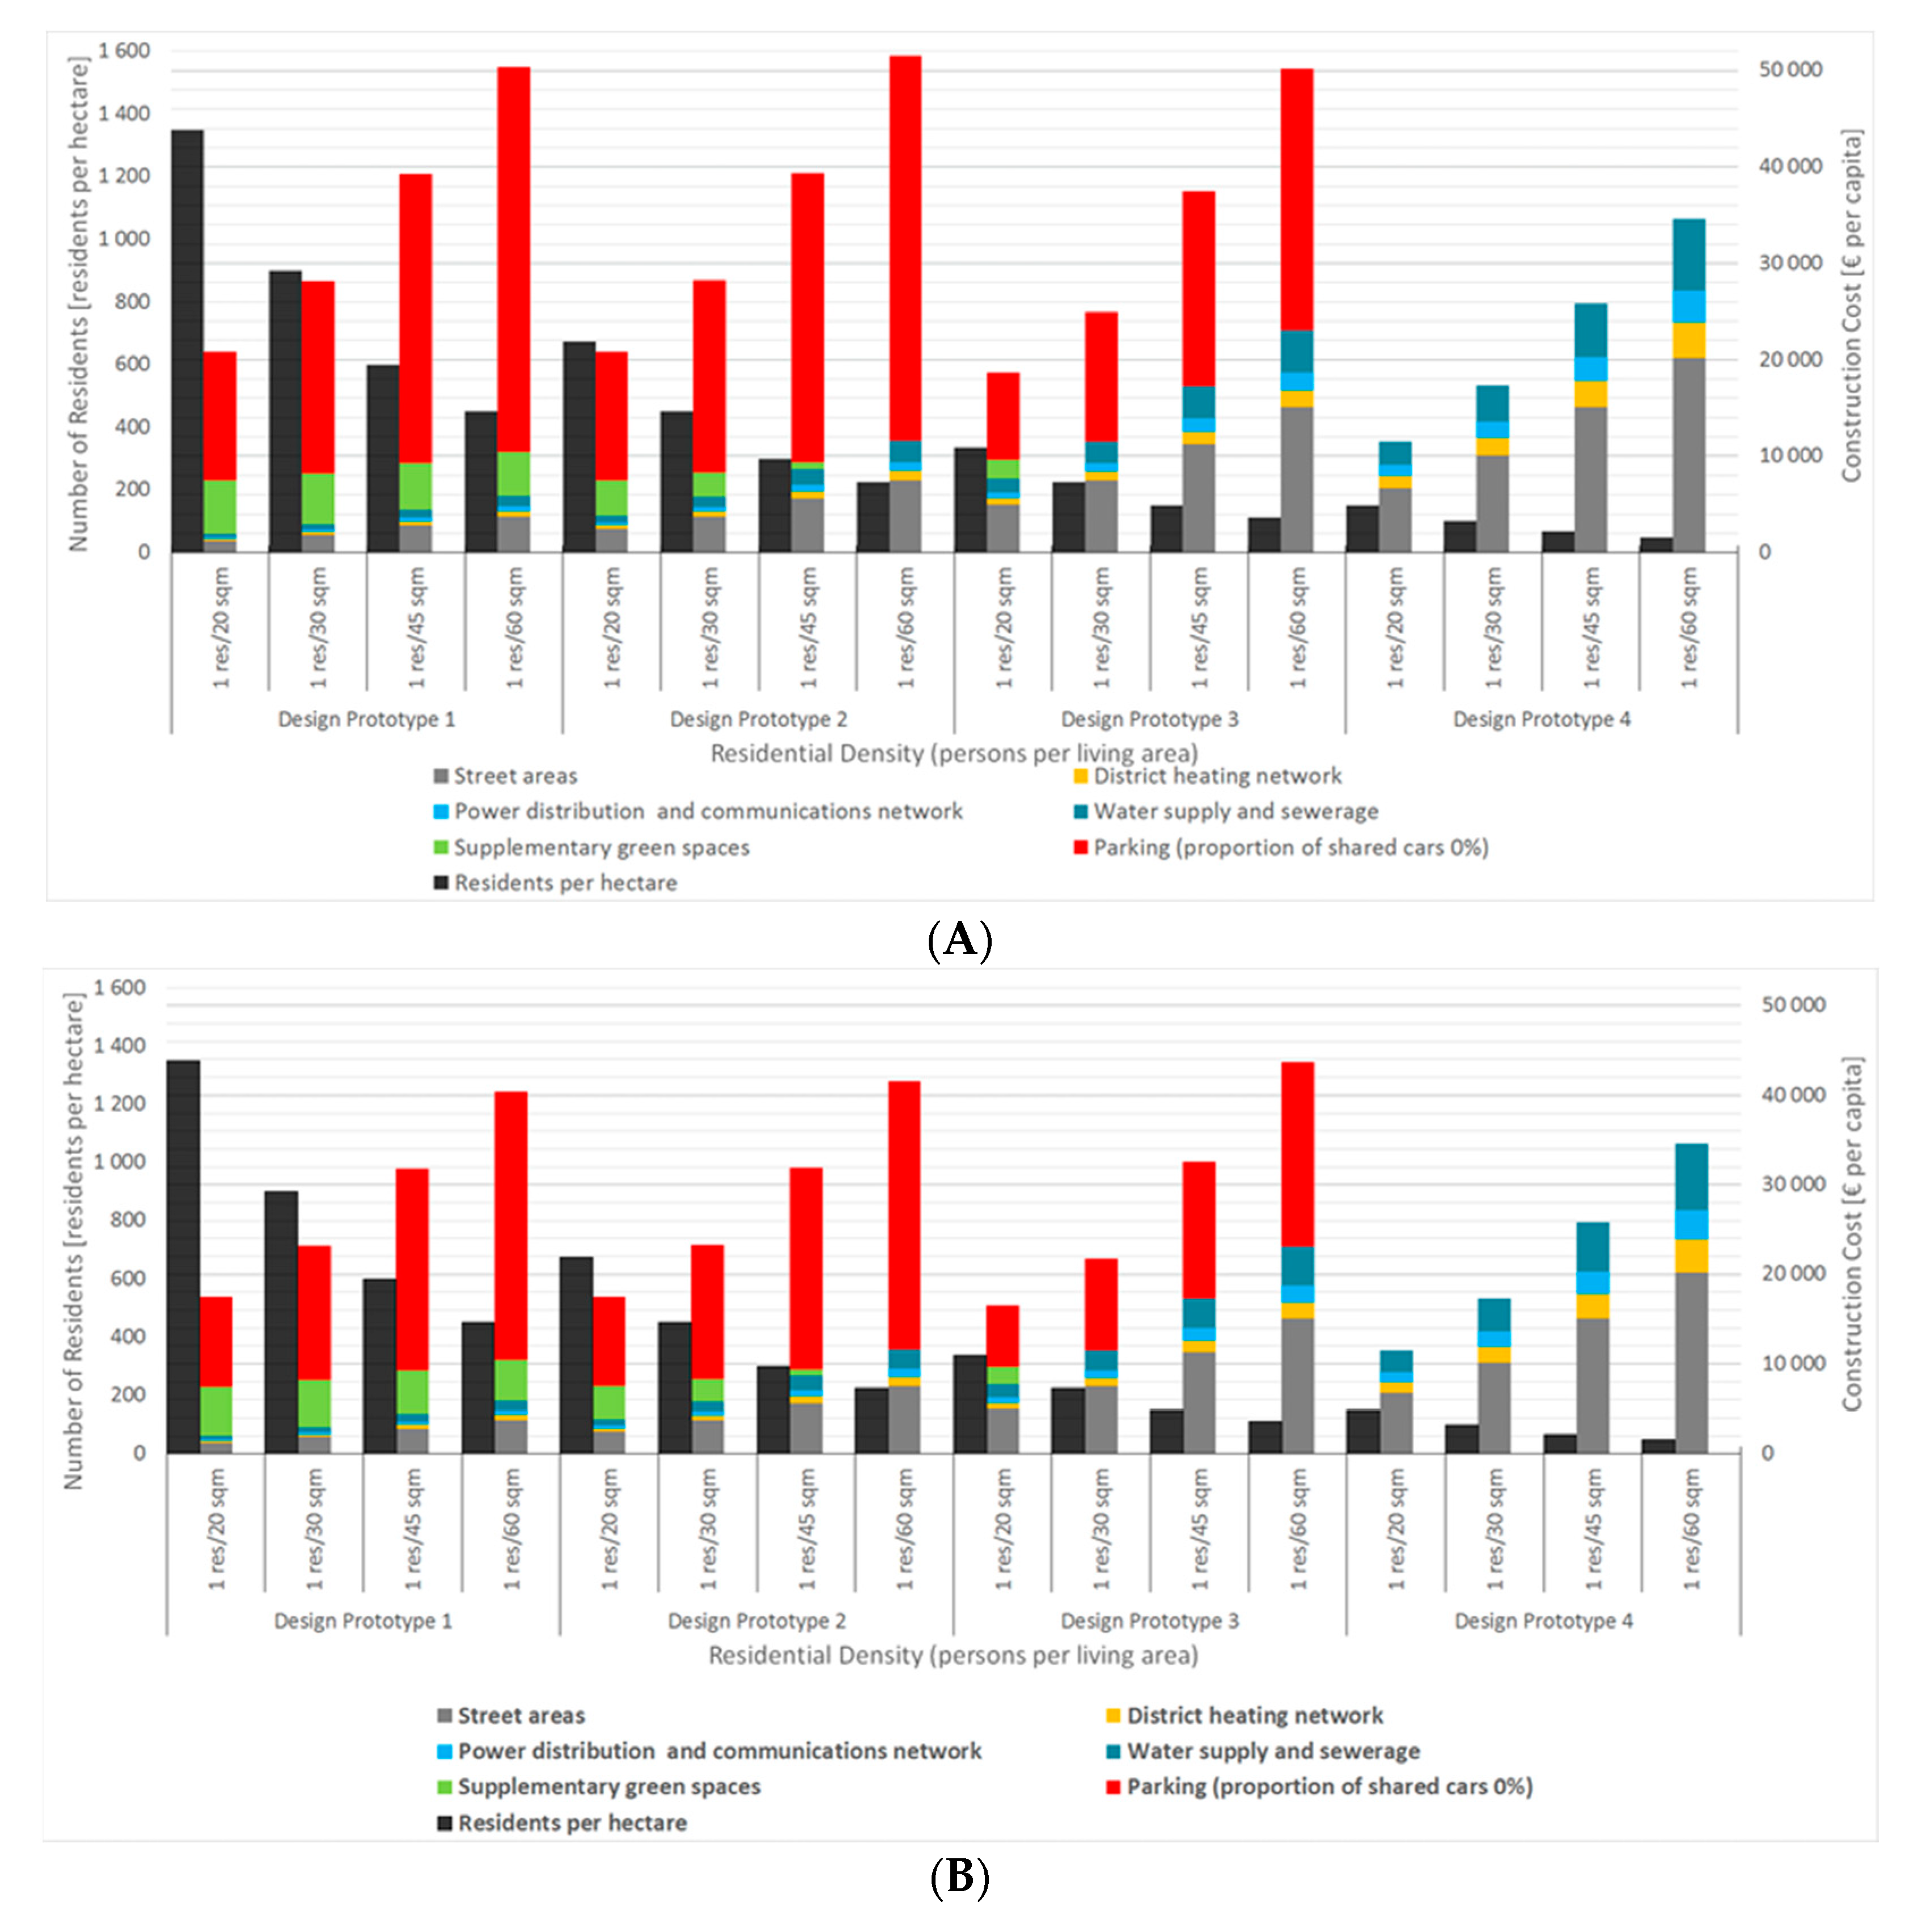
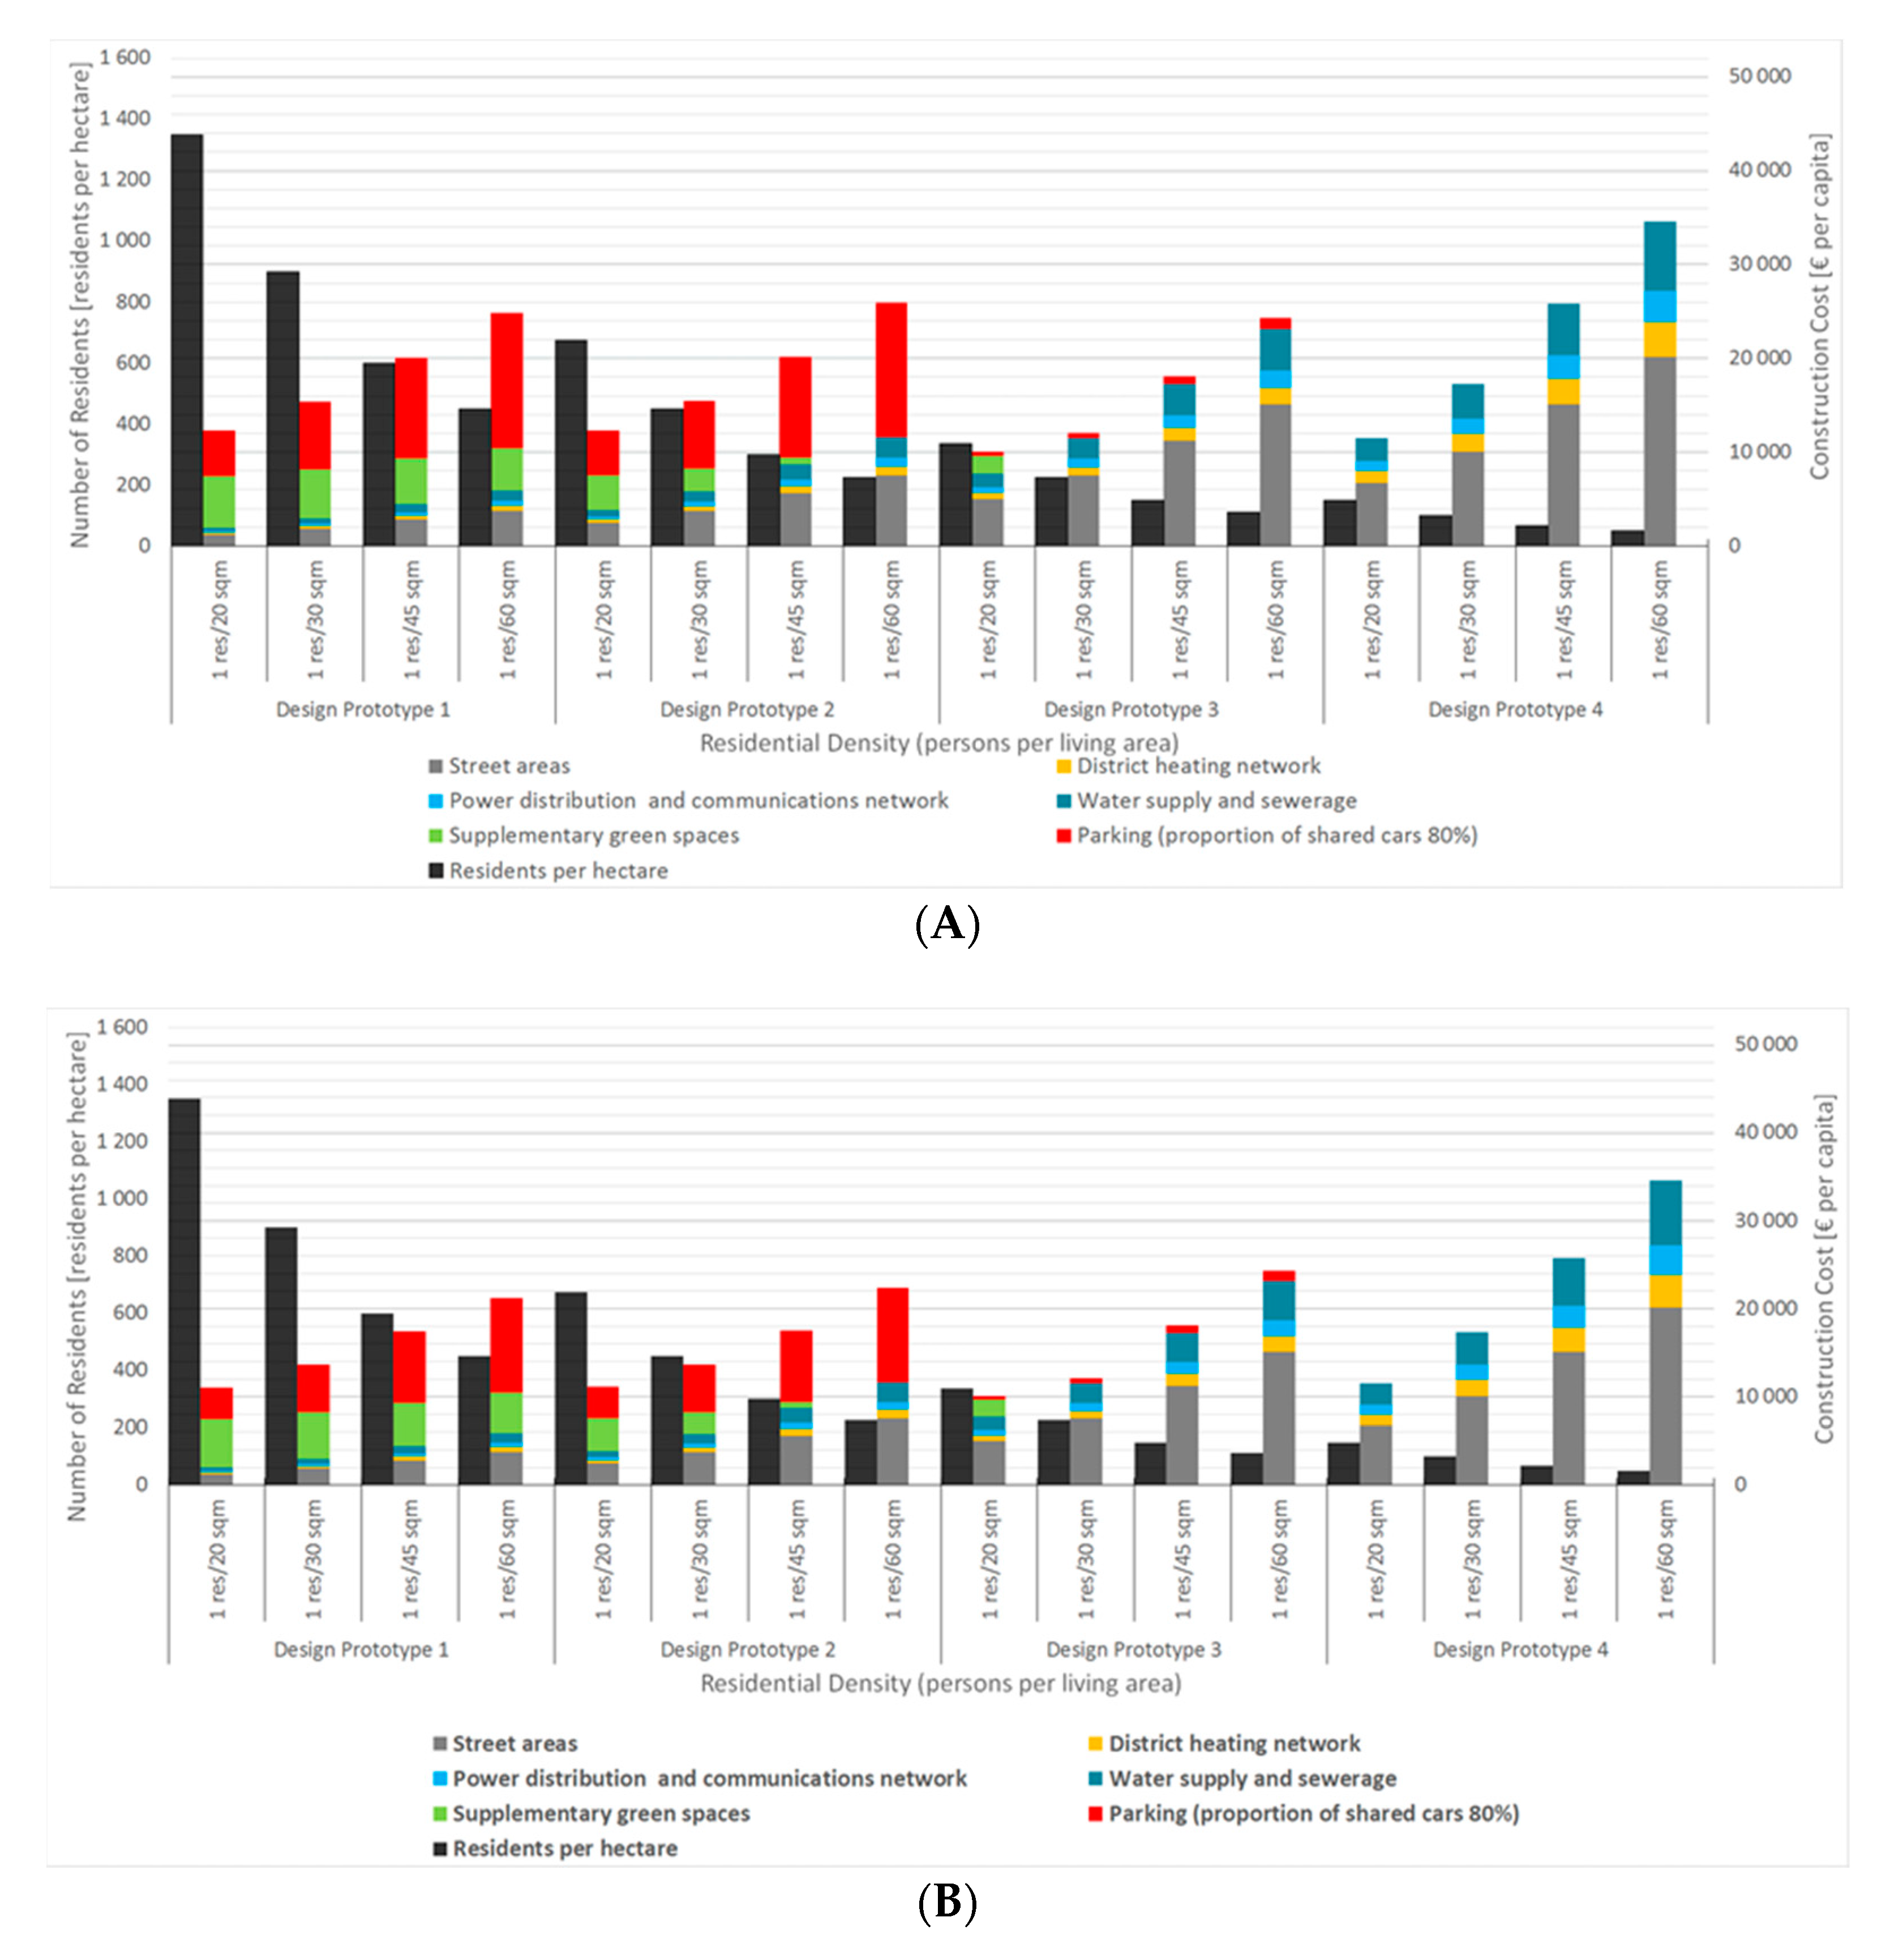
Figure 8, Figure 9 and Figure 10 illustrate results as the residential area is built on soft clay soil with low bearing capacity and proportion of shared cars varies between 0 and 80 percent. In each figure, the costs are reported for ground conditions with both high (A) and low (B) groundwater table. The results indicate that, in lower density areas, more demanding ground conditions notably increase the costs per capita relative to when the residential area is built on non-cohesive soil with high bearing capacity. Correspondingly, cost increase relative to more favourable ground conditions also occurs in higher density areas but, as the number of residents is much higher, the cost per capita increase is more moderate than in lower density areas.
Again, high ground water table has notable impact on the underground parking structures, making costs per capita notably higher relative to areas where groundwater table is at lower level. More demanding ground conditions have also an increasing impact on the costs of additional greenspaces, which raises the total costs per capita in high density areas. However, it is important to notice that the costs per capita for additional green spaces are only indicative as the selected threshold for greenspaces is not an absolute truth but rather provides an insight on the magnitude of investments that may be required to create attractive residential areas. Furthermore, the reported benefits of greenspaces suggest that investing in greenspaces is likely to induce significant savings in wider economic perspective, for example, in terms of well-being and health care. These reported benefits are discussed in more detail in Section 2.3 above.
4.3. Synthesis of Construction Costs of Parking
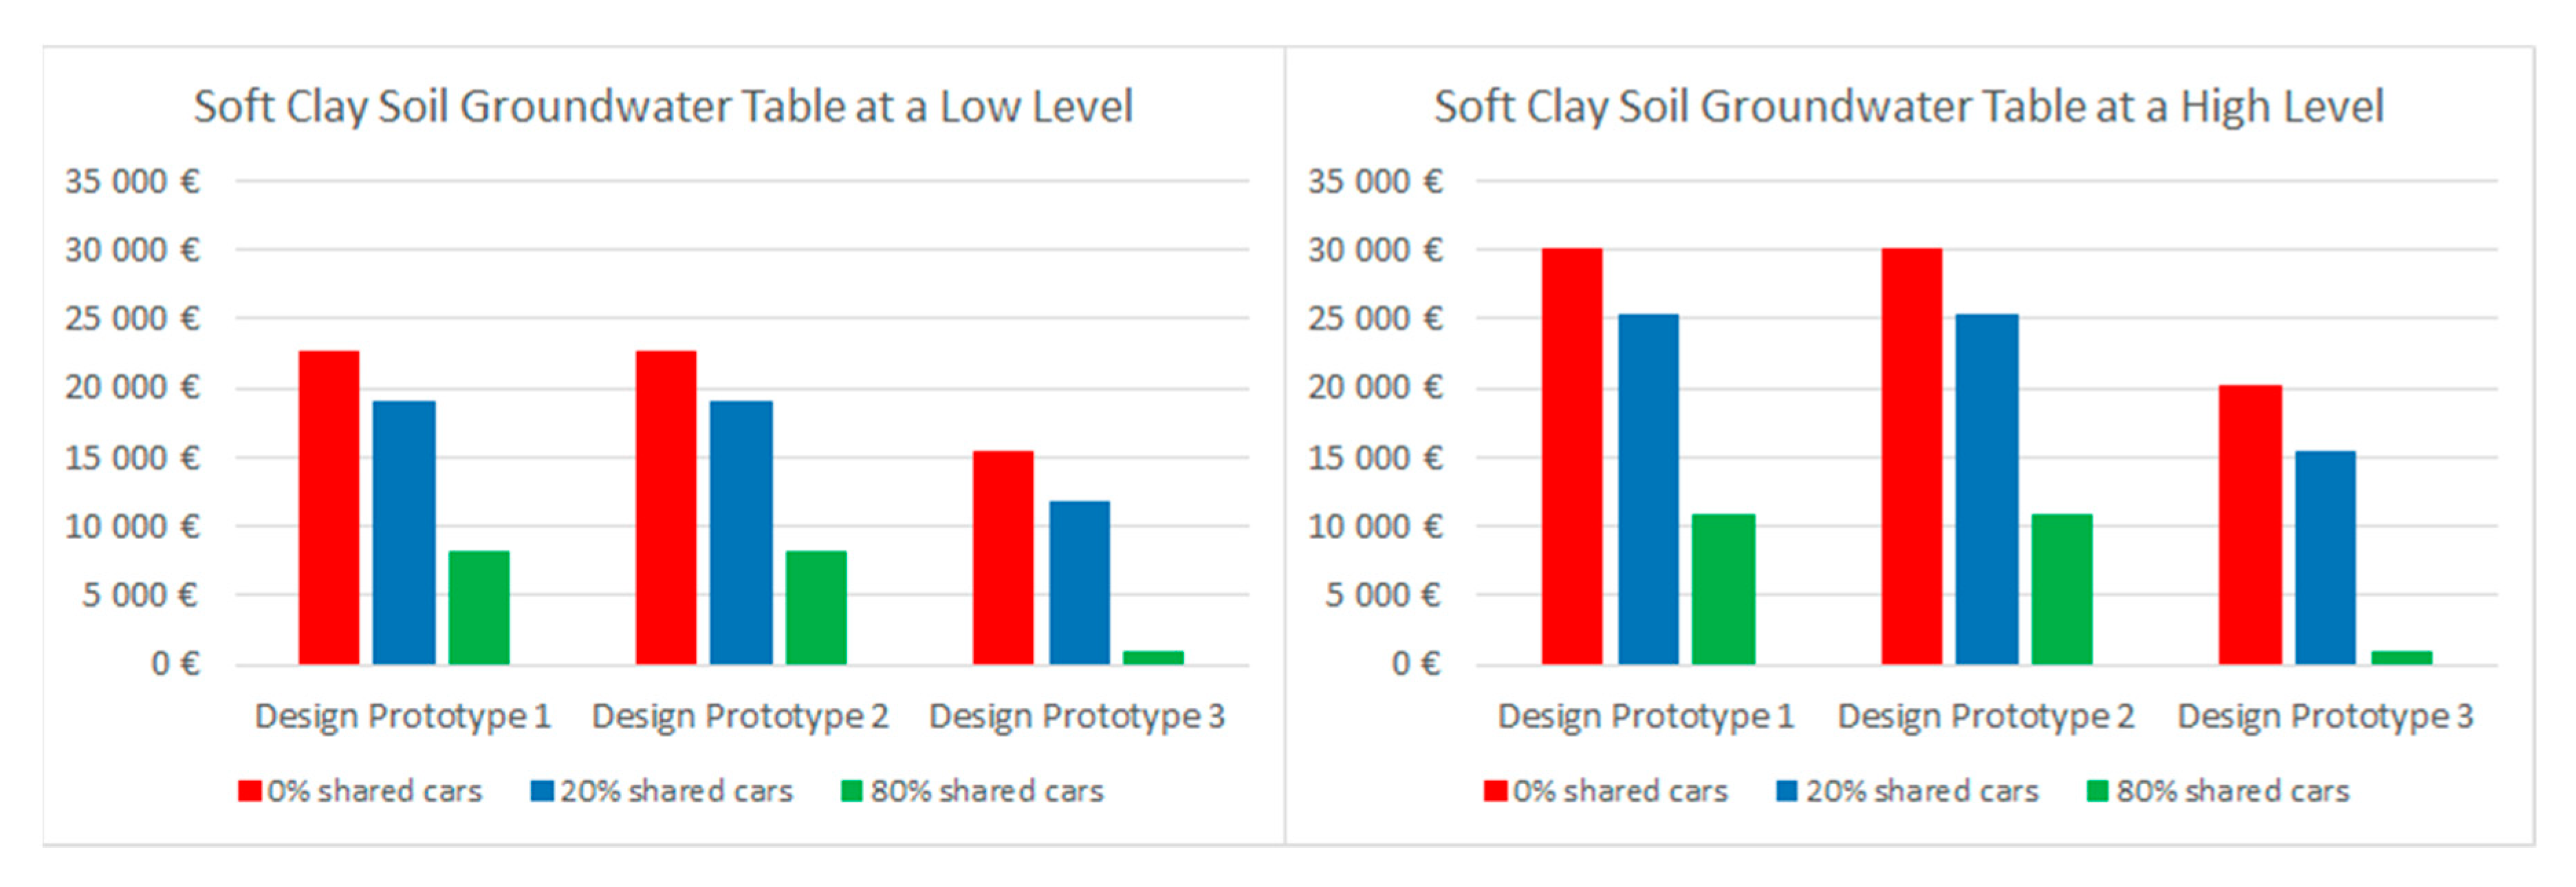
The previous two sections revealed the notably high cost impact of parking structures and Figure 11 seeks to synthesize the obtained results with different proportions of shared cars. The figure shows construction costs per capita when the underground parking garage is constructed on soft clay soil both: (i) when the groundwater table is at a low level and (ii) when the groundwater table is at a high level. For comparison, it is good to notice that the magnitude of the construction costs is at the same level even if the underground parking structure is founded on non-cohesive soil with high bearing capacity. As stated above, the required special structures significantly increase the construction costs in cases where the groundwater table is at a high level. It is also good to pay attention to that Design Prototype 3 allows 20 above ground parking spaces per hectare and, as a result, the construction costs are the same in spite of the groundwater table level. Design Prototype 4 is excluded from the figure as all required parking spaces are accommodated above ground on the streets and driveways.
As construction of parking structures has a notable cost impact, for optimal land use, it is recommended that decisions on the number of parking spaces are rather market-based than regulated in the land use plans. The market-driven approach should make land use more optimal at least in areas with an extensive public transport network (e.g., City of Helsinki), where many residents do not need a car for their daily activities but the required number of parking spaces may turn into a restrictive factor for the size of residential buildings. This would also mean that parking prices are not artificially lowered by embedding part of the construction costs in housing prices but only those who need parking spaces would have to cover the costs.
5. Discussion and Conclusions
In this study, we contribute to the sustainable urban development debate and examine the impact of housing density on infrastructure costs leaning on four hypothetical design prototypes. In these areas, block densities span from 3000 square m per hectare to 27,000 square m per hectare while potential population densities vary from 50 residents per hectare to 1350 residents per hectare. Based on the results, infrastructure costs notably differ between studied design solutions as costs are spanning from some 3000 € per capita to some 52,000 € per capita. The infrastructure costs per capita are the highest in low-density areas and the lowest in high-density areas, if parking is excluded. However, if also construction costs of parking structures are included, the costs per capita are the highest in high-density areas. Considering the notably high cost impact of parking structures and people’s limited willingness to pay for parking, municipally zoned parking requirements in urban areas are likely to result in non-optimal land use.
As expected, comparison of infrastructure costs in different soil conditions revealed poor soil conditions to notably increase the costs per capita, particularly in low-density areas. The higher cost impact on low-density areas occurs because of the lower number of residents while, in the high-density areas, the increased construction costs are allocated to a greater number of residents; thus, resulting in a more moderate increase in costs per capita. In rapidly developing urban areas, developable land is usually scarce and favourable ground conditions are often well exploited; thus, more challenging soil conditions may be the only option that is left for development. Based on the results, it may be concluded that construction in poor soil conditions is only feasible if the floor area ratio and residential densities are relatively high. At the same time, from the cost perspective, low-density projects should be restricted to areas where developable land is not particularly scarce and ground conditions are favourable. Even if this study is restricted to the cost impacts, in decision-making, it is also important to pay attention to market conditions, meaning that high-density projects may only be feasible in such locations where there is adequate demand for housing.
Beyond the direct cost impacts, the number of residents that may be accommodated in urban areas is crucial, in particular, when rapidly developing urban areas are in the focus. As centrally located land for development is scarce, design prototypes with low floor area ratio cannot respond to the needs of rapid urban development. For example, according to recent forecasts on Helsinki Metropolitan Area, the total increase in population from 2017 to 2040 is estimated to be approximately 270,500 residents, equalling to an average yearly increase of 11,760 residents [6]. If population density varies between 1 resident per 20 square m and 1 resident per 60 square m, the yearly increase in demand for housing should vary between some 235,000 and 705,600 square m. Thus, leaning on the design prototypes of this study, correspondingly increasing the housing supply would, depending on the design solution, require annually from 9 to 235 hectares of developable land. Considering the development needs in the long term, nine annual hectares for the development is much easier to allocate than drastically larger area of 235 hectares. Interestingly, the densest design solution would accommodate the housing development needs for the entire forecast period in less land area than the least dense option would require only in one year. However, when interpreting the results, it is good to notice that some of the scenarios may be more realistic than the others. For example, high residential density scenario (1 resident per 20 square m) is more likely in a location that supports Design Prototype 1 than in conjunction with development prototype 4. Similarly, low residential density scenario (1 resident per 60 square m) is more likely in a location that supports Design Prototype 4. Nevertheless, based on the findings, it may concluded that, in centrally located areas, high-density housing should be promoted to allow accommodating a higher number of new residents. This conclusion is also supported beyond the results of this study as global agreements seek to slow down urban sprawl [3], which inevitably speeds up if supply of housing cannot be sufficiently increased in central locations. Furthermore, urban density is relevant in terms of housing affordability as increasing housing supply in central locations can be considered a key measure to dampen the rising housing prices [4].
Also, the importance and benefits of green spaces as a part of urban structure are discussed in this paper. As greenness is seen as an important component of urban land use, in this study, we indicatively explored what are the additional costs per capita if a relatively high amount of green space of 16 square m per resident is required also in the densest areas. We found that, in less dense areas, the additional costs are zero as yard areas fulfil the requirement. At the same time, in the densest design prototype, additional costs of green spaces were at a notable level, varying from some 1000 euros in favourable soil to some 5500 euros per capita in challenging soil conditions. For comparison, costs of underground parking varied from some 10,000 euros to some 40,000 euros per capita, if there were no shared cars. However, costs of parking and greenness are not directly comparable investments as people’s direct willingness to pay for green spaces is even lower than their willingness to pay for parking spaces – very few people would be delighted to pay a fee when entering a public park. Thus, it is necessary that green spaces be provided as public services. Yet, beyond the costs, greenness has a significant impact on people’s well-being and attractiveness of the residential area, which tends to affect positively people’s willingness to pay for housing in the area. Moreover, considering different well-being factors from a wider economic perspective, opportunity cost of not investing in sufficient amount of green spaces is likely to be much higher than the total cost of a sufficient investment in green spaces and the opportunity costs in relation to such investment. As greenness is associated with more attractive neighbourhoods, investing in greenness should create prerequisites for a positive circle of development. Whereas it is hard to find similar positive impacts that could be linked to parking spaces.
At this point, it is also good to recall that the results of this study only provide an example of what the additional green space costs may be if the set requirement for greenness is strictly followed. However, instead of setting strict thresholds for greenness and blindly following them, we suggest that sufficient amount of greenness should be resolved as an area-specific planning task, which is likely to result in better cost efficiency as, in dense areas, sufficient accessibility to green spaces may be ensured in many alternative ways. Also, paying attention to the previously reported quantified economic benefits from urban greenness [38,39], we conclude the costs of urban green spaces to be reasonable relative to achievable benefits and suggest that denser urban structure should not be pursued at the expense of green spaces.
Even though many aspects, such as agglomeration economies, global urban sustainability goals and infrastructure investment cost efficiency, seem to support high urban density, this study revealed a notable obstacle for denser urban housing and rapid development of urban areas, namely municipal requirements for parking structures. More specifically, construction costs of underground parking are in a totally different league than the costs of other components of infrastructure. Even if investment costs in surface parking or above-ground parking structures would be significantly lower than underground parking garages they are not, due to their high opportunity costs, a feasible option in centrally located areas where developable land is scarce. In other words, a notable amount of income is lost if above-ground parking structure is built when, alternatively, the same proportion of land could be used for building a residential high-rise. From business economic point of view, high cost of parking structures would not be an issue if people’s willingness to pay for parking would be higher than the construction costs. However, very few people would be ready to pay full price for their centrally located parking spots, particularly, when public transport works well. At the same time, the political will is to decrease the use of private cars and urge on using public transport and, thus, it is hard to find supporting evidence for conflicting municipally zoned parking requirements. Moreover, the reformation of parking requirements is supported by the ongoing changes in our society, namely increasingly common shared cars that are little by little likely to contribute to decreased demand for urban parking spaces. An important aspect is also that urban parking requirements in their current form seem to be detrimental for the affordability of housing in general. Thus, more market-driven parking approaches presented in Terviö et al. [29] should be seriously considered as an alternative to the current practice. Particularly, such approach should be feasible in the context of cities like the City of Helsinki where the public transport network, including local train, underground, tram and busses, is extensive and constantly evolving.
In conclusion, the central findings of this study are: (i) costs per capita are the lowest in high-density areas, if parking is excluded, (ii) municipally zoned parking requirements potentially lead to non-optimal land use, (iii) economic feasibility in poor soil conditions requires high housing density, (iv) low floor area ratio cannot respond to the needs of rapid urban development and (v) cost of urban greenness is reasonable relative to the reported benefits. Relying on these findings, we suggest that (i) urban density should be promoted but not at the expense of greenness and (ii) construction of parking spaces should rather be market-driven than municipally regulated.
Even if the analysed hypothetical design prototypes are to some extent simplified, they provide a reliable way to analyse the impact of different design solutions to serve the needs of future urban development. As such, this analysis provides a useful insight into the economic reality of urban development. While the contextual background of this study leans on Finnish urban planning framework where public land development is often used, it is possible to apply the approach and findings to similar cities across the world in an attempt to find strategies to more sustainable urban land use.
Author Contributions
Conceptualization, A.K. and A.S.; Methodology, A.K. and A.S.; Validation, A.K. and A.S.; Formal Analysis, A.K.; Investigation, A.K.; Resources, A.K. and A.S.; Data Curation, A.K.; Writing—Original Draft Preparation, A.K.; Writing—Review and Editing, A.K. and A.S.; Visualization, A.K.; Supervision, A.S.; Project Administration, A.K.; Funding Acquisition, A.S. All authors have read and agreed to the published version of the manuscript.
Funding
This work was supported by the Strategic Research Council at the Academy of Finland [decision number: 303618, project: URMI—Urbanization, Mobilities and Immigration]. The main author would also like to thank the Finnish Foundation for Technology Promotion for funding.
Acknowledgments
We would like to acknowledge Panu Lehtovuori for his kind help in planning appropriate design prototypes for this research. Furthermore, we would like to show our gratitude to architectural student Jaakko Muikku for his efforts to visualize the design prototypes. Mirva Koskinen we would like to thank for her kind consultation on the ground conditions in the City of Helsinki.
Conflicts of Interest
The authors declare no conflict of interest.
References
- Melo, P.C.; Graham, D.J.; Noland, R.B. A meta-analysis of estimates of urban agglomeration economies. Reg. Sci. Urban Econ. 2009, 39, 332–342. [Google Scholar] [CrossRef] [Green Version]
- Thisse, J.-F. Economics of Agglomeration. Oxford Research Encyclopedia of Economics and Finance; Oxford University Press: Oxford, UK, 2019. [Google Scholar] [CrossRef]
- United Nations. New Urban Agenda. In Proceedings of the Habitat III—United Nations Conference on Housing and Sustainable Urban Development, Quito, Ecuador, 17–20 October 2016; Habitat III Secretariat: Quito, Ecuador, 2017. Available online: http://habitat3.org/the-new-urban-agenda/ (accessed on 18 July 2019).
- Been, V.; Ellen, I.G.; O’Regan, K. Supply Skepticism: Housing Supply and Affordability. Hous. Policy Debate 2019, 29, 25–40. [Google Scholar] [CrossRef]
- United Nations. World Urbanization Prospects: The 2018 Revision (ST/ESA/SER.A/420), Department of Economic and Social Affairs, Population Division; United Nations: New York, NY, USA, 2019. [Google Scholar]
- Aluekehittämisen Konsulttitoimisto MDI. Kooste Kymmenen Kaupunkiseudun Väestönkehityksestä Vuoteen 2040 Population Projection Until Year 2040 for Ten Finnish Urban Areas. Available online: http://www.mdi.fi/content/uploads/2019/02/10-kaupunkiseudun-_vaestoennuste_kooste.pdf (accessed on 18 July 2019). (In Finnish).
- Fuller, R.J.; Crawford, R.H. Impact of past and future residential housing development patterns on energy demand and related emissions. J. Hous. Built Environ. 2011, 26, 165–183. [Google Scholar] [CrossRef]
- Glaeser, E.L.; Kahn, M.E. The greenness of cities: Carbon dioxide emissions and urban development. J. Urban Econ. 2010, 67, 404–418. [Google Scholar] [CrossRef] [Green Version]
- Norman, J.; MacLean, H.L.; Kennedy, C.A. Comparing High and Low Residential Density: Life-Cycle Analysis of Energy Use and Greenhouse Gas Emissions. J. Urban Plan. Dev. 2006, 132, 10–21. [Google Scholar] [CrossRef]
- Heinonen, J.; Jalas, M.; Juntunen, J.K.; Ala-Mantila, S.; Junnila, S. Situated lifestyles: I. How lifestyles change along with the level of urbanization and what the greenhouse gas implications are—A study of Finland. Environ. Res. Lett. 2013, 8, 025003. [Google Scholar] [CrossRef]
- Valkila, N.; Saari, A. Attitude–behaviour gap in energy issues: Case study of three different Finnish residential areas. Energy Sustain. Dev. 2013, 17, 24–34. [Google Scholar] [CrossRef]
- Carruthers, J.I.; Ulfarsson, G.F. Does ‘Smart Growth’ Matter to Public Finance? Urban Stud. 2008, 45, 1791–1823. [Google Scholar] [CrossRef] [Green Version]
- Carruthers, J.I.; Ulfarsson, G.F. Urban Sprawl and the Cost of Public Services. Environ. Plan. B Plan. Des. 2003, 30, 503–522. [Google Scholar] [CrossRef]
- Holcombe, R.G.; Williams, D.W. The Impact of Population Density on Municipal Government Expenditures. Public Financ. Rev. 2008, 36, 359–373. [Google Scholar] [CrossRef]
- Vihola, J.; Kurvinen, A. Municipal Economics of Regional Development—Infill versus Greenfield Development. RE-CITY: Future City—Combining Disciplines. Datutop 2016, 34, 59–82. [Google Scholar]
- Land Use and Building Act 132/1999 (Unofficial Translation). Available online: https://www.finlex.fi/fi/laki/kaannokset/1999/en19990132.pdf (accessed on 28 December 2019).
- Kanninen, V.; Bäcklund, P. Kansalaisosallistumisen institutionaaliset rajat Institutional boundaries of civil participation. In Kansalaiset Kaupunkia Kehittämässä Citizens Developing the City; Bäcklund, P., Häkli, J., Schulman, H., Eds.; Tampere University Press: Tampere, Finland, 2017; pp. 16–33. ISBN 978-952-03-0623-6. [Google Scholar]
- Mäntysalo, R.; Jarenko, K.; Nilsson, K.; Saglie, I. Legitimacy of Informal Strategic Urban Planning—Observations from Finland, Sweden and Norway. Eur. Plan. Stud. 2015, 23, 349–366. [Google Scholar] [CrossRef]
- Ministry of the Environment. Agreements on Land Use, Housing and Transport. Available online: https://www.ym.fi/en-US/Land_use_and_building/Steering_of_land_use_planning/Landuse_housing_and_transport_letters_of_intent (accessed on 23 December 2019).
- The Association of Finnish Local and Regional Authorities. Maapolitiikan Opas Land Policy Guide. Available online: https://www.kuntaliitto.fi/tilastot-ja-julkaisut/verkko-oppaat/maapolitiikan-opas (accessed on 30 December 2019). (In Finnish).
- Valtonen, E. Promotion of local public objectives with public land development—Is it effective? Aalto Univ. Publ. Ser. Dr. Diss. 2019, 60. [Google Scholar]
- City of Helsinki. Katutilan Mitoitus. Suunnitteluohjeet Helsingin Kaupungille Dimensioning of Street Areas. Planning Instructions for the City of Helsinki. Available online: https://www.hel.fi/static/hkr/julkaisut/ohjeet/katutila_mitoitus.pdf (accessed on 18 July 2019). (In Finnish).
- Koivisto, P. Optiset Liityntäverkot: Suunnittelu, Asennus Ja Testaus Optical Access Networks: Planning, Installation and Testing; Sähköinfo Oy: Espoo, Finland, 2011. (In Finnish) [Google Scholar]
- Koskelainen, L.; Saarela, R.; Sipilä, K. Kaukolämmön Käsikirja Handbook of District Heating; Energiateollisuus ry: Helsinki, Finland, 2006. (In Finnish) [Google Scholar]
- City Planning Department of Helsinki. Asuintonttien Pysäköintipaikamäärien Laskentaohjeet Guidelines for Calculating the Number of Parking Spaces in Residential Areas. Available online: https://dev.hel.fi/paatokset/media/att/d8/d8c0aa3cb50314d6f2f638b034aa66300ddd02fd.pdf (accessed on 18 July 2019). (In Finnish).
- Soininvaara, O. Lisää markkinoita asuntomarkkinoille More market for housing market. Finn. Econ. Pap. 2016, 112, 252–257. [Google Scholar]
- Antonson, H.; Hrelja, R.; Henriksson, P. People and parking requirements: Residential attitudes and day-to-day consequences of a land use policy shift towards sustainable mobility. Land Use Policy 2017, 62, 213–222. [Google Scholar] [CrossRef]
- City of Helsinki. The Most Functional City in the World: Helsinki City Strategy 2017–2021. Available online: https://www.hel.fi/helsinki/en/administration/strategy/strategy/city-strategy/ (accessed on 12 June 2019).
- Terviö, M.; Murto, P.; Harjunen, O.; Nokso-Koivisto, O. Markkinaehtoisen Pysäköinnin Perusteet Basics of Market-Driven Parking. Aalto Economic Institute. Available online: https://www.hel.fi/static/liitteet/kaupunkiymparisto/kerrokantasi/pysakointi-uudistus/markkinaehtoisen-pysakoinnin-perusteet-raportti.pdf (accessed on 18 July 2019). (In Finnish).
- Marsden, G. The evidence base for parking policies—A review. Trans. Policy 2006, 13, 447–457. [Google Scholar] [CrossRef] [Green Version]
- McConnell, C.R.; Brue, S.L.; Flynn, S.M. Economics, 18th ed.; McGraw-Hill: New York, NY, USA, 2009. [Google Scholar]
- Dzhambov, A.M.; Dimitrova, D.D.; Dimitrakova, E.D. Association between residential greenness and birth weight: Systematic review and meta-analysis. Urban For. Urban Green. 2014, 13, 621–629. [Google Scholar] [CrossRef]
- Eriksson, C.; Lind, T.; Ekström, S.; Gruzieva, O.; Georgelis, A.; Bergström, A.; Lõhmus, M. Neighbourhood greenness and birth outcomes in a Swedish birth cohort—A short communication. Health Place 2019, 57, 200–203. [Google Scholar] [CrossRef]
- Dadvand, P.; Pujol, J.; Macià, D.; Martínez-Vilavella, G.; Blanco-Hinojo, L.; Mortamais, M.; Alvarez-Pedrerol, M.; Fenoll, R.; Esnaola, M.; Dalmau-Bueno, A.; et al. The Association between Lifelong Greenspace Exposure and 3-Dimensional Brain Magnetic Resonance Imaging in Barcelona Schoolchildren. Environ. Health Perspect. 2018, 126, 027012. [Google Scholar] [CrossRef] [Green Version]
- Beyer, K.M.M.; Kaltenbach, A.; Szabo, A.; Bogar, S.; Nieto, F.J.; Malecki, K.M. Exposure to Neighborhood Green Space and Mental Health: Evidence from the Survey of the Health of Wisconsin. Int. J. Environ. Res. Public Health 2014, 11, 3453–3472. [Google Scholar] [CrossRef] [Green Version]
- Villeneuve, P.J.; Jerrett, M.; Su, J.G.; Burnett, R.T.; Chen, H.; Wheeler, A.J.; Goldberg, M.S. A cohort study relating urban green space with mortality in Ontario, Canada. Environ. Res. 2012, 115, 51–58. [Google Scholar] [CrossRef] [PubMed]
- Christian, H.; Knuiman, M.; Divitini, M.; Foster, S.; Hooper, P.; Boruff, B.; Bull, F.; Giles-Corti, B.A. Longitudinal Analysis of the Influence of the Neighborhood Environment on Recreational Walking within the Neighborhood: Results from RESIDE. Environ. Health Perspect. 2017, 125, 077009. [Google Scholar] [CrossRef] [PubMed]
- Kardan, O.; Gozdyra, P.; Misic, B.; Moola, F.; Palmer, L.J.; Paus, T.; Berman, M.G. Neighborhood greenspace and health in a large urban center. Sci. Rep. 2015, 5, 11610. [Google Scholar] [CrossRef] [PubMed] [Green Version]
- Vivid Economics. Natural Capital Accounts for Public Green Space in London. Report Prepared for Greater London Authority, National Trust and Heritage Lottery Fund. Available online: https://www.london.gov.uk/what-we-do/environment/parks-green-spaces-and-biodiversity/green-infrastructure/natural-capital-account-london (accessed on 13 June 2019).
- Musolino, G.; Panuccio, P. Planning instruments in Italy and the UK: Private and public spaces for emergency events in urban areas. In Safety and Security Engineering V; Garzia, F., Brebbia, C.A., Guarascio, M., Eds.; WIT Press: Southampton, UK, 2013; pp. 565–574. [Google Scholar] [CrossRef] [Green Version]
- Koskinen, M.; Urban Environment, Helsinki, Finland; Kurvinen, A.; Tampere University, Tampere, Finland. Personal communication, 2018.
- Laakeristo, I.; Peab Oy, Helsinki, Finland; Saari, A.; Tampere University, Tampere, Finland. Personal communication, 2019.
Figure 1.
Design prototypes.

Figure 2.
Area density measured by floor area ratio and potential number of residents in the cases of different residential densities.
Figure 2.
Area density measured by floor area ratio and potential number of residents in the cases of different residential densities.

Figure 3.
Need for structured parking as requirement for parking spaces is one (1) parking space per 120 square m and one (1) shared car accounts for five (5) private cars.
Figure 3.
Need for structured parking as requirement for parking spaces is one (1) parking space per 120 square m and one (1) shared car accounts for five (5) private cars.

Figure 4.
The need of additional green spaces in design prototypes as the residential density varies from 1 resident per 60 square m to 1 resident per 20 square m and the threshold for green spaces is 16 square m per resident.
Figure 4.
The need of additional green spaces in design prototypes as the residential density varies from 1 resident per 60 square m to 1 resident per 20 square m and the threshold for green spaces is 16 square m per resident.

Figure 5.
Infrastructure costs per capita when building on non-cohesive soil with high bearing capacity and all cars are private. (A) Groundwater Table at a High Level, (B) Groundwater Table at a Lower Level. Notes: The black column on the left indicates number of residents per hectare in the cases of different design prototypes and different residential densities. Number of residents is reported per square metre. The multicolour column on the right denotes the costs of infrastructure in the case of non-cohesive soil with high bearing capacity. The upper figure (A) depicts the results when groundwater table is at a high level and the lower figure (B) when groundwater table is at a lower level. The reported costs include project tasks (36%) and VAT (24%).

Figure 6.
Infrastructure costs per capita when building on non-cohesive soil with high bearing capacity and 20 percent of cars are shared. (A) Groundwater Table at a High Level, (B) Groundwater Table at a Lower Level. Notes: The black column on the left indicates number of residents per hectare in the cases of different design prototypes and different residential densities. Number of residents is reported per square metre. The multicolour column on the right denotes the costs of infrastructure in the case of non-cohesive soil with high bearing capacity. The upper figure (A) depicts the results when groundwater table is at a high level and the lower figure (B) when groundwater table is at a lower level. The reported costs include project tasks (36%) and VAT (24%).

Figure 7.
Infrastructure costs per capita when building on non-cohesive soil with high bearing capacity and 80 percent of cars are shared. (A) Groundwater Table at a High Level, (B) Groundwater Table at a Lower Level. Notes: The black column on the left indicates number of residents per hectare in the cases of different design prototypes and different residential densities. Number of residents is reported per square metre. The multicolour column on the right denotes the costs of infrastructure in the case of non-cohesive soil with high bearing capacity. The upper figure (A) depicts the results when groundwater table is at a high level and the lower figure (B) when groundwater table is at a lower level. The reported costs include project tasks (36%) and VAT (24%).

Figure 8.
Infrastructure costs per capita when building on soft clay soil with low bearing capacity and all cars are private. (A) Groundwater Table at a High Level, (B) Groundwater Table at a Lower Level. Notes: The black column on the left indicates number of residents per hectare in the cases of different design prototypes and different residential densities. Number of residents is reported per square metre. The multicolour column on the right denotes the costs of infrastructure in the case of soft clay soil with low bearing capacity. The upper figure (A) depicts the results when groundwater table is at a high level and the lower figure (B) when groundwater table is at a lower level. The reported costs include project tasks (36%) and VAT (24%).

Figure 9.
Infrastructure costs per capita when building on soft clay soil with low bearing capacity and 20 percent of cars are shared. (A) Groundwater Table at a High Level, (B) Groundwater Table at a Lower Level. Notes: The black column on the left indicates number of residents per hectare in the cases of different design prototypes and different residential densities. Number of residents is reported per square metre. The multicolour column on the right denotes the costs of infrastructure in the case of soft clay soil with low bearing capacity. The upper figure (A) depicts the results when groundwater table is at a high level and the lower figure (B) when groundwater table is at a lower level. The reported costs include project tasks (36%) and VAT (24%).

Figure 10.
Infrastructure costs per capita when building on soft clay soil with low bearing capacity and 80 percent of cars are shared. (A) Groundwater Table at a High Level, (B) Groundwater Table at a Lower Level. Notes: The black column on the left indicates number of residents per hectare in the cases of different design prototypes and different residential densities. Number of residents is reported per square metre. The multicolour column on the right denotes the costs of infrastructure in the case of soft clay soil with low bearing capacity. The upper figure (A) depicts the results when groundwater table is at a high level and the lower figure (B) when groundwater table is at a lower level. The reported costs include project tasks (36%) and VAT (24%).

Figure 11.
Construction costs of parking per capita when average residential density is 1 person per 45 square m.
Figure 11.
Construction costs of parking per capita when average residential density is 1 person per 45 square m.

© 2020 by the authors. Licensee MDPI, Basel, Switzerland. This article is an open access article distributed under the terms and conditions of the Creative Commons Attribution (CC BY) license (http://creativecommons.org/licenses/by/4.0/).
Share and Cite
MDPI and ACS Style
Kurvinen, A.; Saari, A. Urban Housing Density and Infrastructure Costs. Sustainability 2020, 12, 497. https://0-doi-org.brum.beds.ac.uk/10.3390/su12020497
AMA Style
Kurvinen A, Saari A. Urban Housing Density and Infrastructure Costs. Sustainability. 2020; 12(2):497. https://0-doi-org.brum.beds.ac.uk/10.3390/su12020497
Chicago/Turabian StyleKurvinen, Antti, and Arto Saari. 2020. "Urban Housing Density and Infrastructure Costs" Sustainability 12, no. 2: 497. https://0-doi-org.brum.beds.ac.uk/10.3390/su12020497
Note that from the first issue of 2016, this journal uses article numbers instead of page numbers. See further details here.