Article

Natural Capital Evolution and Driving Forces in Energy-Rich and Ecologically Fragile Regions: A Case Study of Ningxia Province, China

School of Environment Science and Spatial Informatics, China University of Mining and Technology, Xuzhou 221116, China
*
Author to whom correspondence should be addressed.
Sustainability 2020, 12(2), 562; https://0-doi-org.brum.beds.ac.uk/10.3390/su12020562
Submission received: 7 December 2019 / Revised: 24 December 2019 / Accepted: 7 January 2020 / Published: 11 January 2020

Abstract

:
Ningxia Province is rich in energy but fragile in ecology. How to coordinate sustainable utilization of natural capital and the fragile ecological environment is a significant guarantee for social-economic development. This study uses the improved three-dimensional ecological footprint to characterize the utilization status of natural capital flows and stocks in Ningxia Province from 2004 to 2017. Additionally, the driving factors behind changes in the natural capital stock are revealed by the partial least squares method (PLS). The results are as follows: (1) From 2004 to 2017, ecological footprint increased rapidly in Ningxia Province at an annual rate of 4.52%, resulting in a increase of the ecological deficit from 1.64 to 3.85 gha/cap at an annual rate of 6.8%, among which, Yinchuan city and Shizuishan city had the largest ecological deficit, while Guyuan city basically maintained ecological surplus. The fossil energy land and cropland were the main components of ecological footprint. (2) The consumption of capital stock in Ningxia Province continued to grow at an annual rate of 3.12%, from a value of 2.28 times overusing the existing area in 2004, increasing to 3.41 times in 2017. While the EF size increased slightly with an annual rate of 1.95%. The capital stock consumption was concentrated in Yinchuan and Shizuishan, and the capital flow consumption was concentrated in Wuzhong, Guyuan, and Zhongwei. (3) The capital flows of forest land and built-up land basically meet consumption demand, while the capital stock occupation of grassland, water and fossil energy land was serious. By 2017, the capital flow of cropland could basically satisfy people’s consumption demand. (4) The urbanization rate, GDP, the secondary industry output value and per capita consumption expenditure of urban residents were the main influence factors on the natural capital stock consumption. These findings not only are of real significance in promoting the coordinated development between economy and natural capital utilization in Ningxia Province but also have policy implications in improving the utilization efficiency of natural capital in energy-rich ecologically fragile regions.

1. Introduction

Natural capital refers to the natural resources or environmental assets that provide the materials and services needed for the sustainable development of a region’s social economy [1,2], it is, therefore, the space carrier and material basis for realizing sustainable development. Over the past decade, with the rapid development of the global economic industrialization, social urbanization, and the extensive use of powerful scientific and technological means, human exploitation of resources, ecological destruction, environmental quality reduction, and occupation of space have reached an unprecedented scale [3,4]. Under the current severe resource and environmental problems, natural capital has become a limiting and irreplaceable factor that affects human welfare and regional sustainable development [5,6]. At present, eco-economics has developed a consensus that the minimum level of sustainable development is preventing the stock of natural capital from decreasing [7,8], and the development of low-carbon economy has become an inevitable choice for China and the whole world to achieve sustainable development. But the relatively slow rate of resource renewal is increasingly strenuous to meet the expanding material needs of human beings [9]. Therefore, how to scientifically and accurately quantify natural capital endowment and maintain the minimum threshold of natural capital stock is an important basis and prerequisite for easing the contradiction between human social development and natural resources.
Recognizing the importance of sustainable development has spurred the creation of a number of theories and methods that purport to capture natural capital utilization, such as ecological footprint [10,11], real savings [12], emergy analysis [13,14], life-cycle assessment [15,16], and ecosystem services accounting [17]. Among them, the ecological footprint (EF) method proposed by Rees and his student [18,19] has become one of the most popular and widespread indicators for sustainability assessment and resource management. As a method of natural resource accounting from the ecological perspective, the ecological footprint model has experienced the evolution process from one-dimension to two-dimension and then to three-dimension. One-dimensional model innovatively introduces the concept of ecological productive land that maintains human living needs while absorbing pollution caused by human activities. The two-dimensional model introduces the dimension of ecological capacity to reflect the extent to which human beings utilize natural resources by quantitative measurement of the gap between supply and demand. However, the traditionally two-dimensional ecological footprint only involves the important role of forest carbon sink, regardless of the function of other land use types. Additionally, it fails to track the human-induced depletion of natural capital stocks [5] owing to the lack of corresponding indicators to explain its overload degree.
In order to solve this problem, Niccolucci et al. [20] established the three-dimensional ecological footprint model (3D EF model), introducing ecological footprint depth (EF depth) and ecological footprint size (EF size) indexes to characterize the level of natural capital stocks and flows. The former refers to the natural capital amount existing in physical form in a geographical space at any particular time. The latter refers to the output of natural capital in a geographical space at a certain time [21]. Therefore, 3D EF model can not only explain horizontally whether the utilization of natural resources is overloaded, but also vertically explain the extent of overload [20]. However, Niccolucci et al.’s 3D EF method is only applicable to a single land use type. When different land types are accumulated, the EF depth would be underestimated and EF size would be overestimated [22]. In addition, the index of footprint depth can only represent the extent to which natural resource consumption occupies capital stock in the state of ecological deficit (EF > BC), but it cannot measure the extent to which resource consumption occupies capital flow and its balance in the state of ecological surplus (EF < BC). Therefore, Fang and his colleagues [23,24,25] improved the Niccolucci et al.’s 3D EF model by separately measuring the ecological deficit data of each biological productive land type, and further proposed the occupancy rate of natural capital flow ( w f l o w ) and the ratio of natural capital stocks to capital flows ( w f l o w s t o c k ) to respectively represent the actual utilization of natural capital by human beings when the capital flow is not completely occupied (ecological surplus, EF < BC) and completely occupied (ecological deficit, EF > BC).
Ningxia Province is a typical energy-rich and ecologically fragile region in China [26]. At present, more than 50 kinds of mineral resources have been discovered, including coal, gypsum, oil, natural gas, and clay quartz. By 2017, the regional gross domestic product (GDP) was 370 billion USD, and the output value of the energy-intensive industry accounted for 53.26% of the total annual industrial output value [27]. The population reached 6.88 million, of which 4.05 million, up to 58.88% [28], were in urban areas. The rapid growth of the economy and population has over-consumed natural resources and aggravated pressure on the environment, resulting in the prominent contradiction between ecological environment and economic development in Ningxia. The most typical case in recent years has been the pollution incident in the hinterland of Tengger Desert caused by pollution discharge from Zhongwei industrial park [29]. In order to improve the environment and promote local sustainable development, a series of large-scale ecological restoration projects have been carried out. By 2017, the area of soil erosion in Ningxia decreased by 47% [28], and the forest coverage rate increased to 28.65% [30]. However, it should be noted that the conflict between the increasing demand and the limited supply of resources is still intensifying. Therefore, based on the 3D EF model, this paper analyzes the dynamic change of the EF and EC in Ningxia Province from 2004 to 2017, and then comprehensively evaluates the resource utilization and consumption situation by adopting the EF depth and EF size. Further, the PLS model was constructed to explore the main driving factors and optimization paths that influenced the natural capital evolution, aiming to provide a reference for establishing and fulfilling sustainable development policy and promoting regional ecological civilization construction in energy-rich ecologically fragile regions.

2. Study Area and Data Sources
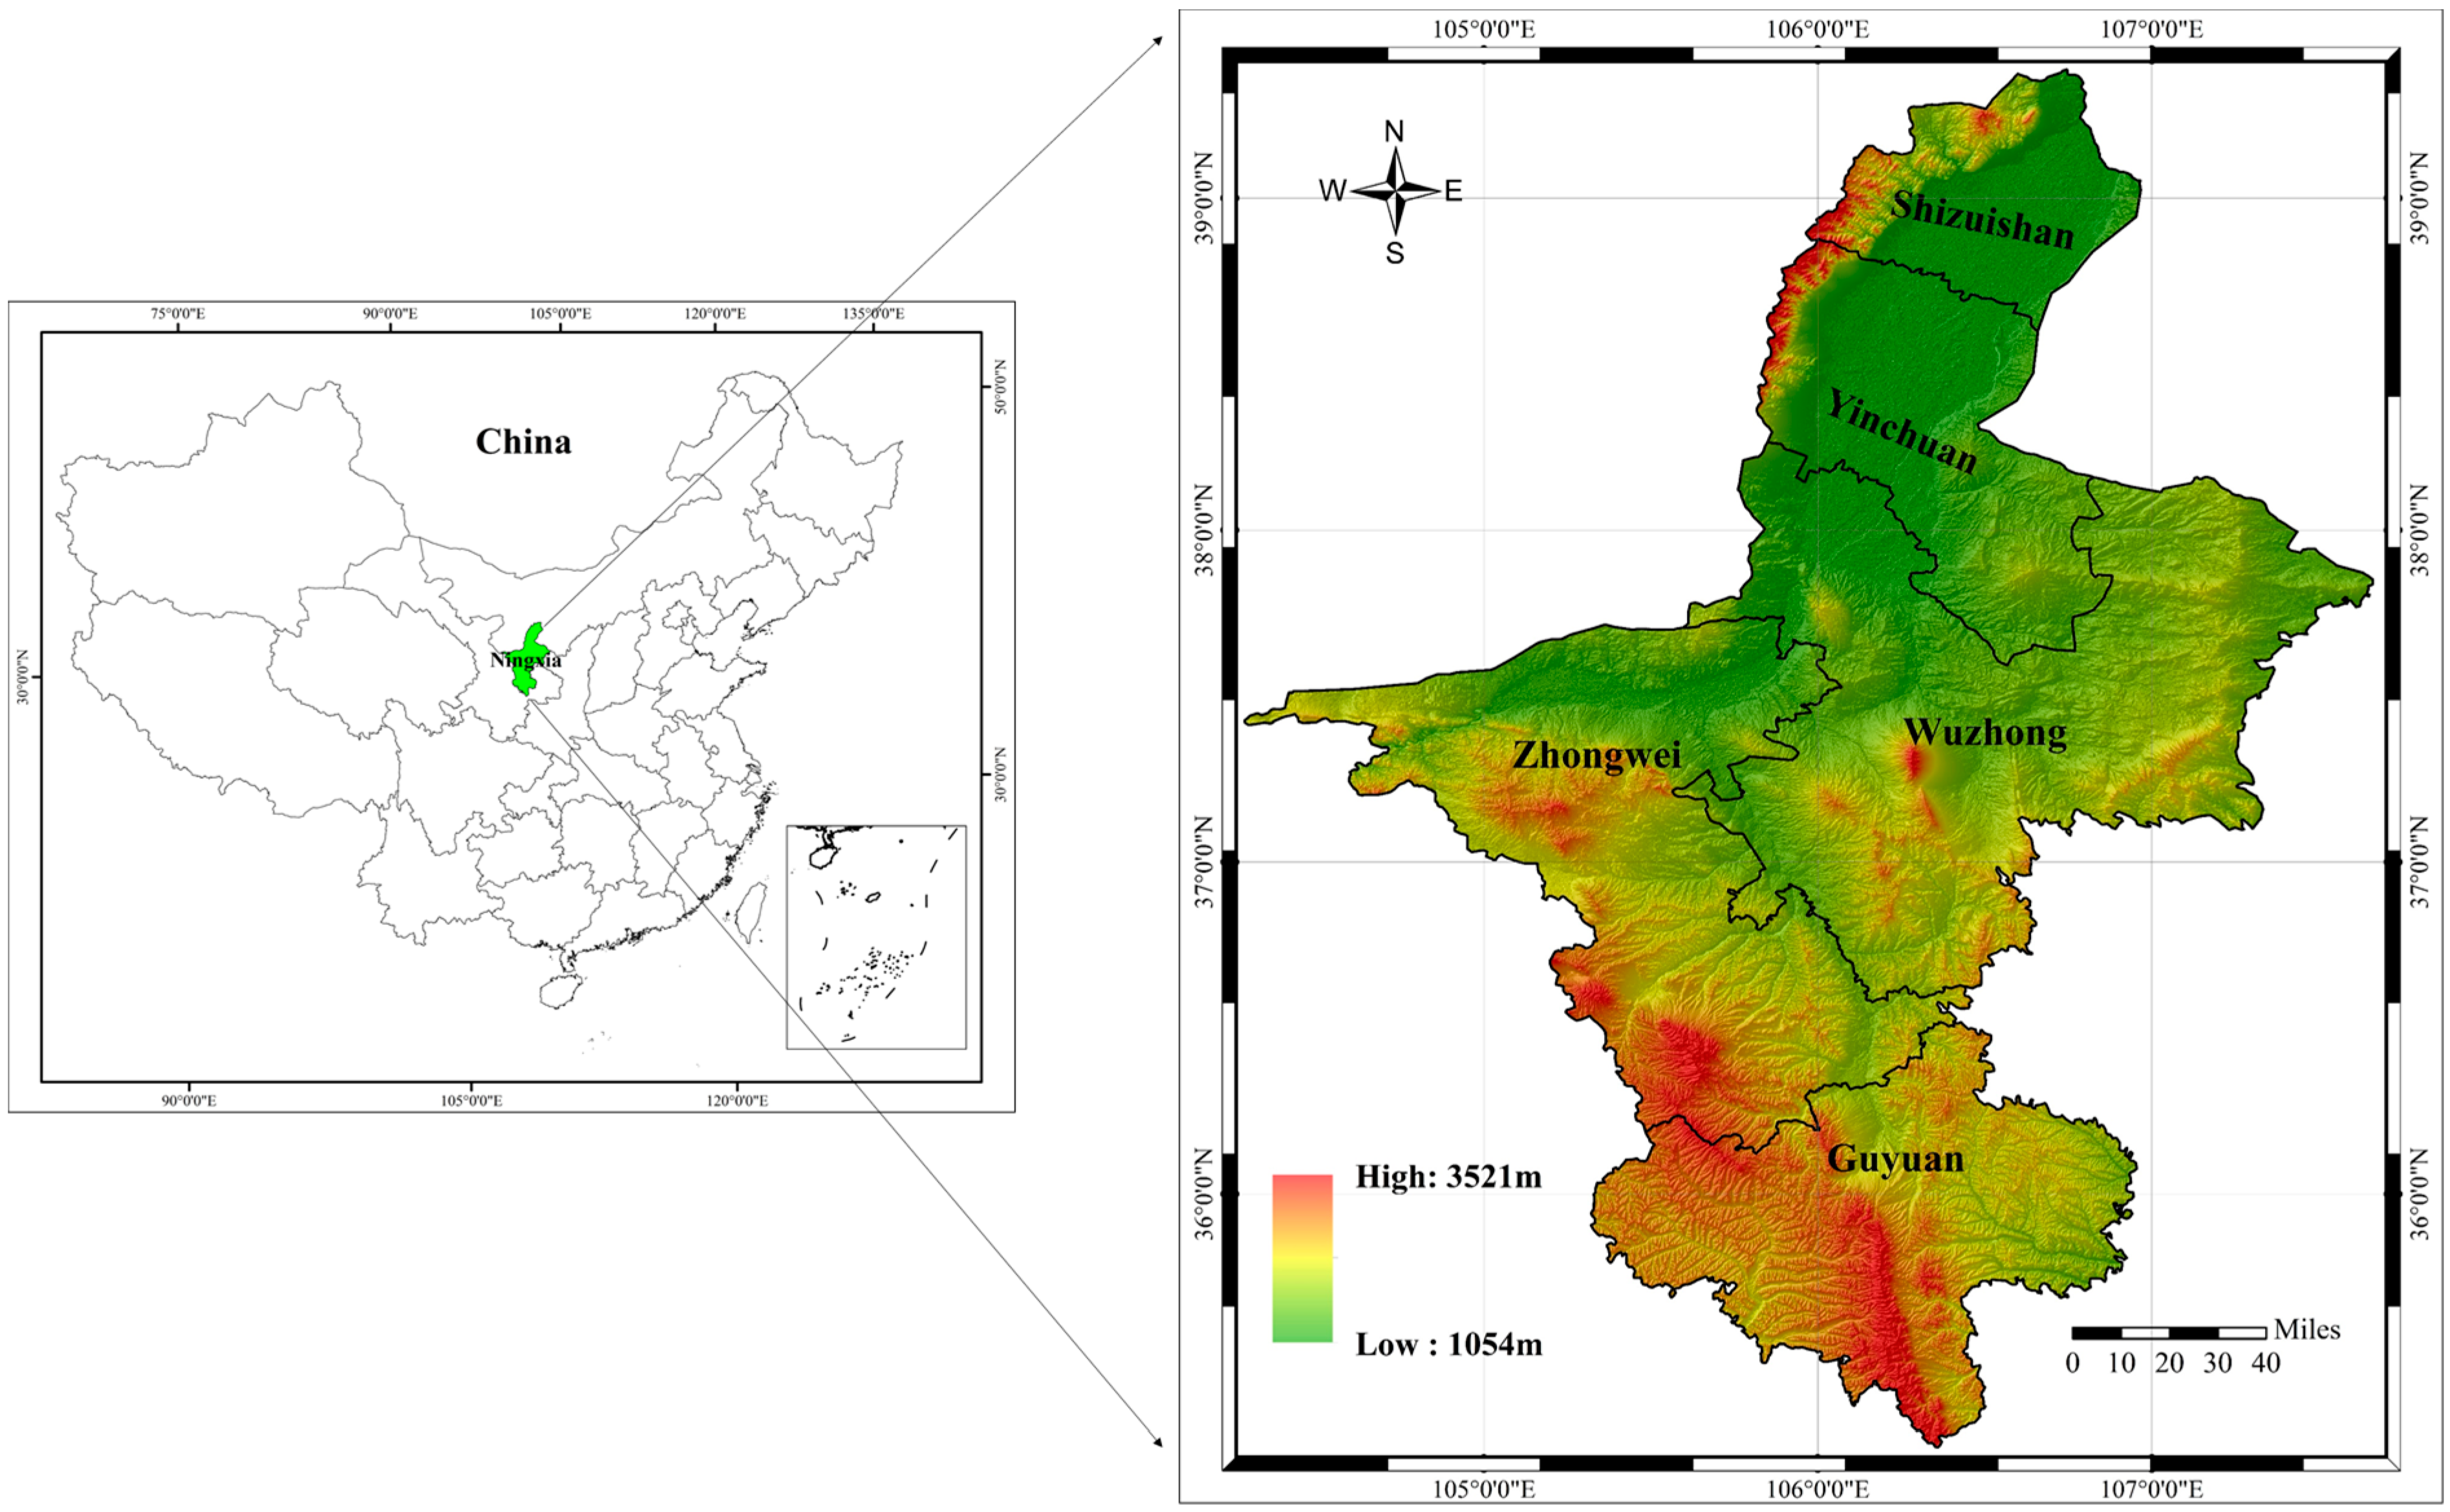
2.1. Study Area

Ningxia Province is located in the middle and upper reaches of the Yellow River and the transition zone between Loess Plateau and desert. The provincial area is 66,400 km2, including Yinchuan city, Shizuishan city, Wuzhong city, Guyuan city, and Zhongwei city (Figure 1). The average annual precipitation and evaporation are approximately 305 and 1800 mm, respectively, belonging to the typical temperate continental arid and semi-arid climate. The terrain of this region is complex and diverse, with the distribution of Helan Mountain, Ordos Plateau, Loess Plateau, and Liupan Mountain from north to south. Additionally, Ningxia is a transitional region from the agricultural area to the animal husbandry area. By 2017, the area of grassland, cropland, and forest land separately accounted for 31.4%, 19.5%, and 11.6% of the total area. The grassland is the main land use type.

2.2. Data Sources

Because Zhongwei county was divided from Wuzhong city to establish the Zhongwei city in 2003, uniform data of five cities from Ningxia Statistical Yearbook are available from 2004. Therefore, in order to keep the data consistent, the time series of 2004–2017 were selected for the calculation and analysis. Further data information and description are shown in Table 1.

3. Methods

3.1. EF and EC

The grassland carbon storage accounts for 16% of global terrestrial surface vegetation storage, second only to forestland (77%) [33], and also plays an important role in absorbing carbon dioxide, especially in arid and semi-arid regions where grassland dominates the main utilization pattern. Therefore, considering the joint role of forest land and grassland in carbon sinks, Xie’s [34] revised ecological footprint model was adopted to calculate the ecological footprint and ecological capacity of fossil energy land, which more scientifically and comprehensively reflects the carbon storage of terrestrial surface vegetation.
The ecological footprint calculation of cropland, forest land, grassland, water, and built-up land is as follows:
E F = j = 1 5 i = 1 n ( r i × a i ) = j = 1 5 i = 1 n ( r j × c i p i )
where EF is the total ecological footprint (gha). c i is the amount of product extracted in a region, p i is the world-average yield for product extraction, r j is the equivalence factor for a given land use type, a i is the ecologically productive area from the ith consumption item.
The ecological footprint calculation of fossil energy land improved by Xie [34] is as follows:
E F j = ( E F c e 1 + E F c e 2 ) = ( C c e × H c e × C d c e × P e r f E P f ¯ + C c e × H c e × C d c e × P e r g E P g ¯ )
where E F c e 1 and E F c e 2 are the ecological footprints of a certain fossil energy attributed to forest land and grassland respectively (gha), C c e is the consumption of a certain fossil energy (t), H c e is the coefficient of combustion calorific value (TJ/103t), C d c e is the carbon emission coefficient (tc/TJ), P e r f and P e r g are, respectively, the proportion of carbon storage of forest land and grassland in terrestrial ecosystem storage (82.72% and 17.28%, respectively), E P f ¯ and E P g ¯ are, respectively, the average carbon absorption capacity of global forest land and grassland (t/gha).
The ecological capacity calculation of cropland, forest land, grassland, water, and built-up land is as follows:
E C = a j × r j × y j
where EC is the total ecological capacity (gha), a j represents the per capita area of the biologically productive land for items of the jth category (gha), y j is the yield factor.
The improved ecological footprint calculation of fossil energy land is as follows:
E C j = ( E C c e 1 + E C c e 2 ) = ( A f × e P f E P f ¯ × e F 1 + A g × e P g E P g ¯ × e F 2 )
where E C c e 1 and E C c e 2 are the ecological capacity of fossil energy land attributed to the forest land and grassland separately (gha). A f and A g are the area of local forest land and grassland separately (gha), e P f and e P g are the average carbon absorption capacity of local forest land and grassland respectively (t/gha), E P f ¯ and E P g ¯ are the average carbon absorption capacity of forest land and grassland globally (t/gha), e F 1 and e F 2 are the equivalence factors of forest land and grassland respectively.

3.2. Improved Three-Dimensional Ecological Footprint Model

Fang and his colleagues [23,24,25] improved the existing 3D EF model by accurately calculating the regional ecological deficit of each land use type rather than just the final accumulation. Additionally, using improved EF formula of fossil energy makes it available to obtain the actual occupancy of forest land and grassland by fossil energy consumption, following the formulas:
E F d e p t h , r e g i o n = 1 + E D r e g i o n E C = 1 + j = 1 m E D j E C = 1 + j = 1 m max ( E F j E C j , 0 ) E C
E F s i z e , r e g i o n = j = 1 m min ( E F j , E C j )
E F d e p t h , r e g i o n E F d e p t h ,   E F s i z e , r e g i o n E F s i z e
where E F d e p t h , r e g i o n and E F s i z e , r e g i o n represent improved ecological footprint depth and size, separately. E D r e g i o n represents ecological footprint deficit (gha/cap). E F j is the ecological footprint for land use of type j. E C j is the ecological capacity for land use type j. E D j is the ecological deficit for land use type j. The improved model is more specific in tracking the natural capital flow path, resulting in errors in the calculation results before and after the model improvement (shown in Formula (7)).
When the capital flow of a certain region is not completely occupied, the E F d e p t h , r e g i o n is 1, which cannot represent the actual occupation of population to capital flow. Therefore, the occupancy rate of capital flow ( w f l o w ) is introduced. If w f l o w reaches 100%, it means that there are ecological deficits in all types of ecological productive land, if w f l o w lower than 100%, it means that there are still ecological surplus in some land use types. The formula is shown as follows:
w f l o w = E F d e p t h , r e g i o n E C × 100 % E F < E C
The use ratio of capital stocks to flows ( w f l o w s t o c k ) represents the extent to which the capital stock exceeds the capital flow. When the capital flows are fully occupied, the consumption of capital stocks begins, so the larger the w f l o w s t o c k , the weaker the sustainability of natural capital utilization [35]. The formula is as follows:
w f l o w s t o c k = E F E F s i z e , r e g i o n E F s i z e , r e g i o n = E F d e p t h , r e g i o n 1 E F > E C

3.3. Natural Capital Change Rate and Scissors Difference

Polynomial regression analysis is most widely used in applied statistics [36]. Here, we apply a polynomial over a time scale to simulate the dynamic change of E F d e p t h , r e g i o n and E F s i z e , r e g i o n in a long time series. The slope of the curve tangent at a given time is the change rate of the data. The polynomial equations of E F d e p t h , r e g i o n and E F s i z e , r e g i o n are as follows:
f 1 = f 1 ( t ) = E F d e p t h , r e g i o n ( t ) = u 0 + u 1 t + u 2 t 2 + + u n t n
f 2 = f 2 ( t ) = E F s i z e , r e g i o n ( t ) = v 0 + v 1 t + v 2 t 2 + + v n t n
where variables f 1 and f 2 refer to E F d e p t h , r e g i o n and E F s i z e , r e g i o n as the dependent variables, respectively. The t is the time variable serving as an independent variable. Taking a derivative with respect to f 1 ( t ) and f 2 ( t ) as the slope of a curve tangent on time t, we can obtain the change rate of E F d e p t h , r e g i o n ( t ) and E F s i z e , r e g i o n ( t ) . For instance, at the given time of t = t 0 , if f 1 ( t 0 ) > 0 , f 1 ( t ) increases with time t. If f 1 ( t 0 ) < 0 , f 1 ( t ) decreases with time t. If f 1 ( t 0 ) = 0 , f 1 ( t ) lies in a stable state of no change [37]. The same analysis is also done for f 2 ( t ) .
The concept of “scissors” was firstly proposed by Trotsky in a report of the 12th Party Congress in 1923, it shows the price scissors representing industrial and agricultural price levels [38]. Since then, the concept of scissors difference has been widely applied to the study of economics. In this paper, we use the scissors difference to measure the difference between the development trends of E F d e p t h , r e g i o n ( t ) and E F s i z e , r e g i o n ( t ) at the given time ( t = t 0 ) of a long time series. The formula is as follows:
α = arccos [ 1 + E F d e p t h , r e g i o n ( t ) × E F s i z e , r e g i o n ( t ) ] 1 + E F d e p t h , r e g i o n ( t ) 2 2 × 1 + ( E F s i z e , r e g i o n ( t ) ) 2 2 0 α π
where E F d e p t h , r e g i o n ( t ) and E F s i z e , r e g i o n ( t ) represent the change rate of regional EF depth and size, respectively. α is scissor difference between them (rad) [35]. When α π / 2 , E F d e p t h , r e g i o n shows an increasing trend and changes in the opposite direction with E F s i z e , r e g i o n . When 0 < α < π / 2 , E F d e p t h , r e g i o n shows an increasing trend and changes in the same direction with E F s i z e , r e g i o n . When α = 0 , there is no difference between the change trends of two indexes. When π / 2 < α < 0 , E F d e p t h , r e g i o n shows a decreasing trend and changes in the same direction with E F s i z e , r e g i o n [37].

4. Results and Discussion

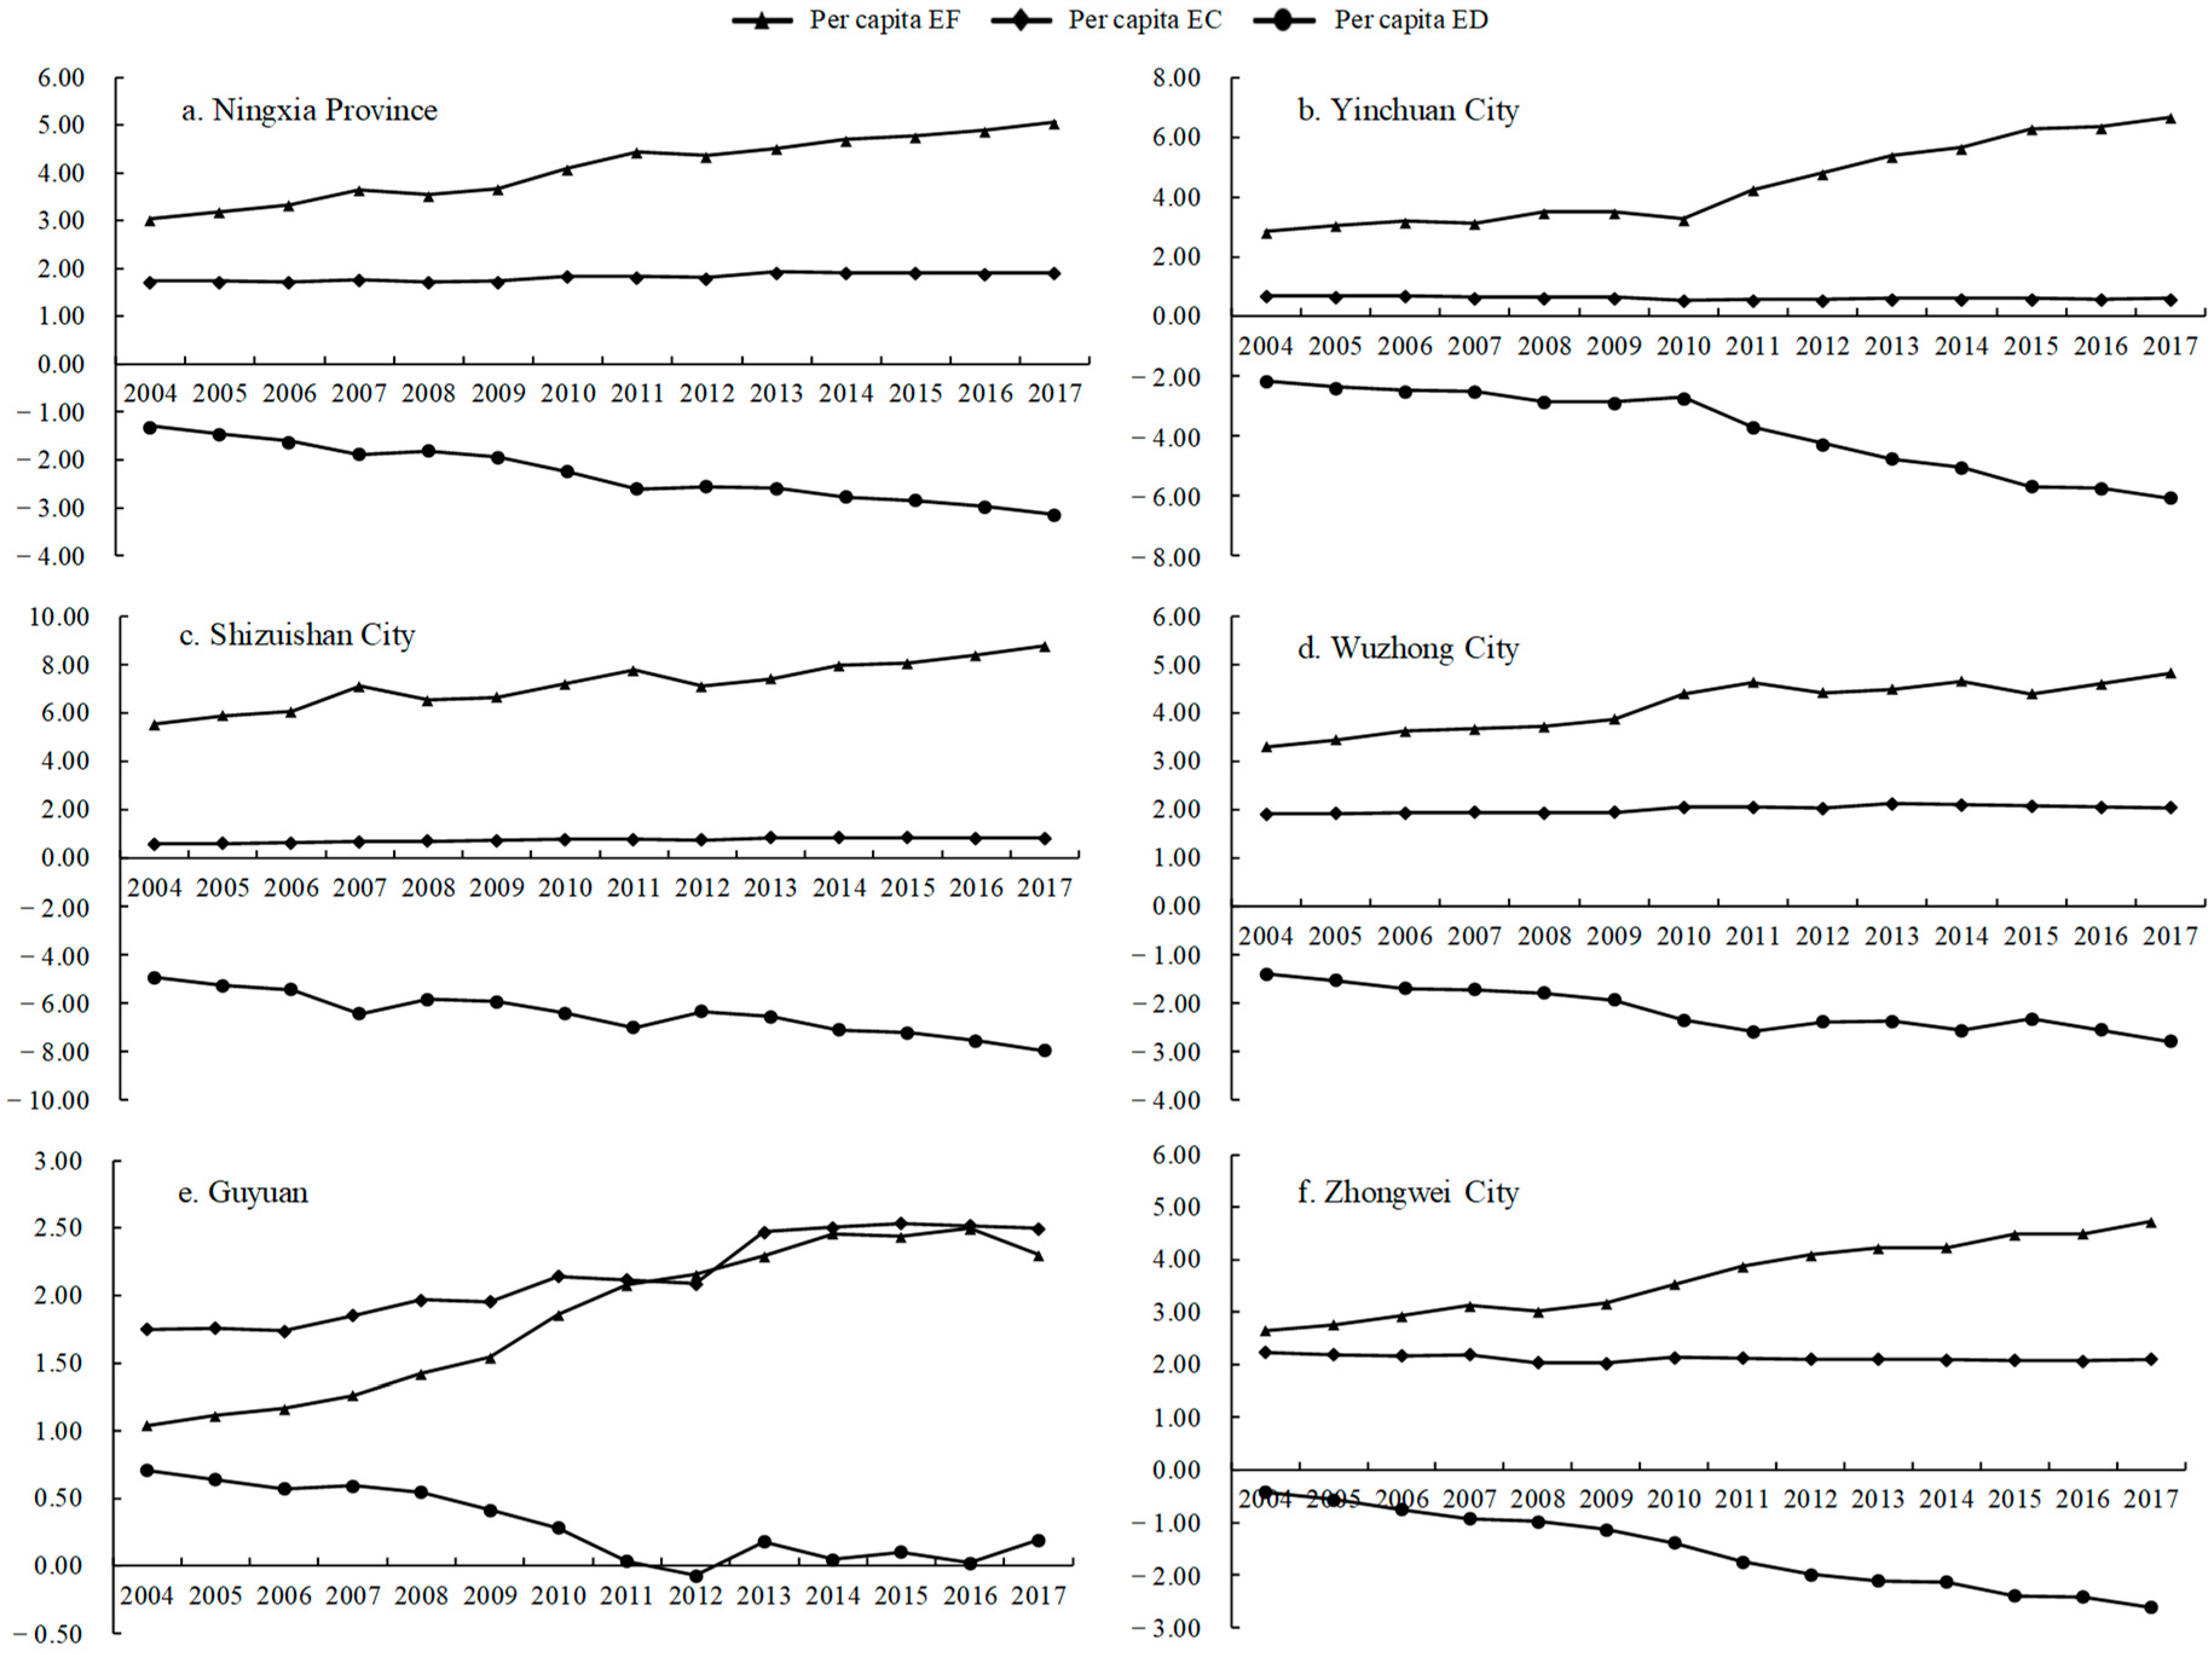
4.1. Dynamic Change of the per Capita EF and per Capita EC

Using Formulas (1) to (4), the per capita EF (ef), per capita ecological capacity (ec) and per capita ecological deficit (ed) from 2004 to 2017 in Ningxia Province can be obtained. As shown in Figure 2a, during the past 14 years, natural capital consumption (ecological footprint) increased from 3.07 to 5.46 gha/cap in Ningxia Province, with an average annual rate of 4.5%. This value was much higher than average ef in China (2.53 gha/cap in 2015) [39]. However, the capacity of natural capital supply (ecological capacity) was slowly increasing at an annual rate of only 0.9%, from 1.44 gha/cap in 2004 to 1.62 gha/cap in 2017, which led to the natural capital loss (ecological deficit) continue growing. By 2017, the ecological deficit reached 3.85 gha/cap, a 2.35-fold decrease. However, compared with the overall decreasing trend in China [40], the slight increase of ec in Ningxia indicates that the ecological restoration measures have made large achievements under the high pressure of economic development. In terms of the compositions of ef and ec in Ningxia Province (Figure 3), in 2017, the cropland contributed largest to the total ecological capacity, followed by forest land, built-up land, and grassland. While fossil energy land was the primary resource consumer, accounting for 53.57% of the total ef. The consumption of cropland and grassland products also accounted for high proportions of 19.96% and 13.69%, respectively.
For the spatial difference of capital consumption and supply (Figure 2b–f), except for Guyuan city, the other four cities were in ecological deficit, especially for Yinchuan city and Zhongwei city, both decreasing rapidly after 2010 at an annual rate of 12.23% and 9.46%, respectively. Although the ef of Guyuan city increased rapidly in the past 14 years, it still remained the minimum ef (2.3 gha/cap in 2017) in Ningxia. Adding the fact that Guyuan had the highest average ec compared with other cities, the ecological deficit was only shown in 2012, and then changed to ecological surplus again. The ef of Shizuishan city increased from 5.53 gha/cap to 8.78 gha/cap during the study period, contributing the most to Ningxia’s ef. The reason is that Shizuishan city is an industrial city with high energy consumption, but at the same time, its population is lower than that of the other four cities, which leads to a large ef. Wuzhong’s ef changed the least, from 3.31 gha/cap in 2004 to 4.83 gha/cap in 2017, with an average annual growth rate of 2.95%. Wuzhong city is located in the middle of the Ningxia drought zone, affected by the environment, its economic growth rate is inferior to Yinchuan city and Shizuishan city, resulting in the slowest growth of the ef.

4.2. Natural Capital Utilization in Ningxia Province

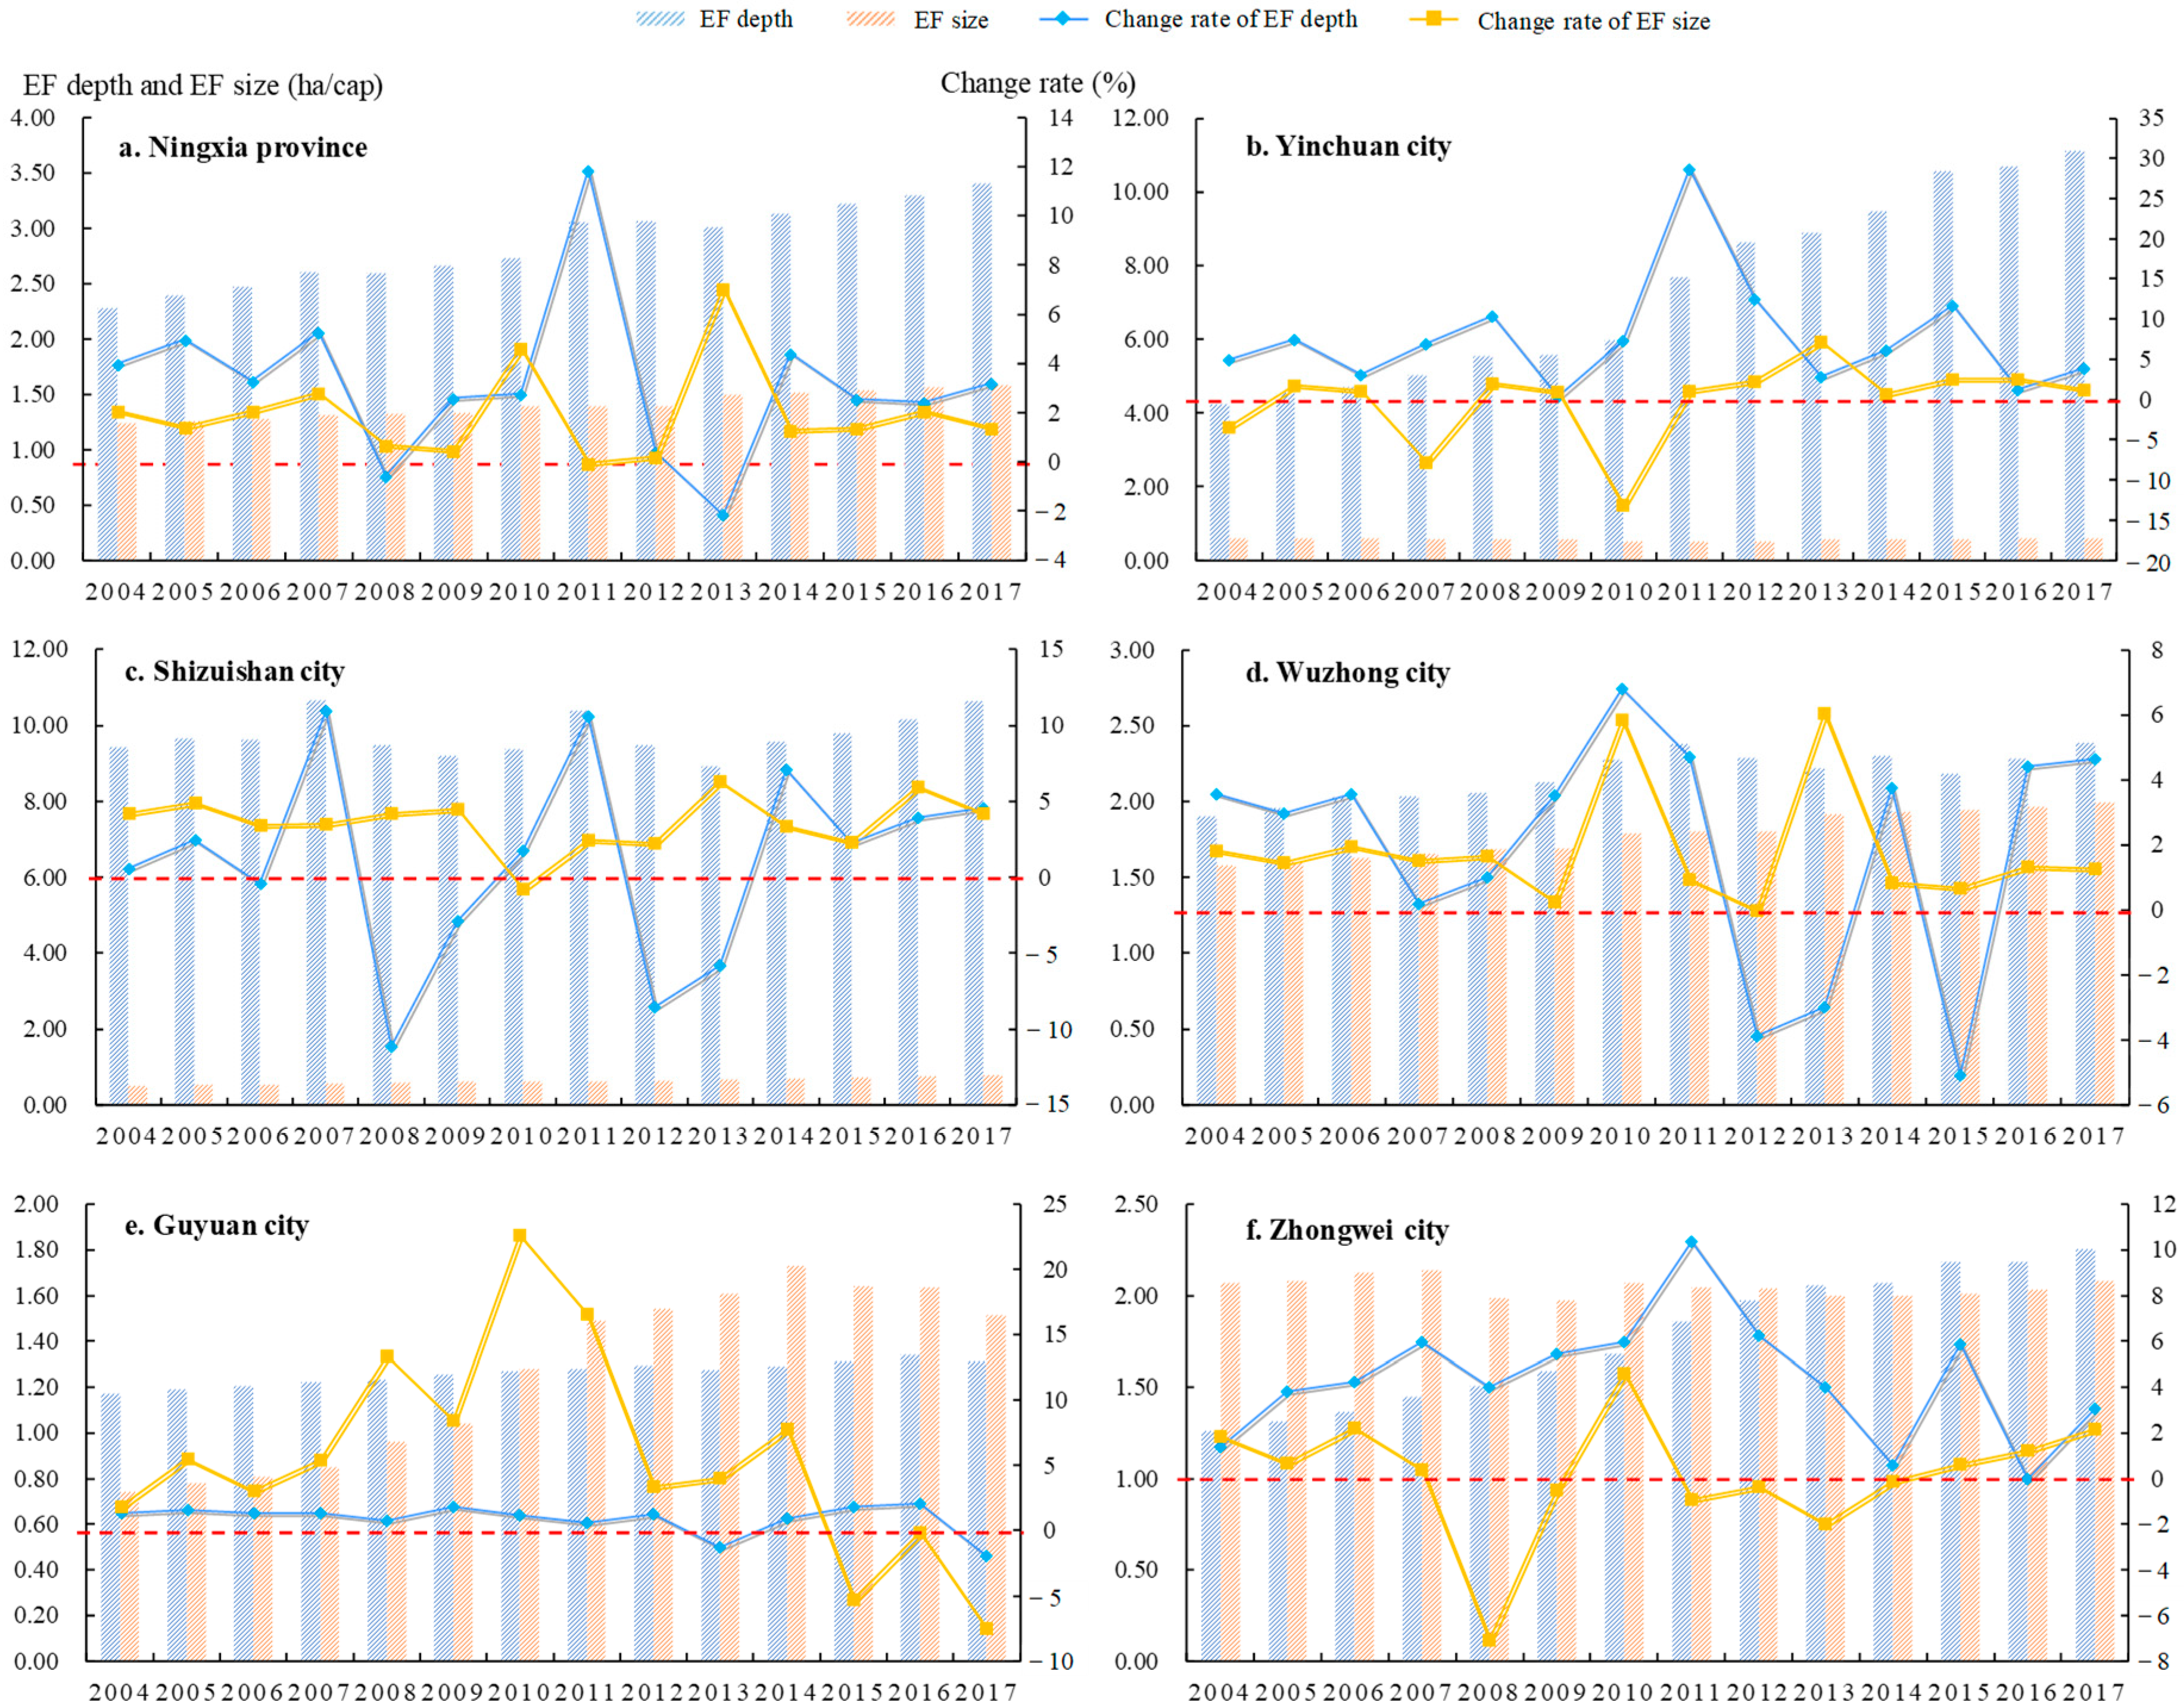
4.2.1. Analysis of per Capita EF Size and per Capita EF Depth
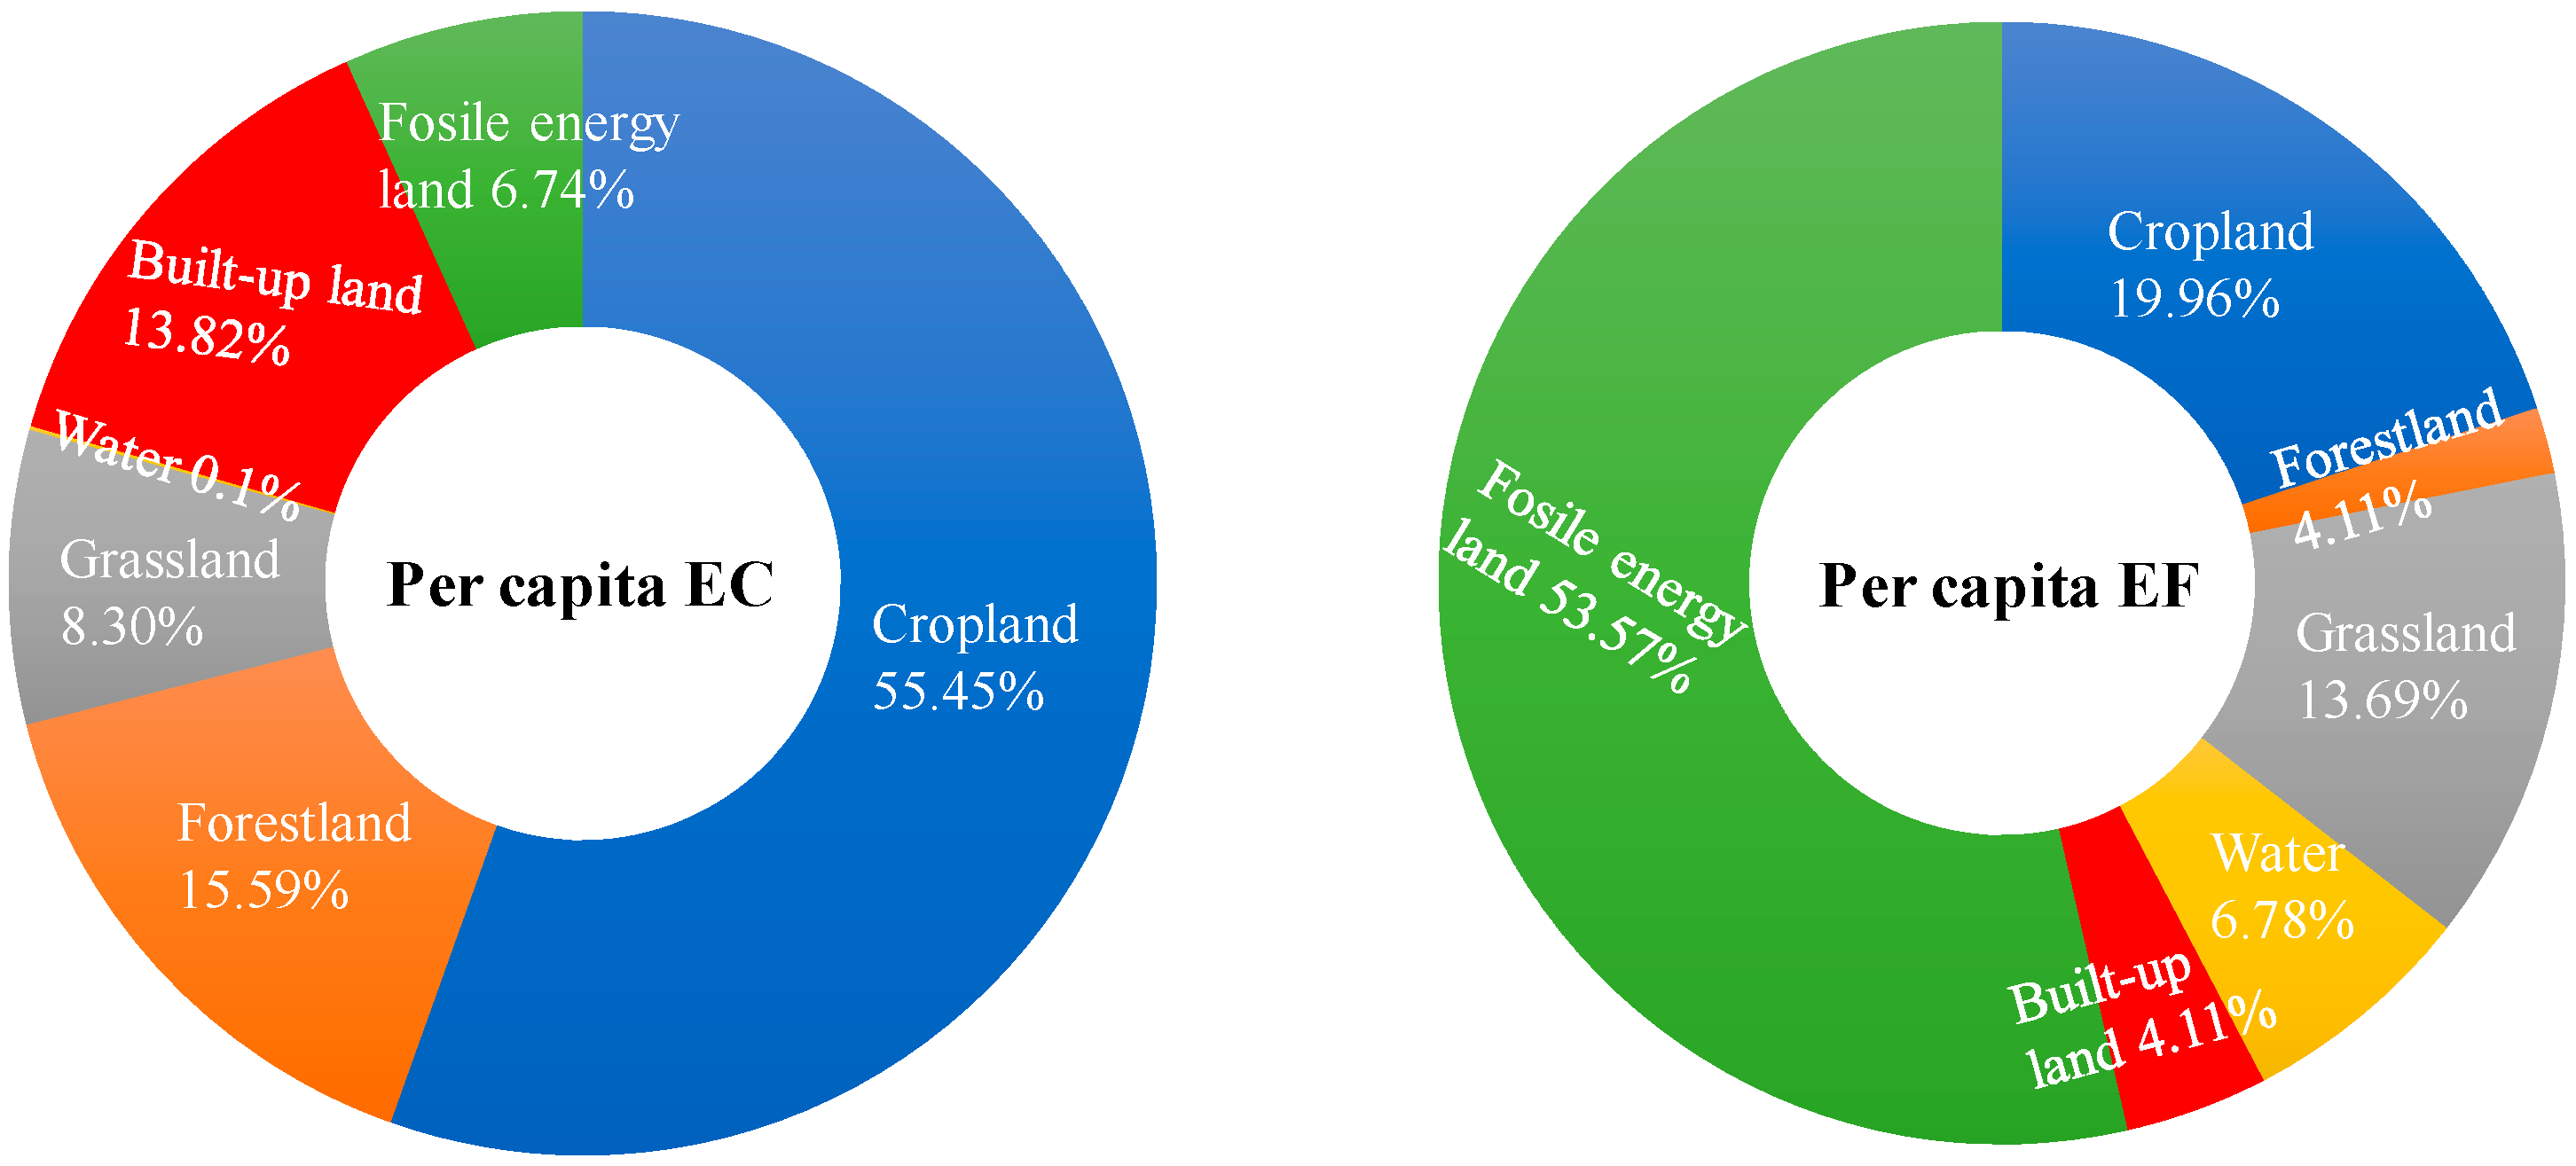
As shown in Figure 4a, the per capita EF depth and per capita EF size of Ningxia Province experienced an increasing trend over the past 14 years, and by 2017, both of which reached 3.41 and 1.59 gha/cap, with an annual change rate of 3.1% and 2% separately. This meant that the capital flows were not sufficient to maintain economic and social development, and an area nearly 3.5 times larger than its current area was needed to support its resource consumption. Specifically, the per capita EF depth increased volatility from 2004 to 2011, especially in 2011, EF depth increased significantly from 2.73 (2010) to 3.06, a range of 11.9%. However, from 2011 to 2013, the change rate dropped sharply, and by 2013, it fell below zero with the negative growth of EF depth. Since then, the change rate of EF depth rose again and then fluctuated around 3%, at the same time, the EF size maintained steady growth, with the change rate fluctuating around 1%, which indicated that the consumption of natural capital gradually tended to be stable. This can be mainly attributed to the economic structure optimization and industrial upgrade in Ningxia Province promoted by the initiatives of Silk Road Economic Belt [41] and Ningxia Inland Opening-up Pilot Economic Zone in 2013 [42].
The per capita EF depth of Yinchuan city grew most rapidly (Figure 4b): From 4.23 gha/cap in 2004, it increased to 11.12 gha/cap in 2017 with an average annual growth rate of 7.7%. As the capital of Ningxia Province, the capital flow in Yinchuan has been unable to meet the rapid growth of population and economy and the dependence on natural stock consumption has been increasing. At the same time, its per capita EF size showed negative growth from 2004 to 2012, and then increased slightly, with the change rate tending to zero.
Shizuishan’s EF depth had always been at a high level, but the annual increase was small, and the EF size was very low but increased steadily, with a change rate fluctuating around 3% (Figure 4c). This mainly because Shizuishan was listed as the resource-exhausted city by the Chinese government in 2008 [43], which pushing the industrial transformation and upgrading and gradually reducing its dependence on the consumption of natural capital stock.
The EF depths of Wuzhong, Guyuan, and Zhongwei were relatively small, all of which lower than 3 (Figure 4d–f). Compared with the other two cities, Wuzhong’s EF depth was relatively higher and increased faster (an average growth rate of 1.75). While the EF sizes in these three cities were rather high in Ningxia Province (all higher than 1.5 gha/cap in 2017). Additionally, Zhongwei’s EF size was higher than EF depth before 2013 and Guyuan’s EF size exceeded the EF depth after 2009. The main reason is that Zhongwei and Guyuan were located in the eastern and southern mountains of Ningxia, with a high forest coverage rate and large supply capacity of resources. However, at the same time, owing to the relatively backward economic development, the demand for stock capital consumption was lower.
As shown in Table 2, the scissors differences (α) of per capita EF depth and per capita EF size in Ningxia Province experienced a slightly decreasing trend from 0.072 in 2004 to 0.04 in 2017, with the value always much lower than π/2. Add the fact that the growth rate of EF depth was slowing and, EF size grew steadily, the gap between EF depth and EF size was narrowing. This indicates that the conflict between the capital stock consumption and the capital flow occupation tends to ease, and the general development trend of the ecological environment is sound.

4.2.2. Analysis of the w f l o w and w f l o w s t o c k of Different Land Use Types

As shown in Table 3, over the past 14 years, the ratio of natural capital stocks to capital flows ( w f l o w s t o c k ) in Ningxia increased rapidly, and by 2017, the capital stock consumption was 2.4 times of capital flow, indicating that large consumption of capital stock has become normal due to insufficient capital flow to meet regional consumption demand. Specifically, the occupancy rate of capital flow ( w f l o w ) of forest land increased significantly from 10.8% in 2004 to 81.9% in 2015, with an annual growth rate of 20.2%, and since then, it began to drop, by 2017, it reached 76.2%, with a decrease of 5.7%. However, the EF depth of forest land has always been natural length without using natural capital stock, which indicated that forest land could basically meet the regional consumption demand for forest products.
The built-up land experienced the process from the consumption of natural capital flow to the natural capital stock. In 2016, the w f l o w of built-up land was 88.1%, indicating the occupation of built-up land remained the natural capital flow. However, since 2017, the natural capital flow has been unable to meet its own growth needs and began to consume the natural capital stock, with 0.01 times greater than the occupation of the natural capital flows. By the end of 2017, the built-up land area had reached 324,100 ha, an increase of 13% over last year. While on the contrary, the consumption of cropland products mainly relied on natural capital stock before 2016, but since then, the capital flow of cropland basically satisfied the needs of economic and social development, with a w f l o w of 79%.
The grassland, water area, and fossil energy land had always relied on the consumption of natural capital stock, among which, the stock consumption of water area was the largest, and by 2017, it was 233 times greater than that of the natural capital flows. This was in line with the reality contradiction between the serious shortage of water resources and people’s significant demand for aquatic products in Ningxia Province. The stock occupation of grassland and fossil energy land has also become the norm in regional development due to insufficient natural capital flows, by 2017, the values of w f l o w s t o c k reached 12.82 and 8.47, with an average annual growth rate of 6.7% and 7.3% separately. This is mainly due to the energy-based industrial development patterns, the increasing demand for animal husbandry products, as well as the decrease of grassland ecological capacity and ecological footprint size.

4.3. Factors Driving Change in Ecological Footprint Depth

The ecological footprint reflects the region’s degree of sustainable development and utilization of resources [33]. It has a direct or indirect relationship with the region’s social and economic development [11,44]. In this paper, the utilization of natural capital flow has changed little, and the main reason for the increase in the ecological footprint is the natural capital stock occupation. At present, the partial least square model (PLS) has been widely used in the study of EF drivers owing to the effective solution of the multicollinearity of independent variables [45]. Therefore, through calculating the value of variable important in projection (VIP), we can quantify the influence of the independent variables on the dependent variables. Indicators in relevant literature [10,11,17] are mainly selected from four aspects: Population structure, economic growth, industrial structure, and consumption level. We included the technology level and foreign trade to comprehensively analyze driving factors of ecological footprint.
Based on the PLS model, the per capita EF depth of the natural capital stock was taken as the dependent variable Y, and 14 indexes in six aspects, including population, economic, industrial structure, consumption, technology, and foreign trade, were taken as the independent variables (Table 4) to explore the driving factors of the utilization of natural capital stock.
The results obtained by the software SIMCA-P 11.5 showed that the accuracy of Hotelling T2 reached 0.95 and t [ 1 ] / u [ 1 ] phase relationship of the sample data was 0.889 (Table 5), meaning that the sample data in this paper were acceptable because there were no inhomogeneous points in the T2 oval plot of sample data. Additionally, when first effective component of t1 was extracted, the model could extract information from the set of independent variables by 88.9%, and interpreted information of dependent variables by 95.6%. At this time, the coefficient Q2, which reflected the fitting level of the predicted value of the model and the actual observed value of the variable, was higher than 90%, indicating that the model had a good fitting degree and the first component extracted could meet the accuracy requirements.
In the PLS model, variable importance in projection (VIP) was used to measure the influence of the independent variables X on the dependent variable Y. A VIP value greater than 1 indicates particularly important influencing factors. A VIP value greater than 0.8 and less than 1 indicates generally important factors, while a VIP value less than 0.8 indicates unimportant factors. According to the results (Figure 5), the particularly important factors were ranked in descending order as follows: Secondary industry output value, urbanization rate, year-end resident population, GDP, primary industry output value, tertiary industry output value, total retail sales of social consumer goods, per capita consumption expenditure of urban residents, per capita consumption expenditure of rural residents and total investment in fixed assets. The remaining general important factors were energy consumption of unit GDP, total export and import volume. The agriculture population had little effect on the change of EF depth.
Based on the PLS model, the standardized regression equation of EF depth and its influencing factors from 2004 to 2017 in Ningxia Province was obtained as follows:
Y = 7.917 + 0.079 X 1 + 0.079 X 2 0.046 X 3 + 0.079 X 4 + 0.076 X 5 + 0.079 X 6 + 0.079 X 7 + 0.079 X 8 + 0.079 X 9 + 0.079 X 10 + 0.077 X 11 0.071 X 12 + 0.067 X 13 + 0.059 X 14
In terms of the population scale, the urbanization rate significantly affected the change of EF depth. Over the past 14 years, the urbanization rate of Ningxia Province increased from 40.6% to 58%, with an increase of nearly 1.5 times, especially for Yinchuan city and Shizuishan city, reaching 77.1% and 75.2% in 2017, respectively. The rapid increase of the urban population promoted the decrease of grassland and cropland area, as well as the increase of built-up land area and people’s demand for products and services. In terms of economic factors, the GDP was the most important factor for the growth of Ningxia’s ecological footprint depth. During the study period, the GDP grew at an average annual rate of 15.36%, and the fast-growing economy increased the consumption of natural capital goods and services. At the same time, different structures of GDP inevitably lead to different utilization of natural capital. Ningxia is an important industrial base of energy, heavy chemicals, and raw materials in China. The secondary industry accounted for 45.8% of the regional GDP, with an output value of 158,057 million RMB Yuan in 2017. The increase of industrial output directly leads to the increase of fossil energy consumption, and finally affects the change of ecological footprint and footprint depth. The consumption expenditure of urban residents had a larger effect on EF depth than that of rural residents. Every 1% increase in the consumption expenditure of urban and rural residents would cause an increase of 0.079% and 0.077% in per capita EF depth, respectively. Additionally, compared with import, the export had a larger effect on the change of EF depth.
For the technological level, the decrease in energy consumption of unit GDP could inhibit the growth of ecological footprint, but it had a generally important influence (VIP = 0.96). Every 1% decrease in energy consumption of unit GDP would cause a decrease of 0.071% in EF depth. This empirically supplements Yang’s [46] analysis of the impact of technical factors on ecological footprint to a certain extent, i.e., the improvement of science and technology provides clean technologies and production processes for industrial production, which could, theoretically, reduce resource consumption, decrease amount of contaminant emission and promote utilization of renewable energy resources. Similarly, although the agricultural population is negatively correlated with the depth of ecological footprint, its influence is very small (VIP = 0.62).

5. Conclusions

The low-carbon economic development model has become an unavoidable way for the sustainable development of the global economy. Especially in energy-rich, ecologically fragile regions, its economic growth pressure increases under “three highs”: High pollution, high energy consumption, high-risk, which leads ecological and environmental protection into a grim situation. Therefore, it is urgent to clarify the environmental capacity and the natural resource consumption degree. In this paper, we used the data published annually by the government to analyze the dynamic change of ecological demand and supply, as well as natural capital utilization in Ningxia Province from 2004 to 2017 based on the improved 3D EF model. Further, the driving factors behind changes in the capital stock are revealed using the PLS method. Through involving the importance of grasslands in absorbing carbon emissions, the results of our model are more in line with the actual situation in arid, ecologically fragile areas than the traditional calculation method of fossil energy footprint, which could provide scientific reference for similar areas. The results are shown as follows:
  • The per capita EF of Ningxia Province nearly doubled during the past 2004–2017 years, while the per capita EC was rather low and increased by only 12.5%, leading to an increasing ecological deficit. The footprint of fossil energy land, represented by carbon emissions from coal consumption, contributed the most to the total EF, followed by cropland and grassland. Except for Guyuan, the remaining four cities are all in ecological deficit during the study period. Yinchuan and Shizuishan, in particular, have the greatest ecological pressure.
  • The capital flows have been not sufficient to maintain economic and social development in Ningxia Province, and an area nearly 3.5 times larger than its current area is needed to support its resource consumption now. The resource pressure is high, among which, the EF depth of forest land and built-up land basically remained at natural length, while the capital stock consumption of grassland, water, and fossil energy land is serious. Capital flow of cropland could also basically satisfy people’s consumption demand by 2017. Spatially, capital stock consumption is concentrated in Yinchuan and Shizuishan. Capital flow occupation is concentrated in Guyuan, Zhongwei, and Wuzhong.
  • It is necessary to emphasize that the scissors difference of per capita EF depth and per capita EF size decreased slightly in 14 years, indicating that the ecological restoration measures have achieved positive effects and the contradiction between supply and demand of natural resources tends to be eased.
  • The urbanization rate, GDP, the secondary industry output value and per capita consumption expenditure of urban residents have significant positive effects on the consumption of natural capital stocks. Compared with import, export has a greater impact on EF depth. Additionally, although the energy consumption of unit GDP could restrain the growth of resource consumption, its effect is limited.
According to the findings above, countermeasures and suggestions should be put forward in Ningxia’s process of sustainable development: (1) Further promote the transformation of existing industrial structure and gradually reduce the excessive dependence of economic development on the energy-intensive industries. (2) Make full use of abundant solar and wind power by adopting new technologies to promote the low-carbon economy, and reduce environmental pollution caused by fossil fuel combustion. (3) Take full advantage of the initiatives of Silk Road Economic Belt and Ningxia Inland Opening-up Pilot Economic Zone to strengthen economic exchanges and cooperation with provinces and countries along the route. (4) Define the boundary of urban space growth, reasonably control urban built-up land and population size in northern, more developed cities, advocating sustainable consumption patterns. (5) Continue to implement ecological projects of forest preservation, reverting arable land to forest and grassland, and soil and water conservation in southern mountains to improve the supply of natural resources.

Author Contributions

Conceptualization, Y.W. and S.G.; data collection, S.G., J.Y. and L.X.; data processing, S.G., C.W. and W.H.; methodology, S.G.; data analysis, S.G.; paper writing, S.G.; review and editing: Y.W. and H.H. All authors have read and agreed to the published version of the manuscript.

Funding

This research was funded by the National Natural Science Foundation of China, grant number 51874307.

Conflicts of Interest

The authors declare no conflict of interest.

References

  1. Daily, G.C.; Ehrlich, P.R. Population, Sustainability, and Earth’s Carrying Capacity. BioScience 1992, 42, 435–450. [Google Scholar] [CrossRef]
  2. Arrow, K.; Bolin, B.; Costanza, R.; Dasgupta, P.; Folke, C.; Holling, C.S.; Jansson, B.O.; Levin, S.; Mäler, K.G.; Perrings, C.; et al. Economic growth, carrying capacity, and the environment. Science 1996, 268, 520–521. [Google Scholar] [CrossRef] [PubMed]
  3. Danish; Hassan, S.T.; Baloch, M.A.; Mahmood, N.; Zhang, J.W. Linking economic growth and ecological footprint through human capital and biocapacity. Sustain. Cities Soc. 2019, 47, 101516. [Google Scholar] [CrossRef]
  4. Maes, J.; Egoh, B.; Willemen, L.; Liquete, C.; Vihervaara, P.; Schägner, J.P.; Grizzetti, B.; Drakou, E.G.; La Notte, A.; Zulian, G.; et al. Mapping ecosystem services for policy support and decision making in the European Union. Ecosyst. Serv. 2012, 1, 31–39. [Google Scholar] [CrossRef]
  5. Mancini, M.S.; Galli, A.; Niccolucci, V.; Lin, D.; Hanscom, L.; Wackernagel, M.; Bastianoni, S.; Marchettinia, N. Stocks and flows of natural capital: Implications for Ecological Footprint. Ecol. Indic. 2017, 77, 123–128. [Google Scholar] [CrossRef]
  6. Natural Capital Committee. State of Natural Capital: Restoring Our Natural Assets; Natural Capital Committee: London, UK, 2014. [Google Scholar]
  7. Daly, H.E. Toward some operational principles of sustainable development. Ecol. Econ. 1990, 2, 1–6. [Google Scholar] [CrossRef]
  8. Wackernagel, M.; Schulz, N.B.; Deumling, D.; Linares, A.C.; Jenkins, M.; Kapos, V.; Monfreda, C.; Loh, J.; Myers, N.; Norgaard, R.; et al. Tracking the ecological overshoot of the human economy. Proc. Natl. Acad. Sci. USA 2002, 99, 9266–9271. [Google Scholar] [CrossRef] [Green Version]
  9. Wackernagel, M.; White, S.; Moran, D. Using Ecological Footprint accounts: From analysis to applications. Int. J. Environ. Sustain. Dev. 2004, 3, 293–315. [Google Scholar] [CrossRef]
  10. Yang, Y.; Hu, D. Natural capital utilization based on a three-dimensional ecological footprint model: A case study in northern Shaanxi, China. Ecol. Indic. 2018, 87, 178–188. [Google Scholar] [CrossRef]
  11. Dong, H.W.; Li, P.; Feng, Z.M.; Yang, Y.Z.; You, Z.; Li, Q. Natural capital utilization on an international tourism island based on a three-dimensional ecological footprint model: A case study of Hainan Province, China. Ecol. Indic. 2019, 104, 479–488. [Google Scholar] [CrossRef]
  12. Lindmark, M.; Nguyen, T.H.; Stage, J. Weak support for weak sustainability: Genuine savings and long-term wellbeing in Sweden, 1850–2000. Ecol. Econ. 2018, 145, 339–345. [Google Scholar] [CrossRef]
  13. Buonocore, E.; Picone, F.; Donnarumma, L.; Russo, G.F.; Franzese, P.P. Modeling matter and energy flows in marine ecosystems using emergy and eco-exergy methods to account for natural capital value. Ecol. Model. 2019, 392, 137–146. [Google Scholar] [CrossRef]
  14. Paoli, C.; Povero, P.; Burgos, E.; Dapueto, G.; Fanciulli, G.; Massa, F.; Scarpellini, P.; Vassallo, P. Natural capital and environmental flows assessment in marine protected areas: The case study of Liguria region (NW Mediterranean Sea). Ecol. Model. 2018, 368, 121–135. [Google Scholar] [CrossRef]
  15. Crane, B.; Hartwell, C.J. Global talent management: A life cycle view of the interaction between human and social capital. J. World Bus. 2019, 54, 82–92. [Google Scholar] [CrossRef]
  16. Houshyar, E.; Chen, B.; Chen, G.Q. Environmental impacts of rice production analyzed via social capital development: An Iranian case study with a life cycle assessment/data envelopment analysis approach. Ecol. Indic. 2019, 105, 675–687. [Google Scholar] [CrossRef]
  17. Xu, X.; Tan, Y.; Chen, S.; Yang, G. Changing patterns and determinants of natural capital in the Yangtze River Delta of China 2000–2010. Sci. Total Environ. 2014, 466–467, 326–337. [Google Scholar] [CrossRef]
  18. Rees, W.E. Ecological Footprints and Appropriated Carrying Capacity: What Urban Economics Leaves Out. Environ. Urban. 1992, 4, 121–130. [Google Scholar] [CrossRef]
  19. Wackernagel, M.; Rees, W. Our Ecological Footprint: Reducing Human Impact on the Earth; New Society Publishers: Gabriola Island, BC, Canada, 1996. [Google Scholar]
  20. Niccolucci, V.; Galli, A.; Reed, A.; Neri, E.; Wackernagel, M.; Bastianoni, S. Towards a 3D National Ecological Footprint Geography. Ecol. Model. 2011, 222, 2939–2944. [Google Scholar] [CrossRef]
  21. Daly, O.; Fleming, B.; Loughrey, G. Psychological sequelae to assassination attempts. Med. Sci. Law 1996, 36, 25–27. [Google Scholar] [CrossRef]
  22. Fang, K. Assessing the natural capital use of eleven nations: An application of a revised three-dimensional model of ecological footprint. Acta Ecol. Sin. 2015, 35, 3766–3777. [Google Scholar]
  23. Fang, K.; Heijungs, R. A review on three-dimensional ecological footprint model for natural capital accounting. Prog. Geogr. 2012, 31, 1700–1707. [Google Scholar]
  24. Fang, K. Ecological footprint depth and size: New indicators for a 3D model. Acta Ecol. Sin. 2013, 33, 267–274. [Google Scholar] [CrossRef] [Green Version]
  25. Fang, K.; LI, H.C. Provincial pattern of China’s natural capital use: A modification and application of ecological footprint depth and size. J. Nat. Resour. 2012, 27, 1995–2005. [Google Scholar]
  26. Yang, Y.; Fan, M. Analysis of the spatial-temporal differences and fairness of the regional energy ecological footprint of the Silk Road Economic Belt (China Section). J. Clean. Prod. 2019, 215, 1246–1261. [Google Scholar] [CrossRef]
  27. National Bureau of Statistics. China Industry Statistical Yearbooks, 2018; China Statistical Press: Beijing, China, 2018. [Google Scholar]
  28. Ningxia Hui Autonomous Region Statistics Bureau. Statistical Communique of Ningxia Hui Autonomous Region on National Economic and Social Development in 2017. 2017. Available online: http://tj.nx.gov.cn/tjsj_htr/tjgbhtr/2018 05/t2018 0510_1470250.html (accessed on 20 November 2019). (In Chinese)
  29. Chang, J. Pollution Reappears in Tengger Desert, How to Pay the Environmental Debt? Available online: https://www.cenews.com.cn/opinion/201911/t20191119_917448.html (accessed on 19 November 2019).
  30. Ningxia Daily. Promoting Green Development, Ushering in a New Era of Ecological Progress. 2017. Available online: https://news.nxu.edu.cn/info/1011/19187.htm (accessed on 20 November 2019). (In Chinese).
  31. Lin, D. Working Guidebook to the National Footprint Accounts; Global Footprint Network: Oakland, CA, USA, 2018. [Google Scholar]
  32. Liu, M.C.; Zhang, D.; Min, Q.W.; Xie, G.D.; Su, N. The calculation of productivity factor for ecological footprints in China: A methodological note. Ecol. Indic. 2014, 38, 124–129. [Google Scholar] [CrossRef]
  33. Li, J.; Chen, Y.; Xu, C.; Li, Z. Evaluation and analysis of ecological security in arid areas of Central Asia based on the emergy ecological footprint (EEF) model. J. Clean. Prod. 2019, 235, 664–667. [Google Scholar] [CrossRef]
  34. Xie, H.Y. Improvement and Application of Ecological Footprint Evaluation Model; Chemical Industry Press: Beijing, China, 2008. [Google Scholar]
  35. Cheng, Y.; Yin, J.Z.; Wang, J.S. Research on natural capital evolution and influencing factors in the Yellow River Delta Region. China Popul. Resour. Environ. 2019, 29, 127–136. [Google Scholar]
  36. Gordon, R.A. Regression Analysis for the Social Sciences: Second Edition; Taylor & Francis Group: London, UK, 2015. [Google Scholar]
  37. Yue, D.X.; Xu, X.F.; Li, Z.Z.; Hui, C.; Li, W.L.; Yang, H.Q.; Ge, J.P. Spatiotemporal analysis of ecological footprint and biological capacity of Gansu, China 1991–2015: Down from the environmental cliff. Ecol. Econ. 2006, 58, 393–406. [Google Scholar] [CrossRef]
  38. Seton, F. Scissor crises, value-prices, and the movement of value-prices under technical change. Struct. Chang. Econ. Dyn. 2000, 11, 13–24. [Google Scholar] [CrossRef]
  39. Zheng, D.; Liu, X.; Wang, Y.; Lv, L. Spatiotemporal evolution and driving forces of natural capital utilization in China based on three-dimensional ecological footprint. Prog. Geogr. 2018, 37, 1328–1339. [Google Scholar]
  40. Yang, Q.; Liu, G.Y.; Hao, Y.; Coscieme, L.; Zhang, J.Q.; Jiang, N.N.; Casazza, M.; Giannetti, B.F. Quantitative analysis of the dynamic changes of ecological security in the provinces of China through emergy-ecological footprint hybrid indicators. J. Clean. Prod. 2018, 184, 678–695. [Google Scholar] [CrossRef]
  41. Yang, Y.; Hu, N. The spatial and temporal evolution of coordinated ecological and socioeconomic development in the provinces along the Silk Road Economic Belt in China. Sustain. Cities Soc. 2019, 47, 101466. [Google Scholar] [CrossRef]
  42. China (Ningxia) Inland Opening-Up Pilot Economic Zone. Available online: http://nx.people.com.cn/GB/192963/374844/index.html (accessed on 24 November 2019).
  43. Ningxia Daily. Shizuishan: Strive to Find a New Path of High-Quality Development for Resource-Exhausted Cities. Available online: http://www.nxnews.net/zt/2019/zlqs/wztt/201909/t20190929_6432805.html?spm=zm5078-001.0.0.1.h2UnFS (accessed on 26 November 2019).
  44. Luo, W.; Bai, H.T.; Jing, Q.N.; Liu, T.; Xu, H. Urbanization-induced ecological degradation in Midwestern China: An analysis based on an improved ecological footprint model. Resour. Conserv. Recycl. 2018, 137, 113–125. [Google Scholar] [CrossRef]
  45. Jia, J.; Deng, H.; Duan, J.; Zhao, J. Analysis of the major drivers of the ecological footprint using the STIRPAT model and the PLS method—A case study in Henan Province, China. Ecol. Econ. 2009, 68, 2818–2824. [Google Scholar] [CrossRef]
  46. Yang, C.; Zhu, Y. Analysis on driving force factors of ecological footprint in Hunan Province from the perspective of green development. Econ. Geogr. 2019, 12, 1–15. [Google Scholar]
Figure 1. The location of study area.
Sustainability 12 00562 g001
Figure 2. Changes in per capita ecological footprint (EF), per capita ecological capacity (EC) and per capita ecological deficit (ED) in Ningxia Province from 2004 to 2017.
Sustainability 12 00562 g002
Figure 3. Compositions of per capita EC and per capita EF in 2017 in Ningxia Province.
Sustainability 12 00562 g003
Figure 4. Changes in per capita EF depth and per capita EF size in Ningxia Province from 2004 to 2017.
Sustainability 12 00562 g004
Figure 5. Variable importance in projection (VIP) for the influence factors of the EF depth in Ningxia Province.
Sustainability 12 00562 g005
Table 1. Indicators and data sources.
ItemsIndicatorsData Sources
Biological accountAgricultural products: Wheat, corn, rice, beans, cotton, oil crop, vegetables, linen, potato, pork, and sunflowerNingxia Statistical Yearbook (2005–2018)
Forest products: Fruits and woodNational Economy and Society Developed Statistical Bulletin (2004–2017)
Grass products: Beef, lamb, milk, dairy products, poultry meat, and eggs
Aquatic products: Freshwater
Energy accountThe consumption of coal, oil, natural gas, and electricityChina Energy Statistical Yearbook (2005–2018)
National Economy and Society Developed Statistical Bulletin (2004–2017)
Land useThe area of cropland, grassland, forest land, water, and built-up landLand Resources Data of the Ministry of Natural Resources (2004–2017)
Ningxia Statistical Yearbook (2005–2018)
Overall Land Use Planning (2006–2020)
Equivalence factorCropland (2.52), grassland (0.46), forestland (1.29), water (0.37), built-up land (2.52), and fossil energy land (1.29) Working Guidebook to the National Footprint Accounts [31]
Yield factorCropland (1.5), grassland (3.8), forest land (1.68), water (3.8), built-up land (2.5), and fossil energy land (0) The calculation of productivity factor for ecological footprints in China: A methodological note [32]
EF depth impact factorsPopulation scale, economic growth, technology, industrial structure, resident consumption, and foreign tradeNingxia Statistical Yearbook (2005–2018) National Economy and Society Developed Statistical Bulletin (2004–2017)
Table 2. Scissors difference of per capita EF depth and per capita EF size in Ningxia Province from 2004 to 2017.
Year2004200520062007200820092010
Scissors difference/radian0.0720.0690.0680.0650.0630.060.058
Year2011201220132014201520162017
Scissors difference/radian0.0550.0530.0510.0490.0450.0420.040
Table 3. The w f l o w and w f l o w s t o c k of different land use types in Ningxia Province from 2004 to 2017.
Year Occupancy   Rate   of   Capital   Flow   ( w f l o w ) / % Use   Ratio   of   Capital   Stocks   to   Flows   ( w f l o w s t o c k )
CroplandForest LandBuilt-Up LandCroplandGrasslandWaterBuilt-Up LandFossil Energy LandOverall
200410.829.90.325.51148.353.401.28
200518.839.40.356.33151.973.771.39
200638.043.40.366.70155.524.081.47
200752.841.10.297.04165.634.921.60
200865.343.50.327.18111.704.841.59
200968.344.40.397.45100.764.961.66
201074.537.80.387.7687.875.381.73
201175.642.10.288.32100.107.092.06
201277.751.40.338.83113.106.812.07
201374.551.10.199.65134.057.142.00
201480.657.70.2310.78151.317.472.14
201581.967.90.1911.47158.307.902.22
201682.988.10.2012.13160.038.172.29
201779.078.512.82233.480.018.472.40
Table 4. Driving factors behind the EF depth of the natural capital stock change.
Dimension of IndexDriving FactorsIndependent Variable
Population scaleYear-end resident population (10,000 persons)X1
Urbanization rate (%)X2
Agriculture population (10,000 persons)X3
Economic growthGross domestic product (GDP) (100 million yuan)X4
Total investment in fixed assets (100 million yuan)X5
Total retail sales of social consumer goods (100 million yuan)X6
Industrial structurePrimary industry output value (100 million yuan)X7
Secondary industry output value (100 million yuan)X8
Tertiary industry output value (100 million yuan)X9
Resident consumption Per capita consumption expenditure of urban residents (yuan)X10
Per capita consumption expenditure of rural residents (yuan)X11
Technological levelEnergy consumption of unit GDP (tons of standard coal/ten thousand yuan)X12
Foreign tradeTotal export volume (million dollars)X13
Total import volume (million dollars)X14
Table 5. Cross validation of PLS regression model.
No. of ComponentsHotelling T2 t [ 1 ] / u [ 1 ] Rx2Ry2Q2Q2 (cum)
10.950.8890.8890.9560.950.95

