Article

Mapping the Roman Water Supply System of the Wadi el Melah Valley in Gafsa, Tunisia, Using Remote Sensing

1
Key Laboratory of Digital Earth Science, Aerospace Information Research Institute (AIR), Chinese Academy of Sciences (CAS), Beijing 100094, China
2
University of Chinese Academy of Sciences (UCAS), Beijing 100049, China
3
International Centre on Space Technologies for Natural and Cultural Heritage under the Auspices of UNESCO, Beijing 100094, China
4
Institute of Archeological Heritage—Monuments and Sites (IBAM), CNR, C.da Santa Loja, 85050 Tito Scalo (PZ), Italy
5
Faculty of Letters and Humanities of Sousse, University of Sousse, FLSHS-LR 13ES11 Sousse, Tunisia
6
Institut des Regions Arides (IRA)-Medenine, Medenine 4119, Tunisia
7
Institute of Methodologies for Environmental Analysis (IMAA), C.da Santa Loja, 85050 Tito Scalo (PZ), Italy
*
Authors to whom correspondence should be addressed.
These authors contributed equally to this work.
Sustainability 2020, 12(2), 567; https://0-doi-org.brum.beds.ac.uk/10.3390/su12020567
Submission received: 25 November 2019 / Revised: 10 January 2020 / Accepted: 10 January 2020 / Published: 11 January 2020
(This article belongs to the Special Issue Remote Sensing for Archaeology and Cultural Landscapes)

Abstract

:
In recent years, very high-resolution satellite remote-sensing tools have been progressively used in archaeological prospecting to acquire information and improve documentation. Satellite remote sensing has also benefited from technical improvements, including better spectral and spatial resolution of sensors, which have facilitated the detection and discovery of unknown archaeological areas. This paper focuses on investigations conducted using multi-spectral satellite remote-sensing data of the ancient canal systems of the Wadi el Melah Valley (WMV) in southern Tunisia. The area used to be part of a huge military defense system along the desert border. This paper describes the use of GeoEye-1 and Ziyuan-3 satellite remote-sensing data to reveal ancient Roman canals, which were part of an advanced hydraulic system devised to capture runoff water and cope with the lack of water in the area. In general, this research provides new information on some essential sections of the Roman walled defense system Limes (Fossatum) in the southern part of the empire, where we study previously undetected sites.

Graphical Abstract

1. Introduction

In the most recent decade, Earth observation and measurement technologies, basically dependent on remote sensing (RS), Geographical Information System (GIS), and the Global Navigation Satellite System (GNSS), have become significant data sources for archaeological explorations. In particular, satellites can provide high-resolution, detailed spatial information, which is very useful for prospecting and understanding archaeological landscapes and discovering hidden sites. Satellite technologies offer several advantages in the field of archaeological research; in particular, they are noninvasive and time-saving. Additionally, recent improvements in Earth observation techniques (including both active and passive sensors) offer advanced technical characteristics that can lead new applications and open new perspectives that were inconceivable only a few years ago [1,2,3,4,5]. In this way, landscape archaeology, especially, can benefit from the use of satellite images because such data can place local field studies within a regional context, can be promptly updated for large areas, and be directly imported into a GIS environment. Landscapes are a vital piece of cultural heritage as they preserve the main features that identify and protect the developmental history of human progress over time. The identification of traces of past human activities, still fossilized in the modern landscape, is the first important step required in the preservation of the “material evidence” of the ancient past and human history. Along these lines, satellite remote-sensing imagery can give important data that can be used to (i) study the role and the relation of landscape archaeology to ancient settlement patterns, irrigation systems, and roads [2], and (ii) improve knowledge of past human activities [3].
Over the years, Earth observation data have been used to reconstruct ancient environments and facilitate the identification of areas involved in early environmental management, as done by Wilkinson [4], for example, who exploited CORONA imagery to investigate 8000 years of human landscape history in the Near East, and also in diverse geographic areas of the world characterized by different environments and ecosystems. Nowadays, a rich assortment of modern technologies can be used by remote-sensing archaeologists to identify, detect, delineate, and analyze archaeological sites and their surroundings. Archaeological examinations have, for the most part, been performed by exploiting the most suitable tool according to the specific local conditions, vegetation type and status, soil characteristics, etc. For example, LiDAR was used by Evans et al. [5] in the thickly vegetated region of the ancient city of Angkor, by Stoner [6] and Canuto et al. [7] in Olmec and other rain forests in Mesoamerica to study the Maya, by Bernardini et al. [8] to study Roman remains in Italy, and by Masini et al. [9,10] to discover medieval castles/settlements in southern Italy. In contrast, in arid or desert environments, active and passive satellite remote-data provide very reliable results that can be used to recognize, separate, delineate, and analyze archaeological sites and their surroundings (see, for example, [11,12]), as confirmed by archaeological excavations. Moreover, in past examinations by our research team, GeoEye-1 satellite imagery was used to reveal an ancient water landscape at the Longcheng site in the northern Chaohu Lake Basin, China [13].
In this study, Earth observations technologies were used to improve the comprehension of water use and the water distribution system along the Roman Limes (the border of the empire) in the desert zones of southern Tunisia. Water was one of the most basic elements in the advancement of a fringe protection technique as well as in the evolution of an inundated, oasis agricultural system. The region of interest is very large and is characterised by complex topographic features. To manage these issues, satellite remote sensing was used to improve on the current state of knowledge regarding the ancient Roman water landscape in southern Tunisia, which, today, has still been less concentrated on than the northern parts of the empire (Tunisia, Carthage, and Europe). Features related to Roman canals have been detected and verified through ground surveillance by beginning from existing knowledge [14,15,16,17,18,19,20,21,22,23,24,25]. This is very much depicted by Trousset [18,19,20,21,22,23,24,25] in comprehensive overviews of archeological and literary sources. Trousset et al. [18,19] endeavored to define and classify hydraulic techniques, distinguishing two locales: (i) A peri-Aurasian area in northern Tunisia, described by piedmont developments, and (ii) the Tripolitania area in southern Tunisia, defined by the development of the Sahara Desert [19,20]. As far as our study region is concerned, the known hydraulic structures are located so as to exploit two water sources: The oasis and the rain from the mountain areas used to build a network of handlers, dams, and canals [24,25].
In Tunisia during the Roman period, people saw the Wadi el Melah Valley (WMV) system, which is similar to the image of agricultural society development in arid regions. Today, it still attracts great interest in agricultural production under extreme climate conditions. In desert and semiarid ecosystems, the Romans went to great lengths to develop canals and cisterns to “adapt to” the environment, as is the case in the Tunisian southern border region, where the most impressive Limes of The Roman Empire can be found. To date, archeological research has focused on Roman roads that cross the pre-Saharan and Sahara regions (Figure 1A), as this is essential for understanding how the Romans controlled these extreme borders.
To sum up, this study aims to open new directions for the study of Roman landscapes in southern Tunisia, a topic of great interest for several reasons, among which is the role of climatic and environmental changes in the decline of ancient Roman civilization. It also can be used as a reference to open up the prospect of exciting scientific and archaeological challenges that impose ad hoc approaches by using very high-resolution (VHR) remote-sensing imagery and automatic classification of archaeological sites.

2. Materials and Methods
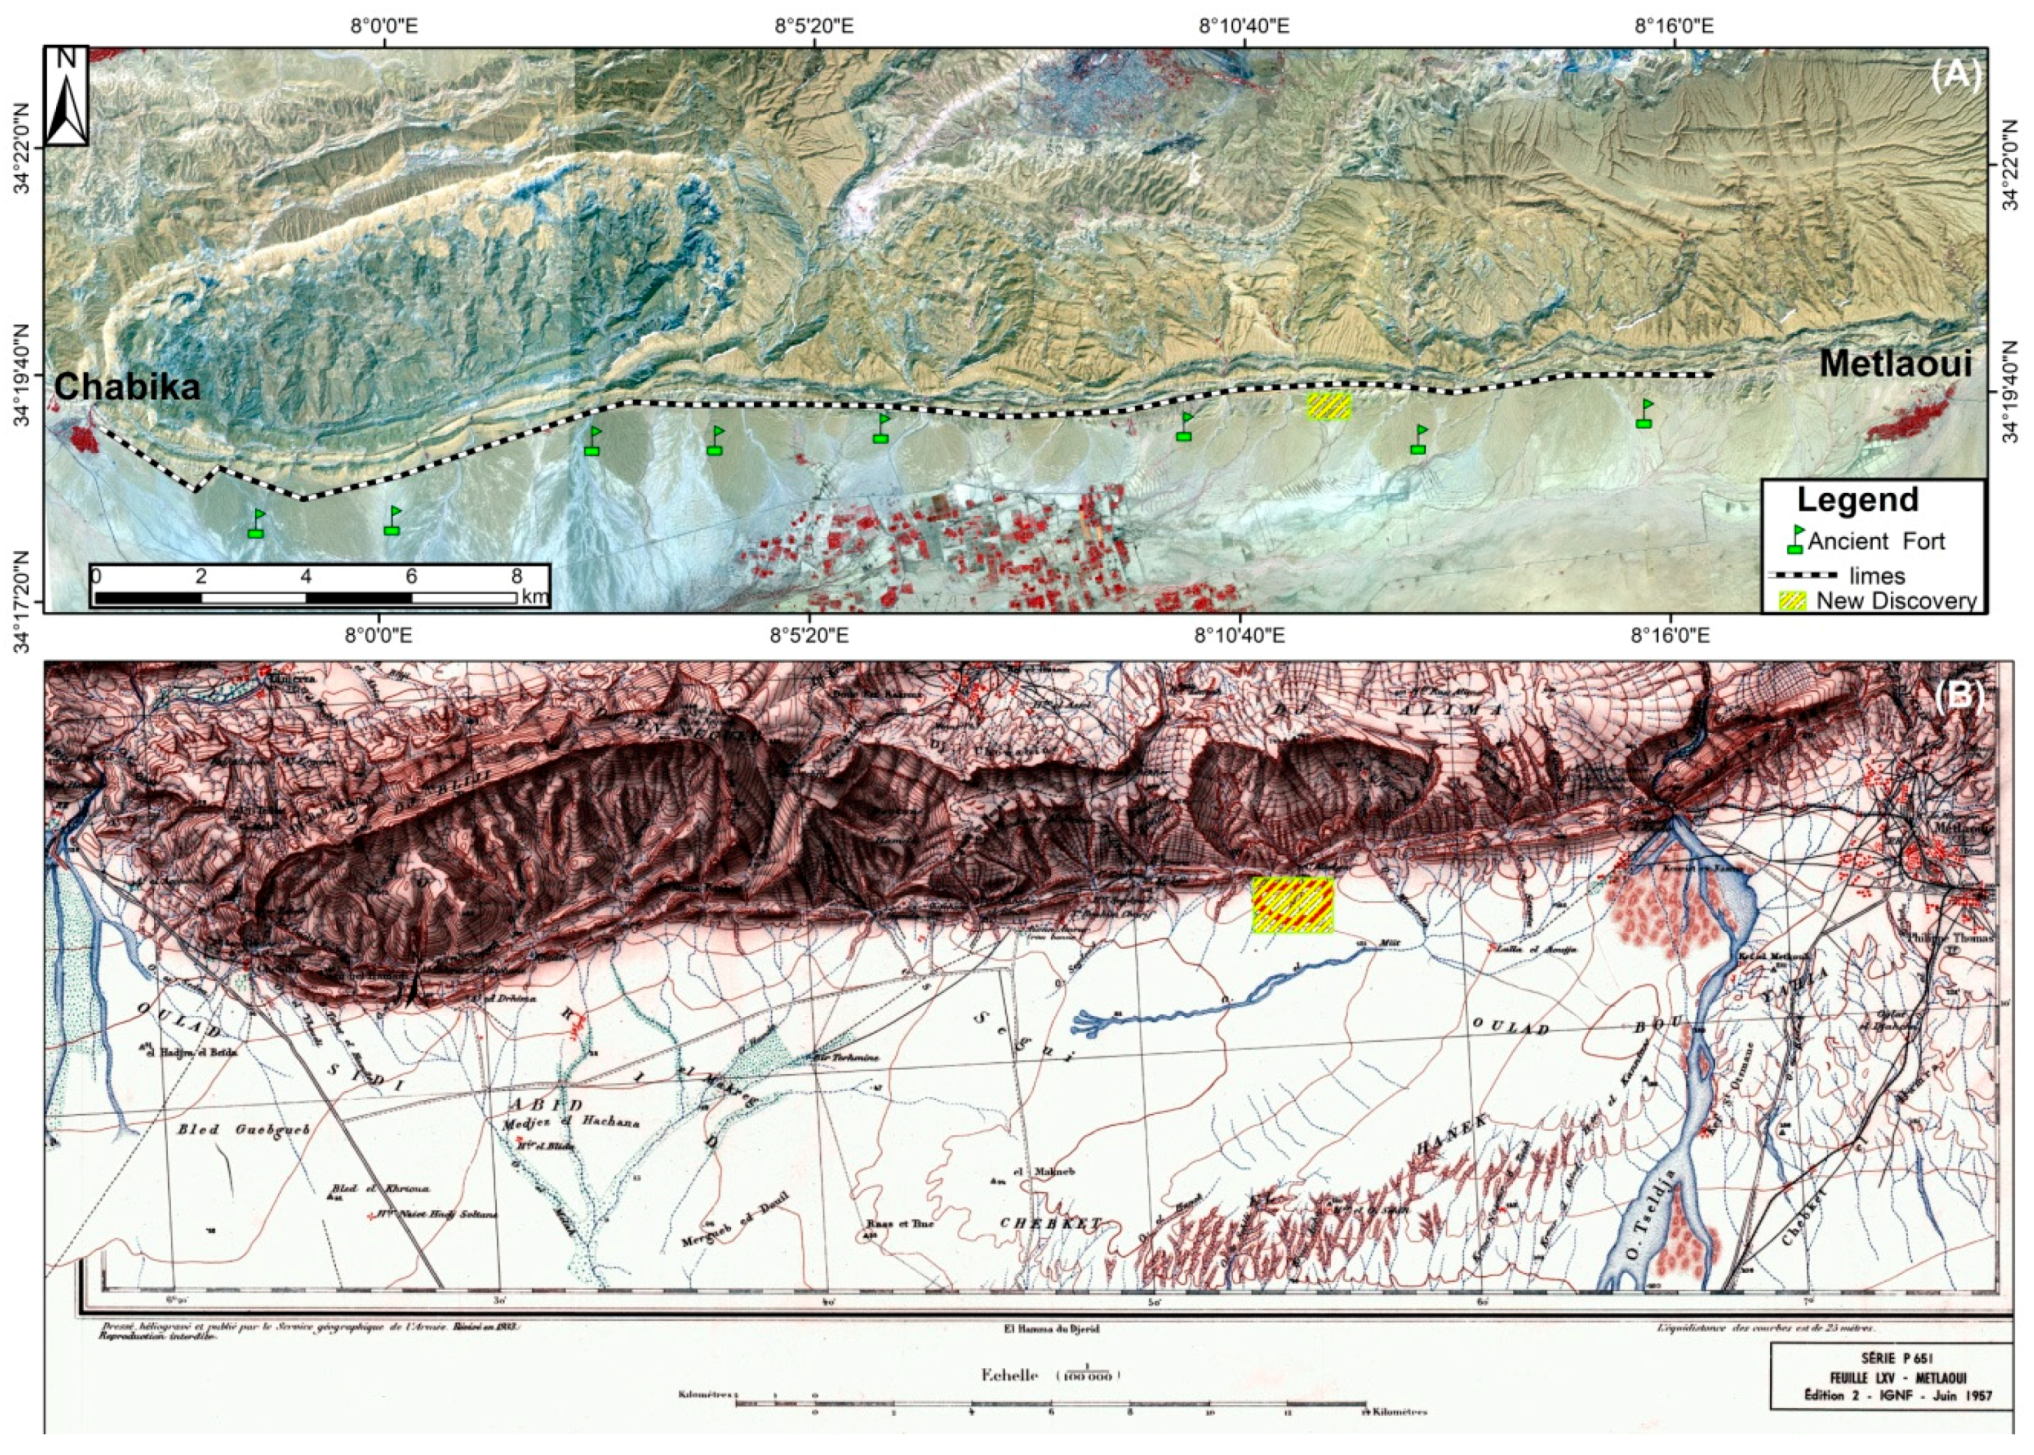
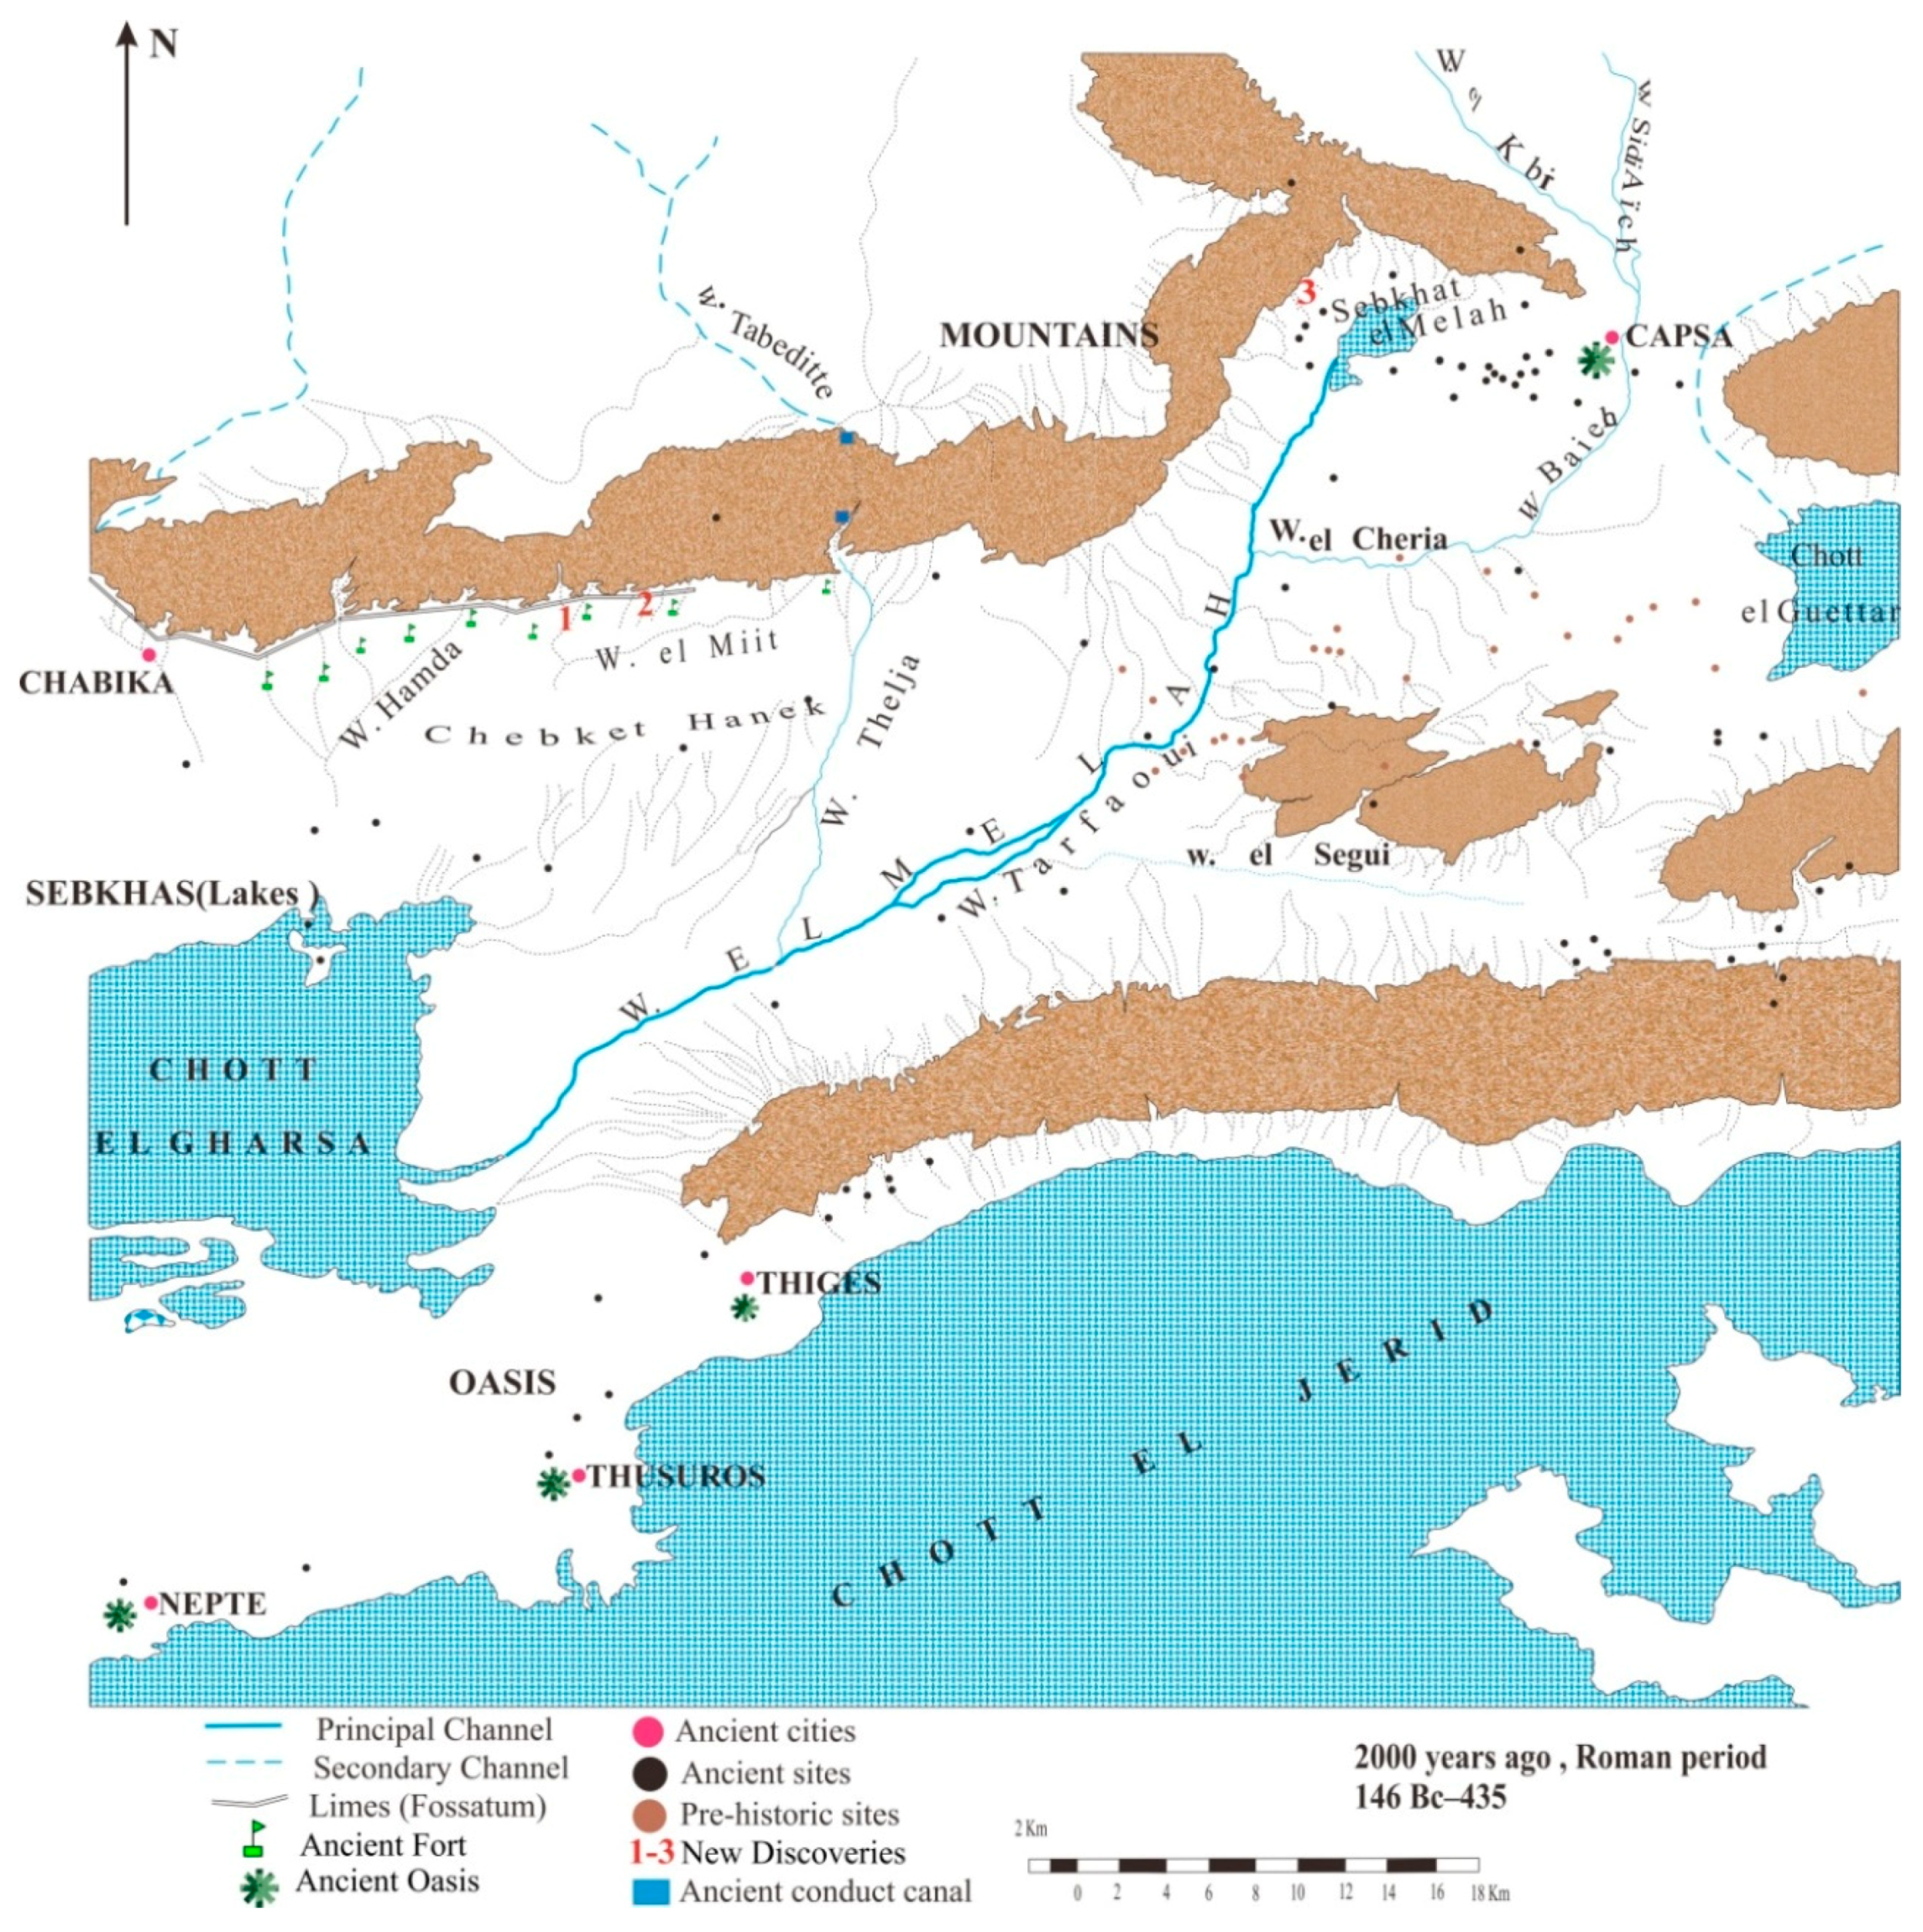
2.1. Study Area

The WMV is located in the southwest of the Gafsa region (southern Tunisia), somewhere in the range of 34°05′52″ and 35°06′19″ north and 8°30′06″ and 9°30′26″ east (Figure 1B,C). It is created by a chain of high plains, delimited by mountains, and progressively descends towards the south. It has a most extreme height of 1479 m. The expression “Wadi” in Arabic refers to a valley-like landscape, normally found in and around desert areas. From a geological point of view, the WMV is situated in the easternmost part of the southern Gafsa, a thrust-and-fold belt chain. Intersecting a lot of plains that receive the scarce waters of the mountain ranges, the Melah River is located in a basin in Sebkhat. Indeed, along its course, the WMV receives the waters of the two main wadis in the region, namely, the Wadi of Baiech and the Wadi of Thelja. Further south are the oases of Tozeur, el Hamma of Jerid, and Nefta, which were and are centers of settled life on the edge of the great desert. The region is defined by a yearly precipitation under 20 mm. The isthmus of Jerid is the only available passage by road between the Sahara and the Tunisian steppes. Chott el Gharsa encompasses the isthmus in the east and Chott el Jerid surrounds it in the west [26,27].

2.2. Satellite Remote Sensing Data

A GeoEye-1 (GE-1) image was procured on 08 November 2018. The image was given in Universal Transverse Mercator (UTM) coordinates (Zone 32 N, datum WGS84) at full radiometric resolution. GE-1 provides data from two imaging sensors: A panchromatic (PAN) sensor, which has a spatial resolution of 0.5 m, and a multispectral (MS) sensor, which acquires data in 4 spectral bands covering the blue, green, red, and NIR regions from 450 nm to 920 nm (Table 1).
ZY-3 (Ziyuan-3 or Resources-3) is China′s first civil high-resolution mapping satellite. Launched in the spring of 2012, it provides 2.1 m resolution PAN and 5.8 m resolution multispectral (MS) image products for topographical mapping and observation of land resources. The ZY-3 PAN imagery used in this study was acquired from the China Centre for Resources Satellite Data and Application.
The strategy that was adopted was based on the integration of different tools and data- processing techniques that are discussed in sequence below.
As a first step, a baseline georeferenced database was developed in ArcGIS 10.4. The database includes 1:50,000 cartographic baseline data obtained from the Tunisian Heritage Institute, as well as freely available topographic (ASTER GDEM) geospatial data. In this GIS database, the 1:100,000 scale archeological maps available in this area [26,27] are also digitized and georeferenced: The classification of sites and the number and type of archeological sites are recorded.
This progress includes refreshing the GIS database with new archeological site data obtained in the system ground overview. When coordinated with baseline information collected from available resources and produced by satellite remote-sensing technology, these detailed field data would help assess the benefits of remote-sensing methods based on the size and location of archeological anomalies found. All in all, a GIS environment can help you understand WMV status in more detail by:
(i) Processing various data sources collected at different spatial resolutions, which can be used to reconstruct the ancient Roman landscape [28,29];
(ii) Assessing the accuracy of the remote-sensing results by comparing it with the data provided by the conventional archaeological maps along with the archaeological records revealed in the ancient literature and assembled during the field studies mentioned above;
(iii) Identification (the overall theme of this paper) of possible archaeological remains with satellite remote-sensing and GIS technology, followed by GNSS-based ground surveys and inspections. The field campaigns were obtained in December 2017 and April 2018, and the satellite images were obtained in November 2018. This study carried out a reverse engineer: The location of forts/canals/villa obtained using field coordinates (GNSS) and later obtaining approximately the same location by means of remote sensing based on satellite imagery.

3. Remote-Sensing Data Preprocessing

3.1. Data Preprocessing

Starting from the latest advancements in the use of remote sensing for archaeological explorations, including passive remote-sensing (photography and multi-/hyperspectral) [30,31,32,33,34,35,36] and active remote-sensing (SAR and LiDAR) [37,38,39,40,41,42,43] imaging sensors mounted on the airborne and spaceborne platforms [44,45], in this study, we used a few numerous remote-sensing data sets, including GE-1 and Chinese ZY-3 VHR imagery. For the purpose of our examinations, the GE-1 and ZY-3 images were first atmospherically and geometrically corrected, and then pansharpened using Gram Schmidt data fusion [43,44]. The methodological approach used for the identification of features of interest was fundamentally founded on the use of texture-analysis algorithms to speed up and improve the recognition of potential anomalies and patterns related to the buried remains of potential archaeological interest.
To further highlight archaeological features, false-color RGB (average (Red), standard deviation (Green), and dissimilarity (Blue)) composites made from different band combinations were also used. This method attempts to create color images with optimal conditions by testing different combinations of bands for archeological interpretation on a regional scale, including RGB composites suggested in other research to highlight archeology in arid and semiarid environment features [46]. For the detection of archaeological features, we used a dataset made up of all the pansharpened scenes. It was chosen to do this because the highest spectral separability for the site borders was observed using the pansharpened scenes (Figure 2 and Figure 3).
Different band combinations were tested using the preprocessed GE-1 and ZY-3 imagery of our study area: The 4-1-2 (RGB) and 4-3-2 (RGB) false-color composites provided a greater visual contrast for regions where there were potential buried archaeological remains [47,48]. Along with these remains, two other regions were also identified: One where ancient artificial canals were present (Figure 4) and a second one where a pattern probably correlated to a fortification and/or structures close to the ancient canal could be seen (Figure 5).

3.2. Spatial Co-Occurrence Measurement

Texture analysis was performed using occurrence (and co-occurrence) measures organized in a matrix together with specific statistical measures computed from this matrix to create the filtered value for the target cell. The occurrence and co-occurrence metrics respectively use the number of occurrences and co-occurrences of every gray level in the processing window to calculate texture indicators such as mean, variance, dissimilarity, and entropy (Equations (1)–(7)). This means that many useful image descriptors can be obtained through texture observation and analysis. The texture classification used here depends on the distinguishing features obtained from the mean, in which case the mean is the local mean of the processing window and the statistical measures discussed below. The variance measures the local variance of the window:
V a r i a n c e = i j ( i u ) 2 ( p i , j )
The correlation measures the linear dependency of a gray level on the gray levels of neighboring image cells:
C o r r e l a t i o n = i j p ( i , j ) m x m y s x s y
The contrast measures the gray-level contrast by using weighting factors equal to the square of the gray-level difference:
C o n t r a s t = n = 0 N g 1 ( n ) 2 i = 1 N g j = 1 N g p ( i , j )
The weighting factors used for the dissimilarity are equal to the absolute value of the gray-level difference:
D i s s i m i l a r i t y = n = 0 N g 1 ( n ) i = 1 N g i = 1 N g j = 1 N g p ( i , j ) 2
The homogeneity (which is effectively the inverse of the contrast) measures the smoothness of the area within the image:
H o m o g e n e i t y = i j 1 1 + ( i j ) 2 p ( i , j )
The second moment measures the textural uniformity of the area within the image:
S e c o n d m o m e n t = n = 0 j = 1 p ( i , j ) 2
The entropy measures the randomness or disorder of the area within the image:
E n t r o p y = i j = 1 p ( i , j ) l o g ( ( p i j ) )

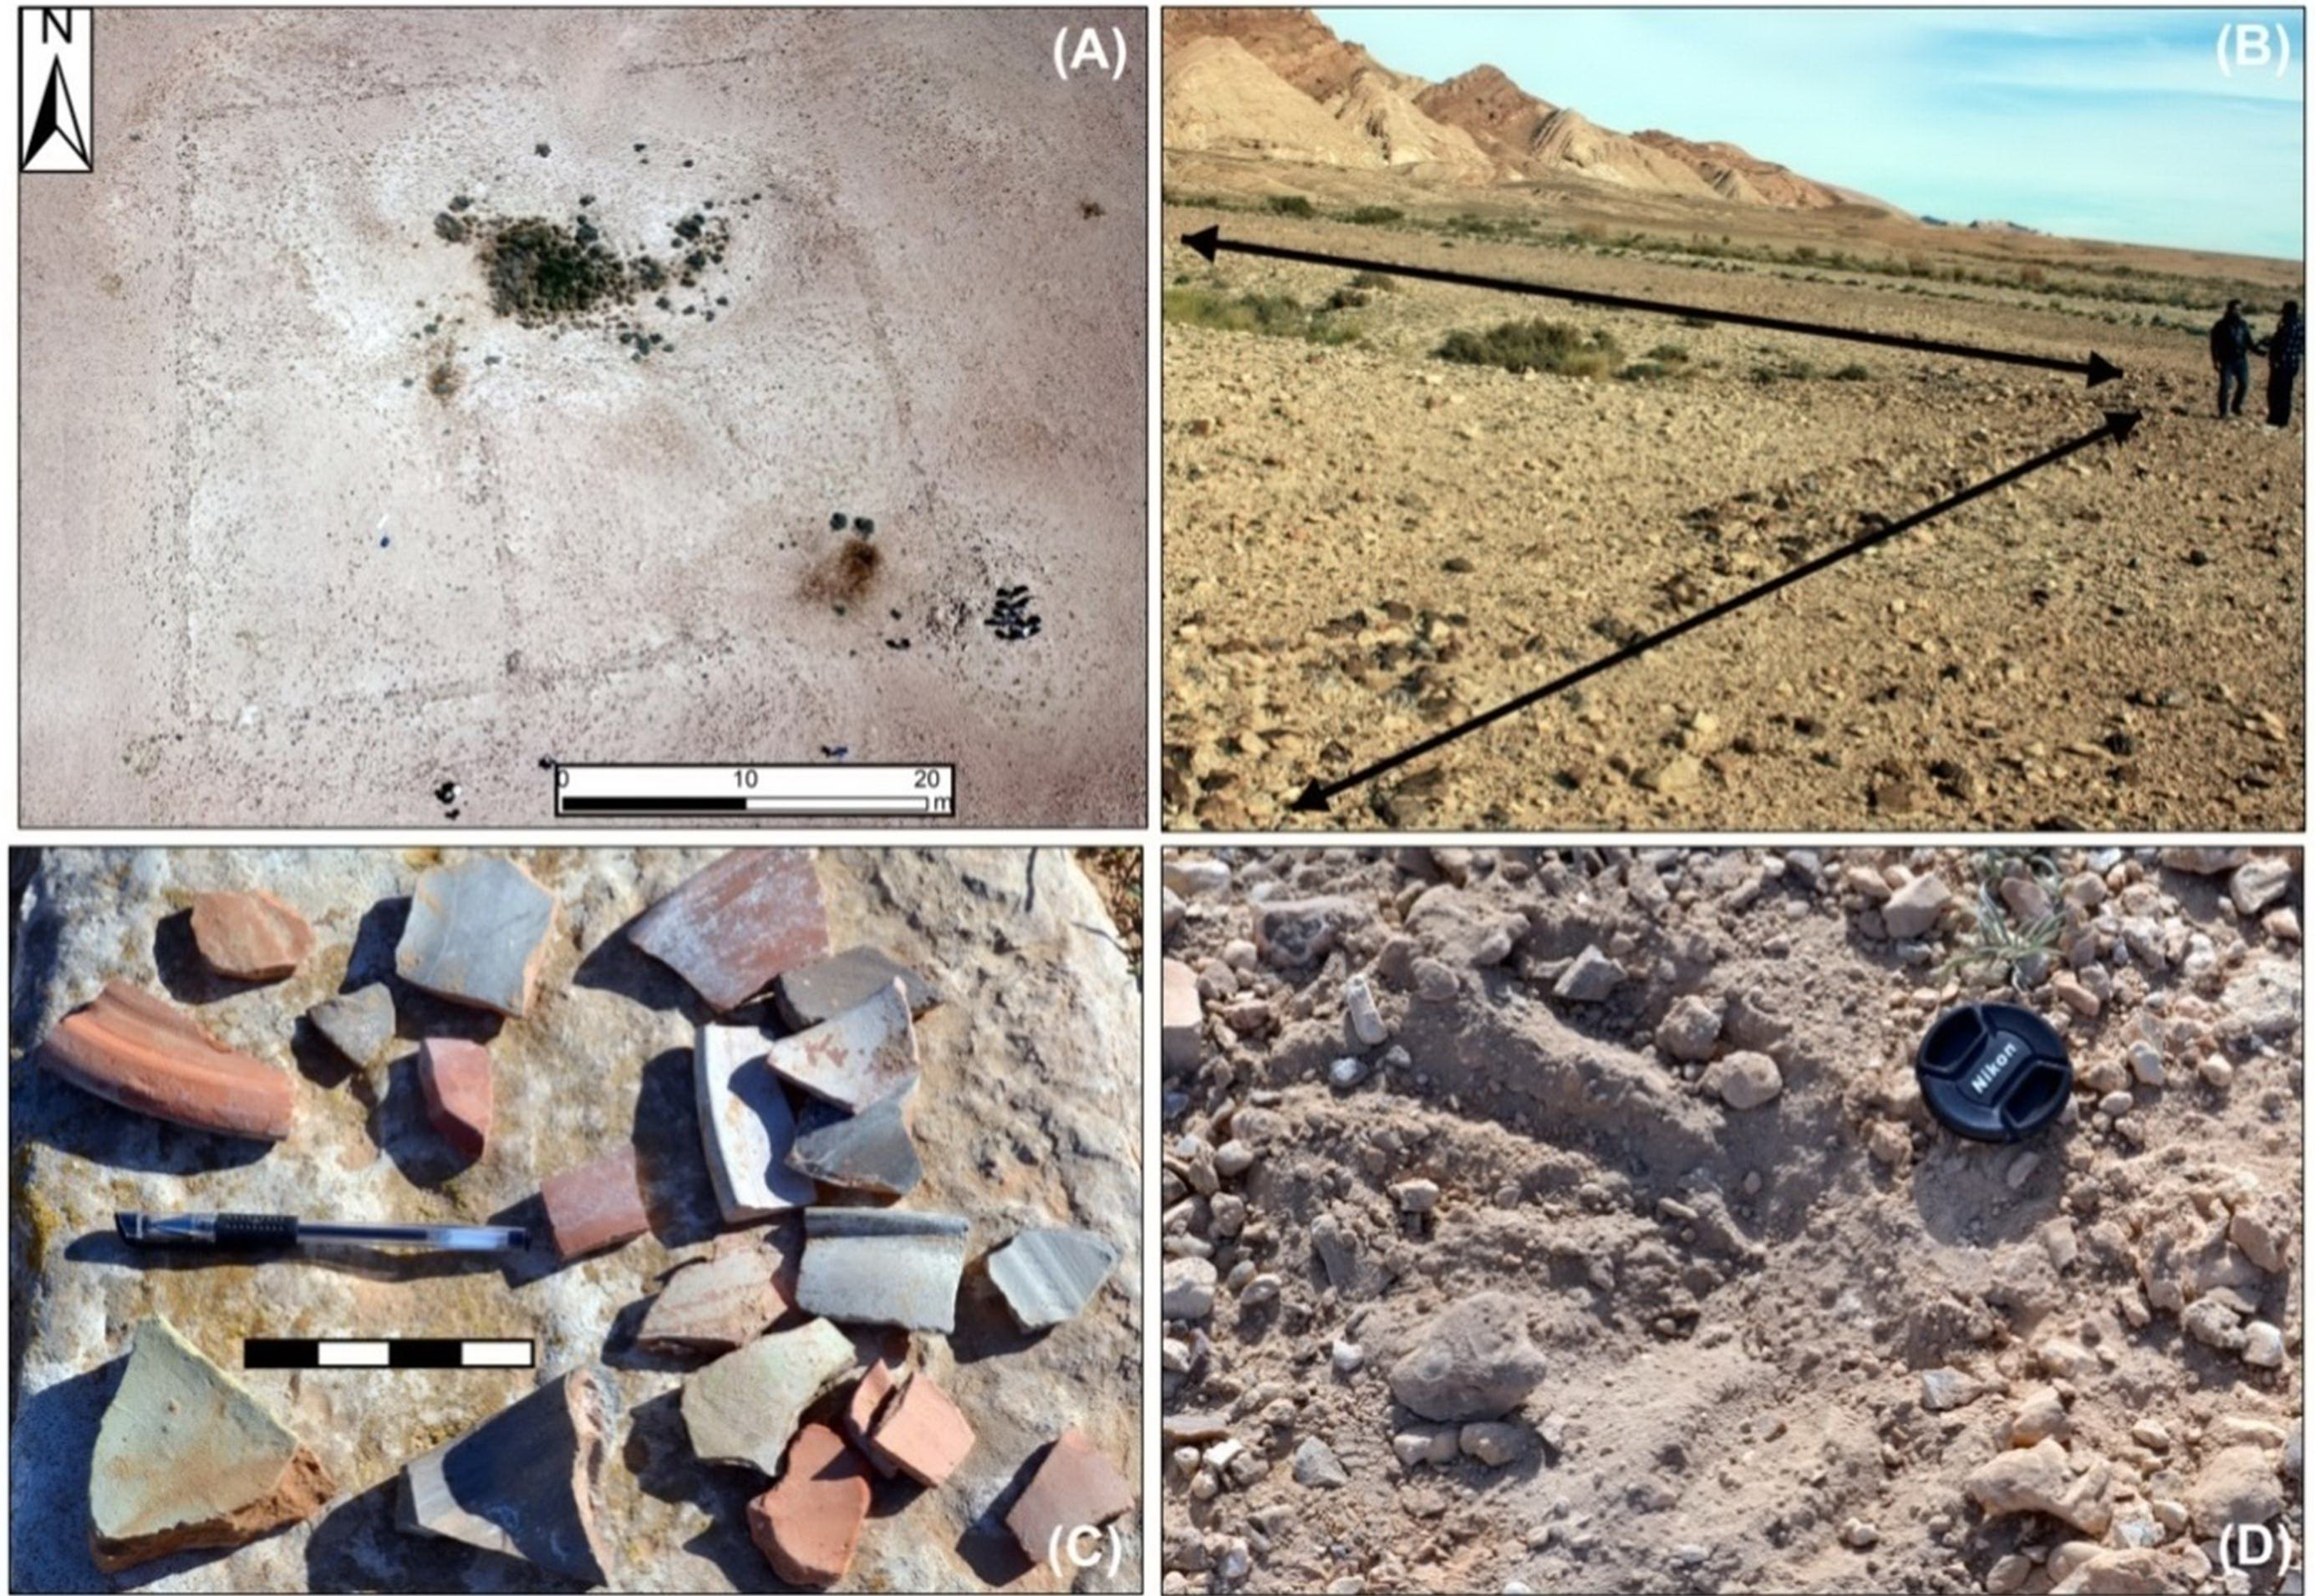
3.3. Archaeological Fieldwork

By integrating data from the past two phases, we can: (i) Identify spatially relevant trends between archeological records and the surrounding landscape, and (ii) conduct targeted field surveys to identify areas with limited spatial concentration. In order to help the detailed research of these areas, three polygons were selected in the inspection area as places where new discoveries could be found. There was no vegetation coverage, and flat terrain supported this method. We used handheld GNSS equipment to locate archeological discoveries in the valley and recorded their basic highlights as field records and digital photography.

4. Results and Discussion

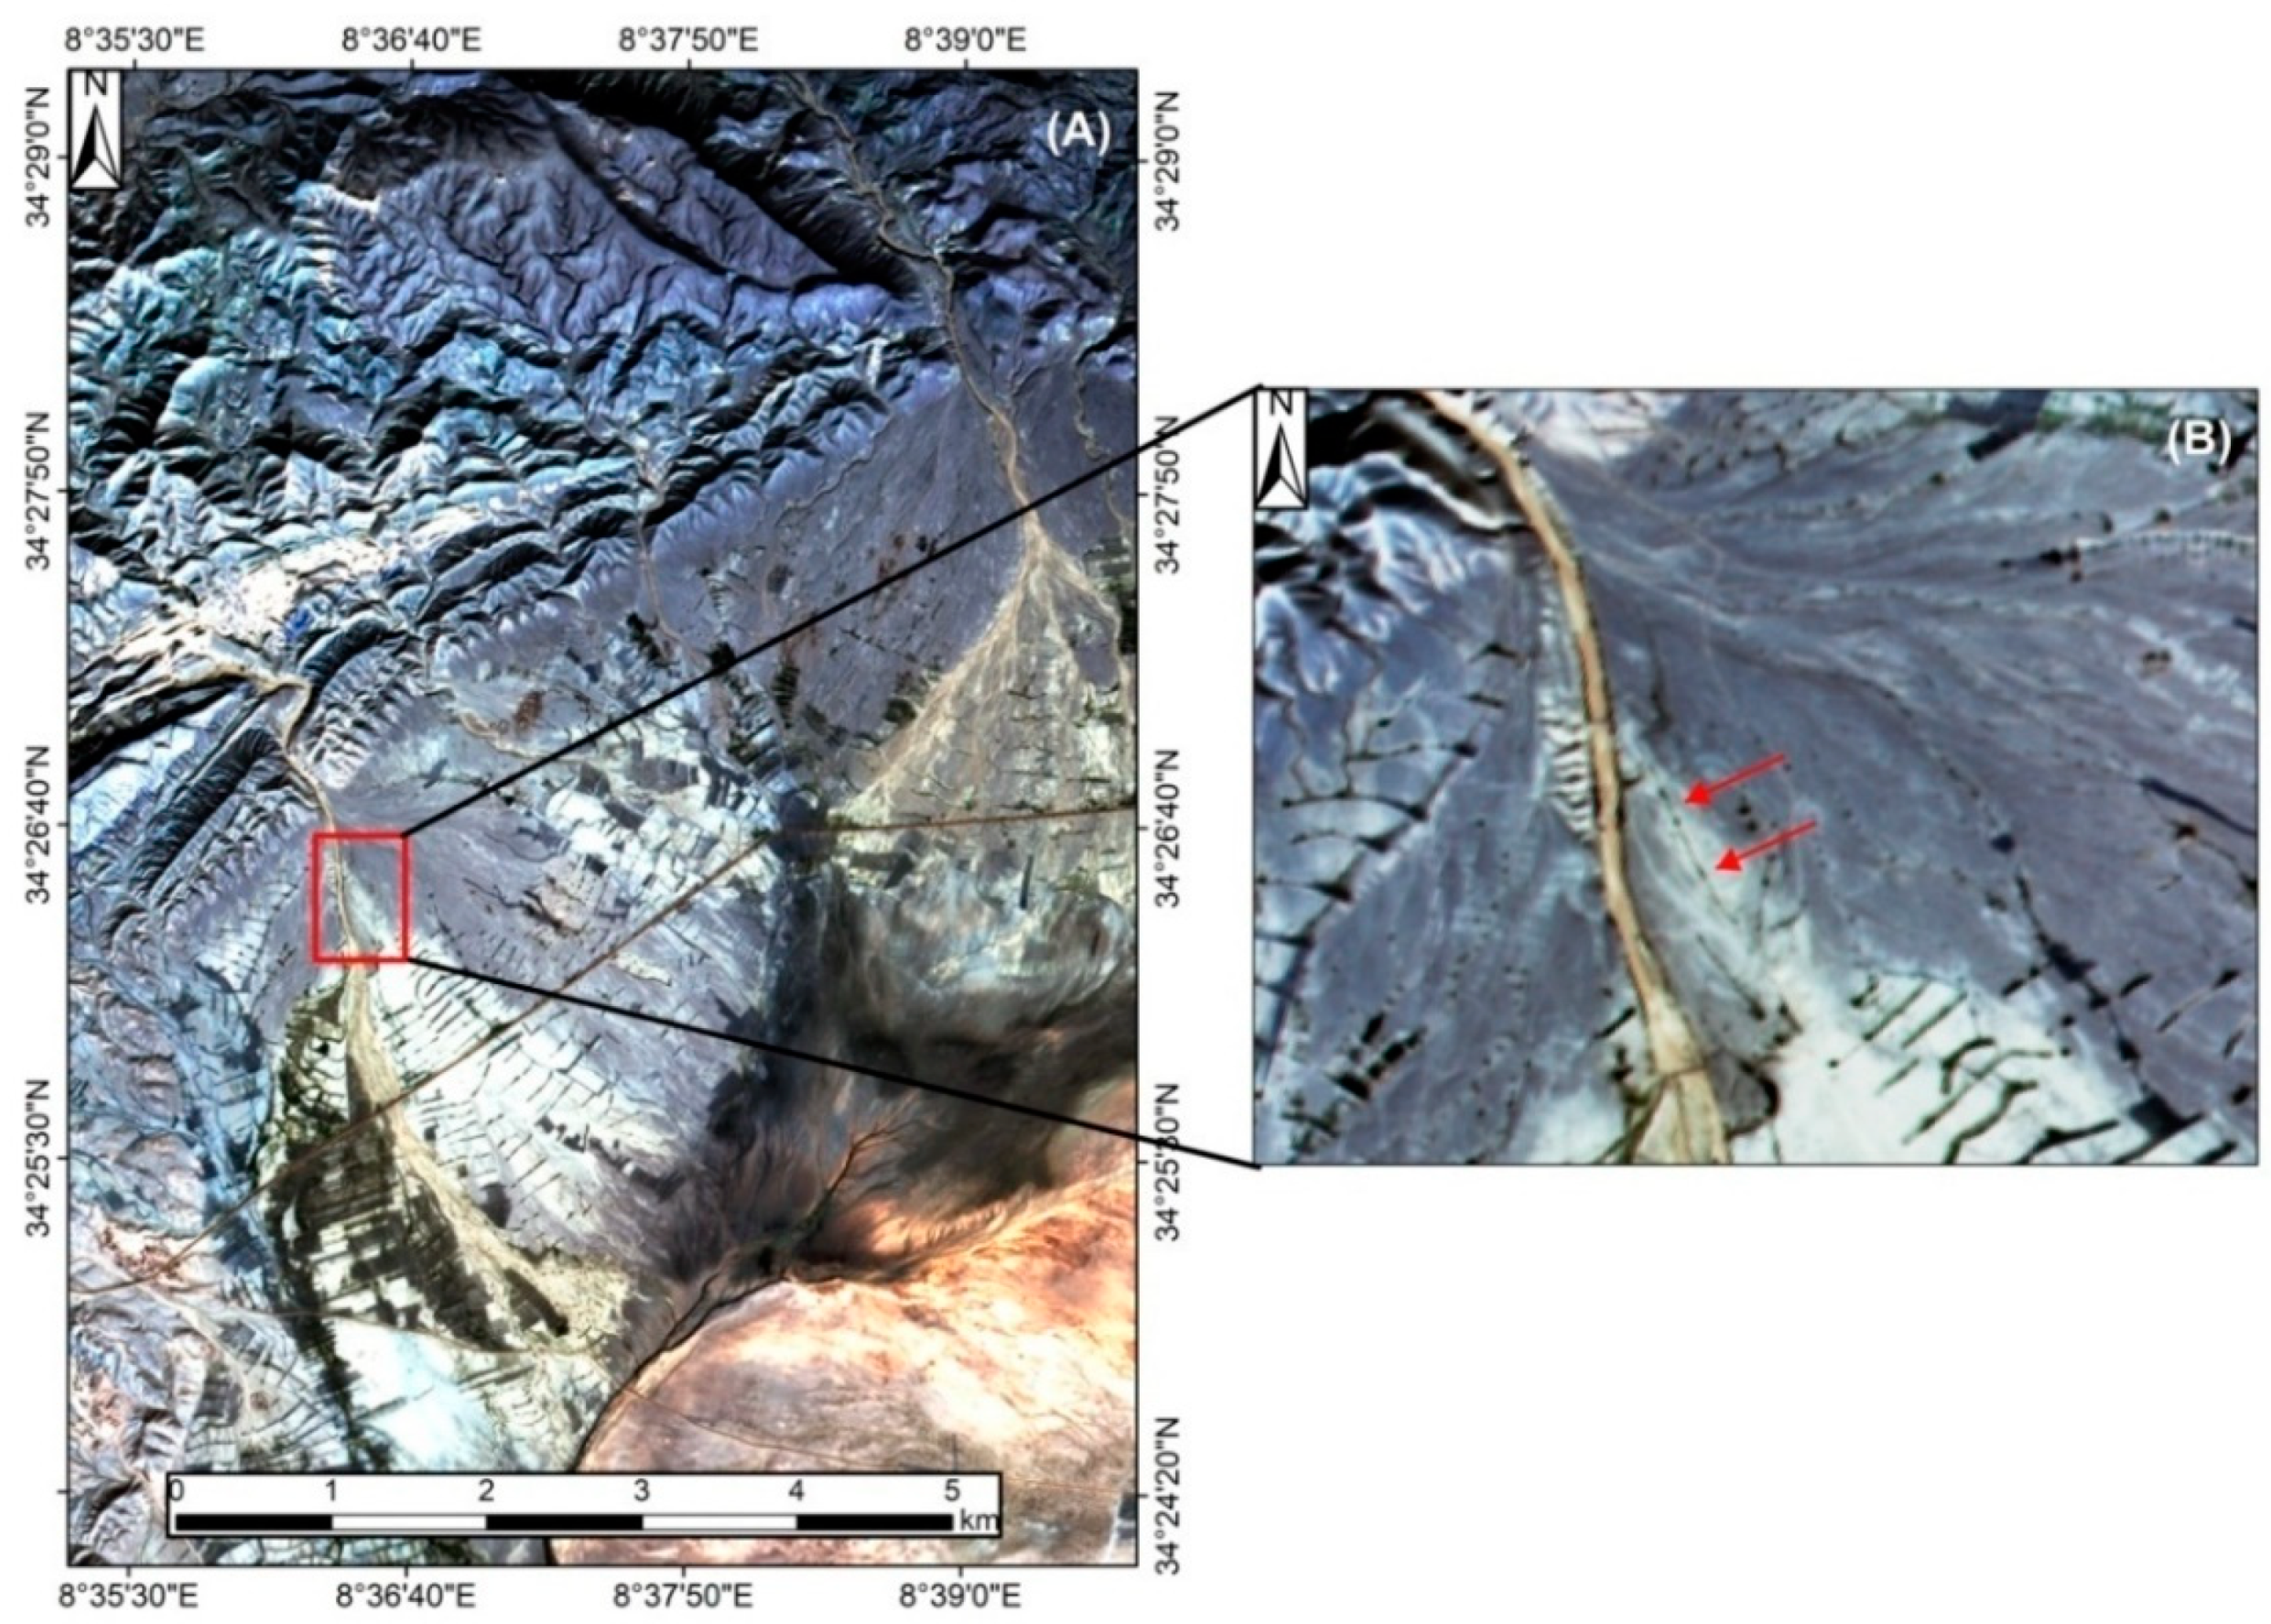
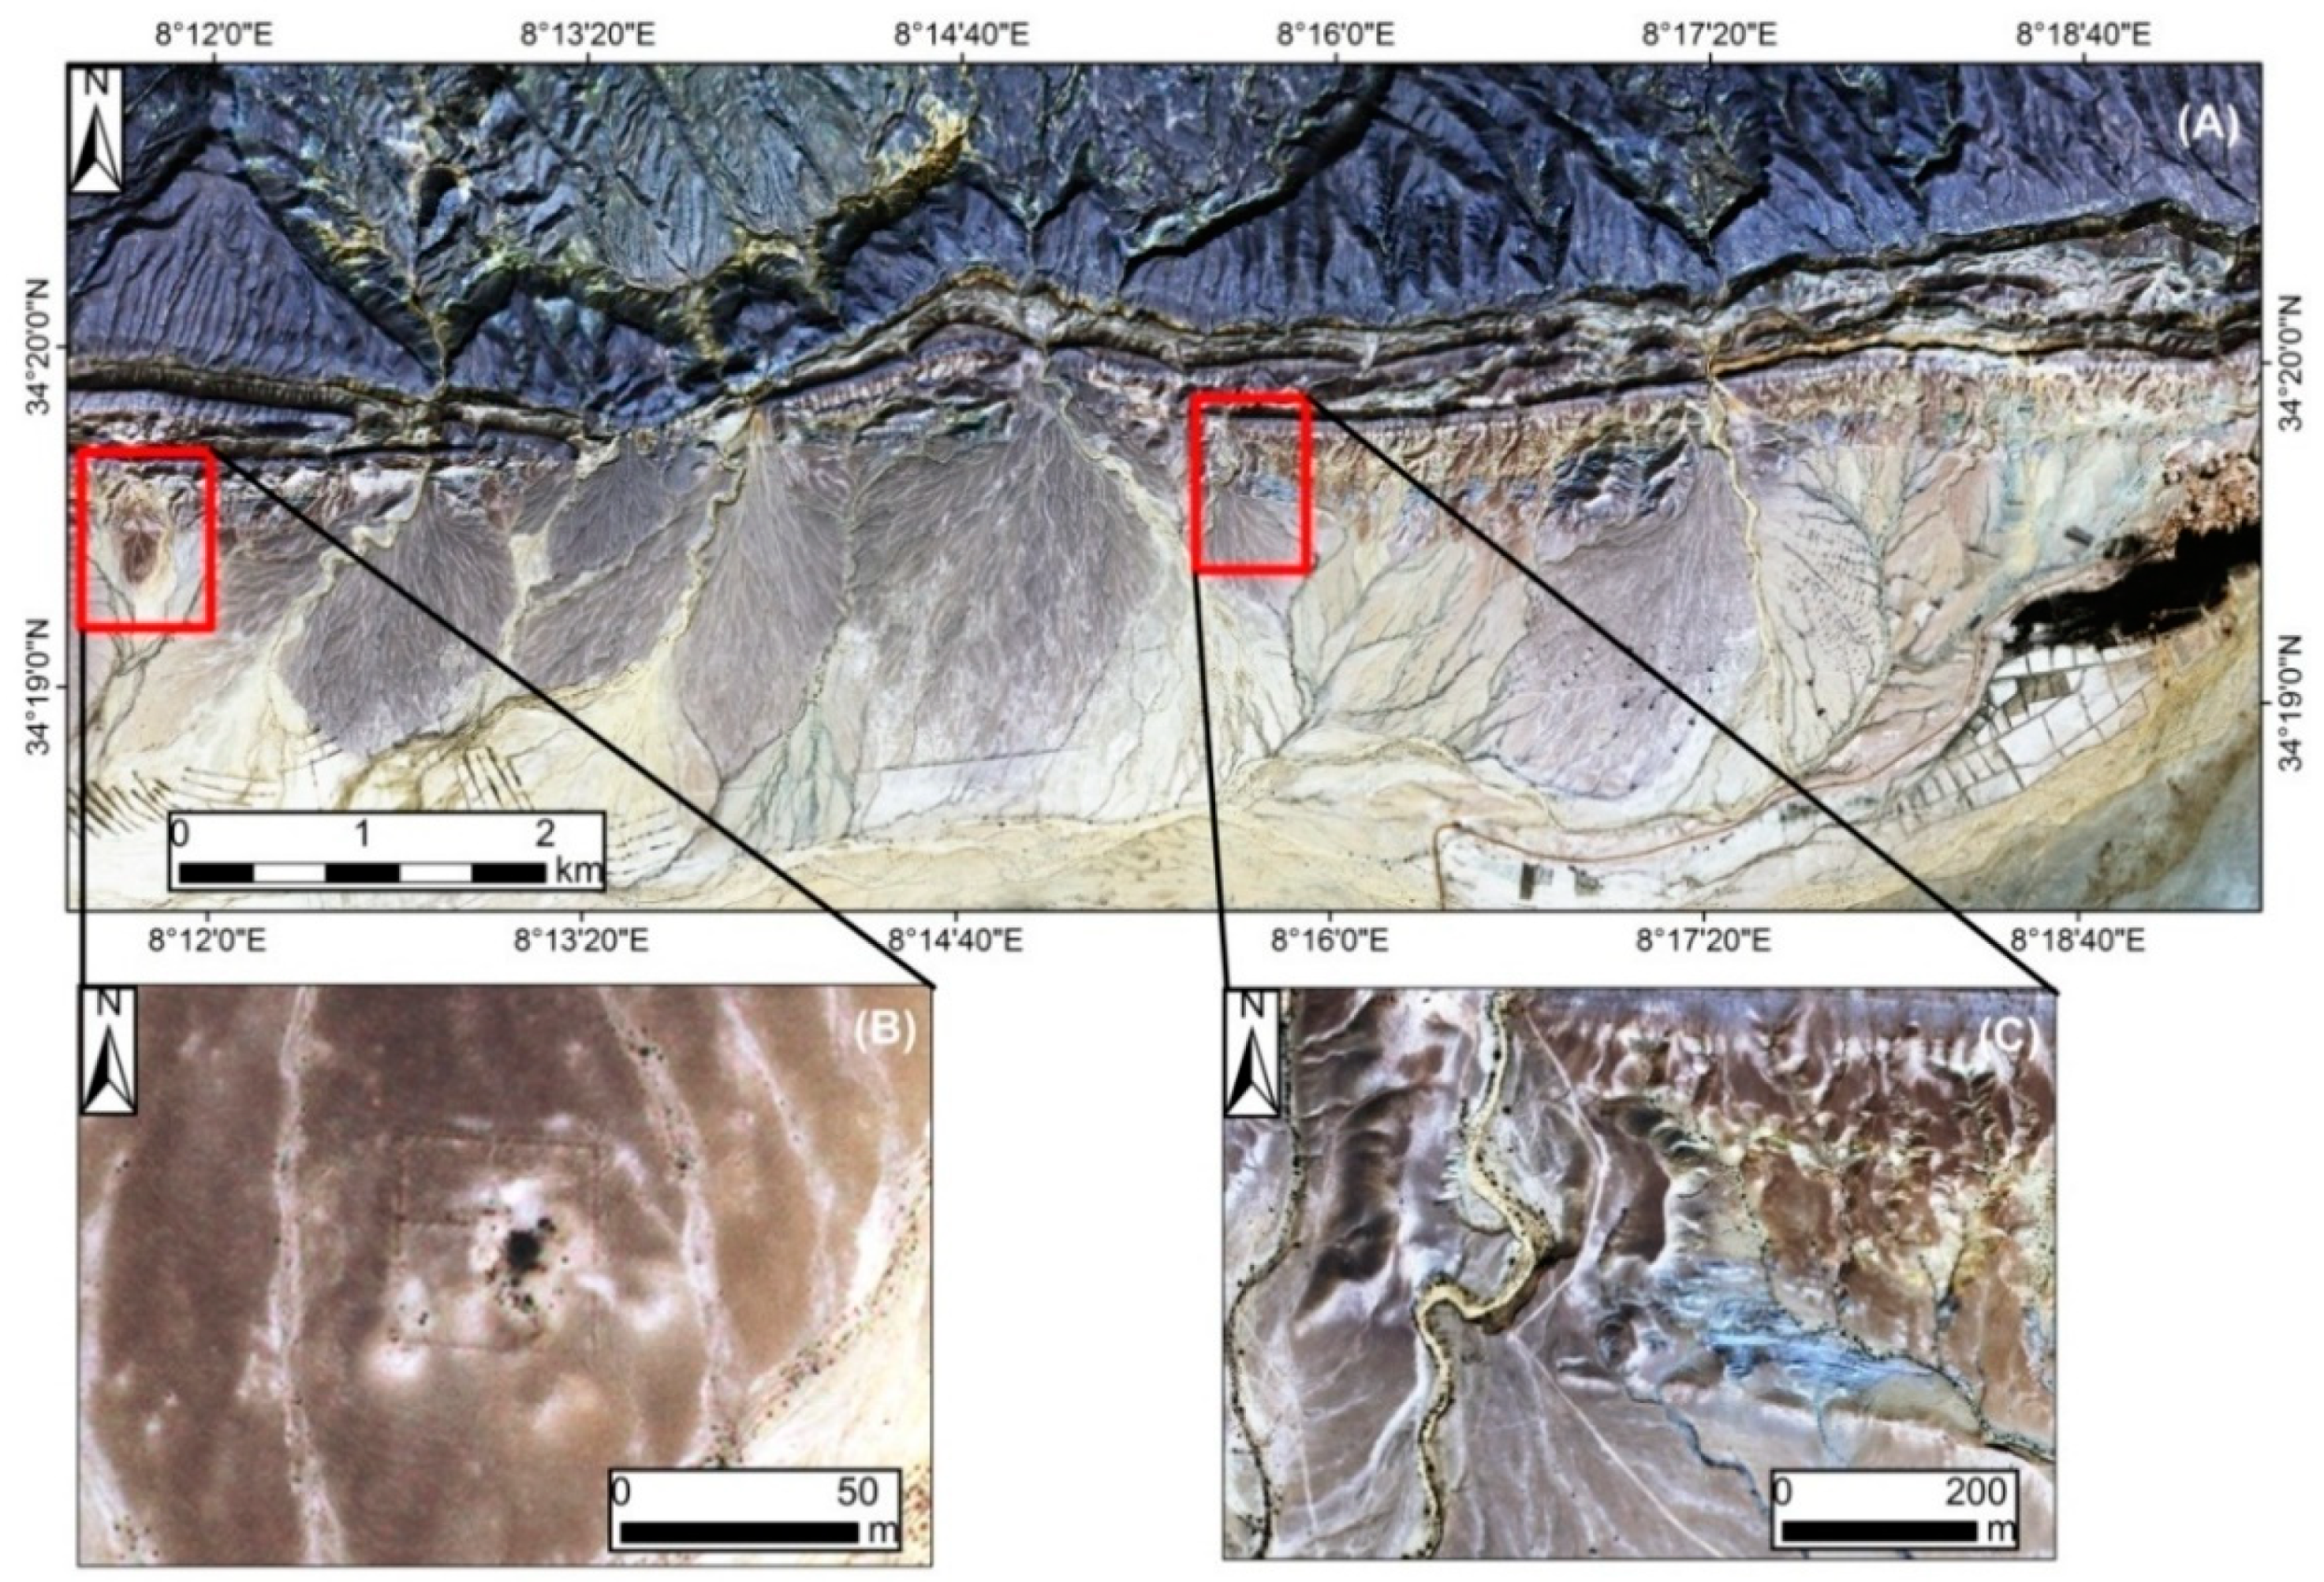
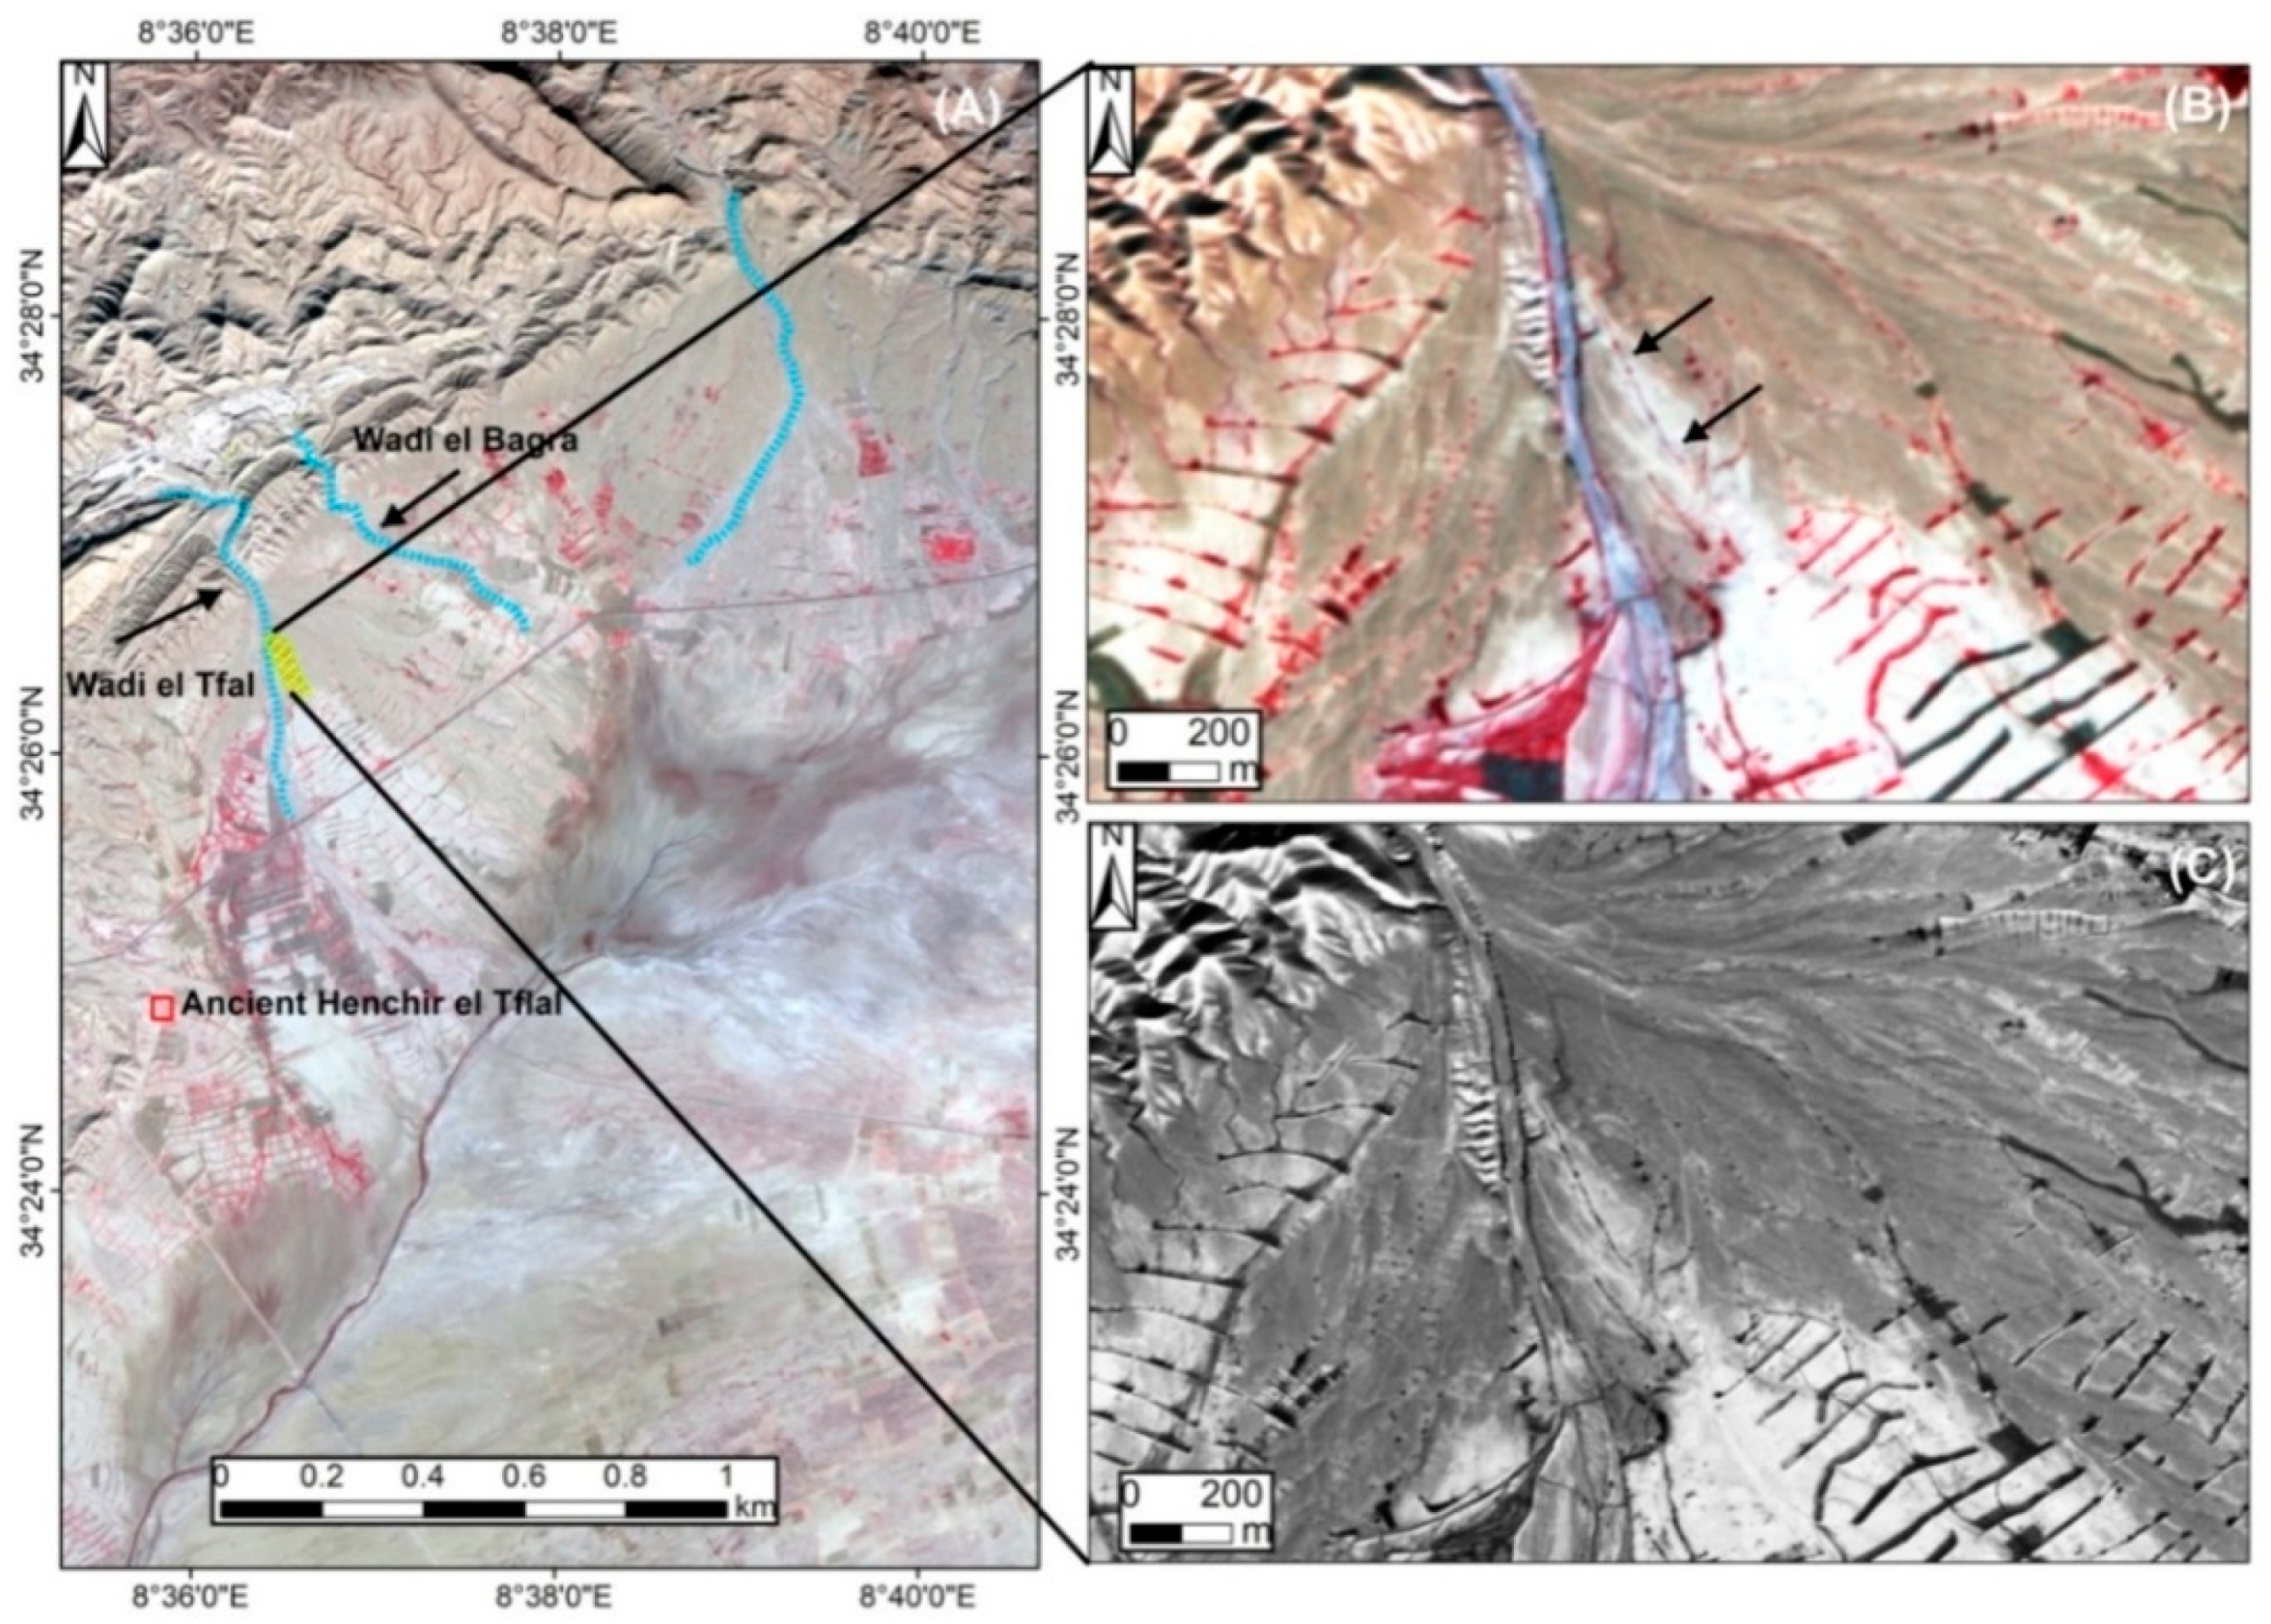
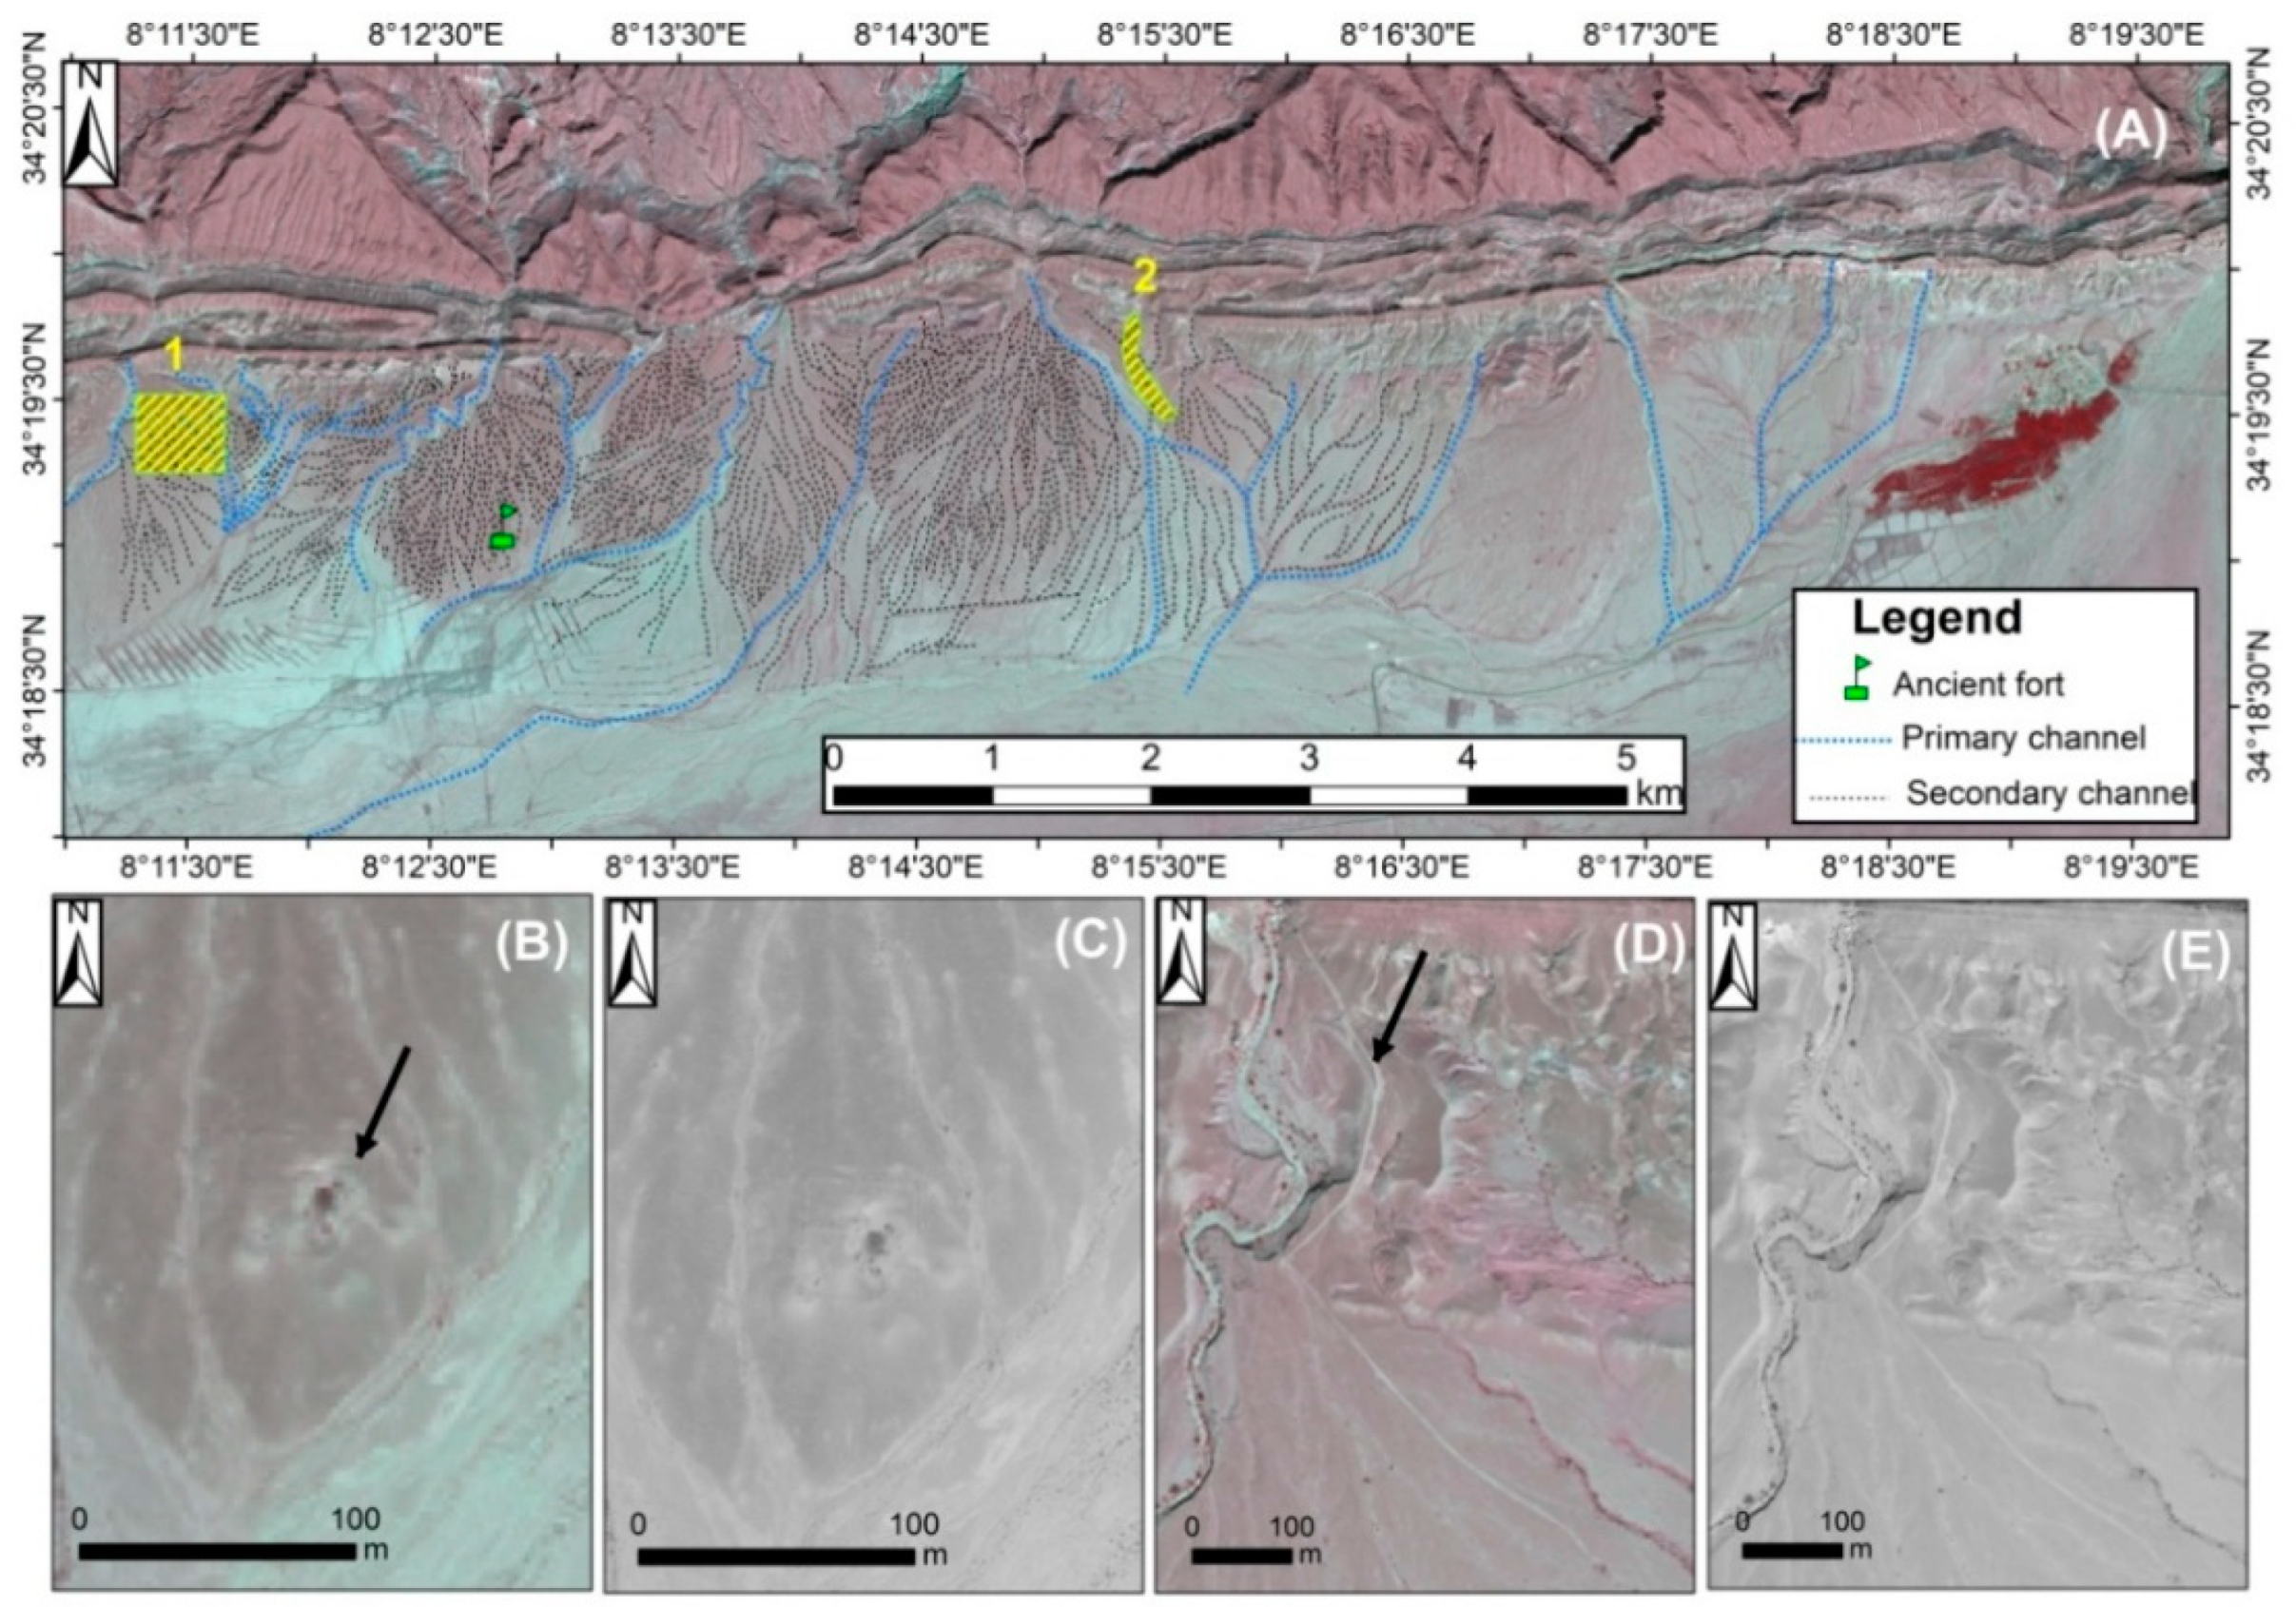
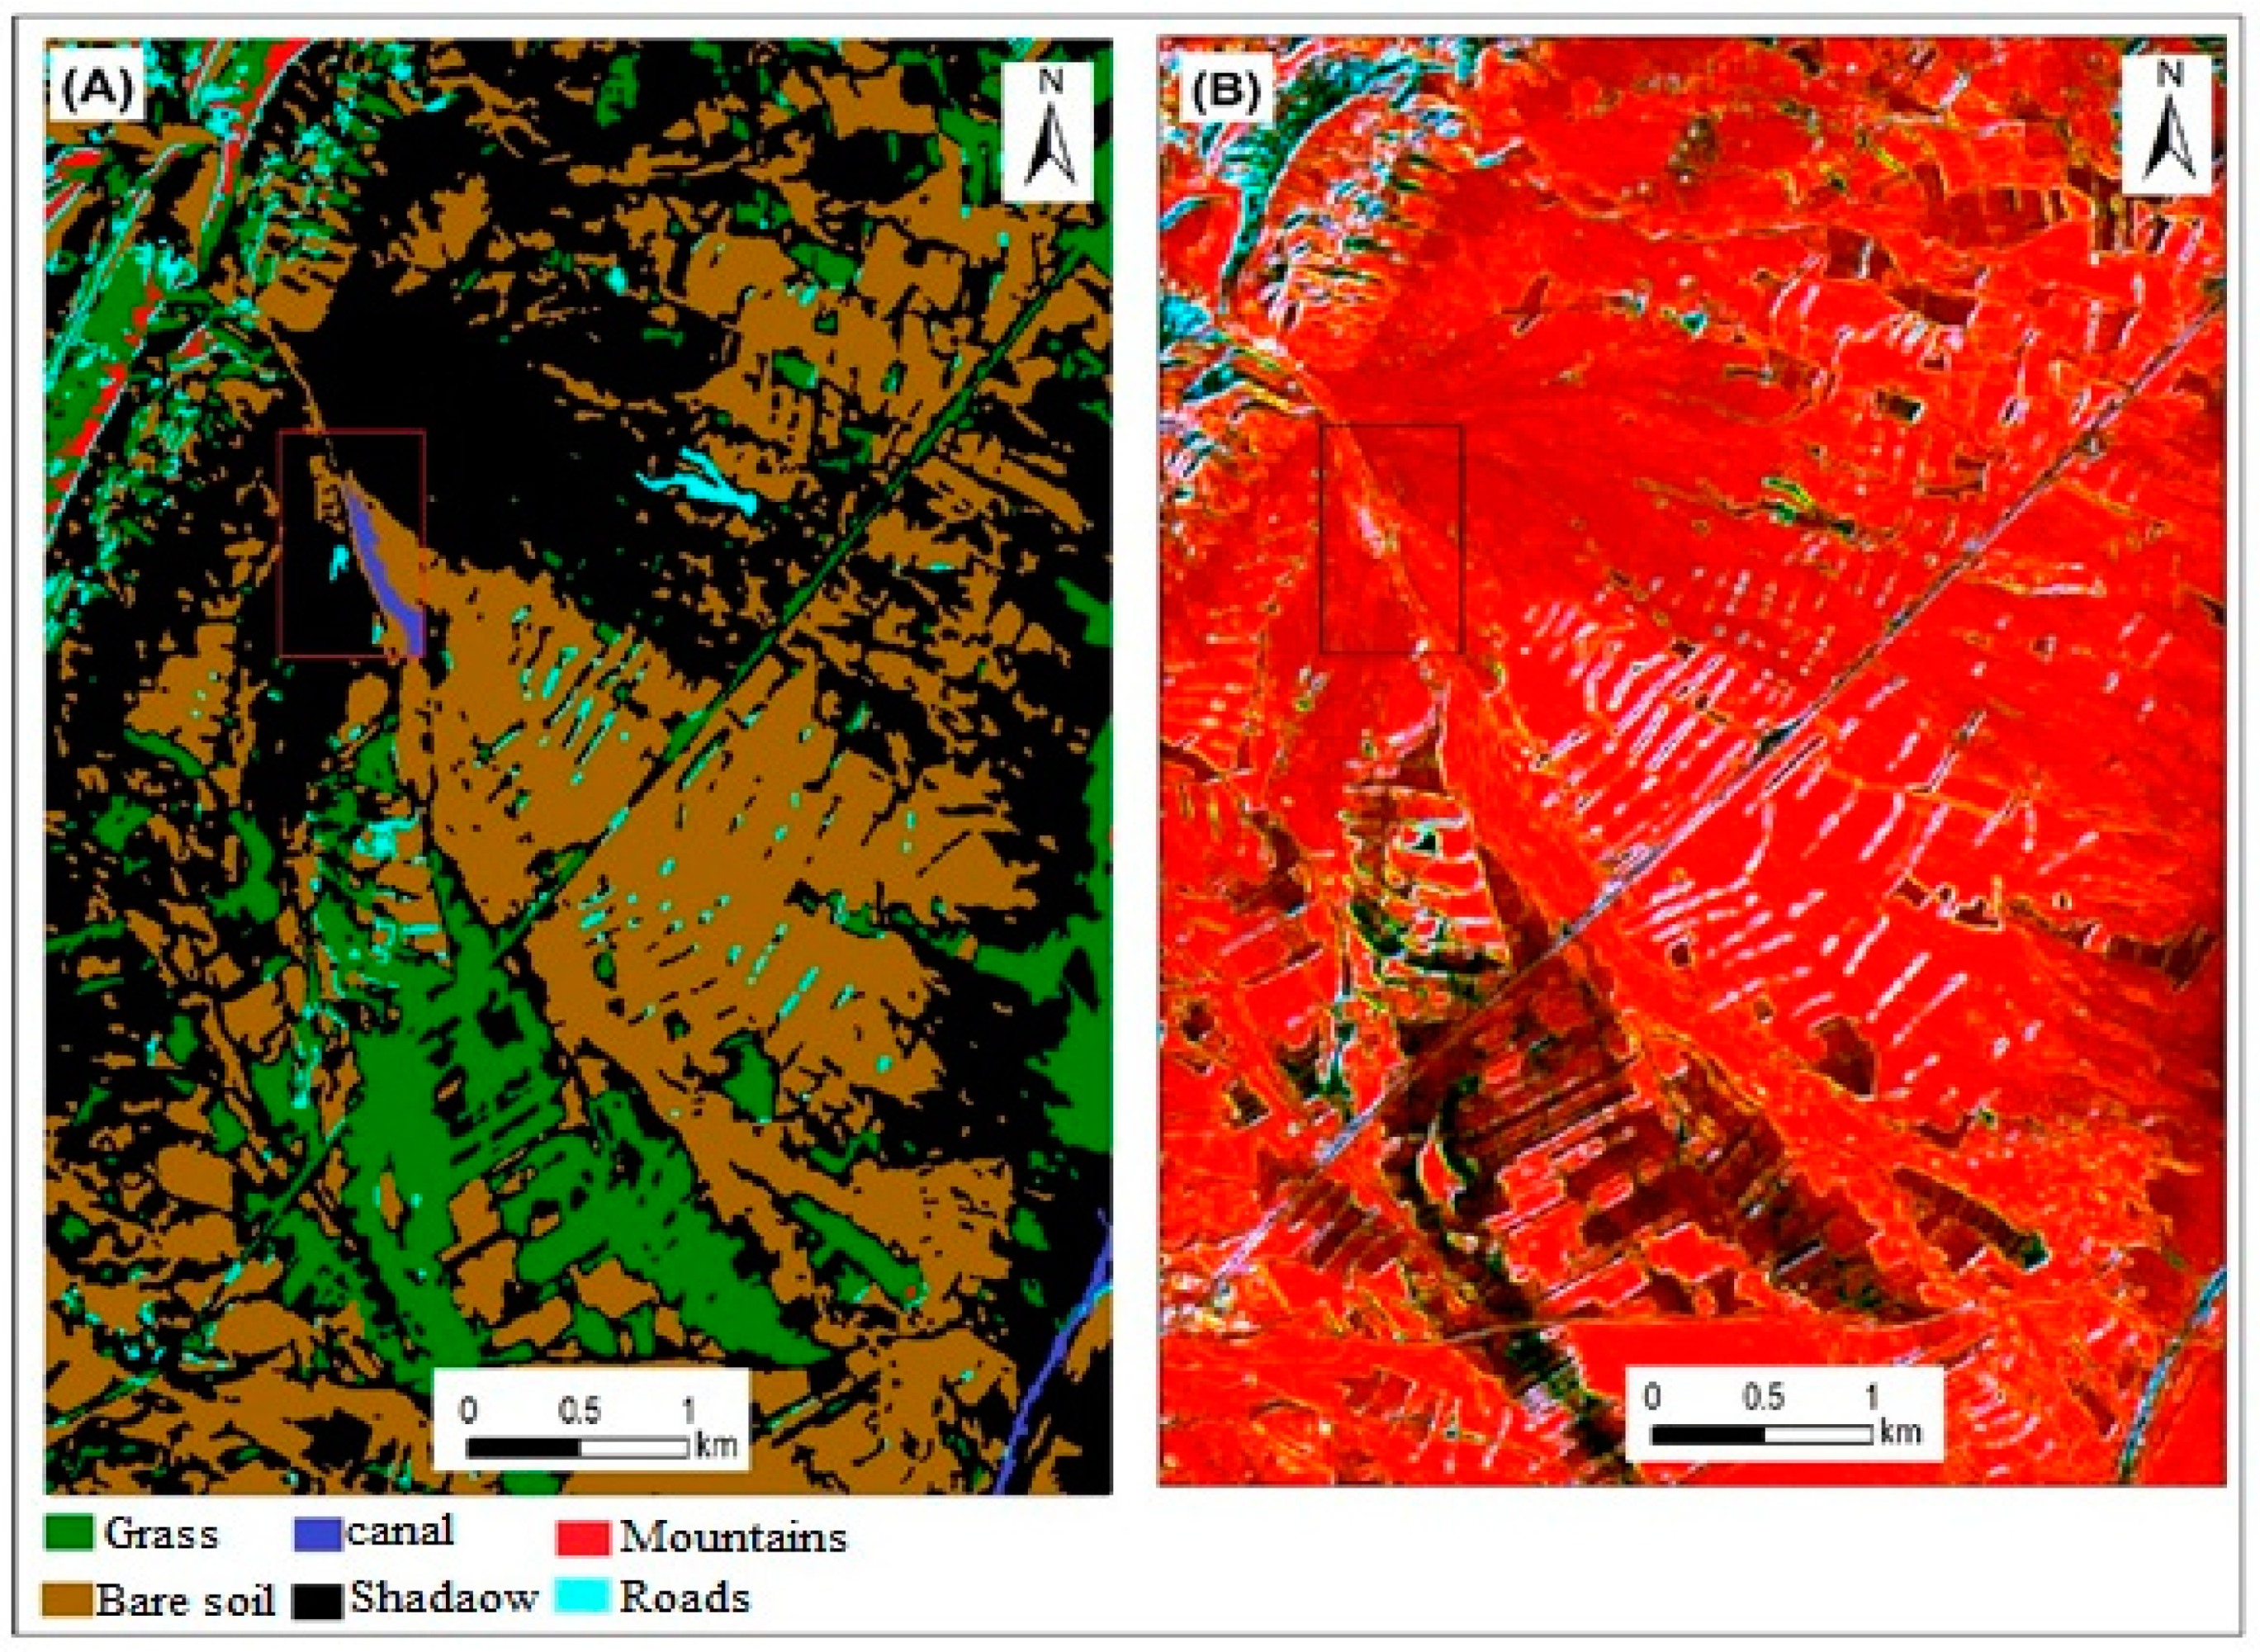
4.1. Spatial Co-Occurrence Analysis of Remote-Sensing Data

Texture analysis has been widely used to characterize remotely sensed images. In this study, we used co-occurrence matrixes to enhance features and analyze them. Among all the texture indicators used, the best for separating spatial patterns related to drainage were the standard deviation and dissimilarity, as appears in Figure 6 and Figure 7.

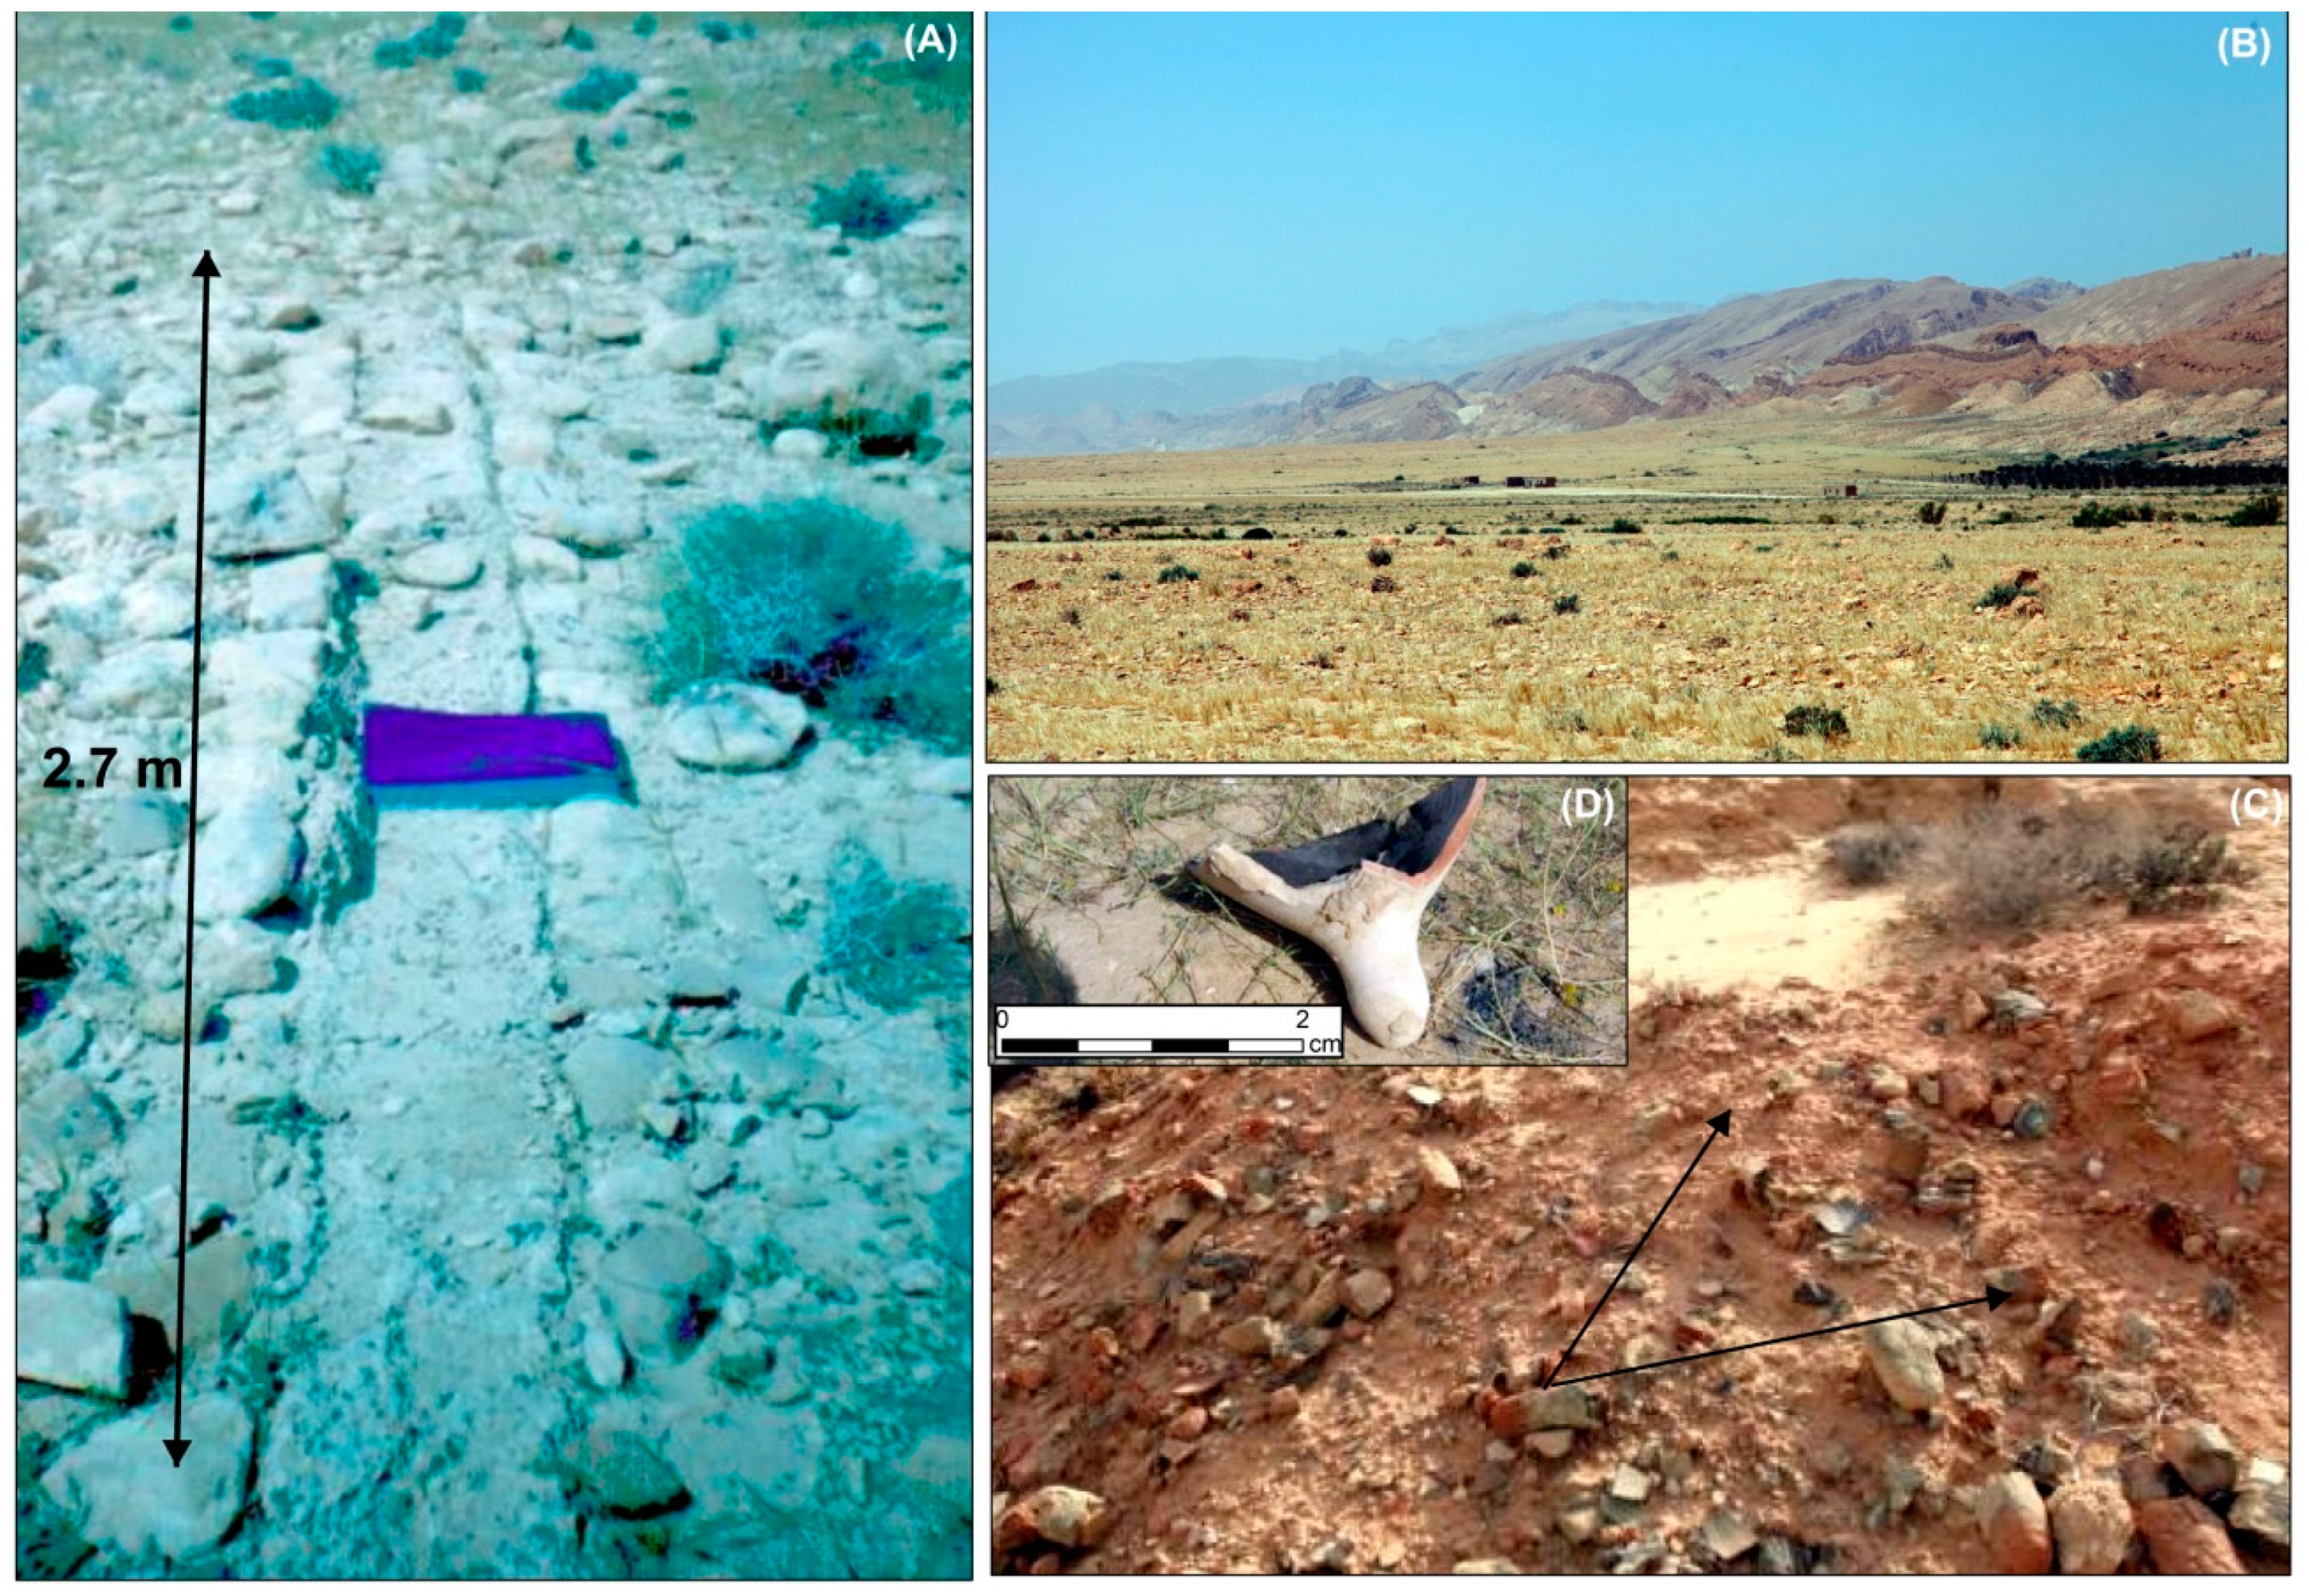
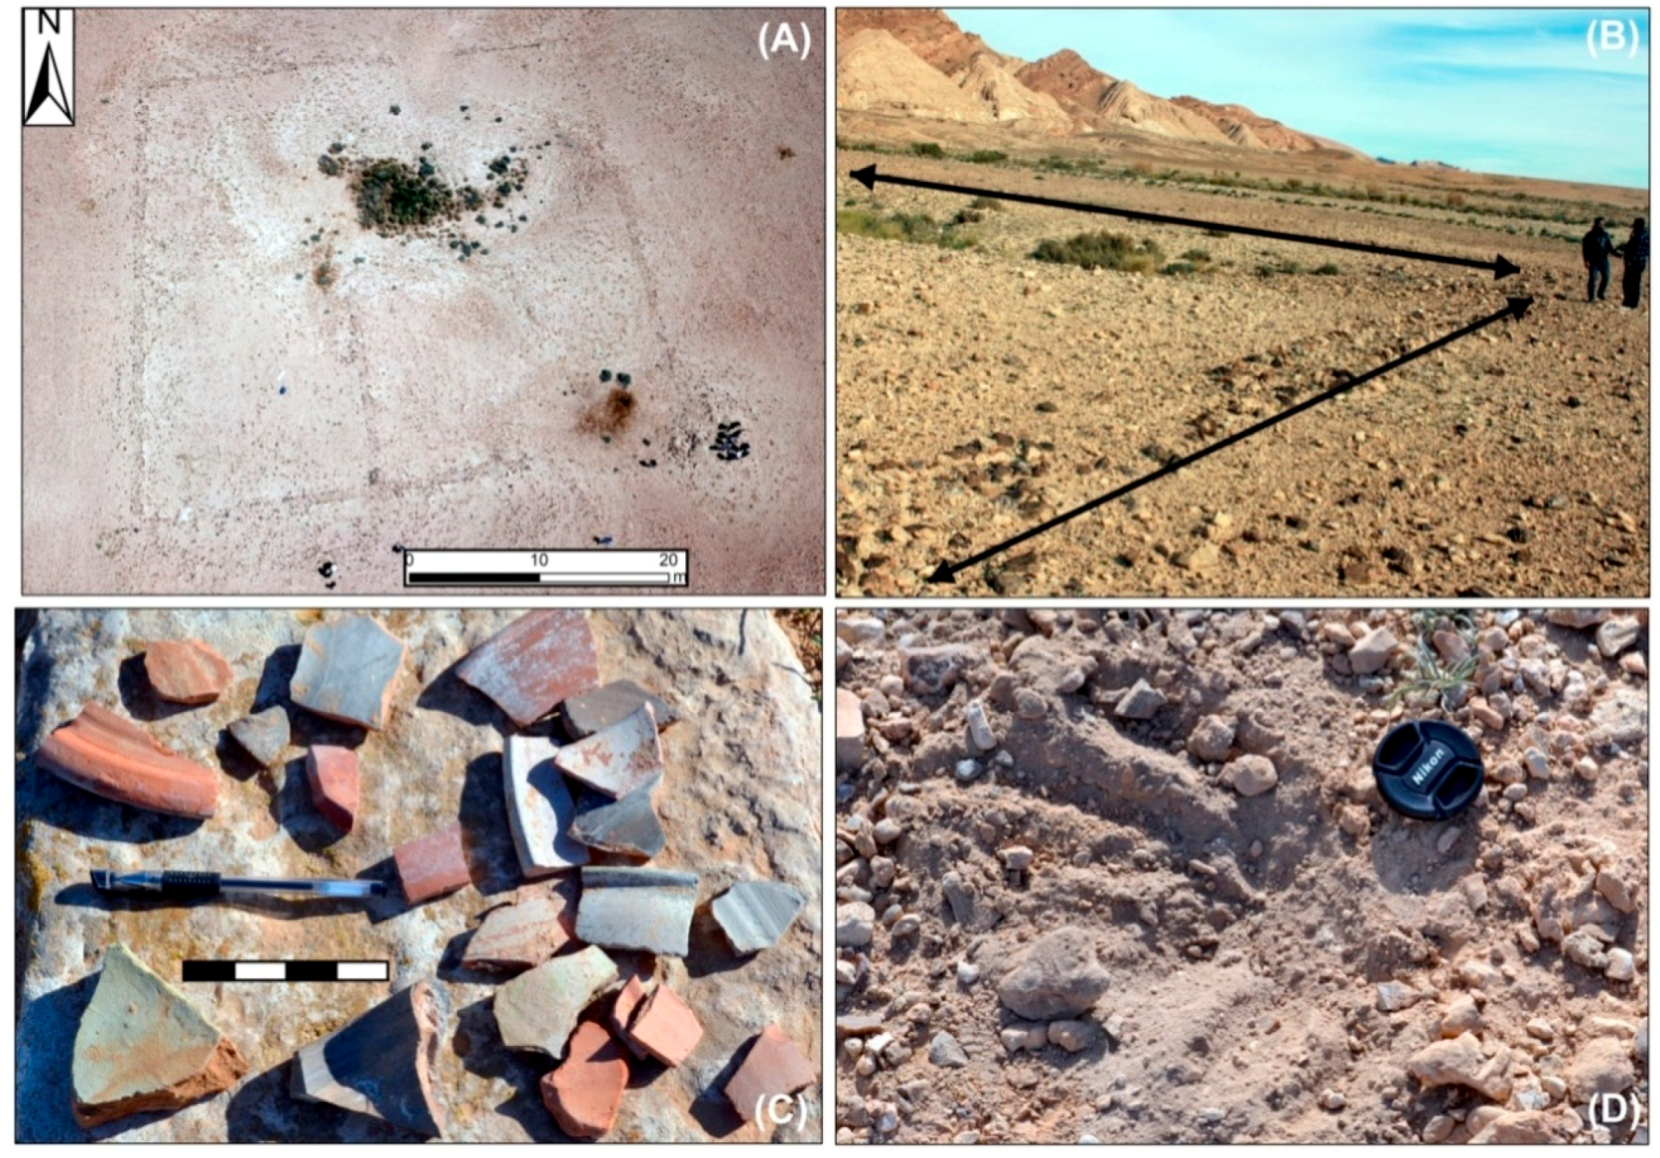
4.2. GNSS Field Investigation

The database retrieved from the literature and our preliminary inspections of the region allowed an overview of the historical record of the Roman period to be attained. These georeferenced data, when consolidated into the GIS database with other topical layers, gave key information for evaluating the potential of satellite remote-sensing techniques, as described below. GIS integration of the results of these different steps was crucial for the planning of systematic fieldwork concentrated on explicit regions of interest, the main results of which are presented in Figure 8 and Figure 9. On 23 December 2017, the investigation team reached a study area approximately 10 km north of the first location of interest. Driving south through WMV, an ancient waterway was discovered. A large number of pottery and bricks (from Roman times) were found at these sites. Along these routes, we identified these sites of interest as Roman fortresses and ancient passages based on the ancient sites observed at these sites. The importance of these newly discovered sites has led to many speculations about their past condition. By coordinating our findings with GIS and remote-sensing images, this survey attempts to address the spatial and temporal distribution of archeological sites and re-evaluate the Roman defense system in the area. In addition, in the north of WMV, we found an ancient canal stretching about 5 km from its source to transport water to the villa. The canal is located near Henchir Tefal. GNSS-based field surveys in the study area successfully recognized identifiable locations in the pansharpened VHR GE-1 and ZY-3 images. In addition, ground data from the study area were used to examine and refine the data obtained using the proposed GIS technology. Therefore, archaeological surveys based on remote-sensing data and GNSS could allow us to identify unknown monuments and provide new directions for future archaeological research on Gafsa in ancient Rome.

4.3. Mapping the Water Supply System of the WMV

In this investigation, the GIS integration of the data generated during the stages described above enabled a reconstruction of the landscape of the WMV in southern Tunisia in the Roman period to be acquired. Although this was a preliminary approach, it enabled us to validate certain points of interest that have been referred to in previous archeological investigations [26,27] and plan strategies to systematically focus on field work in a wide and severe environment. The purpose of our case study is to demonstrate the ability of GIS-based remote-sensing methods to outline potentially bigger areas of interest in desert landscapes in an informed and effective manner, which did not attract much attention during the Roman period.
The texture analysis helped, without vegetation cover, to feature the contrast that was referenced earlier using the structure of the anomalies. Meanwhile, the pansharpening method has the ability to detect the presence of ancient sites. The use of pansharpening prior to the texture analysis greatly improved the identification of archaeological features. The spectral analysis of the GE-1 and ZY-3 scenes made it possible to detect both the primary and secondary channels of the WMV. This examination shows that the WMV canals are totally covered by a layer of aeolian sand deposits and gravel due to ongoing erosion. Concerning the detection of the archaeological sites, the Roman fortifications (Figure 10) were used as a point of reference when prospecting for unknown sites within the WMV. These forts were additionally used by supplementary units as frontier posts. Small, square forts with 50 m long walls and a single gate were built in all Roman territories during the imperial period. These forts were related to the Limes (Fossatum) or played a role in control [18,19,20]. The Limes comprised fortresses for use by legions, as well as a system of roads for the quick transit of troops and, in some places, extensive walls. Such a system was built across the mountains of southern Tunisia to protect the area from attack.
To address the understanding of the archaeological record of the desert in the WMV chronologically is a complex task. The exceptionally low deposition rates in the area typically prevent the burial of ancient sites that could be dated with traditional techniques. This fact, together with a static conception of the paleoenvironmental conditions of this part of the Tunisian desert, has reinforced the view of the area as a geographical barrier and/or a territory exclusively used for interzonal mobility.
The results obtained in this study show that remote sensing imagery provides a different perspective for archaeological landscape studies. The use of this imagery is especially important in the unexplored areas of the WMV. The examination of the sites and their settings from above leads to the realization that everything can be seen has meaning and coherence. The interpretation of GE-1 and ZY-3 images proved to be a very effective strategy for recording the ancient WMV and for mapping the distribution of sites.
This research revealed the presence of a huge Roman landscape in southern Tunisia, particularly in the WMV in Gafsa. Historical accounts and archaeological records have demonstrated that the WMV formed part of an interprovincial border that controlled development between the desert regions in southern Tunisia. In addition, this area, similar to the rest of the country on the borders of the Empire, has encountered other types of human, agricultural, and pastoral occupation.
In the middle of the 20th century, Baradez et al. [49] announced the significance of a similar region to the Roman military defensive system. Archaeological sites and Limes spotted by aerial prospecting of the mountains of southwestern Tunisia were identified as Roman military camps and guarded components. Meanwhile, Carton et al. [50] noted the presence in the southwest of Tunisia of a dense network of hydraulic installations, built with different techniques. These were used by Roman soldiers to catch and bring water from its sources to the fortifications.
In addition, the few fortifications discovered in the southwest of Tunisia provided secure places as convenience and storage facilities for food, weapons, horses, and administrative records. During the first two centuries of our period, the Romans managed to pacify this desert area by containing the nomadic tribes, demarcating their territory and limiting their developments. Archaeological evidence of economic activities and the control of water (catchment supply and storage) in the WMV will aid a complete revision of views of this border area. The archaeological information is concentrated on the development of a past society that favored settled agricultural activities based mainly on the exploitation of hydraulic resources.
The results obtained have indicated that the water supply is the most significant characteristic of the WMV corridor. At the beginning of the 20th century, several archaeological sites were noted by Gauckler [51]: For example, the 5 km long ancient canal that provided water to a villa. In our examination zone, there was systematic harvesting of water in the highland areas. The mountain range that borders the WMV in the west plays the role of a storage tank, due to the ice and snow in the foothills, and forms a well-drained depression. Almost all of the sources of water collected in ancient periods are located in mountainous areas. During the Roman period, the WMV was endowed with a variety of defensive and agricultural installations. These results affirm our view that the Romans looked to envelop the irrigated oasis in their borders.
Moreover, the geographical locations of this large number of defensive systems demonstrate a perception of the uniqueness of the environment and an ability to exploit the conditions on the ground. As can be seen in Figure 10, the mountain range between Chebika and Metlaoui was blocked by fortifications or by linear protections (Fossatum and Clausurae). Indeed, the general landscape of the WMV shows that the Roman concerns in this boundary region were largely defensive, although the archaeological record also shows the existence of agriculture, especially in the northern plain to the southwest of the Gafsa Oasis. From the above examination, this may very well be the reason that the WMV and the Jerid isthmus were a highly important part of the African Limes. As a result, based on our discoveries and the literature, we firmly conclude that the Gafsa region of southern Tunisia was the site of a military project; that is, the defense and protection of the Limes (Figure 11).
The ancient WMV landscape is depicted in the following section. Figure 11 shows that the oasis areas are situated in the middle part of the Wadi el Melah valley, while the northern part is mountainous. The WMV landscape is fed by ice and snow and alluvial water from these mountains. One of the fundamental reasons why the WMV was abandoned was the expansiveness of the desert. Consequently, it is important to explore the spatial patterns in the WMV landscape at a wider scale.

5. Conclusions

Archeological surveys using pansharpening analysis and texture analysis from remote-sensing satellite data provided valuable results that can help understand the ancient water landscapes found in WMV in southern Tunisia. Through a visual interpretation of the pansharpened image, the wreckage of the canals and walls surrounding the ancient WMV was discovered. The systematic restoration of archaeological data from the study area will allow a progressive assessment of WMV during the Roman period. The reconstruction of the WMV pattern requires innovative integration of systematic procedures developed in various disciplines. It is important to conduct research in the landscape and over a wide range of time, and the methods described here are likely to greatly facilitate this work, whether in the desert areas of southern Tunisia or other arid and semiarid areas.
In this survey, satellite remote-sensing data was used to depict WMV and find traces of the ancient Roman military agricultural landscape. According to the results extracted from GE-1 and ZY-3 data and historical records, it was found that there is a hierarchical irrigation structure composed of various types of canals in WMV. The inspection is characterized by the fact that the WMV Canal is completely covered by aeolian sediment and gravel layers due to the ongoing erosion process.
Information about the canal location of the Roman ruins in WMV is important to understand the ancient agricultural landscape of the area and the spatial pattern of irrigation canals in the study area. The results of this survey also confirm the incredible capabilities of optical remote-sensing data, which can be used to explore archeological structures even in desert environments.
In view of the results presented in this article, further studies on the landscape archaeology of the WMV area will be completed using methodical archaeological excavations, geophysical surveys, the analysis of landcover changes, field surveys of remains, and the integration of data from different sources. Future work will also incorporate the use of Ground Penetration Radar (GPR) and SAR data to improve subsurface data, including the width and depth, of paleochannels. Likewise, attempts will be made to map the ancient drainage system for the entire Wadi el Melah, and the spatial characteristics of these paleochannels will be examined using integrated remote sensing (historical aerial imagery and VHR satellite data) and GIS tools (see [52,53]).
Information about the spatial patterns of the irrigation canals across these areas will improve understanding of the supply and use of water resources, critical elements to the development of a border defense strategy as well as the evolution of an irrigated-oasis agricultural system.

Author Contributions

Conceptualization, X.W. and R.L.; Data curation, L.L.; Formal analysis, R.L.; Investigation, N.B., L.L., T.M., and H.K.; Methodology, N.B., X.W., N.M., and R.L.; Project administration, X.W.; Resources, T.M. and H.K.; Supervision, L.L. and X.W.; Validation, N.B., H.K., and R.L.; Writing—original draft, N.B., N.M., and R.L.; Writing—review and editing, L.L. All authors have read and agreed to the published version of the manuscript.

Funding

This work was funded by the Strategic Priority Research Program of the National Natural Science Foundation of China (Grand No. 41801345), the Strategic Priority Research Program of the Chinese Academy of Sciences (Grant No. XDA19030502), and the National Key Research and Development Program of China (Grand No. 2016YFC0503302).

Acknowledgments

Many thanks are due to China Centre for Resource Satellite Data and Applications for providing the ZY-3 VHR remote sensing data that were used in this study. Also appreciated was the field survey assistance of Ouessar Mohamed from IRA and Mondher Brahmi from Institut National du Patrimoine, Tunisia, and the technical assistance of Biao Deng, Pilong Shi, and Fulong Chen from AIR, CAS.

Conflicts of Interest

The authors declare no conflicts of interest.

References

  1. Lasaponara, R.; Masini, N. Satellite Remote Sensing: A New Tool for Archaeology; Springer: Dordrecht, The Netherlands, 2012; p. 16. [Google Scholar]
  2. Jason, U.; Ertsen, M. Tony Wilkinson and the water history of the Near East. Water Hist. 2015, 7, 377–379. [Google Scholar] [CrossRef] [Green Version]
  3. Wilkinson, K.N.; Beck, A.R.; Philip, G. Satellite imagery as a resource in the prospection for archaeological sites in Central Syria. Geoarchaeology 2006, 21, 735–750. [Google Scholar] [CrossRef]
  4. Wilkinson, T.J. Archaeological Landscapes of the Near East; The University of Arizona Press: Tucson, AZ, USA, 2003. [Google Scholar]
  5. Damian, E.; Roland, F. The landscape of Angkor Wat redefined. Antiquity 2015, 89, 1402–1419. [Google Scholar] [CrossRef]
  6. Wesley, D.S. Risk, agricultural intensification, political administration, and collapse in the classic period gulf lowlands: A view from above. J. Archeaol. Sci. 2017, 80, 83–95. [Google Scholar]
  7. Canuto, M.A.; Estrada-Belli, F.; Thomas, G.; Houston, S.D.; Acuña, M.J.; Milan, K.; Damien, M.; Philippe, N.; Luke, A.T.; Cyril, C.; et al. Ancient lowland Maya complexity as revealed by airborne laser scanning of northern Guatemala. Science 2018, 361, eaau0137. [Google Scholar] [CrossRef] [Green Version]
  8. Bernardini, F.; Vinci, G.; Horvat, J.; De, M.A.; Forte, E.; Furlani, S.; Lenaz, D.; Pipan, M.; Zhao, W.; Sgambati, A.; et al. Early Roman military fortifications and the origin of Trieste, Italy. Proc. Natl. Acad. Sci. USA 2015, 112, E1520–E1529. [Google Scholar] [CrossRef] [Green Version]
  9. Masini, N.; Gizzi, F.; Biscione, M.; Fundone, V.; Sedile, M.; Sileo, M.; Lasaponara, R. Medieval Archaeology Under the Canopy with LiDAR. The (Re) Discovery of a Medieval Fortified Settlement in Southern Italy. Remote Sens. 2018, 10, 1598. [Google Scholar] [CrossRef] [Green Version]
  10. Lasaponara, R.; Masini, N. Satellite Remote Sensing in Archaeology: Past, present and future. J. Archaeol. Sci. 2011, 38, 1995–2002. [Google Scholar] [CrossRef]
  11. Lasaponara, R.; Coluzzi, R.; Gizzi, F.T.; Masini, N. On the LiDAR contribution for the archaeological and geomorphological study of a deserted medieval village in Southern Italy. J. Geophys. Eng. 2010, 7, 155–163. [Google Scholar] [CrossRef]
  12. Harper, R.P.; Wilkinson, T.J. Excavations at Dibsi Faraj, Northern Syria, 1972–1974: A Preliminary Note on the Site and Its Monuments with an Appendix. Dumbart. Oaks Papers 1975, 29, 319–338. [Google Scholar] [CrossRef]
  13. Luo, L.; Wang, X.Y.; Guo, H.D.; Liu, J.; Cao, H.; Wu, L.; Liu, C.S. VHR GeoEye-1 image reveals ancient watery landscape at the Longcheng site, northern Chaohu Lake Bas in (China). Int. J. Digit. Earth 2016, 10, 139–154. [Google Scholar] [CrossRef]
  14. Bachagha, N.; Wang, X.; Luo, L.; Li, L.; Khatteli, H.; Lasaponara, R. Remote sensing and GIS techniques for reconstructing the military fort system on the Roman boundary (Tunisian section) and identifying archaeological sites. Remote Sens. Environ. 2020, 236, 111418. [Google Scholar] [CrossRef]
  15. Euzennat, M. Quatre années de recherches sur la frontière romaine en Tunisie méridionale. CRAI 1972, 116, 7–27. [Google Scholar] [CrossRef]
  16. Tissot, C. Géographie Comparée de la Province Romaine D’Afrique; Forgotten Books: Paris, France, 1884; p. 2. [Google Scholar]
  17. Salama, P. L’Africa Romana. Lo Spazio Marittimo del Mediterraneo Occidentale. Geografia Storica ed Economia. Atti del XIV Convegno di Studio, Sassari 7—10 dicembre 2000; Khanoussi, M., Ruggeri, P., Vismara, C., Eds.; Carocci: Roma, Italy, 2002; pp. 1955–2000. [Google Scholar]
  18. Trousset, P. De la montagne au désert: Limes et maîtrise de l’eau. ROMM 1986, 41, 90–115. [Google Scholar] [CrossRef]
  19. Trousset, P. Recherches sur le limes tripolitanus du Chott el-Jérid à la frontière Tuniso- libyenne. Ant Afr. 1974, 20, 181–183. [Google Scholar]
  20. Trousset, P. Les oasis présahariennes dans l’Antiquité: Partage de l’eau et division du temps. Ant Afr. 1986, 22, 163–193. [Google Scholar] [CrossRef]
  21. Leschi, L. Un aqueduc romain dans l’Aurès. Rev. Afr. 1941, 85, 23–30. [Google Scholar]
  22. Trousset, P. Les fines antiquae et la reconquête byzantine en Afrique. Hist. Et Archeol. De L’afrique Du NordIie 1985, 375, 13–29. [Google Scholar]
  23. Trousset, P. Limes et frontières climatiques, dans III colloque sur l’histoire et l’archéologie de l’Afrique du Nord. Montpellier 1985, 11, 55–84. [Google Scholar]
  24. Trousset, P. L’idée de frontière au Sahara et les données archéologiques. Enjeux Sahar. 1981, 7, 47–78. [Google Scholar]
  25. Trousset, P. Le franchissement des Chotts du sud tunisien dans l’antiquité. Ant Afr. 1982, 18, 45–59. [Google Scholar] [CrossRef]
  26. Khanoussi, M. Note sur la date de promotion de Capsa (Gafsa en Tunisie) au rang de colonie romaine. CRAI 2010, 154, 1009–1020. [Google Scholar] [CrossRef]
  27. Tabbabi, M. L’occupation du sol dans la Vallée de l’Oued El Malah (Sud-ouest tunisien) dans l’Antiquité, D.E.A, sous la direction du Pr. Abdellatif Mrabet FLSHS 2006, 158, 11–38. [Google Scholar]
  28. Forman, R.T.T.; Godron, M. Landscape Ecology; John Wiley & Sons: New York, NY, USA, 1986. [Google Scholar]
  29. Stephens, L.; Fuller, D.; Boivin, N.; Rick, T.; Gauthier, N.; Kay, A.; Marwick, B.; Geralda, C.; Armstrong, D.; Barton, C.M.; et al. Archaeological assessment reveals Earth’s early transformation through land use. Science 2019, 365, 897–902. [Google Scholar] [CrossRef] [Green Version]
  30. Luo, L.; Wang, X.Y.; Liu, J.; Guo, H.D.; Lasaponara, R.; Ji, W.; Liu, C. Uncovering the ancient canal-based tuntian agricultural landscape at China’s northwestern frontiers. J. Cult. Herit. 2017, 23, 79–88. [Google Scholar] [CrossRef]
  31. Agapiou, A.; Alexakis, D.D.; Hadjimitsis, D.G. Spectral sensitivity of ALOS, ASTER, IKONOS, LANDSAT and SPOT satellite imagery intended for the detection of archaeological crop marks. Int. J. Digit. Earth 2014, 7, 351–372. [Google Scholar] [CrossRef]
  32. Wiseman, J.; El-Baz, F. Remote Sensing in Archaeology; Springer: New York, NY, USA, 2007. [Google Scholar]
  33. Figorito, B.; Tarantino, E. Semi-automatic extraction of linear archaeological traces from orthorectified aerial images. Int. J. Appl. Earth Obs. Geoinf. 2014, 26, 458–463. [Google Scholar] [CrossRef]
  34. Comer, D.; Harrower, M. Mapping Archaeological Landscapes from Space; Springer: New York, NY, USA, 2013. [Google Scholar]
  35. Garrison, T.G.; Houston, S.D.; Golden, C.; Inomata, T.; Nelson, Z.; Munson, J. Evaluating the use of IKONOS satellite imagery in lowland Maya settlement archaeology. J. Archaeol. Sci. 2008, 35, 2770–2777. [Google Scholar] [CrossRef]
  36. Wu, J.X.; Cheng, X.; Xiao, H.S.; Wang, H.; Yang, L.Z.; Ellis, E.C. Agricultural landscape change in China’s Yangtze Delta, 1942–2002: A case study. Agric. Ecosyst. Environ. 2009, 129, 523–533. [Google Scholar] [CrossRef] [Green Version]
  37. Alexakis, D.; Sarris, A.; Astaras, T.; Albanakis, K. Integrated GIS, remote sensing and geomorphologic approaches for the reconstruction of the landscape habitation of Thessaly during the Neolithic period. J. Archaeol. Sci. 2011, 38, 89–100. [Google Scholar] [CrossRef]
  38. Masini, N.; Capozzoli, L.; Chen, P.; Chen, F.; Romano, G.; Lu, P.; Tang, P.; Sileo, M.; Ge, Q.; Lasaponara, R. Towards an operational use of geophysics for Archaeology in Henan (China): Archaeogeophysical investigations, approach and results in Kaifeng. Remote Sens. 2017, 9, 809. [Google Scholar] [CrossRef] [Green Version]
  39. Lambert, J.D.H.; Siemens, A.H.; Arnason, J.T. Ancient Maya drained field agriculture: Its possible application today in the New River Floodplain, Belize, C.A. Agric. Ecosyst. Environ. 1984, 11, 67–84. [Google Scholar] [CrossRef]
  40. Liu, Y.; Chen, X.; Yang, Y.; Sun, C.; Zhang, S. Automated Extraction and Mapping for Desert Wadis from Landsat Imagery in Arid West Asia. Remote Sens. 2016, 8, 246. [Google Scholar] [CrossRef] [Green Version]
  41. Chirico, P.G.; Malpeli, K.C.; Trimble, S.M. Accuracy evaluation of an ASTER-Derived Global Digital Elevation Model (GDEM) version 1 and version 2 for two sites in western Africa. Geosci. Remote Sens. 2012, 49, 775–801. [Google Scholar] [CrossRef]
  42. Agapiou, A.; Lysandrou, V.; Lasaponara, R.; Masini, N.; Hadjimitsis, D.G. Study of the Variations of Archaeological Marks at Neolithic Site of Lucera, Italy Using High-Resolution Multispectral Datasets. Remote Sens. 2016, 8, 723. [Google Scholar] [CrossRef] [Green Version]
  43. Yuhendra, I.; Alimuddin, J.T.; Sumantyo, S.; Kuze, H. Assessment of pansharpening methods applied to image fusion of remotely sensed multi-band data. Int. J. Appl. Earth Obs. Geo. Inf. 2012, 18, 165–175. [Google Scholar] [CrossRef]
  44. Masini, N.; Lasaponara, R. Sensing the Past from Space: Approaches to Site Detection. In Sensing the Past. From from Artifact to Historical Site; Masini, N., Soldovieri, F., Eds.; Springer: Cham, Switzerland, 2017; pp. 23–60. [Google Scholar] [CrossRef]
  45. Jahjah, M.; Ulivieri, C. Automatic archaeological feature extraction from satellite VHR images. Acta Astronaut. 2010, 66, 1302–1310. [Google Scholar] [CrossRef]
  46. Sabins, F. Remote sensing for mineral exploration. Ore Geol. Rev. 1999, 14, 157–183. [Google Scholar] [CrossRef]
  47. Naranjo, J.; Puig, A. Carta Geológica de Chile escala 1:250.000. Hojas Taltal y Chañaral N°62 y 63; Servicio Nacional de Geología y Minería: Santiago, Chile, 1984; p. 81.
  48. Marinovic, N.; Smoje, I.; Makasev, V.; Hervé, M.; Mpodozis, C. Carta Geológica de Chile Escala 1:250.000. Hoja AguasBlancas, Región de Antofagasta; Servicio Nacional de Geología y Minería: Santiago, Chile, 1995.
  49. Baradez, J. FossatumAfricae. Recherches aériennes sur l’organisation des confins sahariens à l’époque romaine, Paris. Arts et Métiers Graphiques 1949, 147, 143–144. [Google Scholar]
  50. Carton, L. Travaux antiques d’irrigation et de culture dans la région du Djebel-Onk. Recueils dela Société Archéologique de Constantine 1909, 43, 193–224. [Google Scholar]
  51. Gauckler, P. Enquête sur les installations hydrauliques romaines en Tunisie, t. II. Impr. Rapide: Tunis, Tunisia, 1912; p. 161. [Google Scholar]
  52. Luo, L.; Bachagha, N.; Yao, Y.; Liu, C.; Shi, P.; Zhu, L.; Shao, J.; Wang, X. Identifying Linear Traces of the Han Dynasty Great Wall in Dunhuang Using Gaofen-1 Satellite Remote Sensing Imagery and the Hough Transform. Remote Sens. 2019, 11, 2711. [Google Scholar] [CrossRef] [Green Version]
  53. Luo, L.; Wang, X.; Guo, H.; Lasaponara, R.; Zong, X.; Masini, N.; Wang, G.; Shi, P.; Khatteli, H.; Chen, F.; et al. Airborne and spaceborne remote sensing for archaeological and cultural heritage applications: A review of the century (1907–2017). Remote Sens. Environ. 2019, 232, 111280. [Google Scholar] [CrossRef]
Figure 1. (A) Map of ancient southern Tunisia and the main routes of the Ancient Romans. (B) The black rectangle indicates the extent of the Landsat 8 OLI data composites (7(SWIR 2) 5(NIR) 3(Red)) of the study area. (C) The Advanced Spaceborne Thermal Emission and Reflection Radiometer Global Digital Elevation Model of the study area.
Sustainability 12 00567 g001
Figure 2. Pansharpened results for the ZY-3 imagery: The red box (A) and arrows (B) highlight the ancient canal in the eastern part of the study area.
Sustainability 12 00567 g002
Figure 3. Pansharpened results for the GE-1 imagery: (A) The red boxes highlight anomalies 1 and 2 in the western part of the study area. (B) Anomaly 1. (C) Anomaly 2.
Sustainability 12 00567 g003
Figure 4. (A) ZY-3 false-color composite, RGB 4-3-2 (RGB: Average (Red), standard deviation (Green), and dissimilarity (Blue)), of the eastern part of the study area. Ancient canal areas are highlighted in light yellow. (B) Magnified sub-area. (C) ZY-3 pan image.
Sustainability 12 00567 g004
Figure 5. (A) GE-1 false-color composite (RGB 4-1-2) of the western part of the study area. Anomalous regions are highlighted in light yellow. (B) GE-1 image false-color composite and (C) panchromatic image of the newly discovered fort. (D) GE-1 false-color composite and (E) GE-1 panchromatic image of the ancient canal.
Sustainability 12 00567 g005
Figure 6. (A) Classification map. (B) Results of the extraction of the ancient canal from ZY-3 imagery and the texture analysis based on the occurrence matrix (RGB: Average (R), standard deviation (G), and dissimilarity (B)).
Sustainability 12 00567 g006
Figure 7. (AC) Magnified image of the results of the texture analysis based on the occurrence matrix (RGB: Average (Red), standard deviation (Green), and dissimilarity (Blue)). (D) Field photo of the detected canal.
Sustainability 12 00567 g007
Figure 8. Field photographs of ancient canal. (A) Structure of ancient canal. (B) View of landscape in the Wadi el Melah Valley (WMV). (C) Pottery fragments. (D) North African pottery, third to fourth century AD, Roman.
Sustainability 12 00567 g008
Figure 9. Photographs of Roman fort. (A) Orthoimage obtained by unmanned aerial vehicles (UAV) with magnified ground truth. (B, C) Pottery fragments. (D) Reddish burnt soils.
Sustainability 12 00567 g009
Figure 10. (A) Geo-Eye 1 RGB natural composite for a section in the eastern part of the study area. (B) Extract from 1:100,000 topographic map of Metaloui [48].
Sustainability 12 00567 g010
Figure 11. Comprehensive archaeological map of the WMV landscape in the Roman period.
Sustainability 12 00567 g011
Table 1. Characteristics of the GeoEye-1 (GE-1) and Ziyuan-3 (ZY-3) data used in this study.
SensorsZY-3GE-1
Wavelength/µmPAN0.50–0.800.45–0.80
MS0.45–0.52 Blue
0.52–0.59 Green
0.63–0.69 Red
0.77–0.89 NIR
0.45–0.51 Blue
0.51–0.58 Green
0.65–0.69 Red
0.78–0.92 NIR
Spatial resolution/mPAN2.10.5
MS5.82.0

