Article

Exploring CEO Messages in Sustainability Management Reports: Applying Sentiment Mining and Sustainability Balanced Scorecard Methods

1
SKK Business School, Sungkyunkwan University, Seoul 03063, Korea
2
Department of Health Sciences & Technology, SAIHST (Samsung Advanced Institute for Health Sciences & Technology), Seoul 06351, Korea
3
School of Management, Kyung Hee University, Seoul 02447, Korea
*
Author to whom correspondence should be addressed.
Sustainability 2020, 12(2), 590; https://0-doi-org.brum.beds.ac.uk/10.3390/su12020590
Submission received: 25 September 2019 / Revised: 5 January 2020 / Accepted: 9 January 2020 / Published: 13 January 2020

Abstract

:
The purpose of this study is to apply a combination of sentiment mining techniques and a sustainability balanced scorecard to CEO messages in sustainability management reports to predict corporate financial ratios. We classify the contents of CEO messages into the six perspectives suggested by the sustainability balanced scorecard (SBSC). From the sentiment mining results, we first document that positive words dominate CEO messages in sustainability management reports. Moreover, words related to the sustainability perspective do not generally exhibit a significant relationship with financial ratios. This finding indicates that CEOs’ messages in sustainability management reports seemingly fail to properly represent the firms’ current financial status. Therefore, the results indicate that a stronger supervisory standard may be required to induce CEO disclosures that are more responsible for sustainable management reports.

1. Introduction

We investigate whether a significant relationship exists between factors highlighted in a CEO’s message in the sustainable management report and financial indicators of the firm. This study attempts to combine artificial intelligence (AI) technique-based sentiment mining to interpret text-based CEOs’ messages within the framework of the sustainability balanced scorecard (SBSC). The sustainability report is utilized here because it identifies the company’s economic, environmental, and social strategies from a managerial perspective [1]. Further, the sustainability report includes the company’s financial, as well as non-financial, content [2]. For instance, the following are examples of 2017 sustainable management reports that comprise textual financial content:
This sustainability report includes both financial and non-financial performance. Some major issues contain recent and past three years’ quantitative data to help readers’ understanding.
(Lotte Engineering and Construction)
In order to effectively respond to environmental changes in financial and non-financial risks that may occur in the entire process of business activities, including project orders, contracts, construction, and delivery, we operate a risk management team. We identified tasks that reduce construction costs, thereby improving profit margins.
(Samsung Heavy Industries)
Using this report, it is possible to assess and evaluate a company’s sustainability. In particular, the CEO message provides a condensed summary of this information, which is implicit in the manager’s beliefs and intentions. This study attempts to resolve several unexplored research issues using these qualitative CEO messages.
The specific procedures of this research are as follows. To analyze unstructured textual data, such as CEO messages, we employ a sentiment mining technique to extract the most frequently repeated keywords from CEO messages in sustainable management reports. To explore the content of CEOs’ messages found in sustainability management reports, we use the SBSC framework. SBSCs, that contain a sustainable management perspective, can facilitate overcoming the shortcomings of the conventional BSC method by taking into account environmental and social management factors. Consequently, to examine our research question most effectively, we utilize the SBSC framework that adds the CSR perspective and external business environmental perspective to the existing four perspectives [3,4,5,6]. For instance, we classify the keywords of CEO messages using six perspectives (customer, learning and growth, internal process, financial, corporate social responsibility, and the external business environmental perspective). We also elucidate the relationships among each perspective of the CEO messages in the sustainable management report and a variety of corporate financial characteristics.
Our study contributes to the extant literature in the following ways. First, to the best of our knowledge, this is the first investigation to classify CEO messages contained in sustainable management reports by applying the SBSC framework. Although a few studies have examined the text in company disclosures, no study has yet systematically attempted to classify this text in accordance with sentiment mining and scholarly principles. Second, our results demonstrate that CEO messages generally do not possess significant relationships with financial status, meaning that CEOs usually deliver messages using a positive tone without reporting relevant financial performance. Thus, a missing link exists between a firm’s financial and non-financial disclosures. Finally, our findings provide several key policy implications. For instance, regulators should establish clear guidelines for CEOs’ sustainable management reports to mitigate concerns that the unfounded optimism contained in these reports misleads investors and results in poor decisions.
The remainder of this paper is structured as follows. First, we review the related prior works in the literature and develop the paper’s hypothesis. Next, we explain the research design and present the research results. Finally, we discuss empirical results and conclude the paper with implications for future research and practice.

2. Literature Review and Hypothesis Development

2.1. Implications of CEO Messages

Companies aim to achieve sustainable management, i.e., managers present a vision and implement it through a long-term strategy [7]. The CEO’s message is symbolic of the company’s responsibility for its attainment [8]. Moreover, it reflects the CEO’s thoughts and attitudes and provides useful information for defining a business culture and/or corporate values. CEO messages present not only the company’s vision and goals, but also describe the company’s performance and discuss strategies for the future. Although a company releases an annual report with its financial statements, the sustainability report can serve as an important complement to it.
Since the sustainability management report constitutes the most extensive and detailed report of the enterprise, the manager must invest considerable time and effort into its creation. Indeed, the CEO’s message in the sustainability management report should be specific and include objective content that is closely related to the firm’s critical information. The issuance of a CEO’s message is voluntary, and the information contained in the message is relatively unrestrained [9]. It is also worth noting that CEO messages in sustainable management reports do not require auditing. In other words, since they include abundant information about the company’s current state and future strategic initiatives, they do need closer monitoring by financial analysts, shareholders, regulators, and the media [10]. In this sense, it is fortuitous that a certain level of monitoring of these CEO messages has recently been advanced by several interested parties [8].
A CEO plays a critical role in creating the corporate culture of his or her firm, and contributes to the achievement of strategic goals [11]. Therefore, the CEO’s message is an important way to communicate with stakeholders [12]. Indeed, CEO messages are drivers for communicating strategic issues and reflecting strategic change [13]. For this reason, CEO messages have been used uniquely to analyze corporate strategies [14]. The CEO’s message is also a useful tool for assessing the CEO’s will and intentions concerning the company’s future strategic initiatives, as he or she is also legally responsible for this message since it is delivered to the public.
A CEO attempts to convey a wide range of information about the company through his or her message. The CEO message found in a sustainable management report comprises non-financial, as well as financial, information about the company. For example, the message contains comprehensive information about the company, such as assessments of firm performance, efforts to realize its future vision, reviews of efficient and systematic processes, responses to customer satisfaction, etc., [9]. In addition, many CEO’s messages suggest a roadmap for sustainable management, with comments on corporate social responsibility (CSR). We expect that, by analyzing CEO messages, it will be possible to understand precisely what the corporation emphasizes, as well as decipher the vision and strategy presented by management.
Some earlier studies point out problems with CEO messages. For instance, Kohut and Segers find that the more verbose is a CEO message, the lower is the return on equity (ROE) [15]. Segers and Kohut also argue that the content of the CEO message affects investors’ decision-making and, in turn, can influence the value of the company [16]. Clatworthy and Jones explain that the content of the CEO message tends to comprise the acquisition and disposal of assets when the corporation is profitable [17]. However, when the firm is less profitable, the content of the message is likely to mention the replacement of the board of directors. Clatworthy and Jones also report that the less successful managers are, the more they want to focus on manipulating their image [18]. They also demonstrate that CEOs of less profitable companies use expressions that emphasize future performance rather than current performance.

2.2. Issuance of the Sustainability Management Report

Sustainable development, which was declared as a new growth paradigm at the U.N. Global Summit in 1992, has been introduced into management activities. The concept encompasses corporate environmental management and social contribution activities and has emerged in the process of reviewing overall management styles, as environmental and social issues have been highlighted in management activities. The sustainability management report usually refers to management activities that seek sustainable development by integrating all management activities of a company based on economic profitability, environmental soundness, and social responsibility [19].
Since a sustainability management report is not mandatory for companies to publish, companies do so voluntarily. Nevertheless, the major framework for sustainable management reports is standardized, and certain essential information should be included. Indeed, 99% of the sustainability reports issued by Korean companies utilize the global reporting initiative (GRI) guidelines, and 93% have been verified by third parties [20]. The United Nations Global Compact (UNGC) is a voluntary national convention on CSR launched in July 2000. The UNGC recommends that companies abide by the 10 principles of human rights, labor, environment, and anti-corruption in four areas, and submit related annual reports [21]. Additionally, the sustainable management report should comprise UNGC-related content, as well as adhere to the GRI guidelines.
As CSR is increasingly emphasized and interest in sustainable management is growing, many companies attempt to communicate with customers through the publication of sustainable management reports. The CEO’s message is expected to be read by many people because it summarizes the overall content, and is usually located at the front of the report. The qualitative form of disclosures included in CEO messages in sustainable management reports can trigger actions by members and stakeholders, increase brands, share knowledge, and provide future strategic directions [8].
Prior studies report an association between corporate disclosures and actual financial performance. Henry argues that emphasizing good news about a company can reduce the impact of a firm’s negative financial performance [22]. This management intention is also evident in a corporation’s disclosure of its report. Jameson demonstrates that the utilization of positive language tends to avoid company responsibility for poor performance [23]. Cho et al. argue that companies reporting poor performance attempt to manage the firm’s image by using language that is positive and optimistic in the disclosure data [24]. Guay et al., show that voluntary disclosures by a corporation can mitigate the effects of negative financial performance [25]. There are also cases in which a firm’s actual performance is expressed in an overly positive manner to impress stakeholders, without appropriately presenting the corporation’s performance [24,26]. Furthermore, companies tend to manage their image by selectively choosing and disclosing unfavorable information in sustainable management reports [27]. Despite this, no study has yet investigated the relationships between CEO messages in sustainable management reports and the company’s financial outcomes.

2.3. Balanced Scorecard Approach

The management of a company presents a vision and, through its strategy, the company strives to realize this vision. The strategy, however, does not constitute a standardized process. Specifically, it should instead be linked by logic that is organized and consistent from the management’s mission statement to the actual performance of employees [28]. An optimal strategy also creates sustainable differences in the market. Sustainable differences can provide high value, and they are created by dynamic interactions among various components of an organization [29].
Since Kaplan and Norton introduced the concept of the balanced scorecard (BSC) [30], numerous researchers have performed empirical analyses and offered theoretical constructs [29,31,32,33,34,35]. The BSC, as a management accounting technique, has evolved and improved into a common management practice [36]. The BSC is a comprehensive management framework that constantly and dynamically interacts with learning and growth, customers, internal processes, and financial perspectives. Cause-and-effect associations link the objectives of the four perspectives [29]. Specifically, the BSC reveals how the interaction takes place not only from a financial perspective but also from a non-financial one. Examples of this include customers, processes, and learning growth, and comprise extracting key success factors based on the four perspectives and developing them in the direction of establishing the firm’s strategy and goals. The BSC operates as a system that creates value for a company by effectively incorporating areas of the firm’s financial, customer, internal processes, and learning growth perspectives based on key performance indicators (KPI) to manage its core business performance [29,34]. Finally, the BSC makes it possible to consider non-financial strategic success factors that significantly affect sustainable business practices [37]. By connecting financial and non-financial company activities with interaction chains to the firm’s long-term strategy, the BSC supports the management of all corporate activities by reflecting their strategic relevance.
Although most Fortune 1000 companies have used BSC, few SMEs have [38]. Falle et al., highlight the importance of sustainability management for SMEs [4]. When applying the BSC to SMEs, it is beneficial to present strategies reflecting the characteristics of SMEs, and resource utilization strategies in consideration of the SMEs’ environment have been suggested [39]. Malagueño et al., report that companies utilizing BSC achieve superior financial performance and exhibit higher levels of innovation [40]. SMEs also obtain a positive effect when using BSC on financial performance.
The BSC approach is also evolving, and converging with a variety of other factors. Lueg documents the importance of strategy maps as an essential link between BSC and action [7]. Strategy maps assist to understand the BSC, increase commitment, and achieve objectives. Lin explains the synergy effect of knowledge management and the BSC [41]. Specifically, Lin stresses that non-financial performance measures, such as customer satisfaction, internal process, learning, and growth, influence financial performance. Moreover, Aly and Mansour developed a method to evaluate the sustainable performance of the firm’s board of directors, utilizing the balanced scorecard framework in consideration of the CSR perspective [42].
By linking sustainability to BSC, SBSC transcends the disadvantages of conventional BSC [37]. For instance, Figge et al., demonstrate that both non-financial and sustainable strategies significantly influence firm outcomes and can be supported by employing the SBSC framework [37]. However, to the best of our knowledge, our study is the first to use the sustainability balanced scorecard (SBSC) framework to classify CEO messages in sustainability reports by applying AI techniques.

2.4. Hypothesis Development

The CEO’s message includes content that presents the firm’s vision and strategy [43] and emphasizes the unique characteristics of a company [44]. To achieve sustainable management, managers should present a vision, and simultaneously set a long-term strategy to realize and implement it [7]. The CEO message in the sustainable management report consists of text, which is unstructured data that contain a broad range of information about the entire company. In particular, the sustainability report is the most extensive and detailed report of the enterprise, and the manager typically invests extensive and deliberate effort when disclosing information in the report. External stakeholders review CEO messages [45], and investors use these CEO messages as an important source of their judgment of the company’s financial performance [46].
In this paper, we investigate whether the contents of CEO messages in the sustainable management report possess a significant relationship with major financial characteristics, such as profitability, growth, and stability. We also examine the mission statement and examine the reliability of the firm’s disclosure by identifying the degree of consistency existing between qualitative and quantitative reports. To explore these research questions, we quantify the CEOs’ message content in the sustainable management report by using sentiment mining, which makes it possible to analyze unstructured data, such as text. Moreover, we extract keywords that are most frequently repeated in the message.
Next, to elucidate the various contents of the CEO’s message in the sustainability management report, we employ the BSC framework. Essentially, the BSC asserts that corporate performance must seek an equitable balance between financial performance and non-financial performance. In other words, the BSC approach aims to provide an alternative mechanism for measuring performance in consideration of not only balancing financial and non-financial indicators for performance but also short- and long-term indicators for performance. In this sense, the BSC approach assists companies to focus on sustainable management. In addition, when the conventional BSC is also combined with an intention to protect our environment and society, it transforms into a sustainable BSC or SBSC [3,4,5,6], in which an external business environmental perspective, such as corporate social responsibility (CSR), is added to the already existing four perspectives of the BSC. Specifically, we use financial, customer, internal process, learning and growth, CSR, and business environment perspectives to classify CEO messages.
The sustainable management report is globally recommended by the UN. The report provides updated content based on the global reporting initiative (GRI) guidelines. We assume that these financial and non-financial perspectives are associated with financial ratios for the following reasons. First, prior literature documents that various CEO characteristics relate to firm performance [47,48]. For instance, Barker and Mueller show that CEO characteristics are correlated with their R&D spending [48]. Since CEOs’ characteristics may affect his or her writing style, different tones and message types can lead to varied firm outcomes. Second, firms that report poor performance may have a second opportunity to explain their lower performance through a sustainability management report. This observation leads us to predict a systematic relationship between the CEO message in the sustainability management report and the firm’s financial status. Third, the market will value the firms’ social responsibility activities [49]. If this is true, then CEOs are willing to send messages about social activities through the sustainability management report, and these messages may be associated with firms’ outcomes. Fourth, financial statements can only contain discrete numerical information from past transactions due to its verifiability. Consequently, a manager who is well aware of the financial situation of the company will attempt to highlight performance through this sustainable report. For example, firms disclose their values in the report as follows:
In 2017, the financial value was approximately 42.19 trillion KRW, while the “True Value”, including social, economic, and environmental values, reached to 49.16 trillion KRW. This is about 16.5% higher than the financial value, which is 89.2% higher than the “True Value” in 2016.
(Samsung Electronics 2017 Sustainability Management Report)
To summarize, the above discussion leads us to anticipate a significant correlation between messages in sustainability reports and financial ratios. The messages are classified into six perspectives based on the SBSC framework. Thus, we form the following hypothesis:
Hypothesis: 
Systematic associations exist between the perspectives of CEO messages in the sustainable management report and their financial ratios.

3. Research Design

3.1. Sample Selection

In this study, we use firm-level data from 2016 to 2017. The sample consists of 129 firm-years listed in the Korea Stock Exchange (KSE). We collect sustainability management report data from the Business Institute for Sustainable Development (BISD) website [50]. We use the KIS-VALUE [51] and TS-2000 [52] databases from the National Information and Credit Evaluation (NICE) and Korea Listed Companies Association, respectively, to extract our financial data. After deleting observations for financial industries, non-December year-ends, and missing financial variables, 129 firm-year observations are used for our empirical tests.

3.2. Sentiment Mining Technique for Analyzing Textual Data

Text mining is a methodology aimed at deriving useful information from unstructured or semi-unstructured textual data by utilizing natural language processing (NLP) technology [53,54]. This technique enables users to extract meaningful information from big text data, identify links to other information, and discern categories or themes within the text. Using Java-contained functions, the text is collected automatically. Unused words are removed in the process of collecting keywords.
Sentiment mining is a method that extracts keywords and assigns quantified values to them, identifying whether the words have positive, neutral, or negative tone through emotional analysis. This method permits us to determine the main content of the text and, simultaneously, identify the level of positive or negative tones. The specific procedures used in this research for sentiment mining are as follows.
First, we use the bag-of-words (BoW) method [55,56,57,58] to extract words that are most frequently repeated in the CEO message of the sustainability management report. The term frequency-inverse document frequency (TF-IDF) matrix, which plots the frequency of word repetition in the sustainability report, is created by using the BoW method. The TF-IDF is most commonly employed in text mining vectorizing methods [59,60,61].
Each word of the text derived from BoW text mining is then assigned sentimental values. The sentimental value constitutes the classification of extracted words as being used in positive or negative terms in the texts. Since no prior lexicon exists for the sustainable management report, this study directly determines the sentimental value of the sustainability management report for the first time. Eight experts (two certified public accountants, two professors of business, two management field consultants, and two CEOs) in relevant fields of sustainable management reports perform this task. Each specialist assigns a sentimental value and verifies his or her agreement with the intra-class correlation (ICC) test. Through repeated review and data-sharing, the degree of agreement of the sentimental value exceeded 99%. In this research, the sentimental value of the words is taken to have a total value of seven levels. Specifically, the most positive words are assigned +3 points, the most negative words are assigned −3 points, the neutral words are assigned 0 points, and others are located in the range of −3 to +3. As a final step, the CEO’s message data are arranged based on the lexicon of the sustainability management report. The final sentimental values are measured by a weighted average of the TF-IDF values. To the best of our knowledge, the lexicon for sustainable management reports established in our study constitutes the first approach in this research field.

3.3. Classifying Sustainability Management Perspectives by SBSC Framework

Since Kaplan and Norton introduced the concept of the balanced scorecard (BSC) [30], numerous studies have performed related empirical and theoretical analyses [29,31,32,33,34,35]. The BSC is also widely utilized in business practice [33], as it identifies interactions among learning and growth, customers, internal processes, and financial perspectives. The four perspectives of the BSC are linked by cause-and-effect associations [29]. By extracting key success factors based on these four perspectives, the BSC approach facilitates the achievement of the firm’s strategies and goals [34]. Indeed, for sustainable business success, BSC can suggest success factors and provide long-term strategies [37].
During the past decade, the BSC approach has evolved to consider factors for sustainable management. This new framework, i.e., sustainable management with the BSC framework, can support or overcome the shortcomings of the traditional method, which does not consider social management factors. Following recent prior research, we use the SBSC framework that adds a CSR perspective to the existing four perspectives [3,4,5,6]. In addition to these five factors considered in SBSC, the CEO’s message in the sustainable management report includes a considerable number of keywords on the business environment outside of the company. We classify the keywords of CEO messages using six perspectives (customer, learning and growth, internal process, financial, corporate social responsibility (CSR), and external business environment).

3.4. Financial Indicators

In this study, we examine whether CEO messages predict future financial performance and firm value. Therefore, we utilize the major financial ratios that are generally present in financial statement analysis to assess corporate performance, such as rates of profitability, liquidity, growth, stability, and activity. Further, to investigate potential growth probability, we use a firm value indicator.
Proxies of the firm’s profitability return on assets (ROA), return on equity (ROE), and cash flow operating (CFO). These measures reveal a company’s efficient use of assets and management of its expenses to generate a certain rate of return. Proxies of liquidity comprise the current ratio (CUR), quick-asset ratio (QUICK), and defend interval (DEFINT). These measures show short-term cash usability to pay debts and other expenditures. The proxies of growth are total asset growth rate (ASSGRW), sales growth rate (REVGRW), and tangible asset growth rate (TANGRW). The proxies of the stability ratio comprise debt-to-equity ratio (LEV), borrowings-to-asset ratio (BOR), and average after-tax interest from total borrowings (COD). Activity proxies include total asset turnover (ASSTOV), working capital turnover (WCTOV), and tangible asset turnover (TANTOV). These indicators reveal the firm’s efficiency of given resources to generate profits. The measurements of firm value are price-to-earnings ratio (PER), price-book value ratio (PBR), and Tobin’s Q (TQ). These proxies capture the firm’s potential growth according to market expectations. The above financial ratios are summarized into six categories as shown in Table 1.

3.5. Research Methodology

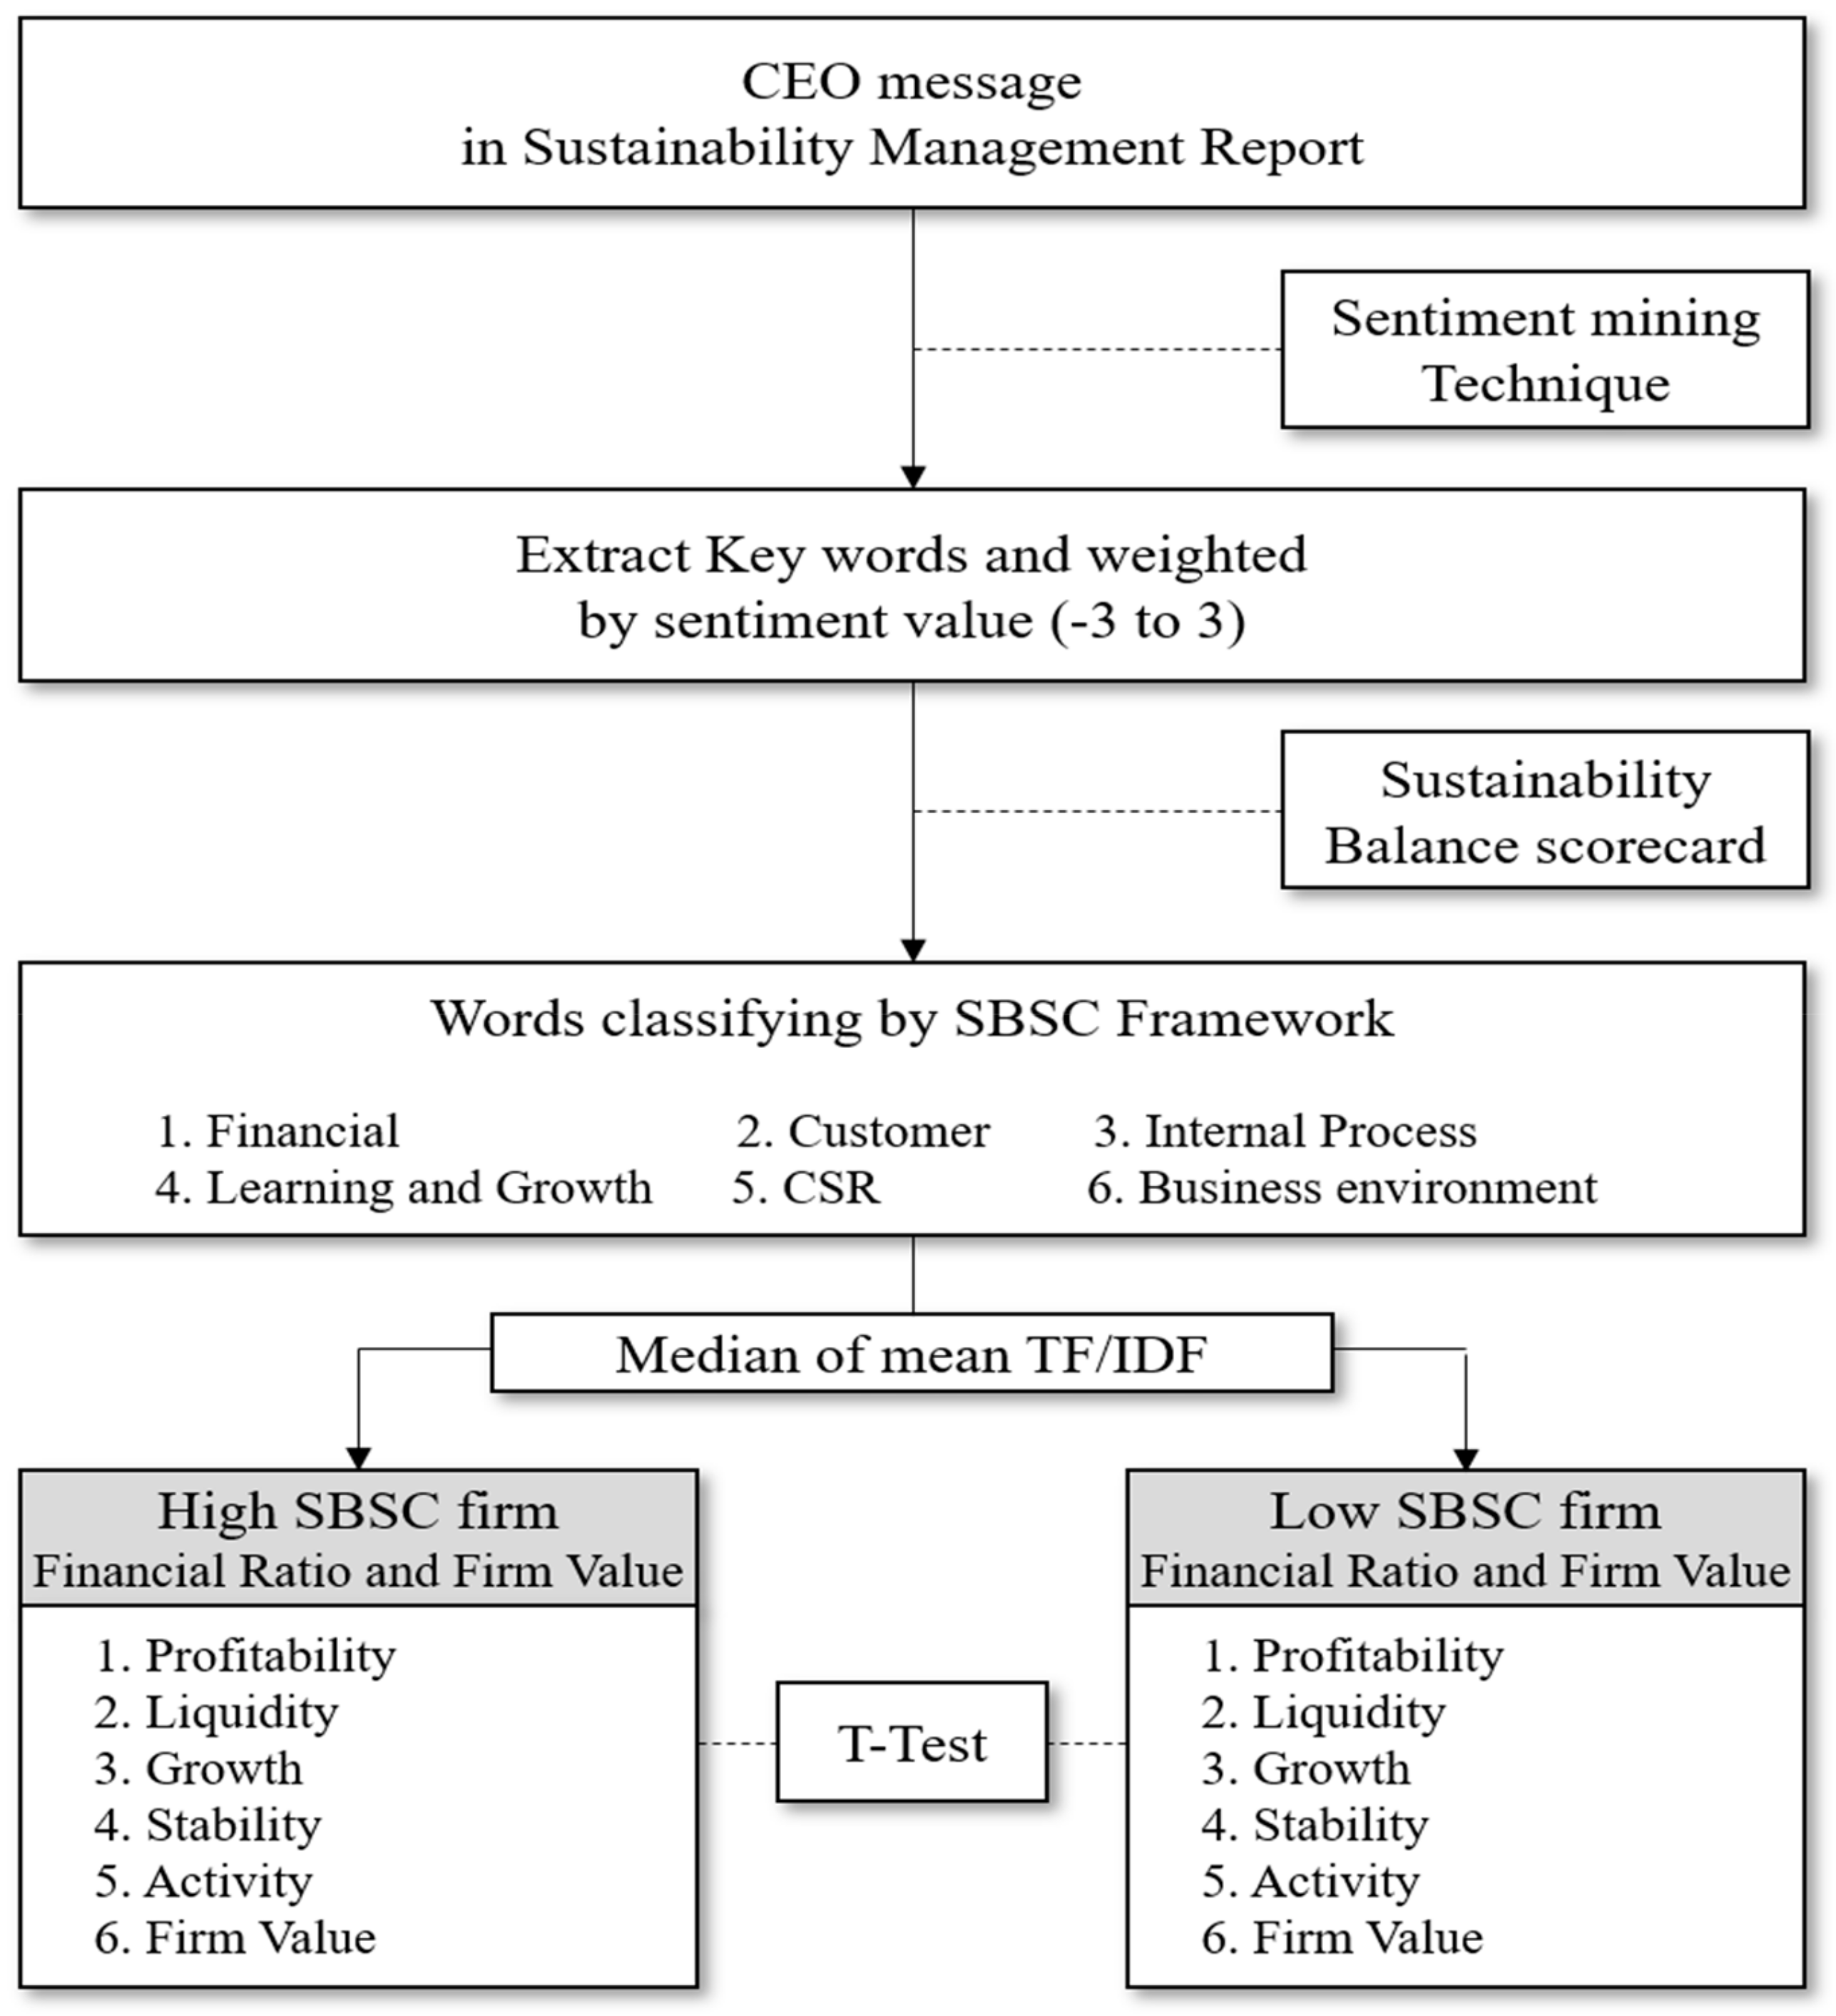
Our research framework is as follows. First, we quantify the CEO message into six perspectives. We multiply each word’s TF/IDF with the weight assigned discretionarily (refer to Section 3.2 for details). Second, we categorize the words extracted from the CEO greeting message in a sustainable management report into five SBSC perspectives, including financial, customer, internal process, learning and growth, and CSR. Here, we face mechanistic problems in applying the original SBSC framework. First, most of the words used in CEO messages are generic, and could not be classified into the SBSC framework. Second, certain word-types, such as adjectives, adverbs, bound nouns, and postpositions depend highly on other words. Third, and more interestingly and importantly, some words are not related to the firm’s inner information, but rather explain the external environment, such as economic policy, international economic conditions, etc. To solve the first and second problems, we omit both generic common words and dependent words. To mitigate the third problem, we add the business environment perspective into the original SBSC’s five perspectives, now constituting six categories.
We next calculate the mean values of weighted TF/IDF words depending on the six perspectives, as follows: financial (FIN), the customer (CUS), internal process (INP), learning and growth (LNG), CSR, and business environment (ENV). We define these mean values as the SBSC score. In doing so, we are able to classify precisely where the CEO message places emphasis on the six categories. Table 2 presents variables of six SBSC perspectives based on TF/IDF calculations.
We then divide the sample into two groups by each median of weighted TF/IDF of the abovementioned six indicators. We determine a high SBSC group if an observation has a higher SBSC score than the corresponding median value. We next compare the mean values of financial indicators and firm value proxies between the high BSC and low BSC groups using univariate t-tests. Subsequently, we classify CEO messages into six perspectives based on the SBSC framework. Finally, we test the associations between CEO messages and financial ratios. Figure 1 summarizes our research methodology.

4. Empirical Results

4.1. Descriptive Statistics

Table 3 presents the descriptive statistics of our sample. First, mean values of each word’s TF/TDF according to the SBSC framework are all positive, suggesting that the CEO message in a sustainable management report is written using primarily optimistic and positive words. The mean (median) values of return on asset (ROA) is 0.043 (0.033), return on equity (ROE) is 0.075 (0.062), and cash flow from operating ratio is 0.080 (0.046). The profitability of the firm reporting sustainable management report is generally favorable. The mean (median) values of current ratio (CUR) is 2.326 (1.254), quick asset ratio (QUICK) is 1.989 (1.032), and defensive interval (DEFINT) is 0.428 (0.150). The sound thresholds for the current ratio and quick asset ratio are 200% and 100%, respectively. In addition, the quick asset ratio is generally safe for short-term debt coverage because the mean and median exceed the proper ratio. Given that the current assets constitute the sum of current assets and inventories, most of our sample firms have a low proportion of inventories. The mean (median) values of asset growth (ASSGRW) is 0.035 (0.031), sales growth (REVGRW) is 0.068 (0.037), and tangible asset growth (TANGRW) is 0.068 (0.431). From these results, we conclude that most of the firms issuing sustainable management reports are at the growth or mature stage.
The mean (median) values of debt-to-equity ratio (LEV) is 1.186 (0.904), borrowings-to-asset ratio (BORR) is 0.492 (0.306), and average after-tax interest from borrowings (COD) is 0.036 (0.032). Approximately 50% of the sample firms’ capital was raised from debt issues. Considering that the proper debt-to-equity ratio is 100%, even though some firms have a very high debt-to-equity ratio, others possess a sound financial advantage. The mean (median) values of asset turnover (ASSTOV) is 0.819 (0.700), working capital turnover (WCTOV) is 5.250 (3.660), and tangible asset turnover (TANTOV) is 18.967 (3.400). Finally, the mean (median) values of the price-to-earnings ratio (PER) is 32.149 (15.029), the price-book value ratio (PBR) is 1.738 (1.307), and Tobin’s Q (TQ) is 1.423 (1.106).

4.2. CEO Message in Sustainable Management Report and Financial Status

Table 4 shows the t-test results that examine the mean differences of financial ratio in the year of the sustainable management report disclosure. First, in the financial perspective in the SBSC framework, high SBSC firms’ mean value of the current ratio (CUR) is significantly lower than that of low SBSC firms at the 10% level (t = −1.92 *). Similarly, the mean value of the high SBSC group’s quick ratio (QUICK) is significantly lower than that of the low SBSC group at the 5% level (t = −2.00 **). Further, Tobin’s Q (TQ) of the high SBSC group is significantly lower than the low SBSC group at the 5% level (t = −2.01 **). No statistical significance is found in other mean differences in financial ratios. This result could suggest that firms with low short-term payment ability and low growth potential seek to compensate for their financial weakness by emphasizing financial performance through CEOs’ greeting messages in the sustainable management report.
Second, regarding customer perspective in the SBSC framework, high SBSC firms’ mean values of return on asset (ROA), return on equity (ROE), and defensive interval (DEFINT) are significantly higher than those of low SBSC firms at the 5% level (t = 2.00 **, t = 2.02 **, and t = 2.36 **, respectively). Moreover, all of the stability ratios, including debt-to-equity ratio (LEV), borrowing-to-asset ratio (BORR), and average after-tax interest from borrowings (COD) are higher in the high SBSC group than in the low SBSC group. Similarly, the mean value of asset turnover (ASSTOV) is significantly higher in the high SBSC firms at the 1% level (t = 3.28 ***). Firm value proxies, price-to-book ratio (PBR), and Tobin’s Q (TQ) of the high SBSC group are higher at the 1% and 5% level, respectively (t = 2.77 ***, t = 2.51 **). Collectively, firms that generate high profits by using given assets, and possess a good debt-raising ability and higher growth potential, use customer-friendly words in the sustainable management report.
Third, from the internal process perspective in the SBSC framework, high SBSC firms’ mean value of asset growth (ASSGRW) is lower. However, high SBSC firms’ average after-tax from borrowings (COD) is higher than the low SBSC firms’ average (t = −2.25 **, t = 1.70 *). This finding indicates that companies with decreasing sizes and high-interest rates, due to low credit ratings, would like to emphasize internal firm operational efficiencies.
Fourth, we find no statistically significant differences between high and low SBSC firms in the learning and growth perspective. All of the liquidity ratios of high SBSC firms are lower than those of low SBSC firms, despite their statistical insignificance.
Fifth, similar to the learning and growth perspective, there is no statistical significance in the mean differences of any financial ratio of high and low SBSC firms in the corporate social responsibility (CSR) category. We interpret this finding as firms emphasizing CSR in their sustainable management report not having any systematic differences in their financial status when compared to low SBSC firms.
Sixth, in the business environment perspective, all of the firm value proxies, including price-to-earnings ratio (PER), price-book ratio (PBR) and Tobin’s Q (TQ), are higher in high SBSC firms than in low SBSC firms at the 5% level (t = 2.04 **, t = 2.19 **, t = 2.49 **). These findings suggest that CEOs with high potential for future growth, but no outstanding current financial performance, tend to shed light on corporate external aspects to complement their short-term performance and provide expectations for their future performance.

4.3. One-Year Change in Financial Status after Disclosing the CEO Message in the Sustainable Management Report

In this section, we investigate how the financial ratios change after disclosing CEO messages through a sustainable management report. Specifically, using high and low SBSC group classification of the CEO message in 2016, we track the change in financial ratios from 2016 to 2017. Table 5 presents the t-test results comparing the change of the mean values of the financial ratios. Table 5 also shows univariate mean differences of one-year-ahead changes in financial ratios between high and low SBSC groups. ***, **, and * denote significance levels at 1, 5, and 10%, respectively.
First, concerning the financial perspective in the SBSC framework, only the high SBSC firms’ change of Tobin’s Q (delta TQ) is significantly higher than that of low SBSC firms at the 10% level (t = 1.70 *). Other financial ratio change differences are not statistically significant, meaning that the CEO message related to the financial perspective has little or no impact on the firm’s financial performance. Nevertheless, it does increase potential growth probability, revealing that positive tones in CEO messages are positively perceived by investors.
Second, in the customer perspective in the SBSC framework, we find no statistical significance, suggesting that emphasizing customer perspective through the CEO message does not influence future financial status or even firm value.
Third, in the internal process perspective, high SBSC firms’ change of current ratio (delta CUR), quick asset ratio (delta QUICK), and defensive interval (delta DEFINT) are significantly higher than that of low SBSC firms. These results imply that firms emphasizing the efficiency of internal processes who experienced low activity and a high cost of debt financing in the previous year increase liquidity in order to manage short-term payment ability.
Fourth, concerning the learning and growth perspective, the change of each firm value measurement, including price-to-earnings ratio (delta PER), price-book ratio (delta PBR), and Tobin’s Q (delta TQ) is significantly higher than that of the low group (t = 1.73 *, t = 2.25 **, t = 2.50 **). This finding indicates that certain references made by the CEO, such as education for employees and visions for the future, can provide investors with a positive indication of the company’s prospects, ultimately resulting in a positive impact on firm value.
Fifth, firms whose CEOs focus on CSR in the sustainable report experienced decreased profits. High SBSC firms’ change of return on asset (delta ROA) and return on equity (delta ROE) is lower than that of low SBSC firms. In contrast, liquidity improves at one year after reporting the CSR message. Moreover, the high SBSC firms’ change of current ratio (delta CUR) and quick asset ratio (delta QUICK) is higher than that of the low SBSC firms at the 10% level (t = 1.70 *, t = 1.75 *). These results could indicate that a firm that is expected to decrease profitability aims to mitigate its negative performance by emphasizing social responsibility activities. However, as the liquidity of these firms increases, they decide to retain cash rather than carry out CSR activities.
Sixth, no significant difference exists in financial ratio and firm value change between high and low SBSC firms in the business environment perspective. Thus, a CEO focusing on the external environment has little or no impact on change one-year-ahead of financial status.

4.4. Multi-Regression Analysis

In this section, we report the multi-regression results, which are addressed in Table 6. Panels show the results of using profit, liquidity, growth, stability, activity, and value indicators as dependent variables. Current ratio (CUR), asset growth (ASSGRW), leverage ratio (LEV), the natural logarithm of total assets (SIZE), the ratio of fixed assets to total assets (PPE), and the firm’s operating years (AGE) are included as control variables. ROA is also used as a control variable but is not used in Panel A because we have the same variable as a dependent variable.
In Panel A, the results demonstrate that the customer relationship perspective relates positively to profitable indicators, such as ROA, ROE, and CFO. In Panel B, CSR relates to higher liquidity levels. In Panel C, we find no statistically significant relationships among the six perspectives and growth indicators. In Panel D, both FIN and CUS are positively correlated with two stability indicators. Moreover, ENV exhibits a marginal relationship with activity indicators in Panel E. Finally, in Panel F, we find a positive association between ENV and value indicators.
To summarize, we find a significant association between CSR and liquidity indicators, which is similar to the results of the univariate test. Moreover, the relations of FIN, CUS, and stability indicators and ENV and value indicators are only significant in the regression analysis. Since multi-regression tests show the coefficient after controlling the effect of other perspectives, as well as controls on the dependent variables, we conclude that considerable numbers of financial ratios relate to our SBSC perspectives.

5. Summary of Results and Discussion

Firms with low short-term payment ability and low growth potential seek to compensate for their financial weakness by emphasizing financial performance through CEO messages in sustainable management reports. Firms that generate high profits by using given assets efficiently, and possess a strong ability to raise debt and good growth potential, utilize customer-friendly words in the sustainable management report. On the other hand, companies with decreasing sizes and high-interest rates, due to low credit ratings, would like to emphasize internal firm operational efficiencies. Firms emphasizing corporate social responsibility in their sustainable management reports possess certain financial characteristics and potential growth probability. CEOs with a high potential for future growth, but no outstanding current financial performance, tend to shed light on corporate external aspects to complement their short-term performance and provide expectations for their future performance.
We now turn to a discussion of the change test. First, based on the results, we cannot reject our null hypothesis, which predicts that no systematic associations exist between perspectives of CEO messages in the sustainable management report and their financial ratios. Second, CEO messages related to financial perspective have little impact on the firm’s financial performance, but they do increase potential growth due to investors accepting the messages positively. In addition, emphasizing the customer perspective through a CEO message does not influence future financial status or even firm value. Corporations seem to emphasize the efficiency of their internal processes when they suffered from a high cost of financing debt in the previous year. References by CEOs, such as education for employees and visions for the future, can provide investors with a favorable indication of the company’s prospects, ultimately resulting in a positive impact on firm value. Moreover, firms that are expected to experience reduced profitability aim to mitigate their negative performance by stressing social responsibility activities. As the liquidity of these companies increases, however, they retain cash rather than carry out CSR activities. Finally, the CEO message, as it is related to the external environment, exerts no impact on future growth.
The results of this study constitute evidence that the text of a qualitative report can provide an indication to predict the financial ratios of the firm. This is believed to be because the manager is already acutely cognizant of the financial performance or financial condition of the firm when he or she composes the CEO message.

6. Conclusions

The results of the association between CEO messages in sustainability management reports and financial indicators provide useful information about a company’s sustainability management. The content of the CEO message in the sustainable management report is systematically classified by using the SBSC, considering the sustainability management perspective. We compare six perspectives of the SBSC with various financial indicators of the company.
Barkemeyer et al., argue that, despite the increasing standardization of sustainable reporting, the CEO message in the sustainability management report focuses more on managing the firm’s impression than it does on the content of its responsibilities [26]. Our results also demonstrate that the content of the CEO message in the sustainability management report consists largely of positive words. In addition, keywords related to the CSR perspective do not have a significant relationship with financial indicators. Qualitative disclosure data, such as CEO messages, are generally deemed to be unreliable in the context of financial status, and requisite attention and efforts are needed to improve it. Finally, we use 2016 and 2017 data in our tests. The sustainability management report data are collected from the Business Institute for Sustainable Development (BISD) website. To date, it only provides data for those two years. Due to this limitation of data availability, we acknowledge that our results should be generalized with caution.
The main implications of this research are as follows. First, this study quantified unstructured text data using sentiment mining for empirical analysis. This research methodology is anticipated to expand the scope of the field of study by making qualitative data available for empirical analysis. Second, we increased the robustness of our results by connecting the research fields of accounting, finance, and MIS by linking financial ratios to textual mining. We believe that our study and approach will enable new and promising future research directions in a variety of fields.
The results of this paper prompt us to strengthen the supervisory standard for qualitative disclosures in practice. Since our findings reveal that CEO messages generally lack sufficient information about the firm’s financial status, guiding these textual disclosures through regulation is necessary. Second, the results of this study highlight the importance of fair and honest disclosures to corporate managers. It also identifies the importance of qualitative disclosure data to inform users who utilize the firm’s published data. Third, although we found limited evidence for associations between CEO messages in sustainability reports and financial ratios, our research still provides a valuable contribution to related practice. For instance, the United Nations (UN) announced a plan to pursue sustainable development goals (SDGs) by 2030 (https://www.un.org/sustainabledevelopment/sustainable-development-goals/). Given this international business environment, the importance of a company’s sustainable management report is determined to be more imperative than any other report. Furthermore, the SBSC framework used in this study proved to be a meaningful vehicle for analyzing the qualitative data expressed in the sustainability management report.

Author Contributions

H.J.N. initiated research ideas and manuscript preparation. K.C.L. supervised and reviewed the manuscripts. S.U.C. conducted literature review and led revision procedures. S.T.K. conducted data processing and analysis. All authors have read and agreed to the published version of the manuscript.

Funding

This work was supported by the Ministry of Education of the Republic of Korea and the National Research Foundation of Korea (NRF-2019S1A5A2A01046529).

Conflicts of Interest

The authors declare no conflict of interest.

References

  1. Cormier, D.; Magnan, M. The economic relevance of environmental disclosure and its impact on corporate legitimacy: An empirical investigation. Bus. Strategy Environ. 2015, 24, 431–450. [Google Scholar] [CrossRef]
  2. Burke, J.J.; Clark, C.E. The business case for integrated reporting: Insights from leading practitioners, regulators, and academics. Bus. Horiz. 2016, 59, 273–283. [Google Scholar] [CrossRef]
  3. Butler, J.B.; Henderson, S.C.; Raiborn, C. Sustainability and the balanced scorecard: Integrating green measures into business reporting. Manag. Account. Q. 2011, 12, 1–10. [Google Scholar]
  4. Falle, S.; Rauter, R.; Engert, S.; Baumgartner, R. Sustainability management with the sustainability balanced scorecard in SMEs: Findings from an Austrian case study. Sustainability 2016, 8, 545. [Google Scholar] [CrossRef] [Green Version]
  5. Kang, J.S.; Chiang, C.F.; Huangthanapan, K.; Downing, S. Corporate social responsibility and sustainability balanced scorecard: The case study of family-owned hotels. Int. J. Hosp. Manag. 2015, 48, 124–134. [Google Scholar] [CrossRef]
  6. Rabbani, A.; Zamani, M.; Yazdani-Chamzini, A.; Zavadskas, E.K. Proposing a new integrated model based on sustainability balanced scorecard (SBSC) and MCDM approaches by using linguistic variables for the performance evaluation of oil producing companies. Expert Syst. Appl. 2014, 41, 7316–7327. [Google Scholar] [CrossRef]
  7. Lueg, R.; Pedersen, M.M.; Clemmensen, S.N. The role of corporate sustainability in a low-cost business model–A case study in the Scandinavian fashion industry. Bus. Strategy Environ. 2015, 24, 344–359. [Google Scholar] [CrossRef]
  8. Amernic, J.; Craig, R.; Tourish, D. Measuring and Assessing Tone at the Top Using Annual Report CEO Letters; The Institute of Chartered Accountants of Scotland: Edinburgh, UK, 2010. [Google Scholar]
  9. Andreia Costa, G.; Cristina Oliveira, L.; Lima Rodrigues, L.; Craig, R. Factors associated with the publication of a CEO letter. Corp. Commun. Int. J. 2013, 18, 432–450. [Google Scholar] [CrossRef]
  10. Aerts, W.; Cormier, D.; Magnan, M. Corporate environmental disclosure, financial markets and the media: An international perspective. Ecol. Econ. 2008, 64, 643–659. [Google Scholar] [CrossRef]
  11. Amernic, J.H.; Craig, R.J. Guidelines for CEO-speak: Editing the language of corporate leadership. Strategy Leadersh. 2007, 35, 25–31. [Google Scholar] [CrossRef]
  12. Amernic, J.; Russell, C. Improving CEO-speak. J. Account. 2007, 203, 65–66. [Google Scholar]
  13. Santema, S.; Van de Rijt, J. Strategy disclosure in Dutch annual reports. Eur. Manag. J. 2001, 19, 101–108. [Google Scholar] [CrossRef]
  14. Mäkelä, H.; Laine, M. A CEO with many messages: Comparing the ideological representations provided by different corporate reports. Account. Forum 2011, 35, 217–231. [Google Scholar] [CrossRef]
  15. Kohut, G.F.; Segars, A.H. The president’s letter to stockholders: An examination of corporate communication strategy. J. Bus. Commun. (1973) 1992, 29, 7–21. [Google Scholar] [CrossRef]
  16. Segars, A.H.; Kohut, G.F. Strategic communication through the World Wide Web: An empirical model of effectiveness in the CEO’s letter to shareholders. J. Manag. Stud. 2001, 38, 535–556. [Google Scholar] [CrossRef]
  17. Clatworthy, M.; Jones, M.J. The effect of thematic structure on the variability of annual report readability. Account. Audit. Account. J. 2001, 14, 311–326. [Google Scholar] [CrossRef]
  18. Clatworthy, M.A.; Jones, M.J. Differential patterns of textual characteristics and company performance in the chairman’s statement. Account. Audit. Account. J. 2006, 19, 493–511. [Google Scholar] [CrossRef]
  19. Diouf, D.; Boiral, O. The quality of sustainability reports and impression management: A stakeholder perspective. Account. Audit. Account. J. 2017, 30, 643–667. [Google Scholar] [CrossRef]
  20. King, A.; Bartels, W. The KPMG Survey of Corporate Responsibility Reporting 2015. KPMG. 2015. Available online: https://assets.kpmg.com/content/dam/kpmg/pdf/2016/05/KPMGSurvey_of_CRReporting_2015.pdf (accessed on 22 September 2019).
  21. UNGC Homepage. Available online: https://www.unglobalcompact.org (accessed on 22 September 2019).
  22. Henry, E. Are investors influenced by how earnings press releases are written? J. Bus. Commun. (1973) 2008, 45, 363–407. [Google Scholar] [CrossRef]
  23. Jameson, D.A. Telling the investment story: A narrative analysis of shareholder reports. J. Bus. Commun. (1973) 2000, 37, 7–38. [Google Scholar] [CrossRef]
  24. Cho, C.H.; Roberts, R.W.; Patten, D.M. The language of US corporate environmental disclosure. Account. Organ. Soc. 2010, 35, 431–443. [Google Scholar] [CrossRef]
  25. Guay, W.; Samuels, D.; Taylor, D. Guiding through the fog: Financial statement complexity and voluntary disclosure. J. Account. Econ. 2016, 62, 234–269. [Google Scholar] [CrossRef]
  26. Barkemeyer, R.; Holt, D.; Preuss, L.; Tsang, S. What happened to the ‘development’ in sustainable development? Business guidelines two decades after Brundtland. Sustain. Dev. 2014, 22, 15–32. [Google Scholar] [CrossRef] [Green Version]
  27. Hooghiemstra, R. Corporate communication and impression management–new perspectives why companies engage in corporate social reporting. J. Bus. Ethics 2000, 27, 55–68. [Google Scholar] [CrossRef]
  28. Kaplan, R.S.; Norton, D.P. Linking the balanced scorecard to strategy. Calif. Manag. Rev. 1996, 39, 53–79. [Google Scholar] [CrossRef]
  29. Kaplan, R.S.; Norton, D.P. Measuring the strategic readiness of intangible assets. Harv. Bus. Rev. 2004, 82, 52–63. [Google Scholar]
  30. Kaplan, R.S.; Norton, D.P. The balanced scorecard: Measures that drive performance. Harv. Bus. Rev. 1992, 70, 71–79. [Google Scholar]
  31. Hansen, E.G.; Schaltegger, S. The sustainability balanced scorecard: A systematic review of architectures. J. Bus. Ethics 2016, 133, 193–221. [Google Scholar] [CrossRef]
  32. Bonner, S.E.; Hastie, R.; Sprinkle, G.B.; Young, S.M. A review of the effects of financial incentives on performance in laboratory tasks: Implications for management accounting. J. Manag. Account. Res. 2000, 12, 19–64. [Google Scholar] [CrossRef]
  33. Kaplan, R.S. The balanced scorecard: Comments on balanced scorecard commentaries. J. Account. Organ. Chang. 2012, 8, 539–545. [Google Scholar] [CrossRef]
  34. Kaplan, R.S.; Norton, D.P. Transforming the balanced scorecard from performance measurement to strategic management: Part II. Account. Horiz. 2001, 15, 147–160. [Google Scholar] [CrossRef]
  35. Lipe, M.G.; Salterio, S.E. The balanced scorecard: Judgmental effects of common and unique performance measures. Account. Rev. 2000, 75, 283–298. [Google Scholar] [CrossRef]
  36. Cooper, D.J.; Ezzamel, M.; Qu, S.Q. Popularizing a management accounting idea: The case of the balanced scorecard. Contemp. Account. Res. 2017, 34, 991–1025. [Google Scholar] [CrossRef]
  37. Figge, F.; Hahn, T.; Schaltegger, S.; Wagner, M. The Sustainability Balanced Scorecard–Theory and Application of a Tool for Value-Based Sustainability Management. In Proceedings of the Greening of Industry Network Conference, Göteborg, Sweden, 23–26 June 2002; Volume 2. [Google Scholar]
  38. Gumbus, A.; Lussier, R.N. Entrepreneurs use a balanced scorecard to translate strategy into performance measures. J. Small Bus. Manag. 2006, 44, 407–425. [Google Scholar] [CrossRef]
  39. Johnson, M.P.; Schaltegger, S. Two decades of sustainability management tools for SMEs: How far have we come? J. Small Bus. Manag. 2016, 54, 481–505. [Google Scholar] [CrossRef]
  40. Malagueño, R.; Lopez-Valeiras, E.; Gomez-Conde, J. Balanced scorecard in SMEs: Effects on innovation and financial performance. Small Bus. Econ. 2018, 51, 221–244. [Google Scholar] [CrossRef]
  41. Lin, H.F. Linking knowledge management orientation to balanced scorecard outcomes. J. Knowl. Manag. 2015, 19, 1224–1249. [Google Scholar] [CrossRef]
  42. Aly, A.H.; Mansour, M.E. Evaluating the sustainable performance of corporate boards: The balanced scorecard approach. Manag. Audit. J. 2017, 32, 167–195. [Google Scholar] [CrossRef]
  43. Bournois, F.; Point, S. A letter from the president: Seduction, charm and obfuscation in French CEO letters. J. Bus. Strategy 2006, 27, 46–55. [Google Scholar] [CrossRef]
  44. Grueber, M.; Studt, T. 2011 Global R&D Funding Forecast: CEO Message. R D Mag. 2010, 52, 31–64. [Google Scholar]
  45. Sonnier, B.M. Intellectual capital disclosure: High-tech versus traditional sector companies. J. Intellect. Cap. 2008, 9, 705–722. [Google Scholar] [CrossRef]
  46. Cianci, A.M.; Kaplan, S.E. The effect of CEO reputation and explanations for poor performance on investors’ judgments about the company’s future performance and management. Account. Organ. Soc. 2010, 35, 478–495. [Google Scholar] [CrossRef]
  47. Manner, M.H. The impact of CEO characteristics on corporate social performance. J. Bus. Ethics 2010, 93, 53–72. [Google Scholar] [CrossRef]
  48. Barker III, V.L.; Mueller, G.C. CEO characteristics and firm R&D spending. Manag. Sci. 2002, 48, 782–801. [Google Scholar]
  49. Bird, R.; Hall, A.D.; Momentè, F.; Reggiani, F. What corporate social responsibility activities are valued by the market? J. Bus. Ethics 2007, 76, 189–206. [Google Scholar] [CrossRef]
  50. BISD Homepage. Available online: https://www.bisd.or.kr (accessed on 22 September 2019).
  51. KIS-VALUE. Available online: https://www.kisvalue.com (accessed on 22 September 2019).
  52. TS-2000. Available online: http://www.kocoinfo.com (accessed on 22 September 2019).
  53. Collobert, R.; Weston, J. A Unified Architecture for Natural Language Processing: Deep Neural Networks with Multitask Learning. In Proceedings of the 25th International Conference on Machine Learning, Helsinki, Finland, 5–9 July 2008; pp. 160–167. [Google Scholar]
  54. Manning, C.; Surdeanu, M.; Bauer, J.; Finkel, J.; Bethard, S.; McClosky, D. The Stanford CoreNLP Natural Language Processing Toolkit. In Proceedings of the 52nd Annual Meeting of the Association for Computational Linguistics: System Demonstrations, Baltimore, MD, USA, 22–27 June 2014; pp. 55–60. [Google Scholar]
  55. Joulin, A.; Grave, E.; Bojanowski, P.; Mikolov, T. Bag of tricks for efficient text classification. arXiv 2016, arXiv:1607.01759. [Google Scholar]
  56. Nahm, U.Y.; Mooney, R.J. Text Mining with Information Extraction. In Proceedings of the AAAI 2002 Spring Symposium on Mining Answers from Texts and Knowledge Bases, Palo Alto, CA, USA, 25–27 March 2002; pp. 60–67. [Google Scholar]
  57. Sriram, B.; Fuhry, D.; Demir, E.; Ferhatosmanoglu, H.; Demirbas, M. Short Text Classification in Twitter to Improve Information Filtering. In Proceedings of the 33rd International ACM SIGIR Conference on Research and Development in Information Retrieval, Geneva, Switzerland, 19–23 July 2010; pp. 841–842. [Google Scholar]
  58. Sun, H.; Sun, X.; Wang, H.; Li, Y.; Li, X. Automatic target detection in high-resolution remote sensing images using spatial sparse coding bag-of-words model. IEEE Geosci. Remote Sens. Lett. 2011, 9, 109–113. [Google Scholar] [CrossRef]
  59. Jing, L.P.; Huang, H.K.; Shi, H.B. Improved Feature Selection Approach TFIDF in Text Mining. In Proceedings of the International Conference on Machine Learning and Cybernetics, Beijing, China, 4–5 November 2002; Volume 2, pp. 944–946. [Google Scholar]
  60. Ramos, J. Using TF-IDF to Determine Word Relevance in Document Queries. In Proceedings of the First Instructional Conference on Machine Learning, Piscataway, NJ, USA, 3–8 December 2003; Volume 242, pp. 133–142. [Google Scholar]
  61. Zhang, W.; Yoshida, T.; Tang, X. A comparative study of TF* IDF, LSI and multi-words for text classification. Expert Syst. Appl. 2011, 38, 2758–2765. [Google Scholar] [CrossRef]
  62. Mohamad, N.E.A.B.; Saad, N.B.M. Working capital management: The effect of market valuation and profitability in Malaysia. Int. J. Bus. Manag. 2010, 5, 140. [Google Scholar]
  63. Anbar, A.; Alper, D. Bank specific and macroeconomic determinants of commercial bank profitability: Empirical evidence from Turkey. Bus. Econ. Res. J. 2011, 2, 139–152. [Google Scholar]
  64. Ball, R.; Gerakos, J.; Linnainmaa, J.T.; Nikolaev, V. Accruals, cash flows, and operating profitability in the cross section of stock returns. J. Financ. Econ. 2016, 121, 28–45. [Google Scholar] [CrossRef]
  65. Saleem, Q.; Rehman, R.U. Impacts of liquidity ratios on profitability. Interdiscip. J. Res. Bus. 2011, 1, 95–98. [Google Scholar]
  66. Al Nimer, M.; Warrad, L.; Al Omari, R. The impact of liquidity on Jordanian banks profitability through return on assets. Eur. J. Bus. Manag. 2015, 7, 229–232. [Google Scholar]
  67. Emery, G.W.; Cogger, K.O. The measurement of liquidity. J. Account. Res. 1982, 20, 290–303. [Google Scholar] [CrossRef]
  68. Cooper, M.J.; Gulen, H.; Schill, M.J. Asset growth and the cross-section of stock returns. J. Financ. 2008, 63, 1609–1651. [Google Scholar] [CrossRef]
  69. Covin, J.G.; Green, K.M.; Slevin, D.P. Strategic process effects on the entrepreneurial orientation–sales growth rate relationship. Entrep. Theory Pract. 2006, 30, 57–81. [Google Scholar] [CrossRef]
  70. Varaiya, N.; Kerin, R.A.; Weeks, D. The relationship between growth, profitability, and firm value. Strateg. Manag. J. 1987, 8, 487–497. [Google Scholar] [CrossRef]
  71. Shin, H.S. Securitisation and financial stability. Econ. J. 2009, 119, 309–332. [Google Scholar] [CrossRef]
  72. Deakin, E.B. Distributions of financial accounting ratios: Some empirical evidence. Account. Rev. 1976, 51, 90–96. [Google Scholar]
  73. Wilcox, J.A. Nominal interest rate effects on real consumer expenditure. Bus. Econ. 1990, 25, 31–37. [Google Scholar]
  74. Gupta, M.C. The effect of size, growth, and industry on the financial structure of manufacturing companies. J. Financ. 1969, 24, 517–529. [Google Scholar]
  75. Warrad, L. The impact of working capital turnover on Jordanian chemical industries’ profitability. Am. J. Econ. Bus. Adm. 2013, 5, 116–119. [Google Scholar]
  76. Büyüksalvarci, A.; Abdioglu, H. Corporate governance, financial ratios and stock returns: An empirical analysis of Istanbul Stock Exchange (ISE). Int. Res. J. Financ. Econ. 2010, 57, 70–81. [Google Scholar]
  77. Ou, J.A.; Penman, S.H. Accounting measurement, price-earnings ratio, and the information content of security prices. J. Account. Res. 1989, 27, 111–144. [Google Scholar] [CrossRef]
  78. Pae, J.; Thornton, D.B.; Welker, M. The link between earnings conservatism and the price-to-book ratio. Contemp. Account. Res. 2005, 22, 693–717. [Google Scholar] [CrossRef]
  79. Lang, L.H.; Stulz, R.M. Tobin’s q, corporate diversification, and firm performance. J. Polit. Econ. 1994, 102, 1248–1280. [Google Scholar]
Figure 1. Research Methodology.
Sustainability 12 00590 g001
Table 1. Definition of financial indicator and firm value.
VariablesDefinition
ProfitableROAReturn on asset [62]
ROEReturn on equity [63]
CFOCash flow from operating scaled by asset [64]
LiquidityCURCurrent ratio [65]
QUICKQuick ratio [66]
DEFINTDefensive interval [67]
GrowthASSGRWAsset growth [68]
REVGRWSales growth [69]
TANGRWTangible asset growth [70]
StabilityDEBTDebt to equity ratio [71]
BORRLiabilities to asset ratio [72]
CODThe average after-tax interest from total borrowing [73]
ActivityASSTOVAsset turnover [74]
WCTOVWorking capital turnover [75]
TANTOVTangible asset turnover [76]
Firm ValuePERPrice to earning ratio [77]
PBRPrice to book ratio [78]
TQTobin’s Q [79]
Table 2. Six perspectives of the sustainability balanced scorecard (SBSC) framework.
VariablesDefinition
TF/IDFFINThe mean of word’s TF/IDF related to financial perspective
CUSThe mean of word’s TF/IDF related to customer perspective
INPThe mean of word’s TF/IDF related to internal process perspective
LNGThe mean of word’s TF/IDF related to learning and growth perspective
CSRThe mean of word’s TF/IDF related to CSR perspective
ENVThe mean of word’s TF/IDF related to business environment perspective
Table 3. Descriptive statistics.
VariablesNMeanStdMinQ1MedianQ3Max
TF/IDFFIN129 0.007 0.006 0.000 0.003 0.006 0.011 0.019
CUS129 0.007 0.005 0.001 0.003 0.005 0.009 0.017
INP129 0.008 0.004 0.003 0.005 0.008 0.010 0.015
LNG129 0.007 0.003 0.003 0.005 0.007 0.010 0.013
CSR129 0.006 0.006 0.000 0.002 0.005 0.009 0.018
ENV129 0.006 0.003 0.001 0.003 0.005 0.007 0.012
ProfitableROA129 0.043 0.047 −0.021 0.011 0.033 0.067 0.148
ROE128 0.075 0.110 −0.053 0.023 0.062 0.110 0.261
CFO129 0.070 0.075 −0.070 0.032 0.067 0.117 0.191
LiquidityCUR129 2.326 5.360 0.488 0.897 1.254 1.747 4.350
QUICK129 1.989 4.720 0.387 0.712 1.032 1.438 3.656
DEFINT129 2.904 1.551 0.543 1.869 2.506 3.975 5.862
GrowthASSGRW127 0.035 0.093 −0.107 0.001 0.031 0.078 0.165
REVGRW127 0.068 0.311 −0.230 −0.044 0.037 0.112 0.270
TANGRW127 0.068 0.431 −0.248 −0.044 0.012 0.075 0.426
StabilityLIAB129 1.186 1.404 0.169 0.438 0.904 1.338 3.976
DEBT128 0.492 0.837 0.013 0.119 0.306 0.553 1.152
COD129 0.036 0.028 0.007 0.026 0.032 0.042 0.066
ActivityASSTOV129 0.819 0.538 0.110 0.470 0.700 1.130 1.870
WCTOV129 5.250 34.698 −26.070 −2.550 3.660 8.400 66.370
TANTOV129 18.967 87.034 0.710 1.620 3.400 5.560 96.130
Firm ValuePER83 32.149 46.540 5.260 10.586 15.029 25.609 158.784
PBR104 1.738 1.961 0.466 0.799 1.307 1.774 7.122
TQ104 1.423 1.159 0.757 0.908 1.106 1.328 3.914
Table 4. Univariate mean differences in financial ratios between high and low SBSC groups.
PerspectiveA. Financial B. Customer C. Internal Process
VariableMeanDifft-ValueMeanDifft-ValueMeanDifft-Value
HighLowHighLowHighLow
ProfitableROAt0.0420.043−0.001−0.070.0510.0350.0172.00 **0.0440.0420.0020.18
ROEt0.0720.078−0.006−0.310.0950.0560.0392.02 **0.0750.0750.0000.00
CFOt0.0670.073−0.006−0.480.0810.0590.0221.70 *0.0660.074−0.007−0.54
LiquidityCURt1.4273.210−1.783−1.92 *2.9391.7221.2171.282.6911.9660.7260.76
QUICKt1.1662.800−1.633−2.00 **2.5141.4731.0401.252.2311.7520.4790.57
DEFINTt2.7803.026−0.247−0.903.2202.5820.6382.36 **3.0702.7400.3301.20
GrowthASSGRWt0.0380.0320.0060.380.0370.0330.0040.250.0250.044−0.019−1.14
REVGRWt0.0540.083−0.029−0.530.0750.0620.0140.250.0970.0400.0571.02
TANGRWt0.0370.099−0.062−0.820.0770.0590.0180.23−0.0170.152−0.169−2.25 **
StabilityLEVt1.2601.1140.1450.581.3980.9780.4201.70 *1.3021.0730.2290.92
BORRt0.5060.4790.0270.180.2750.2240.0511.91 *0.5200.4650.0550.37
CODt0.0370.0360.0010.140.0430.0310.0122.08 **0.0410.0320.0091.70 *
ActivityASSTOVt0.8380.8010.0380.400.9710.6700.3013.28 ***0.8840.7560.1281.36
WCTOVt9.6020.9648.6381.4210.2120.3649.8491.626.2754.2402.0350.33
TANTOVt10.52527.278−16.754−1.1031.1187.00224.1171.5722.27515.7096.5650.42
Firm ValuePERt29.44835.507−6.059−0.5930.93933.450−2.511−0.2432.20332.0940.1090.01
PBRt1.4832.035−0.552−1.402.2541.2221.0322.77 ***1.8111.6680.1430.37
TQt1.2041.679−0.475−2.01 **1.7021.1440.5572.51 **1.5111.3390.1720.75
PerspectiveD. Learning and GrowthE. CSRF. Business Environment
VariableMeanDifft-ValueMeanDifft-ValueMeanDifft-Value
HighLowHighLowHighLow
ProfitableROAt0.0460.0400.0060.740.0440.0410.0030.310.0420.044−0.002−0.21
ROEt0.0750.0750.0010.030.0780.0720.0060.290.0750.075−0.001−0.04
CFOt0.0760.0650.0110.840.0700.0700.000−0.020.0660.074−0.007−0.55
LiquidityCURt1.5813.058−1.477−1.592.7361.9220.8140.862.6282.0280.6010.63
QUICKt1.3292.639−1.310−1.602.2891.6950.5940.712.1891.7920.3970.47
DEFINTt3.1302.6810.4491.642.9912.8180.1740.633.1512.6530.4991.63
GrowthASSGRWt0.0440.0260.0181.100.0340.035−0.001−0.050.0380.0310.0070.42
REVGRWt0.0720.0650.0070.130.1030.0340.0691.250.0460.091−0.046−0.82
TANGRWt0.0780.0590.0190.250.0540.083−0.029−0.380.0860.0510.0350.45
StabilityLEVt1.2181.1560.0620.251.1301.243−0.113−0.461.1651.207−0.042−0.17
BORRt0.5070.4780.0290.200.4900.494−0.004−0.020.5410.4440.0970.66
CODt0.0350.037−0.002−0.430.0360.037−0.001−0.090.0330.040−0.007−1.24
ActivityASSTOVt0.8960.7440.1521.610.8270.8120.0150.160.7960.843−0.047−0.49
ICTOVt5.3055.1950.1100.024.8055.688−0.883−0.147.1883.3413.8470.62
TANTOVt8.91628.863−19.947−1.3126.41911.62914.7900.9610.49027.313−16.823−1.11
Firm ValuePERt24.89838.894−13.997−1.4031.33532.943−1.608−0.1642.56121.98520.5772.04 **
PBRt1.8211.6480.1730.451.5631.894−0.332−0.862.1791.3300.8482.19 **
TQt1.3411.511−0.170−0.731.4481.4010.0470.211.7181.1490.5692.49 **
Note: ***, **, and * denote significance levels at 1, 5, and 10%, respectively.
Table 5. Univariate mean differences of one year ahead changes in financial ratios. Between high and low SBSC groups.
PerspectiveA. Financial B. Customer C. Internal Process
VariableMeanDifft-ValueMeanDifft-ValueMeanDifft-Value
HighLowHighLowHighLow
ProfitableΔROAt+1−0.004−0.0040.0000.05−0.006−0.002−0.003−0.52−0.0090.001−0.010−1.52
ΔROEt+1−0.002−0.0210.0190.82−0.018−0.005−0.014−0.60−0.018−0.005−0.013−0.58
ΔCFOt+1−0.007−0.0090.0020.10−0.010−0.005−0.004−0.21−0.013−0.002−0.012−0.56
LiquidityΔCURt+10.010−0.0260.0360.17−0.0260.009−0.035−0.160.182−0.1960.3781.82 *
ΔQUICKt+1−0.008−0.0500.0410.20−0.052−0.007−0.045−0.210.159−0.2140.3741.80 *
ΔDEFINTt+1−0.024−0.011−0.014−0.23−0.028−0.007−0.021−0.350.037−0.0710.1071.80 *
GrowthΔASSGRWt+1−0.0070.005−0.012−0.51−0.0140.013−0.027−1.13−0.0110.009−0.021−0.86
ΔREVGRWt+10.012−0.0540.0660.98−0.0530.011−0.064−0.95−0.0620.019−0.081−1.20
ΔTANGRWt+10.008−0.0810.0891.07−0.056−0.017−0.040−0.480.015−0.0880.1031.24
StabilityΔLEVt+1−0.113−0.031−0.082−0.60−0.1600.015−0.175−1.28−0.1650.020−0.184−1.35
ΔBORRt+1−0.048−0.006−0.042−0.59−0.0580.004−0.062−0.87−0.0610.007−0.069−0.96
ΔCODt+10.0000.001−0.002−0.08−0.0040.005−0.008−0.470.008−0.0070.0150.83
ActivityΔASSTOVt+10.0190.0010.0180.75−0.0070.027−0.034−1.410.0000.019−0.019−0.80
ΔWCTOVt+1−7.935−14.6096.6740.72−13.439−9.189−4.251−0.46−8.366−14.1845.8180.63
ΔTANTOVt+10.63910.069−9.430−0.7010.2780.5789.7000.7111.793−0.91412.7070.94
Firm ValueΔPERt+10.494−4.5155.0090.561.316−4.6775.9930.60−5.6172.054−7.672−0.78
ΔPBRt+10.053−0.1780.2301.50−0.1280.021−0.149−0.97−0.091−0.018−0.073−0.47
ΔTQt+10.028−0.1380.1661.70 *−0.1040.006−0.109−1.14−0.020−0.0770.0570.58
PerspectiveD. Learning and GrowthE. CSRF. Business Environment
VariableMeanDifft-ValueMeanDifft-ValueMeanDifft-Value
HighLowHighLowHighLow
ProfitableΔROAt+1−0.002−0.0060.0040.65−0.0120.004−0.016−2.53 **−0.004−0.004−0.001−0.14
ΔROEt+10.005−0.0280.0331.44−0.0340.011−0.046−2.03 **−0.013−0.010−0.004−0.16
ΔCFOt+1−0.004−0.0120.0080.39−0.0170.002−0.019−0.90−0.0150.000−0.015−0.72
LiquidityΔCURt+10.024−0.0400.0650.310.171−0.1840.3551.70 *0.122−0.1370.2591.24
ΔQUICKt+10.007−0.0650.0720.340.154−0.2100.3641.75 *0.099−0.1550.2531.21
ΔDEFINTt+1−0.002−0.0330.0310.520.031−0.0650.0961.610.019−0.0530.0731.21
GrowthΔASSGRWt+10.015−0.0160.0311.29−0.0010.000−0.001−0.040.008−0.0100.0180.76
ΔREVGRWt+1−0.007−0.0360.0280.42−0.0620.019−0.081−1.200.017−0.0600.0771.13
ΔTANGRWt+1−0.034−0.0400.0060.07−0.061−0.012−0.049−0.59−0.043−0.031−0.012−0.15
StabilityΔLEVt+1−0.112−0.033−0.079−0.58−0.023−0.1200.0980.720.035−0.1770.2111.57
ΔBORRt+1−0.0560.002−0.058−0.810.009−0.0610.0690.990.015−0.0670.0811.17
ΔCODt+1−0.0040.004−0.008−0.430.002−0.0010.0030.140.007−0.0060.0130.74
ActivityΔASSTOVt+1−0.0050.025−0.030−1.24−0.0060.026−0.032−1.340.0160.0040.0120.49
ΔWCTOVt+1−11.687−10.914−0.774−0.08−12.545−10.069−2.475−0.27−14.859−7.791−7.068−0.76
ΔTANTOVt+10.42410.281−9.857−0.7412.050−1.16713.2180.970.36410.339−9.975−0.75
Firm ValueΔPERt+17.414−9.86617.2801.73 *−2.372−1.025−1.347−0.14−0.053−3.3973.3440.34
ΔPBRt+10.110−0.2300.3402.25 **−0.025−0.0790.0540.35−0.060−0.048−0.013−0.08
ΔTQt+10.065−0.1720.2372.50 **−0.090−0.012−0.078−0.80−0.066−0.034−0.032−0.33
Table 6. Regression results.
Panel A. Regression Results Using Profit Indicators as Dependent Variables
VariableDep = ROADep = ROEDep = CFO
βt-Valueβt-Valueβt-Value
Intercept0.0170.119−0.125−0.363−0.325−1.379
FIN0.3030.4900.2480.1700.2290.229
CUS2.1582.699 ***3.6981.958 *3.7372.896 ***
INP−0.443−0.393−1.785−0.670−2.973−1.634
LNG0.1460.129−0.999−0.3731.6430.897
CSR−0.288−0.383−0.677−0.3810.5750.474
ENV−0.558−0.4640.5310.1870.0050.003
CUR0.0000.4580.0010.337−0.001−0.844
ASSGRW0.1834.364 ***0.3423.459 ***0.2714.009 ***
LEV−0.012−4.303 ***−0.025−3.774 ***−0.008−1.733 *
ASSTOV0.0182.358 **0.0713.994 ***0.0080.644
SIZE0.0010.1420.0080.6110.0101.170
PPE0.0351.5000.0691.2600.1123.000 ***
AGE−0.006−0.980−0.022−1.5810.0181.890 *
Fixed EffectIncludedIncludedIncluded
Fvalue5.231 ***4.671 ***4.518 ***
Adj_Rsq0.320 0.290 0.281
N_obs127 127 127
Panel B. Regression Results Using Liquidity Indicators as Dependent Variables
VariableDep = CURDep = QUICKDep = DEFINT
βt-Valueβt-Valueβt-Value
Intercept39.0792.300**39.2152.651 ***4.7961.090
FIN−28.966−0.393−32.743−0.5101.6270.085
CUS147.6021.516138.5531.63458.8802.335 **
INP39.5940.29434.1500.2921.5270.044
LNG−77.119−0.571−67.952−0.578−26.144−0.747
CSR384.2444.687 ***327.9144.593 ***96.8234.561 ***
ENV−93.003−0.650−88.787−0.712−14.383−0.388
ROA5.1550.4584.6690.4770.0850.029
ASSGRW−3.473−0.644−3.045−0.648−0.137−0.098
LEV−0.382−1.072−0.304−0.981−0.104−1.127
ASSTOV−2.525−2.851 ***−2.306−2.990 ***−0.639−2.788 ***
SIZE−1.393−2.237 **−1.394−2.572 **−0.173−1.071
PPE−4.017−1.463−3.978−1.664 *−1.324−1.862 *
AGE0.8621.2110.7581.2220.1921.043
Fixed EffectIncludedIncludedIncluded
Fvalue3.972 ***4.239 ***3.824 ***
Adj_Rsq0.248 0.265 0.239
N_obs127 127 127
Panel C. Regression Results Using Growth Indicators as Dependent Variables
VariableDep = ASSGRWDep = REVGRWDep = TANGRW
βt-Valueβt-Valueβt-Value
Intercept0.8142.767 ***−0.656−0.6174.0662.663 ***
FIN−0.428−0.332−3.973−0.853−1.564−0.234
CUS−1.858−1.086−6.512−1.0545.2230.588
INP−1.582−0.6749.3671.105−6.782−0.556
LNG1.6240.688−7.731−0.90710.4840.856
CSR0.9500.6074.7600.842−8.432−1.038
ENV0.2080.083−8.264−0.9127.2540.557
ROA0.7954.364 ***1.4652.228 **−0.499−0.528
CUR−0.001−0.6440.0020.4070.0050.550
LEV−0.003−0.5110.0341.503−0.033−1.023
ASSTOV0.0080.5120.0841.458−0.004−0.049
SIZE−0.032−3.025 ***0.0391.002−0.155−2.797 ***
PPE0.0821.715 *−0.294−1.700 *0.1230.494
AGE0.0221.763 *−0.111−2.487 **0.0911.410
Fixed EffectIncludedIncludedIncluded
Fvalue3.568 ***1.975 **1.251
Adj_Rsq0.222 0.098 0.027
N_obs127 127 127
Panel D. Regression Results Using Stability Indicators as Dependent Variables
VariableDep = LIABDep = DEBTDep = COD
βt-Valueβt-Valueβt-Value
Intercept0.3740.081−1.141−0.405−0.012−0.121
FIN49.4402.612 **22.8951.971 *−0.341−0.866
CUS71.6482.856 ***43.7032.838 ***−0.569−1.089
INP−34.797−0.983−26.028−1.1981.0561.434
LNG−30.486−0.856−13.070−0.598−0.755−1.018
CSR0.9670.041−3.038−0.2090.0480.098
ENV6.4930.17122.2810.958−1.048−1.328
ROA−11.861−4.303 ***−6.118−3.617 ***−0.023−0.400
CUR−0.027−1.072−0.014−0.918−0.001−1.332
ASSGRW−0.728−0.5110.2190.250−0.032−1.076
ASSTOV0.5822.465 **−0.062−0.4280.0091.858 *
SIZE0.0270.1630.0460.4480.0020.511
PPE1.1801.6311.1992.699 ***−0.002−0.101
AGE−0.120−0.6350.0550.475−0.002−0.385
Fixed EffectIncludedIncludedIncluded
Fvalue3.759 ***3.048 ***1.532
Adj_Rsq0.235 0.185 0.056
N_obs127 127 127
Panel E. Regression Results Using Activity Indicators as Dependent Variables
VariableDep = ASSTOVDep = ICTOVDep = TANTOV
βt-Valueβt-Valueβt-Value
Intercept1.0440.584−61.027−0.468994.2093.590 ***
FIN−6.904−0.911692.1681.254−1374.822−1.172
CUS11.9951.191504.6710.6882266.8191.454
INP26.3561.933 *−160.751−0.1622690.2331.274
LNG−5.807−0.417−1016.446−1.002−4632.724−2.148 **
CSR8.3660.909−181.882−0.2711832.0261.286
ENV−28.370−1.953 *1067.1161.008−4547.355−2.021 **
ROA2.6712.358 **24.4820.297−230.221−1.313
CUR−0.027−2.851 ***0.2270.331−1.205−0.828
LEV0.2850.51256.6361.398−211.924−2.461 **
ASSGRW0.0892.465 **2.8721.0995.5761.003
SIZE0.0030.0493.5120.735−27.922−2.751 ***
PPE−0.344−1.213−25.565−1.237−55.280−1.258
AGE−0.137−1.878 *−11.379−2.149 **−42.519−3.778 ***
Fixed EffectIncludedIncludedIncluded
Fvalue3.037 ***0.8484.415 ***
Adj_Rsq0.185 -0.017 0.275
N_obs127 127 127
Panel F. Regression Results Using Value Indicators as Dependent Variables
VariableDep = PERDep = PBRDep = TQ
βt-Valueβt-Valueβt-Value
Intercept0.0740.001−4.975−0.9661.1270.414
FIN−224.787−0.7610.2870.0210.9610.136
CUS−92.020−0.25230.3241.6206.8930.696
INP−286.696−0.582−40.111−1.628 *−23.041−1.769 *
LNG−380.267−0.74730.6201.2203.3600.253
CSR194.0370.582−20.595−1.189−2.302−0.251
ENV1015.2981.791 *77.4972.732 ***44.3322.955 ***
ROA−168.145−3.831 ***6.3182.931 ***6.5045.706 ***
CUR0.4191.3350.0784.648 ***0.0394.425 ***
LEV32.4591.4361.3941.3370.0500.090
ASSGRW−2.114−0.8080.0921.4510.0280.833
ASSTOV−1.926−0.5290.1820.9790.0100.098
SIZE1.6550.3920.2371.2820.0100.098
PPE−17.678−1.537−1.003−1.719 *−0.487−1.577
AGE−3.625−1.304−0.326−2.267 **−0.160−2.107 **
Fixed EffectIncludedIncludedIncluded
Fvalue2.610 ***5.087 ***6.998 ***
Adj_Rsq0.230 0.375 0.469
N_obs82 103 103
Note: ***, **, and * denote significance levels at 1, 5, and 10%, respectively.

