A Process Oriented MCDM Approach to Construct a Circular Economy Composite Index

 ,
,  ,
,  and
and 
Abstract
:1. Introduction
2. Measuring Circular Economy at the National Level
2.1. Why Measuring Circular Economy at the National Level Is Important
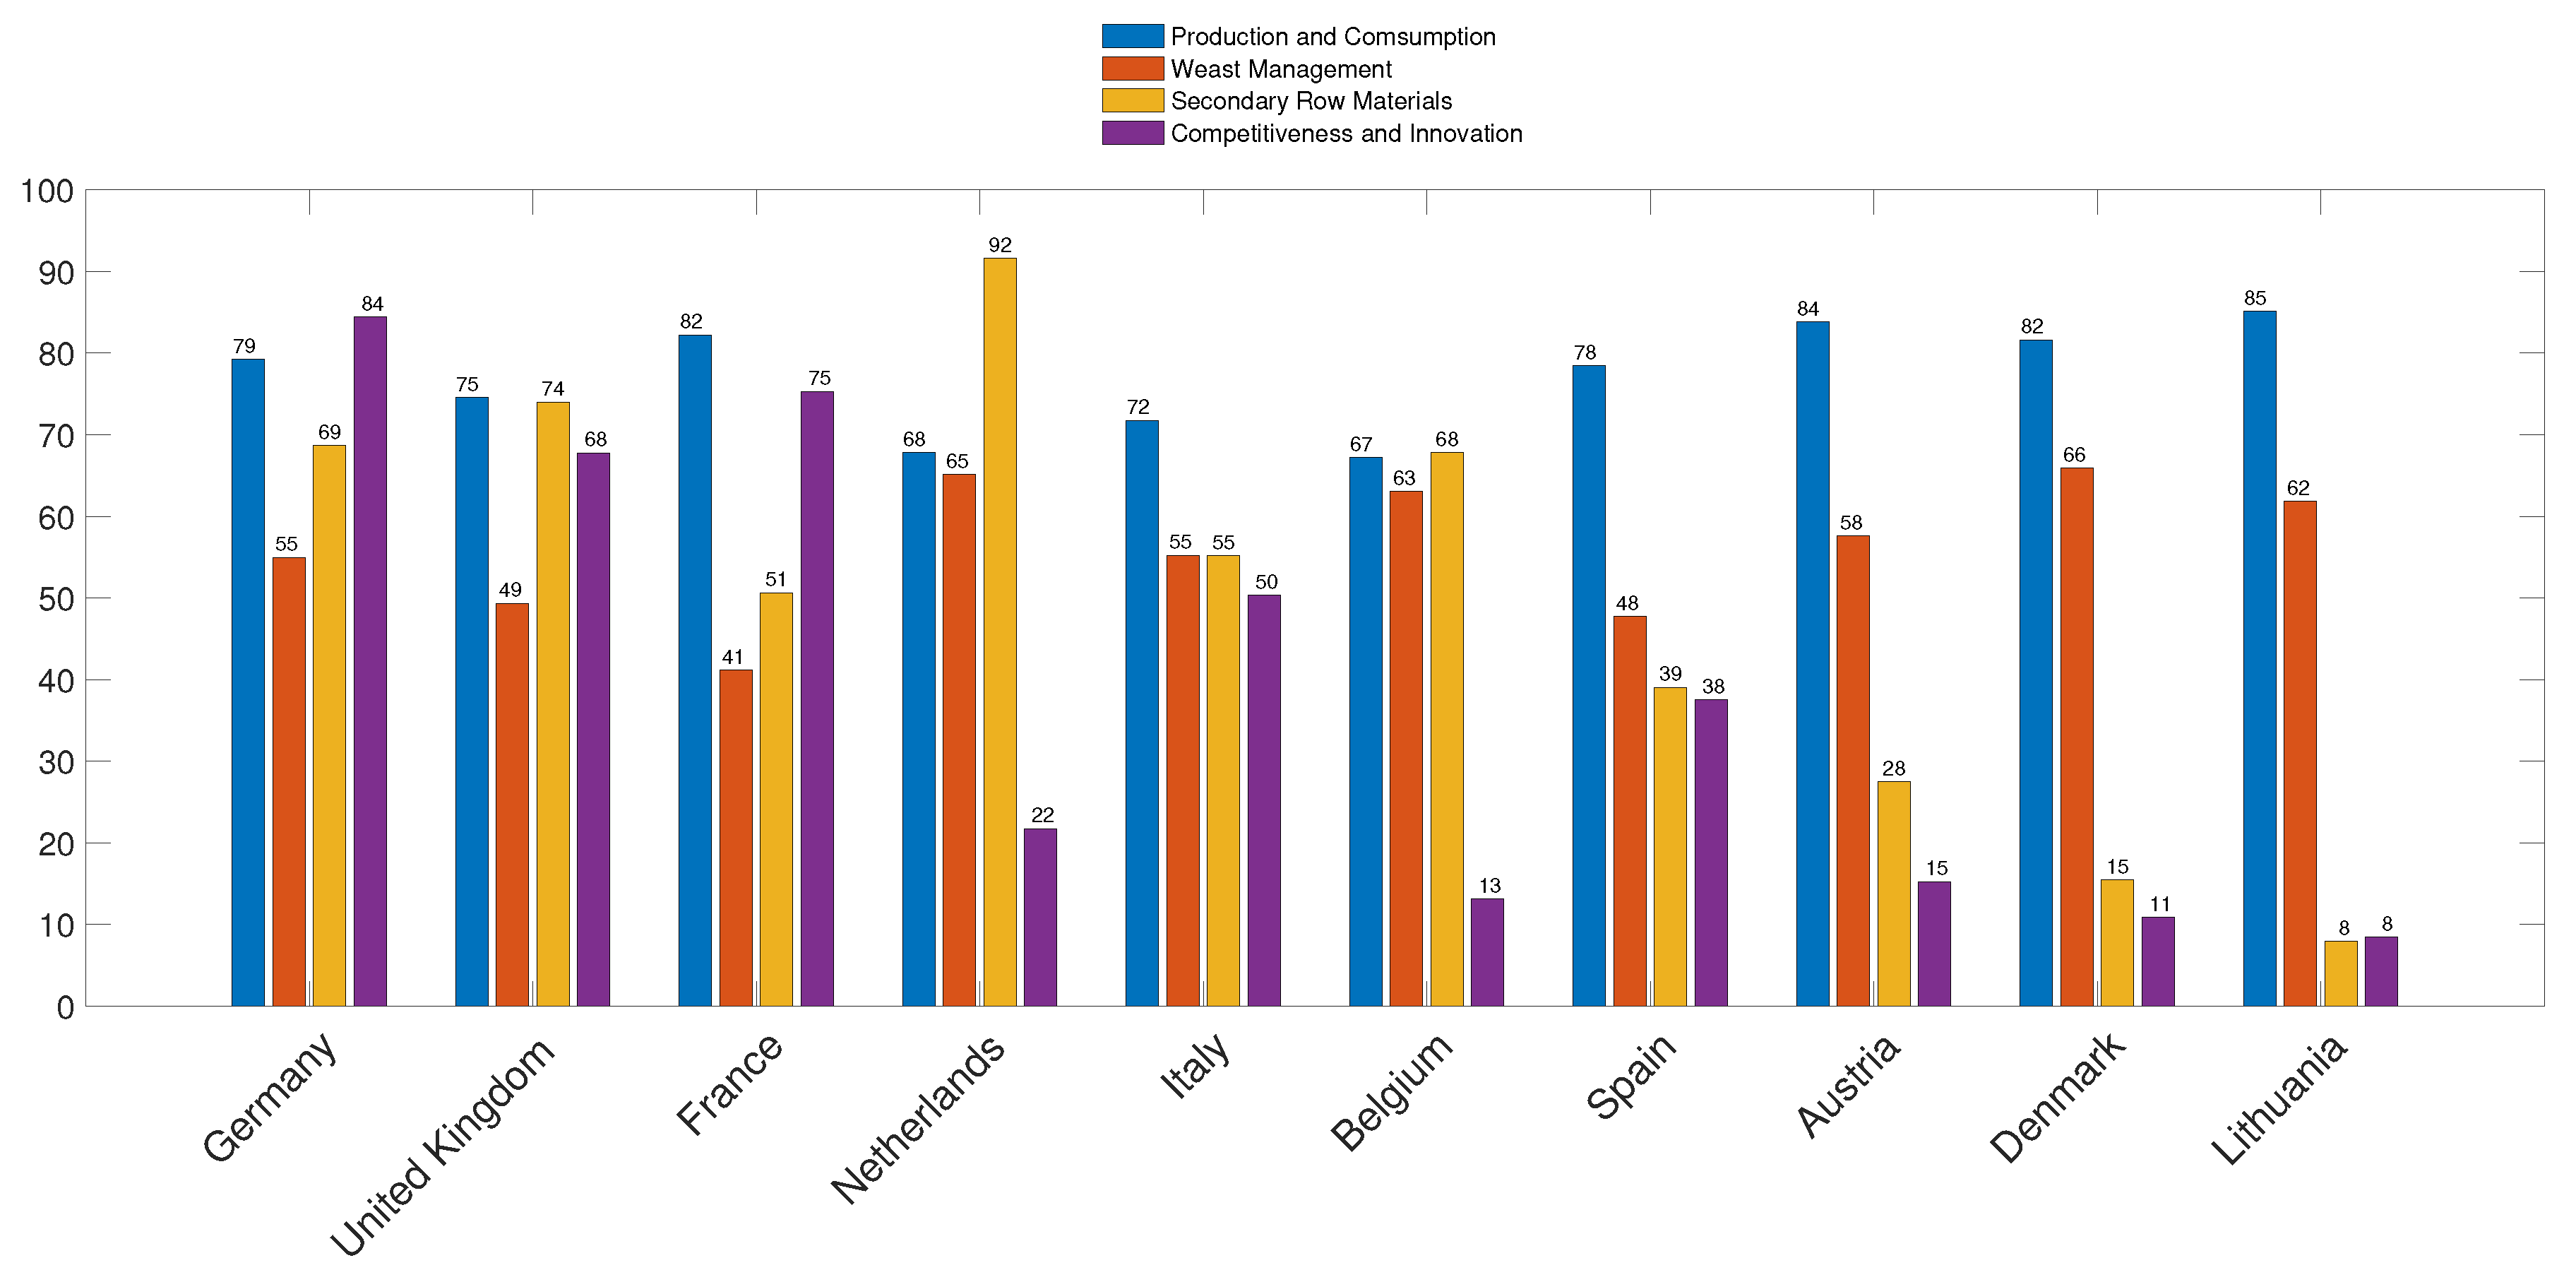
- Production and consumption. In a circular economy, more sustainable models of production in all sectors as well as a responsible consumption are needed. In the long term, this may contribute to a higher self-sufficiency of selected raw materials used in production processes. Statistical indicators related to the generation of different types of waste are used to better estimate the impact of production and consumption in the EU.
- Waste management. The action plan aims to increase the share of waste, which is recycled and returned into the economic cycle. The indicators and sub-indicators included in this dimension are the recycling rates to different products.
- Secondary raw material. In a circular economy, it is needed to use recycled materials instead of using newly extracted natural resources. Statistical indicators such as material use rates and trade of recyclable raw materials can help to assess the performance of this dimension.
- Competitiveness and innovation. When promoting a circular economy new jobs are created to contribute to a sustainable growth. Statistical indicators such gross investment in tangible goods, persons employed and value added are considered.
2.2. Critical Issues When Developing a CE Composite Indicator
- Develop a theoretical framework, thus providing the basis for the selection of single indicators and the structure in sub-groups or dimensions.
- Select the data in order to check the quality of the indicators and discuss their strengths and weaknesses.
- Imputing the missing data, providing a measure of reliability of each imputed value.
- Conduct a multivariate analysis in order to describe the statistical structure of the data set.
- Apply a normalization procedure for comparability purposes.
- Define the weighting and aggregation methodology according to the underlying theoretical framework, considering correlation and compensability issues among indicators.
- Assess its robustness and conduct a sensitivity analysis.
- Get back to the real data and reveal the main drivers for a good or bad performance.
- Find links to other published indicators to correlate the composite indicator with other relevant measures.
- Display the information through visualization tools that allows for presenting the results in a clear and accurate way.
- Equal weighting is used when all the indicators are considered equally important and due to its simplicity appears in several sustainability indices such as the Human Development Index [40] and the Living Planet Index [41]. However, regardless of the benefits, its use has some drawbacks including validity and transparency.
- Statistic based weights derives the importance of the criteria according to the structure of the data. In this group, there are some multivariate statistical approaches such as the Principal Component Analysis (PCA) or the Factor Analysis (FA) in which the weights reflect the contribution of each indicator to the overall composite indicator. The Environmental Sustainability Index [42] uses weights derived from PCA to assess the information content of 15 sustainability sub-indices for agricultural systems. The main disadvantage of these methods is that it only works if the indicators are correlated [20]. In addition, included in this group is the benefit of the doubt approach (BOD) in which the weights are selected to maximize the index for each unit. For example, the Meta-index of Sustainable Development [43] applies the BOD for monitoring countries’ overall performance in sustainable development.
- Participatory methodologies such as the Budget Allocation (BAL) [22], Analytical Hierarchy Process (AHP) [44], or Cojoint Analysis (CA) rely on expert or public opinion for indicators’ weighting. For example, the Eco-Indicator 99 [45] applies the BAL for life cycle impact assessment. AHP methodology has been used to determine the weights [46] when developing a composite sustainability performance index for steel industry. In [47], the priorities of inhabitants are used as input for hierarchical conjoint analysis to improve the quality of life.
- Additive aggregation (full compensability). The resulting composite indicator is the weighted arithmetic mean of normalized indicators. Although widely used, this aggregation entails restrictions on the nature of indicators such as preferential independence since it implies that the trade-off ratio between two indicators is independent of the values of the remaining indicators. By using the additive aggregation methodology, the Environmental Performance Index (EPI) ranks countries on 24 performance indicators covering environmental health and ecosystem vitality [48].
- Geometric aggregation (limited compensability). A lower compensability perspective relies on geometric-mean based methods. In this case, mutually preferential independence condition of indicators is required like in the previous case. This procedure is widely adopted for biodiversity composite indicators such as the Living Planet Index [49] or the geometric mean of relative abundance indices [50].
- Non compensatory multi-criteria approaches. As multidimensionality is intrinsic to the composite indicator concept, many works have proposed the use of MCDM techniques [51]. Some authors also claim that MCDM approaches are suitable to deal with environmental and management problems [13,14,52]. According to [39], the choice of non-compensatory multi-criteria approaches allows for finding a compromise solution among conflicting variables including non-compensability constraints. Furthermore, in recent years, there has been a sharp rise in the number of works aggregating sustainability criteria by using some MCDM tools [16]. In particular, a framework based on a multi-objective evaluation of Circular Economy development in China is presented in [53].
3. Circular Economy Index Construction
- Step 1.
- Taking into account the theoretical framework of the circular economy indicators, construct a decision matrix representing the data set (; ) where n denotes the number of countries and m the number of scoreboard indicators.
- Step 2.
- Compute the normalized () decision matrix for comparability purposes in which the normalized value is obtained by:
- Step 3.
- Define the weight system and calculate the weighted normalized decision matrix in which the value is:where ∈ are the weights associated with each sub-criterion j and obtained according to the selected weighting system. Take into account that .
- Step 4.
- Determine the values of ideal and negative-ideal solution:where is associated with benefit criteria and is associated with cost criteria.In addition, compute the separation measures to the positive ideal and negative ideal as follows:
- Step 5.
- Define the aggregation methodology for the separation measures. We must have in mind that the aggregation methodology can have profound implications on the overall ranking. To allow for maximum flexibility in aggregating the separation measures of the individual indicators for each dimension to the ideal and negative ideal, we use the standard constant-elasticity of substitution (CES) function [24,25] to generate the aggregated distances for the country i:where and are the separation measures to the positive and negative ideals under criteria j for country i and dimension k, respectively.denotes the number of indicators for criteria in the dimension. When the aggregation is made without considering dimensions, then is equal to m, namely, the number of scoreboard indicators.describes the substitutability across criteria, which ranges from .The elasticity of substitution across components of the CE index is defined as:with andThree special cases of CES function are proposed depending on the type of compensability allowed. A weak CE composite indicator reflects a weak sustainability perspective in which the criteria are perfect substitutes and, in this case, the CES assumes the form of the arithmetic mean (see Definition 1). On the other hand, a strong sustainability perspective occurs when the CE indicators are not substitutable, and then, when aggregating the distances in the Strong CE indicator, we opt for looking at the CES function reflecting the maximum distances to the reference levels (see Definition 2). Finally, an intermediate case of substitutability is considered reflecting the limited substitution among criteria and then the CES function becomes the geometric mean of the distances to the reference levels (see Definition 3).Definition 1.Weak distance. If the decision maker considers that the criteria are perfect substitutes, then and . In this case, the aggregation function for the separation distances with equal weights assumes the form of the arithmetic mean:Definition 2.Strong distance. When the criteria are defined as not substitutable, then and . In this case, the aggregation function for the separation distances turns into a Leontief production function and the separation measure is determined by the maximun distance to the ideal and to the negative ideal:Definition 3.Limited distance. For an intermediate case of substitutability, the aggregation function for the separation distances is given by the Cobb–Douglas production function with and . Then, the and the becomes the geometric mean of the criteria separation measures:
- Step 6.
- Obtain the Weak Circular Economy (WCEI), the Strong Circular Economy (SCEI), and the Limited (LCEI) indices by computing the relative closeness to the ideal solution of the corresponding distances. Taking into account all the scoreboard indicators, without considering the sub-dimensions, the three types of CE indicators are computed as:In this final step, we rescale the data into a 0–100 score. This process puts all indicators on a common scale that can be compared. Finally, we rank the countries according to their relative proximity to the desirable country in descending order; thus, the higher the priority, the higher the circular economy performance.
4. Measuring Circular Economy EU Countries Performances
5. Conclusions
Author Contributions
Funding
Conflicts of Interest
Abbreviations
| EU | European Union |
| CE | Circular Economy |
| CES | Constant Elasticity of Substitution |
| MCDM | Multiple Criteria Decision Making |
| TOPSIS | Technique for Order Preferences by Similarity to Ideal Solutions |
| CEI | Circular Economy Index |
| WCEI | Weak Circular Economy Index |
| SCEI | Strong Circular Economy Index |
| LCEI | Limited Circular Economy Index |
References
- Genovese, A.; Acquaye, A.A.; Figueroa, A.; Koh, S.L. Sustainable supply chain management and the transition towards a circular economy: Evidence and some applications. Omega 2017, 66, 344–357. [Google Scholar] [CrossRef]
- Di Maio, F.; Rem, P.C. A robust indicator for promoting circular economy through recycling. J. Environ. Prot. 2015, 6, 1095–1104. [Google Scholar] [CrossRef] [Green Version]
- Geng, Y.; Sarkis, J.; Ulgiati, S.; Zhang, P. Measuring China’s circular economy. Science 2013, 339, 1526–1527. [Google Scholar] [CrossRef] [PubMed]
- Geng, Y.; Fu, J.; Sarkis, J.; Xue, B. Towards a national circular economy indicator system in China: An evaluation and critical analysis. J. Clean. Prod. 2012, 23, 216–224. [Google Scholar] [CrossRef]
- Elia, V.; Gnoni, M.G.; Tornese, F. Measuring circular economy strategies through index methods: A critical analysis. J. Clean. Prod. 2017, 142, 2741–2751. [Google Scholar] [CrossRef]
- Hoekstra, A.Y.; Hung, P.Q. Virtual water trade. Quantif. Virtual Water Flows Nations Relat. Int. Crop Trade Value water Res. Rep. Ser. 2002, 11, 166. [Google Scholar]
- Spangenberg, J.H.; Femia, A.; Hinterberger, F.; Schütz, H.; Bringezu, S.; Liedtke, C.; Moll, S.; Schmidt-Bleek, F. Material Flow-Based Indicators in Environmental Reporting; Number 14; European Environment Agency: Copenhagen, Danmark, 1999. [Google Scholar]
- Huijbregts, M.A.; Rombouts, L.J.; Hellweg, S.; Frischknecht, R.; Hendriks, A.J.; van de Meent, D.; Ragas, A.M.; Reijnders, L.; Struijs, J. Is cumulative fossil energy demand a useful indicator for the environmental performance of products? Environ. Sci. Technol. 2006, 40, 641–648. [Google Scholar] [CrossRef] [Green Version]
- Brown, M.T.; Ulgiati, S. Energy quality, emergy, and transformity: HT Odum’s contributions to quantifying and understanding systems. Ecol. Model. 2004, 178, 201–213. [Google Scholar] [CrossRef]
- Rees, W.E. Ecological footprints and appropriated carrying capacity: What urban economics leaves out. Environ. Urban. 1992, 4, 121–130. [Google Scholar] [CrossRef]
- Wiedmann, T.; Barrett, J. A review of the ecological footprint indicator—Perceptions and methods. Sustainability 2010, 2, 1645–1693. [Google Scholar] [CrossRef] [Green Version]
- Narodoslawsky, M.; Krotscheck, C. The sustainable process index (SPI): Evaluating processes according to environmental compatibility. J. Hazard. Mater. 1995, 41, 383–397. [Google Scholar] [CrossRef]
- Munda, G. “Measuring sustainability”: A multi-criterion framework. Environ. Dev. Sustain. 2005, 7, 117–134. [Google Scholar] [CrossRef]
- Wu, J.; Wu, T. Sustainability indicators and indices: An overview. In Handbook of Sustainability Management; World Scientific: Singapore, 2012; pp. 65–86. [Google Scholar]
- Janeiro, L.; Patel, M.K. Choosing sustainable technologies. Implications of the underlying sustainability paradigm in the decision-making process. J. Clean. Prod. 2015, 105, 438–446. [Google Scholar] [CrossRef]
- Diaz-Balteiro, L.; González-Pachón, J.; Romero, C. Measuring systems sustainability with multi-criteria methods: A critical review. Eur. J. Oper. Res. 2017, 258, 607–616. [Google Scholar] [CrossRef]
- Yoon, K.; Hwang, C.L. TOPSIS (Technique for Order Preference by Similarity to Ideal Solution)–A Multiple Attribute Decision Making, W: Multiple Attribute Decision Making–Methods and Applications, a State-of- the-at Survey; Springer: Berlin, Germany, 1981. [Google Scholar]
- Triantaphyllou, E. Multi-criteria decision-making methods. In Multi-Criteria Decision Making Methods: A Comparative Study; Springer: Boston, MA, USA, 2000; pp. 5–21. [Google Scholar]
- Bandura, R. A Survey of Composite Indices Measuring Country Performance: 2008 Update; UNDP/ODS Working Paper; United Nations Development Programme, Office of Development Studies: New York, NY, USA, 2008. [Google Scholar]
- Joint Research Centre-European Commission. Handbook on Constructing Composite Indicators: Methodology And User Guide; OECD Publishing: Paris, France, 2008. [Google Scholar]
- Mazziotta, M.; Pareto, A. Methods for constructing composite indices: One for all or all for one. Rivista Italiana di Economia Demografia e Statistica 2013, 67, 67–80. [Google Scholar]
- Saisana, M.; Tarantola, S. State-of-the-Art Report on Current Methodologies and Practices for Composite Indicator Development; Joint Research Centre-European Commission: Ispra, Italy, 2002. [Google Scholar]
- Wilson, M.C.; Wu, J. The problems of weak sustainability and associated indicators. Int. J. Sustain. Dev. World Ecol. 2017, 24, 44–51. [Google Scholar] [CrossRef]
- Arrow, K.J.; Chenery, H.B.; Minhas, B.S.; Solow, R.M. Capital-labor substitution and economic efficiency. Rev. Econ. Stat. 1961, 43, 225–250. [Google Scholar] [CrossRef]
- Blackorby, C.; Donaldson, D.; Weymark, J.A. A normative approach to industrial-performance evaluation and concentration indices. Eur. Econ. Rev. 1982, 19, 89–121. [Google Scholar] [CrossRef]
- Rennings, K.; Ludwig Brockmann, K.; Bergmann, H. Voluntary agreements in environmental protection: Experiences in Germany and future perspectives. Bus. Strategy Environ. 1997, 6, 245–263. [Google Scholar] [CrossRef]
- Mathews, J.A.; Tan, H. Circular economy: Lessons from China. Nat. News 2016, 531, 440. [Google Scholar] [CrossRef] [Green Version]
- European Commission (EC). Measuring Progress Towards Circular Economy in the European Union—Key Indicators for a Monitoring Framework; European Commission: Strasbourg, France, 2018. [Google Scholar]
- Cherchye, L.; Moesen, W.; Rogge, N.; Van Puyenbroeck, T.; Saisana, M.; Saltelli, A.; Liska, R.; Tarantola, S. Creating composite indicators with DEA and robustness analysis: The case of the Technology Achievement Index. J. Oper. Res. Soc. 2008, 59, 239–251. [Google Scholar] [CrossRef]
- Giannetti, B.; Bonilla, S.; Silva, C.; Almeida, C. The reliability of experts’ opinions in constructing a composite environmental index: The case of ESI 2005. J. Environ. Manag. 2009, 90, 2448–2459. [Google Scholar] [CrossRef]
- Makkonen, T.; van der Have, R.P. Benchmarking regional innovative performance: Composite measures and direct innovation counts. Scientometrics 2013, 94, 247–262. [Google Scholar] [CrossRef] [Green Version]
- Mazziotta, M.; Pareto, A. On a generalized non-compensatory composite index for measuring socio-economic phenomena. Soc. Indic. Res. 2016, 127, 983–1003. [Google Scholar] [CrossRef]
- Greco, M.; Mazziotta, M.; Pareto, A. A composite index to measure the Italian “Enological Vocation”. Agric. Agric. Sci. Procedia 2016, 8, 691–697. [Google Scholar] [CrossRef]
- Greco, S.; Ishizaka, A.; Tasiou, M.; Torrisi, G. On the methodological framework of composite indices: A review of the issues of weighting, aggregation, and robustness. Soc. Indic. Res. 2019, 141, 61–94. [Google Scholar] [CrossRef] [Green Version]
- Attardi, R.; Cerreta, M.; Sannicandro, V.; Torre, C.M. Non-compensatory composite indicators for the evaluation of urban planning policy: The Land-Use Policy Efficiency Index (LUPEI). Eur. J. Oper. Res. 2018, 264, 491–507. [Google Scholar] [CrossRef]
- Angilella, S.; Catalfo, P.; Corrente, S.; Giarlotta, G.; Greco, S.; Rizzo, M. Robust sustainable development assessment with composite indices aggregating interacting dimensions: the hierarchical-SMAA-Choquet integral approach. Knowl. Based Syst. 2018, 158, 136–153. [Google Scholar] [CrossRef] [Green Version]
- Greco, S.; Ishizaka, A.; Tasiou, M.; Torrisi, G. Sigma-Mu efficiency analysis: A methodology for evaluating units through composite indicators. Eur. J. Oper. Res. 2019, 278, 942–960. [Google Scholar] [CrossRef]
- Ruiz, F.; El Gibari, S.; Cabello, J.M.; Gómez, T. MRP-WSCI: Multiple reference point based weak and strong composite indicators. Omega 2019. [Google Scholar] [CrossRef]
- Nardo, M.; Saisana, M.; Saltelli, A.; Tarantola, S. Tools for Composite Indicators Building; European Comission: Ispra, Italy, 2005; Volume 15, pp. 19–20. [Google Scholar]
- UNDP. Human Development Report 1990; Oxford University Press: New York, NY, USA, 1990. [Google Scholar]
- World Wildlife Fund (WWF). Living Planet Report; WWF: Gland, Switzerland, 1998. [Google Scholar]
- Sands, G.R.; Podmore, T.H. A generalized environmental sustainability index for agricultural systems. Agric. Ecosyst. Environ. 2000, 79, 29–41. [Google Scholar] [CrossRef]
- Cherchye, L.; Kuosmanen, T. Benchmarking Sustainable Development: A Synthetic Meta-Index Approach; Technical Report, Research Paper; UNU-WIDER, United Nations University (UNU): Helsinki, Finland, 2004. [Google Scholar]
- Saaty, T.L. A scaling method for priorities in hierarchical structures. J. Math. Psychol. 1977, 15, 234–281. [Google Scholar] [CrossRef]
- Goedkoop, M.J. The Eco-Indicator 99 a Damage Oriented Method for Life Cycle Impact Assessment Methodology Report; Pre Concultants: Amersfoort, Netherlands, 1999. [Google Scholar]
- Singh, R.K.; Murty, H.; Gupta, S.; Dikshit, A. Development of composite sustainability performance index for steel industry. Ecol. Indic. 2007, 7, 565–588. [Google Scholar] [CrossRef]
- Ülengin, B.; Ülengin, F.; Güvenç, Ü. A multidimensional approach to urban quality of life: The case of Istanbul. Eur. J. Oper. Res. 2001, 130, 361–374. [Google Scholar] [CrossRef]
- Esty, D.C.; Levy, M.A.; Srebotnjak, T.; de Sherbinin, A.; Kim, C.H.; Anderson, B. Pilot 2006 Environmental Performance Index; Yale Center for Environmental Law & Policy: New Haven, CT, USA, 2006; p. 356. [Google Scholar]
- Loh, J.; Wackernagel, M. Living Planet Report 2004; WWF International: Gland, Switzerland, 2004. [Google Scholar]
- Buckland, S.T.; Studeny, A.C.; Magurran, A.E.; Illian, J.B.; Newson, S.E. The geometric mean of relative abundance indices: A biodiversity measure with a difference. Ecosphere 2011, 2, 1–15. [Google Scholar] [CrossRef] [Green Version]
- El Gibari, S.; Gómez, T.; Ruiz, F. Building composite indicators using multicriteria methods: A review. J. Bus. Econ. 2018, 89, 1–24. [Google Scholar] [CrossRef]
- Gan, X.; Fernandez, I.C.; Guo, J.; Wilson, M.; Zhao, Y.; Zhou, B.; Wu, J. When to use what: Methods for weighting and aggregating sustainability indicators. Ecol. Indic. 2017, 81, 491–502. [Google Scholar] [CrossRef]
- Li, H.; Bao, W.; Xiu, C.; Zhang, Y.; Xu, H. Energy conservation and circular economy in China’s process industries. Energy 2010, 35, 4273–4281. [Google Scholar] [CrossRef]
- European Commission. Report from the Commission to the European Parliament, The Council, the European Economic and Social Committee and the Committee of The Regions on the Implementation of The Circular Economy Action Plan; European Commissión: Brussels, Belgium, 2019; Available online: https://ec.europa.eu/environment/circular-economy/index_en.htm (accessed on 10 November 2019).


| Indicator | Data Source | Reference Area | Coverage-Time | |
|---|---|---|---|---|
| Production and Consumption | ||||
| 1 | EU self-sufficient for raw material | European Commission | Only EU aggregate | |
| 2 | Green Public Procurement | |||
| 3 | Waste generation | |||
| 3a | Generation of municipal waste per capita (Kg per capita) | European Statistical System | All EU Member States | >10 years (2000) |
| 3b | Generation of waste excluding major mineral wastes per GDP unit (Kg per thousand euro, chain linked volumes (2010)) | European Statistical System | All EU Member States | >10 years (2004) |
| 3c | Generation of waste excluding major mineral wastes per domestic material consumption (percentage) | European Statistical System | All EU Member States | >10 years (2004) |
| 4 | Food waste (million tons) | |||
| Waste Management | ||||
| 5 | Recycling rates | |||
| 5a | Recycling rate of municipal waste (percentage) | European Statistical System | All EU Member States | >10 years (2000) |
| 5b | Recycling rate of all waste excluding major mineral waste (percentage) | European Statistical System | All EU Member States | 5 to 10 (2010) |
| 6 | Recycling/recovery for specific waste streams | |||
| 6a | Recycling rate of overall packaging (percentage) | Ministries of Environment | All EU Member States | >10 years (2000) |
| 6b | Recycling rate of plastic packaging (percentage) | Ministries of Environment | All EU Member States | >10 years (2000) |
| 6c | Recycling rate of wooden packaging (percentage) | Ministries of Environment | All EU Member States | >10 years (2000) |
| 6d | Recycling rate of e-waste (percentage) | European Statistical System | All EU Member States | 5 to 10 (2010) |
| 6e | Recycling of biowaste (Kg per capita) | European Statistical System | All EU Member States | >10 years (2000) |
| 6f | Recovery rate of construction and demolition waste (percentage) | European Statistical System | All EU Member States | 5 to 10 (2010) |
| Secondary Raw Materials | ||||
| 7 | Contribution of recycled material to raw materials demand | |||
| 7a | End-of-life recycling input rates (EOL-RIR) (percentage) | European Commission | Only EU aggregate | 2016 |
| 7b | Circular material use rate (percentage) | European Statistical System | All EU Member States | >10 years (2010) |
| 8 | Trade in recyclable raw materials (tonnes) | European Statistical System | All EU Member States | >10 years (2004) |
| Competitiveness and Innovation | ||||
| 9 | Private investments, jobs and gross value added related to CE sectors | |||
| 9a | Gross investments in tangible goods (percentage of GDP at current prices) | European Statistical System | All EU Member States | >10 years (2012) |
| 9b | Persons employed (percentage of total employment) | European Statistical System | All EU Member States | >10 years (2012) |
| 9c | Value added at factor cost (percentage of GDP at current prices) | European Statistical System | All EU Member States | >10 years (2012) |
| 10 | Number of patents related to recycling and secondary raw materials | European Patent Office | All EU Member States | >10 years (2000) |
| Weak | Limited | Strong | ||||||
|---|---|---|---|---|---|---|---|---|
| Rank | Country | Score | Rank | Country | Score | Rank | Country | Score |
| 1 | Germany | 67.04 | 1 | United Kingdom | 64.4 | 1 | Germany | 68.54 |
| 2 | United Kingdom | 61.62 | 2 | Germany | 63.18 | 2 | France | 68.06 |
| 3 | France | 59.74 | 3 | Italy | 61.12 | 3 | United Kingdom | 57.51 |
| 4 | Netherlands | 58.25 | 4 | Belgium | 57.71 | 4 | Spain | 56.88 |
| 5 | Italy | 55.14 | 5 | Netherlands | 56.21 | 5 | Netherlands | 55.32 |
| 6 | Belgium | 51.32 | 6 | Denmark | 55.18 | 6 | Italy | 54.56 |
| 7 | Spain | 48.74 | 7 | Lithuania | 53.77 | 7 | Austria | 53.34 |
| 8 | Austria | 47.49 | 8 | France | 53.09 | 8 | Finland | 53.32 |
| 9 | Denmark | 46.74 | 9 | Spain | 52.27 | 9 | Denmark | 53.3 |
| 10 | Lithuania | 46.33 | 10 | Poland | 50.25 | 10 | Luxembourg | 53.26 |
| 11 | Slovenia | 44.89 | 11 | Austria | 50.05 | 11 | Czechia | 52.03 |
| 12 | Poland | 44.13 | 12 | Czechia | 49.96 | 12 | Ireland | 51.85 |
| 13 | Czechia | 43.79 | 13 | Slovenia | 48.67 | 13 | Poland | 51.63 |
| 14 | Ireland | 43.53 | 14 | Ireland | 46.44 | 14 | Sweden | 51.23 |
| 15 | Luxembourg | 43.28 | 15 | Portugal | 45.69 | 15 | Cyprus | 50.87 |
| 16 | Portugal | 42.95 | 16 | Sweden | 44.17 | 16 | Belgium | 50.65 |
| 17 | Sweden | 42.9 | 17 | Latvia | 38.33 | 17 | Malta | 50.05 |
| 18 | Finland | 36.7 | 18 | Hungary | 38.26 | 18 | Slovenia | 49.93 |
| 19 | Latvia | 36.55 | 19 | Luxembourg | 37.45 | 19 | Portugal | 49.6 |
| 20 | Croatia | 36.31 | 20 | Finland | 34.27 | 20 | Greece | 49.32 |
| 21 | Hungary | 36 | 21 | Cyprus | 34.22 | 21 | Croatia | 49.3 |
| 22 | Slovakia | 35.72 | 22 | Croatia | 33.47 | 22 | Hungary | 49.02 |
| 23 | Bulgaria | 33.66 | 23 | Slovakia | 33.27 | 23 | Slovakia | 48.48 |
| 24 | Romania | 31.59 | 24 | Bulgaria | 33.13 | 24 | Latvia | 48.32 |
| 25 | Cyprus | 30.47 | 25 | Greece | 27.13 | 25 | Lithuania | 48.09 |
| 26 | Greece | 29.52 | 26 | Romania | 23.63 | 26 | Romania | 47.83 |
| 27 | Malta | 25.38 | 27 | Estonia | 22.8 | 27 | Bulgaria | 37.13 |
| 28 | Estonia | 21.27 | 28 | Malta | 17.74 | 28 | Estonia | 27.94 |
© 2020 by the authors. Licensee MDPI, Basel, Switzerland. This article is an open access article distributed under the terms and conditions of the Creative Commons Attribution (CC BY) license (http://creativecommons.org/licenses/by/4.0/).
Share and Cite
Garcia-Bernabeu, A.; Hilario-Caballero, A.; Pla-Santamaria, D.; Salas-Molina, F. A Process Oriented MCDM Approach to Construct a Circular Economy Composite Index. Sustainability 2020, 12, 618. https://0-doi-org.brum.beds.ac.uk/10.3390/su12020618
Garcia-Bernabeu A, Hilario-Caballero A, Pla-Santamaria D, Salas-Molina F. A Process Oriented MCDM Approach to Construct a Circular Economy Composite Index. Sustainability. 2020; 12(2):618. https://0-doi-org.brum.beds.ac.uk/10.3390/su12020618
Chicago/Turabian StyleGarcia-Bernabeu, Ana, Adolfo Hilario-Caballero, David Pla-Santamaria, and Francisco Salas-Molina. 2020. "A Process Oriented MCDM Approach to Construct a Circular Economy Composite Index" Sustainability 12, no. 2: 618. https://0-doi-org.brum.beds.ac.uk/10.3390/su12020618