Evolution of Carbon Shadow Prices in China’s Industrial Sector during 2003–2017: A By-Production Approach


Abstract
:1. Introduction
2. Review of Estimation Methods for Carbon Shadow Price
3. Methodology
3.1. Environmental Production Technology
3.2. Output-Oriented Directional Distance Function
4. Data and Results
4.1. Data
4.2. Empirical Results
5. Conclusions
Author Contributions
Funding
Conflicts of Interest
References
- BP. Statistical Review of World Energy. 2019. Available online: https://www.bp.com/en/global/corporate/energy-economics/statistical-review-of-world-energy.html (accessed on 20 November 2019).
- Teng, X.; Liang, C.; Chiu, Y.H. Energy and emission reduction efficiency of China’s industry sector: A non-radial directional distance function analysis. Carbon Manag. 2019, 10, 333–347. [Google Scholar] [CrossRef]
- Chen, S.Y. Energy consumption, CO2 emission and sustainable development in Chinese industry. Econ. Res. J. 2009, 4, 41–55. (In Chinese) [Google Scholar]
- Song, M.; Fisher, R.; Kwoh, Y. Technological challenges of green innovation and sustainable resource management with large scale data. Technol. Forecast. Soc. Chang. 2019, 144, 361–368. [Google Scholar] [CrossRef]
- Song, M.; Zhu, S.; Wang, J.; Zhao, J. Share green growth: Regional evaluation of green output performance in China. Int. J. Prod. Econ. 2020, 219, 152–163. [Google Scholar] [CrossRef]
- Popov, E.V.; Veretennikova, A.Y.; Kozinskaya, K.M. Formal Institutional Environment Influence on Social Entrepreneurship in Developed Countries. Montenegrin J. Econ. 2019, 14, 45–56. [Google Scholar] [CrossRef]
- Raszkowski, A.; Bartniczak, B. Towards sustainable regional development: Economy, society, environment, good governance based on the example of Polish regions. Transform. Bus. Econ 2018, 17, 225–245. [Google Scholar]
- Coase, R.H. The Problem of Social Cost. J. Law Econ. 1960, 3, 1–44. [Google Scholar] [CrossRef]
- Demsetz, H. Toward a Theory of Property Rights. Am. Econ. Rev. 1967, 57, 347–359. [Google Scholar]
- Mao, X. Environomist: China Carbon Market Research Report 2017; Environomist Ltd.: Beijing, China, 2017. [Google Scholar]
- Yuan, P.; Liang, W.; Cheng, S. The Margin Abatement Costs of CO2 in Chinese Industrial Sectors. In Proceedings of the 2nd International Conference on Advances in Energy Engineering (ICAEE), Bangkok, Thailand, 27–28 December 2011; Zeng, D., Ed.; Energy Procedia: Amsterdam, The Netherlands, 2012. [Google Scholar]
- Xie, H.; Shen, M.; Wei, C. Technical efficiency, shadow price and substitutability of Chinese industrial SO2 emissions: A parametric approach. J. Clean. Prod. 2016, 112, 1386–1394. [Google Scholar] [CrossRef]
- Tang, K.; Gong, C.; Wang, D. Reduction potential, shadow prices, and pollution costs of agricultural pollutants in China. Sci. Total Environ. 2016, 541, 42–50. [Google Scholar] [CrossRef]
- Che, L. Shadow Price Estimation of CO2 in China’s Regional Iron and Steel Industry. In Proceedings of the 8th international conference on applied energy (ICAE2016), Beijing, China, 8–11 October 2016; Yan, J., Sun, F., Chou, S.K., Desideri, U., Li, H., Campana, P., Xiong, R., Eds.; Energy Procedia: Amsterdam, The Netherlands, 2017. [Google Scholar]
- Zeng, S.; Jiang, X.; Su, B.; Nan, X. China’s SO2, shadow prices and environmental technical efficiency at the province level. Int. Rev. Econ. Financ. 2018, 57, 86–102. [Google Scholar] [CrossRef]
- Pittman, R.W. Multilateral productivity comparisons with undesirable outputs. Econ. J. 1983, 93, 883–891. [Google Scholar] [CrossRef]
- Färe, R.; Grosskopf, S.; Lovell, C.K.; Yaisawarng, S. Derivation of shadow prices for undesirable outputs: A distance function approach. Rev. Econ. Stat. 1993, 75, 374–380. [Google Scholar] [CrossRef]
- Turner, J. Measuring the Cost of Pollution Abatement in the Electric Utility Industry: A Production Function Approach. Ph.D. Thesis, University of North Carolina, Chapel Hill, NC, USA, 1994. [Google Scholar]
- Hailu, A.; Veeman, T.S. Environmentally Sensitive Productivity Analysis of the Canadian Pulp and Paper Industry, 1959–1994: An Input Distance Function Approach. J. Environ. Econ. Manag. 2000, 40, 251–274. [Google Scholar] [CrossRef] [Green Version]
- Färe, R.; Grosskopf, S.; Weber, W.L. Shadow Prices of Missouri Public Conservation Land. Public Financ. Rev. 2001, 29, 444–460. [Google Scholar] [CrossRef]
- Färe, R.; Grosskopf, S.; Noh, D.W.; Weber, W. Characteristics of a Polluting Technology: Theory and Practice. J. Econom. 2005, 126, 469–492. [Google Scholar] [CrossRef]
- Murty, M.N.; Kumar, S.; Dhavala, K.K. Measuring Environmental Efficiency of Industry: A Case Study of Thermal Power Generation in India. Environ. Resour. Econ. 2007, 38, 31–50. [Google Scholar] [CrossRef]
- Rødseth, K.L. Capturing the least costly way of reducing pollution: A shadow price approach. Ecol. Econ. 2013, 92, 16–24. [Google Scholar] [CrossRef] [Green Version]
- Song, M.; Wang, S. DEA decomposition of China’s environment efficiency based on search algorithm. Appl. Math. Comput. 2014, 247, 562–572. [Google Scholar]
- Boussemart, J.P.; Leleu, H.; Shen, Z. Environmental growth convergence among Chinese regions. China Econ. Rev. 2015, 34, 1–18. [Google Scholar] [CrossRef]
- Shen, Z.; Boussemart, J.P.; Leleu, H. Aggregate green productivity growth in OECD’s countries. Int. J. Prod. Econ. 2017, 189, 30–39. [Google Scholar] [CrossRef] [Green Version]
- Chen, J.; Gao, M.; Ma, K.; Song, M. Different effects of technological progress on China’s carbon emissions based on sustainable development. Bus. Strategy Environ. 2019, 1–12. [Google Scholar] [CrossRef]
- Färe, R.; Grosskopf, S.; Pasurka, C.A. Accounting for Air Pollution Emissions in Measures of State Manufacturing Productivity Growth. J. Reg. Sci. 2001, 41, 381–409. [Google Scholar] [CrossRef]
- Boyd, G.A.; George, T.; Joseph, P. Plant level productivity, efficiency, and environmental performance of the container glass industry. Environ. Resour. Econ. 2002, 23, 29–43. [Google Scholar] [CrossRef]
- Tu, Z.G. The coordination of industrial growth with environment and resource. Econ. Res. J. 2008, 2, 93–105. (In Chinese) [Google Scholar]
- Wang, Q.; Cui, Q.; Zhou, D.Q.; Wang, S. Marginal abatement costs of carbon dioxide in China: A nonparametric analysis. In Proceedings of the International Conference on Energy, Environment and Development (ICEED), Kuala Lumpur, Malaysia, 8–9 December 2010; Zhang, W., Ed.; Energy Procedia: Amsterdam, The Netherlands, 2011. [Google Scholar]
- Murty, S.; Russell, R.R. On Modeling Pollution Generating Technologies; Discussion Papers Series; Department of Economics, University of California: Riverside, CA, USA, 2002; pp. 1–18. [Google Scholar]
- Coelli, T.; Lauwers, L.; Van Huylenbroeck, G. Environmental efficiency measurement and the materials balance condition. J. Prod. Anal. 2007, 28, 3–12. [Google Scholar] [CrossRef] [Green Version]
- Rødseth, K.L. Environmental efficiency measurement and the materials balance condition reconsidered. Eur. J. Oper. Res. 2016, 250, 342–346. [Google Scholar] [CrossRef] [Green Version]
- Murty, S.; Russell, R.R.; Levkoff, S.B. On modeling pollution-generating technologies. J. Environ. Econ. Manag. 2012, 64, 117–135. [Google Scholar] [CrossRef] [Green Version]
- Shen, Z.; Balezentis, T.; Chen, X.; Valdmanis, V. Green growth and structural change in Chinese agricultural sector during 1997–2014. China Econ. Rev. 2018, 51, 83–96. [Google Scholar] [CrossRef]
- Baležentis, T.; Blancard, S.; Shen, Z.; Štreimikienė, D. Analysis of environmental total factor productivity evolution in European agricultural sector. Decis. Sci. 2019, e12421. [Google Scholar] [CrossRef]
- National Bureau of Statistics of China. China Statistical Yearbook for Regional Economy; China Statistics Press: Beijing, China, 1996–2018. [Google Scholar]
- China Economic Census Database. EPS Database. Available online: http://olap.epsnet.com.cn/index.html (accessed on 20 November 2019).
- National Bureau of Statistics in China. Available online: http://www.stats.gov.cn/ (accessed on 20 November 2019).
- Jiang, Y.; Chen, X.; Valdmanis, V.; Baležentis, T. Evaluating Economic and Environmental Performance of the Chinese Industry Sector. Sustainability 2019, 11, 6804. [Google Scholar] [CrossRef] [Green Version]
- National Bureau of Statistics of China. China Energy Statistical Yearbook; China Statistics Press: Beijing, China, 1996–2018. [Google Scholar]
- Intergovernmental Panel on Climate Change. IPCC Guidelines for National Greenhouse Gas Inventories; Eggleston, H.S., Buendia, L., Miwa, K., Ngara, T., Tanabe, K., Eds.; Prepared by the National Greenhouse Gas Inventories Programme; IGES: Hayama, Japan, 2006. [Google Scholar]
- National Development and Reform Commission. NDRC, PRC Guidelines for Provincial Greenhouse Gas Inventories; Prepared by the Climate Division, National Development and Reform Commission, PRC; NDRC: Beijing, China, 2011. [Google Scholar]
- Pan, Q.; Xuan, L.; Zhang, Y. Analysis of the development of high energy-consuming industries in Hainan. Coop. Econ. Sci. 2008, 358, 15–16. (In Chinese) [Google Scholar]
- Nie, W. Research on China’s Carbon Trading Market Based on the Shadow Price of Carbon Emission. Master’s Thesis, Jinan University, Guangzhou, China, 2018. (In Chinese). [Google Scholar]
- Yi, L.; Li, Z.; Yang, L.; Liu, J.; Packianather, M. Evaluation on the development degree of China’s seven pilot carbon markets. Chin. J. Popul. Resour. Environ. 2018, 16, 28–35. [Google Scholar] [CrossRef]
- Chen, X.; Liu, Y. Estimation of China’s carbon dioxide shadow price and analysis of the difference in transaction price: Output function based on quadratic directional distance. Ecol. Econ. 2018, 34, 14–20, 50. (In Chinese) [Google Scholar]
- Liu, M.; Zhu, L.; Fan, Y. Evaluation of carbon emission performance and estimation of marginal CO2 abatement costs for provinces of China: A non-parametric distance function approach. China Soft Sci. 2011, 3, 106–114. (In Chinese) [Google Scholar]
- Zhou, H.; He, S.; Xing, S. Regional industrial structure and heterogeneity of carbon dioxide shadow prices. J. Hunan Univ. Sci. Technol. 2018, 21, 69–77. (In Chinese) [Google Scholar]
- Zhang, X.; Zhao, Y.; Wang, C. Sectorial difference on carbon emission of energy consumption in Xinjiang based on input-output principle. Resour. Ind. 2017, 19, 85–92. (In Chinese) [Google Scholar]
- Zhou, X.; Fan, L.W.; Zhou, P. Marginal CO2 abatement costs: Findings from alternative shadow price estimates for Shanghai industrial sectors. Energy Policy 2015, 77, 109–117. [Google Scholar] [CrossRef]
- Chen, J.; Xu, C.; Cui, L.; Huang, S.; Song, M. Driving factors of CO2 emissions and inequality characteristics in China: A combined decomposition approach. Energy Econ. 2019, 78, 589–597. [Google Scholar] [CrossRef]
- Jin, P.; Peng, C.; Song, M. Macroeconomic uncertainty, high-level innovation, and urban green development performance in China. China Econ. Rev. 2019, 55, 1–18. [Google Scholar] [CrossRef]


| Variable | Units | Mean | Std.Dev | Min | Max |
|---|---|---|---|---|---|
| Labor | millions | 3.94 | 4.10 | 0.14 | 19.77 |
| Capital | billions US dollars | 249.81 | 290.51 | 3.25 | 1847.53 |
| Energy | million tons of standard coal | 53.83 | 39.84 | 0.784 | 195.25 |
| Value added | billions US dollars | 9.93 | 96.33 | 2.16 | 530.19 |
| CO2 | million tons | 166.87 | 124.00 | 5.44 | 569.38 |
| Region | Province | Mean | Max | Min | Std.Dev. | Trend (%) |
|---|---|---|---|---|---|---|
| Eastern | Beijing | 712 | 1300 | 361 | 306 | 9.40 |
| Fujian | 869 | 1409 | 576 | 275 | 5.60 | |
| Guangdong | 1095 | 1529 | 678 | 283 | 5.87 | |
| Guangxi | 586 | 855 | 425 | 139 | 4.76 | |
| Hainan | 353 | 397 | 313 | 25 | −0.01 | |
| Hebei | 354 | 433 | 283 | 45 | 2.68 | |
| Jiangsu | 793 | 1074 | 499 | 167 | 4.78 | |
| Liaoning | 425 | 551 | 314 | 89 | 1.53 | |
| Shandong | 601 | 810 | 426 | 123 | 4.40 | |
| Shanghai | 766 | 1019 | 544 | 138 | 4.01 | |
| Tianjin | 802 | 1255 | 405 | 284 | 8.12 | |
| Zhejiang | 914 | 1293 | 695 | 206 | 4.63 | |
| Inland | Anhui | 510 | 714 | 350 | 136 | 5.50 |
| Heilongjiang | 704 | 1841 | 306 | 487 | −11.19 | |
| Henan | 640 | 894 | 479 | 134 | 3.10 | |
| Hubei | 564 | 964 | 327 | 231 | 8.60 | |
| Hunan | 620 | 940 | 356 | 232 | 8.39 | |
| Inner Mongo. | 267 | 459 | 178 | 67 | −0.20 | |
| Jiangxi | 737 | 904 | 561 | 121 | 3.00 | |
| Jilin | 442 | 696 | 202 | 179 | 9.71 | |
| Shanxi | 283 | 340 | 233 | 31 | 0.79 | |
| Western | Chongqing | 647 | 1017 | 401 | 215 | 7.27 |
| Gansu | 313 | 358 | 275 | 26 | 1.38 | |
| Guizhou | 214 | 375 | 122 | 92 | 8.94 | |
| Ningxia | 166 | 214 | 134 | 22 | −0.25 | |
| Qinghai | 405 | 547 | 221 | 113 | 5.46 | |
| Shaanxi | 696 | 1675 | 461 | 299 | −0.32 | |
| Sichuan | 723 | 964 | 500 | 176 | 3.57 | |
| Xinjiang | 300 | 367 | 217 | 59 | −4.31 | |
| Yunnan | 369 | 603 | 236 | 135 | 7.27 | |
| China | Average | 562 | 1841 | 122 | 294 | 3.83 |
| Period | 2003–2010 | 2011–2017 | ||
|---|---|---|---|---|
| Trend Coefficient | t-Value | Trend Coefficient | t-Value | |
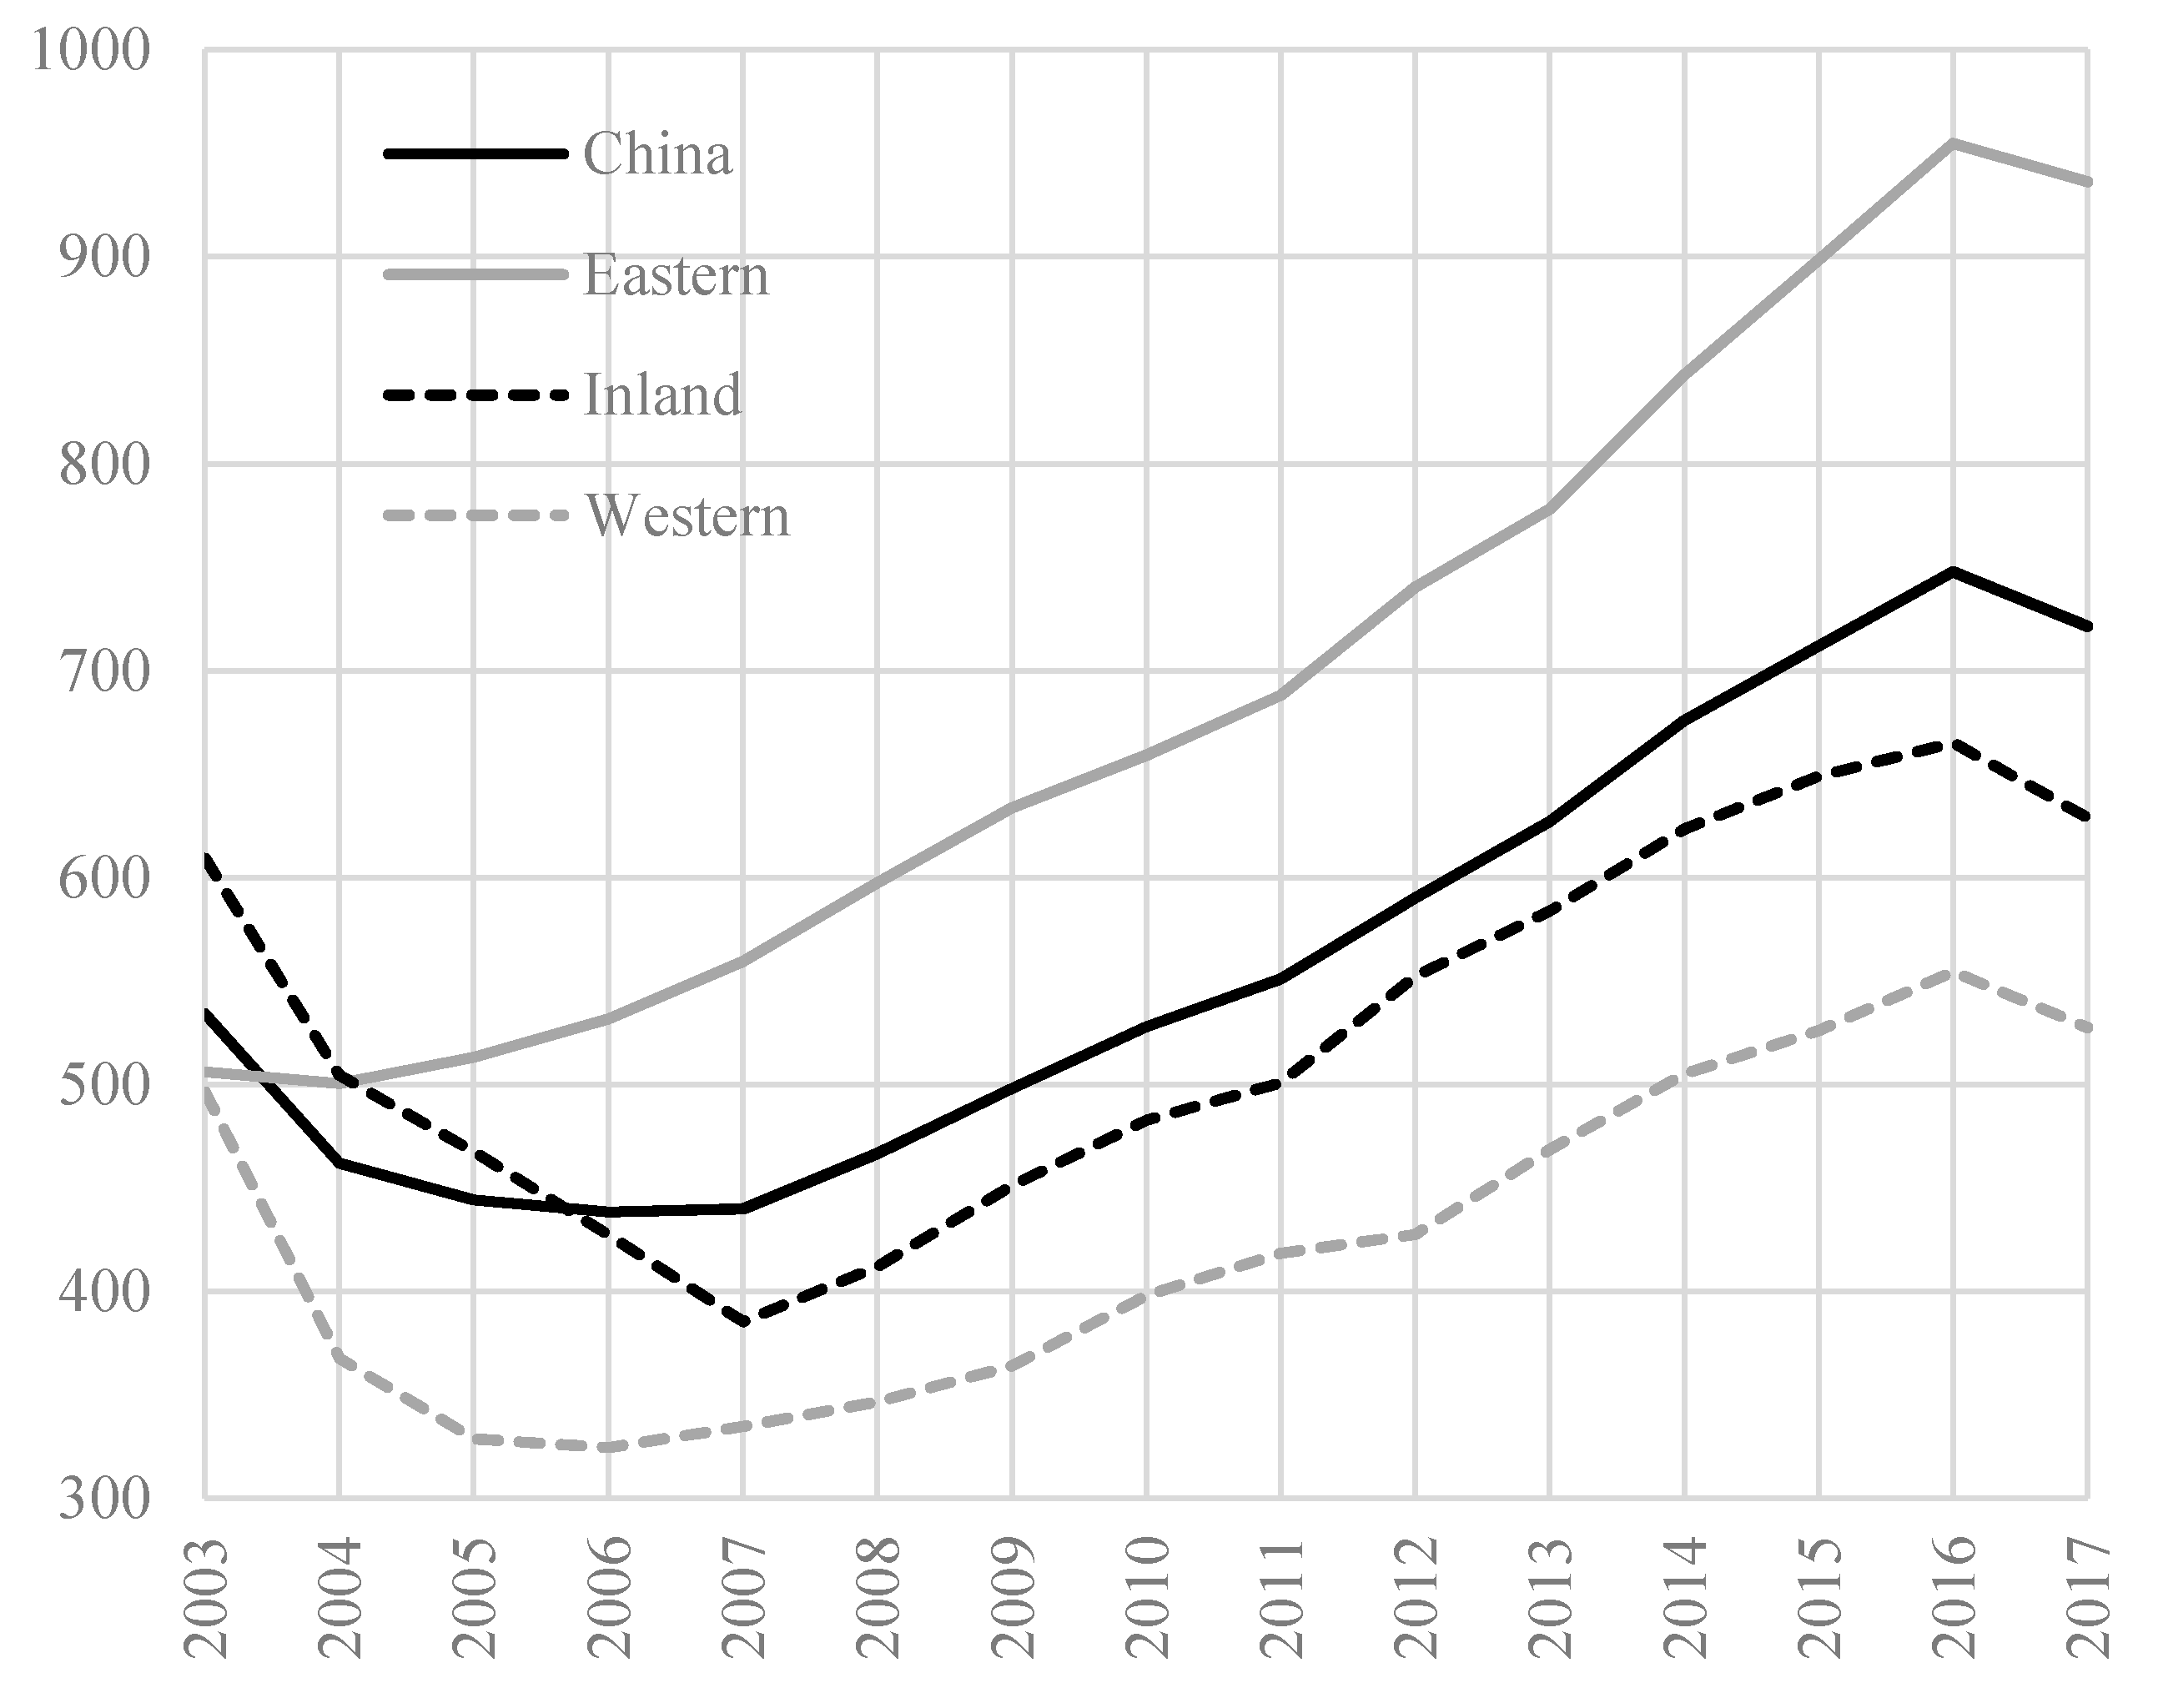
| Eastern | 0.06 | 2.85 | 0.37 | 7.68 |
| Inland | −0.59 | −5.37 | 0.39 | 4.46 |
| Western | −0.48 | −3.18 | 0.13 | 1.53 |
© 2020 by the authors. Licensee MDPI, Basel, Switzerland. This article is an open access article distributed under the terms and conditions of the Creative Commons Attribution (CC BY) license (http://creativecommons.org/licenses/by/4.0/).
Share and Cite
Cheng, W.; Yang, Z.; Pan, X.; Baležentis, T.; Chen, X. Evolution of Carbon Shadow Prices in China’s Industrial Sector during 2003–2017: A By-Production Approach. Sustainability 2020, 12, 722. https://0-doi-org.brum.beds.ac.uk/10.3390/su12020722
Cheng W, Yang Z, Pan X, Baležentis T, Chen X. Evolution of Carbon Shadow Prices in China’s Industrial Sector during 2003–2017: A By-Production Approach. Sustainability. 2020; 12(2):722. https://0-doi-org.brum.beds.ac.uk/10.3390/su12020722
Chicago/Turabian StyleCheng, Wenyin, Zhusong Yang, Xia Pan, Tomas Baležentis, and Xueli Chen. 2020. "Evolution of Carbon Shadow Prices in China’s Industrial Sector during 2003–2017: A By-Production Approach" Sustainability 12, no. 2: 722. https://0-doi-org.brum.beds.ac.uk/10.3390/su12020722