Article

Contaminants of Emerging Concern Removal in an Effluent of Wastewater Treatment Plant under Biological and Continuous Mode Ultrafiltration Treatment

1
Department of Chemical Engineering, Faculty of Science and Technology, University of the Basque Country UPV/EHU, Barrio Sarriena s/n, 48940 Bizkaia, Spain
2
Department of Chemical and Environmental Engineering, Faculty of Engineering in Bilbao, University of the Basque Country UPV/EHU, Plaza Ingeniero Torres Quevedo, 1, 48013 Bilbao, Spain
3
Department of Chemical and Environmental Engineering, Faculty of Engineering Vitoria-Gasteiz, University of the Basque Country UPV/EHU, Nieves Cano 12, 01006 Vitoria-Gasteiz, Araba, Spain
4
Department of Analytical Chemistry, Faculty of Science and Technology, University of the Basque Country UPV/EHU, Barrio Sarriena s/n, 48940 Bizkaia, Spain
*
Author to whom correspondence should be addressed.
Sustainability 2020, 12(2), 725; https://0-doi-org.brum.beds.ac.uk/10.3390/su12020725
Submission received: 26 December 2019 / Revised: 15 January 2020 / Accepted: 16 January 2020 / Published: 19 January 2020
(This article belongs to the Special Issue Removal of Emerging Pollutants from Wastewater Effluent)

Abstract

:
This work presents a case study of a wastewater treatment plant (WWTP), located in Biscay (Spain), in which the removal of high-occurrence contaminants of emerging concern (CEC) was studied. The existing biological treatment in the WWTP was complemented with a continuous ultrafiltration (c-UF) pilot plant, as a tertiary treatment. Thus, the effect on CEC removal of both treatments could be analyzed globally and after each operation. A total of 39 CEC were monitored, including pharmaceutical products, industrial additives, food additives, herbicides and personal care products. For evaluation of the efficiencies, the removal rates of the biological and of the c-UF treatments, including their variability over a day and a week in relation to the ammonium content, were examined in the influent of the WWTP. In the biological treatment, a wide range of different removal rates was obtained due to the different CEC’s biodegradability and concentration. In UF, lower, but more constant removal rates, were achieved. In addition, the reduction of the general toxicity by the UF treatment in terms of the Microtox® toxicity assay was also evaluated. After UF, all of the samples yielded values of TU50 lower than 1, confirming this result the UF effectiveness for toxicity removal.

Graphical Abstract

1. Introduction

The presence of contaminants of emerging concern (CEC) in the effluents of wastewater treatment plants (WWTPs) is a matter of growing concern [1]. Emerging contaminants are chemical compounds that, though they are still unregulated, could be candidates for future regulation, depending on the research results on their potential health effects and occurrence. These include pesticides, pharmaceuticals, drugs of abuse, hormones, other endocrine disruptors, surfactants, surfactant metabolites, perfluorinated compounds, industrial additives and agents, and personal care products [2,3,4].
The occurrence of many CEC is often related to discharges from WWTPs, as a consequence of the widespread use of many of these compounds and the lack of technologies with sufficient removal efficiency, like ozonation of adsorption and their combinations [5]. In fact, the current legislation related to wastewater treatment (Directive 2000/60/EC, Directive 2008/56/EC, Directive 2013/39/EU) does not yet include most of these compounds and, therefore, WWTPs are not specifically designed to eliminate them. As a consequence, it has been found that WWTPs only a partial removal of several CEC, such as carbamazepine or diclofenac (< 25%) [6] continuous discharges give many aquatic environments at sublethal levels that could achieve chronic levels (low μg/L range) of many CEC [7,8]. Moreover, these CEC have even been found in water designated for human consumption [9,10]. Consequently, recent research focused on avoiding the presence of certain CEC in drinking water [3].
In this sense, appropriate water treatment is fundamental for human and environmental health protection. As noted above, the efficiency of the treatments before discharge of water determines its impact on the aquatic ecosystems. Shelley et al. [11] reported that sublethal concentrations of herbicides such as atrazine alter spontaneous swimming activity, feeding behavior, and vulnerability to predation in Oncorhynchus mykiss (rainbow trout) after 96 hours of exposure. De Wever and Verachtert [12] studied the toxic effects of the industrial additive 2-hydroxybenzothiazole on Candida albicans. This CEC produced alterations in the cell membrane, causing vulnerability to attacks. In this context, the general trend in Europe during recent decades has been to raise the percentage of the population connected to WWTPs with tertiary treatments. This is particularly the case for countries such as the Netherlands, Germany, and Austria, where currently more than 90% of urban wastewater receives tertiary treatment [13]. The development of advanced treatments to be used as tertiary treatments is necessary to adequately avoid address the potential hazards.
Currently, membrane filtration technologies and the use of advanced oxidation processes (AOPs) are widely studied for the removal of micropollutants, either in wastewater or in drinking water [14,15,16,17]. Among these treatments, the most relevant processes are: ozonation [18,19], UV/H2O2/Fe3+ photocatalysis [20], electrochemical reactions [20,21], membrane bioreactors [22], nanofiltration or ultrafiltration, reverse osmosis [23,24,25] and adsorption [26]. Technologies based on hydrogen peroxide oxidation, such as Fenton, or others activated by UV [21,27,28] and ultrasound [29], have also proved significant. However, fundamental questions about the technical viability, cost-effectiveness ratio or the sustainability of the industrial implantation of different techniques are still under discussion. [30,31].
The well-known advantages of membrane filtration technologies over other technologies, such as their small process footprint, simplicity, easy maintenance, or high separation efficiency, make them an outstanding option for wastewater treatment, operating either alone or inside a hybrid process [32]. Among the different membrane technologies, that of ultrafiltration (UF) has been chosen in this work because of its characteristics: pore size and operability, with a good adaptation to the effluent treatment of a WWTP.
Within the available UF technologies, the continuous mode (c-UF) has been. The c-UF system used in this work has been patented in Spain under patent number ES201431341A. This technology has the following benefits when compared to current UF systems:
  • Constant product flow even during cleanings
  • Up to 30% cost reduction
  • 50% footprint reduction
  • 5% higher net production
  • Large reduction of occupied space (suitable for modular plants)
The objective of this work is to study the in-situ removal ratio of a panel of 39 emerging compounds (see Table 1) by a c-UF pilot plant connected to the secondary (biological) effluent of a working WWTP. The target contaminants have been selected based on their frequency of appearance and concentration in WWTPs [33] and the removal efficiency of the biological and UF processes has been quantified and compared, analyzing, in both cases, the influence of CEC concentration and in the case of the biological treatment the influence of biodegradability. In the UF treatment, we studied the specific behavior associated to adsorption phenomena. This factor, together with the complexity of the filtering mechanisms, requires global parameter for a complete valorisation of the UF effect, beyond the CEC reduction. Consequently, the effect of the UF treatment in the reduction of toxicity (Microtox®) has also been evaluated in order to obtain an estimation of the effectiveness of the treatment and the quality of the resulting effluent.

2. Materials and Methods

2.1. Equipment for UF and Operation Procedure

A pilot UF plant made by Fluytec S.A. (Bilbao, Spain) was used to treat the effluent from the biological process (BIO) of the WWTP of Galindo. This WWTP treats the urban and industrial water of the area of Bilbao (43°18′35.38′′ N and 3°0′25.92′′ W, Biscay, north of Spain), with an equivalent population of 1,500,000 inhabitants, using a conventional activated sludge process after various pretreatments (roughing, degreasing, sedimentation, and primary decantation).
The added UF plant has a treatment capacity of 5 m3/h and operates in continuous mode (c-UF) and without recirculation (dead end). The UF technology used works in dead-end mode, with a recovery factor of 98%. Then the retentate (2% of the feed water) corresponds to the wash water. This little stream could be recirculated to the biologic entrance to get further removal by biological degradation, and adsorption mechanism, or treated by ozonization. Its four hollow-fiber filtration modules are made of polyether sulfone (PES) with molecular weight cut off (MWCO) of 100 kDa, corresponding to a 20 nm pore size. The permeate stream presents a perpendicular direction across the membrane and a constant flow (3.3 m3/h) throughout the process. The estimated filtration rate through the membrane was 41.25 L/m2h taking into account that the effective membrane area was 80.0 m2. The operation procedure includes the sequential washing of each filtration module, such that the other three modules are working meanwhile. A 9 min. washing was programmed after each filtration period of 47 min, when the transmembrane pressure reaches the value of 0.6 bar, and consists of three phases: flushing, backwashing, and rinsing. The feed pressure starts at 1.5 bar and rises to 2.3 bar at the end of the filtering period, just before the washing period starts.

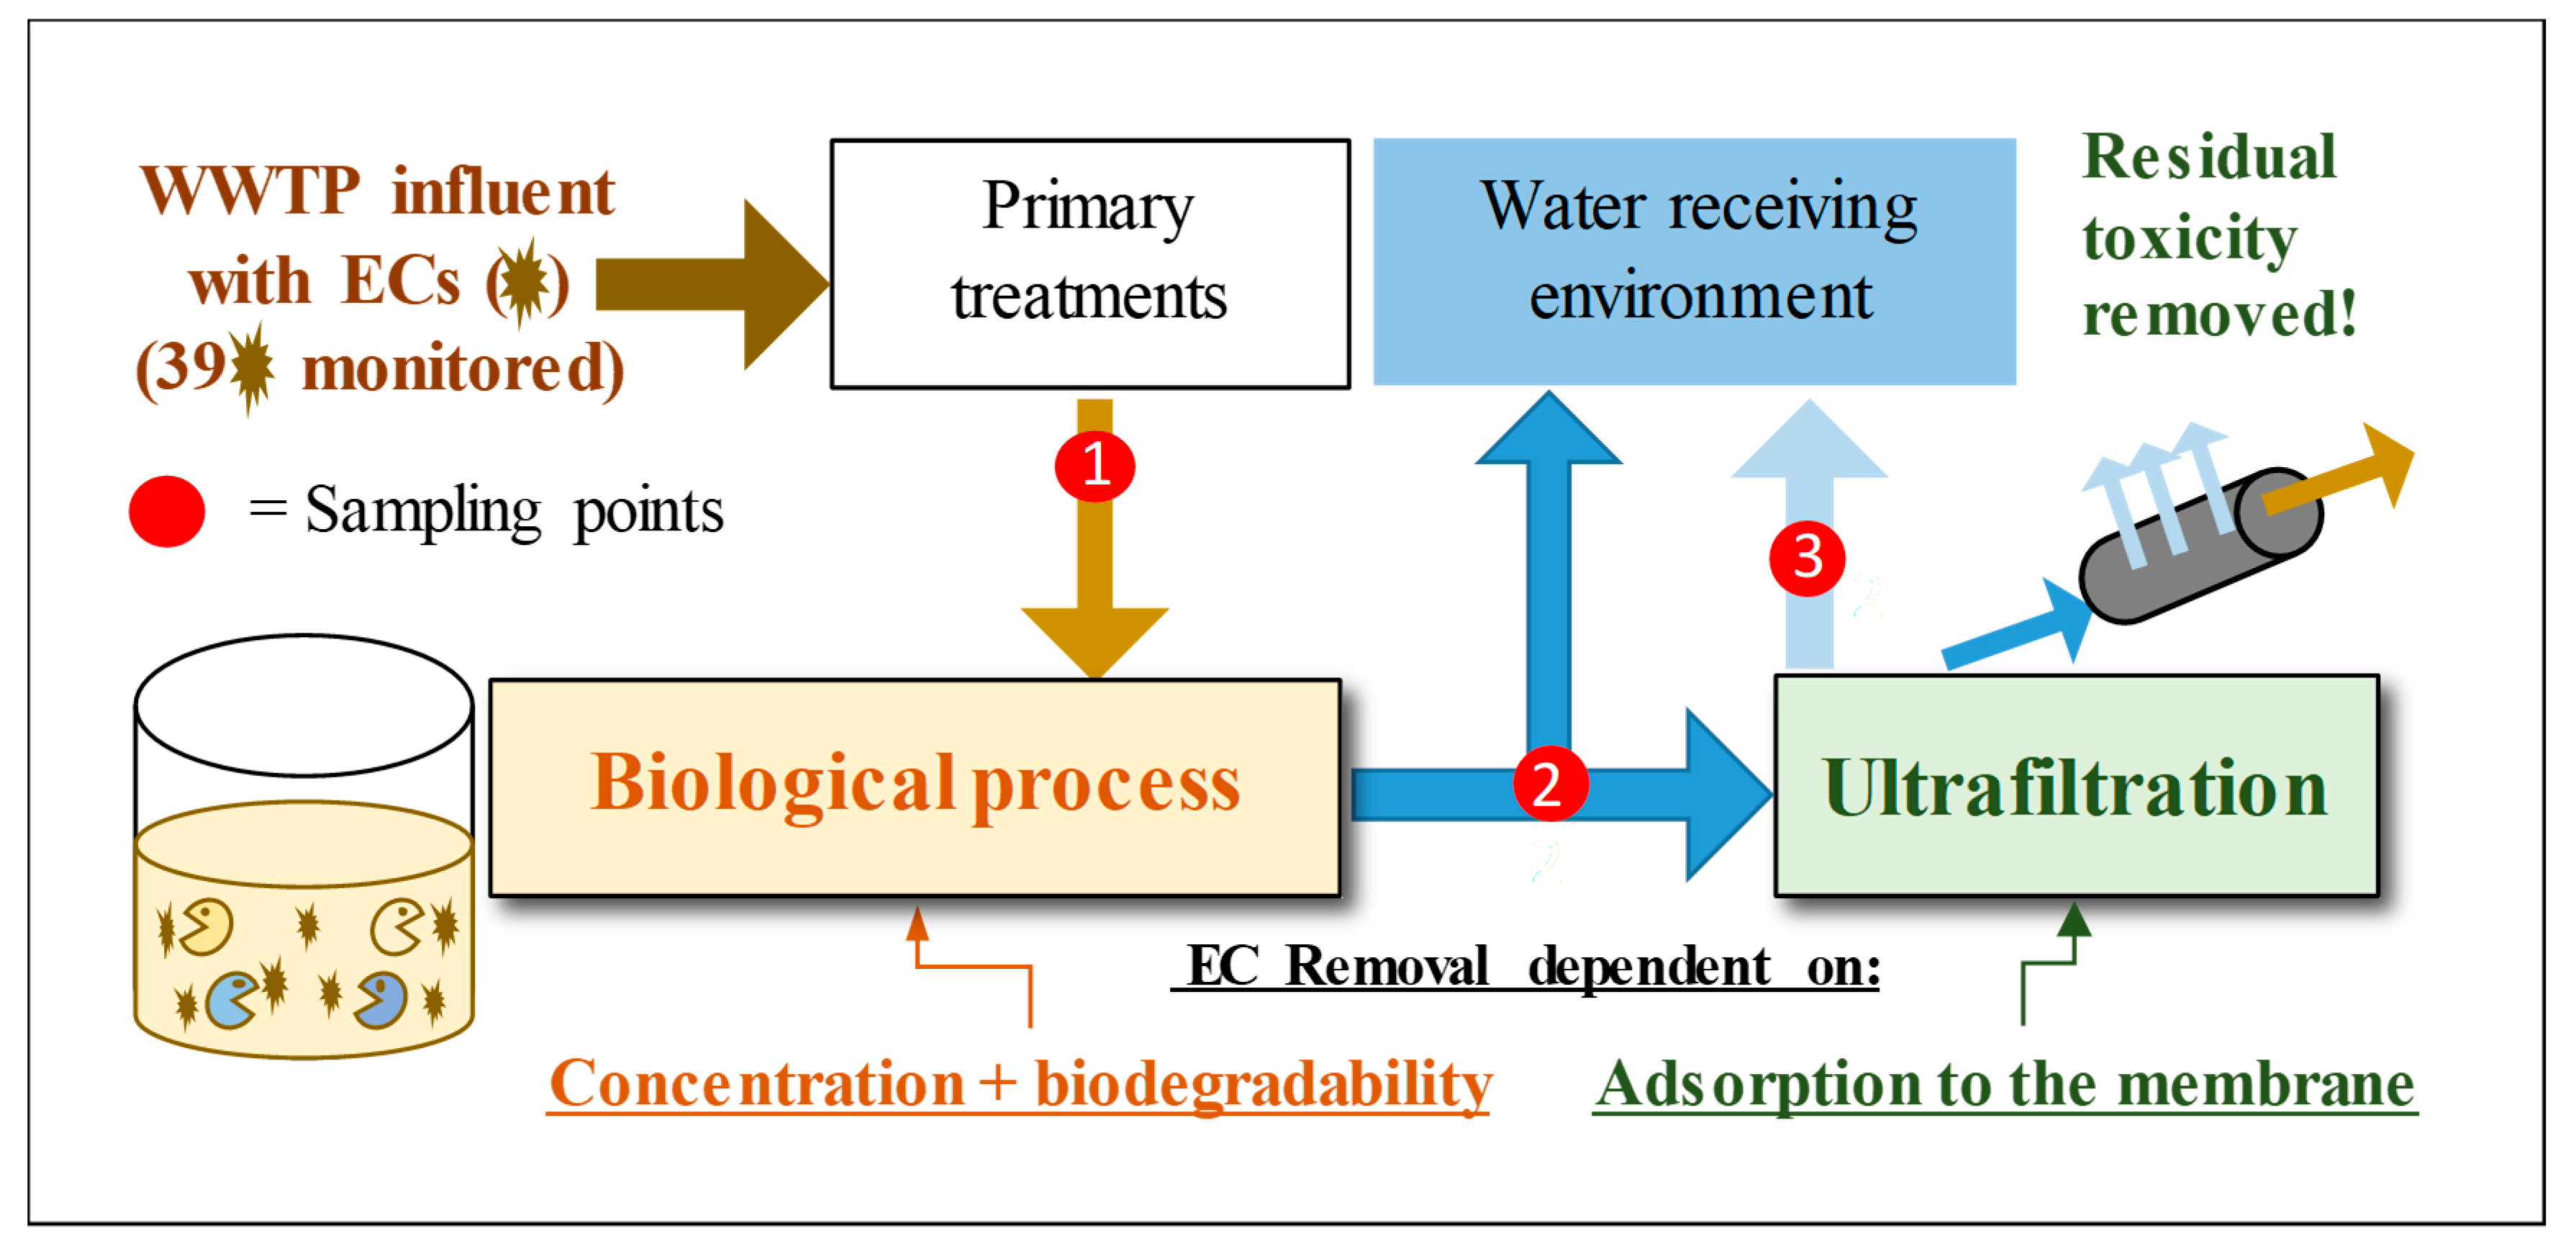
2.2. Sampling Method

Analyzed samples were collected after primary, secondary, and tertiary treatments. Figure 1 schematically shows the entire water treatment process in the WWTP and the different sampling points selected. Different samples (BIO influent, UF influent, and UF effluent samples) used in this work were named according to this figure.
Composite grab samples of 1.5L were collected, on three randomly selected days (in triplicate) of October 2018. Each day, samples at 4 different hours (9:00, 10:00, 11:00, and 12:00am) were taken, and each 1.5 L hour sample was formed by three 500 mL subsamples taken every 5min around the corresponding hour. Figure 1 shows the treatment units of the WWTP with the sampling points.
Corresponding UF influent samples were taken considering the hydraulic retention times in the aeration ponds and in the secondary settlers of the WWTP. Retention times fluctuated between 28 and 38 h, depending on the flow rate of treated wastewater. All samples were immediately frozen to preserve them until the analysis was performed. Samples were collected in prewashed amber glass bottles and transported to the laboratory in cooled boxes (4 °C). Samples were filtered through a 1.2 µm glass microfiber filter (GE Whatman, Maidstone, UK), and kept in the fridge at −4 °C before analysis. The analyses were performed within 24 h of sampling.
The ammonium concentration was obtained from the online monitoring system of the facility at the entrance of the biological process influent with measurements every 15 minutes, according to ISO 7 150-2 (1986), Water quality—Determination of ammonium—Part 2: Automated spectrometric method [34]. Ammonia is related to human activities and oxygen present in wastewater and, therefore lead to an increase in CEC, mostly pharmaceuticals, excreted by people. Bicudo et al. analyzed the presence of pharmaceutical CEC, such as acetaminophen or valsartan, to human activity through monitoring of ammonia in the influent of a WWTP in Grand River watershed. As in this study, they found no relationship between ammonium concentrations and CEC [35].

2.3. Analytical Method and Method Assurance

Water samples were analyzed in triplicate as one of the methods described by Mijangos et al. [36]. In this case, attending to the frequency at which compounds appeared and their concentration, 39 of the 41 compounds determined in that work were selected, which are listed in Table 1.
The applied method’s quality parameters, including extraction recoveries and method limits of quantification, were evaluated elsewhere [33]. The analysis of the samples is briefly described, as follows. First, 100 mL of each sample was filtered through 1.2 µm glass fiber filters (GE Whatman, Maidstone, UK), and then 4.25 mL of Na2EDTA (0.2 M) and 0.8 mL of a solution containing formic acid were added (pH = 2).
The compounds were loaded at a constant flow of 5 mL/min into a solid phase extraction (SPE) cartridge (OASIS-HLB, hydrophilic–lipophilic-balanced, 200 mg, Waters, Milford, USA) previously conditioned with 5 mL of methanol (MeOH), 5 mL of Milli-Q (MQ), and 5 mL of acidified MQ (pH = 2). After the samples were loaded, the cartridges were rinsed with 6 mL of MQ to remove the impurities, and the cartridges were vacuum dried for an hour. Methanol (6 mL) was used to elute the target analytes from the cartridges, and the extract was evaporated at 35 °C under a gentle stream of N2. Finally, samples were reconstituted in 200 µL of MeOH:MQ (30:70, v:v) and filtered using 0.22 µm polypropylene filters (PP, 0.22 µm, 13 mm, Phenomenex, Torrance, CA, USA), before liquid chromatography–tandem mass spectrometry (LC–MS/MS) analysis was performed [33].
The LC–MS/MS analysis was performed using an Agilent 1260 series HPLC chromatograph equipped with a degasser, binary pump, autosampler, and column oven, and coupled to an Agilent 6430 triple quadrupole (QqQ) mass spectrometer equipped with an electrospray ionization (ESI) source (Agilent Technologies, Palo Alto, CA, USA). The separation of the target analytes was carried out using a Kinetex F5 100 Å core-shell 2.1 mm × 100 mm, with a 2.6 µm column coupled to a Kinetex F5 pre-column 2.1 mm × 4.6 mm, 2.6 µm (Phenomenex, Torrance, 235 CA, USA). Then, 10 µL of sample was injected into the system and the column was maintained at 35 °C during the chromatographic run.
The separation was performed at a constant flow of 0.3 mL/min. under gradient elution with a binary mixture consisting of: water:MeOH (95:5, v:v) (mobile phase A) and MeOH:water (95:5, v:v) (mobile phase B), both containing 0.1% formic acid. The gradient profile started with 30% B, which was increased to 50% after 4 min and maintained for 12 min. Then, it was increased to 90% B, where it was maintained for 10 min. Initial gradient conditions (30% B) were then achieved in 6 min., where it was finally held for another 10 min (post-run step).
Electrospray ionization was carried out using a N2 flow rate of 12 L/min, a capillary voltage of 3500 V, a nebulizer pressure of 45 psi, and a source temperature of 350 °C.
Quantification was performed in the selected reaction monitoring (SRM) acquisition mode by recording the three most intense transitions for each analyte (the most sensitive transition was chosen as the quantifier and the second and third ones as qualifiers) where possible. Both voltages, according to the target analytes, were simultaneously applied in a single injection.
In order to assess the toxicity levels of UF influent and effluent samples Microtox® toxicity bioassays were performed. The measurements were carried out according to ISO 11348-3 (1998), Water Quality—Determination of the inhibitory effect of water samples on the light emission of Vibrio fischeri (Luminescent bacteria test)—Part 3: Method using freeze-dried bacteria [34]. The results of this assay are usually expressed as EC50, which represents the percentage of sample dilution (% v/v) that causes a 50% reduction in bacteria luminescence after 15 min of exposure. Consequently, the toxicity units (TU50 = 100/EC50) were used in this study to express the toxicity [38]. All the tests were carried out in duplicate in a Microtox® toxicity analyzer, Azur 500 model (Microbics Corp., New Castle, Delaware, USA).

3. Results and Discussion

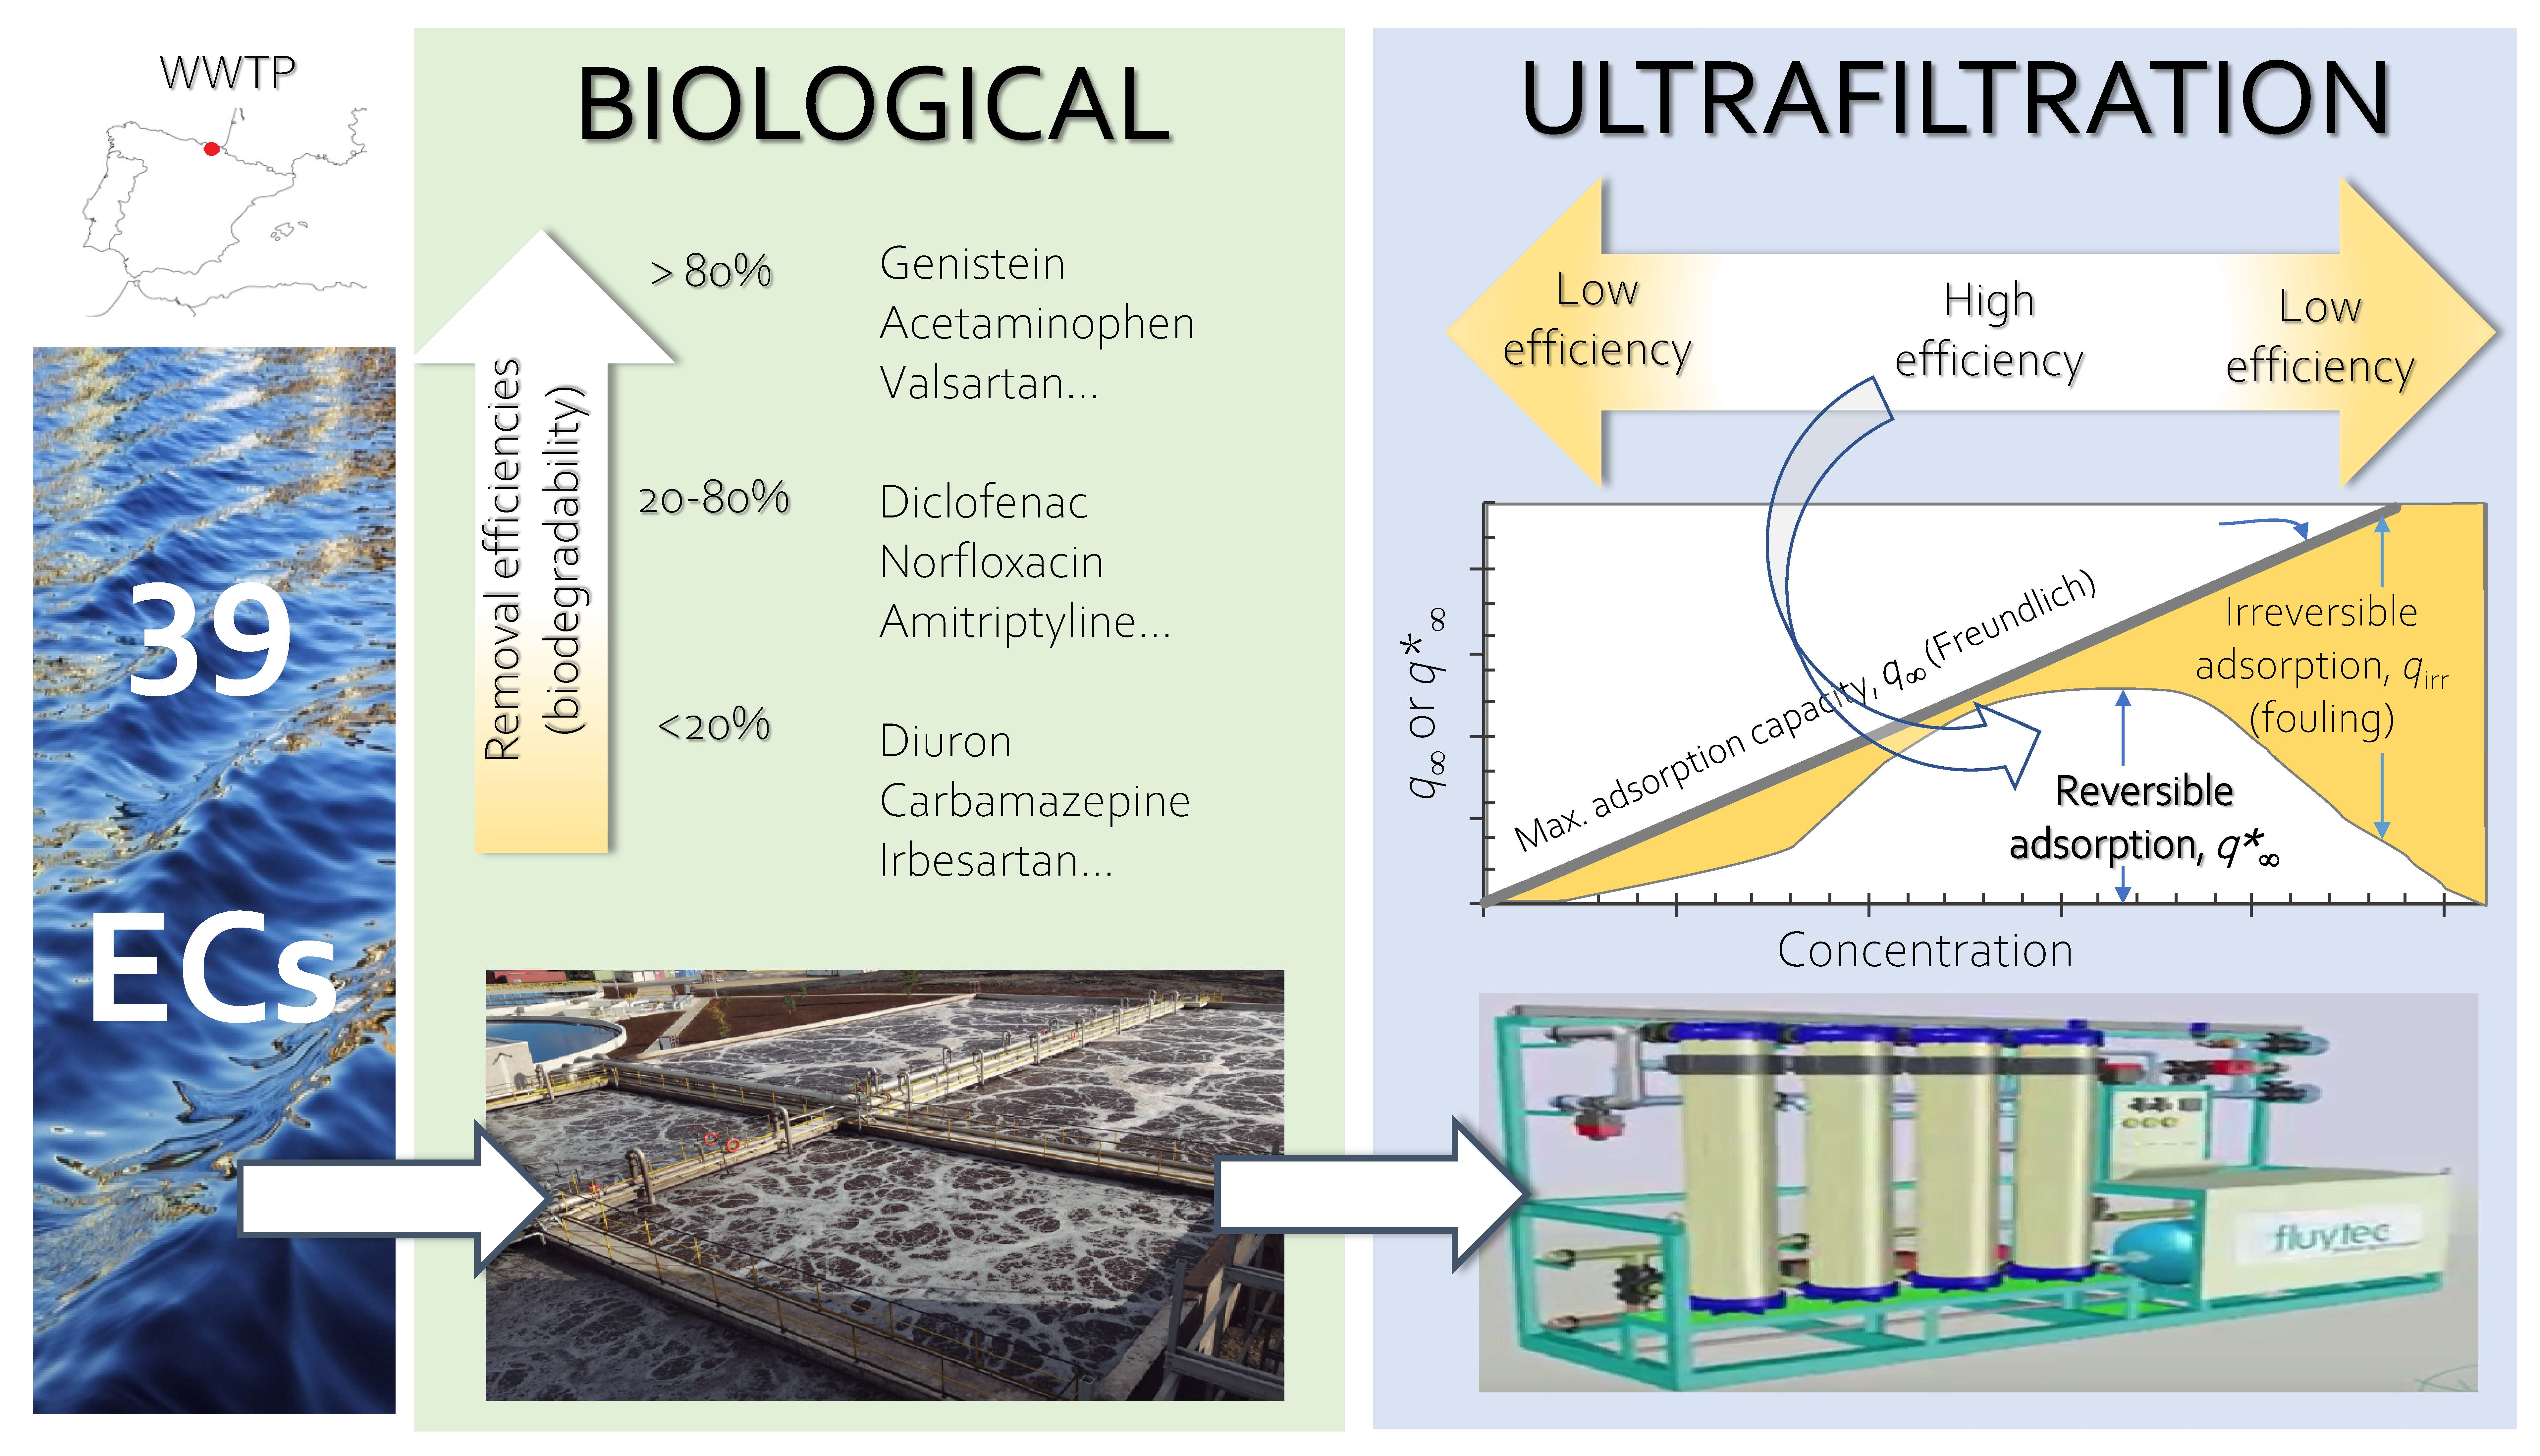
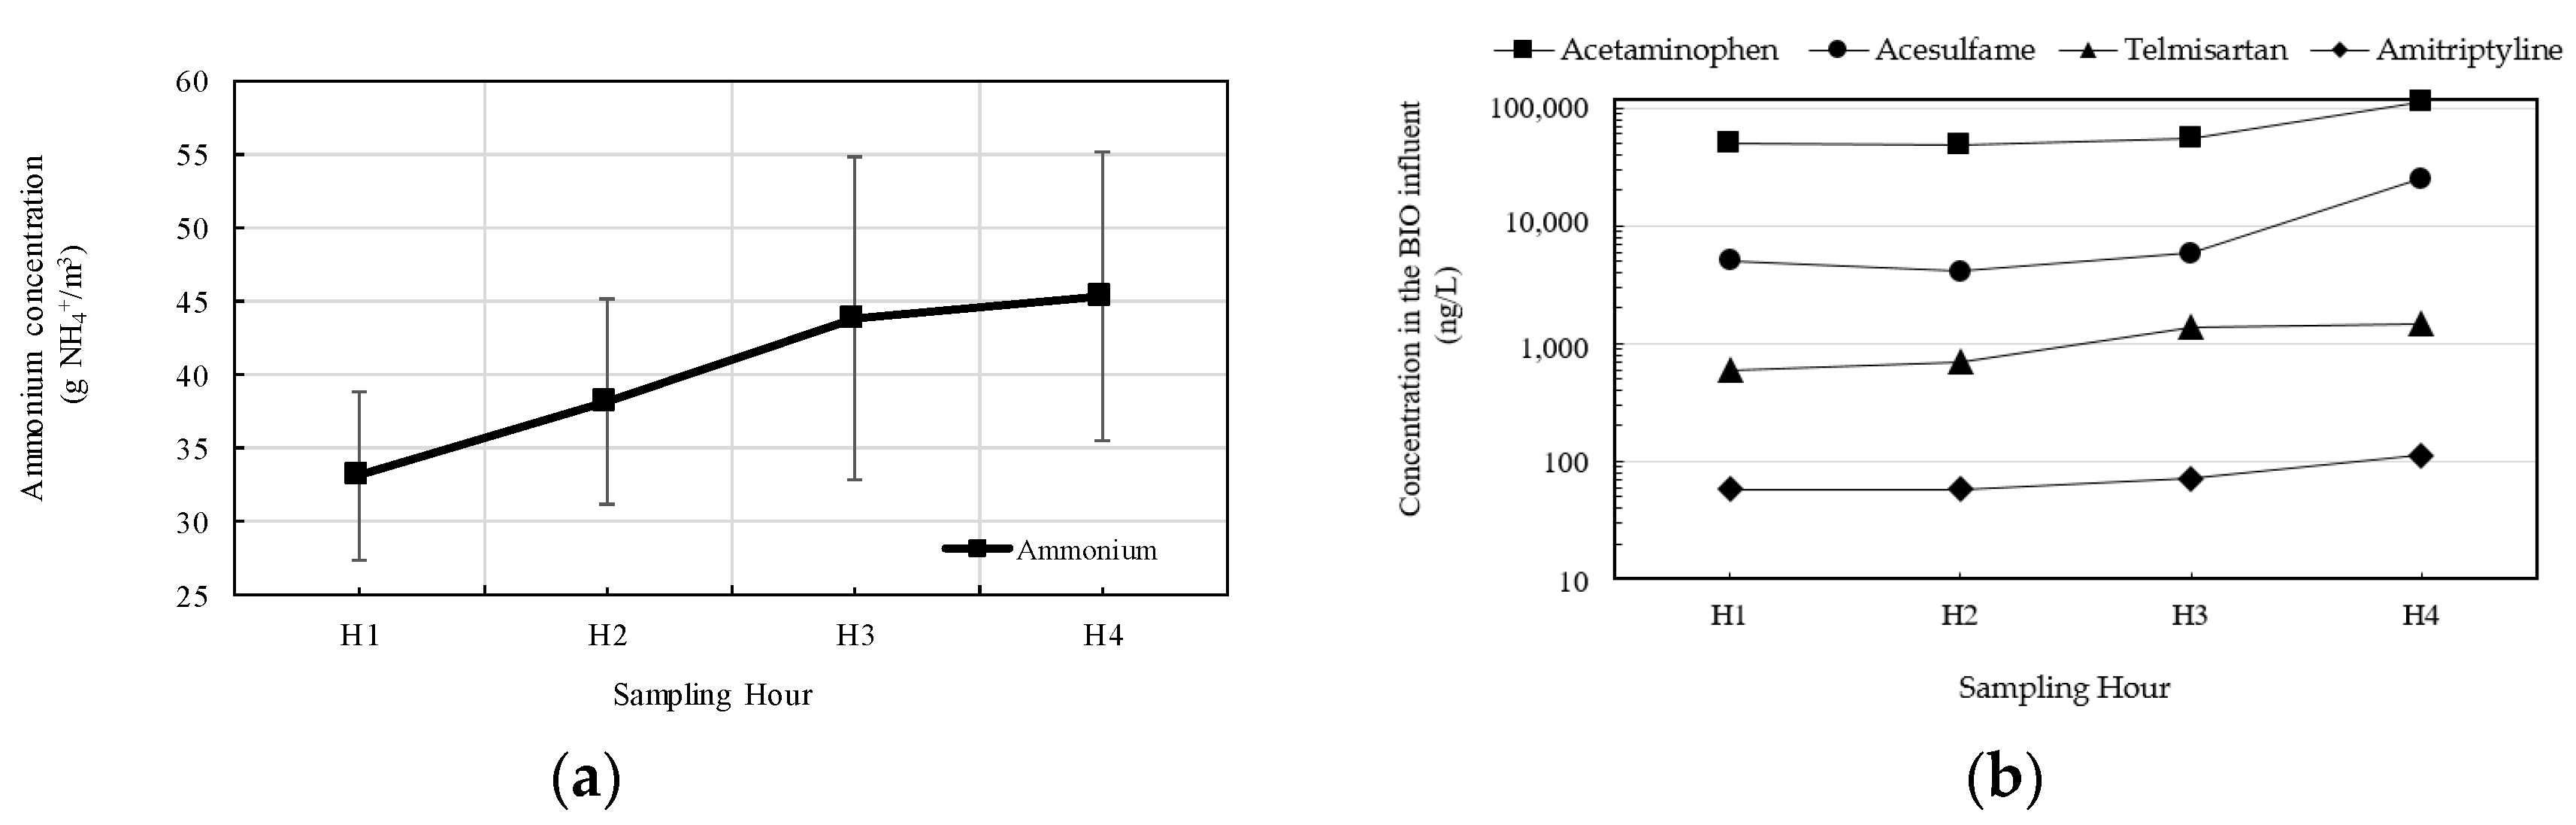
3.1. Relationship Between Ammonium Concentration and Emerging Contaminants Concentration

In the first step of the study, time profiles of ammonium and CEC concentrations arriving at the WWTP were studied and compared. The concentration of the major CEC (those above 1 ng/L) in the influent of the biological treatment is shown in Table 2. As has been reported by Luo et al. [9], most emergent contaminants are typically found between 0.1 and 10 µg/L, and some, such as acetaminophen and caffeine, show much higher levels. On the contrary, concentrations below 1 ng/L were found for the following microcontaminants: atrazine, butylparaben, clofibric acid, genistin, glycitin, imipramine, perfluoro-n-nonanoic acid, potassium perfluoro-1-octanesulfonate, potassium nonafluoro-1-butanesulfonate, simasine, sucralose and sulfadiazine. Therefore, these minor components were not taken into account in the study.
Ammonium concentration levels varied between 27.6 and 55.2 g/m3 in the different analysis days. As can be seen in Figure 2a, the ammonium content steadily increased with increasing sampling time, probably because of the increasing levels of human activities throughout the morning.
In the case of CEC (as shown in Table 2), some of them, such as acetaminophen, acesulfame, telmisartan, and amitriptyline, followed a pattern close to that of ammonium (Figure 2b—increasing their concentration as noon approached). This was also the case for other CEC, such as bezafibrate, eprosartan mesylate, and valsartan. Nevertheless, other CEC, such as diclofenac and diuron, showed the opposite tendency. However, most of them, such as testosterone and ciprofloxacin, showed a random pattern. Therefore, according to our results, CEC concentration variation in wastewaters cannot be related to ammonium concentration.

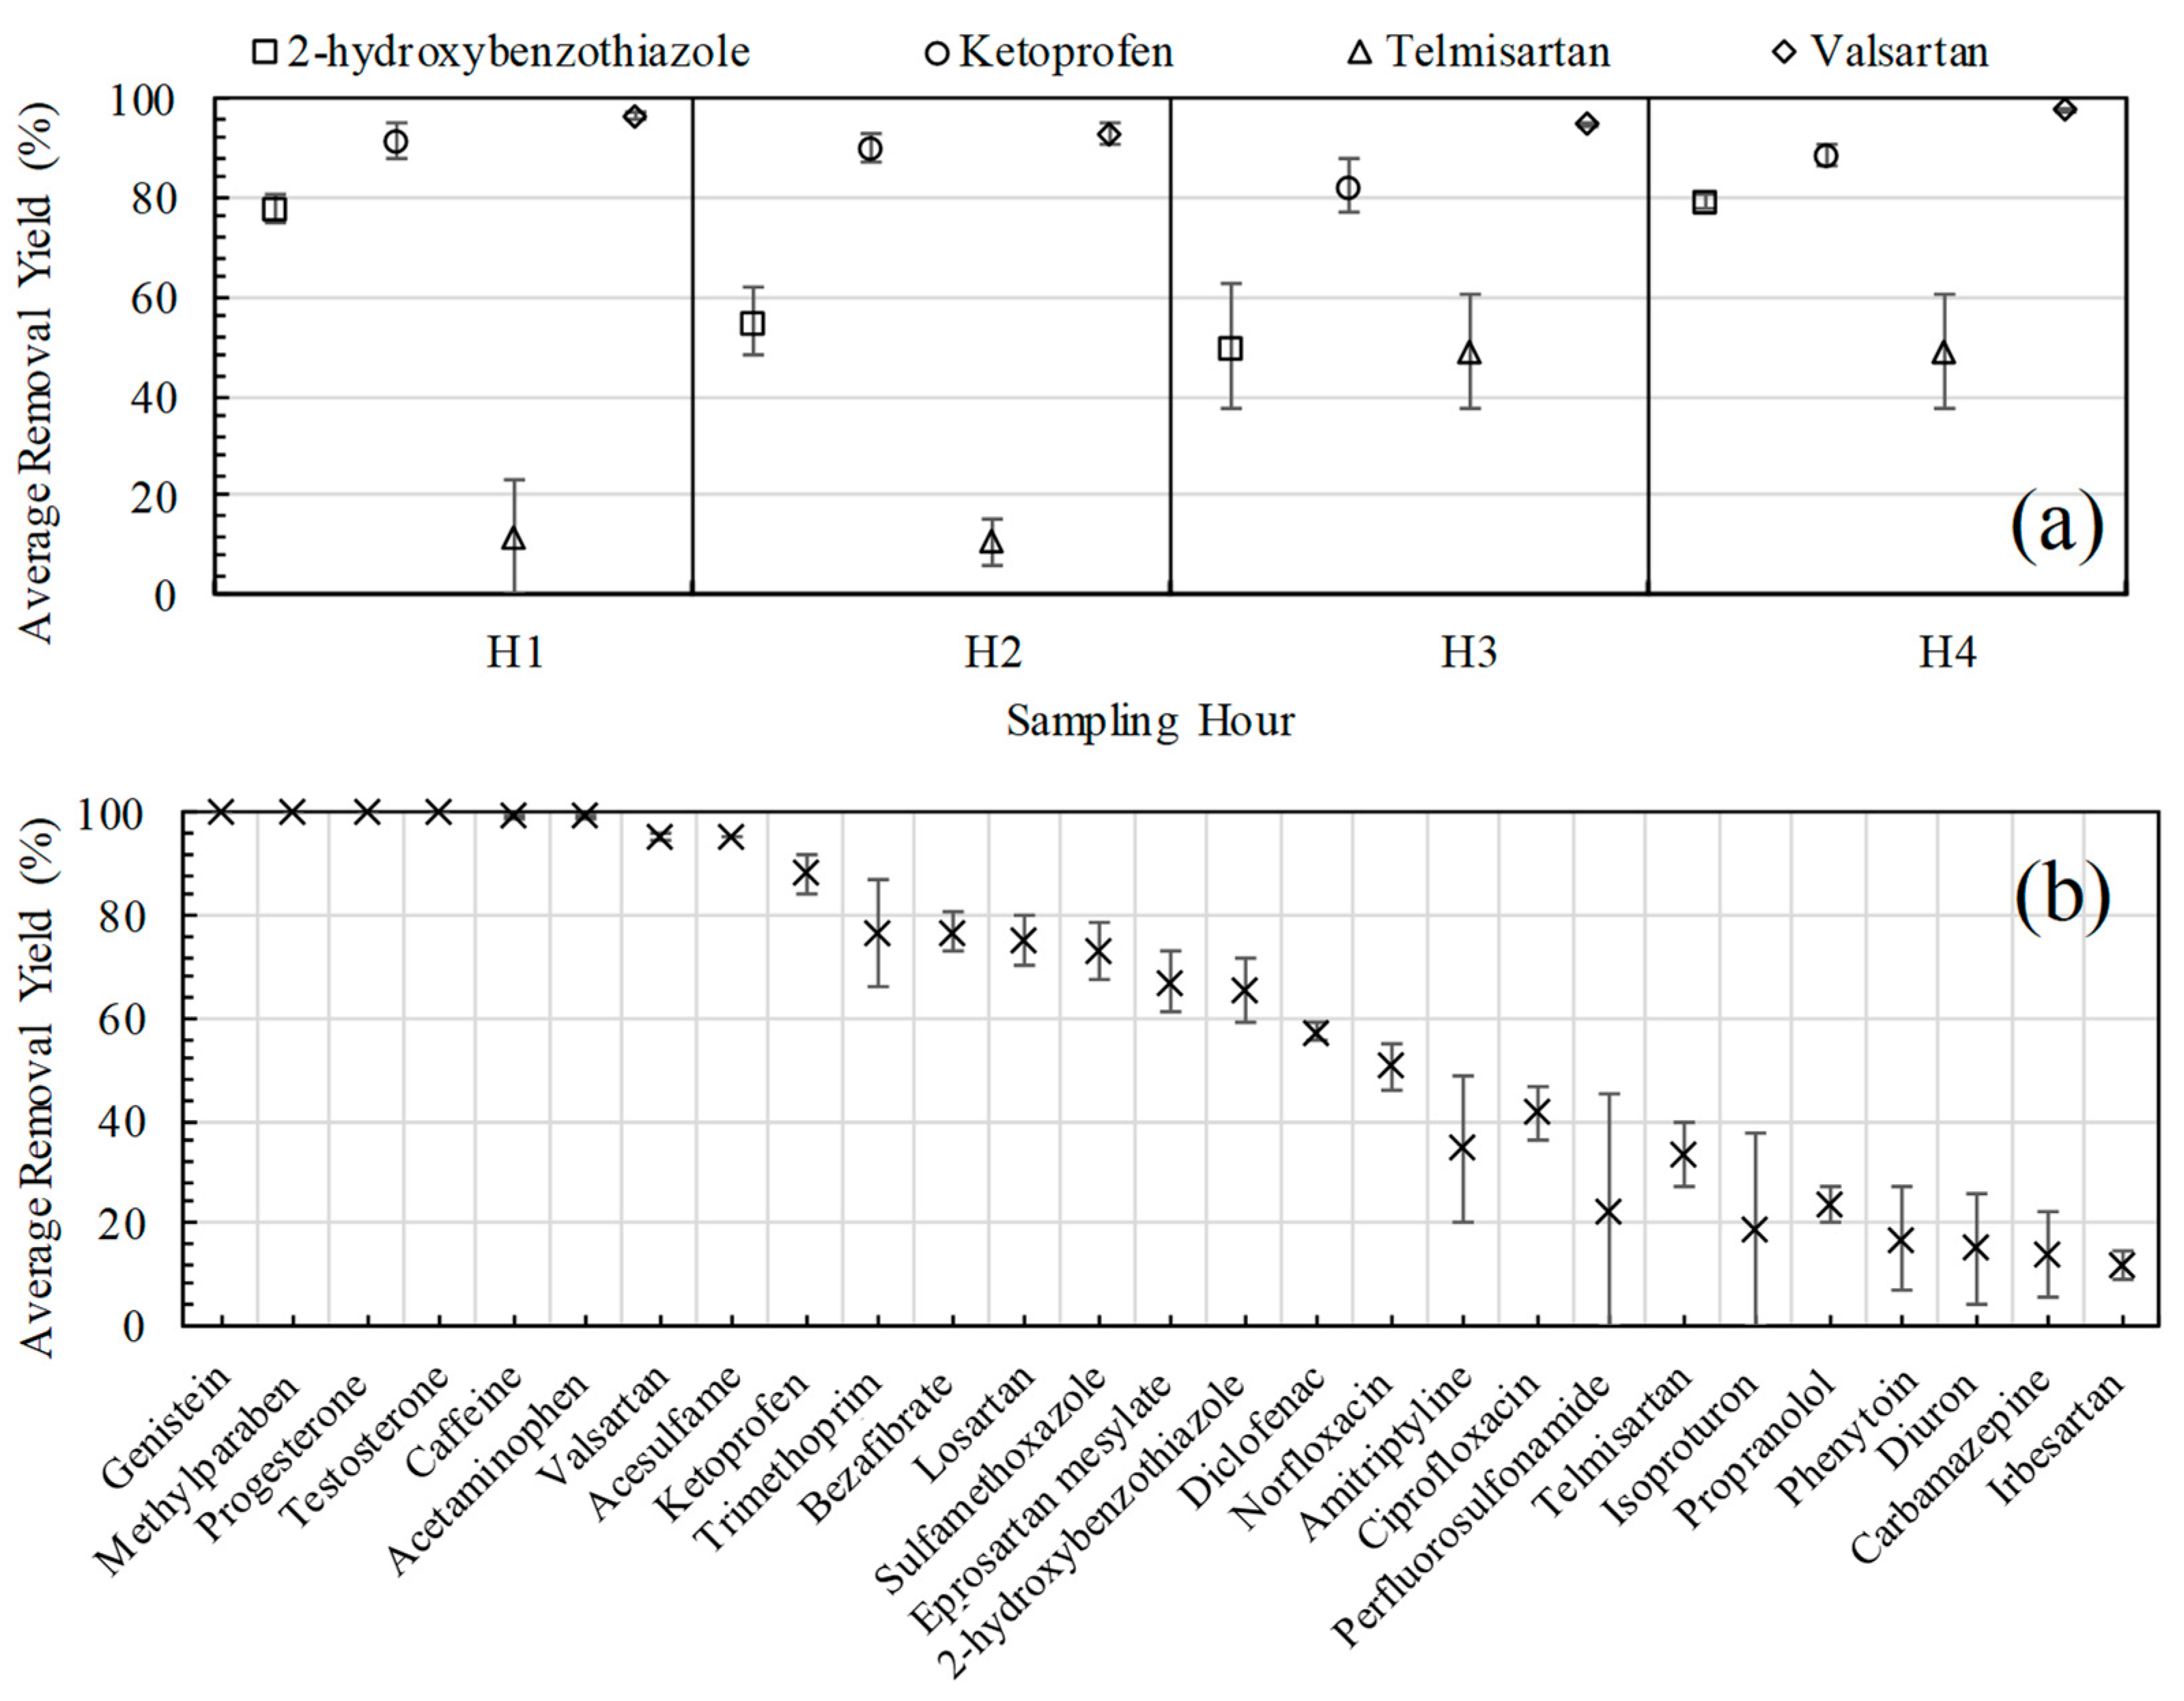
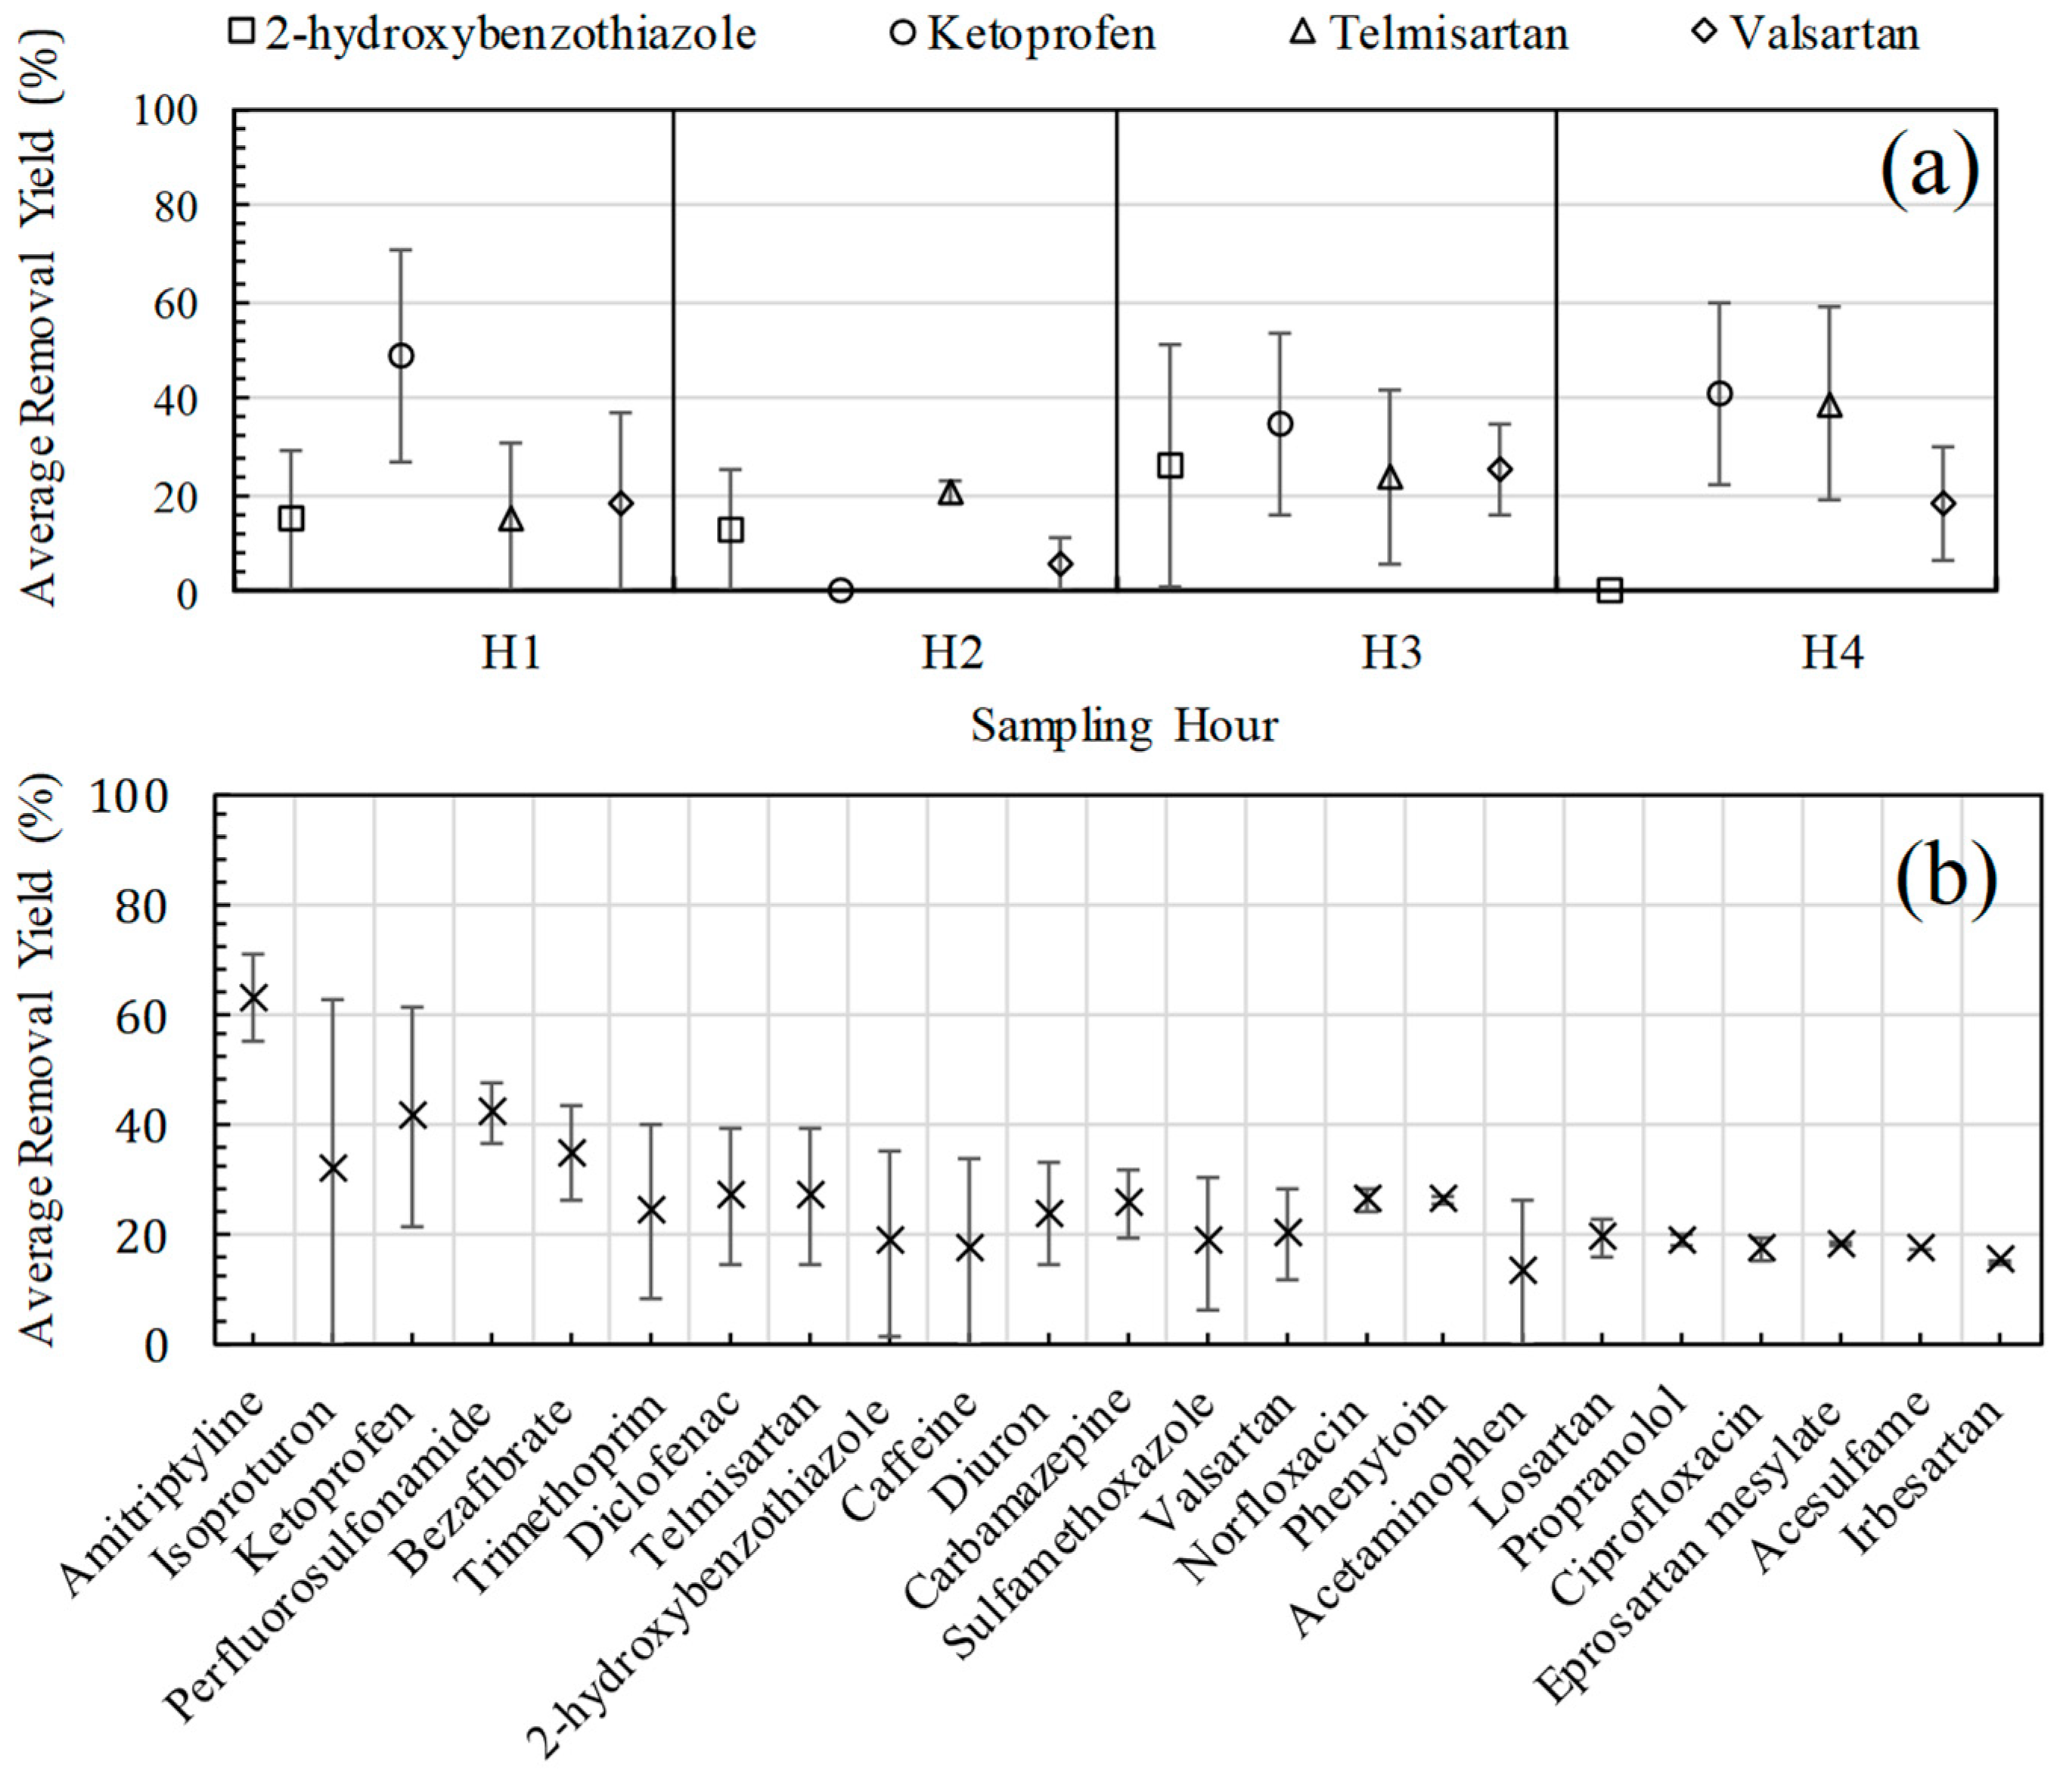
3.2. Removal Yields of Emerging Contaminants with the Biological Treatment

Removal rates achieved with the biological treatment for each of the CEC were calculated taking into account the concentration (mean and standard deviation) at the influent and the effluent of the treatment. From all the CEC, 2-hydroxibenzothiazole, ketoprofen, telmisartan, and valsartan have been chosen as representatives of the different behaviors, and the variation of their removal rates for each sampling hour is shown in Figure 3a. As can be seen, ketoprofen and valsartan showed high removal ratios in all hour samples. However, 2-hydroxibenzothiazole and telmisartan, showed lower values of removal efficiency with higher variability.
As Figure 3b shows, in general, compounds showing a removal higher than 80% maintained approximately constant values in all hour samples. On the contrary, those having intermediate and low removal percentages displayed higher variability. These results seem to indicate a certain variability in removal rates, which could be explained by taking into account factors such as CEC concentration and biodegradability.
When removal rates are analysed in relation to the concentration values at the influent of the biological treatment (Table 2), a partial dependence can be observed, probably for kinetic reasons. In fact, solutions with concentrations higher than 1500 ng/L yielded, in all cases, efficiencies above 80.0%, except for the case of sulfamethoxazole in H2. This was the case of acesulfame, acetaminophen, caffeine, methylparaben, and valsartan at all hours, and of eprosartan mesylate, sulfamethoxazole, and trimethoprim only at the hours with a proper concentration. Higher variation of efficiency was observed for most compounds.
Mean removal efficiencies for all CEC under biological treatment are shown in Figure 3b. As can be seen in this treatment, genistein, methylparaben, progesterone, and testosterone were completely removed, and caffeine and acetaminophen showed removal percentages higher than 99.5%. Contrarily, irbesartan and carbamazepine presented the lowest removal ratios, with maximum values of 15.0% and 22.0%, respectively. Two special cases were perfluorosulfonamide and isoproturon, which, in some cases, were not eliminated at all.
It can also be observed that the efficiency of some CEC is higher depending on the targeted compound, their biodegradation, and adsorption onto activated sludge [39]. In fact, acesulfame, acetaminophen, caffeine, genistein, methylparaben, progesterone, testosterone, and valsartan showed efficiencies higher than 93.0% at all the hours, and ketoprofen had an efficiency that was higher than 82.0%. Of them, genistein, progesterone, testosterone, and ketoprofen are remarkable, as their concentration was lower than 1500 ng/L. In the rest of the analytes, in general, displayed efficiencies lower than 84.0%, and the variation in the removal rate with the sampling hour was much higher. This higher variability of the rates with lower efficiencies could be due to the higher difficulty for the degradation of compounds with less biodegradability and at lower concentrations.
These results are generally in agreement with those obtained in the literature. For example, poor removal levels of carbamazepine (23.1%) in combination with high removal of acetaminophen (99.9%), caffeine (99.2%), and ketoprofen (94.2%), medium–high of diclofenac (81.4%) and trimethoprim (69.0%), and medium–low of sulfamethoxazole have been found in different biological-based WWTPs [40], as in this study. Similarly, in other works, evidence of the poor removal rate of carbamazepine [3,41] and the high degradability of acetaminophen [42,43] and caffeine or medium–high degradability of trimethoprim has been found [44].

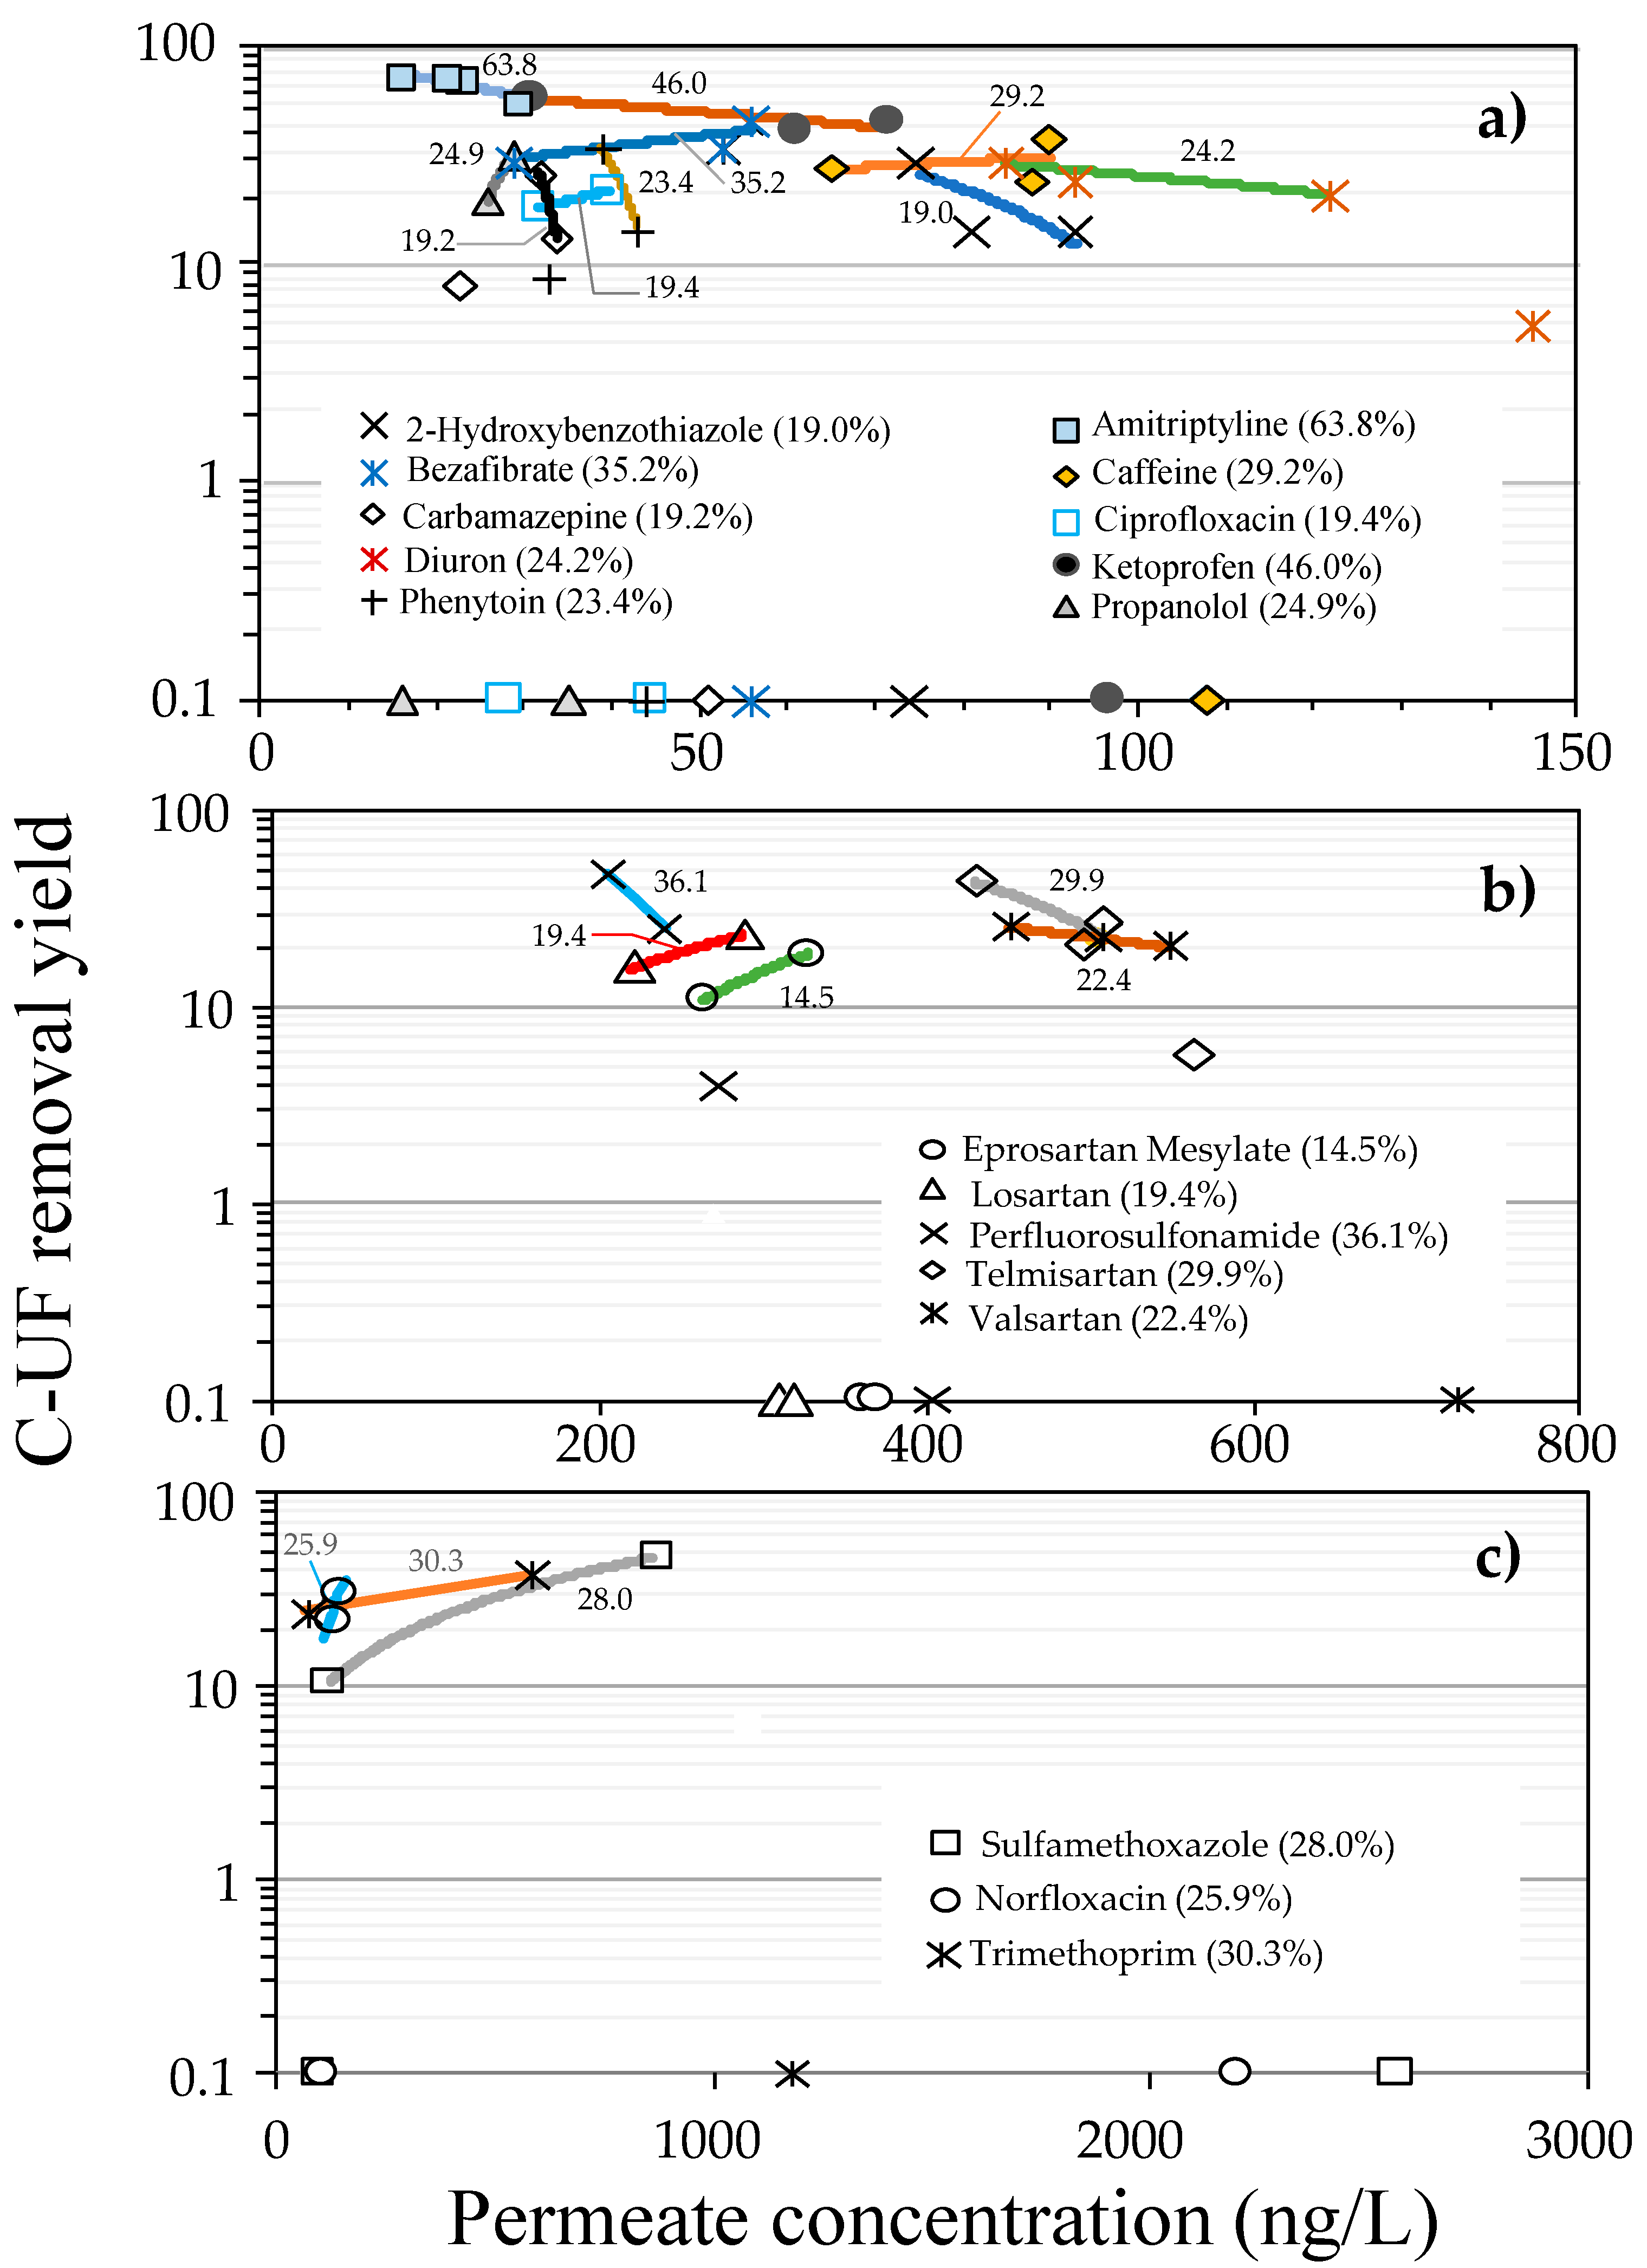
3.3. Removal Yields of Emerging Contaminants with UF Treatment

After biological treatment, effluent was submitted to c-ultrafiltration. Figure 4a shows removal rates with this treatment for the same emerging contaminants depicted in Figure 3a. Figure 4b shows the average efficiencies obtained with ultrafiltration for all the CEC.
As can be seen, the efficiencies achieved with ultrafiltration treatment were below 50.0% in almost all cases, except for amitriptyline (63.0%), and were systematically lower than those obtained with biological treatment. In addition to this, it is worth noting that the efficiencies were more stable throughout the day, though higher deviations were observed in the replicated measurements, probably due to the low removal rates achieved (high difficulty of the removal).
According to the literature, the predominant driving mechanism in UF is adsorption [45,46], and not size-exclusion due to the relatively large pore size. Therefore, the extent of the retention of the different compounds is related to the higher or lower affinity of each compound for the membrane. Nevertheless, it should be emphasized that, in general, ultrafiltration retention efficiency is not very high. For example, according to a reporting study [45], retention coefficients by different UF membranes were tested—obtaining average values below 50.0%. In addition, in other works, most of the compounds showed retention lower than 30.0% in the UF membrane [46].

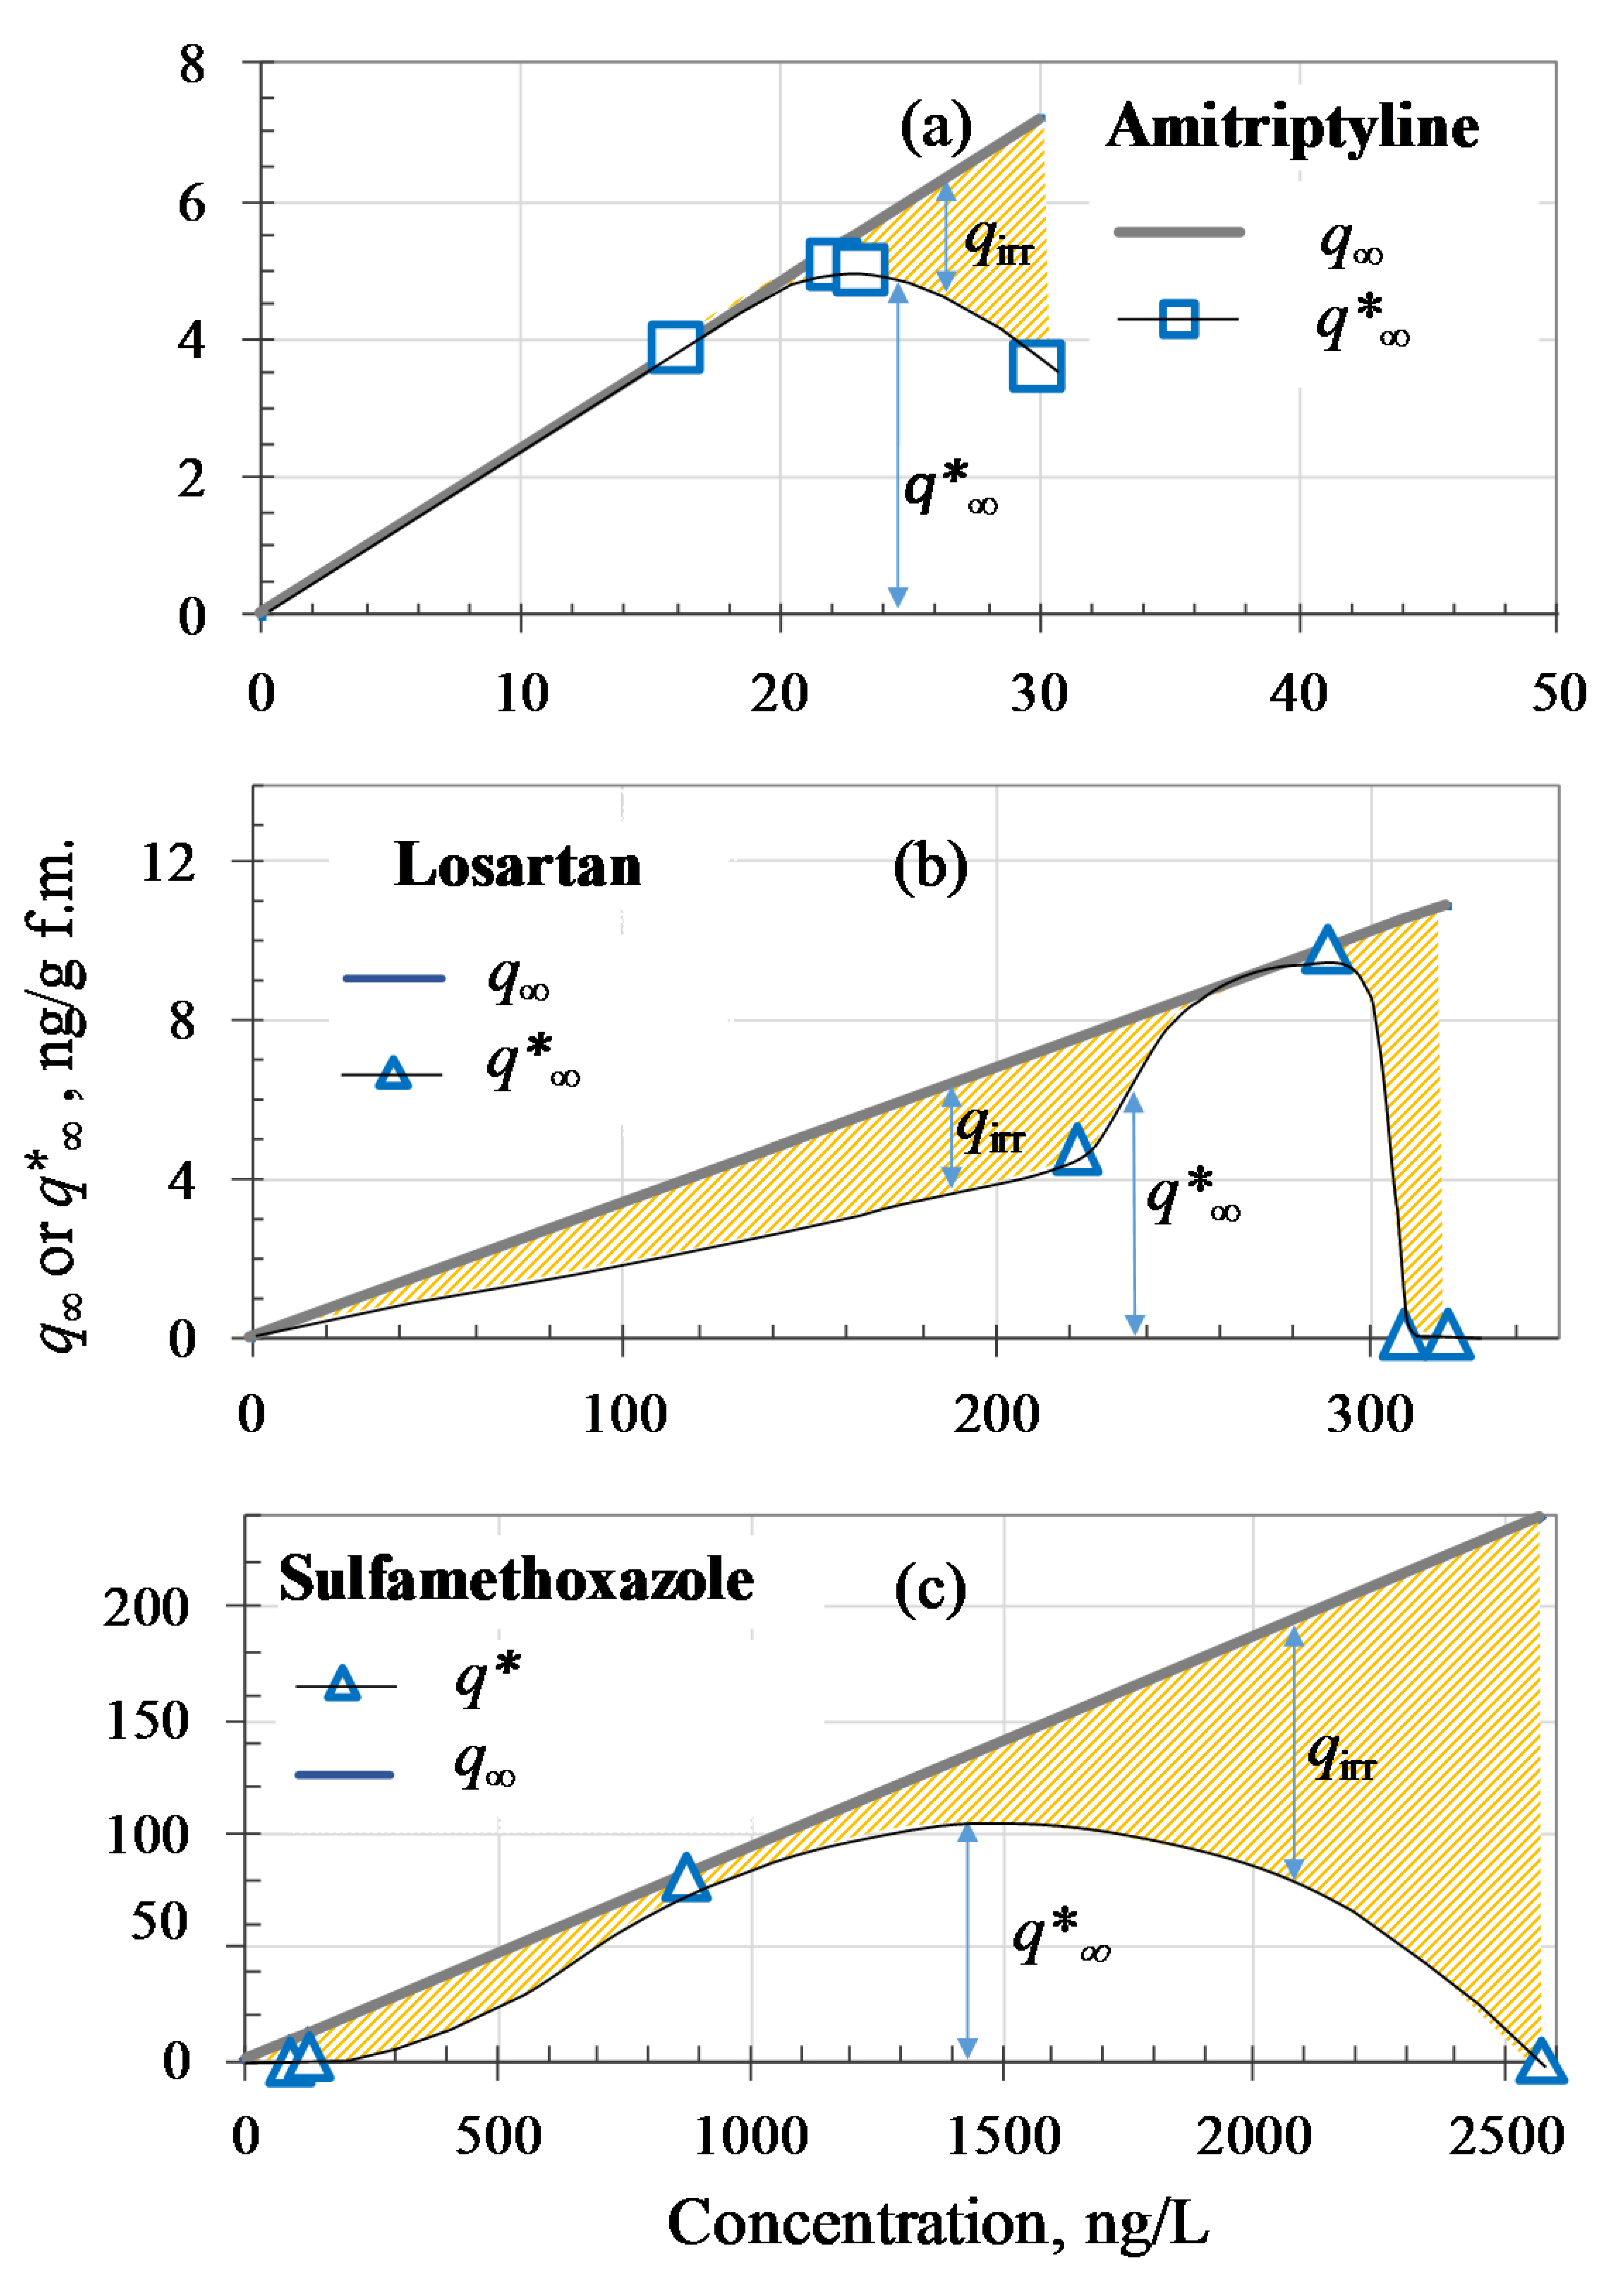
3.4. Removal Yields and Adsorption Phenomena in UF Treatment

Figure 5 shows the removal rates of the 18 CEC detected versus permeate concentration during c-UF in the treated effluent, showing a specific behaviour that could be associated to adsorption phenomena. The concentration variability observed for each contaminant at the ultrafiltration inlet depends not only on the concentration, but also on its biodegradability and the adsorption equilibrium on the surface of the membrane, as will be studied below in detail. Thus, many of those contaminants that are emerging in Figure 5a are contaminants with high biodegradability; those in Figure 5c presented high concentration variability in the biological entrance; those in Figure 5b presented intermediate values of concentration and biodegradability. Examples of CEC with extreme variation in concentration are caffeine, with a low concentration (≈ 50 ng/L), and trimethoprim, with a high concentration (≈ 500 ng/L). Both compounds presented removal rates of about 30.0%, but a sharp decrease of the average yields, beneath 0.1%, was observed at extreme concentration values. This was an extended behavior in many of the emerging contaminants shown in Figure 5. Thus, one can mention, among those of great variability—ketoprofen, 2-hydroxibenzothiazole, bezafibrate, carbamazepine and phenytoin—and those with medium concentration—valsartan, perfluorosulfonamide, eprosartan mesylate and losartan. Although showing different removal yields at their respective medium–high concentrations, at low concentrations, all these contaminants presented removal rates below 0.1%. On the other hand, in all compounds with high concentration variability—shown in Figure 5c—removal rates below 0.1% were found both at high and low concentrations (extreme values).
This special behavior, observed in most emerging contaminants analyzed in c-UF, seems to be explained by adsorption phenomena [47]. Corresponding equilibria of different compounds could be affected by the organic matter present at the entrance of the UF. Nevertheless, the buffering effect of the biological process leads to similar organic matter content concentration and characteristics of organic matter at the outlet. Consequently, the effect on the balance of different CEC is negligible.
After analyzing the removal yields, it is deduced that the maximum removal rate, once filtered, lies within the middle values, within the variability of each contaminant. In such cases, a good recovery of the filter material after washing is deduced. The retention capacity for a contaminant can be defined by the corresponding equilibrium adsorbed amount, q (ng/g f.m.), which depends on the contaminant concentration in contact with the filter material, according to the Freundlich adsorption isotherm:
K F = q C e 1 / n F
where Ce (ng/L) is the equilibrium concentration and KF (ng/g) (L/ng)nF is the Freundlich constant corresponding to a given contaminant and adsorbent material, when nF = 1. For many compounds at low concentrations, as in the emerging compounds, the heterogeneity factor, nF, is one [48].
Moreover, the duration of the filtration stage in the tests reported here was 47 min. For these times, it can be assumed that the retained load, qtf, at the end of the filtration period, is in equilibrium with the contaminant concentration at the c-UF output (permeate). Consequently, qtfq, and is, therefore, in equilibrium with the output concentration, Cp = Ce. In this way, the KF constant can be derived from:
q tf = η × C 0 × Q × t f M F
K F = q C e ;   q tf C p
Equation (2) relates the removal yield (η) to qtf, with MF (g) being the ultrafiltration membrane mass used to treat a flow Q (L/min), in which C0 (ng/L) is the input concentration for a certain CEC. Under certain conditions, also serves to estimate the retention capacity in equilibrium, q. In other words, Equation (3) is assumable, as long as the adsorption capacity is maintained at the maximum value; that is, q does not decrease and the adsorption kinetics, kads (g(ng min)−1), are sufficiently fast. In principle, these circumstances would occur for the highest removal rate observed in each contaminant. In this case, the corresponding qtf is assimilable to q.
An estimation of the adsorption constant can be made by considering a pseudo-second order kinetics:
d q tf d t f = k ads × ( q q tf ) 2
t f q t f = 1 k ads × q 2 + t f q
Equation (5) enables the amount of contaminant retained during filtration to be determined. Solving for a time tf = 47 min (filtration period), the qtf value is obtained that should coincide with the experimental one from Equation (2). In the case of a low removal yield, the experimental qtf values can be explained through Equation (5), because of the q reduction to a lower effective value, q* (= qqirr), depending on the filtration conditions. This value tends to be zero at the extreme concentration values, within the variation range of each CEC. Table 3 shows the values of the adsorption parameters estimated from the retention observed for each compound. Diuron and caffeine were selected among the low-concentration CEC, telmisartan and losartan among those of medium concentration, and sulfamethoxazole and trimethoprim among those of high concentration. The qirr value represents the amount irreversibly retained in the filtration membrane and not removed during washing, causing fouling [25]. In general, qirr approaches q at extreme values (high and/or low), leading to a low removal yield.
A fouling factor, Fq, was defined for each component by the ratio of adsorbed contaminant, not eliminable or irreversible, qirr, to the original adsorption capacity, q, according to Equation (6):
F q = q irr q
In Table 3, the variability of the removal yields with the concentration for some selected compounds are shown.
The highest removal yields correspond to situations with a fouling factor, Fq, close to zero. Thus, for each compound, the greatest removal yields correspond to situations, with a fouling factor, Fq, close to zero. In Figure 6, the retention capacity in equilibrium has been represented, according to Equation (3), for three representative compounds, of low (amitriptyline), medium (losartan), and high concentration (sulfamethoxazole). As explained above, q is composed of a reversible part q* (white area below q profile in Figure 6) which is removed by washing, after each filtration period, and another irreversible part or fouling, qirr (shaded area). As qirr approaches q, it will be more difficult to recover the adsorption capacity after each cycle.
Consequently, highest removal yields will occur as q* approaches q. These favourable situations correspond to intermediate concentrations represented in Figure 6 by a large white area beneath the q line, whereas qirr (shaded area) is negligible. This concentration range of high removal yields can be more or less centred depending on the compound. Thus, losartan and sulfamethoxazole present similar situations, whereas in the case of amitriptyline, the highest elimination yields correspond to the lowest concentrations.

3.5. Toxicity Test

The results (mean and standard deviation of three replicates) of the Microtox® assay in both the input and output of the c-UF plant, at each hour, are summarized in Table 4.
It is well known that UF removes mainly suspended solids and bacteria but also has significant efficiency in terms of toxicity removal, because it removes the low toxicity of the biological effluent (see Table 4); local discharge legislation establishes nontoxic effluents when TU50 values are below 50. Moreover, part of CEC, as seen before, are also removed although this is not clearly related to the decrease of toxicity. Consequently, most of the toxicity may be due to non-measured contaminants or to only a part of the measured ones. Deeper experiments beyond the scope of this work would be necessary to clarify this aspect.

4. Conclusions

In this work, the removal of 39 high-occurrence CEC by the biological treatment of a WWTP and by a c-UF plant installed in its effluent was studied.
First, the time profile of the CEC concentration in the influent of the biological treatment was compared to the profile of ammonium and no significant relationships were obtained for most (75.0%) of the CEC.
In the case of the biological treatment, the removal rate of the CEC was dependent on the concentration and nature of each compound due to specific degradation biokinetics and biodegradability of the different compounds, respectively. Related to this, genistein, methylparaben, progesterone, testosterone, caffeine, and acetaminophen showed removal efficiencies above 99.5%. In contrast, irbesartan, carbamazepine, diuron, and phenytoin showed average removal rates below 20.0%. In addition, solutions with a higher concentration of CEC (above 1500 ng/L) presented high efficiencies above 80.0% in almost all cases.
In the case of ultrafiltration, removal rates were not higher than 30.0% in most cases, except for the case of amitriptyline, which reached 63.0%. In general, a strong variability of the removal rate with concentration was observed in all CEC. Low removal yields observed at low and/or high concentrations could be explained by fouling, or irreversibly adsorbed material on the filtration membrane.
Moreover, the Microtox® toxicity tests revealed that c-UF efficiently reduces the toxicity of the secondary effluent (biological). However, because of the complexity of this matter, beyond the scope of this work, the identification of responsible CEC for toxicity could not be found.
As a general conclusion, biological treatment complemented with c-UF allows a higher efficiency in removing CEC than the biological process alone. Nevertheless, ultrafiltration can be satisfactorily used as a tertiary treatment in order to help remove the small residual toxicity in the last WWTP stream.

5. Patents

The c-UF system used in this work has been patented in Spain under patent number ES201431341A.

Author Contributions

Conceptualization, J.I.L.; methodology and analyses, J.I.L. and O.R.; model validation, A.d.L. and N.V.; formal analysis, I.G.-M.; investigation, I.G.-M.; original draft preparation, A.d.L. and C.F.; review and editing, C.F. and N.V.; supervised the experimentation, N.E.; acquired the funding, J.I.L. and N.E. All authors have read and agreed to the published version of the manuscript

Funding

The authors are grateful to the University of the Basque Country for their financial support of this study through the PPGA19/63 and UFI 11/39 projects, and C. Ferreiro’s predoctoral PIF grant (PIF16/367).

Acknowledgments

The authors also wish to acknowledge the assistance of Fluytec S.A. with a c-UF unit of its own for this study.

Conflicts of Interest

The authors declare no conflict of interest.

References

  1. Chávez, A.M.; Ribeiro, A.R.; Moreira, N.F.F.; Silva, A.M.T.; Rey, A.; Álvarez, P.M.; Beltrán, F.J. Removal of Organic Micropollutants from a Municipal Wastewater Secondary Effluent by UVA-LED Photocatalytic Ozonation. Catalysts 2019, 9, 472. [Google Scholar] [CrossRef] [Green Version]
  2. Lopera, A.E.C.; Ruiz, S.G.; Alonso, J.M.Q. Removal of emerging contaminants from wastewater using reverse osmosis for its subsequent reuse: Pilot plant. J. Water Process. Eng. 2019, 29, 100800. [Google Scholar] [CrossRef]
  3. Gros, M.; Petrovic, M.; Barceló, D. Analysis of Emerging Contaminants of Municipal and Industrial Origin. In Emerging Contaminants from Industrial and Municipal Waste: Occurrence, Analysis and Effects; Barceló, D., Petrovic, M., Eds.; The Handbook of Environmental Chemistry; Springer: Berlin/Heidelberg, Germany, 2008; pp. 37–104. ISBN 978-3-540-74795-6. [Google Scholar]
  4. Quiñones, D.H.; Álvarez, P.M.; Rey, A.; Beltrán, F.J. Removal of emerging contaminants from municipal WWTP secondary effluents by solar photocatalytic ozonation—A pilot-scale study. Sep. Purif. Technol. 2015, 149, 132–139. [Google Scholar] [CrossRef]
  5. Tran, N.H.; Reinhard, M.; Gin, K.Y.H. Occurrence and fate of emerging contaminants in municipal wastewater treatment plants from different geographical regions—A review. Water Res. 2018, 133, 182–207. [Google Scholar] [CrossRef] [PubMed]
  6. Prasse, C.; Stalter, D.; Schulte-Oehlmann, U.; Oehlmann, J.; Ternes, T.A. Spoilt for choice: A critical review on the chemical and biological assessment of current wastewater treatment technologies. Water Res. 2015, 87, 237–270. [Google Scholar] [CrossRef] [PubMed] [Green Version]
  7. Montes-Grajales, D.; Fennix-Agudelo, M.; Miranda-Castro, W. Occurrence of personal care products as emerging chemicals of concern in water resources: A review. Sci. Total Environ. 2017, 595, 601–614. [Google Scholar] [CrossRef]
  8. Pereira, L.C.; De Souza, A.O.; Bernardes, M.F.F.; Pazin, M.; Tasso, M.J.; Pereira, P.H.; Dorta, D.J. A perspective on the potential risks of emerging contaminants to human and environmental health. Environ. Sci. Pollut. Res. 2015, 22, 13800–13823. [Google Scholar] [CrossRef]
  9. Luo, Y.L.; Guo, W.S.; Ngo, H.H.; Nghiem, L.D.; Hai, F.I.; Zhang, J.; Liang, S.; Wang, X.C. A review on the occurrence of micropollutants in the aquatic environment and their fate and removal during wastewater treatment. Sci. Total Environ. 2014, 473, 619–641. [Google Scholar] [CrossRef]
  10. Vulliet, E.; Cren-Olive, C.; Grenier-Loustalot, M.F. Occurrence of pharmaceuticals and hormones in drinking water treated from surface waters. Environ. Chem. Lett. 2011, 9, 103–114. [Google Scholar] [CrossRef]
  11. Shelley, L.K.; Ross, P.S.; Miller, K.M.; Kaukinen, K.H.; Kennedy, C.J. Toxicity of atrazine and nonylphenol in juvenile rainbow trout (Oncorhynchus mykiss): Effects on general health, disease susceptibility and gene expression. Aquat. Toxicol. 2012, 124, 217–226. [Google Scholar] [CrossRef]
  12. De Wever, H.; Verachtert, H. Biodegradation and toxicity of benzothiazoles. Water Res. 1997, 31, 2673–2684. [Google Scholar] [CrossRef]
  13. European Environment Agency. Urban Waste Water Treatment. Available online: https://www.eea.europa.eu/data-and-maps/indicators/urban-waste-water-treatment/urban-waste-water-treatment-assessment-4 (accessed on 16 December 2019).
  14. Oturan, M.A.; Aaron, J.J. Advanced Oxidation Processes in Water/Wastewater Treatment: Principles and Applications. A Review. Crit. Rev. Environ. Sci. Technol. 2014, 44, 2577–2641. [Google Scholar] [CrossRef]
  15. Nasirabadi, P.S.; Saljoughi, E.; Mousavi, S.M. Membrane processes used for removal of pharmaceuticals, hormones, endocrine disruptors and their metabolites from wastewaters: A review. Desalin. Water Treat. 2016, 57, 24146–24175. [Google Scholar] [CrossRef]
  16. Van Der Bruggen, B.; Vandecasteele, C.; Van Gestel, T.; Doyen, W.; Leysen, R. A review of pressure-driven membrane processes in wastewater treatment and drinking water production. Environ. Prog. 2003, 22, 46–56. [Google Scholar] [CrossRef]
  17. Wang, J.; Tian, Z.; Huo, Y.B.; Yang, M.; Zheng, X.C.; Zhang, Y. Monitoring of 943 organic micropollutants in wastewater from municipal wastewater treatment plants with secondary and advanced treatment processes. J. Environ. Sci. 2018, 67, 309–317. [Google Scholar] [CrossRef]
  18. Kudlek, E. Decomposition of Contaminants of Emerging Concern in Advanced Oxidation Processes. Water 2018, 10, 955. [Google Scholar] [CrossRef] [Green Version]
  19. Márquez, G.; Rodríguez, E.M.; Beltrán, F.J.; Álvarez, P.M. Solar photocatalytic ozonation of a mixture of pharmaceutical compounds in water. Chemosphere 2014, 113, 71–78. [Google Scholar] [CrossRef]
  20. De La Cruz, N.; Esquius, L.; Grandjean, D.; Magnet, A.; Tungler, A.; De Alencastro, L.; Pulgarin, C. Degradation of emergent contaminants by UV, UV/H2O2 and neutral photo-Fenton at pilot scale in a domestic wastewater treatment plant. Water Res. 2013, 47, 5836–5845. [Google Scholar] [CrossRef]
  21. Serna-Galvis, E.A.; Silva-Agredo, J.; Giraldo, A.L.; Flórez-Acosta, O.A.; Torres-Palma, R.A.; Torres, R. Comparative study of the effect of pharmaceutical additives on the elimination of antibiotic activity during the treatment of oxacillin in water by the photo-Fenton, TiO2-photocatalysis and electrochemical processes. Sci. Total Environ. 2016, 541, 1431–1438. [Google Scholar] [CrossRef] [Green Version]
  22. Shi, B.J.; Wang, Y.; Geng, Y.K.; Liu, R.D.; Pan, X.R.; Li, W.W.; Sheng, G.P. Application of membrane bioreactor for sulfamethazine-contained wastewater treatment. Chemosphere 2018, 193, 840–846. [Google Scholar] [CrossRef]
  23. Acero, J.L.; Benitez, F.J.; Leal, A.I.; Real, F.J.; Teva, F. Membrane filtration technologies applied to municipal secondary effluents for potential reuse. J. Hazard. Mater. 2010, 177, 390–398. [Google Scholar] [CrossRef] [PubMed]
  24. Dolar, D.; Vuković, A.; Asperger, D.; Kosutić, K. Effect of water matrices on removal of veterinary pharmaceuticals by nanofiltration and reverse osmosis membranes. J. Environ. Sci. 2011, 23, 1299–1307. [Google Scholar] [CrossRef]
  25. Ferrer-Polonio, E.; McCabe, M.; Mendoza-Roca, J.A.; Vincent-Vela, M.C. Fractionation of secondary effluents of wastewater treatment plants in view of the evaluation of membrane fouling in a further ultrafiltration step. J. Chem. Technol. Biotechnol. 2018, 93, 1495–1501. [Google Scholar] [CrossRef]
  26. Gupta, V.K.; Carrott, P.J.M.; Carrott, M.M.L.R.; Suhas. Low-Cost Adsorbents: Growing Approach to Wastewater Treatment—A Review. Crit. Rev. Environ. Sci. Technol. 2009, 39, 783–842. [Google Scholar] [CrossRef]
  27. Sanz, J.; Lombraña, J.I.; De Luis, A. Temperature-assisted UV/H2O2 oxidation of concentrated linear alkylbenzene sulphonate (LAS) solutions. Chem. Eng. J. 2013, 533–541. [Google Scholar] [CrossRef]
  28. Ferreiro, C.; Villota, N.; Lombraña, J.I.; Rivero, M.J.; Zúñiga, V.; Rituerto, J.M. Analysis of a Hybrid Suspended-Supported Photocatalytic Reactor for the Treatment of Wastewater Containing Benzothiazole and Aniline. Water 2019, 11, 337. [Google Scholar] [CrossRef] [Green Version]
  29. Villota, N.; Lomas, J.M.; Camarero, L.M. Effect of ultrasonic waves on the water turbidity during the oxidation of phenol. Formation of (hydro) peroxo complexes. Ultrason. Sonochem. 2017, 39, 439–445. [Google Scholar] [CrossRef]
  30. Benner, J.; Helbling, D.E.; Kohler, H.P.E.; Wittebol, J.; Kaiser, E.; Prasse, C.; Ternes, T.A.; Albers, C.N.; Aamand, J.; Horemans, B.; et al. Is biological treatment a viable alternative for micropollutant removal in drinking water treatment processes? Water Res. 2013, 47, 5955–5976. [Google Scholar] [CrossRef]
  31. Oller, I.; Malato, S.; Sánchez-Pérez, J. Combination of Advanced Oxidation Processes and biological treatments for wastewater decontamination—A review. Sci. Total Environ. 2011, 409, 4141–4166. [Google Scholar] [CrossRef]
  32. Uribe, I.O.; Mosquera-Corral, A.; Rodicio, J.L.; Esplugas, S. Advanced technologies for water treatment and reuse. AIChE J. 2015, 61, 3146–3158. [Google Scholar] [CrossRef]
  33. Mijangos, L.; Ziarrusta, H.; Olivares, M.; Zuloaga, O.; Moeder, M.; Etxebarria, N.; Prieto, A. Simultaneous determination of 41 multiclass organic pollutants in environmental waters by means of polyethersulfone microextraction followed by liquid chromatography-tandem mass spectrometry. Anal. Bioanal. Chem. 2018, 410, 615–632. [Google Scholar] [CrossRef] [PubMed]
  34. Association, A.P.H. Standard Methods for the Examination of Water & Wastewater; American Public Health Association: Washington, DC, USA, 2005; ISBN 978-0-87553-047-5. [Google Scholar]
  35. Bicudo, J.R.; Brown, T.; Waller, M.; Saint, W.; Summach, D. Addressing ammonia levels in the Grand River through nitrification upgrades at the Kitchener WWTP. Influents 2016, 11, 54–57. [Google Scholar]
  36. Mijangos, L.; Ziarrusta, H.; Ros, O.; Kortazar, L.; Fernández, L.A.; Olivares, M.; Zuloaga, O.; Prieto, A.; Etxebarria, N. Occurrence of emerging pollutants in estuaries of the Basque Country: Analysis of sources and distribution, and assessment of the environmental risk. Water Res. 2018, 147, 152–163. [Google Scholar] [CrossRef] [PubMed]
  37. ECHA. CoRAP List of Substances. Available online: https://echa.europa.eu/information-on-chemicals/evaluation/community-rolling-action-plan/corap-list-of-substances (accessed on 2 July 2019).
  38. De Luis, A.M.; Lombraña, J.I.; Menéndez, A.; Sanz, J. Analysis of the Toxicity of Phenol Solutions Treated with H2O2/UV and H2O2/Fe Oxidative Systems. Ind. Eng. Chem. Res. 2011, 50, 1928–1937. [Google Scholar] [CrossRef]
  39. García-Becerra, F.Y.; Ortiz, I. Biodegradation of Emerging Organic Micropollutants in Nonconventional Biological Wastewater Treatment: A Critical Review. Environ. Eng. Sci. 2018, 35, 1012–1036. [Google Scholar] [CrossRef]
  40. Behera, S.K.; Kim, H.W.; Oh, J.E.; Park, H.S. Occurrence and removal of antibiotics, hormones and several other pharmaceuticals in wastewater treatment plants of the largest industrial city of Korea. Sci. Total Environ. 2011, 409, 4351–4360. [Google Scholar] [CrossRef]
  41. Zhang, Y.; Geißen, S.U.; Gal, C. Carbamazepine and diclofenac: Removal in wastewater treatment plants and occurrence in water bodies. Chemosphere 2008, 73, 1151–1161. [Google Scholar] [CrossRef]
  42. Gómez, M.; Bueno, M.M.; Lacorte, S.; Fernández-Alba, A.; Agüera, A. Pilot survey monitoring pharmaceuticals and related compounds in a sewage treatment plant located on the Mediterranean coast. Chemosphere 2007, 66, 993–1002. [Google Scholar] [CrossRef]
  43. Kasprzyk-Hordern, B.; Dinsdale, R.M.; Guwy, A.J. The removal of pharmaceuticals, personal care products, endocrine disruptors and illicit drugs during wastewater treatment and its impact on the quality of receiving waters. Water Res. 2009, 43, 363–380. [Google Scholar] [CrossRef]
  44. Sui, Q.; Huang, J.; Deng, S.; Yu, G.; Fan, Q. Occurrence and removal of pharmaceuticals, caffeine and DEET in wastewater treatment plants of Beijing, China. Water Res. 2010, 44, 417–426. [Google Scholar] [CrossRef]
  45. Acero, J.L.; Benitez, F.J.; Teva, F.; Leal, A.I. Retention of emerging micropollutants from UP water and a municipal secondary effluent by ultrafiltration and nanofiltration. Chem. Eng. J. 2010, 163, 264–272. [Google Scholar] [CrossRef]
  46. Yoon, Y.; Westerhoff, P.; Snyder, S.A.; Wert, E.C.; Yoon, J. Removal of endocrine disrupting compounds and pharmaceuticals by nanofiltration and ultrafiltration membranes. Desalination 2007, 202, 16–23. [Google Scholar] [CrossRef]
  47. Hendricks, D. Fundamentals of Water Treatment Unit Processes: Physical, Chemical, and Biological, 1st ed.; CRC Press: Boca Ratón, FL, USA, 2010. [Google Scholar]
  48. Kimura, K.; Amy, G.; Drewes, J.; Watanabe, Y. Adsorption of hydrophobic compounds onto NF/RO membranes: An artifact leading to overestimation of rejection. J. Membr. Sci. 2003, 221, 89–101. [Google Scholar] [CrossRef]
Figure 1. Scheme of the assembly of the different treatments in this work with specification of sampling points: biological process (BIO) influent (1), ultrafiltration (UF) influent (2) and UF effluent (3).
Sustainability 12 00725 g001
Figure 2. Concentration in the influent of the biological treatment at the different sampling hours of: (a) Ammonium; (b) certain representative emerging pollutants.
Sustainability 12 00725 g002
Figure 3. Average removal rates in the biological treatment for: (a) Four representative emerging pollutants at different hours; and (b) every emerging pollutant (with all samples).
Sustainability 12 00725 g003
Figure 4. Average removal rates in continuous ultrafiltration (c-UF) treatment for: (a) Four selected emerging pollutants at different hours; (b) every emerging pollutant (with all samples).
Sustainability 12 00725 g004
Figure 5. c-UF removal yields as a function of the permeate concentration for the emerging contaminants studied at: (a) low-, (b) medium-, and (c) high-concentration variability. Percentage average yields (values higher 10%) of each pollutant are given in brackets in the insets of the graphs. Values in the lower part of the graph correspond to yields below 0.1%.
Sustainability 12 00725 g005
Figure 6. Variation of the equilibrium adsorption capacity: original (q) and effective (q*), depending on the concentration for three selected CEC: (a) amitriptyline, (b) losartan, and (c) sulfamethoxazole.
Sustainability 12 00725 g006
Table 1. Name, CAS Registry Number and principal use of the 39 contaminants of emerging concern (CEC) studied [37].
ApplicationMicropollutantCAS Registry NumberProperties of Concern (European Chemicals Agency, ECHA)
Food additives
Acesulfame55589-62-3
Caffeine58-08-2
Methylparaben99-76-3Possibly endocrine disrupting
Sucralose56038-13-2
Herbicides
Atrazine1912-24-9 Skin sensitizing
Diuron330-54-1Possibly carcinogenic
Possibly endocrine disrupting
Substance included in the Community Rolling Action Plan (CoRAP)
Isoproturon34123-59-6Possibly carcinogenic
Simasine122-34-9Possibly carcinogenic
Industrial additives
2-hydroxybenzothiazole934-34-9
Perfluorooctanesulfonamide (PFOSA)754-91-6
Perfluoro-n-nonanoic acid (PFNA)375-95-1Possibly carcinogenic
Toxic to reproduction
Persistent, bioaccumulative and toxic
Substance of very high concern (SVHC) and included in the candidate list
Potassium nonafluoro-1-butanesulfonate29420-49-3
Potassium perfluoro-1-octanesulfonate (PFOS)2795-39-3Possibly carcinogenic
Toxic to reproduction
Medicaments
Acetaminophen103-90-2
Amitriptyline hydrochloride549-18-8Skin sensitizing
Respiratory sensitizing
Bezafibrate41859-67-0
Carbamazepine298-46-4Skin sensitizing
Respiratory sensitizing
Ciprofloxacin85721-33-1
Clofibric acid882-09-7
Diclofenac15307-86-5
Eprosartan mesylate144143-96-4
Genistein446-72-0
Genistin529-59-9
Glycitin40246-10-4
Imipramine50-49-7
Irbesartan138402-11-6Toxic to reproduction
Ketoprofen22071-15-4
Losartan Free Acid114798-26-4Toxic to reproduction
Skin sensitizing
Norfloxacin70458-96-7
Phenytoin57-41-0
Progesterone57-83-0Carcinogenic
Toxic to reproduction
Propranolol525-66-6
Sulfadiazine68-35-9Skin sensitizing
Respiratory sensitising
Sulfamethoxazole723-46-6Carcinogenic
Skin sensitizing
Telmisartan144701-48-4
Testosterone58-22-0
Trimethoprim738-70-5
Valsartan137862-53-4
Personal Care
Butylparaben94-26-8
Table 2. CEC analyzed at different hours in the influent of the biological treatment.
MicropollutantConcentration (ng/L)
H1H2H3H4
Acetaminophen50,421 ± 346048,352 ± 191954,557 ± 1040112,762 ± 4788
Caffeine21,493 ± 135018,835 ± 38216,047 ± 65531,704 ± 1309
Valsartan17,340 ± 24510,072 ± 122012,143 ± 12030,979 ± 1499
Sulfamethoxazole8828 ± 1192189 ± 62135 ± 1283 ± 4
Trimethoprim5581 ± 116851 ± 276 ± 182 ± 1
Methylparaben5139 ± 1192937 ± 1002094 ± 678400 ± 250
Acesulfame5041 ± 5814102 ± 1815851 ± 33225,092 ± 1808
Losartan free acid1267 ± 38917 ± 1681056 ± 41723 ± 125
Genistein1191 ± 331198 ± 208739 ± 971184 ± 131
Eprosartan mesylate1049 ± 10799 ± 108874 ± 291588 ± 94
Ketoprofen865 ± 99643 ± 27579 ± 421117 ± 86
Irbesartan829 ± 4714 ± 61822 ± 241070 ± 42
Diclofenac766 ± 18692 ± 10582 ± 17458 ± 10
Telmisartan593 ± 1704 ± 301386 ± 1291476 ± 67
Norfloxacin452 ± 3363 ± 5233 ± 15365 ± 10
2-hydroxybenzothiazole422 ± 9240 ± 3219 ± 27271 ± 14
Progesterone243 ± 8205 ± 1276 ± 33
Bezafibrate207 ± 5199 ± 10272 ± 18474 ± 22
Perfluorosulfonamide203 ± 11148 ± 22196 ± 12302 ± 27
Diuron174 ± 1147 ± 857 ± 176 ± 2
Carbamazepine116 ± 186 ± 290 ± 2120 ± 2
Testosterone107 ± 474 ± 761 ± 2101 ± 6
Ciprofloxacin79 ± 563 ± 251 ± 169 ± 3
Amitriptyline68 ± 168 ± 271 ± 3112 ± 3
Phenytoin45 ± 241 ± 136 ± 649 ± 4
Propranolol24 ± 123 ± 523 ± 217 ± 2
Isoproturon3 ± 12 ± 12 ± 12 ± 1
Sampling hour at H1—(9:00 am); H2—(10:00 am); H3—(11:00 am); and, H4—(12:00 am).
Table 3. Adsorption parameters of the c-UF filtration membrane, depending on the concentration, for selected pollutants.
MicropollutantC0, ng/Lη, %Cp, ng/LKF, (ng/g) (L/ng)nFq, ng/gkads,
g (ng min)−1
qirr, ng/gq*, ng/gFq
Amitriptyline
5168.6162.40 × 10−13.811.90.03.80.000
6867.6222.40 × 10−15.311.90.25.00.044
6966.7232.40 × 10−15.511.90.55.00.086
6352.4302.40 × 10−17.211.93.63.60.497
Caffeine
9027.065.56.80 × 10−24.50.2951.72.80.385
11624.0886.80 × 10−26.00.2952.93.20.476
1070.11076.80 × 10−27.30.2957.30.00.996
14538.0906.80 × 10−26.20.2950.06.10.006
Telmisartan
5975.75638.15 × 10−245.90.35042.13.80.917
62720.74978.15 × 10−240.50.35026.214.30.647
69026.25098.15 × 10−241.50.35021.619.90.520
74942.64308.15 × 10−235.00.3500.035.00.000
Losartan
26215.62213.40 × 10−27.50.0852.84.70.370
37523.22883.40 × 10−29.80.0850.09.80.001
3090.13093.40 × 10−210.50.08510.40.10.989
3200.13203.40 × 10−210.90.08510.80.10.990
Norfloxacin
1060.11064.90 × 10−25.20.0565.10.10.986
16322.11274.90 × 10−26.20.0561.94.30.309
20529.81444.90 × 10−27.10.0560.07.10.001
22030.122014.90 × 10−2107.80.056107.40.40.996
Sulfamethoxazole
920.1929.30 × 10−28.60.0568.50.10.992
13710.21239.30 × 10−211.40.0569.61.90.838
160845.88729.30 × 10−281.10.0560.081.10.000
25730.125709.30 × 10−2239.00.056238.50.50.998
C0—pollutant initial concentration; η—removal yield; CP—pollutant output concentration; KF—Freundlich constant; q—equilibrium adsorbed amount; kads—pseudo-second-order rate constant of adsorption; qirr—amount of adsorbed contaminant not eliminable; Fq—fouling factor.
Table 4. Results of the Microtox® toxicity assays obtained in the influent and in the effluent of the c-UF treatment.
UF InfluentUF Effluent
Sampling HourTU50Sampling HourTU50
H127.0 (± 5.2)H1< 1 (Not Toxic)
H251.7 (± 12.8)H2< 1 (Not Toxic)
H311.1 (± 4.5)H3< 1 (Not Toxic)
H438.2 (± 7.4)H4< 1 (Not Toxic)

