Article

Application of Water Poverty Index (WPI) in Spatial Analysis of Water Stress in Koshi River Basin, Nepal

1
Institute of Mountain Hazards and Environment, Chinese Academy of Sciences, Chengdu 610041, China
2
University of Chinese Academy of Sciences, Beijing 100049, China
3
College of Resources and Environment, University of Chinese Academy of Sciences, Beijing 100190, China
4
Chengdu Institute of Biology, Chinese Academy of Sciences, Chengdu 610041, China
5
Institute of Urban Environment, Chinese Academy of Sciences, Xiamen 361021, China
*
Author to whom correspondence should be addressed.
Sustainability 2020, 12(2), 727; https://0-doi-org.brum.beds.ac.uk/10.3390/su12020727
Submission received: 4 December 2019 / Revised: 5 January 2020 / Accepted: 16 January 2020 / Published: 19 January 2020

Abstract

:
Water and poverty interface is strongly interconnected and a robust assessment of water stress is crucial to identify needy areas and develop appropriate intervention for poverty reduction. Water Poverty Index (WPI) provides an interdisciplinary tool to assess water stress by linking physical estimates of water availability with socio-economic drivers of poverty. This study presents an application of Water Poverty Index (WPI) to estimate and compare the level of water stress in 27 districts of Koshi River Basin in Nepal. Based on data availability, relevance to the study area and review of literatures, 12 indicators were selected under five key components outlined by WPI. The study result shows medium-low degree (WPI = 54.4) of water poverty in the Koshi River Basin in Nepal. The WPI score varies widely (from 49.75 to 69.29) along the districts and it was found that districts in Tarai regions and urban areas were more water stressed compared to the districts in mid-hill and high-hill regions. Priorities for intervention must be given to the districts in Tarai regions and urban areas with a low WPI score, explicitly on the sector regarding access to water and sanitation to address water poverty in the basin.

1. Introduction

The water and poverty interface is strongly interlinked [1,2]. Adequate access to water is a highly relevant issue while addressing the problem of poverty, as it is impossible to eradicate extreme poverty without proper allocation and access to water [3]. The United Nations 2030 Agenda for Sustainable Development explicitly sets clean water and sanitation as one of its Sustainable Development Goals (SDGs). It recognizes safe drinking water, effective sanitation, and good hygiene (WASH) as an end in itself and as a driver of development directly impacting other SDGs, including nutrition, health, education and gender equality [4]. Thus, access to safe water is essential but not a sufficient condition for extreme poverty eradication [5].
Global water stress and water needs of the poorest communities are receiving increasingly more attention as water is seen as one of the most critically stressed resources [3]. Water resource management is becoming an increasingly challenging issue because of decreasing trends in water availability and increasing demands [6]. Appropriate assessment of water stress is crucial to determine the needy areas and develop suitable management policy and effective interventions. Many efforts have been made in recent years into the development of methods and alternatives from many disciplinary perspectives to quantify water stress at community, subnational and national level [3,7]. Tools such as Falkenmark index [8], Water Resource Vulnerability Index [9] and Water availability index [10] are being used to assess water stress using unidimensional indicators [11]. Water Poverty Index (WPI), developed by Sullivan [12], provides multidimensional tools to assess water poverty. Index-based analysis such as WPI is an important method for identifying the factors influencing poverty, ranking the extent of stress, and developing appropriate interventions in needy areas [13].
Water Poverty Index (WPI) is an interdisciplinary indicator to assess water stress and scarcity, linking physical estimates of water availability with the socioeconomic drivers of poverty [7]. The benefit of using WPI as an indicator of water stress is that it condenses several measures of influencing components ranging from physical to socio-economic factors in a single numerical representation. WPI indicates the status, availability, variability and quality of the water resources at community, subnational or national level, contributing towards effective water management at the water stressed zone [14]. Although WPI was designed as a holistic water resource assessment tool to use primarily at the community level on a site-specific basis, it can, however, be applied at different spatial scales to suit different needs [3].
The objective of this study is to provide an outlook on an application of WPI to estimate the state of the water crisis at subnational level for 27 districts of Koshi River Basin in Eastern Nepal. Rather than to contribute to the conceptual or methodological advancement of WPI, we use WPI as a tool to analyze and visually represent the status of water availability in Koshi basin, Nepal. This study uses five components: water resource (R), use (U), access (A), capacity (C) and environmental quality (E) as outlined by WPI [3,15]. Indicators for each component were selected on the basis of relevance to the local context, data availability and review of relevant literatures.
This study is significant in two major ways. Firstly, this study provides important background information that can be used as a reference for future scientific studies for temporal comparison in Koshi River Basin. Secondly, the findings of the study will be useful tools for development planners to understand and identify major livelihood constraints at the spatial scale. The overall findings of this study will help assist scientists, researchers, politicians, policy makers, investors, development workers and donors to better understand the situation of water poverty at the regional scale at Koshi River Basin, and provide background information which can be used as a guideline for policy formation to promote sustainable livelihood through enhanced adaptation mechanisms and improved water management practices in rural communities.

Water Poverty Assessment in Nepal

Due to inadequate water supply, increasing agricultural and domestic demand, decreasing water quality and low economic growth, water poverty in Nepal is becoming increasingly high [11]. High rainfall variability [16,17] and poor institutional capacity [18] has contributed significantly to water poverty in the context of Nepal.
An international comparison of water poverty conducted by Lawrence et al. [19] described Nepal as a medium water stressed country (WPI = 54.4). However, very little work has been done in quantitative assessment of water poverty at the subnational level in Nepal and very few researches have used WPI as a tool for assessment of water poverty. WPI was used to estimate water poverty at upper Bagmati River Basin by [14] (pp. 12–15) and their result shows upper Bagmati River Basin as medium-low water poor with WPI ranging from 54.63 to 77.95. Pandey et al. [5] (pp. 2486–2487) conducted a comparative study of water poverty in five medium-sized river basins in Nepal and has recommended needy areas and instruments for interventions. Similarly, Manandhar, S.; Pandey, V.P.; Kazama, F [1] (pp. 99–102) conducted study on the application of WPI with a case study of Kali Gandaki River Basin (KGRB) in Nepal. Their result shows wide variation of WPI (from 37.1 to 56.5) within the KGRB. Although no clear trend was observed at spatial scale, [1] (p. 101) found KGRB with high scores for resource and access components. Panthi, Khatiwada, Shrestha and Dahal [11] (p. 3) used WPI to study water poverty in the context of climate change at different elevation zones of Karnali River Basin in western Nepal. They found that among three elevation zones, mid-hill districts had the highest water poverty and emphasized that water resource availability was not a problem in the basin. However, effective use and access to water was a primary concern at Karnali River Basin in Nepal. Water poverty analysis and mapping conducted by [18] (pp. 20–21) in Indrawati River Basin (one of the sub-basins of Koshi River Basin) concluded that the majority of the population had poor access to water with WPI score 52.5. The WPI has been used at the basin scale in Jhikhu Khola and the Yarsha Khola of Koshi River Basin in Nepal by [20] and WPI value was estimated to be 59.2 for the Jhikhu catchment and 63.2 for the Yarsha catchment in mid-hill districts of Nepal [3,18,20].
Due to poor access to water resources, harsh topography and poor government policy, the population in sub-basins and catchment areas of Koshi River Basin were found to be at a large risk of impacts from changing temperature and rainfall patterns [20,21,22,23]. However, district level comparison of water poverty in Koshi River Basin has not been conducted.

2. Materials and Methods
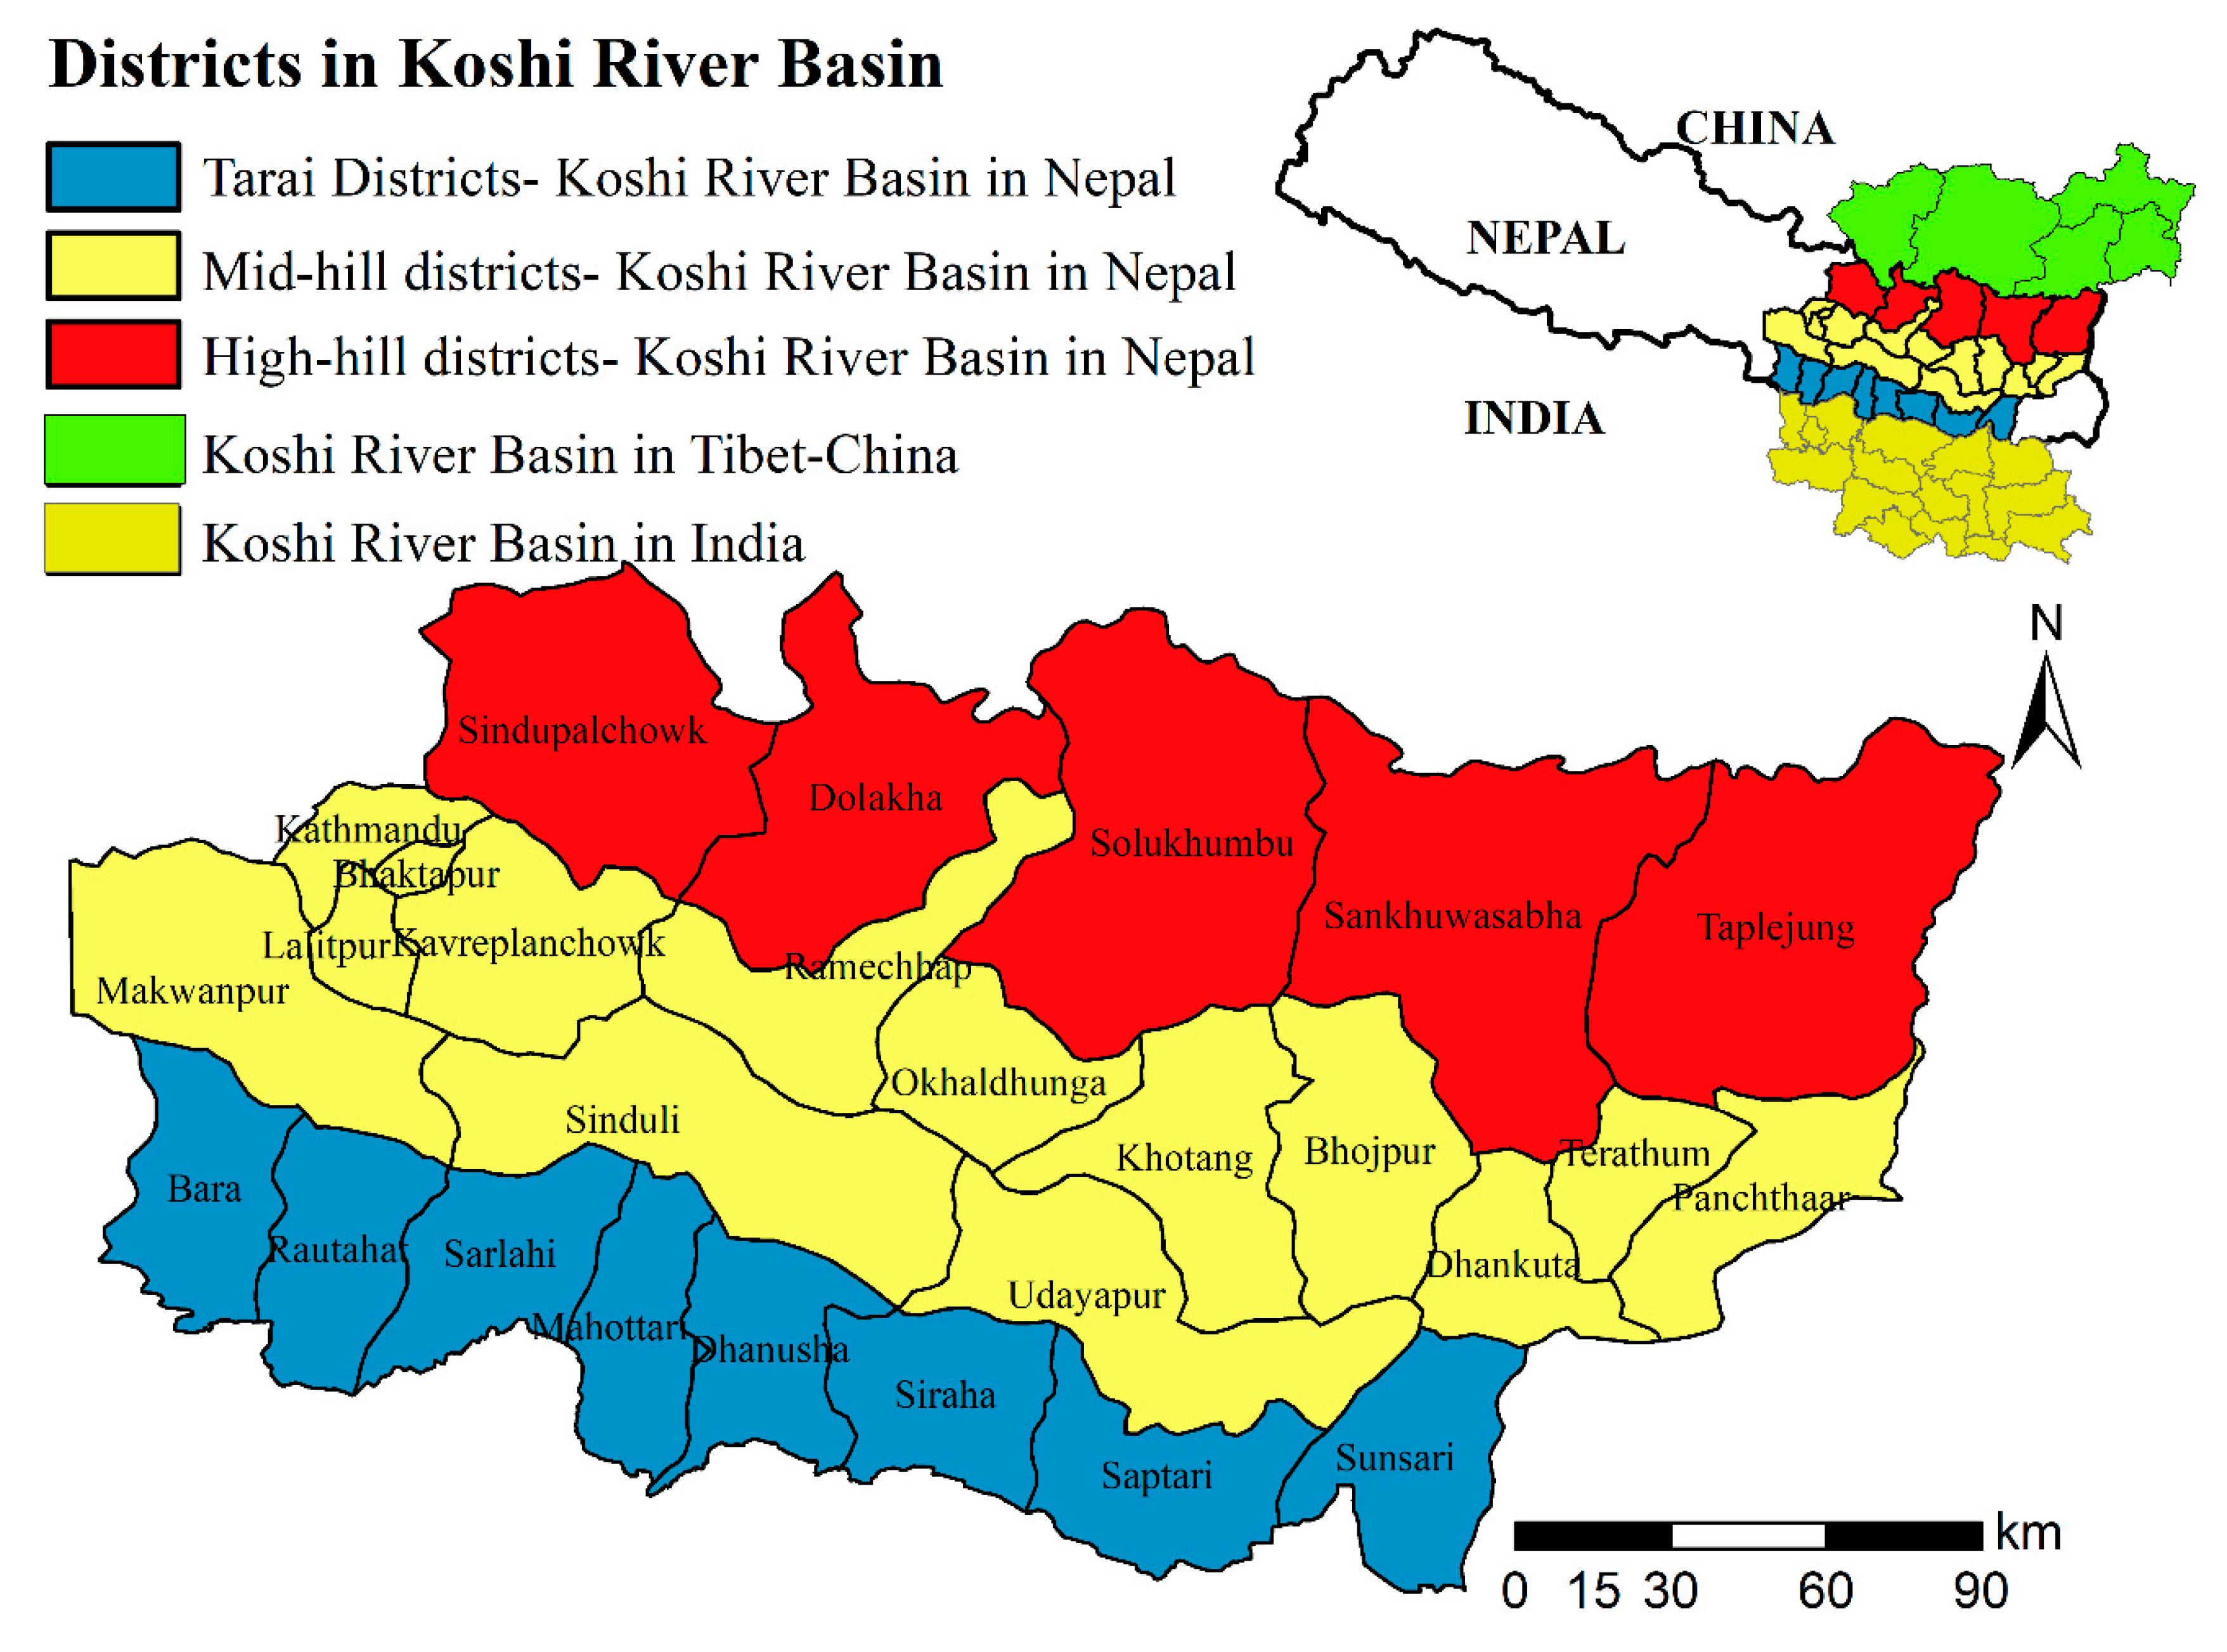
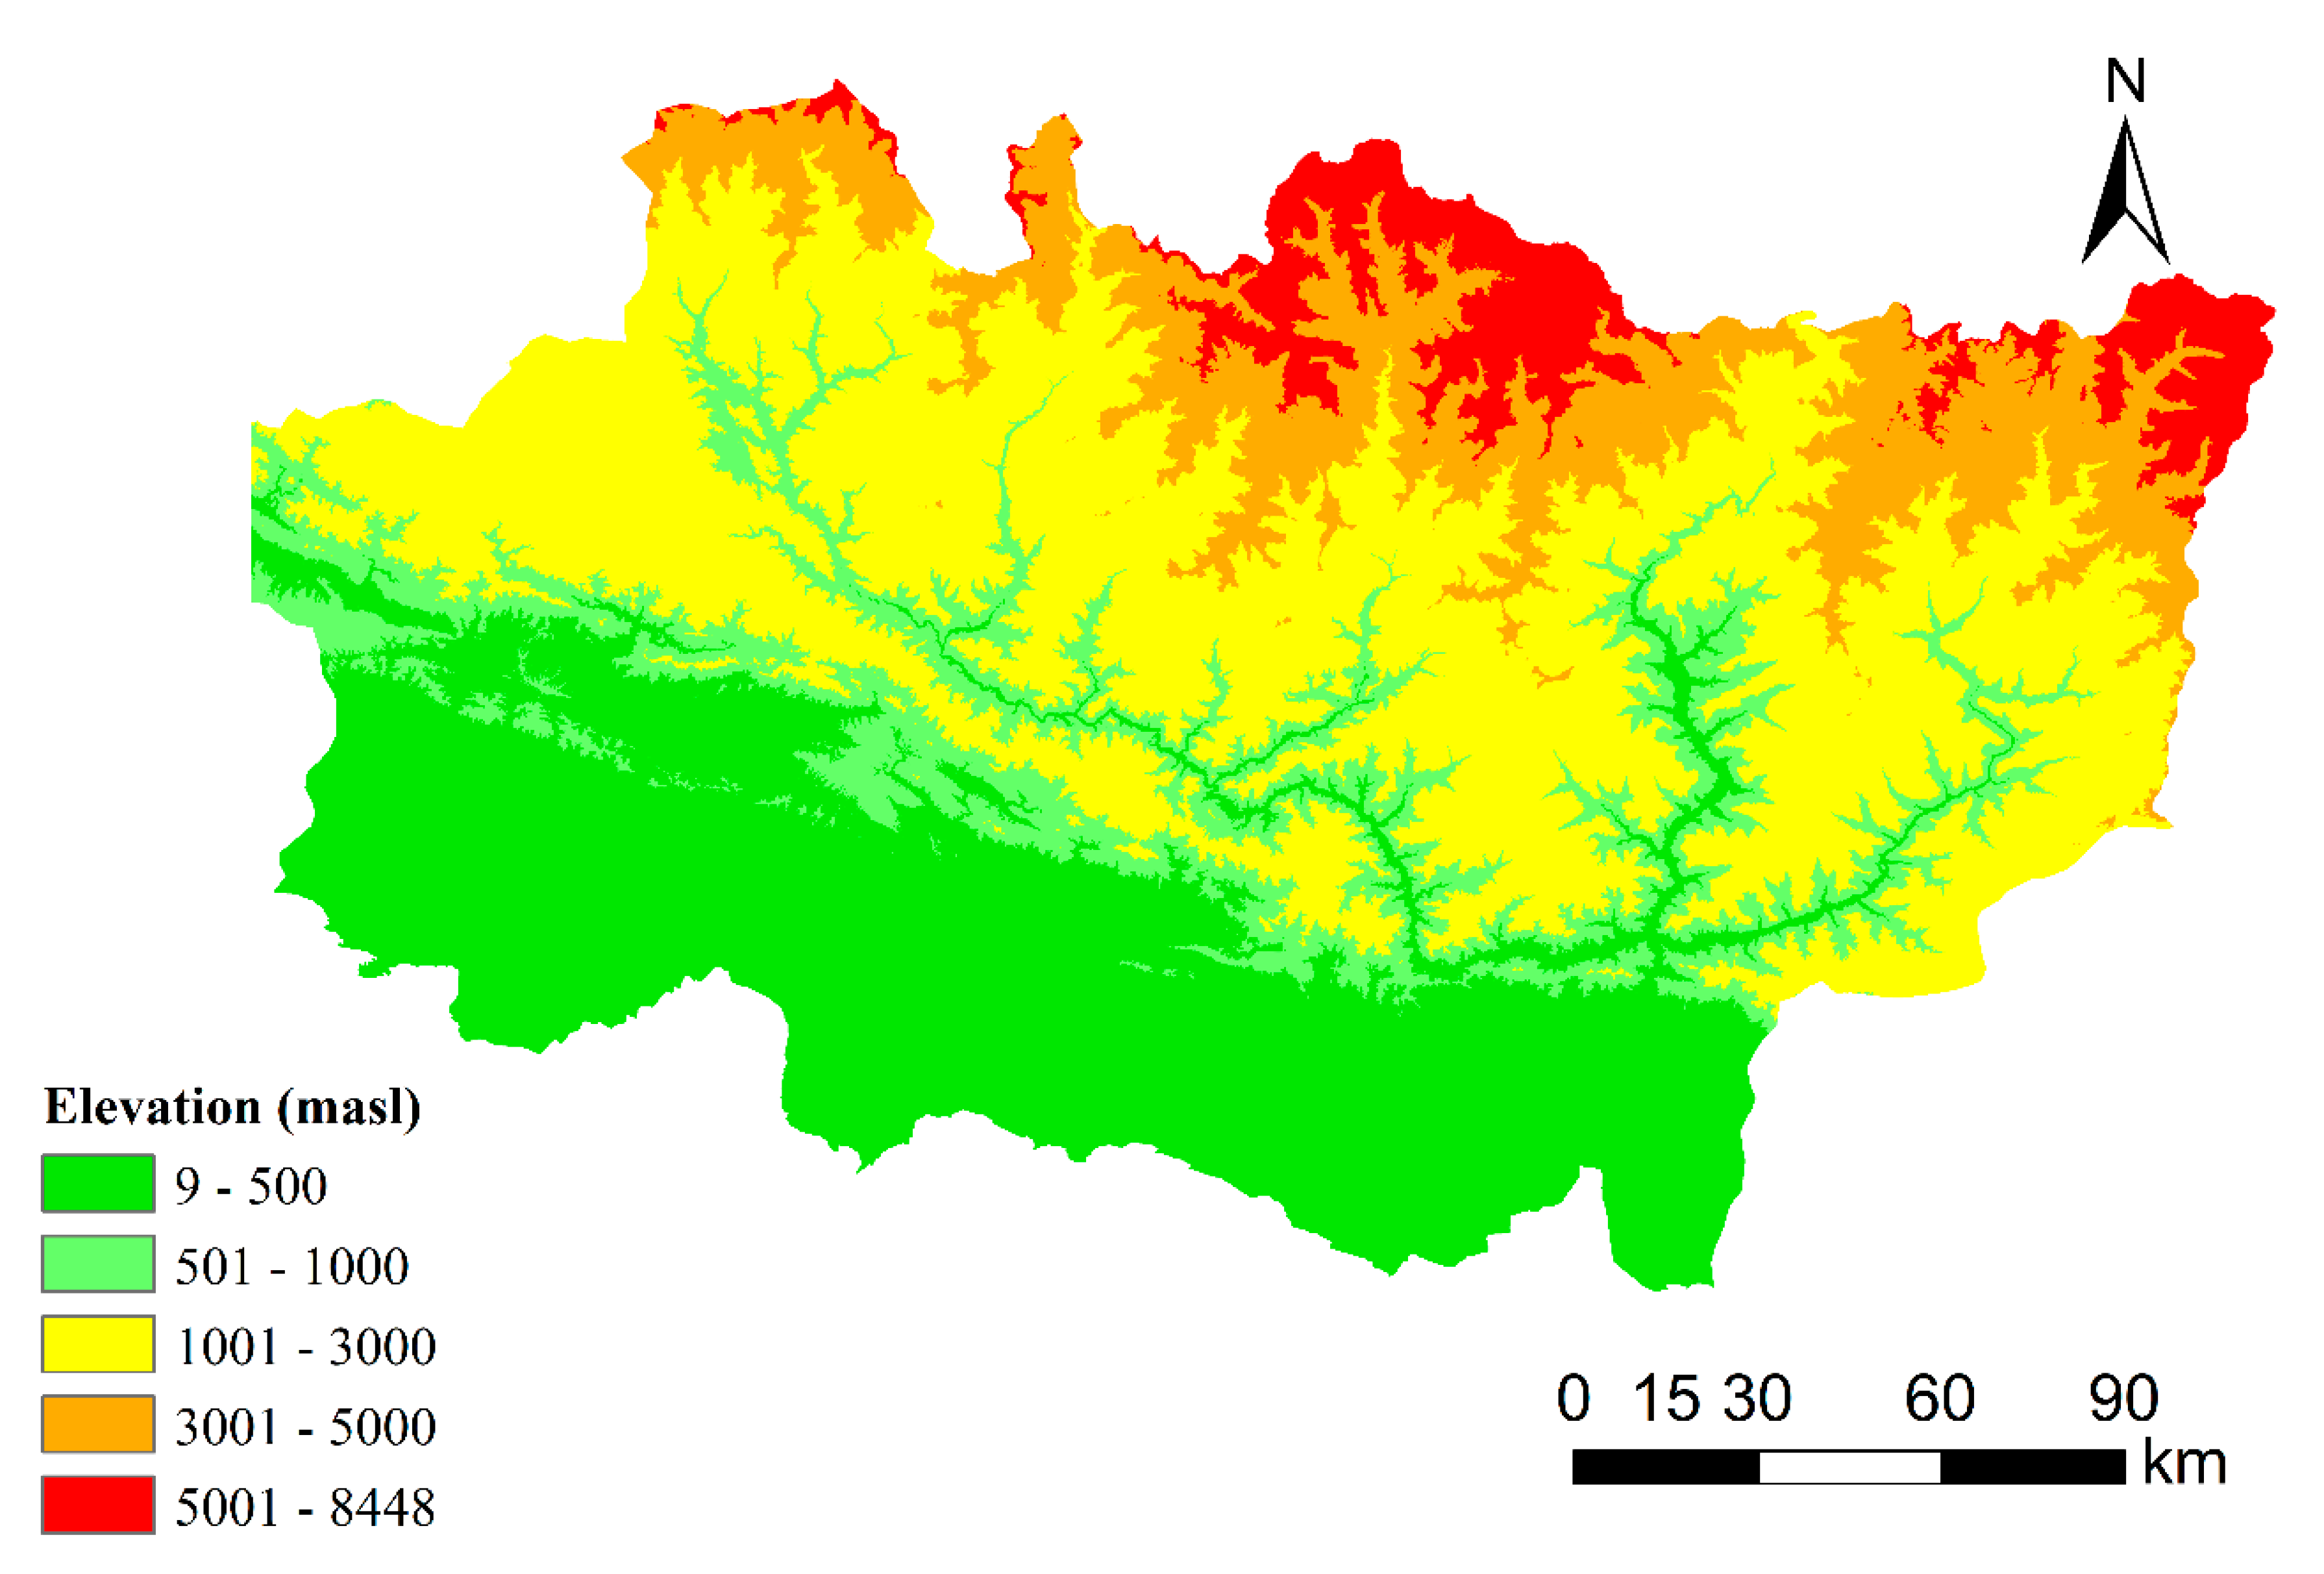
2.1. Study Area

Despite being one of the richest countries in water resources with more than 2.27% of global fresh water, Nepal is ranked among one of the top countries with a poor drinking water system [24]. Koshi River Basin is one of the three snow-fed watersheds in Nepal and drains around 71,500 km2 of area in Tibet, Nepal and North Bihar [25]. Koshi is also the largest river basin in Nepal and drains around 30,000 km2 area from the agricultural low lands of Tarai plains in the south (from 65 masl) to the Himalayas in the North (over 8000 masl) [25,26]. It includes 27 districts of Eastern Nepal.
High contrasts in topographic features and climatic conditions along the elevation gradient of the basin have contributed to a distinct range of ecosystems, agro-ecology, diverse livelihood and socio-economic systems. The region bears the impacts of rapidly changing ecosystems and livelihood processes [25]. The ongoing change in climatic regime is expected to change the hydrological cycle along the Koshi basin, altering the magnitude, time, intensity of the region´s prevailing precipitation as well as affecting evaporation [25]. This change could evidently translate into wetter wet seasons and drier dry seasons, posing challenges to the ecosystem and livelihood of the people inhabiting the Koshi basin. Water stress during the dry season and frequent floods during the monsoons are the prevalent challenges in Koshi Basin [25,27]. However, this study focuses entirely upon the status of water availability and stress in 27 districts of Koshi Basin in Nepal, based on the framework provided by WPI. In this study, 27 districts in Koshi Basin were divided into 3 agro-ecological categories based upon topographic features: Tarai, mid-hill and high-hill districts as presented in Figure 1. The elevation map is presented in Appendix (Figure A1). Tarai region falls in the southern belt of the basin bordering India and it is characterized by flat topography, sub-tropical climate, higher agricultural productivity [28], relatively better road connectivity and infrastructure development contributing to higher population density [29]. Mid-hill districts are characterized by sub-tropical to temperate climate with rugged terrain, sloppy hills and bio-physically and socio-economically complex diversities [30]. The high-hill districts fall under the lap of the high Himalayan range with hostile climate (cool temperate) and extremely rugged terrain with agglomerated settlements and low population density [31].

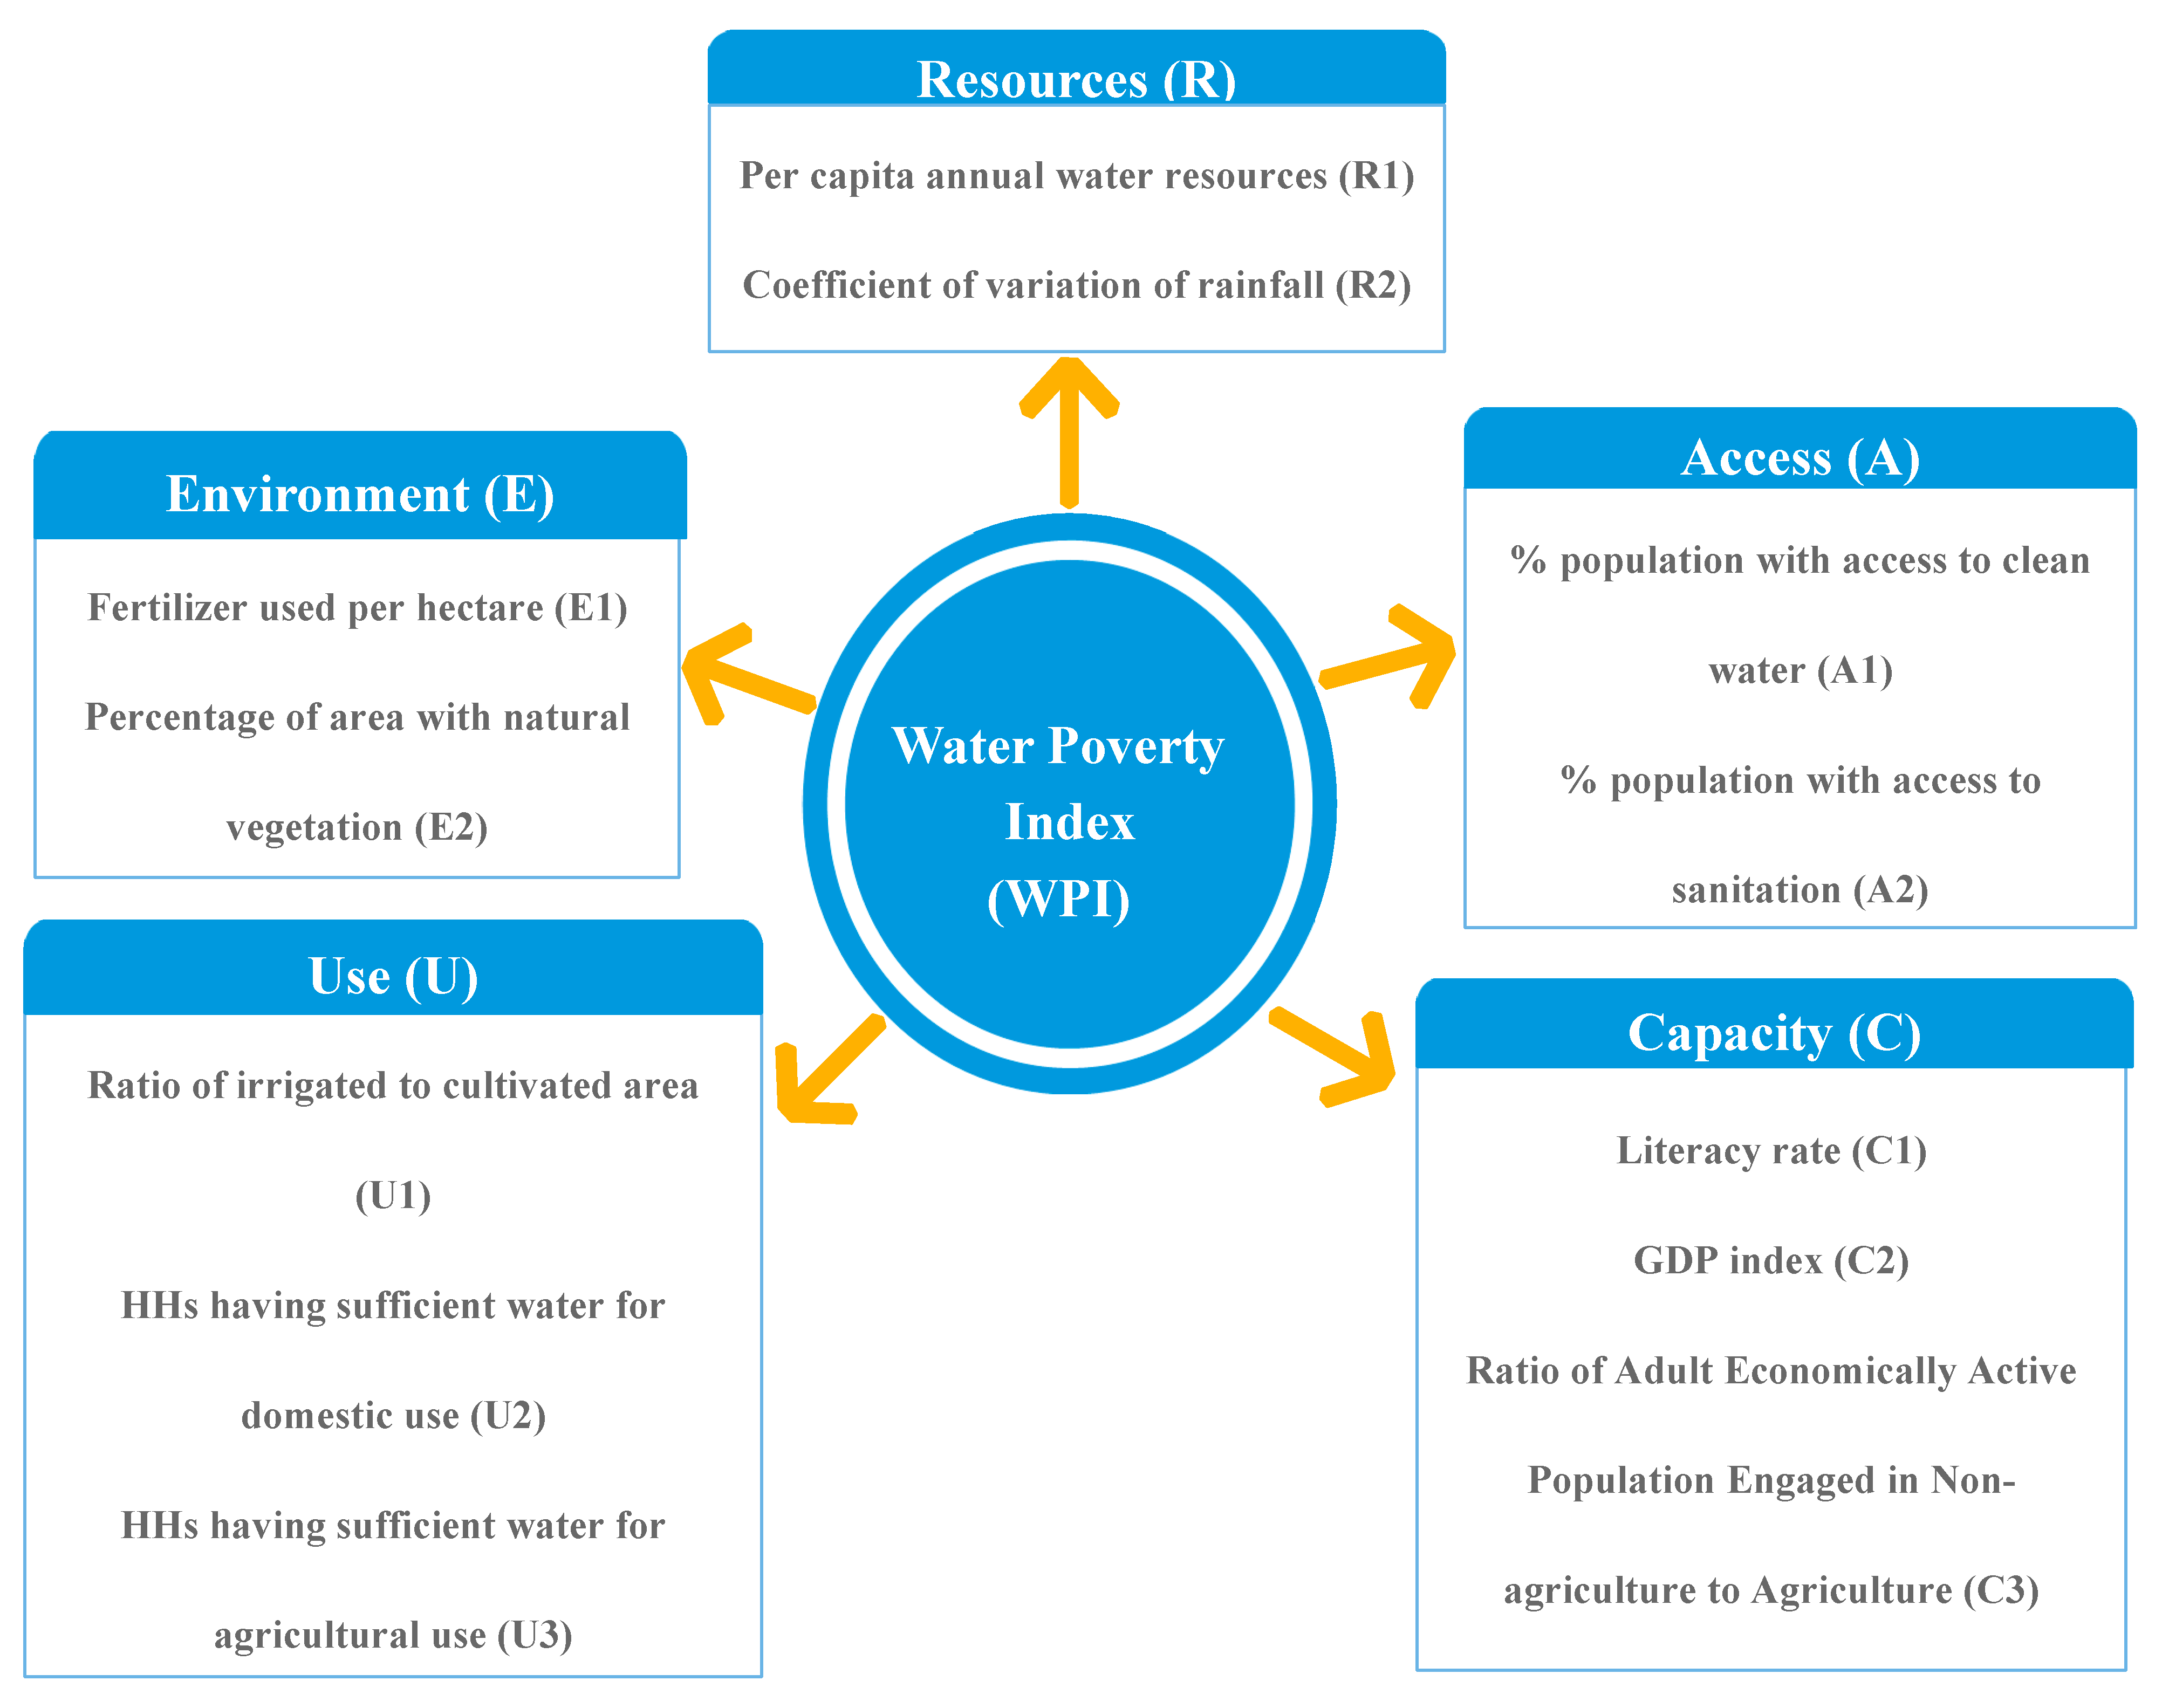
2.2. Water Poverty Index (WPI) Framework

WPI provides an interdisciplinary measure that links affluence of a household with water availability indicating the degree of stress that water scarcity possesses on a study area [19]. While calculating WPI, it is crucial to select suitable indicators that represent several components of water availability and stress. Several studies suggest that indicators to represent water stress are location specific and should be chosen carefully [3,5,15,32]. It requires careful study of the local context and data availability while selecting the indicators for WPI [1,3].
Methodology of this study is based on a WPI framework developed by [3,15,32]. WPI considers five components that integrate physical availability of water with socio-economic and environmental factors: Resource (R), Access (A), Use (U), Capacity (C) and Environment (E) [5]. The Resource component provides an assessment on availability and annual variability of the water resource in the study area [5,12,15]. Access indicates the access to adequate water and sanitation [12,15]. The Use component shows the water consumption at domestic and agricultural level [5,12,15]. The Capacity component depicts the socio-economic capacity of the population to manage water resource [5,12,15]. The Environmental component denotes the health of the watershed that influences water quality and resources [32]. While selecting indicators for the components of WPI, we have considered three major criteria: (1) availability of the data, (2) relevance to the local context and (3) review of relevant literatures. The WPI components and indicators used in this study are presented in Figure 2. The detailed descriptions of indicators and their relationship with WPI are summarized in Table 1.
Since the data collected for each indicator was measured in different scales, the composite index approach was applied to aggregate all indicators into a single comparable and dimensionless value. It was important to normalize the indicator value into a uniform and unidirectional index using thresholds, such that it will lie in the range of 0 to 100 (where, 0 is the most water stressed and 100 is the least water stressed situation) [5]. The standardization and calculation for each indicator of WPI is further discussed below.

2.3. Measurement Methods and Data Sources

2.3.1. Resource (R)

Availability and variability of the water resources in the district were considered as variables for resource components. Per capita annual water resources (m3/year) (R1) and Coefficient of variation (CV) of rainfall (R2) of the districts were selected as indicators for availability and variability, respectively. Since data for per capita water resources were not available on a district level of our study area, we applied specific discharge (discharge per unit drainage area) to estimate the amount of water resources. A similar approach was used by [1] while estimating water resources in Kali Gandaki River Basin (KGRB) in central Nepal. We used the specific discharge calculated by [35] at different locations of sub-basins in the Koshi River Basin, and the water resource at the district was estimated by multiplying the specific discharge of the sub-basin with the area of the respective district within the sub-basin. The estimated water resource of the district was further divided by the population of the district to calculate the per capital water availability (R1). It was standardized by using min-max approach, as shown in the Equation below, as used by [1,5,43]:
R1 = [(Xi − Xmin)/(Xmax − Xmin)] × 100
where, Xi is per capita annual water resources (m3/year) of the district i, and Xmin and Xmax are maximum and minimum values from all of the studied districts.
To calculate the variability of the rainfall in the districts of the study area, available rainfall data from 1979–2009 (30 years) for all stations within 27 districts was obtained from the Department of Hydrology and Meteorology (DHM), Nepal. Coefficient of variation (CV) of the rainfall (R2) was calculated as an indicator for variability of water availability. CV higher than 30% was considered a most vulnerable situation, as done by [1,5,43]. The following Equation was used for standardization:
R2 = [1 − (Xi/30)] × 100
where, Xi is CV of rainfall of district i, and R2 is considered 0 (most vulnerable), when Xi is greater than or equal to 30.

2.3.2. Access (A)

Access to safe water and sanitation were considered as variables for Access (A) component. Percentage of population with access to water (A1) and percentage of population with access to sanitation (A2) were used as the indicators for components. Data was obtained from the Nepal Population Census 2011, published by Central Bureau of Statistics (CBS), Nepal. The following equation was used to calculate indicator A1 and A2, and they are self-normalized in the scale of 0–100.
A1 = (Xwi/Xi) × 100
A2 = (Xsi/Xi) × 100
where, Xwi and Xsi are population with access to safe water and sanitation, respectively, and Xi is total population of the district i.

2.3.3. Use (U)

In the absence of district level data for domestic and agricultural water use, we have considered domestic and agricultural water sufficiency as indicators for the Use (U) component. Ratio of irrigated to cultivated area (U1), water sufficiency for domestic use (days/year) (U2) and water sufficiency for agricultural use (days/year) (U3) were used as indicators for Use (U) components. Data for irrigated land and cultivated area was acquired from the Ministry of Agriculture MoAD [38]. Data on domestic and agricultural water use was obtained from the Koshi Basin Information System of International Center for Integrated Mountain Development (ICIMOD) and district profiles of respective districts. The following Equations were used to calculate and normalize the value of U1, U2 and U3.
U1 = (Xai/Xi) × 100
U2 = (Xdi/365) × 100
U3 = (Xbi/365) × 100
where, Xai is irrigated area and Xi is total cultivated area of district i. Xdi and Xbi are number of days with sufficient water for domestic and agricultural use, respectively, for district i.

2.3.4. Capacity (C)

Literacy rate (C1), GDP index (C2) and Ratio of Adult Economically Active Population Engaged in Non-agriculture to Agriculture (C3) were selected as indicators for capacity component (C). Data on C1 and C2 were acquired from CBS [36] and data for C3 was obtained from the Koshi Basin Information System of ICIMOD. The Equations for calculating the indicators of C components are presented below:
C1 = (Xei/Xi) × 100
C2 = [Log(per capita income) − Log(min))/(Log(max) − Log(min)] × 100
C3 = (Xai/Xi) × 100
where, Xei and Xi are literate and total population in district I, respectively. While calculating C2 maximum and minimum values were set as $40,000 and $100 per year, respectively. Xai and Xi are total population engaged in non-agricultural employment and population engaged in agricultural employment, respectively.

2.3.5. Environment (E)

Fertilizer used per hectare (kg/hectare) (E1) and Percentage of area with natural vegetation (E2) were set are two indicators for the Environment (E) component of WPI. Data for fertilizer used were obtained from MoAD [39] and data on natural vegetation cover were calculated from the district profile from each district and further triangulated with the data from CBS [36]. Below are the Equations to calculate and normalize the indicators E1 and E2:
E1 = [((Xmax − Xi)/(Xmax − Xmin)] × 100
E2 = (Xvi/Xai) × 100
where, Xi is the amount of fertilizer used in the district i and Xmax and Xmin are maximum and minimum amount of fertilizer used among all 27 districts from the dataset. Among 27 districts in Koshi Basin, Kathmandu district has the highest fertilizer per hectare use (142.02 kg/hectare) and Panchthaar district has the lowest (0.016 kg/hectare) [36]. Xvi and Xai are area covered by vegetation and total area of the district i.

2.4. Weighting and WPI Calculation

We have assigned equal weights to all the indicators and components to calculate the final WPI. Assigning equal weights avoids subjectivity, bias and makes indexes more comparable, transparent to decision makers and stakeholders [5]. Despite its limitations, equal weight approach is popular while measuring WPI or other research including index (for e.g., [1,5,43]). Arbitrarily assigning random weights to different indicators or even statistically produced weights could produce questionable results, whereas acknowledging all components and indicators having equal contribution to overall WPI can be considered justifiable. However, a rigorous participatory approach including all stakeholders and experts’ judgements could be used to assign unequal weights to indicators while calculating WPI. The Equation presented below was used to estimate the final WPI using the equal weighted approach:
WPI = (R + A + U + C + E)/5
where, R, A, U, C and E are values for Resource, Access, Use, Capacity and Environment components of WPI. The values for each component are calculated as an average value of its associated indicators.

2.5. Classifying Final WPI Score

The final WPI and components’ score range from 0 to 100 (0 being the most water stressed and 100 being the least water stressed situation). After calculating the final WPI score, all districts have been classified into five different categories based on level of WPI score. Five categories have been identified by classifying 27 districts into five equal interval classes between the range of highest and lowest WPI score. The same approach was used to classify districts into five categories under different WPI components.

3. Results

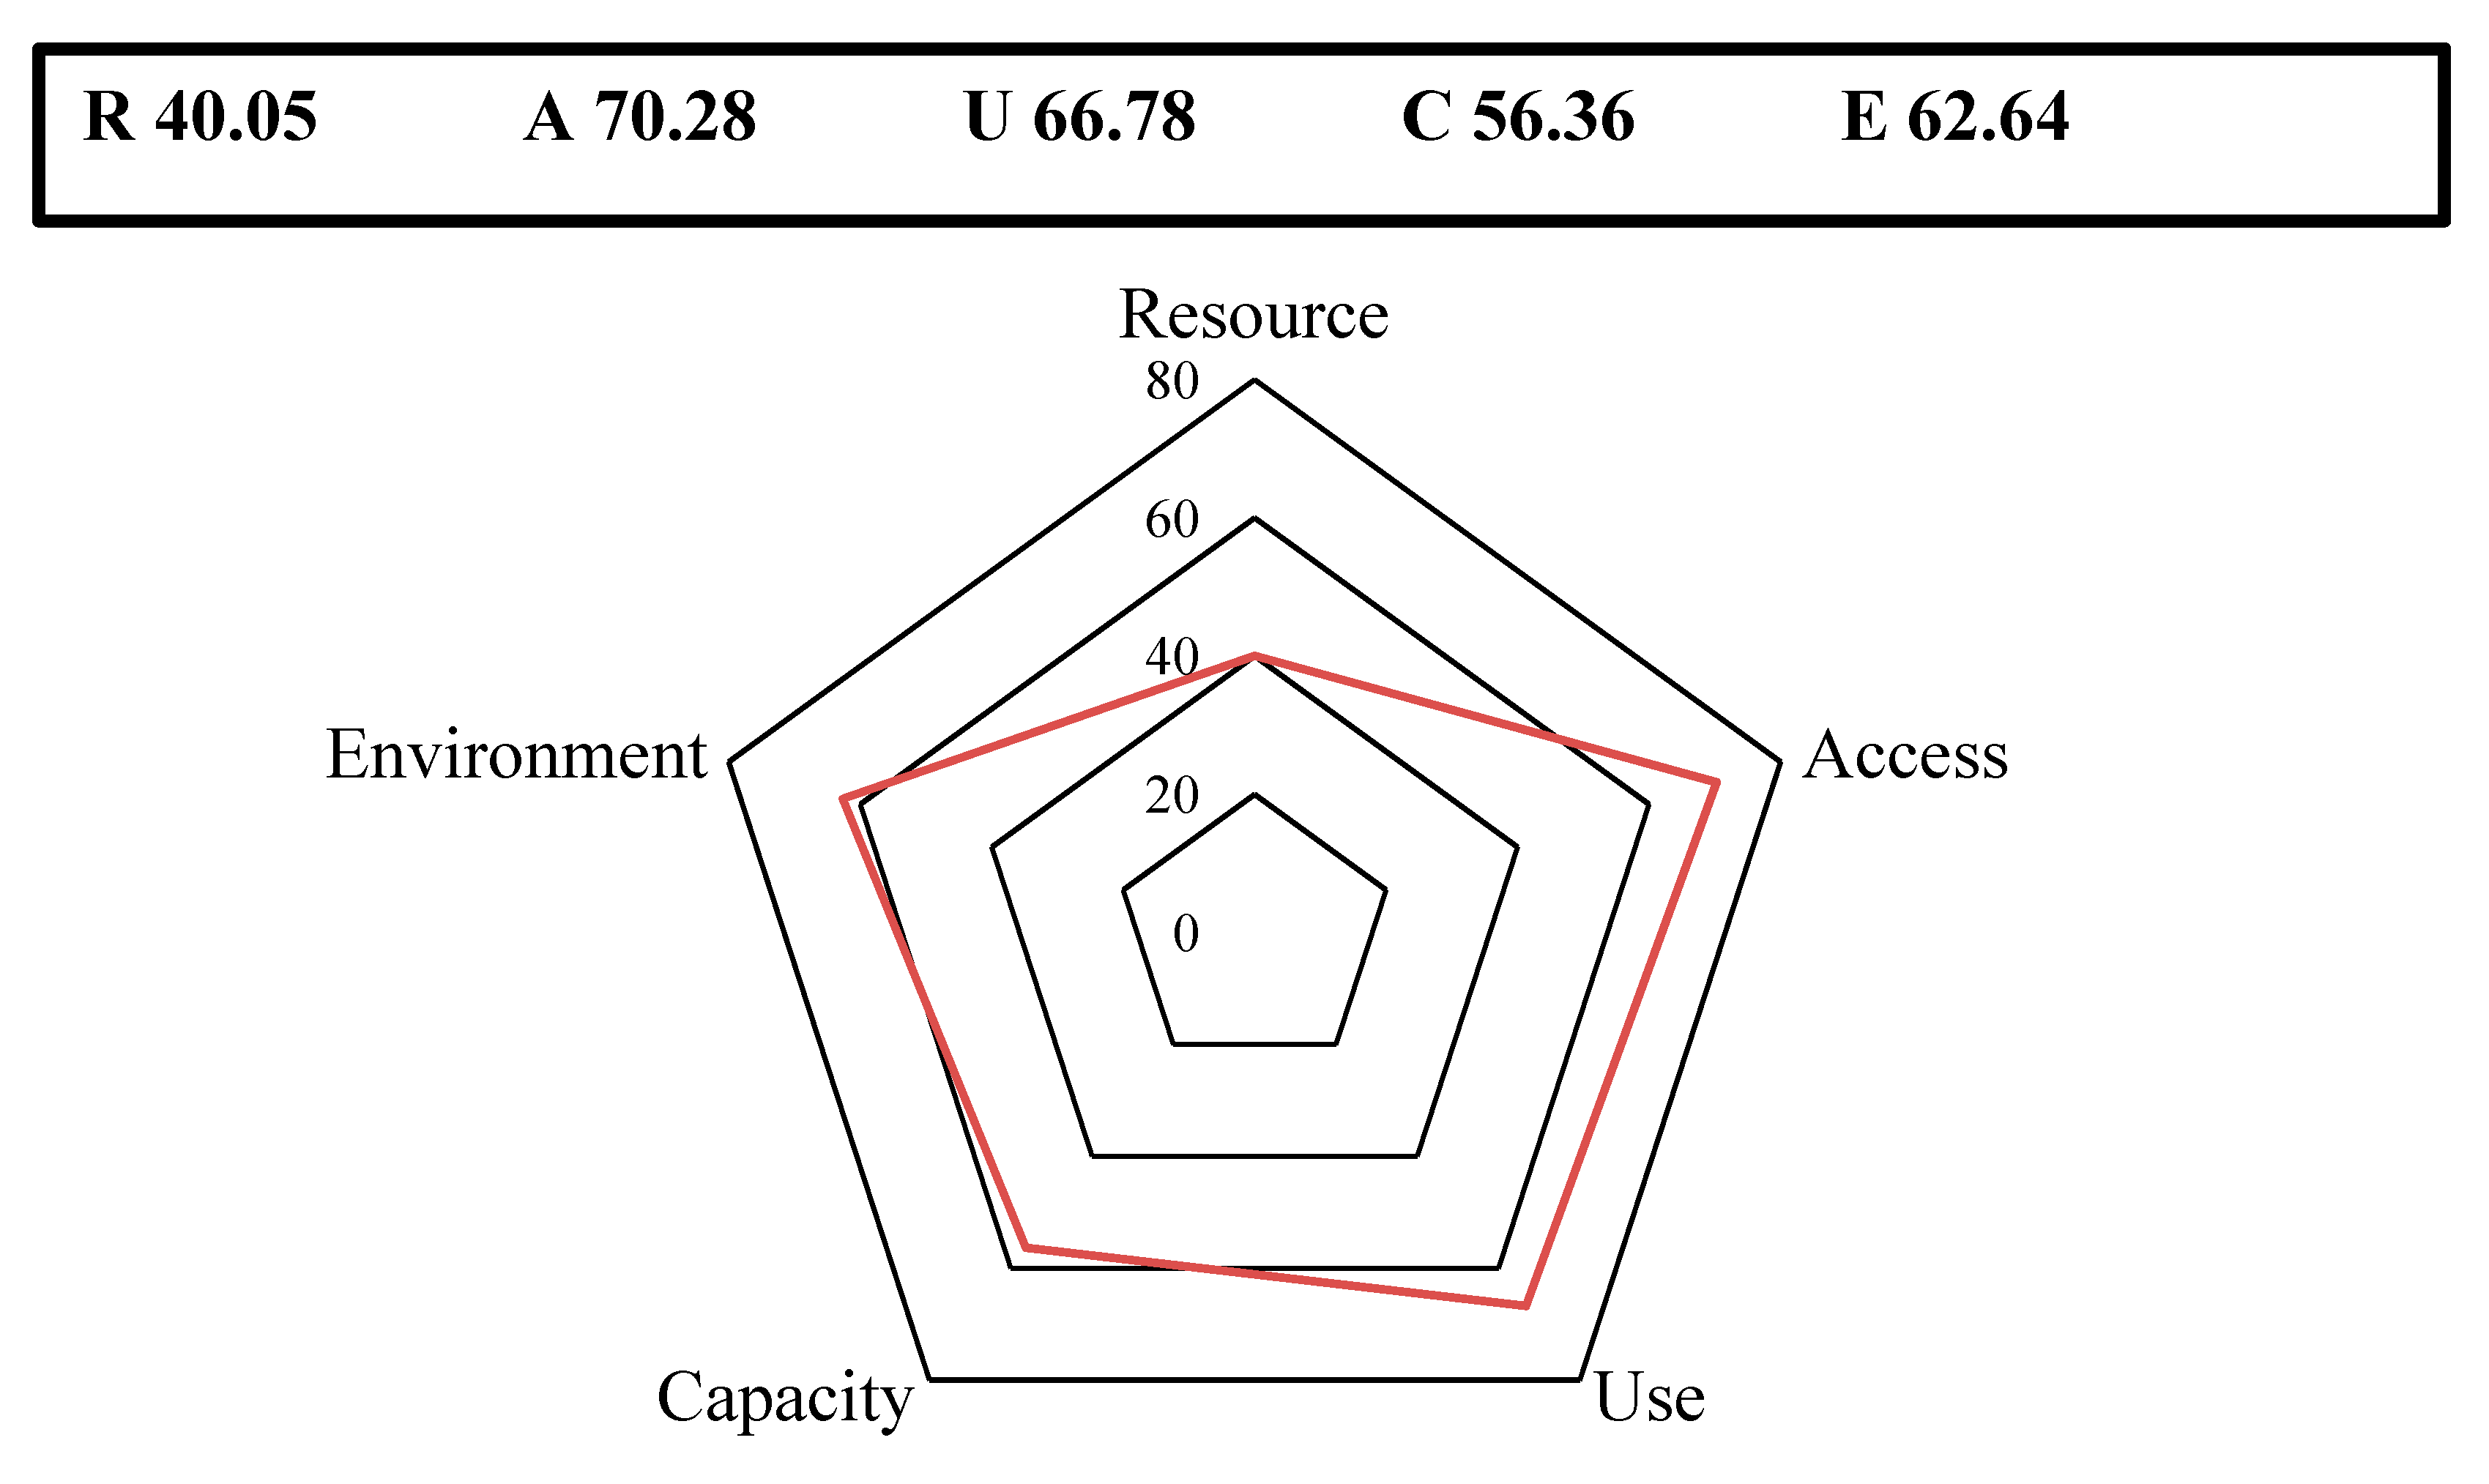
3.1. Water Poverty in Koshi Basin

According to the National Population and Housing Census 2011, the total population of 27 districts of Koshi River Basin was 11,627,972 [36]. The final WPI score for 27 districts of Koshi Basin in Nepal was found to be 59.22, which is over the national average (54.4) estimated by Lawrence, Meigh and Sullivan [19]. The final scores for all components of WPI are shown in Figure 3. Out of five components, Resource was found to be the lowest (R = 40.05) followed by Capacity (C = 56.36), Environment (E = 62.64), Use (U = 66.78) and Access (A = 70.28). Among the indicators used, variability in average annual precipitation (R2 = 23.66), low GDP index (C2 = 40.35) and percentage of vegetation cover (E2 = 41.22) contributed mostly to the water poverty with lowest scores. Similarly, ratio of irrigated land to cultivated land (U1 = 41.80), per capita water availability (R1 = 56.43) and access to sanitation (A2 = 58.80) have substantially impacted the water poverty in the basin. Water sufficiency for domestic (U2 = 94.43) use was relatively higher in the Basin compared to water sufficiency for agricultural use (U3 = 64.11). The detailed contribution of each indicator and respective components to overall and district level water poverty is presented in the Appendix (Table A1).

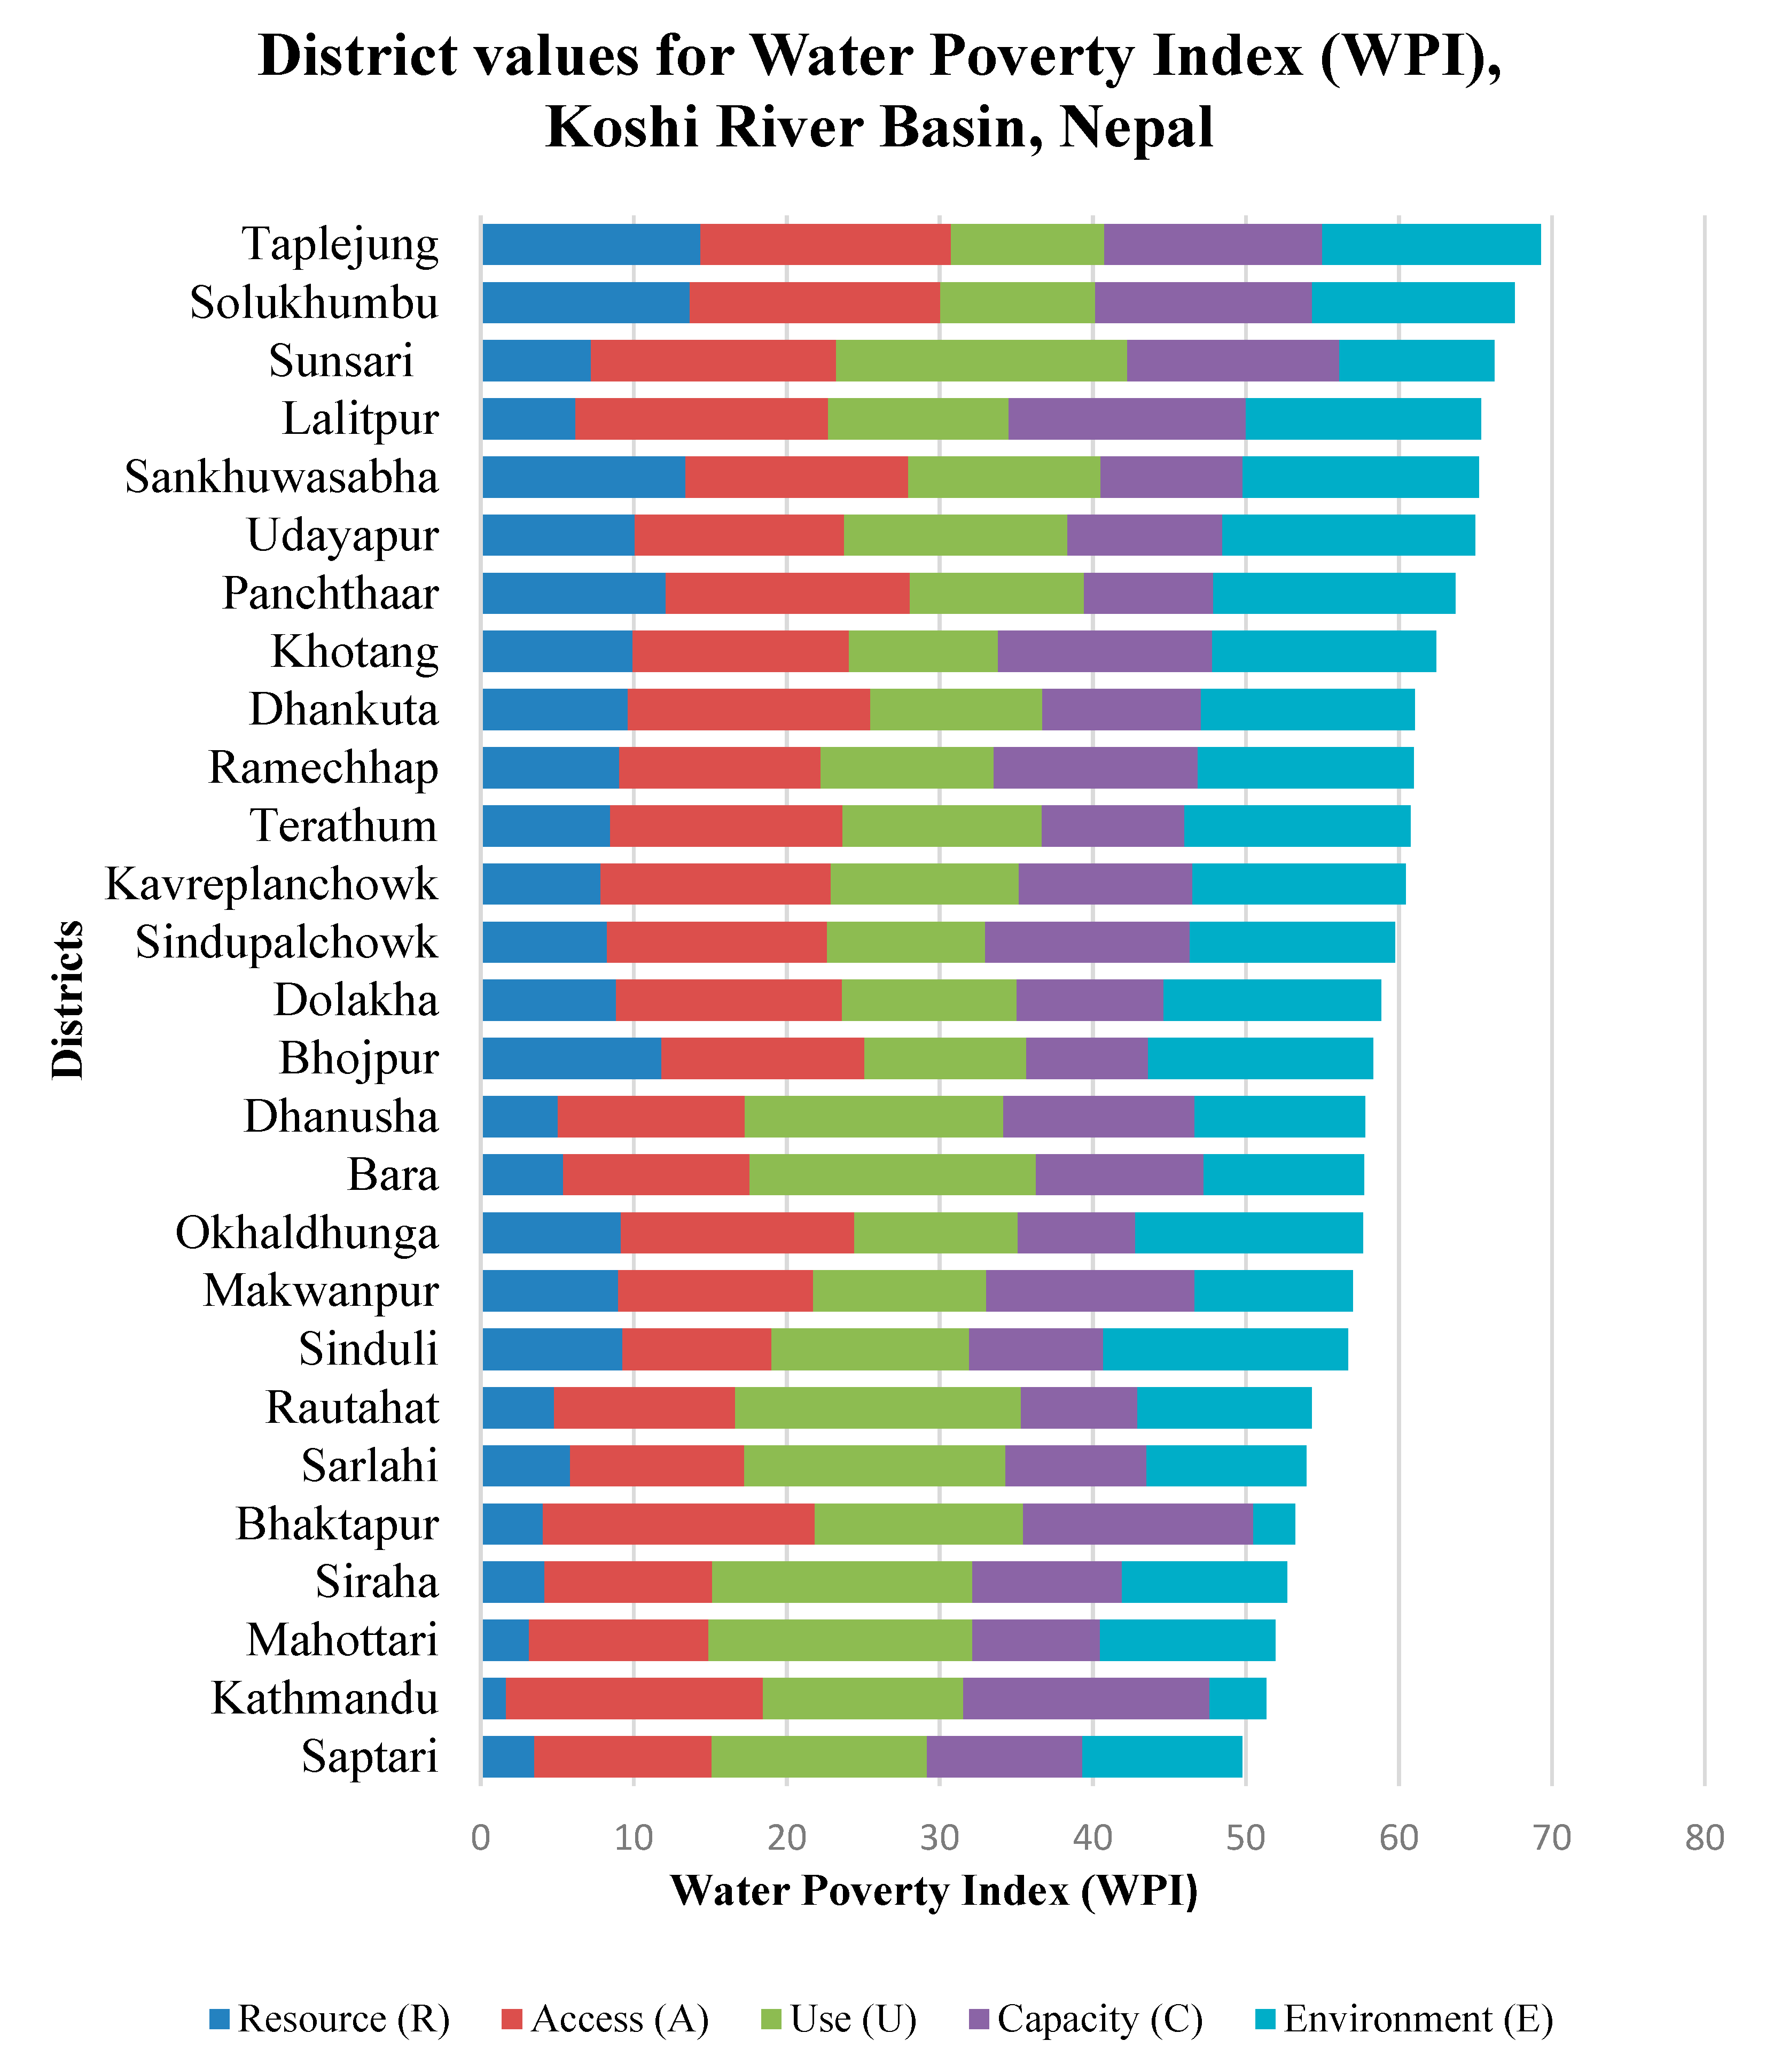
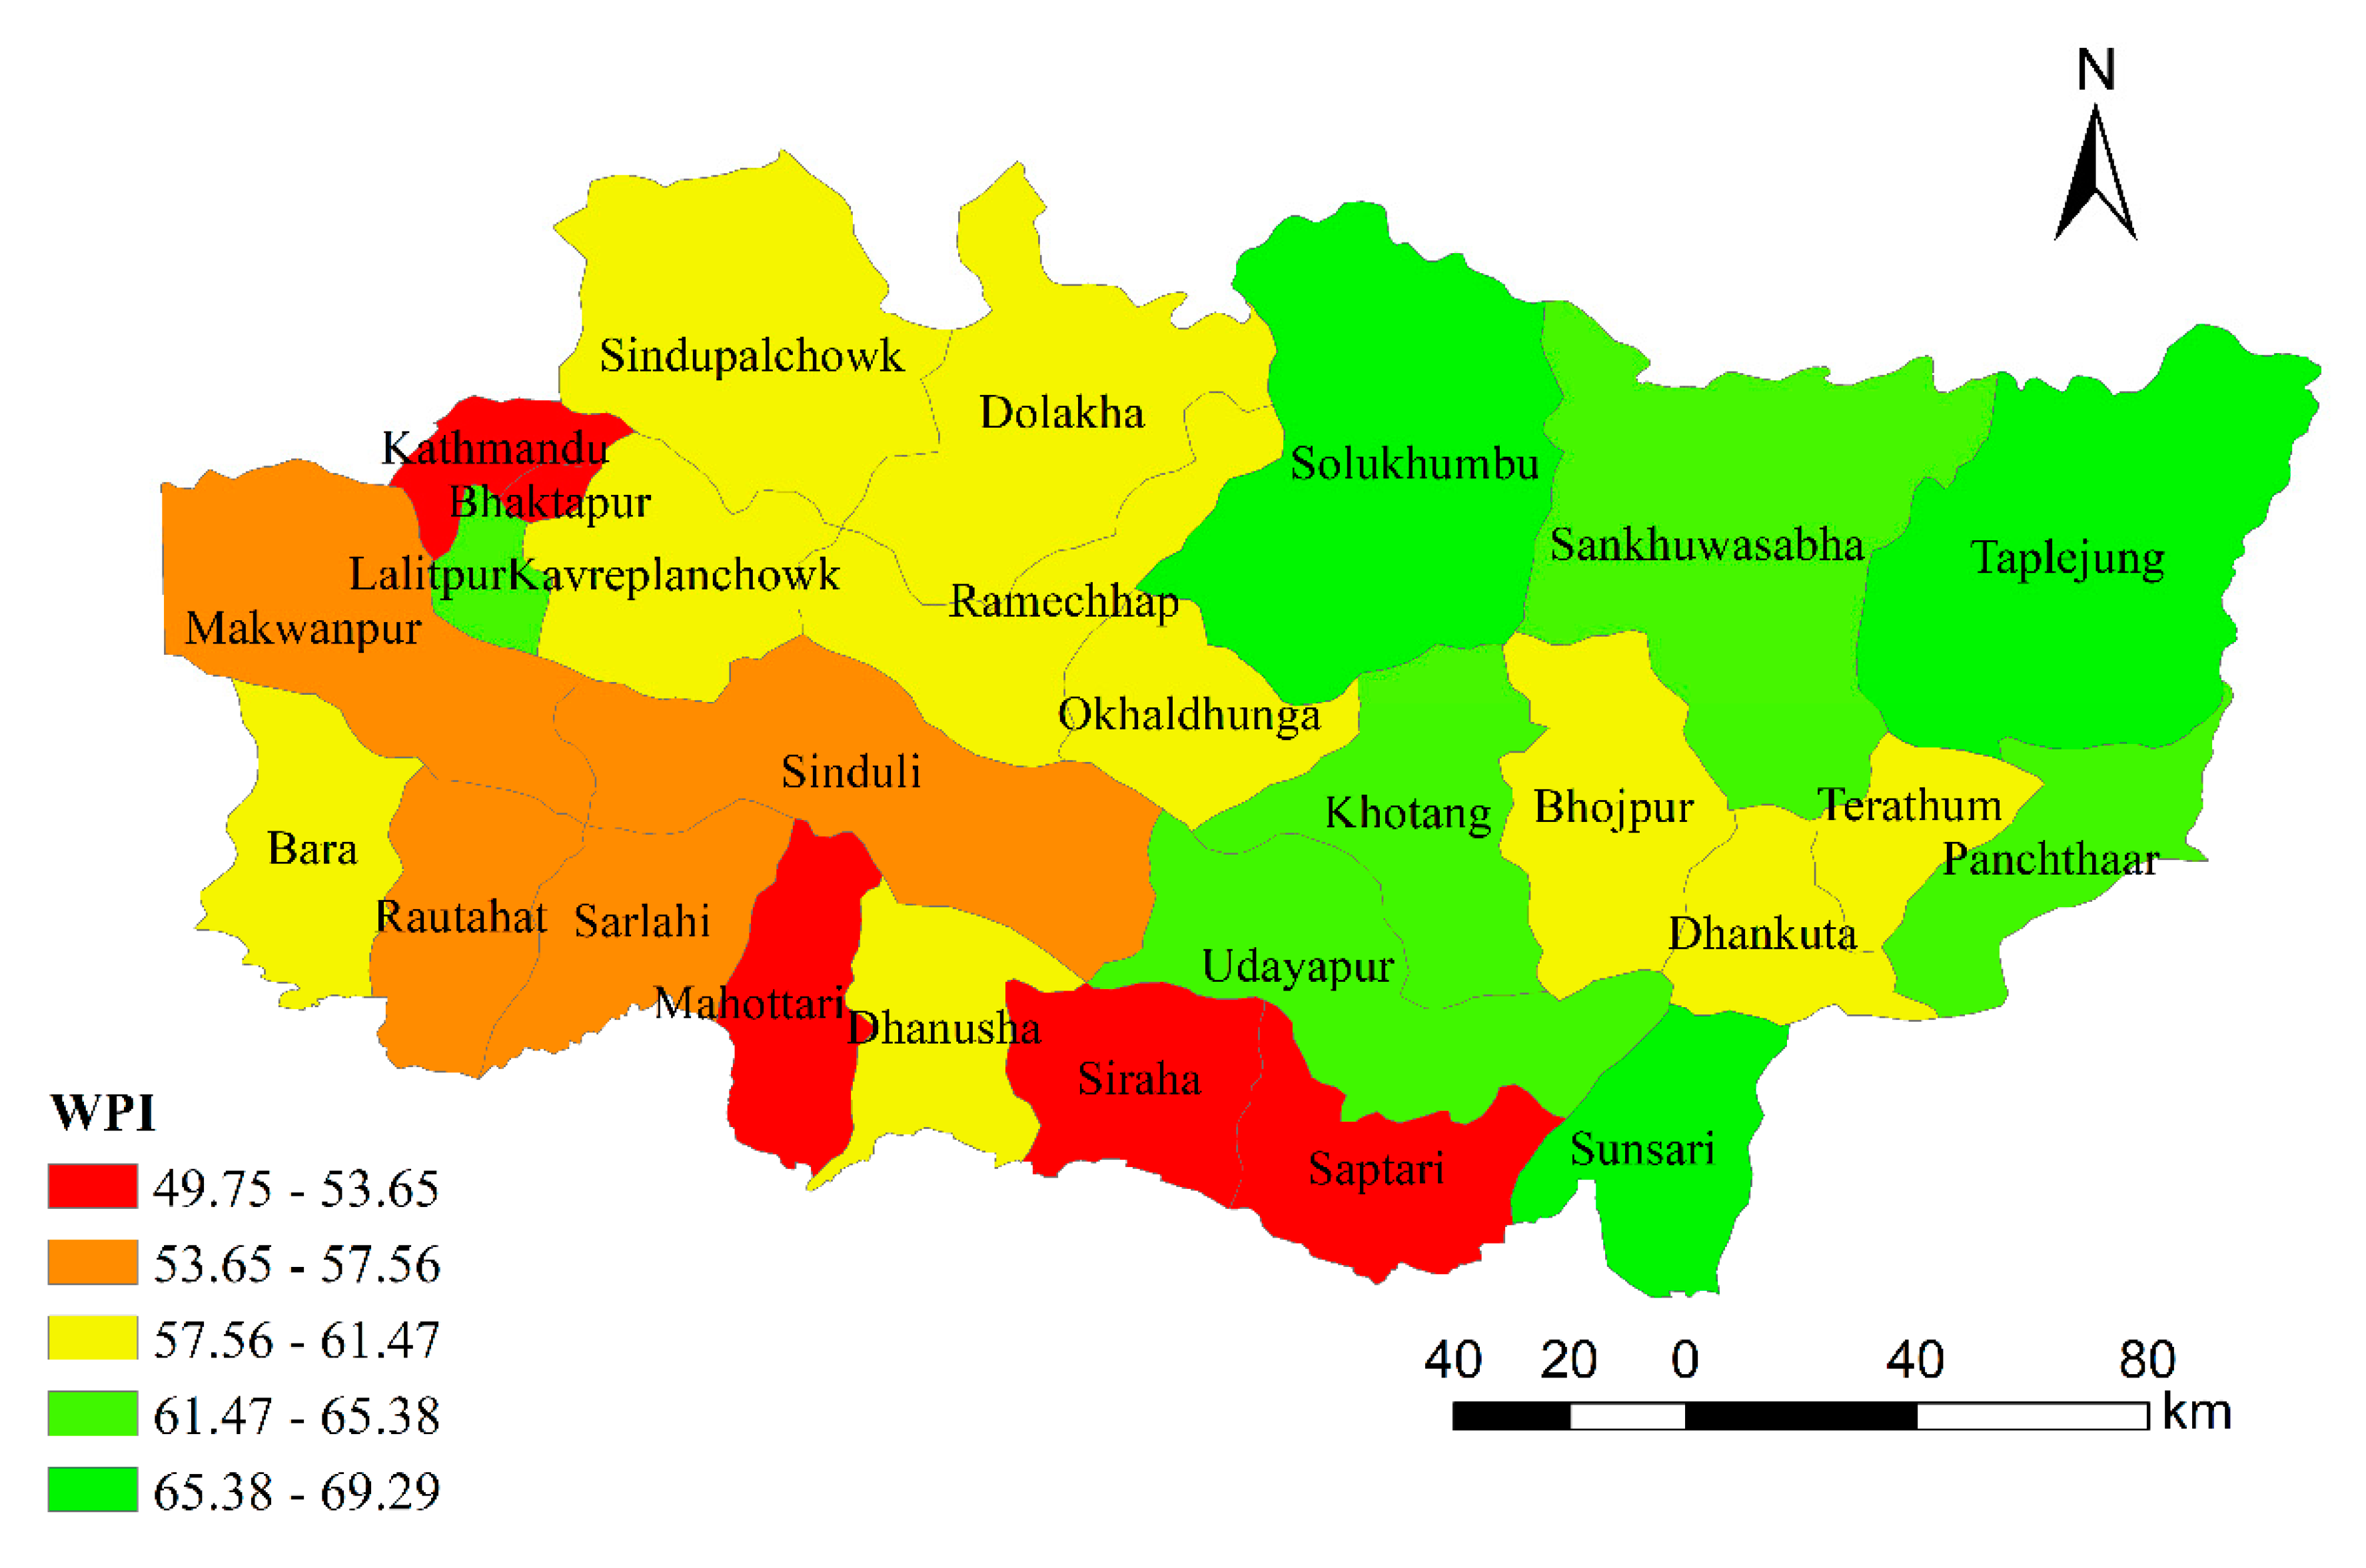
3.2. District Level Water Poverty in Koshi Basin

The district level comparison for WPI and its respective components are presented in Figure 4. District level WPI scores shows wide variation ranging from 49.75 to 69.29. Out of 27 districts, Saptari was found to be most water stressed with a WPI score of 49.75, followed by Kathmandu (51.35) and Mahottari (51.91). Taplejung (69.29), Solukhumbu (67.57) and Sunsari (66.25) were found to be least water stressed with the highest WPI scores. Urban districts such as Kathmandu and Bhaktapur scored low in the Resource component, however, they had higher Access and Capacity to manage water.
Spatial variation of WPI along districts of Koshi Basin in Nepal is presented through a water poverty map in Figure 5. Saptari, Siraha, Mahottari, Kathmandu and Bhaktapur were found to have the least WPI score with a higher level of water stress. Taplejung, Solukhumbu and Sunsari scored highest in WPI with lowest water poverty in the Basin.
Spatial variation of WPI components presented in Figure 6 illustrates that districts in Tarai region were relatively more stressed on Resource (R), Access (A), Capacity (C) and Environment (E) components, while districts in mid-hill and high-hill regions were stressed in terms of water Use (U). Urban districts like Kathmandu and Bhaktapur performed better in Access and Capacity components, however, due to low Resource, Use and Environmental health, these districts performed low in overall WPI. Human Development Index (HDI) is also presented in Figure 6, together with five WPI components allowing the comparison between WPI components and HDI. Figure 6 shows that districts in Tarai region with a low HDI score were also found to have lower scores for capacity (C), Access (A) and Resource (R) components of WPI. In a study conducted by [19] (p. 9) an identical relation between HDI and WPI scores is shown, where they have found a strong positive association between the HDI and Capacity component. This strong correlation is expected as WPI’s Capacity component and HDI are based on similar indicators.

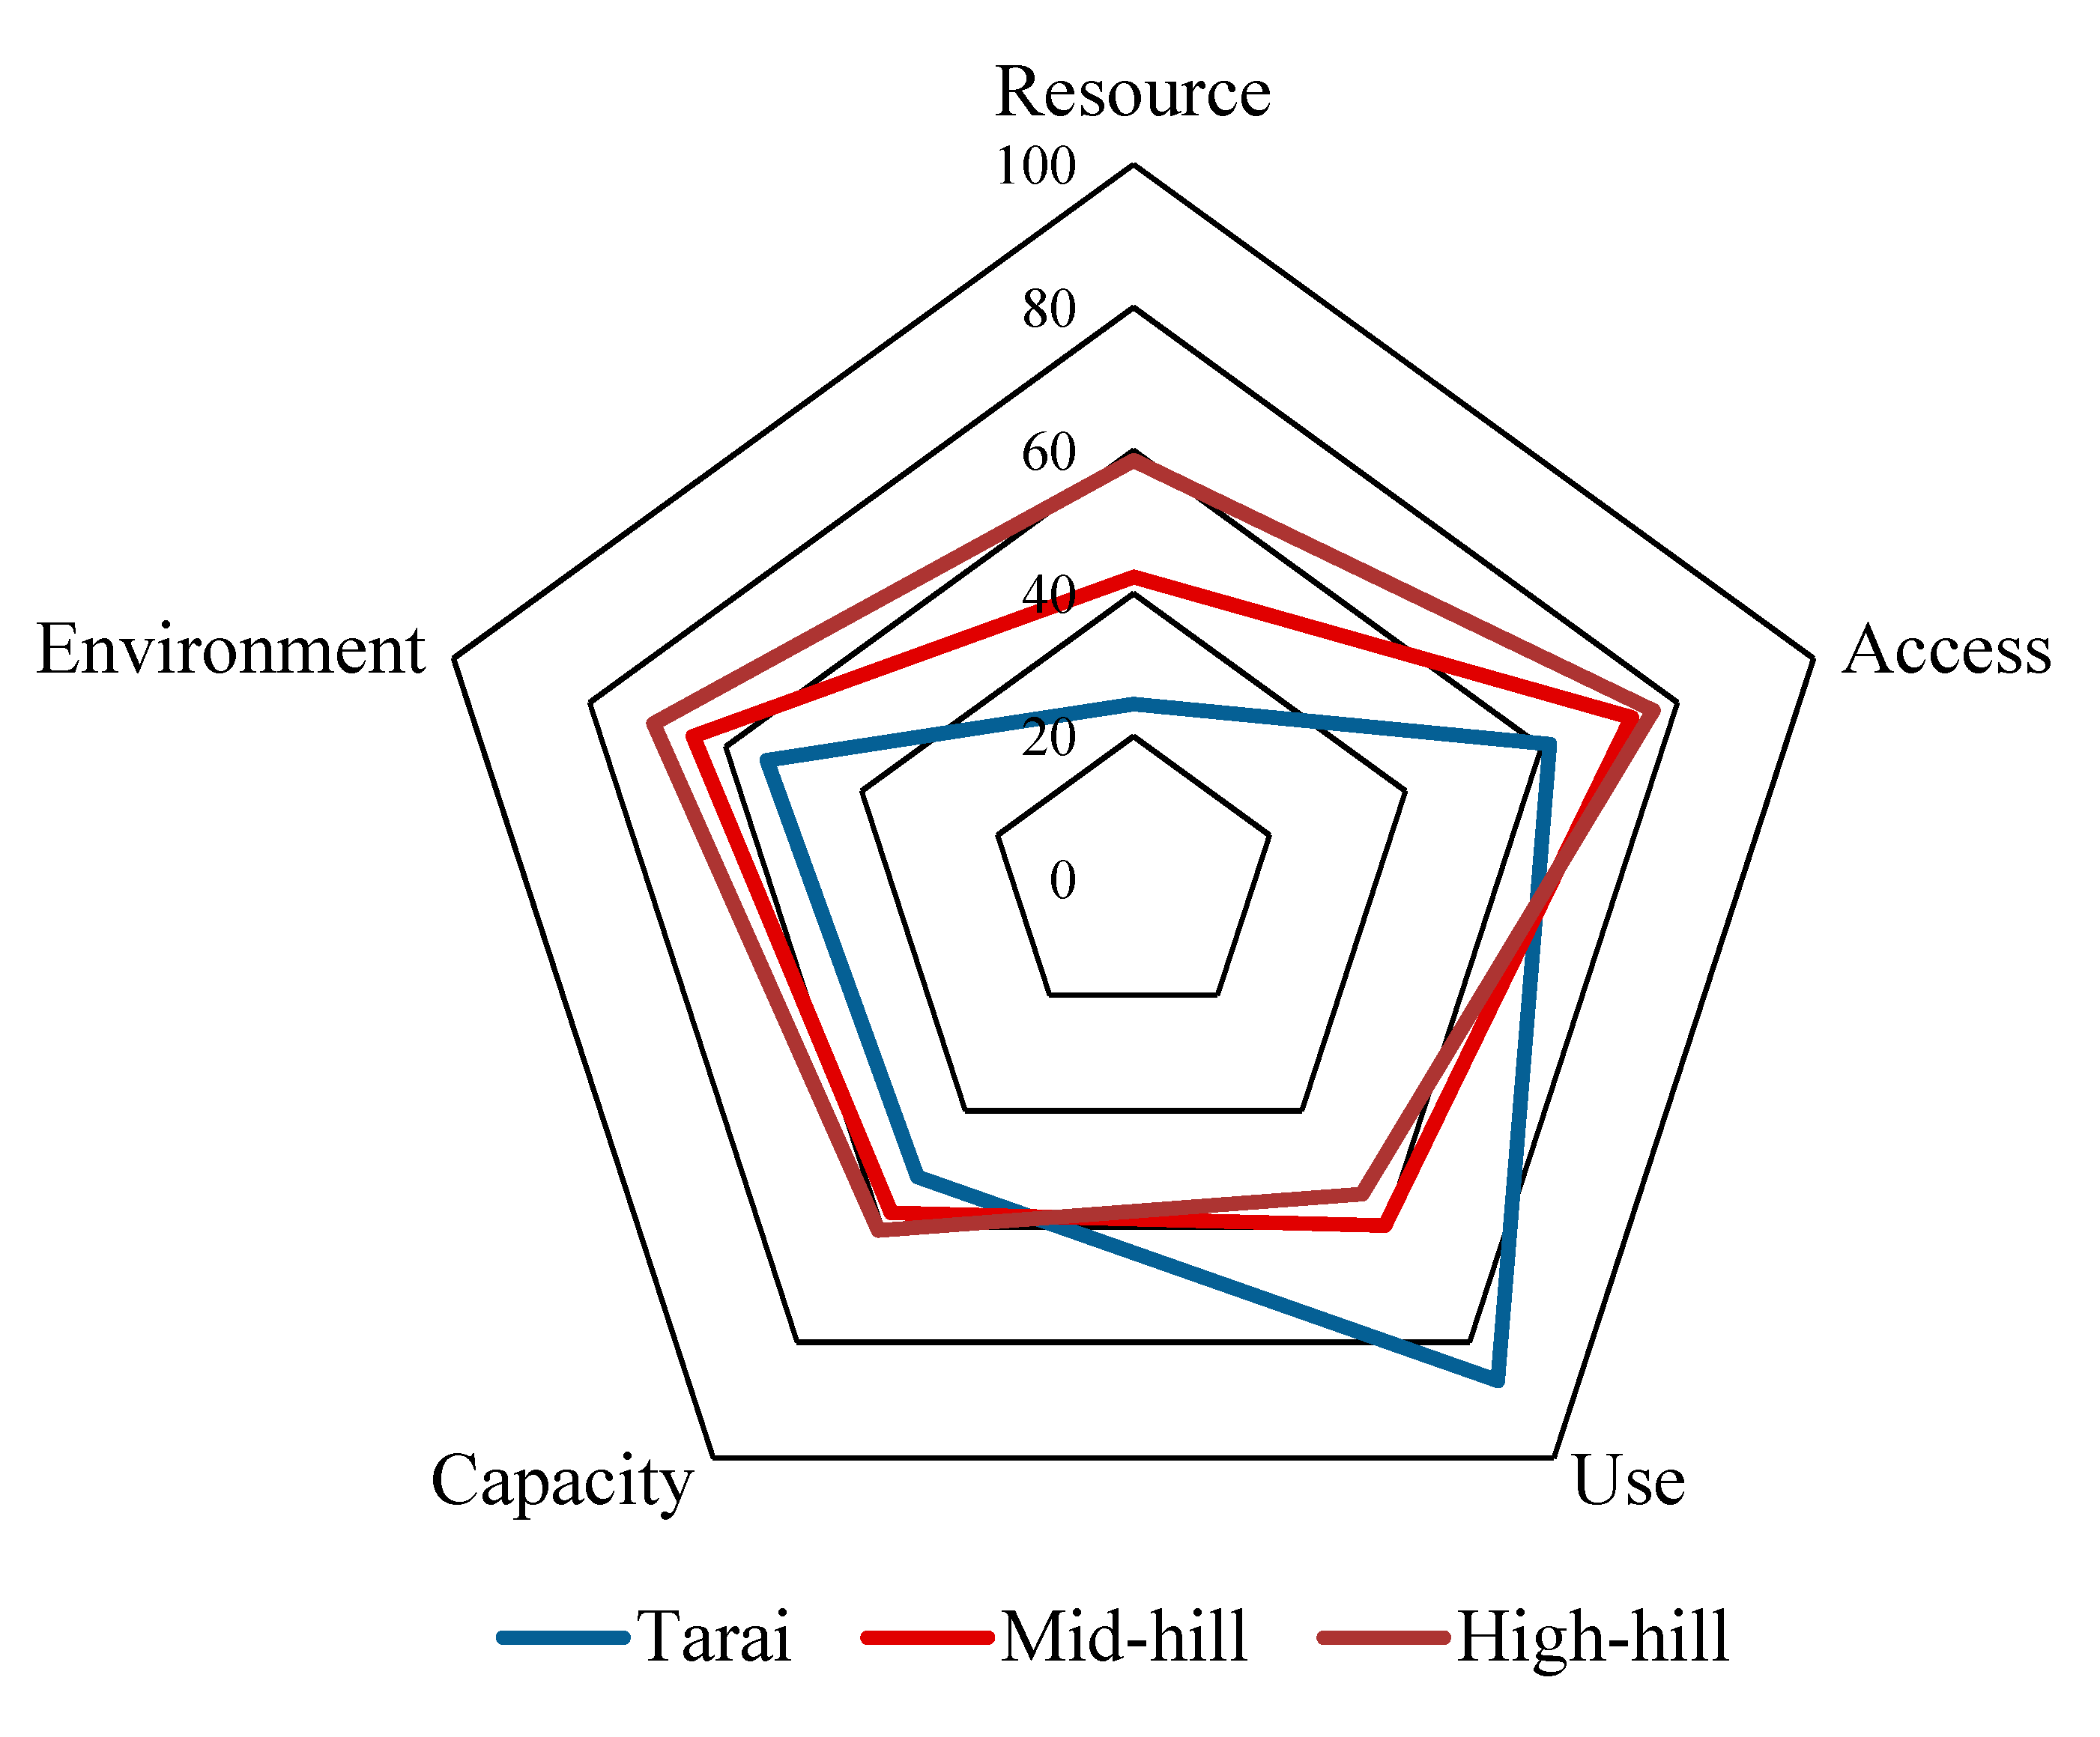
3.3. Water Poverty along Agro-Ecological Region

Comparing water poverty along three selected agro-ecological categories, Tarai region was found to be more water stressed in terms of all components compared to mid-hill and high-hill regions except for the Use (U) component. The overall WPI was found to be significantly low in Tarai (55.6) compared to mid-hill (59.6) and high-hill (64.1) districts, denoting high level of water poverty in Tarai compared to other regions. However, WPI in all three regions are higher than the national average estimated by Lawrence, Meigh and Sullivan [19], representing less water poverty in Koshi Basin compared to the national average. The scores of individual components and overall WPI for three agro-ecological regions are presented in Table 2 and Figure 7.
Ratio of irrigated land to cultivated land was found to be lower in mid-hill and high-hill districts, while districts in Tarai region were found to have better access to irrigation. Literacy rate was found relatively lower in districts of Tarai region compared to the mid-hill and high-hill districts. Fertilizer use per hectare of cultivated land was found to be relatively low in the Basin, with exceptions for urban districts such as Kathmandu and Bhaktapur.

4. Discussion

The final WPI score (59.22) for the Koshi Basin in Nepal can be considered medium-low in terms of water stress, and the findings in this study are comparable to other contemporary studies conducted at national, district and watershed levels [1,5,11,14,17,18,19] in other parts of the country. The overall water poverty in the Basin was lower than the national average (54.4) estimated by Lawrence, Meigh and Sullivan [19]. The estimation of the national average by Lawrence, Meigh and Sullivan [19] was made in 2002, and this study has used the data from the National Population and Housing Census of Nepal in 2011. Thus, it can be argued that the situation of water poverty has improved in Koshi River Basin in 2011 compared to 2002. However, due to the lack of national and sub-national level time series data on different indicators of water poverty, temporal comparison was not possible.
Our study also revealed an improved state of water poverty in Koshi Basin compared to the analysis and mapping conducted by WWF [18] in Indrawati River Basin (one of the sub-basins of Koshi River Basin) that showed a WPI score of 52.5. This variation provides support to the argument that the nature of water poverty in Koshi Basin is complex and unevenly distributed across sub-basins, districts and agro-ecological regions. The WPI score at Jhikhu Khola and the Yarsha Khola of Koshi River Basin in Nepal estimated by Merz [20], showed very identical WPI results compared to our findings with 59.2 for the Jhikhu catchment and 63.2 for the Yarsha catchment in mid-hill districts. District level comparison showed high variation of WPI scores, ranging from 49.75 to 69.29 in Koshi River Basin, which is slightly lower than the score estimated at upper Bagmati River Basin (sub-basin of Koshi River Basin) by Thakur, Neupane and Mohanan [14], that showed Bagmati River Basin as medium-low water poor with WPI ranging from 54.63 to 77.95. The variation might have been caused due to differences in indicator selection and spatial scale selected for the study. Districts of Koshi River Basin were less water stressed compared to Kali Gandaki River Basin which have WPI ranging from 37.1 to 56.5, estimated by Manandhar, Pandey and Kazama [1].
Unlike the findings in Karnali River Basin by Panthi, Khatiwada, Shrestha and Dahal [11] that concluded mid-hill districts having the highest water poverty, our study discovered higher water stress in Tarai region, compared to high-hill and mid-hill region in Koshi River Basin. This variation implies that mid-hill regions of Koshi River Basin (WPI = 59.6) are relatively less water stressed compared to mid-hill regions of Karnali River Basin (WPI = 0.3533). Similarly, Tarai region in Koshi River Basin (WPI = 55.6) were more water stressed compared to Tarai region of Karnali River Basin (WPI = 0.631). This shows the uneven distribution of water stress across different regions of two river basins in Nepal.
Among the five WPI components, Koshi River Basin was found to be least stressed on Access component, indicating that most of the population in the Basin have access to water and sanitation. However, the results from the district level and agro-ecological level WPI suggest a high level of variation among different components.
The water poverty can be seen as the product of socio-economic Capacity coupled with Resource and Environmental indicators in the study districts. Urban districts like Kathmandu and Bhaktapur were found to have better Access and Capacity to manage water resource. However, due to lack of proper resources and a degraded environmental situation, both districts performed low in WPI denoting high level of water stress.
The districts in Tarai region and urban areas were found relatively more water stressed compared to other districts in the Basin. The districts in Tarai region were relatively more stressed on Resource (R), Access (A), Capacity (C) and Environment (E) components, while districts in mid-hill and high-hill regions were stressed in terms of water use (U). Poor access to sanitation, high illiteracy rate and low per capita income in Tarai districts have contributed to a high degree of water stress in the region. The districts in mid-hill and high-hill regions are stressed in terms of water use, specifically with access to irrigation.
Water availability, variability, accessibility, use and socio-economic capacity to manage water are the major challenges prevailing in the Basin. Efficient use of available water and integrated water resource management techniques could help improve the water poverty situation in the Basin. However, all the districts in the Basin require improvement in all the components and their respective sectors. Urgent attention should be given to the most water stressed districts in Tarai region and urban areas such as Kathmandu and Bhaktapur. Improvement in water supply and sanitation through appropriate policy and instruments could enhance the Access component in the Basin, explicitly in Tarai region. Infrastructure for domestic and agricultural water use can be developed in order to improve water use. Integrated water resource management practices could be used for proper utilization of available water resources in the Basin. Provision of education, employment and diversification of livelihood systems could improve the socio-economic capacity of the people to cope with existing water stress.

5. Conclusions

WPI offers a robust and comprehensive tool to access water stress at various spatial scales. Using the five components described by WPI, we selected 12 indicators, considering local relevance and availability of data, to access water stress in 27 districts of Koshi Basin, Nepal. The study revealed medium-low level (WPI = 54.4) of water poverty in Koshi Basin in Nepal with substantial variation along the districts (from 49.75 to 69.29). The results showed that out of five components, Resource was found to be the most stressed followed by Capacity, Environment, Use and Access. The spatial analysis showed that districts in Tarai region and urban areas are relatively more water stressed compared to other districts in the Basin.
The districts with low WPI scores should be given priority for intervention. Priorities must be given to the districts in Tarai region and urban areas, explicitly on access to water and sanitation to address water poverty in the Basin. Focus should be given on infrastructure development in mid-hill and high-hill districts in order to improve domestic and agricultural water use. Water managers and policy makers should prioritize their focus on proper management of existing water resources. Equal priority should be given for enhancing socio-economic capacity of the people through provision of education and employment opportunities. Conservation of water resources through proper management of watershed is a crucial factor to enhance the environmental component. Development of sustainable infrastructures could improve domestic and agricultural water use as well as ensure access to safe water and sanitation.
District level WPI can be a useful tool for proper water management in Koshi Basin. It could assist water resource managers and policy makers to prioritize the water stress areas, along with priority sectors that require immediate attention. Inclusion of more indicators and assigning unequal weights based on experts and stakeholders’ consultations can be done in future to make WPI more reliable and useful. Water poverty assessment at various spatial scales (municipality and ward level) within the districts of Koshi Basin could provide more distinct priority areas and stronger basis for management interventions. Updated studies at frequent intervals could provide temporal changes in water poverty, which can be used to monitor progress and evaluate existing management policy instruments. Moreover, the concern of water quality is equally important and future research could incorporate water quality aspects into the WPI assessment to make WPI more comprehensive and a holistic tool.

Author Contributions

S.K. and Y.F. conceived and designed the research. S.K. gathered, processed and analyzed the data. S.K., N.M.D., C.Z., B.P. and S.S. contributed to discussing the results and writing the paper.

Funding

This research was supported by the NSFC-ICIMOD Joint Research Project (Grant no. 41661144038). We would also acknowledge the help and support from the International Center for Integrated Mountain Development (ICIMOD).

Acknowledgments

The research was supported by the NSFC-ICIMOD Joint Research Project (Grant no. 41661144038). We would also like to acknowledge the help and support from the International Center for Integrated Mountain Development (ICIMOD).

Conflicts of Interest

The authors declare no conflict of interest.

Appendix A

Table A1. Calculated values for WPI components and indicators for Koshi Basin, Nepal.
DistrictR1R2RA1A2AU1U2U3UC1C2C3CE1E2EWPI
Bara39.4814.5727.0396.0026.0061.0091.5398.6390.4193.5252.0044.9767.0054.6668.7336.0052.3757.71
Bhaktapur10.5830.1420.3681.8096.0088.9039.5882.1982.1967.9982.0043.7910075.267.1520.0013.5753.22
Bhojpur75.8842.3159.1068.6064.0066.3035.4690.4132.8852.9169.0038.4112.0039.8099.0448.0073.5258.33
Dhankuta67.8428.3348.0881.7077.0079.3520.7290.4157.5356.2274.0042.2539.0051.7598.4841.0069.7461.03
Dhanusha31.4519.1325.2988.1034.0061.0572.6998.6382.1984.5050.0037.36100.062.4588.4023.0055.7057.80
Dolakha80.907.5344.2277.8070.0073.9023.1598.6349.3257.0363.0037.0844.0048.0392.1850.0071.0958.85
Kathmandu0.0016.808.4070.0098.0084.0039.9782.1973.9765.3886.0055.4010080.470.0037.0018.5051.35
Kavreplanchowk54.0024.6139.3179.4071.0075.2028.2490.4165.7561.4770.0044.0456.0056.6885.1854.0069.5960.45
Khotang72.7326.8349.7878.2063.0070.6023.0090.4132.8848.7669.0040.5010069.8399.4747.0073.2362.44
Lalitpur25.0437.1031.0769.5095.6082.5520.8682.1973.9759.0183.0049.0910077.3691.7862.0076.8965.38
Mahottari31.850.0015.9390.4026.9058.6569.3498.6390.4186.1346.0032.0247.0041.6792.3822.0057.1951.91
Makwanpur62.8627.2145.0478.4049.0063.7015.0796.9957.5356.5368.0044.1792.0068.0636.1167.0051.5556.98
Okhaldhunga71.5620.1145.8382.7070.0076.3516.3994.5249.3253.4164.0037.7013.0038.2310049.0074.5157.67
Panchthaar71.1449.9760.5571.6088.0079.8019.3793.7057.5356.8773.0039.7514.0042.2510058.0079.0163.70
Ramechhap72.5218.2345.3779.6052.0065.8016.8095.3457.5356.5662.0037.5910066.5397.1944.0070.5960.97
Rautahat38.449.8024.1295.1023.0059.0591.5198.6390.4193.5242.0033.7838.0037.9388.7525.0056.8854.30
Sankhuwasabha94.8339.0466.9467.6078.0072.8034.5896.1657.5362.7669.0041.3829.0046.4699.4455.0077.2265.24
Saptari35.240.0017.6296.0020.0058.0063.0898.6349.3270.3455.0034.7362.0050.5887.4017.0052.2049.75
Sarlahi38.3920.1129.2589.0025.0057.0076.7596.9982.1985.3146.0034.8957.0045.9684.6420.0052.3253.97
Sinduli70.1822.5346.3664.5033.0048.7532.7195.3465.7564.6061.0035.1635.0043.7292.8367.0079.9256.67
Sindupalchowk71.1311.6941.4180.7063.0071.8535.7594.5224.6651.6460.0040.1710066.7288.2346.0067.1159.75
Siraha34.866.8420.8589.7020.0054.8566.1498.6390.4185.0650.0032.2164.0048.7492.0516.0054.0352.71
Solukhumbu99.9236.9068.4188.8075.0081.9011.8398.6341.1050.5264.0048.6210070.8799.2833.0066.1467.57
Sunsari 31.7940.3636.0896.4064.0080.2090.9498.6395.3494.9768.0040.0810069.3682.3319.0050.6766.25
Taplejung10043.8871.9490.5073.0081.7518.5698.6332.8850.0271.0042.9810071.3399.8043.0071.4069.29
Terathum69.6915.1742.4377.7074.0075.8533.6796.1665.7565.2075.0044.2720.0046.4298.7549.0073.8860.76
Udayapur71.2229.7550.4877.9059.0068.4540.9395.3482.1972.8269.0037.0446.0050.6899.9965.0082.4964.99
Average56.4323.6640.0581.7758.8070.2841.8094.4364.1166.7864.4840.3564.2656.3684.0641.2262.6459.22
Figure A1. Elevation map of Koshi River Basin in Nepal.
Sustainability 12 00727 g0a1

References

  1. Manandhar, S.; Pandey, V.P.; Kazama, F. Application of water poverty index (WPI) in Nepalese context: A case study of Kali Gandaki River Basin (KGRB). Water Resour. Manag. 2012, 26, 89–107. [Google Scholar] [CrossRef]
  2. Giné Garriga, R.; Pérez Foguet, A. Water, sanitation, hygiene and rural poverty: Issues of sector monitoring and the role of aggregated indicators. Water Policy 2013, 15, 1018–1045. [Google Scholar] [CrossRef]
  3. Sullivan, C.; Meigh, J.; Lawrence, P. Application of the Water Poverty Index at Different Scales: A Cautionary Tale: In memory of Jeremy Meigh who gave his life’s work to the improvement of peoples lives. Water Int. 2006, 31, 412–426. [Google Scholar] [CrossRef]
  4. WHO; UNICEF. Progress on Drinking Water, Sanitation and Hygiene: 2017 Update and SDG Baselines; United Nations Children’s Fund (UNICEF): New York, NY, USA; World Health Organization: Geneva, Switzerland, 2017. [Google Scholar]
  5. Pandey, V.P.; Manandhar, S.; Kazama, F. Water poverty situation of medium-sized river basins in Nepal. Water Resour. Manag. 2012, 26, 2475–2489. [Google Scholar] [CrossRef]
  6. Pandey, V.P.; Babel, M.S.; Shrestha, S.; Kazama, F. A framework to assess adaptive capacity of the water resources system in Nepalese river basins. Ecol. Indic. 2011, 11, 480–488. [Google Scholar] [CrossRef]
  7. Garriga, R.G.; Foguet, A.P. Improved method to calculate a water poverty index at local scale. J. Environ. Eng. 2010, 136, 1287–1298. [Google Scholar] [CrossRef] [Green Version]
  8. Falkenmark, M.; Lundqvist, J.; Widstrand, C. Macro-scale water scarcity requires micro-scale approaches: Aspects of vulnerability in semi-arid development. Nat. Resour. Forum 1989, 13, 258–267. [Google Scholar] [CrossRef] [PubMed]
  9. Raskin, P.; Gleick, P.; Kirshen, P.; Pontius, G.; Strzepek, K. Comprehensive Assessment of the Freshwater Resources of the World. Water Futures: Assessment of Long-Range Patterns and Problems. 1997. Available online: https://www.eea.europa.eu/data-and-maps/indicators/use-of-freshwater-resources-3/raskin-et-al.-1997 (accessed on 16 January 2020).
  10. Meigh, J.; McKenzie, A.; Sene, K. A grid-based approach to water scarcity estimates for eastern and southern Africa. Water Resour. Manag. 1999, 13, 85–115. [Google Scholar] [CrossRef]
  11. Panthi, J.; Khatiwada, K.; Shrestha, M.; Dahal, P. Water poverty in the context of climate change: A case study from Karnali river basin in Nepal Himalaya. Int. J. River Basin Manag. 2019, 17, 243–250. [Google Scholar] [CrossRef]
  12. Sullivan, C. The potential for calculating a meaningful water poverty index. Water Int. 2001, 26, 471–480. [Google Scholar] [CrossRef]
  13. Fang, Y.P.; Zhao, C.; Rasul, G.; Wahid, S.M. Rural household vulnerability and strategies for improvement: An empirical analysis based on time series. Habitat Int. 2016, 53, 254–264. [Google Scholar] [CrossRef]
  14. Thakur, J.K.; Neupane, M.; Mohanan, A.A. Water poverty in upper Bagmati River basin in Nepal. Water Sci. 2017, 31, 93–108. [Google Scholar] [CrossRef] [Green Version]
  15. Sullivan, C. Calculating a water poverty index. World Dev. 2002, 30, 1195–1210. [Google Scholar] [CrossRef]
  16. Dahal, P.; Shrestha, N.S.; Shrestha, M.L.; Krakauer, N.Y.; Panthi, J.; Pradhanang, S.M.; Jha, A.; Lakhankar, T. Drought risk assessment in central Nepal: Temporal and spatial analysis. Nat. Hazards 2016, 80, 1913–1932. [Google Scholar] [CrossRef] [Green Version]
  17. Panthi, J.; Dahal, P.; Shrestha, M.; Aryal, S.; Krakauer, N.; Pradhanang, S.; Lakhankar, T.; Jha, A.; Sharma, M.; Karki, R. Spatial and temporal variability of rainfall in the Gandaki River Basin of Nepal Himalaya. Climate 2015, 3, 210–226. [Google Scholar] [CrossRef] [Green Version]
  18. WWF. Water Poverty of Indrawati Basin, Analysis and Mapping, June 2012; 2012. Available online: https://wwf.panda.org/?205791/water-poverty-of-indrawati-basin---analysis-and-mapping (accessed on 16 January 2020).
  19. Lawrence, P.R.; Meigh, J.; Sullivan, C. The Water Poverty Index: An International Comparison; Citeseer. 2002. Available online: https://econpapers.repec.org/paper/wpawuwpdc/0211003.htm (accessed on 16 January 2020).
  20. Merz, J. Water balances, floods and sediment transport in the Hindu Kush-Himalayas. Geogr. Bernensia G 2004, 72, 1–339. [Google Scholar]
  21. Karki, R.; Gurung, A. An overview of climate change and its impact on agriculture: A review from least developing country, Nepal. Int. J. Ecosyst. 2012, 2, 19–24. [Google Scholar] [CrossRef] [Green Version]
  22. Palazzoli, I.; Maskey, S.; Uhlenbrook, S.; Nana, E.; Bocchiola, D. Impact of prospective climate change on water resources and crop yields in the Indrawati basin, Nepal. Agric. Syst. 2015, 133, 143–157. [Google Scholar] [CrossRef]
  23. NAPA. National Adaptation Programme of Action (NAPA); Government of Nepal, Ministry of Environment: Kathmandu, Nepal, 2010.
  24. Gurung, A.; Adhikari, S.; Chauhan, R.; Thakuri, S.; Nakarmi, S.; Ghale, S.; Dongol, B.S.; Rijal, D. Water crises in water-rich country: Case studies from rural watersheds of Nepal’s mid-hills. Water Policy 2019, 21, 826–847. [Google Scholar] [CrossRef]
  25. Dixit, A.; Upadhya, M.; Dixit, K.; Pokhrel, A.; Rai, D.R. Living with Water Stress in the Hills of the Koshi Basin, Nepal; Institute for Social and Environmental Transition-Nepal (ISET-N): Kathmandu, Nepal, 2009; Available online: https://pdfs.semanticscholar.org/f908/1d8fda155931cc8d28936bc41181c9a85f37.pdf (accessed on 16 January 2020).
  26. Agarwal, A.; Babel, M.S.; Maskey, S. Analysis of future precipitation in the Koshi river basin, Nepal. J. Hydrol. 2014, 513, 422–434. [Google Scholar] [CrossRef]
  27. NCVS. Vulnerability Through the Eyes of the Vulnerable: Climate Change Induced Uncertainties and Nepal’s Development Predicaments; Institute for Social and Environmental Transition–Nepal (ISET-N): Kathmandu, Nepal, 2009; Available online: https://www.preventionweb.net/publications/view/12565 (accessed on 16 January 2020).
  28. Alomia-Hinojosa, V.; Speelman, E.N.; Thapa, A.; Wei, H.-E.; McDonald, A.J.; Tittonell, P.; Groot, J.C. Exploring farmer perceptions of agricultural innovations for maize-legume intensification in the mid-hills region of Nepal. Int. J. Agric. Sustain. 2018, 16, 74–93. [Google Scholar] [CrossRef] [Green Version]
  29. Paudel, B.; Zhang, Y.; Li, S.; Liu, L. Spatiotemporal changes in agricultural land cover in Nepal over the last 100 years. J. Geogr. Sci. 2018, 28, 1519–1537. [Google Scholar] [CrossRef] [Green Version]
  30. Subedi, Y.R.; Mulia, R.; Cedamon, E.; Lusiana, B.; Shrestha, K.; Nuberg, I. Local knowledge on factors leading to agroforestry diversification in mid-hills of Nepal. J. For. Livelihood 2018, 15, 2. [Google Scholar]
  31. Mandal, M. Social Inclusion of Ethnic Communities in Contemporary Nepal; KW Publishers Pvt Ltd.: Delhi, India, 2013. [Google Scholar]
  32. Sullivan, C.; Meigh, J. Considering the Water Poverty Index in the context of poverty alleviation. Water Policy 2003, 5, 513–528. [Google Scholar] [CrossRef]
  33. Jafari Shalamzari, M.; Zhang, W. Assessing water scarcity using the Water Poverty Index (WPI) in Golestan province of Iran. Water 2018, 10, 1079. [Google Scholar] [CrossRef] [Green Version]
  34. Liu, W.; Zhao, M.; Xu, T. Water poverty in rural communities of arid areas in China. Water 2018, 10, 505. [Google Scholar] [CrossRef] [Green Version]
  35. Sinha, R.; Gupta, A.; Mishra, K.; Tripathi, S.; Nepal, S.; Wahid, S.; Swarnkar, S. Basin-scale hydrology and sediment dynamics of the Kosi river in the Himalayan foreland. J. Hydrol. 2019, 570, 156–166. [Google Scholar] [CrossRef]
  36. CBS. National Population and Housing Census, National Report; Government of Nepal: Kathmandu, Nepal, 2011.
  37. Alessa, L.; Kliskey, A.; Lammers, R.; Arp, C.; White, D.; Hinzman, L.; Busey, R. The arctic water resource vulnerability index: An integrated assessment tool for community resilience and vulnerability with respect to freshwater. Environ. Manag. 2008, 42, 523. [Google Scholar] [CrossRef]
  38. Hamouda, M.A.; El-Din, M.M.N.; Moursy, F.I. Vulnerability assessment of water resources systems in the Eastern Nile Basin. Int. Ser. Prog. Wat Resour. 2009, 23, 2697–2725. [Google Scholar] [CrossRef]
  39. MoAD. Statistical Information on Nepalese Agriculture; Government of Nepal, Ministry of Agricultural Development: Kathmandu, Nepal, 2016. Available online: http://www.indiaenvironmentportal.org.in/files/file/YearBook2013.pdf (accessed on 16 January 2020).
  40. Brooks, N.; Adger, W.N.; Kelly, P.M. The determinants of vulnerability and adaptive capacity at the national level and the implications for adaptation. Glob. Environ. Chang. 2005, 15, 151–163. [Google Scholar] [CrossRef]
  41. Huang, S.; Feng, Q.; Lu, Z.; Wen, X.; Deo, R. Trend analysis of water poverty index for assessment of water stress and water management polices: A case study in the Hexi Corridor, China. Sustainability 2017, 9, 756. [Google Scholar] [CrossRef] [Green Version]
  42. Appelgren, B.; Klohn, W. Management of water scarcity: A focus on social capacities and options. Phys. Chem. Earth Pt B 1999, 24, 361–373. [Google Scholar] [CrossRef]
  43. Van Ty, T.; Sunada, K.; Ichikawa, Y.; Oishi, S. Evaluation of the state of water resources using Modified Water Poverty Index: A case study in the Srepok River basin, Vietnam–Cambodia. Int. J. River Basin Manag. 2010, 8, 305–317. [Google Scholar] [CrossRef]
Figure 1. Districts of Koshi River Basin in Nepal.
Sustainability 12 00727 g001
Figure 2. Water Poverty Index (WPI) components and indicators used in the study.
Sustainability 12 00727 g002
Figure 3. Scores for Water Poverty Index (WPI) components in 27 districts of Koshi Basin, Nepal. Where, R, A, U, C, and E are Resource, Access, Use, Capacity and Environment components, respectively.
Sustainability 12 00727 g003
Figure 4. Water Poverty Index (WPI) and component scores for districts in Koshi River Basin, Nepal. Where, horizontal axis represents the WPI score ranging from 0–100 (0 is most water poor and 100 is least water poor).
Sustainability 12 00727 g004
Figure 5. Spatial variation of Water Poverty Index (WPI) along districts of Koshi Basin, Nepal.
Sustainability 12 00727 g005
Figure 6. Spatial variation in Water Poverty Index (WPI) components and Human Development Index (HDI).
Sustainability 12 00727 g006
Figure 7. Water Poverty Index (WPI) components in three agro-ecological regions of Koshi Basin, Nepal.
Sustainability 12 00727 g007
Table 1. Water Poverty Index (WPI) components, indicators, description and data sources used for the study.
WPI ComponentIndicatorDescription/Relation with WPIReferencesData Sources
Resource (R)1. Per capita annual water resources (m3/year) (R1)Physical availability of water resources (+)[33,34][35,36]
2. Coefficient of variation of rainfall (R2)Variability of water availability (−)[1,37]Department of Hydrology and Meteorology Nepal (DHM)
Access (A)3. % population with access to clean water (A1)Provision of safe water (+)[15,38][36]
4. % population with access to sanitation (A2)Provision of sanitation (+)[1,32]
Use (U)5. Ratio of irrigated to cultivated area (U1)Water use by agricultural sector (+)[3,14][39]
6. Households (HHs) having sufficient water for domestic use (days/year) (U2)Domestic water use (+) Database from ICIMOD, Koshi Basin Information System (KBIS)
7. HHs having sufficient water for agricultural use (days/year) (U3)Agricultural water use (+)
Capacity (C)8. Literacy rate (C1)Access to information (+)[40][36]
9. GDP index (C2)Economic capacity to use water (+)[41,42]
10. Ratio of Adult Economically Active Population Engaged in Non-agriculture to Agriculture (C3)Reliable income source (+)[38]
Environment (E)11. Fertilizer used per hectare (E1)Degradation of water sources (−)[3,14][36]
12. Percentage of area with natural vegetation (E2)Natural water balance (+)[1,32][39]
Table 2. Comparison of Water Poverty Index (WPI) and its components in 3 agro-ecological regions.
RegionRAUCEWPI
Tarai24.561.286.751.453.955.6
Mid-hill42.373.359.857.664.859.6
High-hill58.676.454.460.770.664.1

