Tourist Flow Management: Social Impact Evaluation through Social Network Analysis


Faculty of Engineering and Architecture, University “Kore” of Enna, 94100 Enna, Italy
*
Author to whom correspondence should be addressed.
Sustainability 2020, 12(2), 731; https://0-doi-org.brum.beds.ac.uk/10.3390/su12020731
Submission received: 20 December 2019
/
Revised: 6 January 2020
/
Accepted: 9 January 2020
/
Published: 19 January 2020
(This article belongs to the Special Issue Enhancement of Public Real-estate Assets and Cultural Heritage: Management Plans and Models, Innovative Practices and Tools in Supporting the Local Sustainable Development)
Abstract
:The present paper was prompted by the activity carried out within the scope of an EU-funded project (WARMEST). It calls to analyse the reasons for the degradation of the Patio de Los Leones, which attracts over 2 million tourists per year to Granada in Spain. We review here the most advanced studies and regulations on the assessment of the social impact of mass tourism and present a novel methodology to analyse its effects. We dug into the material available on social networks—especially feedback to posts published on major relevant sites—and got a comprehensive picture of the thoughts that were expressed there and a comprehensive assessment of the citizens’ opinion on the social impact of tourism in Granada. Thus, we obtained a new indicator called “C.1.2 index modified”, which measures the level of dissatisfaction of citizens with the tourists’ pressure; we propose to replace the existing ETIS index with C.1.2, which is mainly based on direct surveys that are often carried out with very limited resources. At the end of the research, we could point out topics that are especially important to the citizens, thus allowing us to define a strategic action plan with a bottom-up approach.
1. Introduction
The paper aims to define a new methodology to measure the attitude of the population living in major destinations of cultural tourism vis-à-vis the increasing number of visitors. This growing flow is strongly affecting residents’ everyday lives as well as their attitude towards their cities, especially their city centres. While is it easier to establish the cities’ capacity to properly host visitors by means of quantitative data that are often available, it is far more complex to follow the residents’ attitude. To date, the main tools required, also at a European level, were direct interviews and questionnaires, which entail considerable time and effort to convey significant information. Our approach is to use social networks instead, which can be analysed—as we did—through proper tools. Such tools, more specifically the one that we selected, can deliver a larger and more representative set of data according to a well-specified procedure that can be repeated, thus enabling us to compare results over time and define a trend. The paper was prompted by the activity carried out within the scope of an EU-funded project (WARMEST) [1]. Its goal is to analyse monuments’ degradation due to factors such as climate change and the growing number of tourists, create a model to describe and anticipate the phenomenon, and put in place a user-friendly decision support system that will help in setting up preventive maintenance plans. As part of the project, we had the chance to study in depth the degradation at the Patio de Los Leones, the core of the world-famous site of the Alhambra and Generalife, which attracts over 2 million tourists per year to Granada (whose population is around 232.000 individuals) in Spain, where they are located.
The United Nations Environment Program (UNEP) and the World Tourism Organization (WTO) defined sustainable tourism as “tourism that takes full account of its current and future economic, social and environmental impacts, addressing the needs of visitors, the industry, the environment and host communities” [2].
The definition of sustainability can be applied to tourism by referring to the following three aspects: environmental, economic, and socio-cultural. The aim is to find a balance between the requirements thus defined, i.e., to make responsible use of environmental resources, respect the socio-cultural traditions of the hosting communities, and ensure long-term economic activities for all stakeholders, including employment opportunities and social services [3].
The World Tourism Organization (UNWTO), in its 2018 annual report, showed that tourists worldwide increased from 25 million in 1950 to 1.3 billion in 2017. This growth trend has advantages and disadvantages. On the one hand, the larger number of tourists contributes significantly to the socio-economic well-being and cultural development of cities. On the other hand, the negative attitude of the local population towards visitors increases due to perceived overcrowding, noise, and other resulting nuisances [4].
In Spain, this issue affects several cities. The citizens there tend to mobilise and publicly express their dissatisfaction; movements based on anti-tourism and tourist-phobia are growing [5,6]. Spanish mass media has been putting the topic at the forefront of public debate.
In this context, the present paper reviews the state of the art on the assessment of the social impact of mass tourism and analyses its effects through a novel methodology based on digging into the material published on social networks. The methodology is then applied to a case study, the city of Granada, where, in recent years, the threat posed by mass tourism to the preservation of its values is increasingly perceived.
2. Literature Review
Several studies were published regarding the social impact of an uncontrolled flow of tourists. Some of them refer to the definition given by UNWTO to the Tourism Carrying Capacity (TCC), i.e., “the maximum number of people that may visit a tourist destination at the same time without causing destruction of the physical, economic, or socio-cultural environment and an unacceptable decrease in tourist satisfaction” [7]. Various attempts were made to quantitatively assess the TCC, setting a maximum number of tourists, beyond which the destination begins to decay [8]. Yet, as Saveriades (2000) pointed out, there is no universally accepted definition of TCC [9] and no unique model is applicable to asses it for each tourist destination. The methodologies are serving many different purposes and are getting uneven results [10]. The reason for the lack of a unique method is that the approach is strongly influenced by the intrinsic characteristics of the venue taken into consideration.
The UNWTO identifies five types of TCC [11]:
- Ecological capacity: the ability of certain species to withstand disturbance thanks to biological and physical elements.
- Socio-cultural capacity: measured by the intolerable impacts on the local community or limitations due to the availability of human resources.
- Psychological capacity: given by the amount of crowding that tourists can endure without affecting the quality of their experience. This changes according to the types of tourist and the types of activity and their use.
- Infrastructural capacity: it refers to factors such as the number of bedrooms, the capacity of transport systems, or water supply. It can easily vary in the medium to long term.
- Management capacity: it is the number of tourists that can be handled in a city without creating economic and administrative issues.
Regarding socio-cultural capacity, UNWTO refers to the tourist’s perception and the quality of experience without mentioning the social impact of tourism on resident citizens.
Several authors evaluate the experience of tourists and the social impact that the flow of tourists generates on residents by means of survey-based questionnaires [12,13,14], the processing, administration, and analysis of which is very long.
Additionally, in recent years, the European Commission has been working to achieve the objectives of sustainable tourism development set out in Agenda 2030. In 2013, it introduced the European Tourism Indicators Systems (ETIS) [15]. It is a management, information, and monitoring tool specifically intended for tourism destinations, which supports the activity of collecting and analysing data with the overall goal of assessing the impact of tourism on a destination. The system aims to identify the key problems and determine the best intervention strategies for the management of the tourist flow.
ETIS lists 43 main indicators and other optional ones, dividing them in four categories:
- Destination management
- Economic value
- Social and cultural impact
- Environmental impact
Each of these categories is then divided into criteria and sub criteria. Table 1 is an extract of the ETIS indicators relating to the criteria required to assess the social and cultural impact of tourism.
The first, third and fourth indexes are easy to compute because they require easily available data (the number of tourists, the number of beds in accommodations, and the number of second homes). The second index is more complex because the percentage of residents who are satisfied with tourism in the destination is not an easily measurable value.
For each indicator, the European Commission defines: the reason for measurement, the data requirements, the method of calculation, the frequency of data collection, the reporting format, and the suggestion of actions (regarding indicator C.1.2, see Table 2). When the data to quantitatively measure ETIS indicators is missing, the European Commission suggests using questionnaires as helping tools. The European Commission has also prepared a predefined questionnaire for interviewing a group of people (on average 15–20 individuals) living in the tourist destination and working in the tourism sector.
Some researchers also relied on questionnaires as a survey method to assess the evaluation of the social and cultural impact of tourism. Tudorache et al. (2017) [17] and Modica et al. (2018) [18] used ETIS indicators to assess social impact in different environments and both concluded that their new indicators should be added to ETIS in order to analyse aspects that are difficult to compute.
Despite the widespread use of questionnaires as a method of data collection, many authors define it as an obsolete method [19,20] and other ones defines it as a “static method” [21] that does not take into account the speed in which opinions and preferences change. Moreover, high-quality data requires high costs and a lot of time investment due to the needed number and time of the following groups: researchers, who design the surveys; interviewers, who collect the data; and respondents, who voluntarily provide answers. Moreover, the people interviewed often give superficial answers due to their lack of interest.
Our research proposes an alternative method to collect data and evaluate the C.1.2 indicator, which defines “the percentage of residents who are satisfied with tourism in the destination (per month/season)”. We apply a method of social network analysis to assess the citizens’ opinion about the social impact of tourist flows in Granada using feedbacks to posts.
3. Materials and Methods
3.1. Social Network Analysis
The analysis of the information provided by social networks can be useful to understand public opinion regarding the effects of mass tourism. It can also help to track changes in mass tourism continuously and in real time, while questionnaires can be used to deliver random surveys.
The advantages are:
- People’s comments and reactions highlight issues of social relevance;
- Free access to social network archives allows people to explore all published posts;
- The level of interest in a topic can be assessed by counting the number of people sharing, appreciating, or commenting on the posts related to that topic;
- The discussion’s content can be analysed by classifying it as a positive or negative a message published on the web. This process is called sentiment analysis.
3.2. Methodology
Recently, the use of social networks (Facebook, Instagram, Twitter) has become obvious, allowing us to share thoughts or multimedia content and to create a wide interaction among users.
In this paper we propose a new approach to assess the local populations’ degree of dissatisfaction with tourism flow through the analysis of the social network content.
The proposed procedure is divided into 8 steps:
- Definition of the topic: the thorough and precise definition of the subject under investigation is key to clearly set the goal of the analysis.
- Selection of the sources: once the investigation subject and the goal are defined, the available media (online newspaper, journals, blogs, etc.) must be listed, searched, and analysed. The result is the identification of the groups and associations discussing the relevant issues related to the city of the selected media. Neighbourhood associations, created to defend citizens, are especially relevant to our research topic are. These associations usually communicate and share news through social network pages, and on these pages, citizens share new ideas and deal with emerging problems.
- Analysis of the social network pages: the analysis of the groups or associations on social pages allows us not only to evaluate the citizens’ opinion about certain events but also to collect useful data for the investigation.
- Definition of the keywords for post selection: key word selection is pivotal to pick up the most significant information related to the investigated topic. Within Facebook, it is possible to extract all posts containing a given keyword.
- Selection of the social network analytical tool: social networks allow us to have an overview of the page’s performance, but these data are confidential and can only be extracted by page administrators. Therefore, it is necessary to find other tools useful for defining the key metrics and to extract data from social networks. Several are available online.
- Analysis of the key metrics: social network activity is measured through KPIs (Key Performance Indicators) that provide accurate information on the page performance of interest. Some helpful KPIs are:
- Activity metrics: KPIs measuring the page activity level (such as the number of posts, temporal frequency, and the recency of posting activity)
- Interaction metrics: KPIs measuring the level of interaction between posts and users (the number of comments, reactions, and shares).
- Collection of reactions to the selected posts: the analysis of the feelings and thoughts of the citizens involved in an event is important to understand its effects in terms of social impact.
- Dissatisfaction index calculation: in the last phase, the reactions collected over the selected period of time are quantified and a dissatisfaction index in relation to mass tourism is computed. The procedure required to achieve this, is divided into the following steps:
- Within the selected social networks, the “angry” reactions related to tourist protests (A) should be picked and separated from the rest (the total number of posts with “angry” reactions) (B);
- Calculate the functions A = f(x) and B = z(x) of reactions A and B over time (days/months) for each year (n = a, a+1, …, N);
- Calculate the integrals TAa e TAb of the functions f(x) and z(x) for each N year;
- Analyse the performance of TAa and TAb over time;
- Replace the ETIS index C.1.2. (Percentage of residents who are satisfied with tourism in the destination (per month/season)) with the “C.1.2 index modified”, which is the ratio between the “angry” reactions related to tourism flow and the total “angry” reactions in the period of interest (per month/season).
Thus, we can compute the dissatisfaction “C.1.2 index modified” without using surveys; we use the followers’ reaction to obtain a quantitative value of the level of disaffection of local citizens vis-à-vis mass tourism in their cities. This value reflects the citizens’ real opinions and can be analysed and compared over time.
4. Results
4.1. Case Study—Granada
The case study on which we have focused, as part of the research effort carried out within the European financed project H2020/MSCA/RISE2017/Warmest, is the city of Granada in Spain, which is among the most visited Spanish cities due to the Alhambra [22]. This monumental complex is located on a rocky hill on the banks of the River Darro. In the XIII century, the Nasrid kingdom was established and the first palace was built by the founder King Mohammed ibn Yusuf ben Nasr. In the XIII, XIV, and XV centuries, the fortress consisted of two main areas: the military area (Alcazaba) and the medina where there are the famous Nasrid Palaces and the remains of the houses of noblemen and plebeians. In the 1492, Catholic kings took the Alhambra, and later on the emperor Carlos V built a palace there. The complex also consists of the Generalife, a palace surrounded by orchards and gardens [23].
The monumental complex of the Alhambra and the Generalife has been a UNESCO World Heritage Site since 1984 and is Granada’s main tourist destination, although not the only one. As history shows, the Alhambra has always been the core of the city of Granada. It was first a military and commercial resource, and today it is an economic resource for the large number of tourists it attracts. Figure 1 shows the annual trend of tourists visiting the Alhambra and Generalife. From 1991 to 2018 their number increased to almost 3 million.
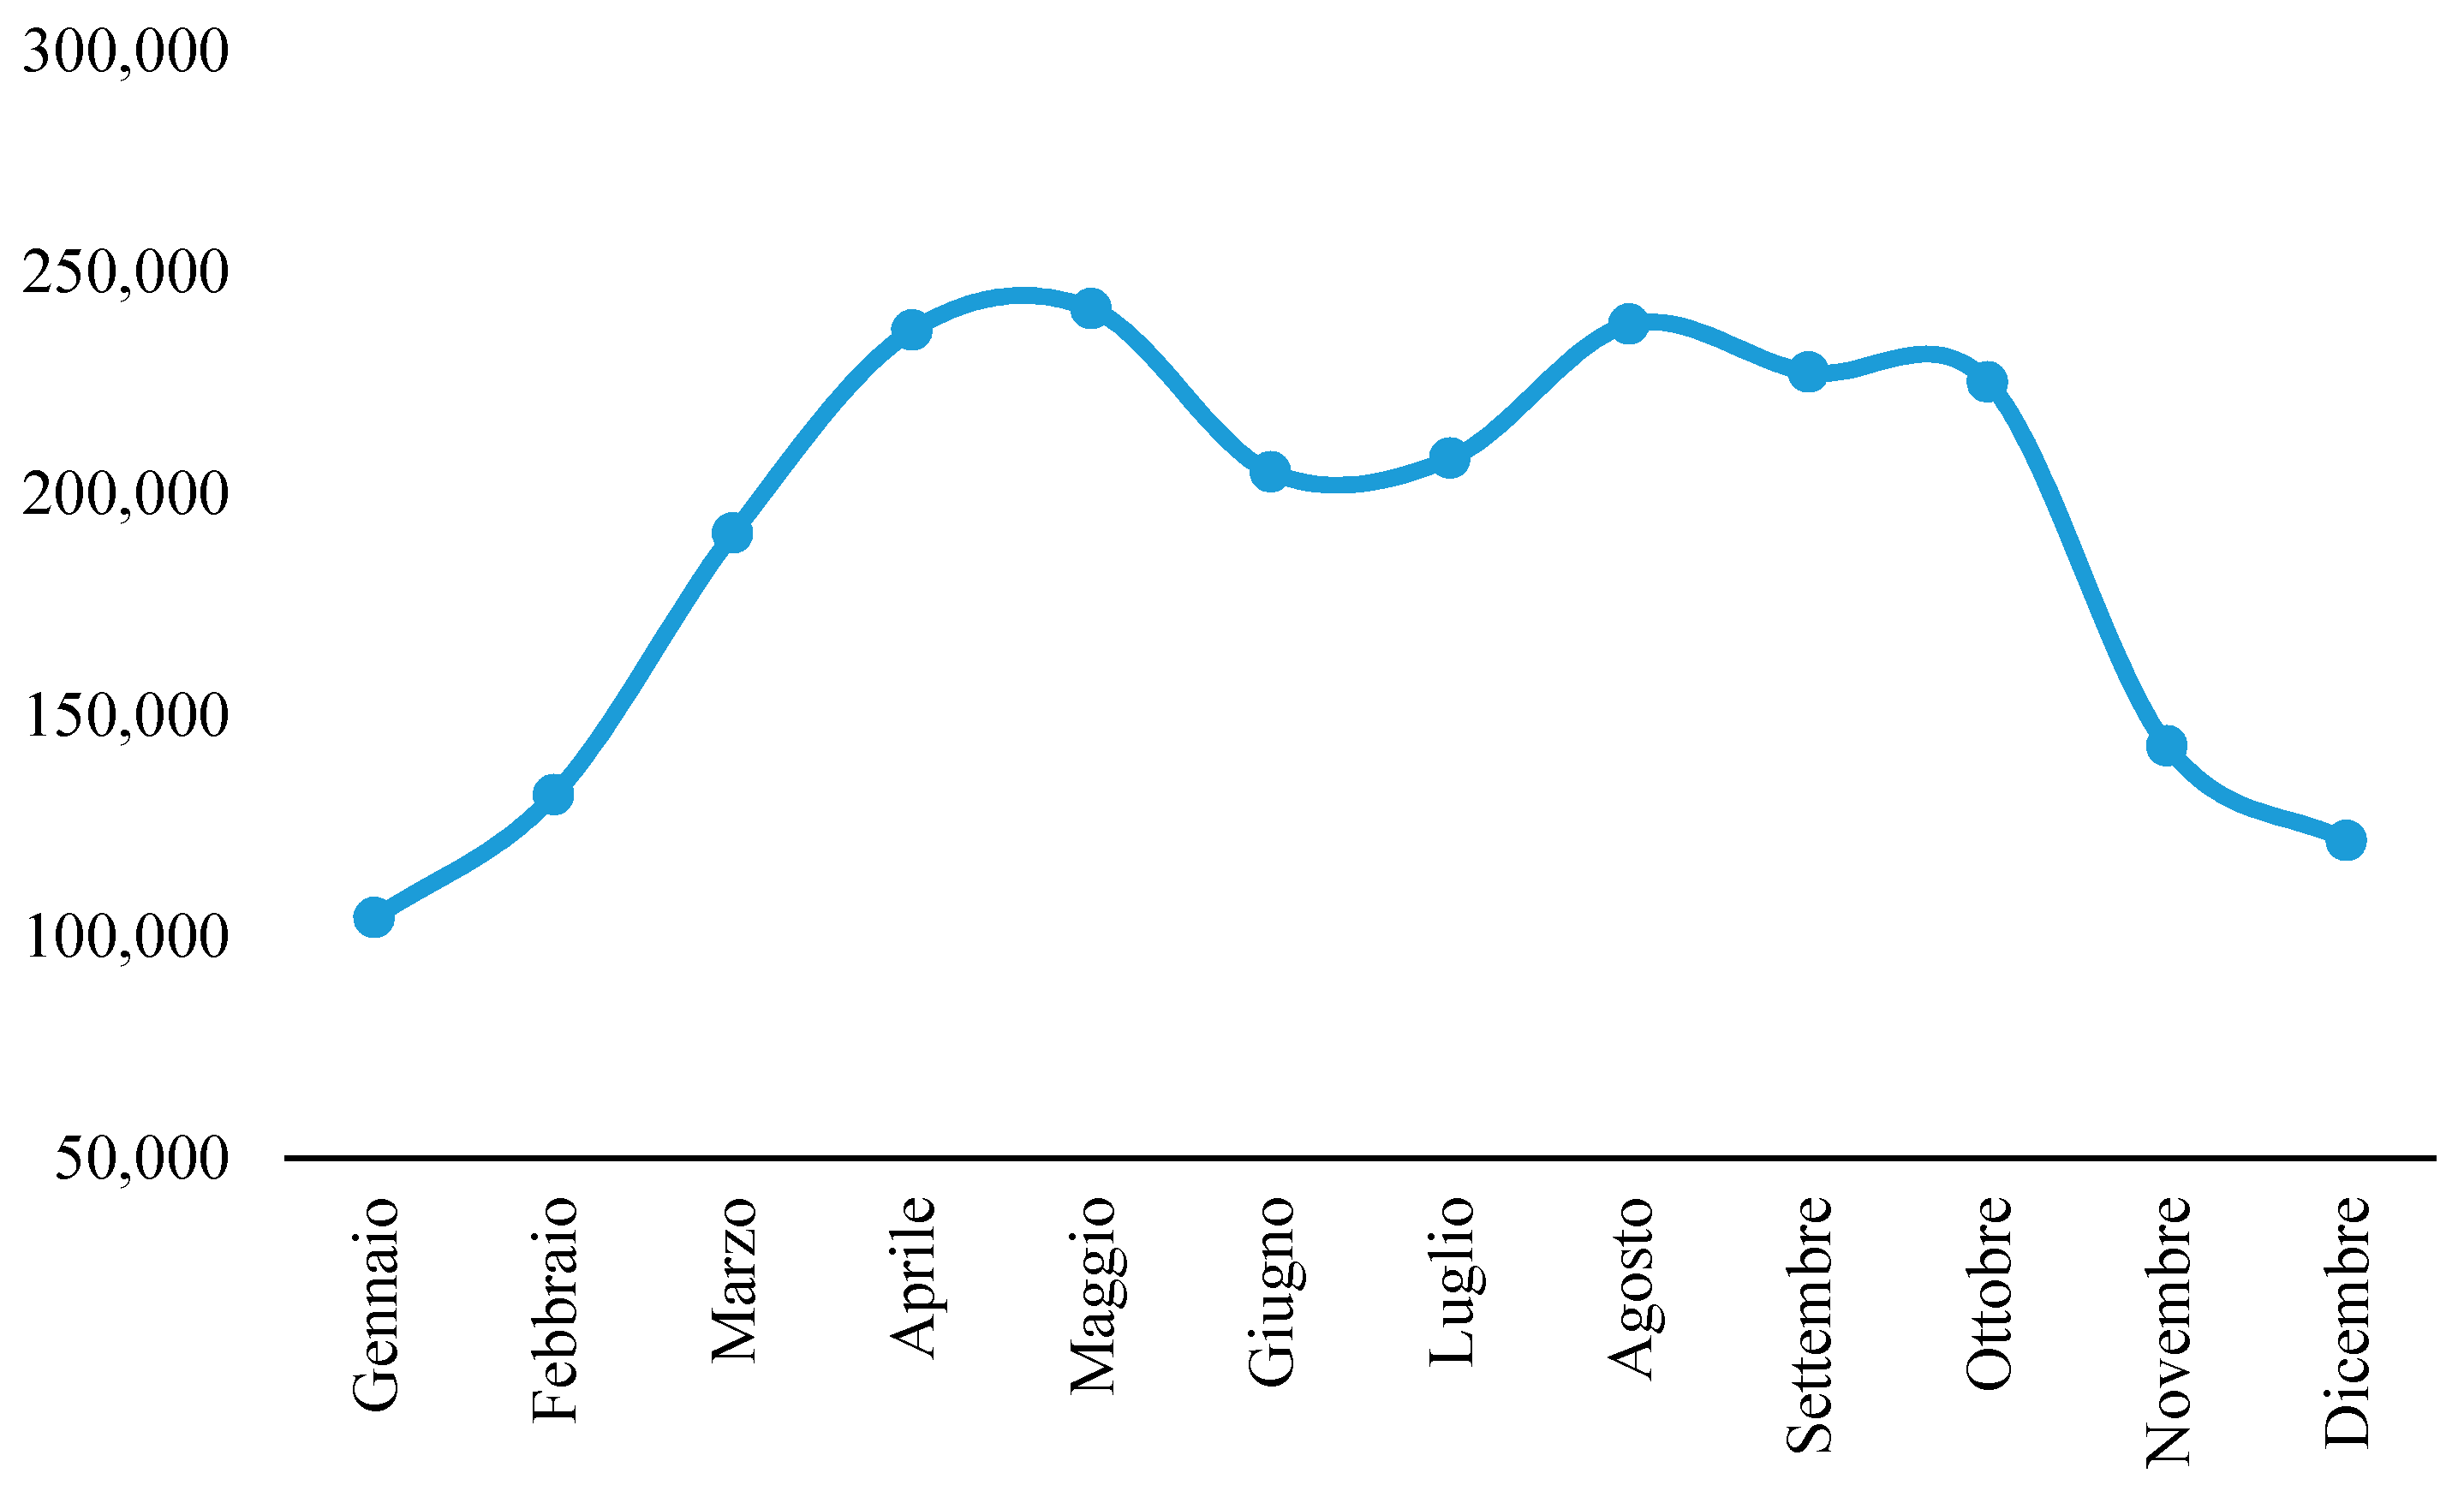
On the other hand, Figure 2 shows the average monthly distribution of visitors from 1991 to 2018. In terms of tourist flow, years may be divided into three different seasons: a low, a medium, and a high one. The low season includes January, February, November, and December (22% of the annual flow). The medium season includes March, June, and July (27% of the annual flow). The high season includes April, May, August, September, and October (51% of the annual flow).
According to official data, the resident population in Granada is 232,000 inhabitants [25] and tourists are more than 4.5 million [22]. The latest annual Exceltur report (Alliance for Excellency in Tourism) shows how tourist pressure in Granada is the highest of the 15 most visited destinations in Spain [26]. The report states that “the main factor determining the increase in tourist pressure in Spanish cities is the transformation of housing into tourist accommodation. In fact, in cities where there has been a greater social response to tourism are those with a significant percentage of tourist accommodation”.
In Granada, 55% of tourists choose to stay in apartments found through peer-to-peer hosting, such as Airbnb. The remaining 45% still choose “traditional” accommodation in hotels and hostels.
Homesharing platforms have become very powerful tools for the development, increase in incomes, and the promotion of tourist destinations; at the same time, they have brought significant disadvantages when used in an unregulated manner. As in many cities in Europe, in Granada citizens move from the old town to the so-called new towns [27], pushed by the increase in nightlife, restaurants, souvenir shops, and city traffic. In addition, there is a growing trend in flat owners to invest in their apartments and transform them into tourist accommodation to receive a profit from them. The result of the rise in the number of apartments for homesharing is an increase in the price of rents, which tends to keep the local population even further away.
One of the most famous neighbourhoods of Granada is the Albayzin, located on a hill opposite the Alhambra and separated from it by the Darro River. It is characterized by narrow winding streets built during its Medieval Moorish period dating back to the Nasrid Kingdom of Granada. It was declared a World Heritage Site in 1984, along with the Alhambra. The socio-economic activities of the Albayzin district consist of typical North African shops with restaurants and small shops selling Moroccan goods (carpets, fabrics, jewellery, and coloured lamps). In recent years, most of the apartments in the neighbourhood have been converted into tourist apartments, losing their original social characteristics.
Nevertheless, Granada should not be considered as a case by itself but rather a good, though not extreme, case study of a tourist pressed city. In Italy, this phenomenon is even more serious in various venues. In Florence and Venice, the ratio among tourists and residents is even higher, at 26 and 45, respectively, which means that for each resident there are 26 tourists in Florence and 45 tourists in Venice [28,29,30]. Historical cities live a seemingly unstoppable process of “Disneyfication” [31]. The New York Times also defined Venice as “Disney on the sea” [5] because it is invaded by tourists from all over the world attracted by a venue that today is crushed by noise and landscape pollution.
Generally speaking, historic centres are undergoing a transformation process and are increasingly adapted to the needs of tourists and decreasingly to the citizens’ ones. Therefore, the risks are the loss of identity and the progressive abandonment of the historical centre [32].
4.2. The Proposed Methodology Applied to the Case of Granada
The methodology described above was applied, point by point, on the case study of Granada.
- 1.
- Definition of the topic: the subject selected for the research was the attitude of the residents towards the growing tourist flow in Granada, especially in the light of the outbursts of tourism-phobia that affected the city in recent times. To do this, we analysed the negative or positive impacts of tourists on Granada as perceived by the citizens.
- 2.
- Selection of the sources: local newspapers frequently report news on citizens’ complaints about mass tourism. Among these citizens, the majority live in the Albayzin, a historical district of Granada. The most striking protest event reported by local newspapers took place in May 2019. The walls of the main Albayzin streets were covered by graffiti “@tourist: go away” or “@tourist: flamenco is not a show” [24]. A few months later (August 2019) a group of citizens complained about the tourists’ lack of respect for the neighbourhood (or district) and its inhabitants. [25]. Several news reports also concern the inconvenience and damage caused by tourist buses that run along the typical streets of the neighbourhood [26].
We carried out a web investigation on social media that collects the citizens’ opinion on this matter. We identified two associations spreading information on the topic through their blogs and social platform (Facebook e Twitter). The first one, “Bajo Albayzin”, is a neighbourhood association founded in January 2000. It aims to improve the cultural, historical, social, urban, and environmental values of the Albayzin district. The second association, “SOS Alhambra”, was founded in July 2015 following a citizen’s protest against an architectural design involving a major transformation of the “atrium” area of the Alhambra, in front of the Carlos V palace. The aim of the organization is to warn about the possible environmental damage that the project could cause to the site, which is one of the UNESCO World Heritage Sites and it also generally provides information on the main problems affecting the monumental complex.
- 3.
- Analysis of the social network pages: To date, among the “Bajo Albayzin” communication platforms (blogs, Facebook, and Twitter), the Facebook page (2000 followers) is the most active in terms of published posts and reactions/comments to them. Although the Twitter page collects a thousand more followers than Facebook, it has not been active since August 2019. As far as the blog is concerned, it turned out to only be a data archive. There is no interaction (comments or shares) to the published posts there. The Facebook page of “SOS Alhambra” (1700 followers) is the most active platform compared to the blog and the Twitter page that counts only 450 followers. Thus, we chose to focus our attention on analysing data extracted from these Facebook pages.
- 4.
- Definition of key words for post selection: the data investigation was carried out through the following selected keywords: “protestas”, “turistas”, “turismo”, “turismo masivo”, “Alhambra” (Figure 3). Since 2016 to date, the followers of the “Bajo Albayzin” and “Sos Alhambra” pages published 370 posts with negative tourism reactions to the tourist flow.
We decided to focus on “Bajo Albayzin” because it hosts more articles regarding the citizens’ protests than “Sos Alhambra”, which appears to prefer political and administrative topics. The “Bajo Albayzin” association is in a direct relationship with the residents of the district and their problems, being themselves active in the neighbourhood. Moreover, Figure 4 shows that the engagement trend in “Bajo Albayzin” is higher than in “Sos Alhambra” in terms of shares, comments, publications, and reactions.
- 5.
- Selection of the social network analytical tools: Data collection was carried out through the platform called Social Insider. The co-operation between Kore University of Enna and the company allowed us to use freely the Pro version (generally it is charged). This tool is used to provide information for marketing companies in order to create more competitive benchmarks. We used it to analyse the two Facebook pages: “Bajo Albayzin” and “SoS Alhambra”. Social Insider offers advanced analysis functions for social networks, including:
- saving data for unlimited time;
- identification of the most performing posts;
- multi-page comparisons;
- analysis of own posts and those of competitors;
- extraction of reports in CSV, PDF, PPT format.
The tool can create charts automatically, providing information about the posts and the distribution of shares and reactions to posts over time.
- 6.
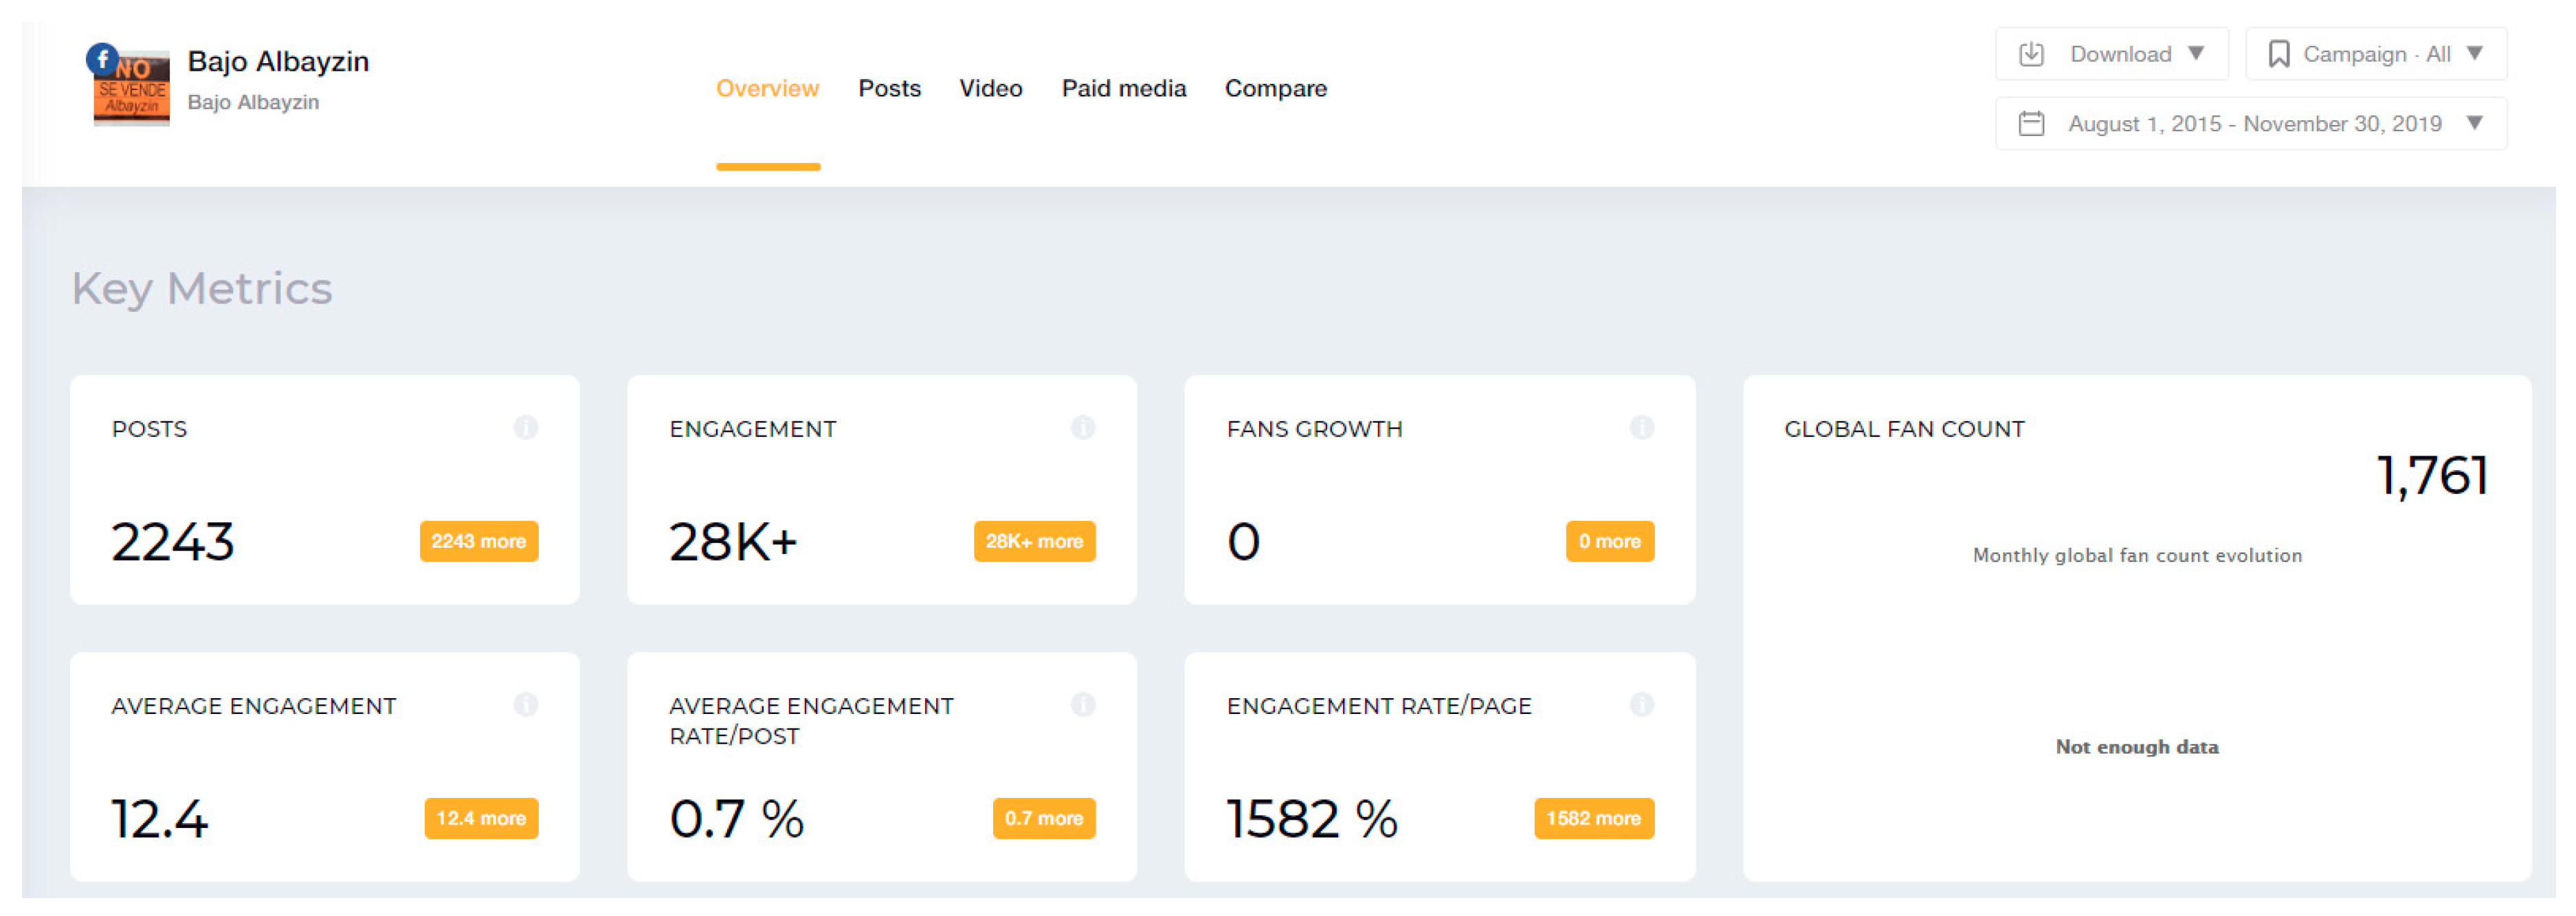
- Analysis of the key metrics: we analysed the key metrics of posts, fans, fan growth, and engagement from 2015 to date; as we can see (Figure 5) the fan growth remained unchanged, while the page remains active for posts publication.
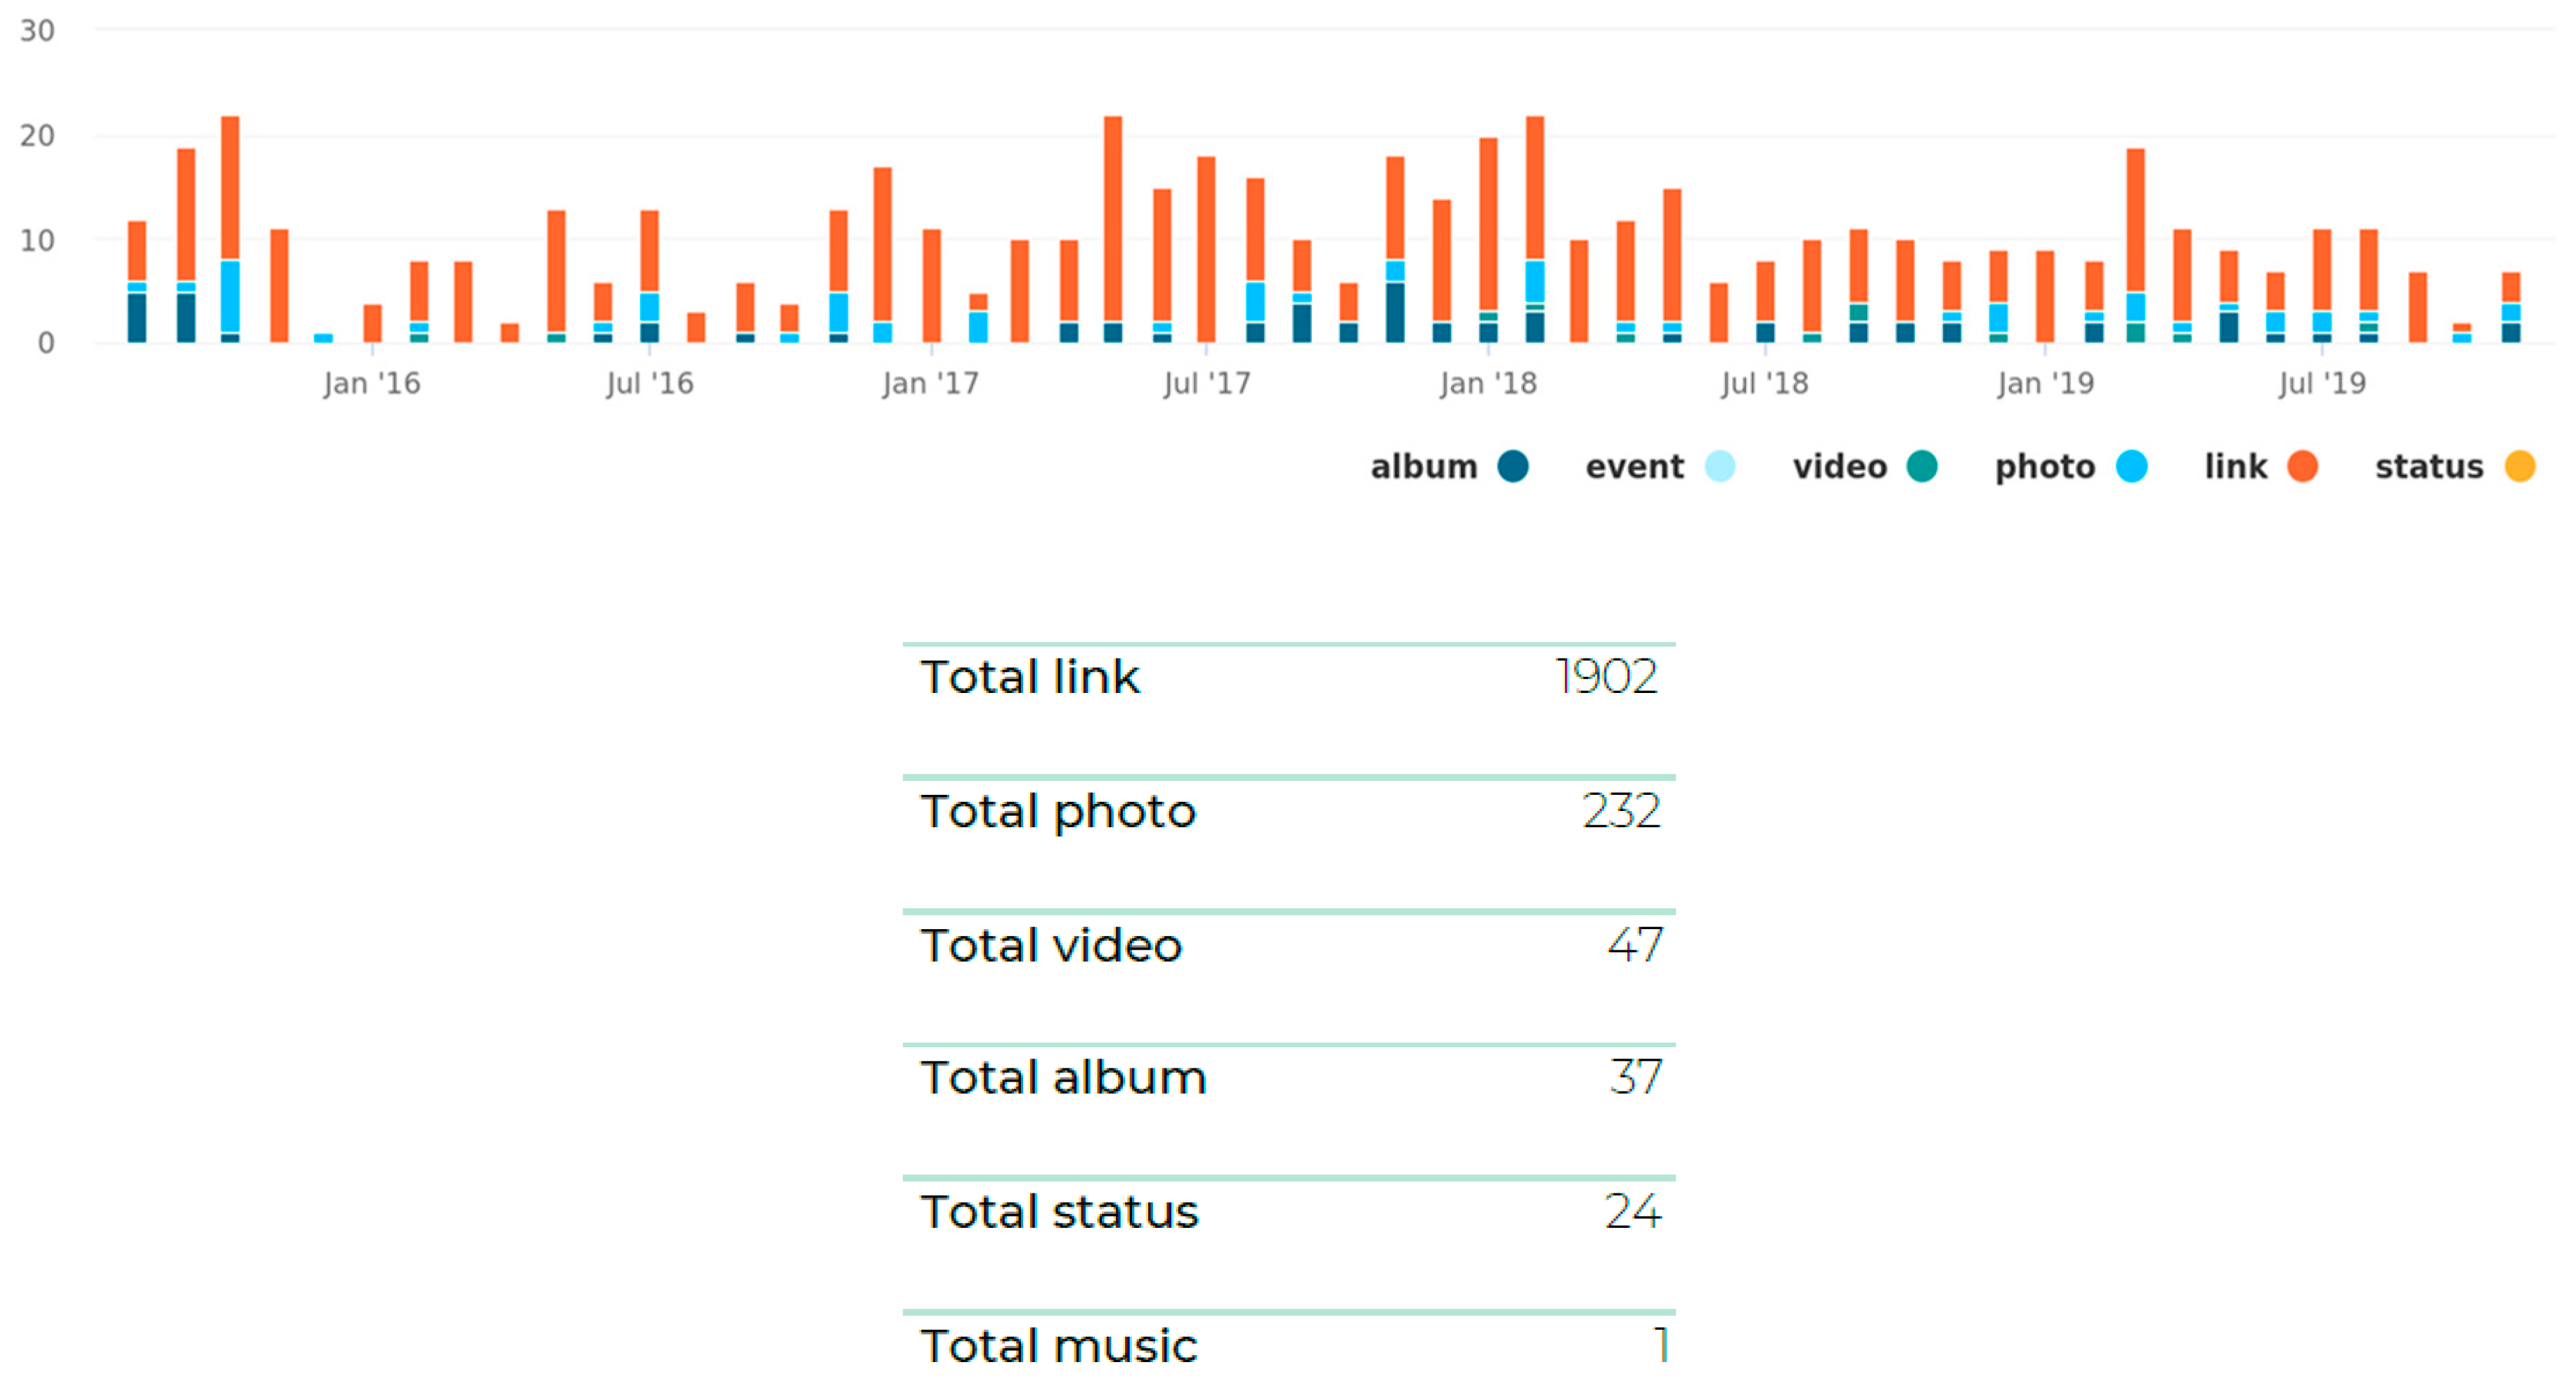
In particular, owing to the machine learning tool of the Social Insider, we were able to trace the distribution of the various posts—links, photos, videos, events, albums—in the time frame of interest.
The orange histogram bars, compared to the much shorter azure and blue, suggest which type of post is preferred: links are published significantly more often than other multimedia content (Figure 6).
The association, in fact, uses Facebook as a vehicle to spread information. Any new content, already made known by blogs or newspaper articles, is re-shared on the page to increase its circulation rate.
- 7.
- Collection of reactions to selected posts. The analysis of reactions was carried out through Facebook Reactions (Figure 7).
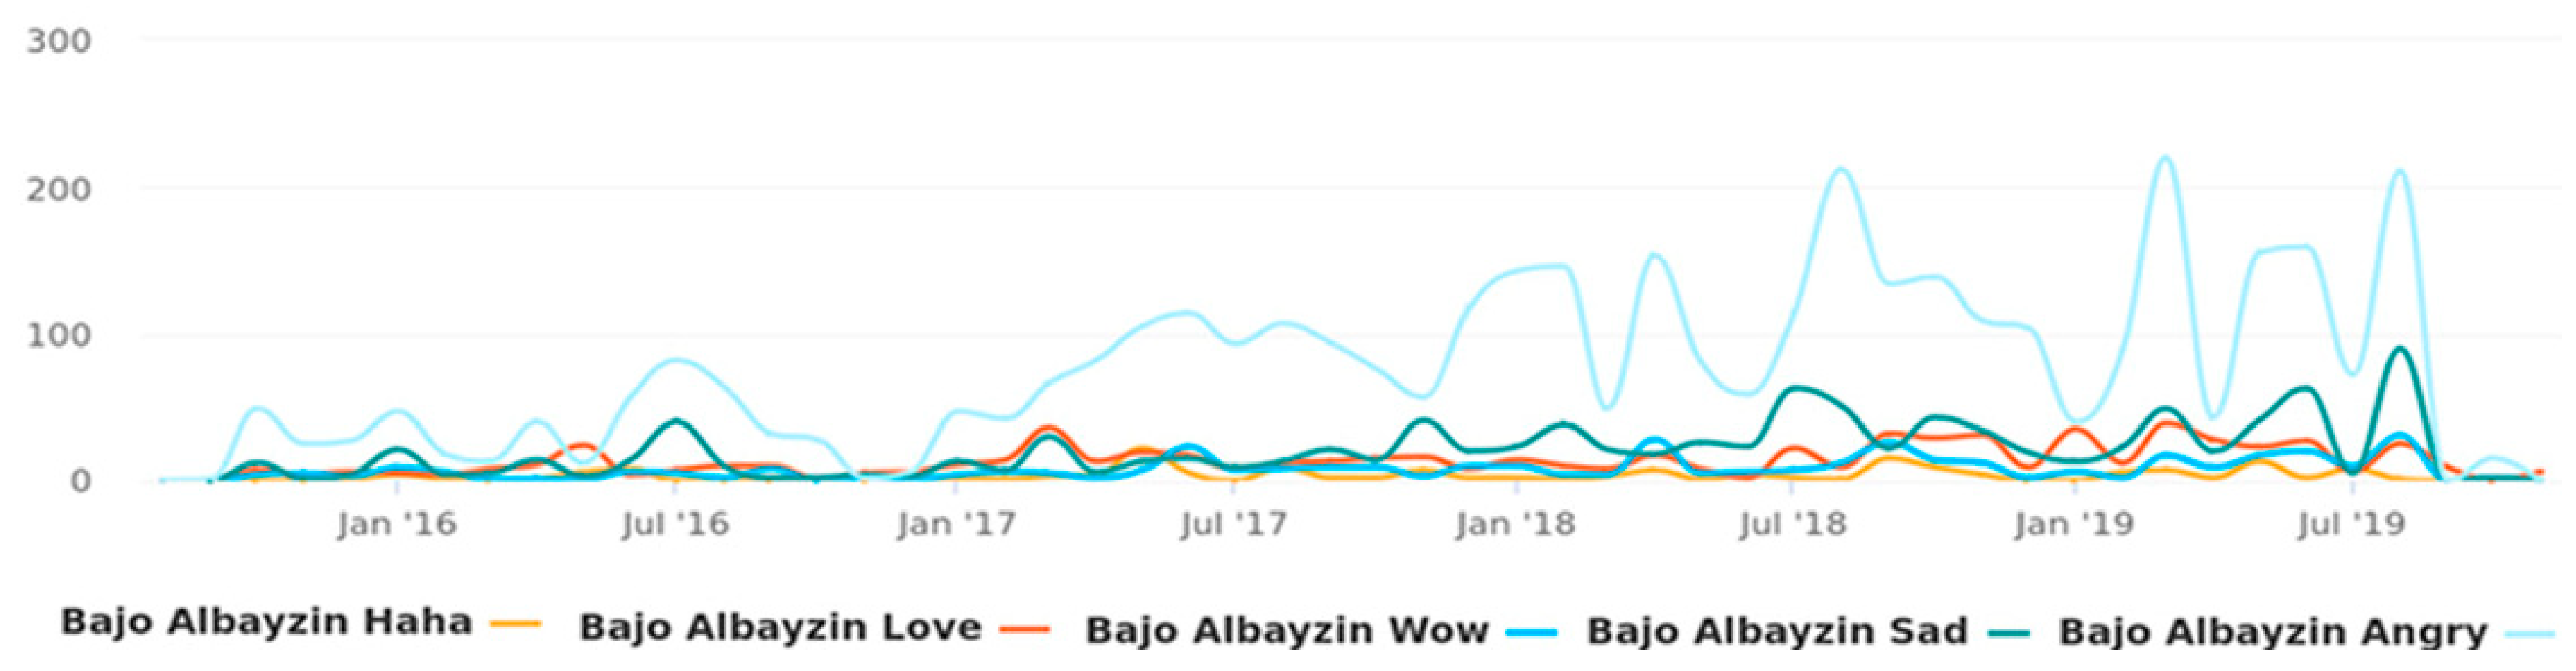
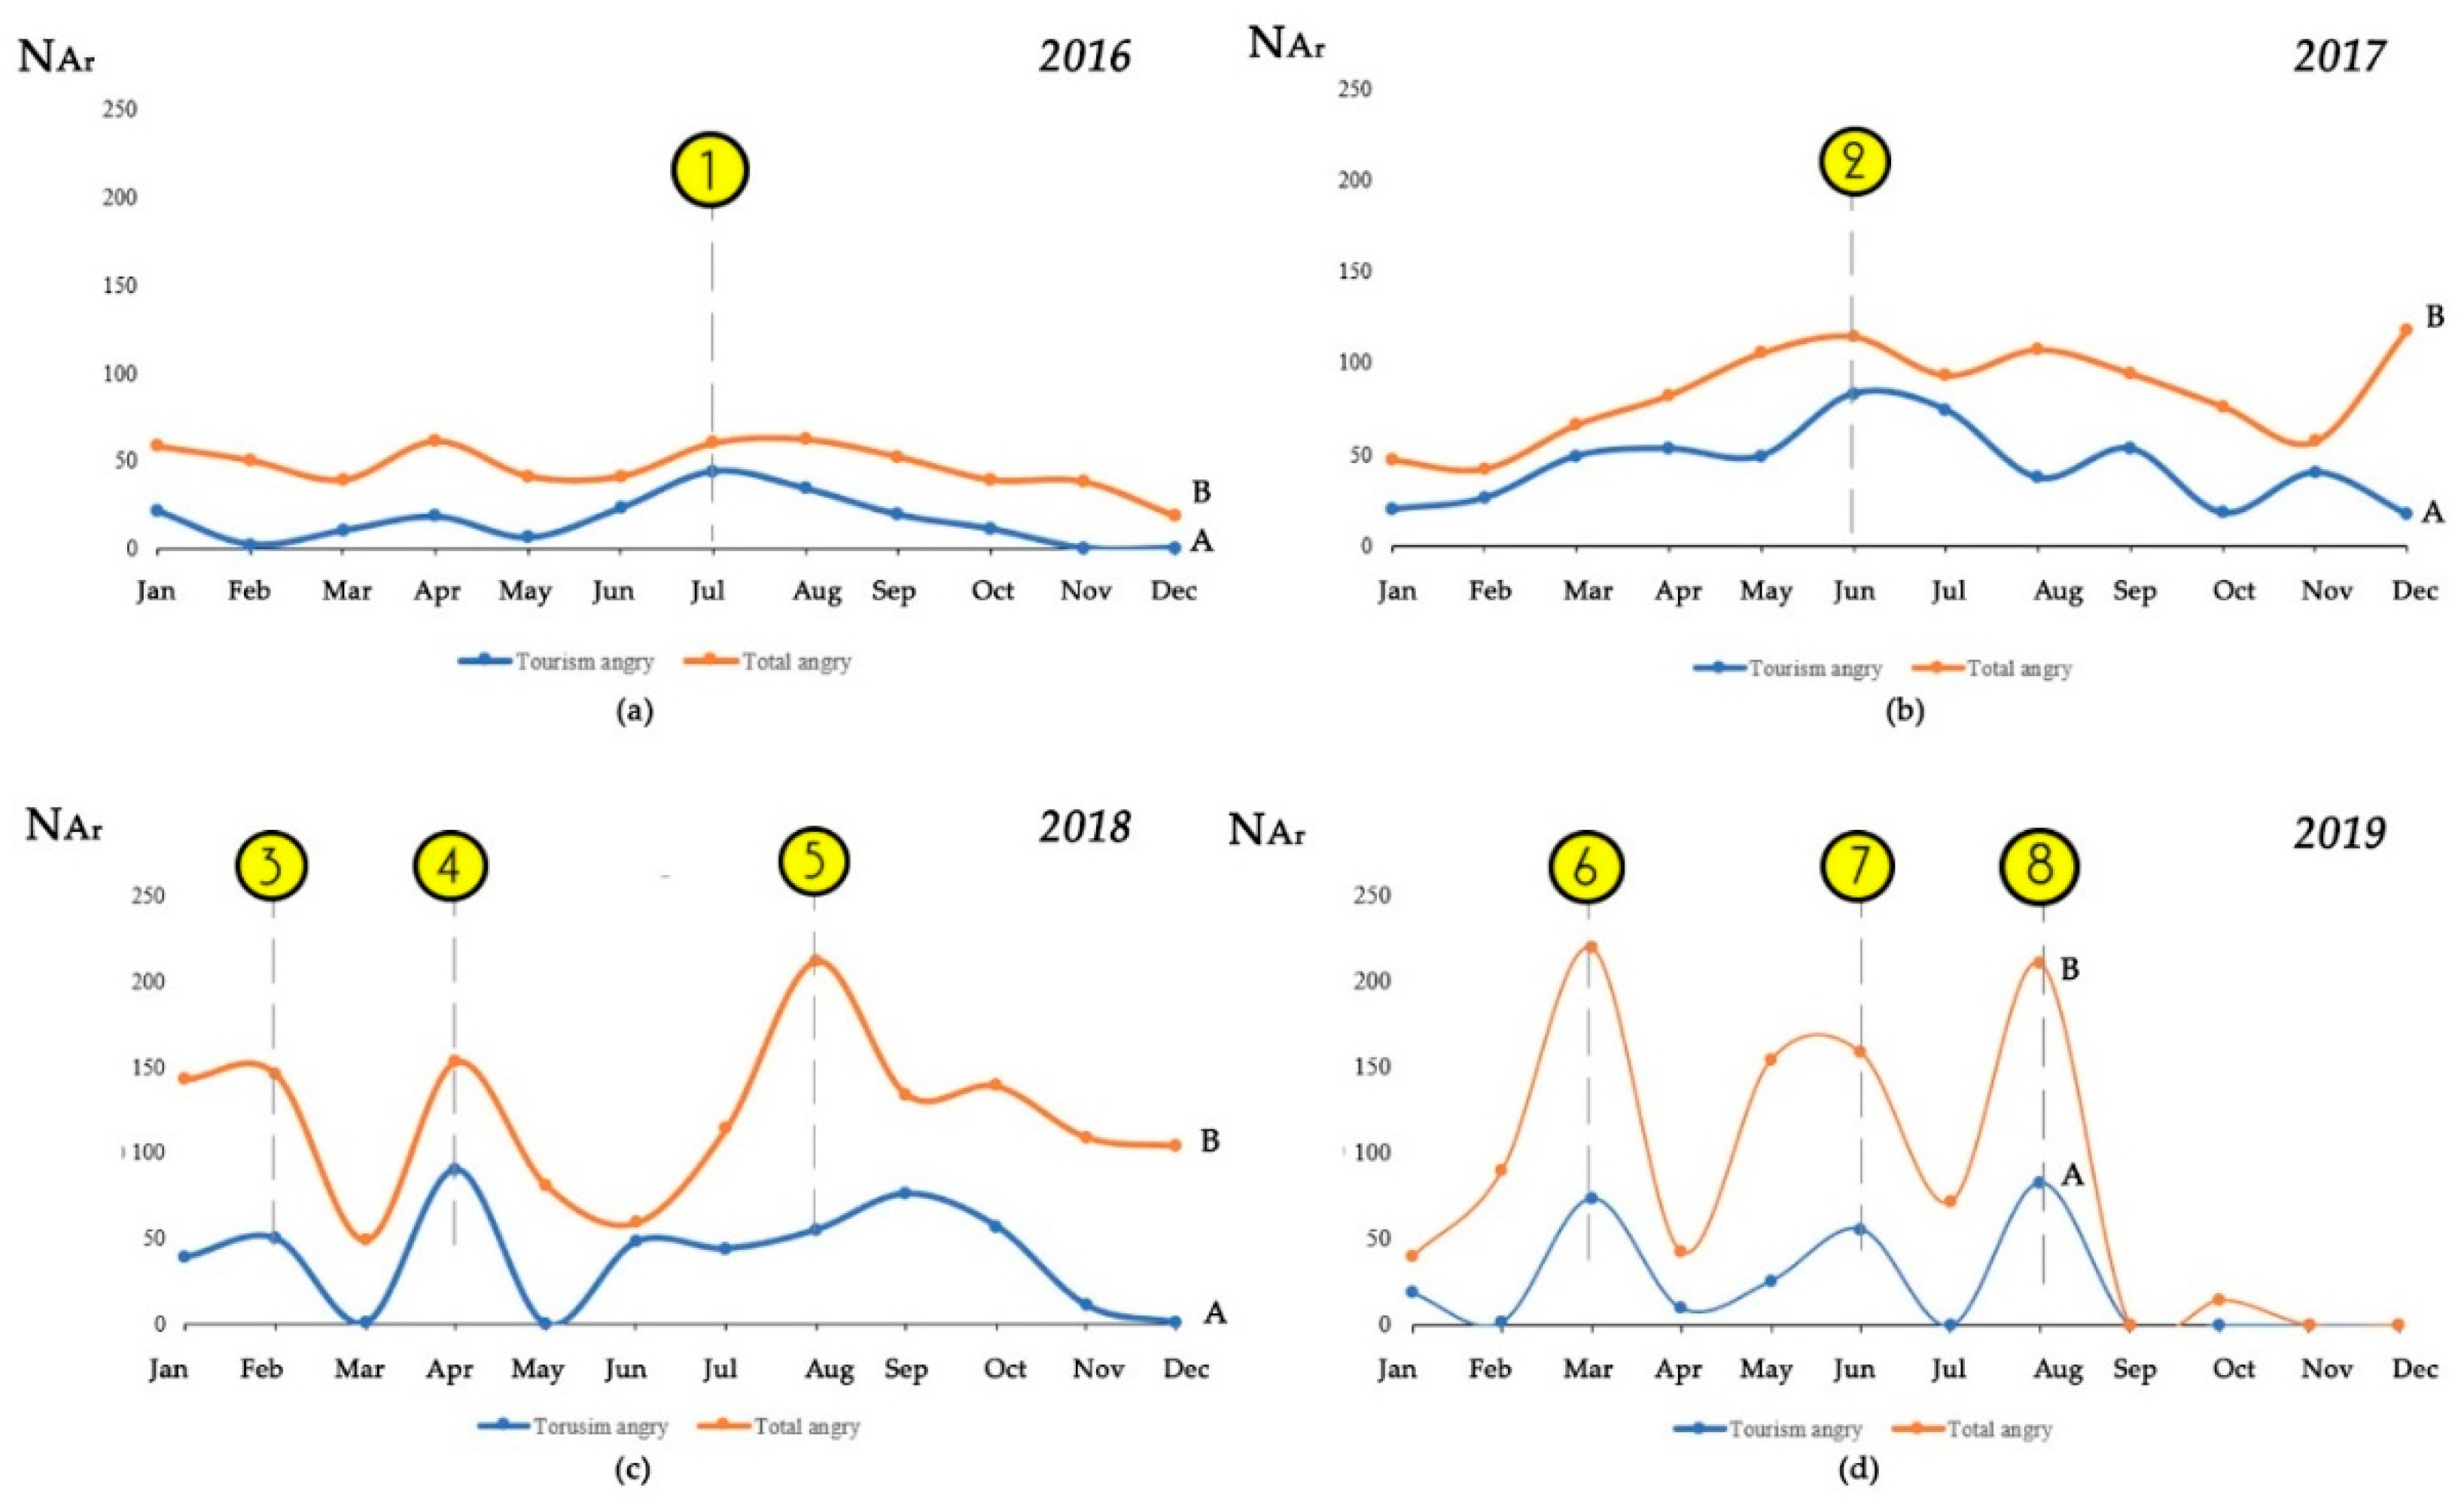
Social Insider automatically generates a graph that expresses the reactions trend excluding like reactions. Figure 8 shows that the peaks of the function “angry” (in blue) increase over the years. Instead, the others (ahah, sad, love, wow) remain stable over time. The “angry” reaction curve refers to several topics and not only to those related to tourism protests.
- 8.
- Dissatisfaction Index Calculation:
- For each month of each year taken into account (2016, 2017, 2018, 2019), from the total number of posts with “angry” reactions (B), we selected the “angry” reaction number referring only to posts related to tourism (A). In the four years analysed, the number of (A) is 1449 and the number of (B) is 4008.
- The distribution of “angry” reactions relating to tourism over time defines the function A = f(x), while the distribution of total “angry” reactions over time defines the function B = z(x). The latter can also be obtained from Social Insider (Figure 8). Figure 9 (a-b-c-d) shows the trend of both functions over time.
- In order to compute the dissatisfaction index, we calculated the integrals of both functions A = f(x) and B = z(x). For example, the integral referred to in 2016 is:
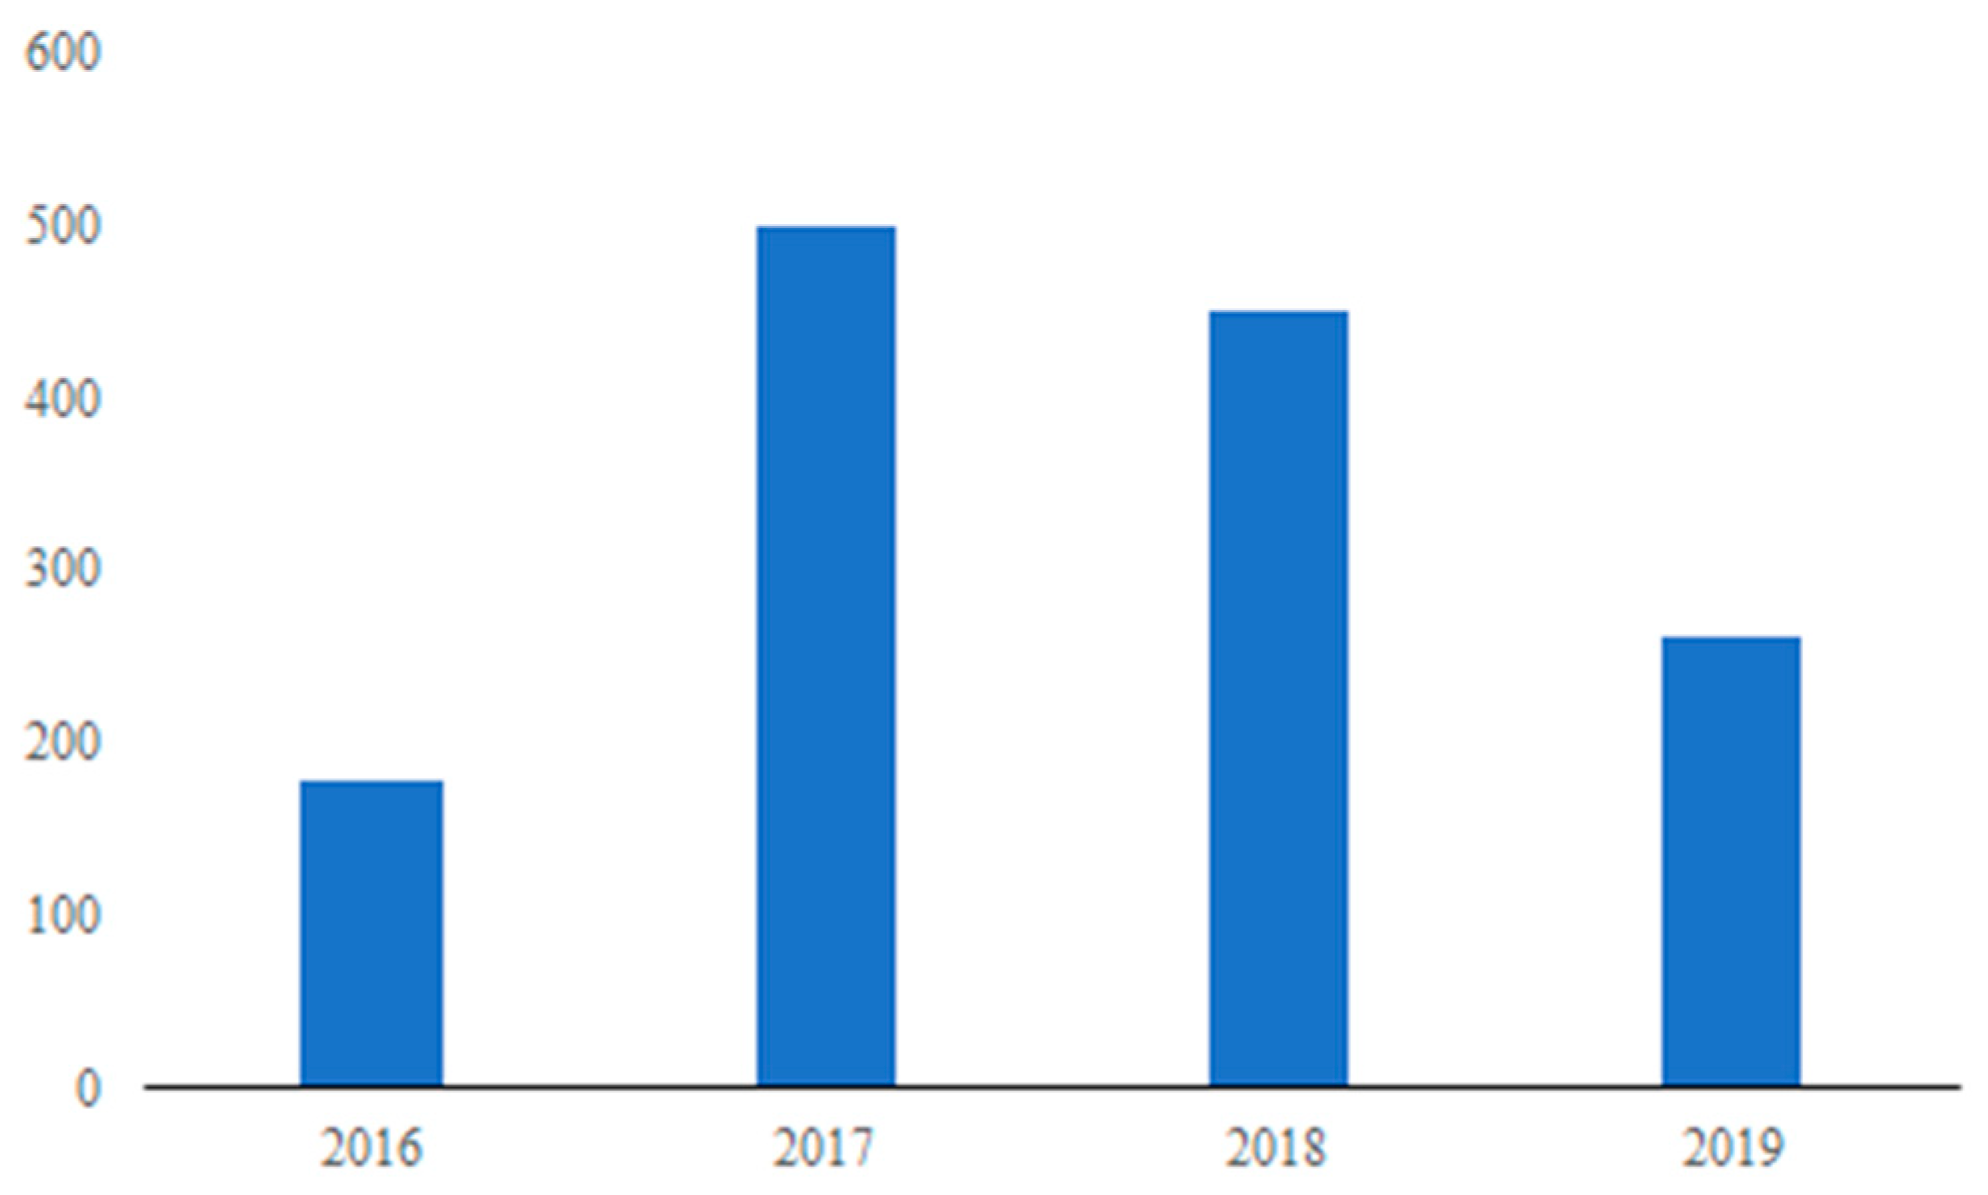
- Figure 10 shows the areas under the A curve for each year. The “angry” reactions have a peak in conjunction with the triggering events. As we can see, the highest peak is in 2017. Instead, in 2019 there is a lower value probably due to the citizens’ acquiescence to the flow of tourists in Granada.
- The “C.1.2 Index modified”, for example, for the year 2017, is as follows:
The ratio Idiss defines the incidence of citizens’ dissatisfaction with the flow of tourism in relation to the totality of the topics on the page. The higher percentage is in 2016 (Table 3).
We analysed the posts related to mass tourism for each peak of curve (A) and found that they are related to the following main events:
- A high risk of damage to historical heritage. The huge flow of tourists is considered to be a cause of damage to the historical heritage [33].
- The illegal occupation of parking. The violations of traffic road regulations are frequent. There many vehicles that park on sidewalks or in reserved parking lots. “Bajo Albaycin” said “Unos llegan en furgonetas, otros en caravanas, todos invadiendo y saturando el espacio público con sus vehículos para vivir con vistas a la Alhambra” (“Many tourists come by camper and roulette invading the public roads with their vehicles in order to visit the Alhambra”) [37,38].
- The invasion of public spaces. Souvenir shops and street vendors occupy main streets and walls of buildings from Elvira Street and Grifos de San José to Plaza Nueva [39].
- The demolition of a kiosk in “Plaza Nueva”. The Authorities ordered the demolition of a kiosk where there was a bakery. The residents claimed that this decision was affecting small local businesses [40].
- Lack of apartments for residents. Granada’s historic centre is increasingly left by local citizen. Residents move from the old city to suburbs and rent their apartment to tourists. The Realejo and Albaycín neighbourhoods are becoming large “low-cost hotels”. The rise in the number of apartments meant that homesharing has increased, which in turn has increased the price of the rents that boosted this trend in the first place [2,41].
- The demolition of a building in “Plaza de Santa Ana”. The building was located in the A2 area, where buildings with significant architectural, historical, and cultural characteristics are located. The demolition rose the debate on heritage conservation. The residents wanted to “preserve its [Granada’s] architectural elements and qualities” [42,43].
- The residents’ rebellion against tourists. Graffiti against tourists was written on street walls in Albayzin. They were signed by “@tourist”. They called visitors to leave the city, accusing them of destroying it. The association “Bajo Albayzin” agreed with the graffiti’s content but did not agree with the manner in which the citizens protested [44,45].
- Undisciplined tourists. The increase in nightlife, music, and parties are among the major causes of citizen dissatisfaction. Residents understand that tourism is an economic resource for Granada but would like tourists to be more sympathetic and respectful [46].
5. Conclusions and Strategic Indications
The continuous growth of the tourists’ pressure on historical city centres causes an increase in dissatisfaction among local residents. We applied a method based on the analysis of the reactions posted on the social networks by cities’ citizens to assess their opinion on the social impact of mass tourism on Granada. Thus, we replace the ETIS index C.1.2 with a new indicator called “C.1.2 index modified” to define the level of dissatisfaction among citizens experiencing the tourist pressure.
From this analysis, we can also outline a strategic action plan aimed at countering the negative outcomes of mass tourism through a bottom-up approach.
We suggest that the Granada authorities makes use of the following six intervention strategies (Figure 11):
- Cultural heritage management
- Sustainable mobility
- Urban planning
- The promotion of local businesses
- The promotion of hotels rather than the rent of private flats
- Taking care of public orders and standards of behaviour
As next step, a possible development of the present research could be to create a hierarchy among the proposals arising from the citizens’ reactions.
According the Granada Tourist Plan 2018–2022 (Plan Turístico de Grandes Ciudades de Granada) [47] there are six objectives to achieve through strategic guidelines:
- Enhancing tourism resources from a cultural, social, environmental, and economic point of view;
- Adapting the urban environment to tourism by promoting universal accessibility;
- Increasing the quality of the city’s tourist services;
- Improving the existing tourism products and creating new products based on the innovative exploitation of resources;
- Raising awareness and involving the population and local agents in a culture of quality tourism;
- Strengthening the competitiveness of the local tourism sector.
When comparing the action plan adopted by the Municipality of Granada with what we propose in this paper, it becomes clear that there are some common points regarding urban planning and the promotion of local business.
Author Contributions
Conceptualization, G.A.; methodology, G.A.; investigation, M.G., G.M. and C.M.P.; data analysis, M.G., G.M. and C.M.P.; writing—original draft preparation M.G., G.M. and C.M.P.; writing—review and editing, G.A.; supervision, G.A. All authors have read and agreed to the published version of the manuscript.
Funding
This research was funded by H2020 Marie Skłodowska-Curie Actions, grant number 777981 and The APC was funded by Kore University of Enna.
Conflicts of Interest
The authors declare no conflict of interest
References
- WARMEST Project. WARMEST EU PROJECT—Low Altitude Remote Sensing for the Monitoring of the State of Cultural Heritage Sites: Building an Integrated Model for Maintenance, 2017. Available online: http://warmestproject.eu/ (accessed on 5 December 2019).
- UNWTO. Sustainable development | UNWTO. Available online: https://www.unwto.org/sustainable-development (accessed on 10 December 2019).
- Why Tourism? | World Tourism Organization UNWTO. Available online: http://www2.unwto.org/content/why-tourism (accessed on 22 November 2019).
- World Tourism Organization. ‘Overtourism’?—Understanding and Managing Urban Tourism Growth beyond Perceptions, Executive Summary; WTO, Centre of Expertise Leisure, Tourism & Hospitality, NHTV Breda University of Applied Science, NHL Stenden University of Applied Sciences, Eds.; World Tourism Organization (UNWTO): Madrid, Spain, 2018. [Google Scholar]
- Coldwell, W. First Venice and Barcelona: Now Anti-Tourism Marches Spread across Europe, 2017. Available online: https://static1.squarespace.com/static/53109b11e4b05040160f0a8f/t/59bfcc8b90badeccf7cc1564/1505741995422/First+Venice+and+Barcelona_+now+anti-tourism+marches+spread+across+Europe+_+Travel+_+The+Guardian.pdf (accessed on 10 January 2020).
- Milano, C.; Novelli, M.; Cheer, J.M. Overtourism and Tourismphobia: A Journey Through Four Decades of Tourism Development, Planning and Local Concerns. Tour. Plan. Dev. 2019, 16, 353–357. [Google Scholar]
- Lück, M. Sustainable Development of Tourism: A Compilation of Good Practices: Una Compilación de Buenas Prácticas: Une Compilation de Bonnes Pratiques = Desarrollo Sostenible del Turismo = Développement Durable du Tourisme; World Tourism Organization: Madrid, Spain, 2000. [Google Scholar]
- Brown, K.; Turner, R.K.; Hameed, H.; Bateman, I. Environmental carrying capacity and tourism development in the Maldives and Nepal. Environ. Conserv. 1997, 24, 316–325. [Google Scholar] [CrossRef]
- Saveriades, A. Establishing the social tourism carrying capacity for the tourist resorts of the east coast of the Republic of Cyprus. Tour. Manag. 2000, 21, 147–156. [Google Scholar] [CrossRef]
- Cimnaghi, E.; Mondini, G.; Valle, M. La Capacità di Carico Turistica. Uno Strumento per la Gestione del Patrimonio Culturale; Ministero dei Beni e delle Attività Culturali e del Turismo: Rome, Italy, 2017. [Google Scholar]
- WTO; UNEP. Making Tourism more Sustainable: A Guide for Policy Makers; United Nations Environment Programme: Nairobi, Kenya, 2005. [Google Scholar]
- Gonzalez, V.; Coromina, L.; Galí, N. Overtourism: Residents’ perceptions of tourism impact as an indicator of resident social carrying capacity—Case study of a Spanish heritage town. Tour. Rev. 2018, 73, 277–296. [Google Scholar] [CrossRef]
- Gonson, C.; Pelletier, D.; Alban, F. Social carrying capacity assessment from questionnaire and counts survey: Insights for recreational settings management in coastal areas. Mar. Policy 2018, 98, 146–157. [Google Scholar] [CrossRef] [Green Version]
- Joshi, S.; Dahal, R. Relationship between Social Carrying Capacity and Tourism Carrying Capacity: A Case of Annapurna Conservation Area, Nepal. J. Tour. Hosp. Educ. 2019, 9, 9–29. [Google Scholar] [CrossRef] [Green Version]
- European Commission. European Tourism Indicators System for Sustainable Destination Management | Internal Market, Industry, Entrepreneurship and SMEs, 2016. Available online: https://ec.europa.eu/growth/sectors/tourism/offer/sustainable/indicators_en (accessed on 2 December 2019).
- European Commission. DocsRoom—European Commission, 2016. Available online: https://ec.europa.eu/docsroom/documents/15849 (accessed on 14 December 2019).
- Tudorache, D.; Simon, T.; Frenț, C.; Musteaţă-Pavel, M. Difficulties and Challenges in Applying the European Tourism Indicators System (ETIS) for Sustainable Tourist Destinations: The Case of Braşov County in the Romanian Carpathians. Sustainability 2017, 9, 1879. [Google Scholar] [CrossRef] [Green Version]
- Modica, P.; Capocchi, A.; Foroni, I.; Zenga, M. An Assessment of the Implementation of the European Tourism Indicator System for Sustainable Destinations in Italy. Sustainability 2018, 10, 3160. [Google Scholar] [CrossRef] [Green Version]
- Savage, M.; Burrows, R. The Coming Crisis of Empirical Sociology. Sociology 2007, 41, 885–899. [Google Scholar] [CrossRef]
- Mayer-Schönberger, V.; Cukier, K. Big Data: A Revolution That Will Transform. How We Live, Work, and Think; Houghton Mifflin Harcourt: New York, NY, USA, 2013. [Google Scholar]
- Fedrigo, F. Le Potenzialità Dell’analisi Dell’utilizzo dei Social Network a Fini di Marketing Caso Studio Sulle Sigarette Elettroniche; Tesi di Laurea Magistrale, Università Ca’Foscari Venezia: Venezia, Italy, 2013. [Google Scholar]
- Junta de Andalucía. Instituto de Estadística y Cartografía de Andalucía, 2019. Available online: https://www.juntadeandalucia.es/institutodeestadisticaycartografia (accessed on 11 December 2019).
- Alhambra.org. La Alhambra de Granada—alhambra.org. Available online: https://www.alhambra.org/alhambra/alhambra-diaria.html (accessed on 22 November 2019).
- Junta de Andalucía. Junta de Andalucía—Estadística de la Red de Espacios Culturales de Andalucía; Consejeria de Cultura u Patrimonio Historico: Seville, Spain, 2019; Available online: https://www.juntadeandalucia.es/organismos/culturaypatrimoniohistorico/servicios/estadistica-cartografia/actividad/detalle/175086/175547.html (accessed on 22 November 2019).
- Eurostat. Statistics Illustrated—Eurostat. 2018. Available online: https://ec.europa.eu/eurostat/en/web/population-demography-migration-projections/statistics-illustrated (accessed on 11 December 2019).
- Exceltur | Alliance for Excellency in Tourism. Perspectivas Turisticas n°67. Valoracion Turistica Empresarial de 2018 y Perspectivas para 2019. Available online: https://www.exceltur.org/wp-content/uploads/2019/01/Informe-Perspectivas-N67-Balance-del-a%C3%B1o-2018-y-previsiones-para-2019.pdf (accessed on 10 January 2020).
- Montanari, T. Le Pietre e il Popolo: Restituire ai Cittadini L’arte e la Storia delle Città Italiane; I Edizione; Minimum Fax: Roma, Italy, 2013. [Google Scholar]
- Becheri, E.; Micera, R.; Morvillo, A. Rapporto sul Turismo Italiano; XXII Edizione 2017/2018; Rogiosi: Napoli, Italy, 2019. [Google Scholar]
- Romano, I.M. Pressione Turistica sul Centro Storico di Firenze—sito UNESCO: Un Modello per la Valutazione Dell’impatto Percettivo; Firenze University Press: Florence, Italy, 2018. [Google Scholar]
- Zannini, A. Il turismo a Venezia dal secondo dopoguerra ad oggi. Lab. Ital. Polit. Société 2014, 15, 191–199. [Google Scholar] [CrossRef]
- Pollice, F. Valorizzazione dei Centri Storici e Turismo Sostenibile nel Bacino del Mediterraneo. Boll. Della Soc. Geogr. Ital. 2018, 41–56. [Google Scholar]
- Acampa, G.; Mattia, S. Marginal Opportunities: The Old Town Center in Palermo. In Integrated Evaluation for the Management of Contemporary Cities; Mondini, G., Fattinnanzi, E., Oppio, A., Bottero, M., Eds.; Springer International Publishing: Cham, Switzerland, 2018; pp. 441–451. [Google Scholar]
- Lucas, M.A.O. El nuevo director de la Alhambra: El turismo tiene también un límite que, si se rebasa, empieza a ser depredador. eldiario.es. 3 October 2015. Available online: https://www.eldiario.es/andalucia/nuevo-director-Alhambra-gestion-hacer_0_435707492.html (accessed on 19 December 2019).
- El Turismo Colapsa los Autobuses del Barrio, que se han Visto Reducidos en Favor de la Línea Turística, y Desespera a los Vecinos, Bajo Albayzín. Available online: http://albayzin.info/2018/08/el-turismo-colapsa-los-autobuses-del-barrio-que-se-han-visto-reducidos-en-favor-de-la-linea-turistica-y-desespera-a-los-vecinos/ (accessed on 11 December 2019).
- Bajo Albayzín. Atasco en San Isabel la Real a causa de un autobús turístico cuyas dimensiones le impiden seguir a San Miguel Bajo. Bajo Albayzín. 21 April 2018. Available online: http://albayzin.info/2018/04/atasco-en-san-isabel-la-real-a-causa-de-un-autobus-turistico-cuyas-dimensiones-le-impiden-seguir-a-san-miguel-bajo/ (accessed on 19 December 2019).
- Bajo Albayzín. Peligroso e ilegal aparcamiento de autobuses en la Cuesta del Chapiz. Bajo Albayzín. 2 July 2017. Available online: http://albayzin.info/2017/07/peligroso-e-ilegal-aparcamiento-de-autobuses-en-la-cuesta-del-chapiz/ (accessed on 19 December 2019).
- Bajo Albayzín. PRENSA: Los otros ‘okupas’ del Albaicín. Bajo Albayzín. 16 May 2017. Available online: http://albayzin.info/2017/05/prensa-los-otros-okupas-del-albaicin/ (accessed on 19 December 2019).
- Bajo Albayzín. PRENSA: Los Vecinos Claman Contra las Acampadas Ilegales en el Albaicín. Bajo Albayzín. 1 July 2017. Available online: http://albayzin.info/2017/07/prensa-los-vecinos-claman-contra-las-acampadas-ilegales-en-el-albaicin/ (accessed on 19 December 2019).
- Bajo Albayzìn. Invasión de la vía pública por los comercios. Bajo Albayzín. 11 Feburary 2017. Available online: http://albayzin.info/2017/02/invasion-de-la-via-publica-por-los-comercios/ (accessed on 19 December 2019).
- Bajo Albayzín. Kiosco del pan de Plaza Nueva, SI. Terrazas Abusivas y tantos Chirimbolos, NO. Bajo Albayzín. 27 April 2018. Available online: http://albayzin.info/2018/04/kiosco-del-pan-de-plaza-nueva-si-terrazas-abusivas-y-tantos-chirimbolos-no/ (accessed on 19 December 2019).
- Moreno, P.S. El problema del Turismo en Granada, igual que en Barcelona, Bajo Albayzín. Available online: http://albayzin.info/2014/09/el-problema-del-turismo-en-granada-igual-que-en-barcelona/ (accessed on 10 January 2020).
- Granada Hoy. El derribo de Santa Ana levanta el debate sobre la conservación del patrimonio. Granada Hoy. 7 March 2019. Available online: https://www.granadahoy.com/granada/derribo-plaza-Santa-Ana-conservacion-patrimonio_0_1333967227.html (accessed on 19 December 2019).
- Battisti, F.; Campo, O. A methodology for determining the profitability index of real estate initiatives involving public-private partnerships. A case study: The integrated intervention programs in rome. Sustainability 2019, 11, 1371. [Google Scholar] [CrossRef] [Green Version]
- Bajo Albayzín. PRENSA: Las Calles del Albaicín se Llenan de Pintadas Contra el Turismo. Bajo Albayzín. 29 May 2019. Available online: http://albayzin.info/2019/05/prensa-las-calles-del-albaicin-se-llenan-de-pintadas-contra-el-turismo/ (accessed on 19 December 2019).
- Bajo Albayzín, PRENSA: Las Pintadas Contra los Turistas del Albaicín Llegan Hasta la Prensa Inglesa. Bajo Albayzín. 1 June 2019. Available online: http://albayzin.info/2019/06/prensa-las-pintadas-contra-los-turistas-del-albaicin-llegan-hasta-la-prensa-inglesa/ (accessed on 19 December 2019).
- Opdenhoff, J.-H. PRENSA: «No Tienen Ningún Respeto por el Barrio»: Los Vecinos del Albaicín Cargan Contra Turistas Incívicos. Bajo Albayzín. Available online: http://albayzin.info/2019/08/prensa-no-tienen-ningun-respeto-por-el-barrio-los-vecinos-del-albaicin-cargan-contra-turistas-incivicos/ (accessed on 19 December 2019).
- LabIN Granada. Plan Turístico de Granada 2018-2022, LabIN Granada. Available online: https://labingranada.org/foroalbaicinsacromonte-foro2/ (accessed on 3 January 2020).
Figure 1.
Annual tourists at the Alhambra and Generalife [1].
Figure 1.
Annual tourists at the Alhambra and Generalife [1].

Figure 2.
Average monthly trend of tourists (2000 to 2018) [24].
Figure 2.
Average monthly trend of tourists (2000 to 2018) [24].

Figure 3.
Search keywords—screen application from Social Insider.

Figure 4.
See the distribution of total engagement for each page—report Social Insider.

Figure 5.
Key Metrics “Bajo Albayzin”—report from Social Insider.

Figure 6.
Total post by type “Bajo Albayzin”—report from Social Insider.

Figure 7.
Reactions from Facebook.

Figure 8.
“Angry” reaction curve trend on “Bajo Albayzin” page.

Figure 9.
Comparison between A = f(x) and B = z(x).

Figure 10.
“Angry” reactions trend over time.

Figure 11.
Proposal of Action Plan.


Table 1.
European Tourism Indicators Systems (ETIS) core indicators [15].
Table 1.
European Tourism Indicators Systems (ETIS) core indicators [15].
| Social and Cultural Impact | ||
|---|---|---|
| Criteria | Indicator Reference | ETIS Core Indicators |
| C.1 Community/social impact | C.1.1 | Number of tourists/visitors per 100 residents |
| C.1.2 | Percentage of residents who are satisfied with tourism in the destination (per month/season) | |
| C.1.3 | Number of beds available in commercial accommodation establishments per 100 residents | |
| C.1.4 | Number of second homes per 100 homes | |
Table 2.
Data sheets for core indicators [16].
Table 2.
Data sheets for core indicators [16].
| Indicator: C.1.2 | Percentage of Residents Who are Satisfied with Tourism in the Destination (Per Month/Season) |
|---|---|
| Reason for Measuring | Checking on resident satisfaction on a regular basis is an important gauge for visitor experience. Being alert to changes in the levels of resident satisfaction and taking action where necessary is fundamental to sustainable tourism. |
| Data Requirements | Resident surveys and tourism studies during peak season |
| Units of Measurement | % |
| Terms in Glossary | Resident satisfaction |
| Data Collection Instructions | Resident Survey |
| Method of Calculation | Number of residents who responded “satisfied” or better ÷ total number of residents who responded × 100 = % of residents satisfied with tourism Repeat for each month/season/year |
| Frequency of Data Collection | Monthly Seasonally Annually |
| Reporting Format | Bar graph |
| International Benchmarks | N/A |
| Key Stakeholders/Users | Destination Managers |
| Suggested Actions | Should the results be less than an agreed percentage, destination managers and tourism enterprises need to engage with residents to determine how to better plan tourism development and activities. |
Table 3.
Comparison among dissatisfaction indexes over four years.
| Year | 2016 | 2017 | 2018 | 2019 |
|---|---|---|---|---|
| Idiss | 34% | 54% | 34% | 26% |
© 2020 by the authors. Licensee MDPI, Basel, Switzerland. This article is an open access article distributed under the terms and conditions of the Creative Commons Attribution (CC BY) license (http://creativecommons.org/licenses/by/4.0/).
Share and Cite
MDPI and ACS Style
Acampa, G.; Grasso, M.; Marino, G.; Parisi, C.M. Tourist Flow Management: Social Impact Evaluation through Social Network Analysis. Sustainability 2020, 12, 731. https://0-doi-org.brum.beds.ac.uk/10.3390/su12020731
AMA Style
Acampa G, Grasso M, Marino G, Parisi CM. Tourist Flow Management: Social Impact Evaluation through Social Network Analysis. Sustainability. 2020; 12(2):731. https://0-doi-org.brum.beds.ac.uk/10.3390/su12020731
Chicago/Turabian StyleAcampa, Giovanna, Mariolina Grasso, Giorgia Marino, and Claudia Mariaserena Parisi. 2020. "Tourist Flow Management: Social Impact Evaluation through Social Network Analysis" Sustainability 12, no. 2: 731. https://0-doi-org.brum.beds.ac.uk/10.3390/su12020731
Note that from the first issue of 2016, this journal uses article numbers instead of page numbers. See further details here.