Outdoor Recreation Participation in Istanbul, Turkey: An Investigation of Frequency, Length, Travel Time and Activities


1
Faculty of Education, Yildiz Technical University-Istanbul, Davutpasa Campus, 34210 Esenler–Istanbul, Turkey
2
Department of Geography and Geology, Paris Lodron-University of Salzburg, Hellbrunnersstrasse 34, Salzburg A-5020, Austria
*
Author to whom correspondence should be addressed.
Sustainability 2020, 12(2), 741; https://0-doi-org.brum.beds.ac.uk/10.3390/su12020741
Submission received: 18 November 2019
/
Revised: 14 January 2020
/
Accepted: 15 January 2020
/
Published: 20 January 2020
(This article belongs to the Special Issue Dealing with Environmental Conflicts)
Abstract
:Although outdoor recreation participation has been studied extensively, little research has come from less developed regions of the world. This paper examined outdoor recreation participation and its predictors in Istanbul, an increasingly urbanized and populated megacity, in Turkey. The results show that nearly half of the people interviewed in this study had claimed to visit a nature area at least once a week or more often, nearly three-quarters invested a travel time to these areas of between 30 min to 2 h, about two-thirds spent more than 2 h at the area, and about one-third was engaged in leisurely walking. The frequency of visits was almost the single predictor of travel time. Visit frequencies were predicted by the travel time and visit length. Activity type and traveling longer than 2 h predicted the length of visits. Recreational activity type was predicted by visit length and travel time. Socio-demographic variables were associated with only a few outdoor participation variables. The findings imply that the residents have limited contact with nature and limited opportunity to benefit from such interaction.
1. Introduction
Outdoor recreation participation has become increasingly popular around the world [1,2]. Participating in outdoor recreation in urban parks of metropolitan areas provides opportunity for human-nature contact and contributes to the well-being of urban dwellers [3,4]. Consequently, researchers, policy makers and planners around the world have paid increasing attention to factors influencing the use and benefits of outdoor recreation participation.
While the majority of human-nature contact studies come from more developed regions of the world, such as Europe, Australia, and North America [5], evidence from different/other parts of the world has also been emerging recently. This is important because urbanization trends between more developed and less developed parts of the world diverge, with the developing countries experiencing a comparatively more rapid urbanization [6]. In addition, according to United Nations, as of 2014, there were 28 megacities and an additional 13 predicted until 2030, many of which are located in less developed regions of the world [7]. However, little is known about the participation in outdoor recreation in urban areas in developing or underdeveloped countries [8]. The United Nations (2019) emphasize the importance of providing equal, necessary, and adequate infrastructure to provide transportation, health care, job opportunities, housing, a healthy environment, and other services for sustainable urbanization. One would expect that outdoor recreational participation patterns in urbanized megacities around the world would be similar. Results of the existing studies from developed countries provide information about management, improvement and sustainability of outdoor recreation for decision-makers in other countries. Nonetheless, certain local, cultural, geographical, economic, and policy differences that influence outdoor recreation participation are inevitable. While sustainable urbanization is proven to have positive effects to improve residents’ quality of life, the way in which it is planned and implemented probably varies across governments, resulting in variation across countries. Thus, different and new challenges for the well-being of inhabitants in urbanized megacities in less developed regions needs to be addressed.
Istanbul, one of the world’s megacities and a significant economic center of Turkey and Europe, has been urbanized and industrialized rapidly in recent years. Yet, we know little about outdoor recreation participation of Istanbul’s residents. This paper addresses outdoor recreation participation and its predictors in Istanbul, Turkey. It explores the relationship between the participation in outdoor recreation and demand factors. It focuses on how length of travel time to participate in outdoor recreation, frequency and length of participation in outdoor recreation, and engaged outdoor recreation activities are related to each other, and to socio-demographic characteristics of individuals. The goal is to provide information that may help decision-makers to improve recreational opportunities for all urban residents of the megacity, subsequently improving their well-being.
1.1. Theoretical Framework
Outdoor recreation is defined as leisure activities taking place in open spaces with green or nature element components, confined within a day. Outdoor recreation activities, ranging from very passive to very active, from solitary to social, include, but are not limited to, walking, sitting, relaxing, enjoying a view, skiing, biking, horse riding, hiking, fishing, exercising, swimming, picnicking, and grilling [9]. Among those activities, leisurely walking, followed by sitting and enjoying nature, is the most popular activity reported in various studies from different parts of the world [10,11,12,13,14]. The five most popular activities that people in the US participate in are walking for pleasure (83%), family gatherings (73.5%), visiting nature centers (57.1%), picnicking (54.5%) and sightseeing (51.8%) [15,16]. A notable gap in the literature, though, is the investigation of the relation between different types of activities and the frequency and duration of visits as well as travel time to recreational areas.
Physiological, psychological and social benefits of participating in outdoor recreation are well established in literature (e.g., [17,18,19,20,21,22,23]). Outdoor recreation participation is related to lower depression scores among individuals with disabilities [24] and among individuals over 65 years of age [25]. It reduces the stress level [21] and annoyances resulting from city noise [18,26] and gives a feeling of peace and tranquility [27,28]. In addition, visiting urban parks has been linked to better results in pulse and heart rate, diastolic blood pressure, sympathetic nerve activities and a lower level of negative emotions and anxiety [29,30,31]. Nonetheless, research shows that outdoor recreation benefits individuals when the participation is frequent and lasts long enough [32,33]. For example, in their study with individuals over 65 years of age, Christensen and colleagues [34] investigated whether the prevalence of major depression at the time of study differed based on the outdoor recreation participation in the past year. They found that major depression was most likely to be observed among participants who did not participate in outdoor recreation and was least likely to be observed among those who participated in outdoor recreation four or more times per week. These results encourage frequent and longer outdoor recreation participation with a good amount of time. Yet, only a limited number of studies have focused on the duration of the recreational site visits (e.g., [33,35]) and its predictors.
1.2. Travel-Cost Approach
The current research explores the relationships between frequency and duration of recreational area visits, types of recreational activities, demand factors and travel time. It is framed around a travel-cost (TC) model [36,37], which is one of the earlier and frequently cited approaches in studying recreational demands. It proposes that, in order to engage in recreation at a site, each individual begins traveling from a different point of origin, which leads to a variation in travel time and cost. “[T]ravel time [and] travel itself may have a negative or positive value, depending on such factors as interest, comfort, and attractiveness [and] varies greatly for different individuals, for different times for the same individual, and for trips to different places” ([38], p. 38). Wilkinson [38] also draws attention to the different costs associated with recreationists’ travelling time from various distances to a particular recreational area; an advantage for those living in close distance to recreational areas over those living farther away. In addition, the travel costs are lower for people near the site and high for those living farther away. Thus, the closer the recreational area to one’s residence, the more time- and cost-efficient the outdoor recreation participation is and the more frequently the site is used. However, as the distance to the site increases, the demand/desire that residents have for it decreases [39,40]. Existing research provides evidence that residential proximity to the recreational area is the strongest, if not the sole, predictor of visit frequency, with people living closer to the area making more frequent visits [12,32,41,42,43,44].
TC model is particularly useful to estimate the total use of a site and offers a good foundation for the recreation economics [39]. However, it comes with two limitations that have important implications for our study. First, it assumes that each individual spends the same amount of time at the site and has access to the same services [40]. Nonetheless, there is evidence that distance may be relevant to the length of visits [45,46]. For example, Rossi et al. [46] found that people traveling shorter distances tended to make more frequent visits and spend less than two hours whereas people travelling longer travel distances tended to make less frequent visits and spend more time at the park. In this study, we propose that visits requiring longer travel time and occurring less frequently would last longer due to the higher cost for visiting recreation areas (both the travel time and associated gas or travel cost). In addition, different types of activities would take place in different settings and in different frequencies and would be associated with different travel times. Needing only a few amenities and little preparation, such as walking, would be associated with more frequent visits, shorter travel time and shorter visits. In contrast, activities requiring specific facilities or amenities (e.g., grilling or picnicking area), would be linked to/be associated with less frequent visits, longer travel time and longer visits. For example, research shows that walking at least once a week is more likely to happen in parks close to residents’ homes [12,13,43,47]. Nature observation occurs at the areas characterized by high ecological value and good green composition, even if it is far in distance [17,48]. Therefore, it is highly possible that travel time to a recreational site, frequency and duration of the site visits, and recreational activities at the site are all interrelated.
The second limitation of the TC model is that it ignores the effects of individuals’ socio-demographic characteristics such as age, gender, occupation, or socio-economic status on recreational site use [40]. One line of research shows that there is a relationship between socio-demographic characteristics and participation in outdoor recreation. In a study by Payne and colleagues [49] with Cleveland, Ohio residents, age was found to be a strong predictor of frequency of local park visits, with younger participants visiting more frequently. In a study by Rossi et al. [46] with Australian residents, the effect of distance appeared to be more pronounced for older people, in that older participants living in close distance to parks/a park were more likely to visit the area than older participants living further away. A study by Liu, Chen, and Dong [50] in China showed that older individuals who had a shorter distance to parks also made more visits. In addition, males tended to have a longer travel distance than females did. Neuvonen et al. [13] revealed that with Helsinki, Finland residents, females and individuals aged 65 or older tended to make more close-to-home recreational visits, though the coefficients were insignificant. Van Cauwenberg et al. [51] showed no relationship between gender and frequency or length of recreational walking. In addition, some studies investigated how age and gender linked to distance when predicting the frequency of park use. In their study using a Danish national representative survey, Schipperijn et al. [43] showed an age by gender interaction effect on the frequency of green space use in that for men. The probability of green space visits, for at least a few days a week, increased as the age increased until the age of 80 years, after which it decreased. For women, no systematic relationship was observed. Similarly, women living farther from the parks made less frequent visits compared to men. Rossi and colleagues [46] studied the relationship between age, travel time, and amount of time spent at the park. They found that younger people were more likely to travel longer distances and spend more time, whereas individuals 45 or older tended to travel shorter distances and spend less time at the park. Age may also influence the types of activities individuals engage in. For example, Artmann et al. [17] reported that nature observation is one of the main activities for seniors. All these studies imply that, although inconclusive, age and gender, as being an important determinant of mobility, capacity for physical activity, and perceived safety, may be an important predictor for outdoor recreation participation.
Employment status might be an important predictor of participation in outdoor recreation. Neuvonen et al. [13] showed that employed individuals had less close-to-home recreation participation than unemployed ones. It was also found that unemployed people, pensioners and housewives participated more in close-to-home recreational activities than in other outdoor activities. In a more recent study with Australian mid to older aged adults, Van Cauwenberg and colleagues [51] compared retired and non-retired adults, regarding whether living near a park and other recreational and socio-demographic factors influenced recreational walking activities. They found that distance was a significant factor for only non-retired participants, in that those living near a park participated in recreational walking more frequently. It is possible that employment status presenting time constraints for workers and financial constraints for unemployed or retired people —at the simplest level, if not more—influence outdoor recreation participation in an urbanized megacity, as distances are far and traveling and recreating is costly.
Several studies have shown that less affluent areas generally have poorer levels of access to recreational facilities than more affluent areas [52,53]. When modes of transportation are considered, more affluent areas have better access to facilities for travel by car than less affluent areas in urban settings, whereas rural areas have more accessible facilities for travel by bus [54]. Lamb et al. [55] also found that affluent areas had a significantly higher number of facilities accessible by car within 20 or 30 min, and less affluent areas had a higher number of facilities accessible by walking, bus, or cycling. On the other hand, it was found that individuals living in areas with lower socio-economic status (SES) were less likely to use some facilities, even if they had better access to them than those living in more affluent areas [52]. Individuals with a higher educational level tended to visit green spaces more frequently than individuals with a lower educational level [13,43]. The majority of studies focused on access or use of the facilities in neighborhoods, but this study examined the SES of the districts in which residents live, which is associated with outdoor recreation participation in major recreational areas of the urbanized megacity.
With the premise that recreational area demand and use are the products of many factors related to recreationists and the recreational environment, this study focused on three major research questions:
(1) What are the patterns of outdoor recreation participation for residents of Istanbul? With this research question, we aimed to describe and analyze travel time, frequency and length of recreational area visits, as well as types of recreational activities they are engaged in during their visits. We expected that the majority of individuals would make weekly visits to an area, travel sometime between 30 min to 2 h, spend 2–5 h at the area and engage in leisurely walking.
(2) What is the relationship between the variables pertaining to the recreational activity participation itself, including travel time to the area, frequency and length of visits, and types of recreational activity? We hypothesized that the variables describing the travel time, frequency of visits, duration of visits and activity type at the recreational area would all be interrelated. We expected that the shorter the travel distance, the more frequent the visitations would occur and the shorter the duration of visits would last. Conversely, we anticipated that the longer the travel time, the less frequent the visits would occur and the longer the visits would last. We also anticipated that leisurely walking would be more likely to occur after short travel times and during short-lasting visitations, whereas enjoying the scenery, socializing and organized activities such as grilling or fishing would be more likely to take place after relatively/comparatively longer travel times, and within longer durations of visit.
(3) How do the socio-demographic characteristics of individuals such as gender, age, occupation, and SES of resided neighborhood relate to outdoor recreation participation? We hypothesized that males, younger participants (e.g., age 16–34), students and working individuals would participate in outdoor recreation more frequently, spend less time and be less engaged in leisurely walking and socializing than their counterparts.
1.3. The Case of Istanbul
Istanbul is a coastal megacity located in the Northeastern part of Turkey. The city is situated on two peninsulas, one on the Asian continent and one on the European continent, with the Bosporus in the middle. It has coastal sides by the Marmara Sea, an inland sea, and the Black Sea. It is the most crowded city of not only Turkey, but Europe, with over 15 million inhabitants as of 2018 (Figure 1 and [56]). The settlement of the city has expanded along the Marmara Sea coast along an east–west axis on both peninsulas and near the Bosporus, characterized by higher population density [57]. As of 2008, Istanbul has 2470 open recreational areas [58]. These changes have led to new challenges for transportation and commuting in and around the city [59]. Dülger-Türkoğlu, Bölen, Baran and Marans [60] showed that people living in Istanbul commute to work mostly by bus or walking and spend between 30 min to 3 h to go to work, with increasing time for those living in peripheral parts of the city.
Coinciding with this period, several researchers have studied outdoor recreation participation in Istanbul. Kara and colleagues [58] studied the use of recreational areas in the Historical Peninsula. Based on the on-site survey, they showed that only 34% of the respondents reported to participate in recreational activities. Of those, 31% visited weekly, 28% visited every other week, and 39% visited the area once a month. One-fourth of the visitors to this specific area were engaged in picnicking, and 41% were engaged in sport activities. Kart [61] conducted a study in Emirgan Park, located in the Bosporus region with a relatively high socio-economic status. The researcher found that the majority of park users were individuals living within close distance, those aged 19–40, and students and employed participants. Unemployed and retired residents and housewives made up a smaller percentage (about 16% in total) of park users. In addition, 85% of the park users had a high school or higher level of education and 72% had high-middle- or high-income. Picnicking (20%), walking (18%), landscape viewing (14%), socializing (8%) and sports (3%) were the most frequently engaged activities at the park. Fifty-six percent of park users spent 1–3 h, 33% 3–5 h, 9% longer than five hours, and 2% less than an hour at the park. In a study conducted within broader regions in Istanbul, Dülger Türkoğlu et al. [60] found that walking was also one of the most prevalent daily physical activities. A more recent study by Sezer and Akova [62] examined the outdoor recreation participation in three well-known parks (Emirgan, Gülhane and Yildiz) in Istanbul. The researchers found that 73.3% of individuals participated in outdoor recreation at least once a month or more often. Participation in outdoor recreation did not vary by gender, age, educational level, income level or occupation of the participants.
According to a report published by the Union of Chambers of Turkish Engineers and Architects [59], the number of constructions has almost doubled since 2004, and green recreational area per person has significantly decreased, falling far below the European and World averages. Between 1987 and 2007, residential area has increased by 45% whereas agricultural area has decreased by 64%, forest by 97%, and bush and grass land by 54% in Marmara sea coastal region [63]. At the same time, an increasing amount of recreational areas has been formed by land reclamation, and new roads and routes have been constructed. All these issues have raised concerns regarding the city residents’ well-being, their contact with nature and need to recreate.
While aforementioned studies have made important contributions to our understanding of outdoor recreation participation in Istanbul, they are either descriptive in nature, outdated and/or conducted within a limited number of parks, mostly located in the center of the city. This study is extensive, in a sense that it includes a broad number of outdoor recreation areas that were rated as the most popular recreation areas by respondents. This gives the study additional/particular significance/importance, at least in the case of Turkey, as most studies on recreational area use in Istanbul [58,60,61,62] and in other cities (e.g., [64,65]) have been more limited in their geographical scope of recreational areas.
Istanbul is divided into 39 administrative districts under a Metropolitan Municipality, which varies based on their population characteristics. In an attempt to simplify districts’ characteristics, Seker, Bakis, and Dizeci [66] calculated a human development index (HDI) using seven areas of development (governance and transparency, social coverage, economic status, education, health, social life index, municipal’s environmental performance, and transportation) and established four categories. Among the four groups (very high HDI, high HDI, middle HDI, and low HDI), the researchers categorized districts of Istanbul under the first three: 16 districts with very high HDI; 14 districts with high HDI; 9 districts with middle HDI. No district fell into the low group. Table 1 shows the HDI level of the districts.
2. Method
2.1. Sampling and Data Collection Procedure
Participants of this study were individuals reporting to use the selected recreational area regions in Istanbul through interviews conducted in selected downtown squares. The data was collected in the first week of November 2016, Monday through Friday between 10 a.m. and 7 p.m. by 20 graduate research assistants, with two assigned to a square. Individuals passing by research assistants were invited at random to participate in the survey. All participants who volunteered were informed about the study purpose and ensured about the confidentiality in advance. Of those who volunteered, only residents were interviewed. Interviewers asked the questions to the respondents one-on-one, face-to-face and noted their answers on the paper and pencil questionnaire while standing up.
Not all individuals approached were willing to participate in the research. Research assistants were not able to keep the record of the number of individuals who were willing to participate over the number of individuals approached by the research assistants to participate in the research. However, based on our discussion to determine the response rate, they all agreed that the ratio was about one over three and younger individuals compared to middle-aged or older individuals were more willing to participate in the survey (as reflected in proportion of participants).
A total of 65 squares in Istanbul are identified as significant squares and grouped based on their location and focus of interest [67]. Of those, we selected 10 squares, which are categorized as both culturally and commercially focused (see Figure 1). Of 10 squares, seven squares are located on the European side (squares at Eminönü, Taksim, Beşiktaş, Ortaköy, Bakırköy, Esenler, and Bağcılar) and three squares are located on the Asian side (squares at Kadıköy, Üsküdar and Ümraniye). The squares are located in districts, which are rich in their historical, touristic, recreational areas and financial activities, and attract visitors from diverse socio-demographic backgrounds. These 10 downtown squares were selected in order to be able to recruit participants representing the socio-economic level of individuals living in all districts of Istanbul as much as possible.
Drawing a representative sample from the population through random sampling is the optimum approach in social research [25]. However, this presents a challenge for researchers studying a city with over 15 million residents due to the reasons such as cost and inaccessibility. In addition, unavailability of a citywide or national database on outdoor recreation participation makes it impossible to compare whether the participants represent the population of Istanbul dwellers, who participate in outdoor recreation or visit recreational areas. However, as it was not our intention to generalize study findings, we designed the study as an explorative one. Still, it is highly likely that selected downtown squares helped us to obtain quotas of individuals, with some demographic characteristics such as socio-economic levels, age, and gender, with similar characteristics of Istanbul residents who participate in outdoor recreation.
Overall, we were able to recruit participants dwelling in 32 districts out of 39. Seven districts with no respondents are located in the peripheral part of the city. HDI level of resided districts were used as an approximation of SES level of individuals. Although our sample reflected the HDI distribution pattern of the population in general (e.g., the majority were from very high and high HDI districts in population and in the sample), each group had a relatively different proportion. For example, about two-thirds of our sample compared to 40% of the population reported to live in districts with very high HDI. Similarly, gender and age distribution of the sample and population were similar, with the exception that we had a greater proportion of individuals aged between 25 and 34. This is still a good approximation because our sample includes individuals over 16 years of age who have the ability to move.
2.2. Survey Instrument
The survey instrument contained items addressing self-reported participant demographics, use patterns, and preferences. The questionnaire consisted of two parts. The first part dealt with the respondent’s personal data, such as age, gender, and profession. We also asked individuals which district they reside in for approximation of their socio-economic status. For this, we used a categorization developed by Seker et al. [66] at the district level.
The second part of the questionnaire enquired about the use of the recreational areas. Survey items regarding the use of recreational areas started with asking the respondents their most frequently used outdoor recreational area among the given seven recreational area regions: Bosphorus, Marmara Sea Coast, Golden Horn, Old City Town, Princes’ Islands, Belgrade Forests and Black Sea Coasts. This question was followed by four relevant items pertaining to outdoor recreation participation at their most frequented area reported in the first item: (1) frequency of their visits to this area (2–3 times a week, once a week, once a month, and seldom); (2) length of a typical stay at the area (<1 h, 1–2 h, 2–5 h and >5 h); (3) estimated travel time to arrive at the area (<30 min, 30–60 min, 1–2 h, and >2 h), representing short, medium, long, and very long travel time, respectively, in Istanbul context; and (4) types of recreational activities. This question included response categories of leisurely walking, enjoying the scene, socializing (e.g., having conversations or chatting with people), grilling, fishing, picnicking, and other. We grouped grilling, fishing, picnicking and other as “organized activities” due to low frequency.
2.3. Statistical Analysis
Analysis was conducted to first describe such socio-demographic characteristics of participants as gender, age, occupation, and HDI. Thereafter, a series of analyses were carried out to evaluate whether outdoor recreation participation variables were associated with socio-demographic characteristics and other recreation variables.
In order to get a better understanding of the factors predicting outdoor recreation participation, first, we employed multinomial logistic regression for each recreation variable. Multinomial logistic regression is appropriate when the dependent variable has more than two categories or levels. It is not required to meet normality, linearity, or homoscedasticity assumptions [68]. However, the likelihood ratio and goodness-of-fit statistics, along with the relatively high percentage of cells with zero frequencies (>60%) showed that multinomial logistic regression may not be suitable for our analyses.
Alternatively, we decided to employ logistic regression. Logistic regression is an approach that can be used to describe the relationship of several independent variables to a dichotomous dependent variable and it does not assume a normal distribution. It gives the estimated probability of being in a category of a binary variable with predicting variables. We analyzed the estimated probability of being in each category compared to all others for all four recreation variables. For example, for the variable measuring the frequency of visits, we estimated the probability of visiting the area 2–3 times in a week (=1) compared to visiting the area less frequently (once a week, once a month, and seldom = 0). Interaction terms for theoretically relevant variables (see the Results section for details) were also used. The Hosmer–Lemeshow goodness-of-fit test [69], Nagelkerke R2 and likelihood ratio tests were used to evaluate the model fits.
The results are given as odds ratios (OR) with 95% confidence intervals (CI). An OR < 1 represents a lower and an OR > 1 represents a higher odds of being in that category compared to baseline category. SPSS Version 23 was used for analyses and statistical significance level was set at α ≤ 0.05.
3. Results
3.1. Characteristics of Respondents
Socio-demographic characteristics of study participants and population statistics for Istanbul city are presented in Table 2. A total of 500 individuals were administered the survey questionnaire. Of the respondents, 52% were female and 48% were male. Our participants were dominated by participants aged between 25–44 (68.7%), students and individuals with a job (about 77.8%) and individuals living in very high HDI districts (66%). Chi-Square statistics revealed that occupation varied significantly between males and females (X2 = 32.190, df = 3, p < 0.001) and across age groups (X2 = 487.602, df = 12, p < 0.001). The percentage of unemployed females was higher than that of males (21.9% vs. 5.9%), whereas the percentages of working and retired males were higher than those of the females (37.7% vs. 24.2% and 10.2% vs. 5.9%, respectively). As could be expected, the percentage of students among participants aged between 16–24 (95.7%) and between 25–34 (76.2%) was higher than it was among older participants Additionally, about three-fourths of the participants over 55 were either retired (56.7%) or unemployed (16.7%). The percentages of working and unemployed participants were higher among 35–44 year-olds (67.7% and 28.3%, respectively) and 45–54 year-olds (57.1% and 32.7%, respectively).
As HDI data at a coarser level was used, we compared the proportions for age, gender, and occupational status, and reported travel time to the recreational area for the three groups. Chi-Square statistics showed that age, gender and occupational status distribution of the participants across districts with three HDI levels were similar. On the other hand, individuals living in districts with a very high HDI level were more likely to report shorter travel time than those individuals living in districts with high and middle HDI (X2 = 29.41; df = 6; p < 0.001). Specifically, 25.2% of individuals living in districts with very HDI level compared to 4.8% and 9.3% of individuals living in districts with high HDI and middle HDI, respectively, reported traveling less than 30 min. About 43% of individuals living in high HDI compared to about 33% of those living in very high and middle HDI reported traveling 30–60 min. 58.2% of individuals from middle HDI traveled longer than an hour while 41.4% from very high and 52.4% from high HDI also did so.
3.2. Descriptives for Outdoor Recreation Participation
Percentages were used to describe the general use patterns of the recreational area by our respondents. Table 3 shows the results. Out of the 500 respondents, approximately 47.1% had visited a nature area at least once a week or more often, 71% had traveled sometime between 30 min to 2 h, 65% had spent longer than 2 h at the area, and 36.6% had undertaken leisurely walking.
3.3. Multiple Logistic Regression Results for the Outdoor Recreation Participation
Table 4 provides multiple logistic regression results for four outdoor recreation participation variables. Each variable, with its own response categories, was analyzed separately. To save space, only odd ratios are provided.
3.3.1. Predicting the Travel Time
Multiple logistic regression models for the travel time to the recreational area were developed to identify the determinants of the four possible outcomes: <30 min, 30–60 min, 1–2 h, and >2 h. The model included gender, age, occupation, HDI level of resided district, frequency of visits, length of visits, and recreational activities engaged in the area as predictors. We added the interaction effects to the models to further examine whether the least frequent and longest visits (seldom visits X > 5 h duration) predict the longest travel time (>2 h travel) and the most frequent and shortest visits (visits 2–3 for times a week X < 1 h duration) predict the shortest travel time (<30 min). The first panel of Table 4 presents the results.
<30 min travel. Nearly half of the respondents (47.1%) visiting the area 2–3 times a week, compared to 22.1% of those visiting the area once a week, and about 7% of those visiting the area once a month or seldom, reported traveling <30 min to the area. Results indicated that visiting the recreational area once a week (OR: 0.321, 95% CI: 0.166–0.624, p < 0.001), once a month (OR: 0.117, 95% CI: 0.052–0.263, p < 0.001), and seldom (OR: 0.104, 95% CI: 0.040–0.270, p < 0.001) were associated with lower likelihood of traveling <30 min than visiting the area 2–3 times a week. There was no interaction between frequency of visits and duration of visits.
30–60 min travel. Visiting the area once a week had higher odds of 30–60 min travel than visiting the area 2–3 times a week (OR: 1.876, 95% CI: 1.033–3.408, p < 0.05, 45.6% versus 29.4%). In addition, males were more likely to visit the area once a week than females (OR: 1.567, 95% CI: 1.047–2.345, p < 0.05).
1–2 h travel. The probability of traveling 1–2 h to the area was higher for visits occurring once a month (OR: 2.253, 95% CI: 1.177–4.311, p < 0.05) and seldom (OR: 2.649, 95% CI: 1.328–5.282, p < 0.01). About 43% of respondents visiting the area once a month and 45% of the respondents visiting the area seldom reported to reach the area within 1–2 h of travel.
>2 h travel. Only 10.5% of the individuals reported traveling >2 h. Travel time lasting >2 h was predicted by frequency and length of visits. The odds of >2 h travel were higher for visits that occurred once a month (OR: 8.241, 95% CI: 1.680–40.424, p < 0.01) and seldom (OR: 7.581, 95% CI: 1.277–44.988, p < 0.05) than visits which occurred 2–3 times a week. The odds were lower for visits lasting 1–2 h (OR: 0.236, 95% CI: 0.059–0.935, p < 0.05) and 2–5 h (OR: 0.060, 95% CI: 0.010–0.342, p = 0.01) than visits lasting <1 h. Only about 2% of the respondents visiting the area 2–3 times a week and another 2% visiting the area once a week reported traveling >2 h. No interaction effects between visit frequency and visit duration were observed.
3.3.2. Predicting the Frequency of Recreational Area Visits
In predicting the frequency of recreational area visits, we regressed the gender, age, occupation, HDI level of resided district, travel time, length of visits, and activity type on four levels of frequency of visits: 2–3 times a week, once a week, once a month, and seldom. We further included interaction terms to examine whether shortest travel time and shortest visit duration (<30 min travel time X < 1 h duration) predict the most frequent visit (2–3 times a week) and longest travel time and longest visit duration (>2 h travel time X >5 h duration) predict the least frequent visit (seldom). The results are shown in the second panel of Table 4.
2–3 times a week. The odds of visiting the recreational area 2–3 times a week were lower for 30–60 min travel (OR: 0.254, 95% CI: 0.129–0.499, p < 0.001), 1–2 h travel (OR: 0.189 95% CI: 0.092–0.385, p < 0.001) and >2 h travel (OR: 0.053, 95% CI: 0.010–0.270, p < 0.001) than it was for <30 min travel. About 43.2% of the individuals making trips lasting <30 min, compared to only 3–14% of individuals traveling >30 min, visited the recreational area 2–3 times a week.
The probability of having visits lasting 2–5 h (OR: 0.198 95% CI: 0.051–0.771, p < 0.05) and lasting >5 h (OR: 0.217, 95% CI: 0.062–0.754, p < 0.05) were lower than the probability of having visits lasting <1 h. One-third of the respondents spending <1 h at the area reported to make visits for 2–3 times a week. The coefficient for travel time X visit duration interaction was insignificant.
Once a week. The odds of visiting the recreational area was significantly lower for >2 h travel than for <30 min travel. Only 7.7% of those traveling >2 h visited the area once a week. Although not statistically significant, the odds were lower for 30–60 min travel and for 1–2 h travel than for <30 min travel.
Once a month. Traveling 30–60 min (OR: 2.704, 95% CI: 1.319–5.542, p < 0.01), 1–2 h (OR: 3.169, 95% CI: 1.547–6.493, p < 0.01), and >2 h (OR: 4.264, 95% CI: 1.749–10.393, p < 0.01) had higher likelihood than traveling <30 min. Furthermore, the probability was higher for visits lasting 2–5 h (OR: 3.162, 95% CI: 1.046–9.553, p < 0.05), and >5 h (OR: 2.983, 95% CI: 1.045–8.516, p < 0.05) than for visits lasting <1 h. A greater percentage of individuals traveling >30 min as well as individuals spending >2 h at the recreational area visited the recreational area once a month.
Seldom. About 20% of the individuals visited the recreational area seldom. The odds of visiting the area in seldom frequency were higher for travels lasting 1–2 h (OR: 3.785, 95% CI: 1.557–9.205, p < 0.01) and >2 h (OR: 7.691, 95% CI: 1.959–30.197, p < 0.001) than for travels lasting <30 min. Seldom visits were not associated with length of visits or type of activities, or any socio-demographics. Duration of visits and travel time was not interacted in predicting the seldom frequency.
Figure 2 and Figure 3 visually depict the relationship between frequency of visits and travel time and length of visits, respectively. Overall, as shown in Figure 2, it appears that individuals with shorter traveling time (see Figure 2) and with shorter stays (see Figure 3) tended to make more frequent visits and vice versa.
3.3.3. Predicting the Length of Recreational Area Visits
The model to predict the length of recreational area visits included socio-demographic variables (gender, age, occupation, HDI level of resided district), and travel time, frequency of visits, and types of recreational activities. We also analyzed whether the shortest travel time and the most frequent visit (<30 min travel time X 2–3 times a week visit frequency) predict the shortest visit duration (<1 h duration), and longest travel time and the least frequent visit (>2 h travel X seldom visits) predict the longest visit duration (>5 h). The third panel of Table 4 shows logistic regression results for each length of visits.
<1 h. Length of visits lasting <1 h was predicted by types of recreational activity and frequency of visits. The probability of having visits lasting <1 h was higher for enjoying the scene than organized activities (OR: 12.706, 95% CI: 1.52–105.84), and lower for visiting the area once a month than 2–3 times a week (OR: 0.207, 95% CI: 0.051–0.838). Although not significant, leisurely walking and socializing tended to have a higher probability than organized activities, and once a week or less frequent visits tended to have a lower probability than visits occurring 2–3 times a week. No interaction effects were found.
1–2 h. Visits lasting 1–2 h were predicted by gender, occupation, and frequency of visits. The odds of spending 1–2 h at the area were higher for males than for females (OR: 1.748, 95% CI: 1.132–2.700, p < 0.05), and were also higher for students (OR: 2.208, 95% CI: 1.047–4.654, p < 0.05) than for employed respondents. Moreover, it was lower for respondents visiting the recreational area once a month (OR: 0.312, 95% CI: 0.161–0. 607, p < 0.001) or seldom (OR: 0.462, 95% CI: 0.226–0.944, p < 0.05) than for those visiting 2–3 times a week.
2–5 h. Visits lasting between 2–5 h were associated with age, occupation, travel time, and types of activities. Respondents aged between 16–24 were more likely than those 55 and older (OR: 5.125, 95% CI: 1.036–25.341, p < 0.05), and students (OR: 0.408, 95% CI: 0.195–0.853, p < 0.05) and unemployed respondents (OR: 0.368, 95% CI: 0.143–0.948, p < 0.05) were less likely to spend 2–5 h at the recreational area than employed respondents. In addition, traveling >2 h compared to traveling <30 min was associated with lower probability of leisurely walking (OR: 2.539, 95% CI: 1.046–6.162, p < 0.05) and socializing (OR: 3.662, 95% CI: 1.466–9.145, p < 0.05) than organized activities.
>5 h. Length of visits lasting >5 h was predicted by the frequency of visits, and activity type. Compared to 30.4% of individuals traveling longer than 30 min, 41.2% of individuals traveling 30–60 min, 50.9% of individuals traveling 1–2 h and 67.3% of individuals traveling longer than 2 h reported spending 5 h or longer. About half of the individuals (54.5%) traveling shorter than 30 min spent 2 h or less at the area.
Visiting the recreational area once a month (OR: 2.480, 95% CI: 1.322–4.651, p < 0.01) and seldom (OR: 2.508, 95% CI: 1.237–5.167, p < 0.01) were associated with a higher probability of spending >5 h at the area than visiting the area 2–3 times a week. The interaction effect for frequency by travel time was insignificant. Finally, the odds of having visits >5 h were lower for leisurely walking (OR: 0.442, 95% CI: 0.244–0.800, p < 0.01), enjoying the scene (OR: 0.262, 95% CI: 0.135–0.508, p < 0.001) and socializing (OR: 0.356, 95% CI: 0.189–0.672, p < 0.001) than organized activities.
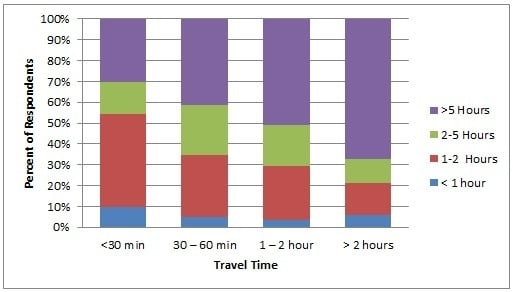
Overall, as shown in Figure 4, the duration of visits tended to get longer as the travel time gets longer. Additionally, individuals appeared to spend >5 h at the area if they traveled longer than 2 h (see Figure 5). Individuals socializing and doing organized activities tended to spend >5 h, while only 1–2% of those spent <1 h. In general, 43.4% of leisurely walking, 34.9% of enjoying the scene, 43.3% of socializing, and 65.4% of organized activities occurred during the visits lasting longer than 5 h (See Figure 6).
3.4. Predicting the Types of Recreational Activities
Multiple logistic regression models for the types of recreational activities were developed to identify the predictors of the four categories of activities: leisurely walking, enjoying the scene, socializing and organized activities. The predicting variables were gender, age, occupation, travel time, frequency of visits, and length of the visit. The results are presented in the fourth panel of Table 4.
Leisurely walking. It was predicted by travel time in that traveling >2 h was associated with lower odds of leisurely walking (OR: 0.35, 95% CI: 0.15–0.82, p < 0.05) than traveling <30 min. No association was observed between leisurely walking and other recreational participation variables or socio-demographics.
Enjoying the scene. It was associated with length of visits with the shortest visits having the highest probability. Visits lasting 1–2 h (OR: 0.38, 95% CI: 0.16–0.90, p < 0.05), 2–5 h (OR: 0.21, 95% CI: 0.08–0.55, p < 0.01), and >5 h (OR: 0.19, 95% CI: 0.08–0.46, p < 0.001) had significantly lower probability for enjoying the scene than visits lasting <1 h. Frequency of visits, travel time, or socio-demographic variables were not associated with enjoying the scene.
Socializing. Socializing was more likely during the 2–5 h of visits than during visits lasting <1 h (OR: 4.15, 95% CI: 1.24–13.91, p < 0.05), 1–2 h visits, or >5 h. It was also more likely to occur after travelling >2 h than travelling <30 min (OR: 4.95, 95% CI: 2.07–11.84, p < 0.001). Frequency of visits or socio-demographic background did not predict the types of recreational activities undertaken by the respondents.
Organized Activities. The probability of organized activities did not vary by recreational variables or socio-demographics. The only exception was that retired respondents were significantly less likely to participate in organized activities than working respondents (OR: 0.10, 95% CI: 0.01–0.980).
4. Discussion
This study examined participation in outdoor recreation of the residents of Istanbul, Turkey. Focusing on the most frequently visited outdoor recreational areas reported by respondents, travel time, frequency of visits, duration of visits, and types of recreational activities were of interest. We hypothesized that the recreational area variables would have reciprocal relationships and socio-demographic characteristics of respondents would influence participating in outdoor recreation. Employing multiple logistic regressions to our data, we found that the duration of visits, travel time, frequency of visits, and recreational activities were all interrelated.
Our first research question focused on describing the travel time, visit frequency and length, as well as recreational activities and the relationship between those variables. Our data showed that leisurely walking was the most popular activity with 36.6%. Participation rates of leisurely walking were not highly discernible from the participation rates of enjoying the scene or socializing. Organized activities were undertaken the least frequently. The visits lasted longer than 5 h for 45% of the respondents and lasted longer than 2 h for 65%. These percentages are comparatively higher than Kart’s [61] study, which focused on the use of a park in one of the recreational regions included in this study. Four in five respondents reported traveling >30 min to reach their most frequently visited recreational area. Barely half of the respondents made visits once a week or more often, whereas about one-third visited the area once a month and 20% made visits fewer than once a month. Although the proportions are comparatively higher than those reported in the studies by Kara and colleagues [58] and by Sezer and Akova [62], the percentages for visit frequencies are far lower than the percentages reported in studies from other parts of the world. For example, Schipperijn et al. [43] reported 92.4% of Danes visited a park weekly/once a week or more often and only 8.8% Danes visited the area once a month or less. Neuvonen et al. [13] reported that half of the residents participated in an outdoor activity daily or every other day for the Finnish population. Grahn and Stigsdotter [32] reported 153 visits and Ezebilo et al. [33] reported 74 visits in the Swedish population annually.
The recreational regions this research focused on are attractive, have beautiful nature composed of water and greenery, signify the beauty of Istanbul, and are segregated from the average level of residencies. Living expenses, including renting or owning a home around those regions are higher than average, as evidenced in our study sample, which had a greater percentage of individuals from very high HDI reporting shortest travel time to the recreational areas. However, as 82.4% of the respondents reported traveling longer than half an hour to the study sites, it is highly possible that they may engage in recreation more often in other green areas, such as those closer to their neighborhoods to fulfill their recreational needs. Indeed, one can even see people picnicking under trees on the side of highways or roads or in neighborhood parks.
People’s ability to recreate depends on time, money and access to transportation, private car or public transportation, in part, and so on. Ezebilo et al. [33] discuss that longer travel times to a nature area make participation in outdoor recreation a luxury good due to the associated travel costs. Considering that over 91% of our samples were from the very high or high HDI group, longer travel times probably discourage people from participating in outdoor recreation due to not only the travel costs, but also the time lost and traffic issues encountered on the way. While traveling and travel time might be enjoyable particularly when traveling along the coast or through a beautiful landscape, this would typically be stressful in a megacity like Istanbul with its traffic issues and high population density. In addition, given that a significantly greater number of individuals from a higher HDI level reported shorter travel time to the recreational area, a relatively lower level of participation in outdoor recreation may be indicative of time constraints, safety concerns, different recreational habits, or other limitations due to work and life conditions. It is worth investigating reasons for the low level of outdoor recreation participation of Istanbul residents.
Our second research question investigated the relationship between the recreation variables. As we expected, the travel time, frequency of visits, and duration of visits, were almost linearly interlinked. Indeed, the frequency of visits was almost the single predictor of travel time. The travel time was shortest for the respondents visiting the area most frequently and longest for those visiting the area least frequently. Existing research to date has predominantly focused on the role of park proximity for frequent park use, with findings supporting the importance of distance: the closer the distance the more frequent the recreational area visits occur [12,32,41,42,43,44,70]. This line of research asserts that distance predicts the frequency of visits. The logic behind this is that people make more (or less) frequent visits to a recreational area because they have one within a close (or far) distance. While this assertion certainly is justified in its validity, it would also be possible that people may first decide about how frequently they would participate in outdoor recreation and then choose an area with a suitable distance. For example, a mother with a young child may want to take her child to a playground several times a week and choose to go to the closest area, because it is time and cost-saving and convenient for such a frequency. It would also be possible for the mother to take her child to a playground several times a week because there is one near her home. Indeed, providing evidence for this assertion, our findings showed that the most frequent visits were observed for the shortest travel time, and the shortest duration, while least frequent visits were observed for the longest travel time and longer duration. In addition, several studies have shown that closer activity locations would actually promote more frequent trips with shorter durations [71,72]. Our findings are not necessarily in agreement with those. Surprisingly, visit duration, visit frequency, and travel time had independent relationships, meaning that the visits with the longest travel time were not necessarily the least frequent visits with the longest duration, nor were visits with shortest travel necessarily the most frequent visits with the shortest duration.
One of our expectations was that types of activities would predict the visit duration as some activities take longer than the others do. Our findings showed that organized activities such as picnicking, grilling, fishing, etc., were more likely to occur during the longest visit duration than leisurely walking, enjoying the scene or socializing. Enjoying the scene was observed most in the shortest duration, and socializing and leisurely walking were observed most during the 2–5 h duration. Contrary to our expectations, activity type was generally not associated with frequency of visits and the travel time. The only exception was that respondents reporting a travel time lasting >2 h had a higher probability of engaging in leisurely walking and a lower probability of socializing. Although these results are in agreement with Rossi et al.’s [46] study, showing no relationship between the distance travelled to the park and the activities that people engaged in, there might be several reasons stemming from the study itself to explain these findings. First, we focused on recreational regions, rather than a specific single park or recreational area. These regions include many parks and facilities and cover a large area (see Figure 1); ranging from central to peripheral, from poorly-managed and little facilities to well-managed and luxury facilities; and offered a wide range of recreational services including cheaper as well as more expensive prices. Thus, these regions entertain individuals who want to visit the area for different durations and for various types of activities as they have areas for picnicking, grilling, or fishing, as well as for leisurely walking or enjoying the scenery. Thus, people may not need to travel long to arrive at a part of the recreation site where they can picnic and spend long hours.
The aforementioned reasons might also explain the reason for not finding any systematic differences based on socio-demographic characteristics, particularly the SES level of resided districts in outdoor recreation participation; which was examined in our third research question. Research has shown that outdoor recreation areas are concentrated in higher SES regions and that individuals from higher SES participate in outdoor recreation more frequently [52]. Therefore, we expected that SES level of resided districts would relate to travel time, frequency of visits, duration of visits and even to the recreation activities. However, we found no such association. It is highly possible that the recreational regions we focused on offer recreational opportunities (as explained above) for individuals from different SES segments, in agreement with the assertion made by previous research that open spaces with a variety of features and amenities entertain and meet the needs of a wide range of users [41,73]. Another reason for not finding any difference in outdoor recreation participation would be that we were unable to retrieve SES, income and educational level of survey respondents. Instead, we asked in which districts they resided and used a generated HDI level of districts for our estimations. HDI level of districts is the aggregation of individual levels, thus, each HDI group or even each district has its more and less affluent areas. It is possible that we had respondents living in a less affluent area of a higher HDI district or vice versa.
Findings of previous research are inconclusive in terms of the variation in outdoor recreation participation by age and gender. Focusing on the distance, visit frequency and length, some studies found significant variation (e.g., [43,46,49]) and some did not (e.g., [13,51]). The studies finding variation by gender and age have shown that males and females and younger and older individuals may show different patterns of visit frequency and length interacting with distance with males and younger individuals. Particularly, younger males travel longer and make more frequent visits, and spend more time at the green space than their counterparts. In terms of occupation, working is associated with close-distance visits and with less frequent visits (e.g., [13,51]). The findings of this research showed that variations in 30–60 min travel time by gender, in favor of males; and in 2–5 h visit duration in favor of individuals with a job. Socio-demographic factors such as gender, age, and occupation were not associated with any other of the recreation variables systematically. This may be because the outdoor recreational spaces and pursuits inquired here are not gendered leisure spaces or activities, nor do they require a higher level of physical activity. Another reason would be that our respondents were composed of individuals visiting large downtown squares by walking, who are highly likely to have the ability and opportunity for outdoor recreation. It is possible that we were unable to reach individuals with limited ability to move or recreate outside, particularly beyond their close neighborhood.
Although the literature on participating in outdoor recreation is now extensive, being studied since the 1960s, relatively little research has formally linked travel time and frequency to duration and types of activities. Traditionally, distance is defined in miles and operationalized as the predictor of frequency. Both frequency and travel time are analyzed across settings with different features (i.e., neighborhood parks, urban parks, etc.) or varying distances, with respect to participating in physical activity (e.g., walking). It appears that distance has a consistently high predictive power of frequency.
Through the findings of this research, we suggest that (1) travel time can be analyzed as a determinant of duration and recreational behavior, in addition to frequency, as it, defined as time, also has a significant influence on duration and recreational behavior. (2) Frequency of visits can be operationalized as the predictor of travel time and duration. (3) Duration can be utilized as the predictor of travel time, frequency and recreation behavior. (4) Recreation behavior can be used to predict the duration. Ignoring the critical role of distance in outdoor participation, particularly in regard to the frequency of using urban green areas in the neighborhood, would be unwise. While years of research have shown the distance as the most prominent predictor of frequent participation, here we illustrated that frequency and duration of visits have an important influence on people’s willingness to travel as well. The findings of this research with those of previous research collectively imply that creating green nature areas within close distance to residents is critical. Yet, creating a demand for frequent and long-enough outdoor recreation participation may become more critical in some cases. Understanding the relationships among these recreation participation variables is important in terms of outdoor recreation management in megacities located in underdeveloped regions because cities are becoming increasingly crowded and urban populations often grow faster than the improvement speed of the recreation and transportation infrastructure.
Given the findings of our study, future research should expand on the relationship among recreation variables. Here, we have several suggestions: First, our analysis focused on the direct relationship between these variables. Future research may explore how these variables are related indirectly. For example, we found that the frequency of visits did not influence the recreational activity directly. Frequency of visits may be influential on the recreational activity through its relationship with duration or travel time. Furthermore, future research may find it beneficial to explore the causal relationships among these relationships. In doing so, social, economic, physiological, psychological, and demographic characteristics of individuals, as well as characteristics of neighborhoods, are critical determinants to be inquired.
One potential problem with this study is that we inquired the data about travel time, duration, and frequency of outdoor recreation participation based on the participants’ most frequently visited outdoor recreation place. Our data is also based on respondents’ reports. It is impossible to know whether their reported outdoor recreation participation relevant to their most frequently visited area is typical for their recreational experiences. Another problem is that although not systematically identified, at least every two out of three persons were reluctant to be interviewed for the research survey. Some even rejected before letting the interviewer inform them about the research. One reason for unwillingness to participate in the survey would be that in such large areas in Istanbul, individuals are frequently stopped and asked to participate in interviews for commercial purposes (e.g., introduce and try to convince to buy a new product, service or shop) or to make some charity donations. Thus, it is possible that they would have assumed our purpose was one of those. Another reason would be that these areas are also places where people make public transportation transfers; thus, some may be in a hurry to catch a bus or train and had no time for an interview. The third reason would be that they simply do not want to participate in the research. The response rate in our study might seem to be low compared to response rates in other research. Morton and colleagues [74] discuss that, in the 21st century, “There is no simple answer to what is an appropriate rate, and no rate is automatically indicative of greater or lesser accuracy and utility” (p. 108). Thus, we believe that the response rate is at an acceptable level given the data collection context.
5. Conclusions
Overall, we found that the longer the travel time, the less frequent the visits and vice versa. However, frequent visits seem to last shorter. In other words, although the association between the frequency of visits and visit duration is not linear, the longest visits were more likely to occur when the visits were once a month or seldom. This finding is supportive to the theory that the availability of parks in close distance increases the frequency of use, thus, participation in outdoor recreation. In addition, individuals appear to spend 2–5 h at the area for walking and socializing, less than an hour to enjoy the scene and more than five hours for organized activities.
Given the proportion of respondents with frequent visits and with reasonable travel time to access the recreational area, it is possible to conclude that the majority of Istanbul’s residents have limited participation in outdoor recreation, as the majority visit the area once a month or less, and travel a relatively long time. As the majority of our respondents were from high or very high HDI neighborhoods, the participation in outdoor recreation is probably influenced by issues and challenges stemming from living in this urban megacity, such as traffic jam, time constraints, physical and psychological exhaustion to commute to work or school, as well as long work hours in addition to the cost associated with outdoor recreation.
Although previous research has studied distance, visit frequencies and length, and types of activities either separately or comprehensively, we know no study that has investigated the associations among these variables using data from relatively less studied regions of the world. By addressing this gap, some of our findings support the previous research while some findings are relatively new and bring different perspective to how outdoor recreation participation may be viewed. We expected that this study would provide some insights to our understanding of outdoor recreation participation in a megacity.
The findings of this study shed light on outdoor recreation participation patterns of individuals living in a megacity, and we concluded that the participation is not good enough. This implies that the residents have limited contact with nature and limited opportunity to benefit from such an interaction. Consequently, it would not be unwise to speculate that well-being and life quality of people residing in such a city is put at risk, unless city planners and policy makers take necessary actions, such as building more roads, improving public transportation, as well as implementing regulations to prevent further loss of nature areas within reach of urban residents.
Author Contributions
Conceptualization, M.H.-K. and J.B.; data curation, M.H.-K.; formal analysis M.H.-K.; investigation, M.H.-K. and J.B.; methodology, M.H.-K. and J.B.; project administration, M.H.-K. and J.B.; supervision M.H.-K. and J.B.; visualization M.H.-K.; writing—original draft, M.H.-K.; writing—review and editing, M.H.-K. and J.B. All authors have read and agreed to the published version of the manuscript.
Acknowledgments
Digital forest data used for this research were provided by Mehmet Fatih Döker. Mapping of the data were done by Cem Oğuz Büke. We thank our colleague Jan Keily for English editing.
Conflicts of Interest
The authors declare no conflict of interest.
References and Notes
- Manning, R.E.; Anderson, L.E.; Pettengill, P.R. Managing Outdoor Recreation: Case Studies in the National Parks, 2nd ed.; CABI: Boston, MA, USA, 2017; p. 240. [Google Scholar]
- Thapa, B. The mediation effect of outdoor recreation participation on environmental attitude-behavior correspondence. J. Environ. Educ. 2010, 41, 133–150. [Google Scholar] [CrossRef]
- Breuste, J.; Niemelä, J.; Snep, R.P. Applying landscape ecological principles in urban environments. Landsc. Ecol. 2008, 23, 1139–1142. [Google Scholar] [CrossRef]
- Breuste, J.; Qureshi, S. Urban sustainability, urban ecology and the Society for Urban Ecology (SURE). Urban Ecosyst. 2011, 14, 313–317. [Google Scholar] [CrossRef]
- Bozat, A.; Fischer, L.K.; Kowarik, I. Unexploited opportunities in understanding liveable and biodiverse cities. A review on urban biodiversity perception and valuation. Glob. Environ. Chang. 2016, 39, 220–233. [Google Scholar] [CrossRef]
- United Nations. World Urbanization Prospects. The 2018 Revision; United Nations Department of Economich and Social Affairs: Nova Iorque, NY, USA, 2019. [Google Scholar]
- United Nations. Population Facts: A World of Cities. Department of Economic and Social Affairs; United Nations: Nova Iorque, NY, USA, 2014; pp. 1–2. [Google Scholar]
- Wright-Wendel, H.E.; Zarger, R.K.; Mihelcic, J.R. Accessibility and usability: Green space preferences, perceptions, and barriers in a rapidly urbanizing city in Latin America. Landsc. Urban Plan. 2012, 107, 272–282. [Google Scholar] [CrossRef]
- Bell, S.; Tyrväinen, L.; Sievänen, T.; Pröbstl, U.; Simpson, M. Outdoor recreation and nature tourism: A European perspective. Living Rev. Landsc. Res. 2007, 1, 1–46. [Google Scholar] [CrossRef] [Green Version]
- Boll, T.; Von Haaren, C.; Von Ruschkowski, E. The preference and actual use of different types of rural recreation areas by urban dwellers—The Hamburg Case Study. PloS ONE 2014, 9, e108638. [Google Scholar] [CrossRef] [Green Version]
- Breuste, J.; Astner, A. Which kind of nature is liked in urban context? A case study of solarcity Linz, Austria. Mitt. Osterreichischen Geogr. Ges. 2017, 159, 105–129. [Google Scholar] [CrossRef]
- Cohen, D.A.; McKenzie, T.L.; Sehgal, A.; Williamson, S.; Golinelli, D.; Lurie, N. Contribution of public parks to physical activity. Am. J. Public Health 2007, 97, 509–514. [Google Scholar] [CrossRef]
- Neuvonen, M.; Sievänen, T.; Tönnes, S.; Koskela, T. Access to green areas and the frequency of visits—A case study in Helsinki. Urban For. Urban Green. 2007, 6, 235–247. [Google Scholar] [CrossRef]
- Oguz, D. User survey of Ankara’s parks. Landsc. Urban Plan. 2000, 52, 165–171. [Google Scholar] [CrossRef]
- Cordell, H.K. Recreation and Tourism Trends Research. Presented at National Outdoor Recreation Conference, Helsinki, Finland. 2005. Available online: http://www.srs.fs.fed.us/trends/NatORC.html (accessed on 10 November 2006).
- National Survey on Recreation and the Enviroment. American’s participation in outdoor recreation: Results from NSRE. In National Survey on Recreation and the Environment 2000–2002; The Interagency National Survey Consortium, Coordinated by the USDA Forest Service, Recreation, Wilderness, and Demographics Trends Research Group, Athens, GA and the Human Dimensions Research Laboratory, University of Tennessee, Knoxville, TN; National Survey on Recreation and the Enviroment: Asheville, NC, USA, 2003. [Google Scholar]
- Artmann, M.; Chen, X.; Iojă, I.-C.; Hof, A.; Onose, D.; Poniży, L.; Lamovšek, A.Z.; Breuste, J. The role of urban green spaces in care facilities for elderly people across European cities. Urban For. Urban Green. 2017, 27, 203–213. [Google Scholar] [CrossRef]
- Dzhambov, A.M.; Dimitrova, D.D. Urban green spaces’ effectiveness as a psychological buffer for the negative health impact of noise pollution: A systematic review. Noise Health 2014, 16, 157–165. [Google Scholar] [CrossRef]
- Kaźmierczak, A. The contribution of local parks to neighbourhood social ties. Geogr. Plan. 2013, 31–44. [Google Scholar] [CrossRef] [Green Version]
- Kjellgren, A.; Buhrkall, H. A comparison of the restorative effect of a natural environment with that of a simulated natural environment. J. Environ. Psychol. 2010, 30, 464–472. [Google Scholar] [CrossRef]
- Tyrväinen, L.; Ojala, A.; Korpela, K.; Lanki, T.; Tsunetsugu, Y.; Kagawa, T. The influence of urban green environments on stress relief measures: A field experiment. J. Environ. Psychol. 2014, 38, 1–9. [Google Scholar] [CrossRef]
- Van den Berg, A.E.; Jorgensen, A.; Wilson, E.R. Evaluating restoration in urban green spaces: Does setting type make a difference? Landsc. Urban Plan. 2014, 127, 173–181. [Google Scholar] [CrossRef]
- Wolch, J.R.; Byrne, J.; Newell, J.P. Urban green space, public health, and environmental justice: The challenge of making cities ‘just green enough’. Landsc. Urban Plan. 2014, 125, 234–244. [Google Scholar] [CrossRef] [Green Version]
- Wilson, J.F.; Christensen, K.M. The relationship between outdoor recreation and depression among individuals with disabilities. J. Leis. Res. 2012, 44, 486–506. [Google Scholar] [CrossRef]
- Christensen, L.B.; Johnson, R.B.; Turner, L.A. Research Methods, Design, and Analysis, 12nd ed., Global Edition; Pearson Education Limited: Hoboken, NJ, USA, 2014; p. 542. [Google Scholar]
- Gidlöf-Gunnarsson, A.; Öhrström, E. Noise and well-being in urban residential environments: The potential role of perceived availability to nearby green areas. Landsc. Urban Plan. 2007, 83, 115–126. [Google Scholar] [CrossRef]
- Kaplan, S.; Kaplan, R. Health, supportive environments, and the reasonable person model. Am. J. Public Health 2003, 93, 1484–1489. [Google Scholar] [CrossRef] [PubMed]
- Song, Y.; Gee, G.C.; Fan, Y.; Takeuchi, T. Do physical neighborhood characteristics matter in predicting traffic stress and health outcomes? Transp. Res. Part F Traffic Psychol. Behav. 2007, 10, 164–176. [Google Scholar] [CrossRef] [Green Version]
- Park, B.-J.; Tsunetsugu, Y.; Kasetani, T.; Morikawa, T.; Kagawa, T.; Miyazak, Y. Physiological effects of forest recreation in a young conifer forest in Hinokage Town, Japan. Silva Fenn. 2009, 43, 291–301. [Google Scholar] [CrossRef] [Green Version]
- Song, C.; Joung, D.; Ikei, H.; Igarashi, M.; Aga, M.; Park, B.-J.; Miwa, M.; Takagaki, M.; Miyazaki, Y. Physiological and psychological effects of walking on young males in urban parks in winter. J. Physiol. Anthropol. 2013, 32. [Google Scholar] [CrossRef] [Green Version]
- Song, C.; Ikei, H.; Igarashi, M.; Takagaki, M.; Miyazaki, Y. Physiological and psychological effects of a walk in urban parks in fall. Int. J. Environ. Res. Public Health 2015, 12, 14216–14228. [Google Scholar] [CrossRef]
- Grahn, P.; Stigsdotter, U.A. Landscape planning and stress. Urban For. Urban Green. 2003, 2, 1–18. [Google Scholar] [CrossRef] [Green Version]
- Ezebilo, E.E.; Boman, M.; Mattsson, L.; Lindhagen, A.; Mbong, W. Preferences and willingness to pay for close to home nature for outdoor recreation in Sweden. J. Environ. Plan. Manag. 2015, 58, 283–296. [Google Scholar] [CrossRef]
- Christensen, K.M.; Holt, H.M.; Wilson, J.F. The relationship between outdoor recreation and depression among older adults. World Leis. J. 2013, 55, 72–82. [Google Scholar] [CrossRef]
- Mwebaze, P.; Jeff, B. Valuing Australian botanic collections: A combined travel-cost and contingent valuation study. AARES 2012, 56, 498–520. [Google Scholar] [CrossRef] [Green Version]
- Clawson, M. Methods for Measuring Demand for and Value of Outdoor Recreation; Reprint no:10; Resources for the Future Inc.: Washington, DC, USA, 1959. [Google Scholar]
- Clawson, M.; Knetsch, J.L. Economics of Outdoor Recreation, 1st ed.; John sHopkins Press: Baltimore, MD, USA, 1966; p. 328. [Google Scholar]
- Wilkinson, P.F. The use of models in predicting the consumption of outdoor recreation. J. Leis. Res. 1973, 5, 34–48. [Google Scholar] [CrossRef]
- Parsons, G.R. The travel cost model. In A Primer on Nonmarket Valuation, 2nd ed.; Springer: Berlin/Heidelberg, Germany, 2003; pp. 187–233. [Google Scholar]
- Smith, V.K. The estimation and use of models of the demand for outdoor recreation. In Assessing Demand for Outdoor Recreation; National Akademy of Sciences: Washington, DC, USA, 1975; pp. 89–125. [Google Scholar]
- Giles-Corti, B.; Broomhall, M.H.; Knuiman, M.; Collins, C.; Douglas, K.; Ng, K.; Lange, A.; Donovan, R.J. Increasing walking: How important is distance to, attractiveness, and size of public open space? Am. J. Prev. Med. 2005, 28, 169–176. [Google Scholar] [CrossRef] [PubMed]
- McCormack, G.R.; Rock, M.; Toohey, A.M.; Hignell, D. Characteristics of urban parks associated with park use and physical activity: A review of qualitative research. Health Place 2010, 16, 712–726. [Google Scholar] [CrossRef] [PubMed]
- Schipperijn, J.; Ekholm, O.; Stigsdotter, U.K.; Toftager, M.; Bentsen, P.; Kamper-Jørgensen, F.; Randrup, T.B. Factors influencing the use of green space: Results from a Danish national representative survey. Landsc. Urban Plan. 2010, 95, 130–137. [Google Scholar] [CrossRef]
- Silva, A.T.D.; Fermino, R.C.; Lopes, A.A.D.S.; Alberico, C.O.; Reis, R.S. Distance to fitness zone, use of facilities and physical activity in adults. Rev. Bras. Med. Esporte 2018, 24, 157–161. [Google Scholar] [CrossRef] [Green Version]
- Hanink, D.M.; White, K. Distance effects in the demand for wildland recreation services: The case of national parks in the United States. Environ. Plan. 1999, 31, 477–492. [Google Scholar] [CrossRef]
- Rossi, S.; Pickering, C.M. The role of distance in peri-urban national park use: Who visits them and how far do they travel? Appl. Geogr. 2015, 63, 77–88. [Google Scholar] [CrossRef] [Green Version]
- Sugiyama, T.; Francis, J.; Middleton, N. J.; Owen, N.; Giles-Corti, B. Associations between recreational walking and attractiveness, size, and proximity of neighborhood open spaces. Am. J. Public Health 2010, 100, 1752–1757. [Google Scholar] [CrossRef]
- Shanahan, D.F.; Lin, B.B.; Gaston, K.J.; Bush, R.; Fuller, R.A. What is the role of trees and remnant vegetation in attracting people to urban parks? Landsc. Ecol. 2015, 30, 153–165. [Google Scholar] [CrossRef] [Green Version]
- Payne, L.L.; Mowen, A.J.; Orsega-Smith, E. An examination of park preferences and behaviors among urban residents: The role of residential location, race, and age. Leis. Sci. 2002, 24, 181–198. [Google Scholar] [CrossRef]
- Liu, W.; Chen, W.; Dong, C. Spatial decay of recreational services of urban parks: Characteristics and influencing factors. Urban For. Urban Green. 2017, 25, 130–138. [Google Scholar] [CrossRef]
- Van Cauwenberg, J.; Cerin, E.; Timperio, A.; Salmon, J.; Deforche, B.; Veitch, J. Park proximity, quality and recreational physical activity among mid-older aged adults: Moderating effects of individual factors and area of residence. Int. J. Behav. Nutr. Phys. Act. 2015, 12, 1–8. [Google Scholar] [CrossRef] [Green Version]
- Giles-Corti, B.; Donovan, R.J. Socioeconomic status differences in recreational physical activity levels and real and perceived access to a supportive physical environment. Prev. Med. 2002, 35, 601–611. [Google Scholar] [CrossRef] [PubMed]
- Ogilvie, D.; Lamb, K.E.; Ferguson, N.S.; Ellaway, A. Recreational physical activity facilities within walking and cycling distance: Sociospatial patterning of access in Scotland. Health Place 2011, 17, 1015–1022. [Google Scholar] [CrossRef] [PubMed]
- Ferguson, N.S.; Lamb, K.E.; Wang, Y.; Ogilvaie, D.; Ellaway, A. Access to recreational physical activities by car and bus: An assessment of socio-spatial inequalities in mainland Scotland. PloS ONE 2013, 8, e55638. [Google Scholar] [CrossRef] [PubMed] [Green Version]
- Lamb, K.E.; Ogilvie, D.; Ferguson, N.S.; Murray, J.; Wang, Y.; Ellaway, A. Sociospatial distribution of access to facilities for moderate and vigorous intensity physical activity in Scotland by different modes of transport. Int. J. Behav. Nutr. Phys. Act. 2012, 9, 1–10. [Google Scholar] [CrossRef] [PubMed] [Green Version]
- Neredeyim: İstanbul. Coğrafya (Where Am I: Istanbul. Geography). Available online: istanbul.ktb.gov.tr (accessed on 12 January 2020).
- Yiğit, A.; Hayir-Kanat, M. İstanbul şehrinde ağırlıklı nüfus merkezinin değişimi ve nedenleri: 1990–2010 dönemi (Changes of Population Gravity Center in İstanbul: Period 1990–2010). Int. J. Soc. Sci. Res. 2017, 6, 114–123. [Google Scholar]
- Kara, F.; Demirci, A.; Kocaman, S. Şehir coğrafyası açısından bir araştırma: Istanbul’un açık rekreasyon alanlarının değerlendirilmesi (A study of city geography approach: The evaluation of outdoor recreational areas in Istanbul). Marmara Coğrafya Derg. 2008, 18, 76–95. [Google Scholar]
- Mühendislerï, Ç; Subesï, O.İ. Report for Environmental Condition of Istanbul (Istanbul Çevre Durum Raporu); Environment and Urban Ministry (Cevre ve Sehircilik Bakanligi): Istanbul, Turkey, 2017.
- Dülger Türkoğlu, H.; Bölen, F.; Baran, P.K.; Marans, R. İstanbul’da yaşam kalitesinin ölçülmesi (Measuring urban quality of life in Istanbul). İtüdergİsİ/A Mimar. Plan. Tasar. 2008, 7, 103–113. [Google Scholar]
- Kart, N. Emirgan parkında kullanıcıların memnuniyet derecelerinin değerlendirilmesi. J. Fac. For. Istanb. Univ. 2005, 55, 185–208. [Google Scholar]
- Sezer, B.; Akova, O. Kent sakinlerinin rekreasyon tercihleri, rekreasyon alanlarının algılanan değeri ve ger-çek kullanımı arasındaki ilişki (The Relations between recreation preferences of residences, the perceived value ff recreational areas and their real use). Fac. Econ. Adm. Sci. E J. 2016, 5, 94–115. [Google Scholar]
- Kurt, S. Land use changes in Istanbul’s Marmara Sea coastal regions between 1987 and 2007. Middle East J. Sci. Res. 2012, 11, 1584–1590. [Google Scholar] [CrossRef]
- Yılmaz, H.; Turgut, H.; Demircan, N. Determination of the preference of urban people in picnic areas with different landscape characteristics. Sci. Res. Essays 2011, 6, 1740–1752. [Google Scholar]
- Yılmaz, H.; Surat, H.; Özhancı, E.; Yeşil, P.; Yeşil, M. Urban living area satisfaction and public preference. Kast. Üniv. Orman Fak. Derg. 2015, 15, 319–329. [Google Scholar] [CrossRef]
- Seker, M.; Bakıs, B.; Dizeci, B. Insani Gelisme Endeksi—Ilçeler (IGE-I) 2017 Tüketiciden Insana Geçis (Human Development Index—Districts (IGE-I) 2017 Transition from Consumer to Human), 1st ed.; Çizge Tanıtım & Matbaacılık Ltd. Şti: Istanbul, Turkey, 2018; p. 112. [Google Scholar]
- Çakılcıoğlu, M.; Reyhan, S.; Kurt, T. İstanbul Meydanları. Kent Genelindeki Önemli Meydanların ve Plan Kararlarında Belirlenen Öneri Meydanların Değerlendirilmesi (Istanbul Squares. Evaluation of Important Squares Throughout the City and Proposed Squares Identified in Plan Decisions); IBB: Istanbul, Turkey, 2010. [Google Scholar]
- Tabachnick, B.G.; Fidell, L. Using Multivariate Statistics, 4th ed.; Allyn and Bacon: Needleham Heights, MA, USA, 2001; p. 966. [Google Scholar]
- Hosmer, D.W.; Lemeshow, S. Applied Logistic Regression, 2nd ed.; John Wiley & Sons, Inc.: Hoboken, NJ, USA, 2000; p. 375. [Google Scholar]
- Jensen, F.D.; Koch, N.E. Twenty-five years of forest recreation research in Denmark and its influence on forest policy. Scand. J. For. Res. 2004, 19, 93–102. [Google Scholar] [CrossRef]
- Susilo, Y.O.; Dijst, M. How far is too far? Travel time ratios for activity participations in the Netherlands. Transp. Res. Rec. 2009, 2134, 89–98. [Google Scholar] [CrossRef]
- Susilo, Y.O.; Dijst, M. Behavioural decisions of travel-time ratios for work, maintenance and leisure activities in the Netherlands. Transp. Plan. Technol. 2010, 33, 19–34. [Google Scholar] [CrossRef] [Green Version]
- Kaczynski, A.T.; Potwarka, L.R.; Saelens, B.E. Association of park size, distance, and features with physical activity in neighborhood parks. Am. J. Public Health 2008, 98, 1451–1456. [Google Scholar] [CrossRef]
- Morton, S.M.B.; Bandara, D.K.; Robinson, E.M.; Carr, P.E.A. In the 21st century, what is an acceptable response rate? Aust. N. Z. J. Public Health 2012, 36, 106–108. [Google Scholar] [CrossRef]
Figure 1.
Distribution of outdoor nature recreation area in Istanbul (own elevation).

Figure 2.
The relationship between travel time and frequency of visits.

Figure 3.
The relationship between length of visits and frequency of visits.

Figure 4.
The relationship between travel time and duration of visits.

Figure 5.
The relationship between frequency of visits and duration of visits.

Figure 6.
The relationship between activity type and length of visits.


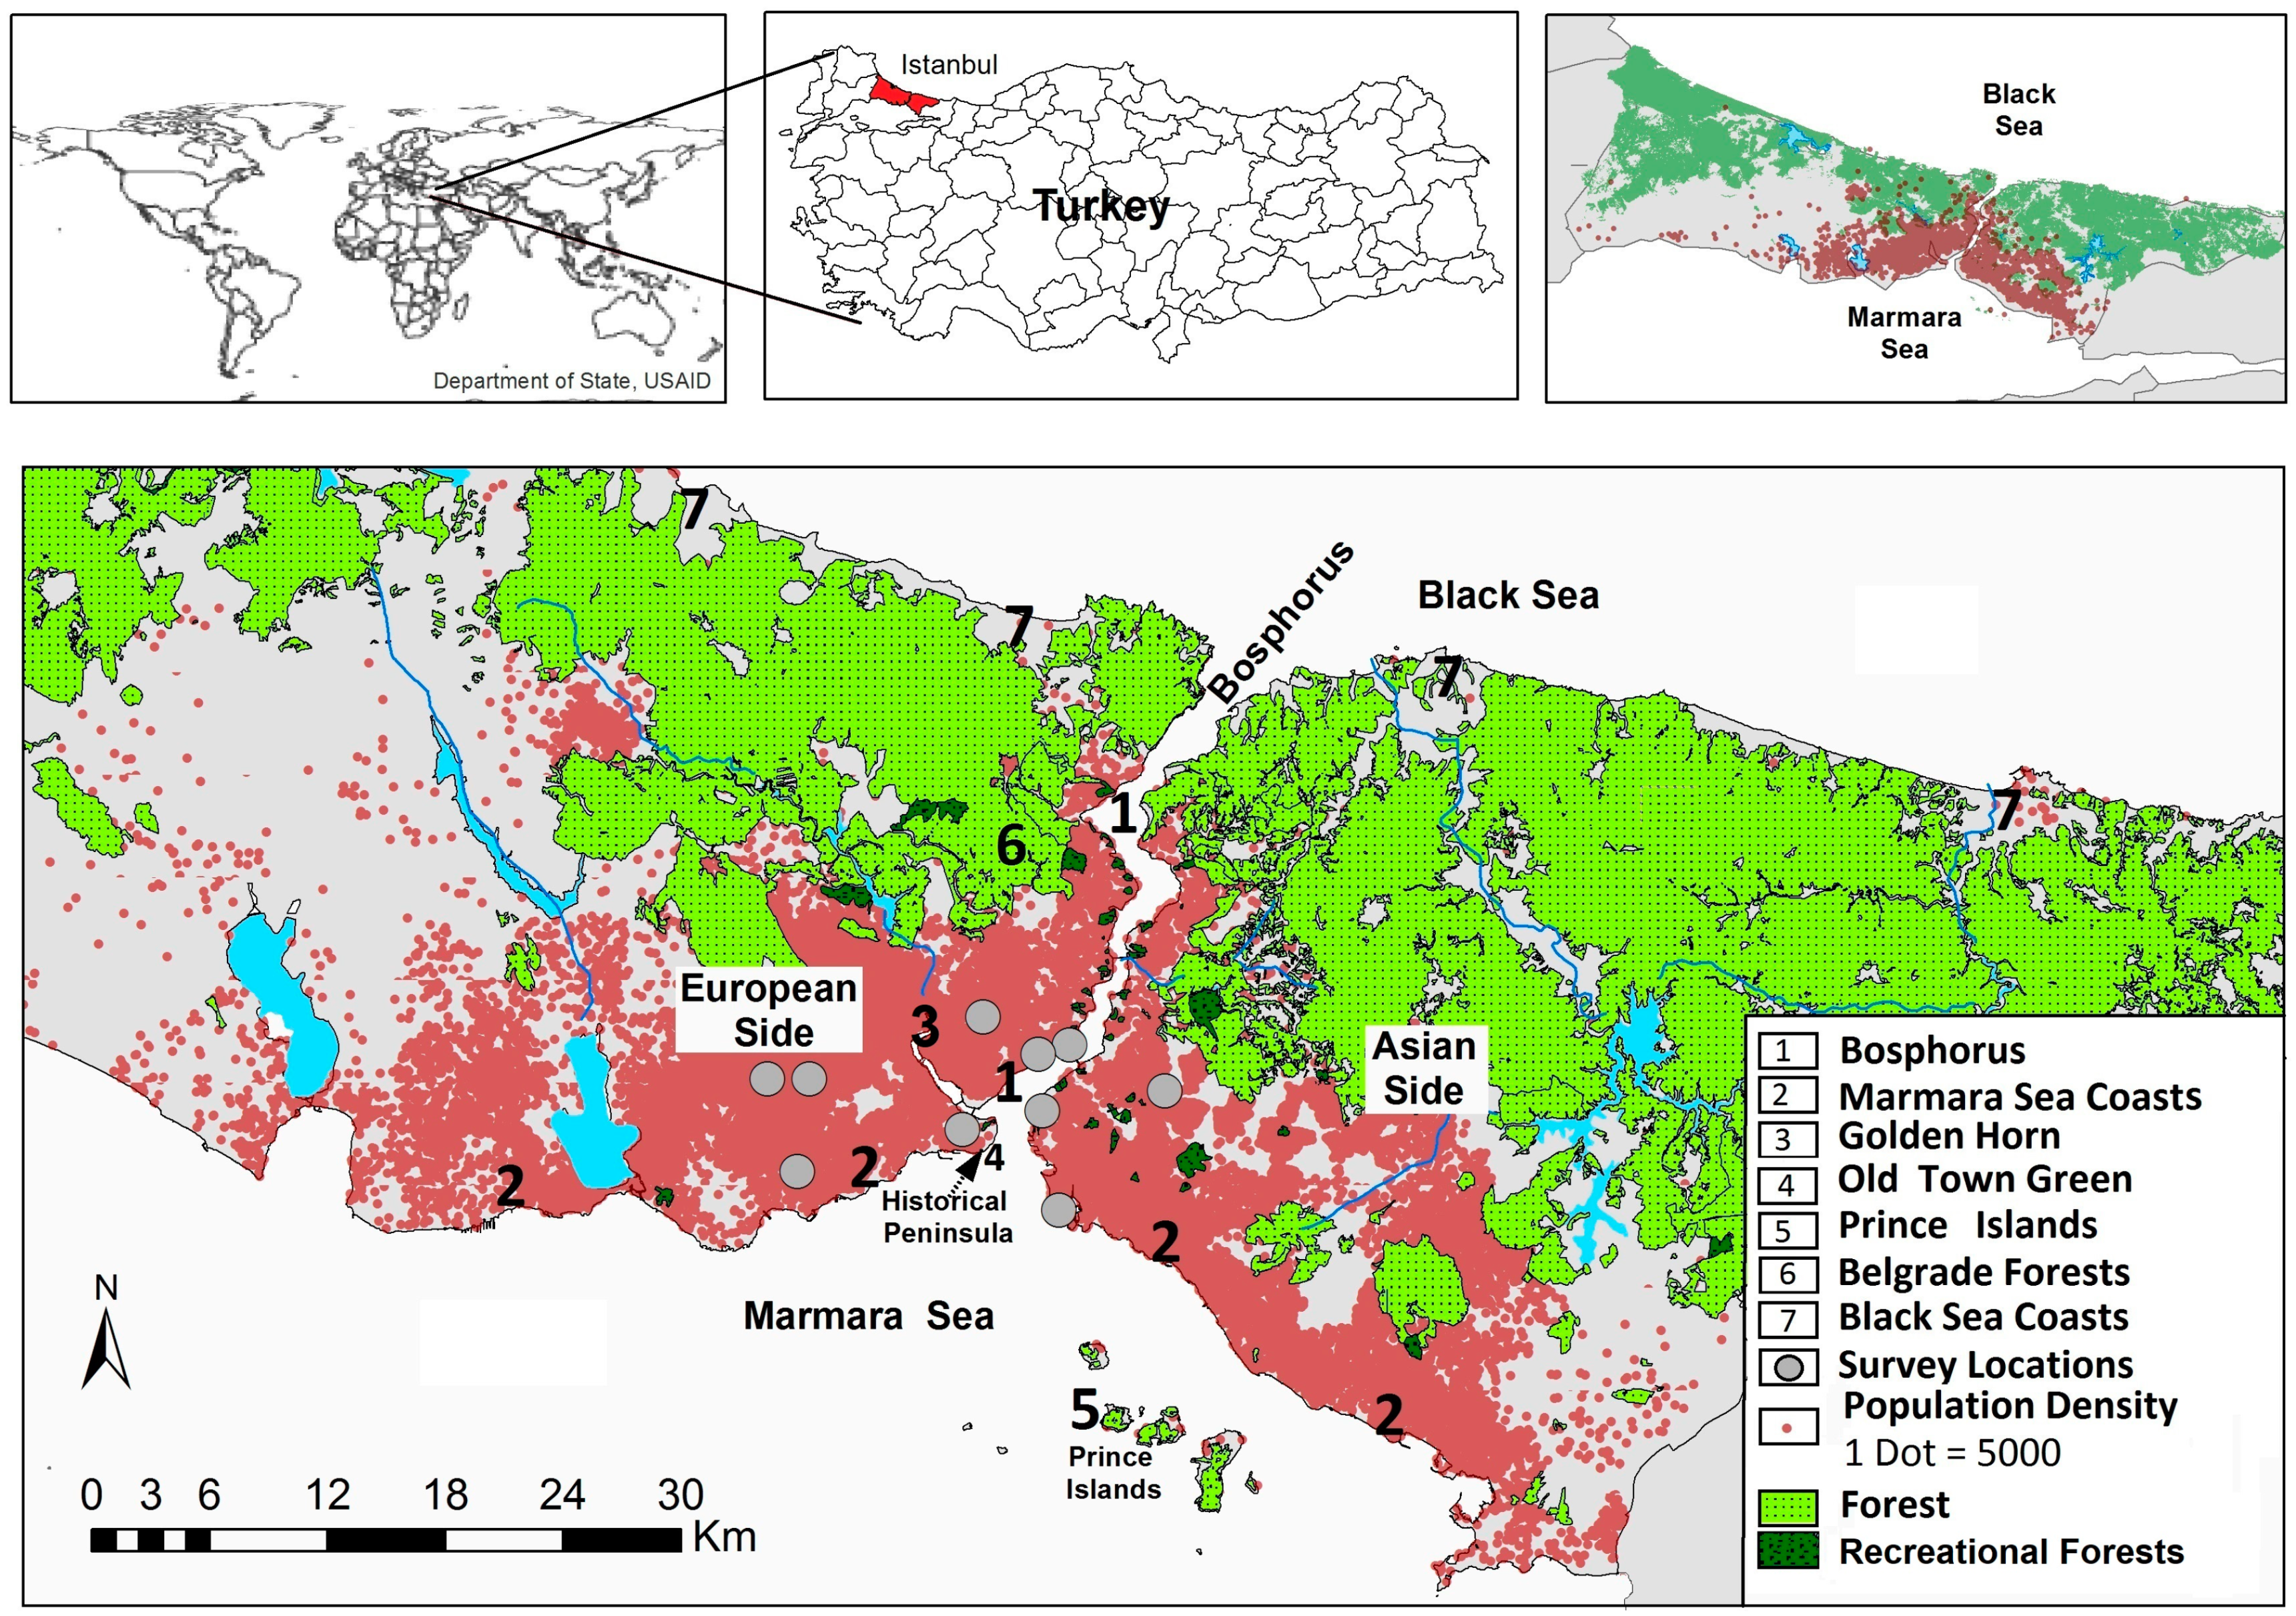
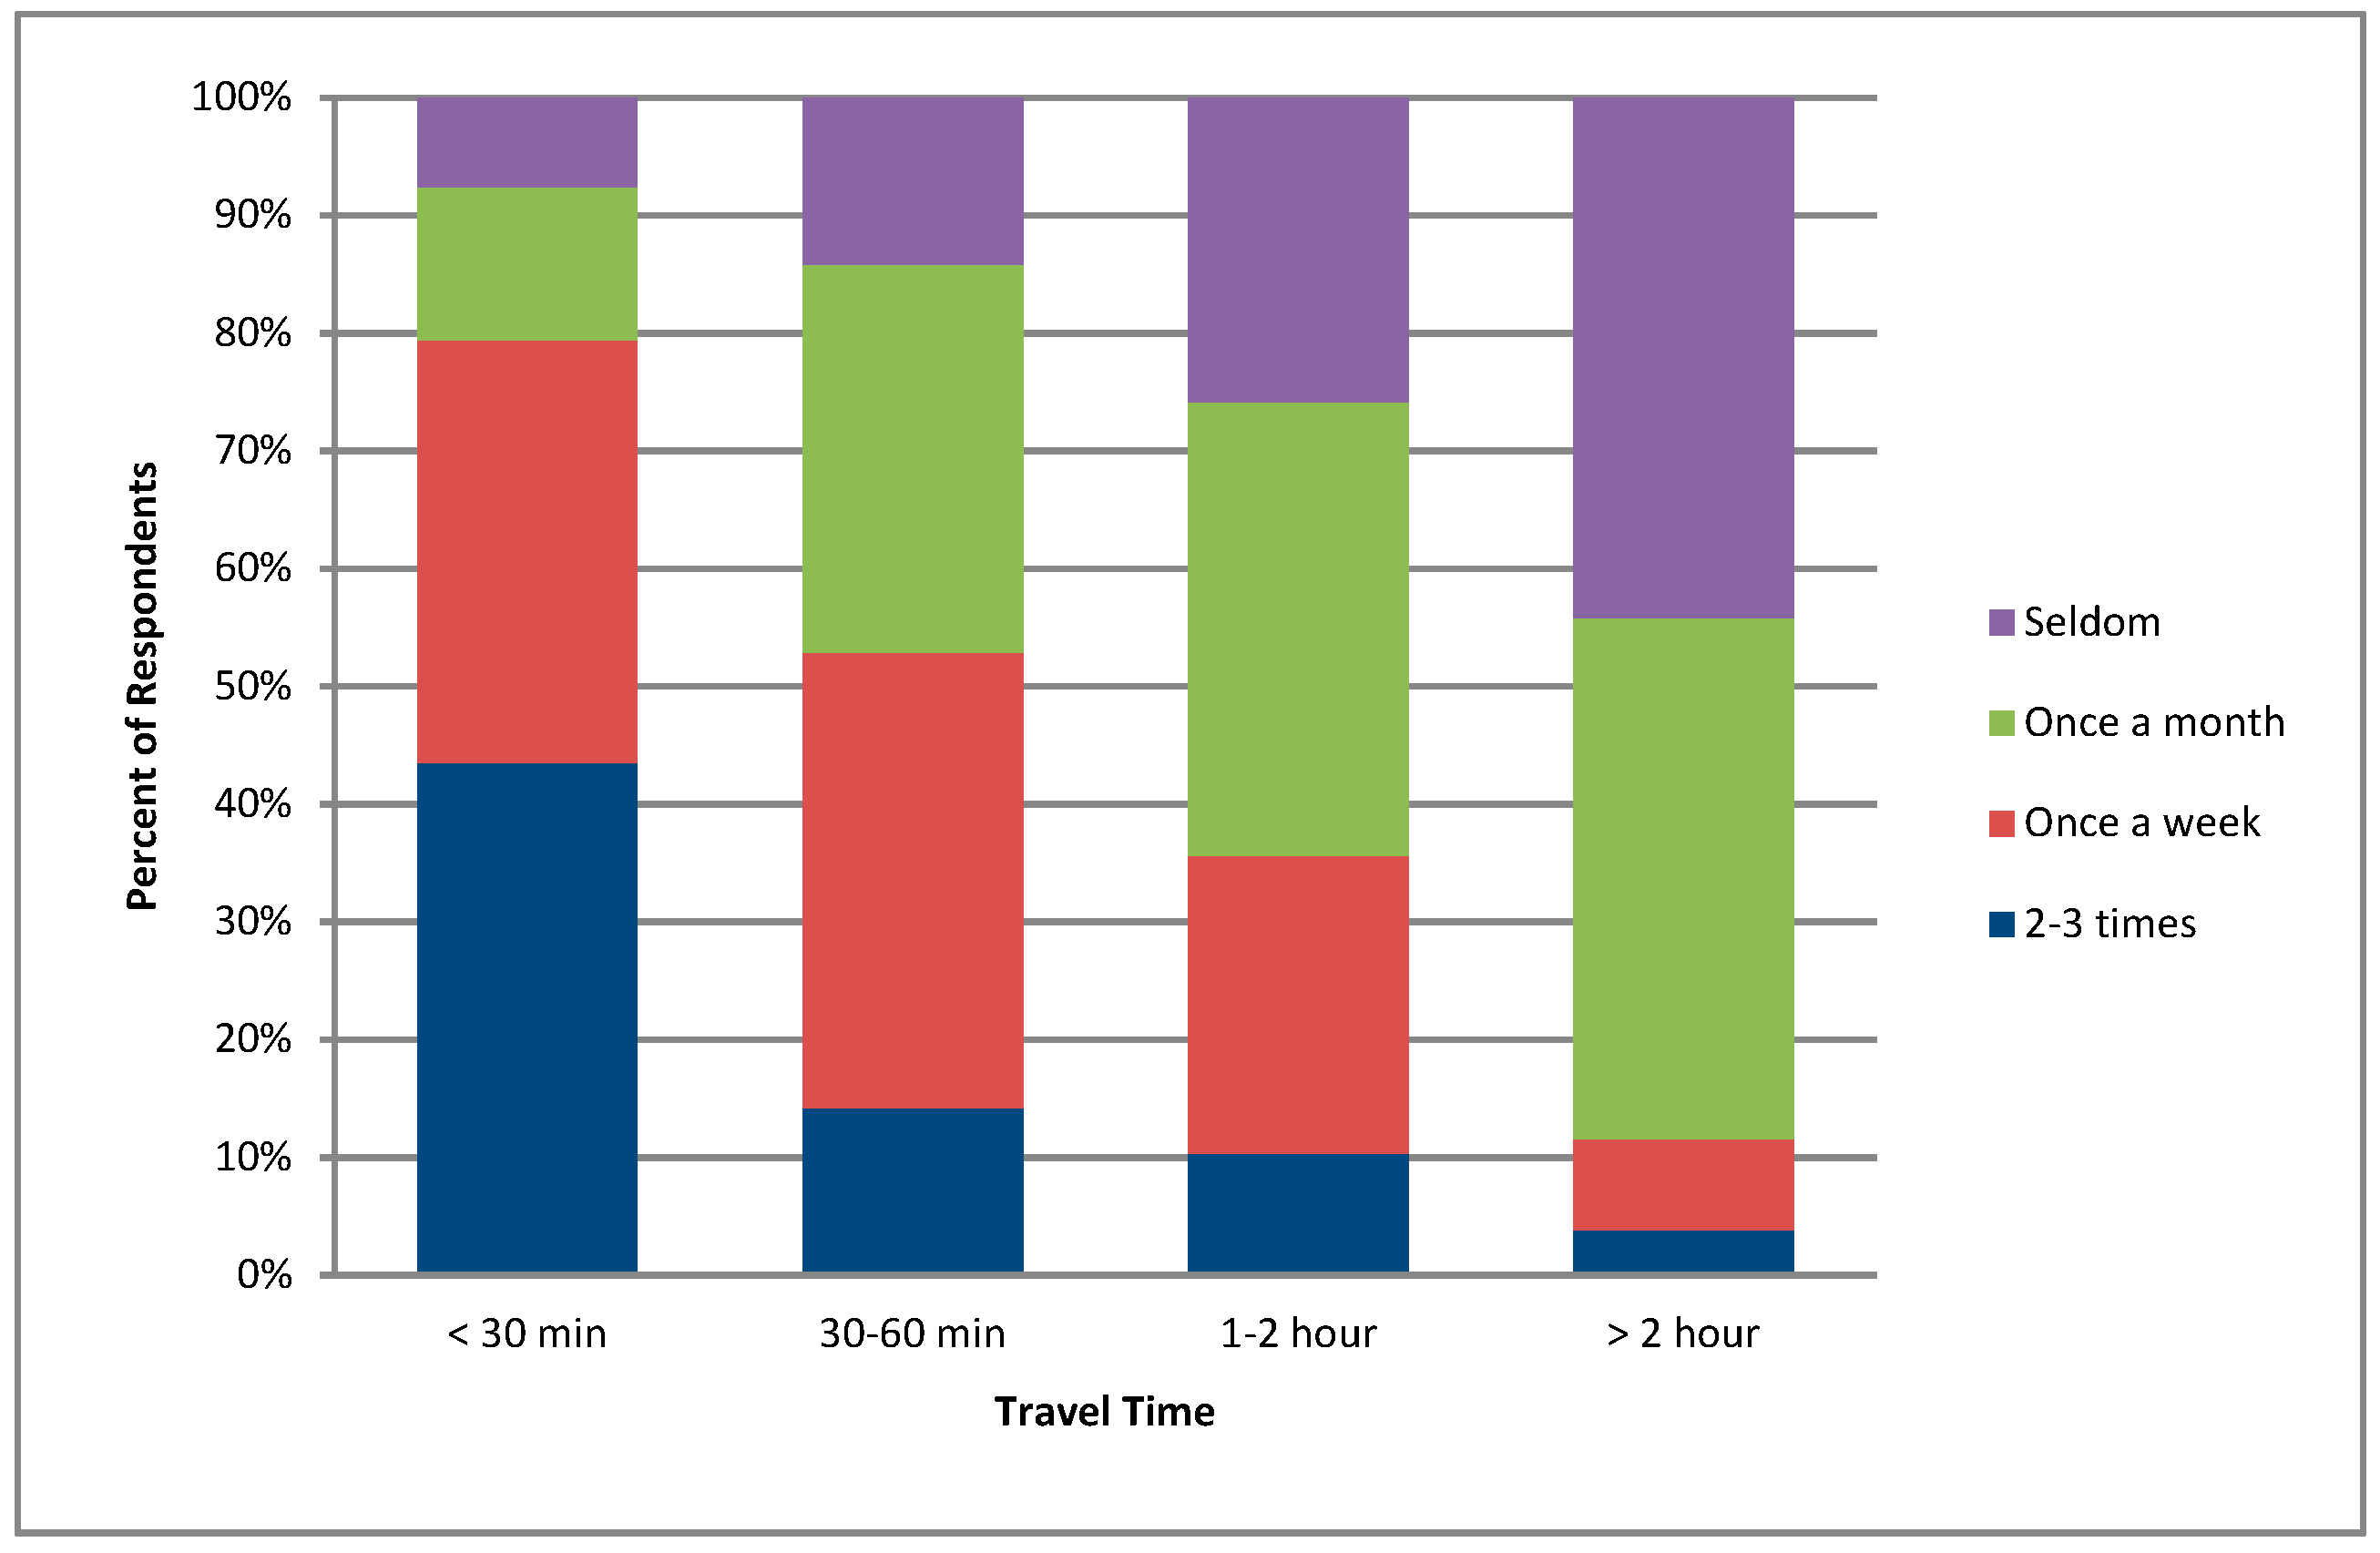
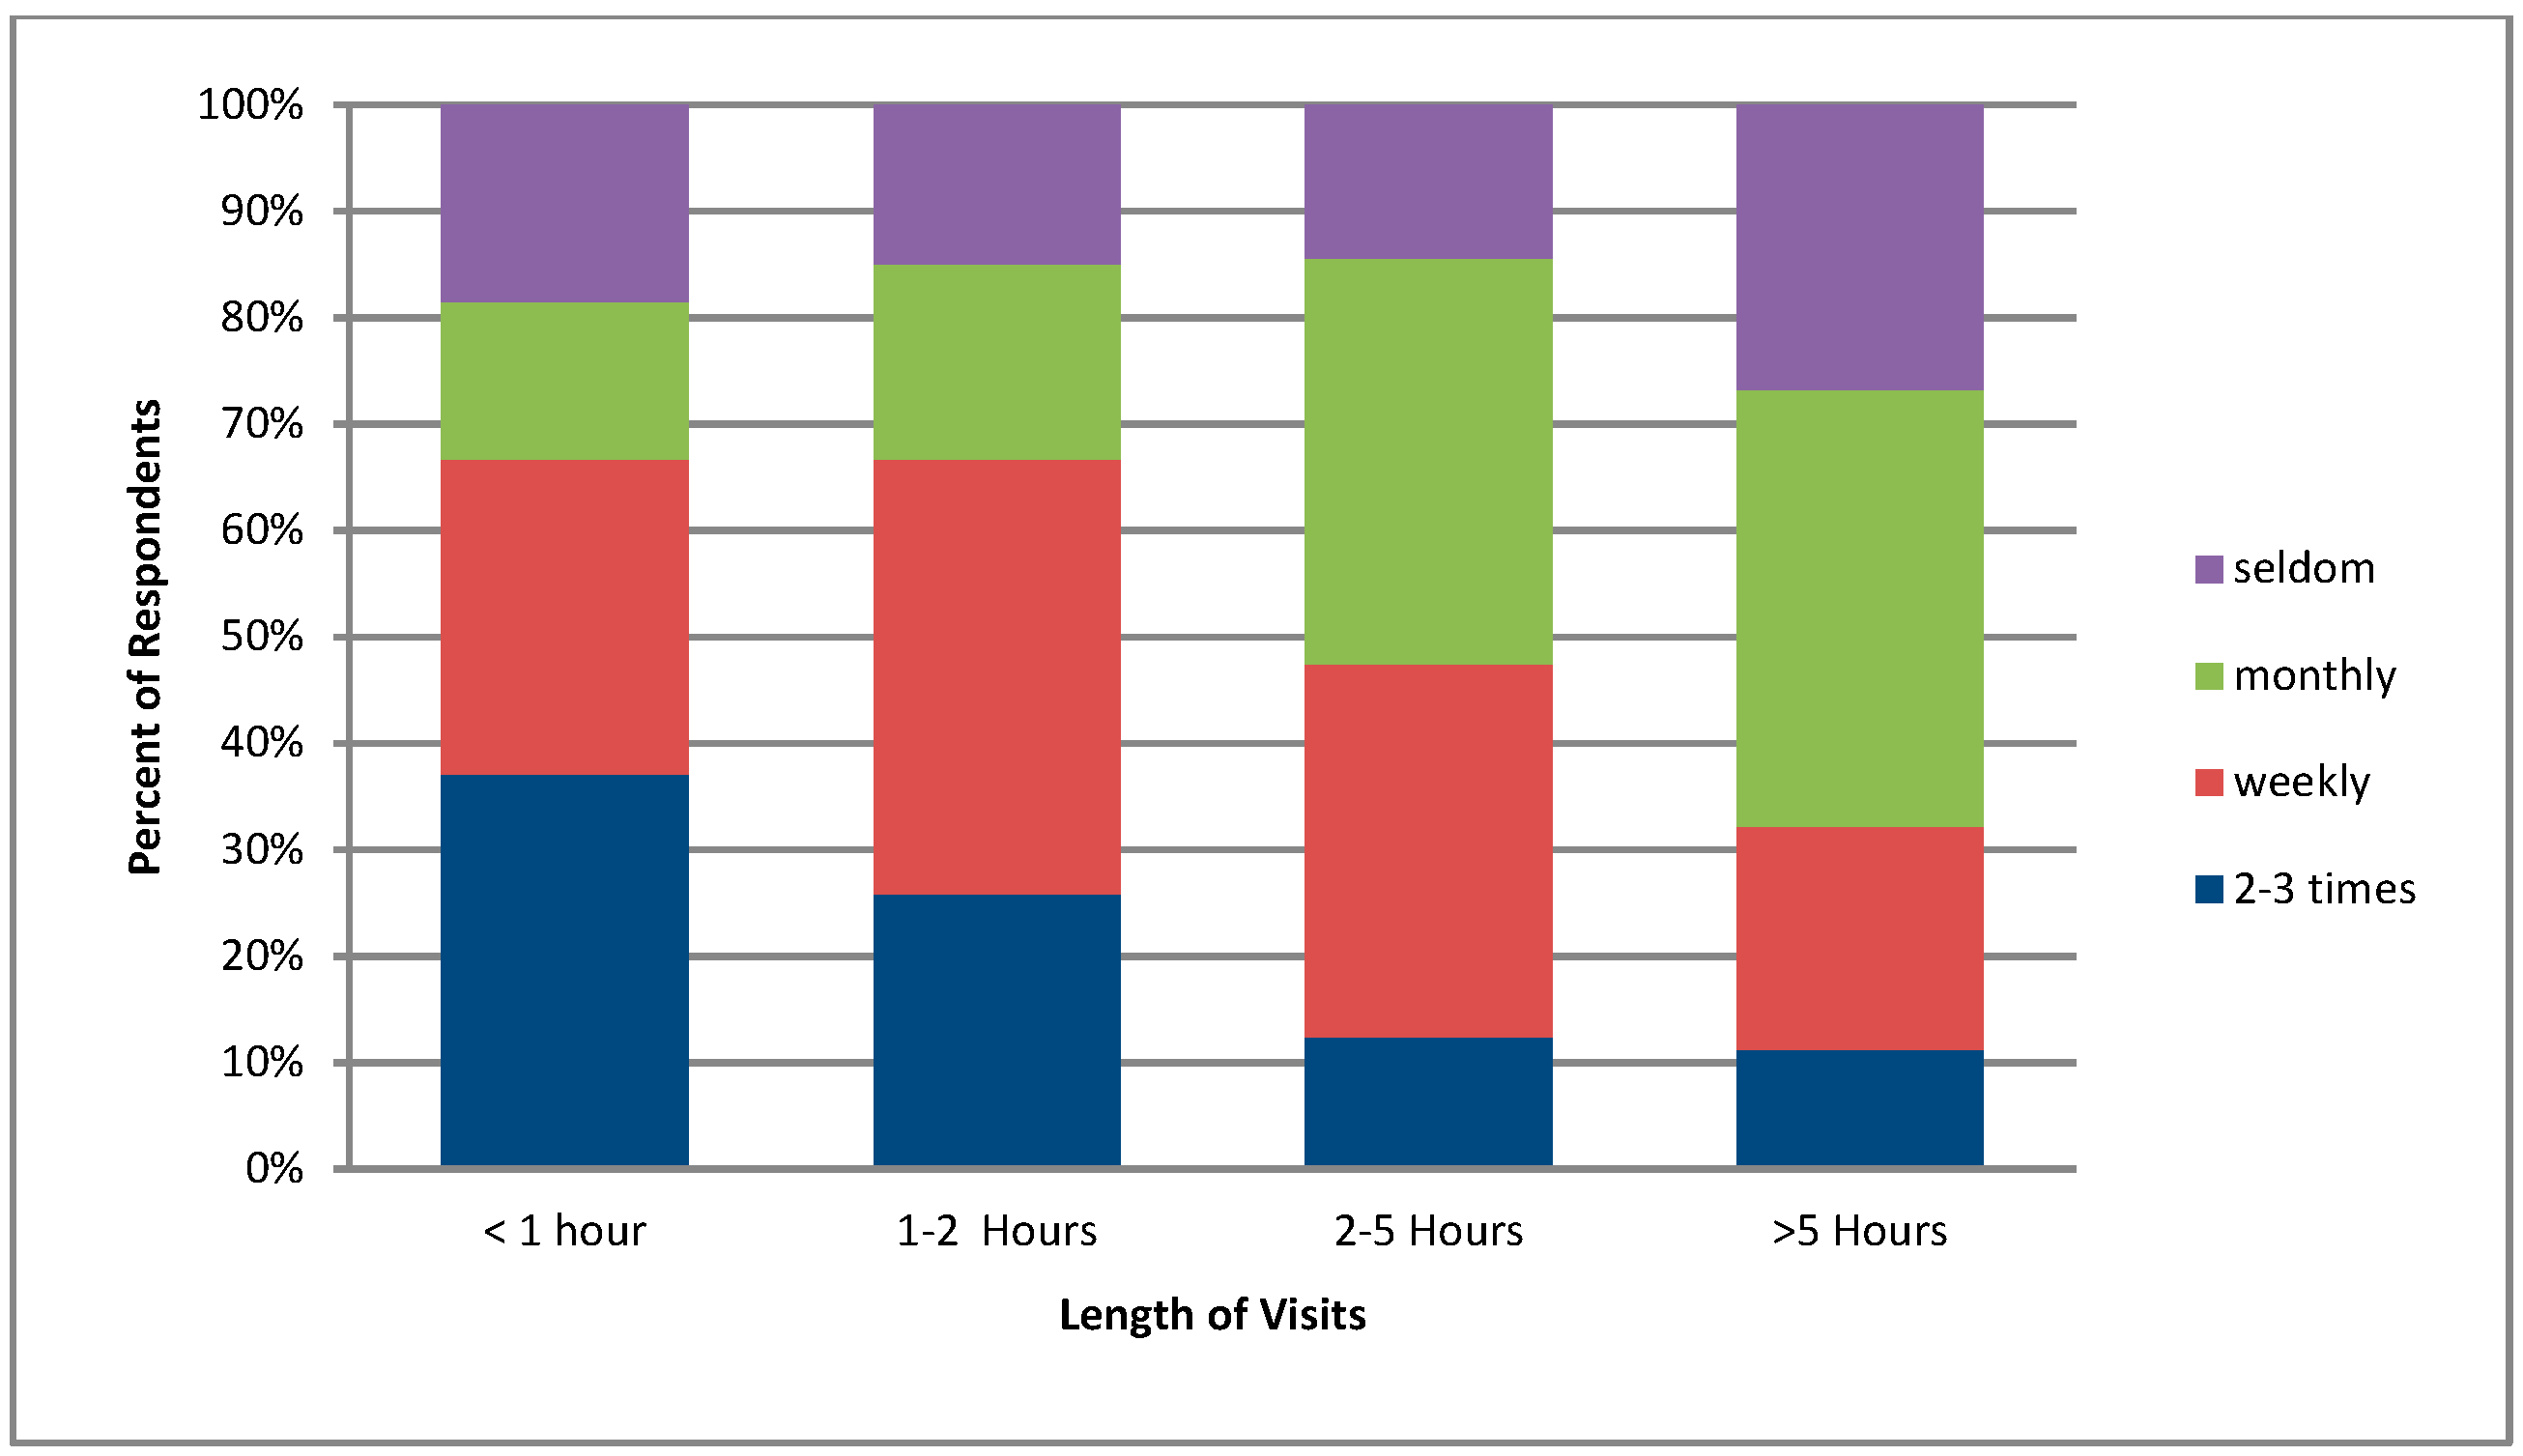
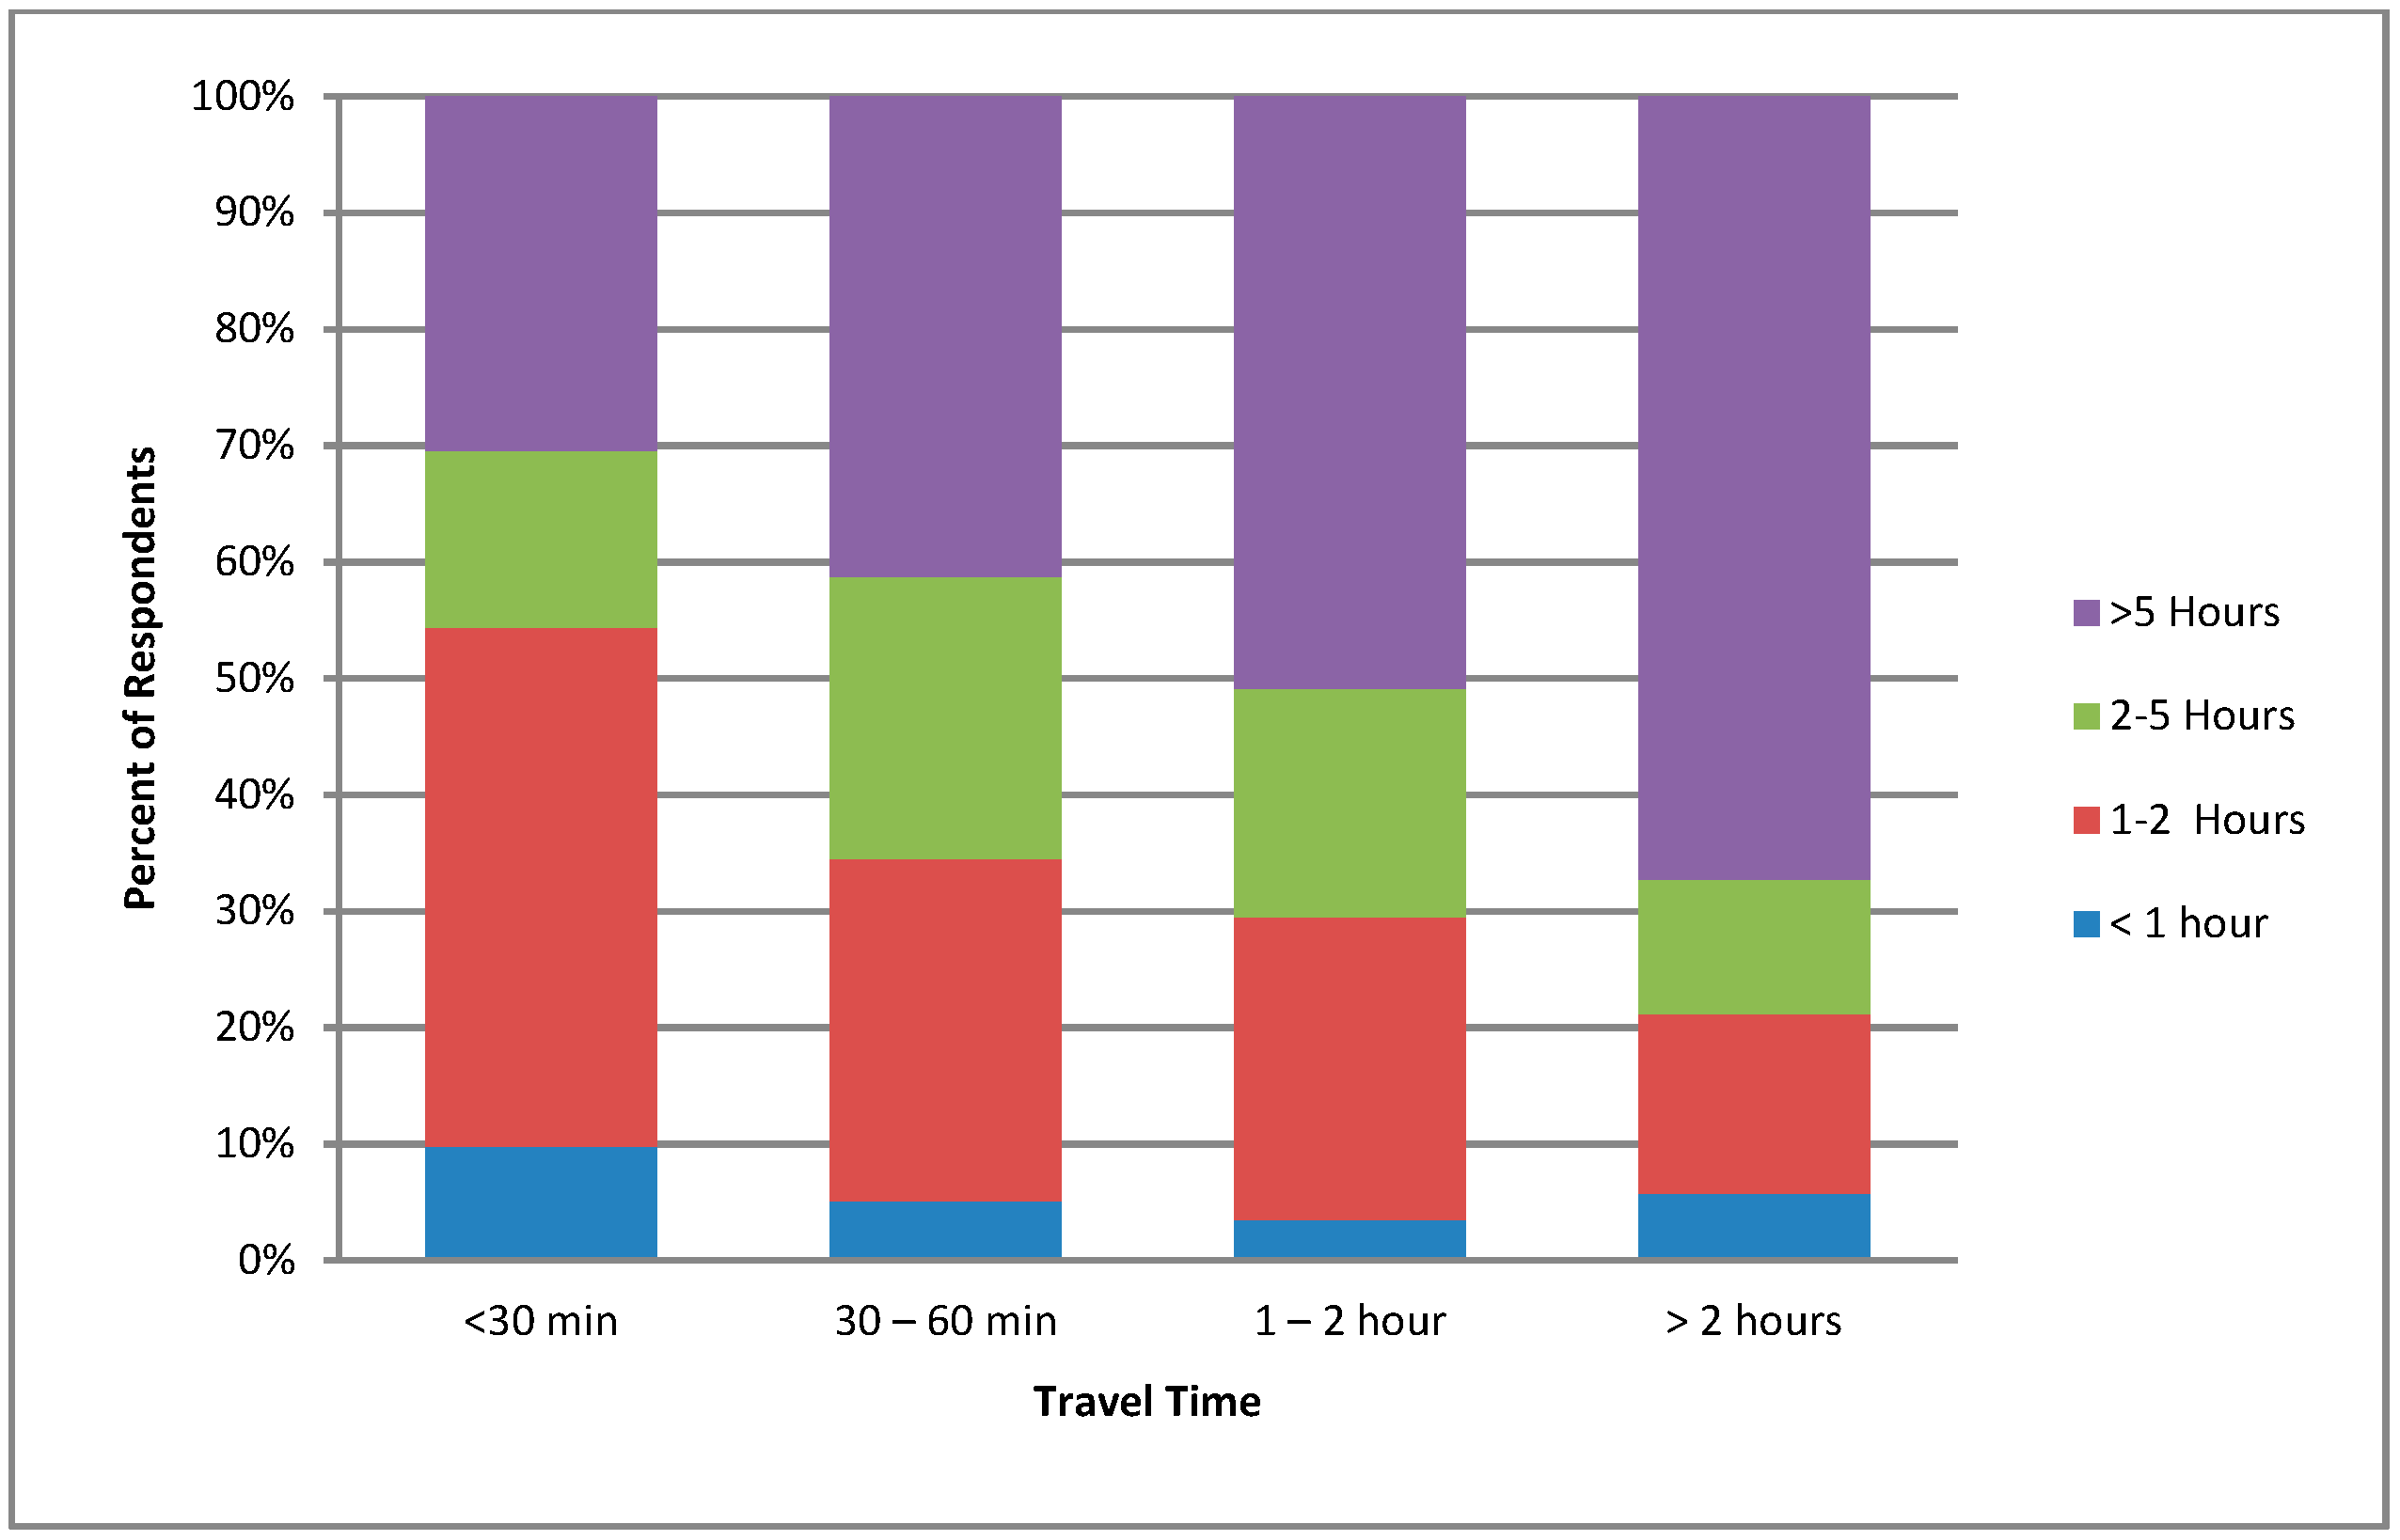
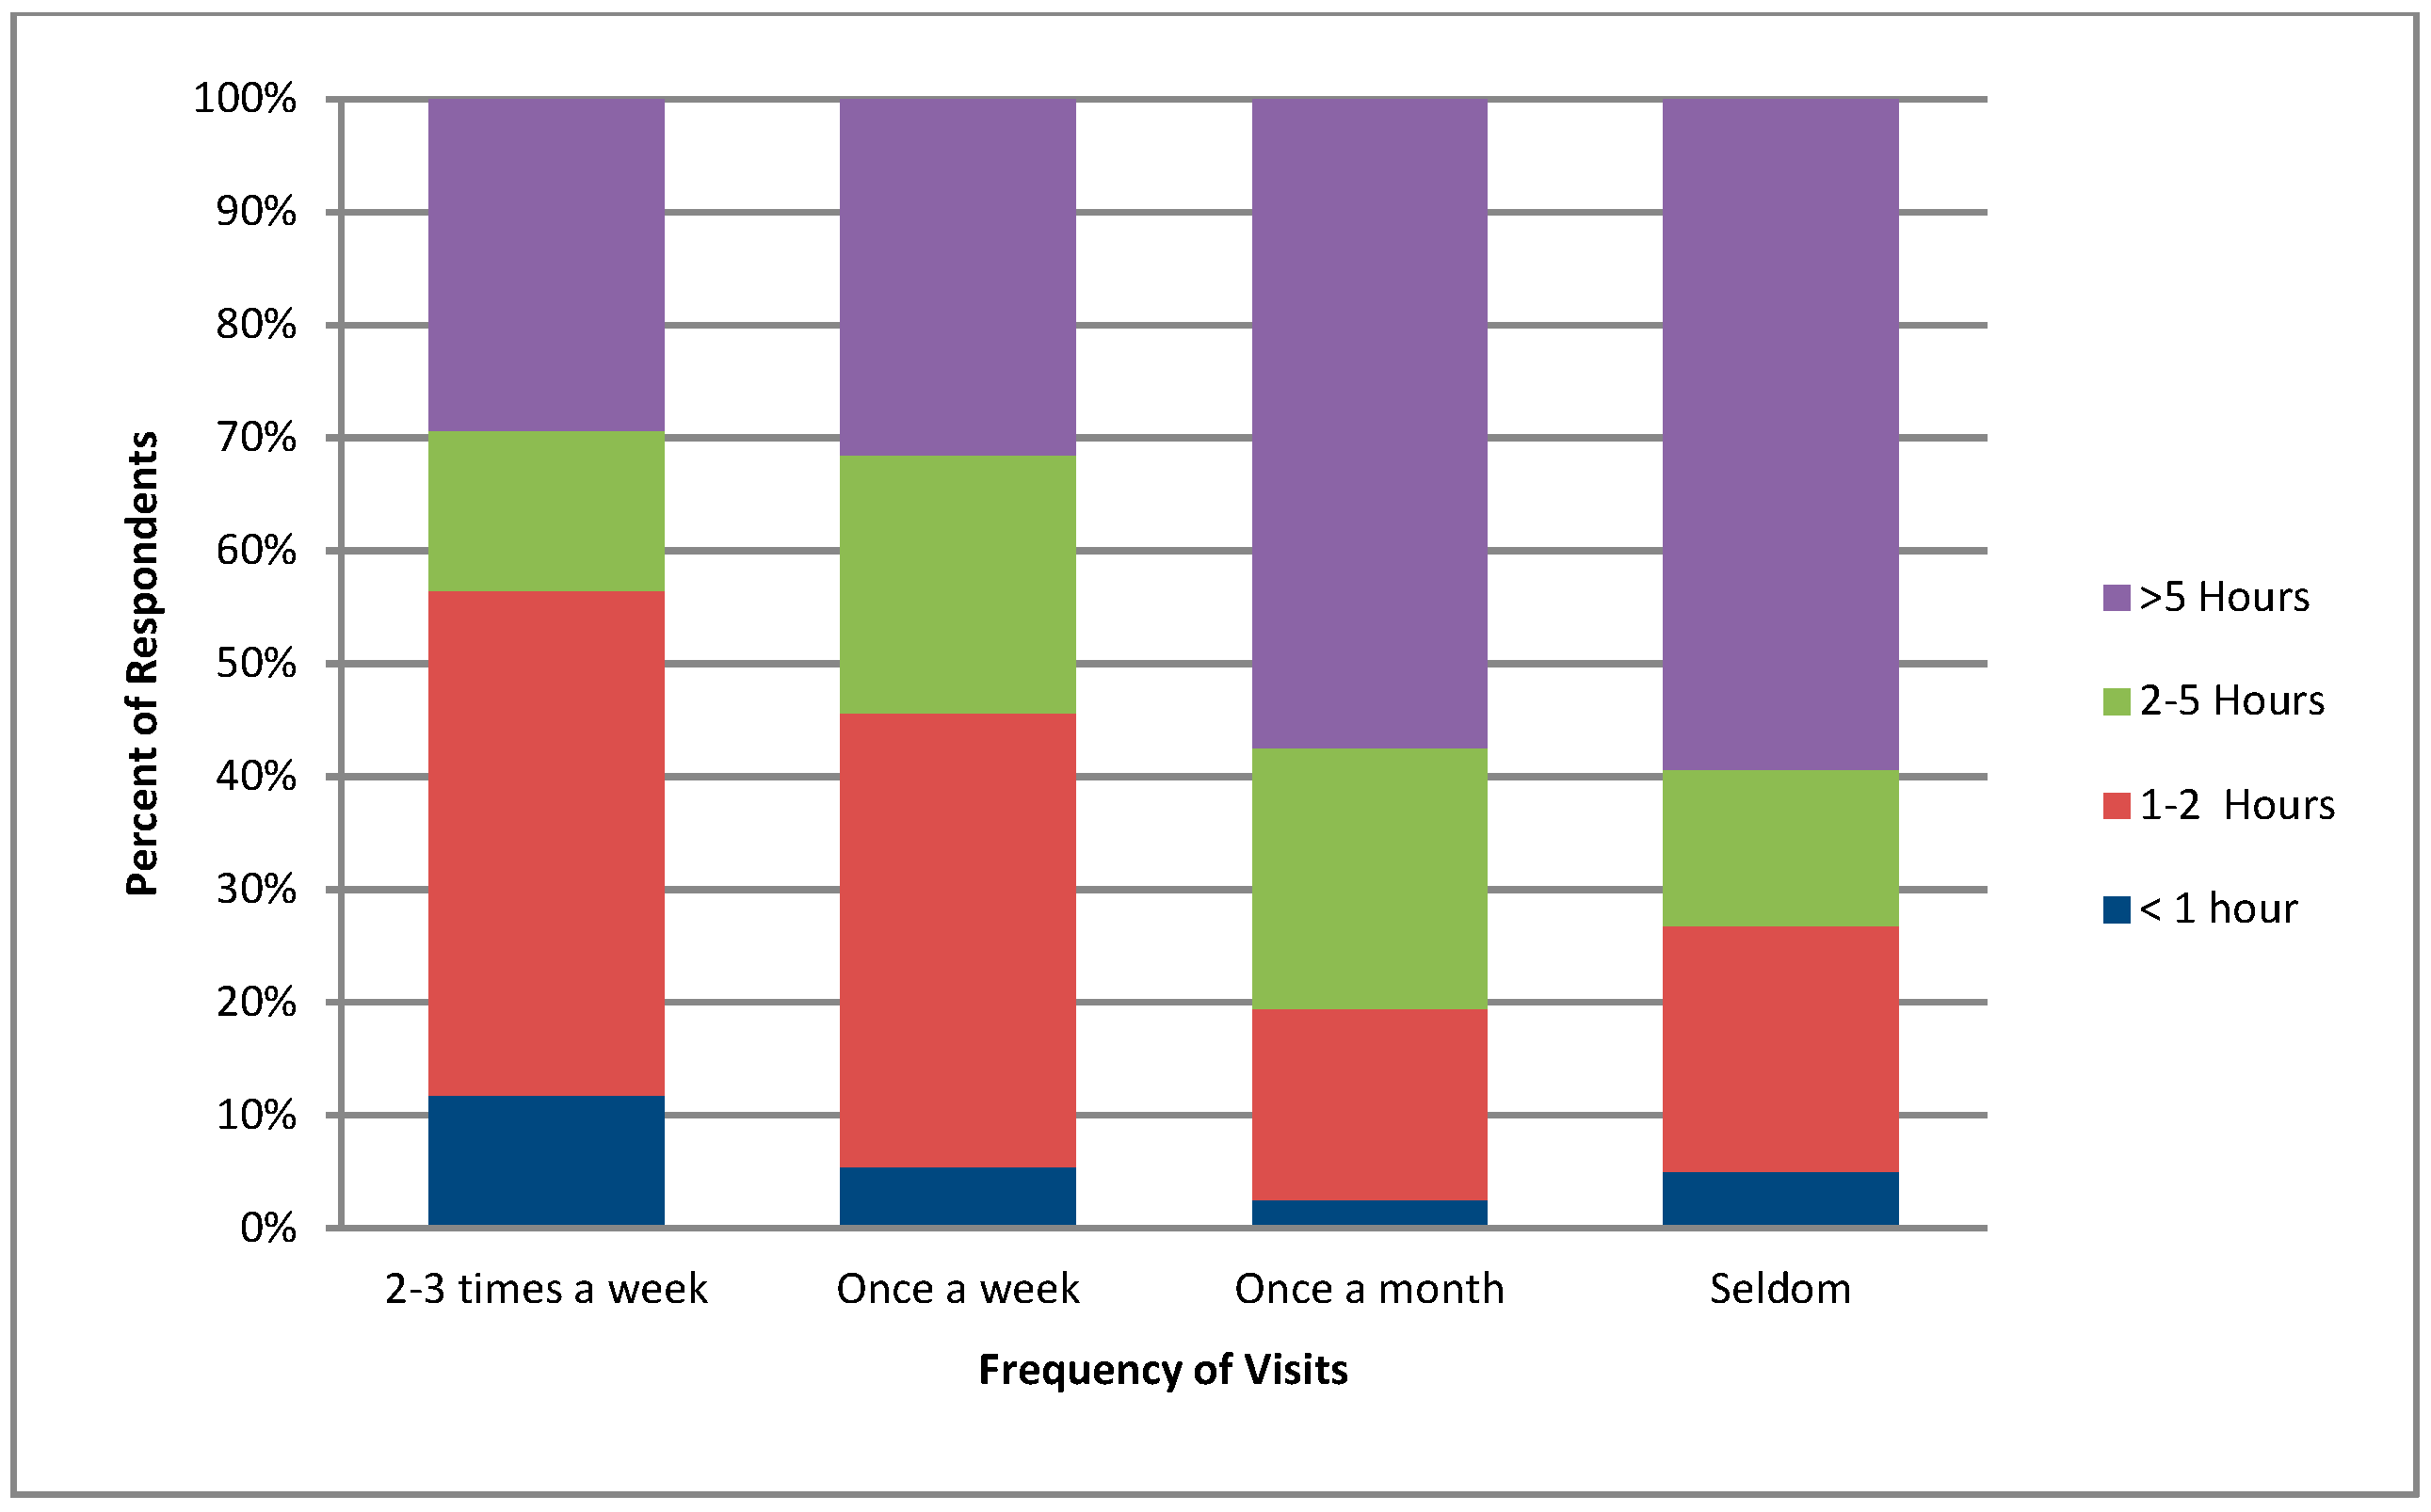
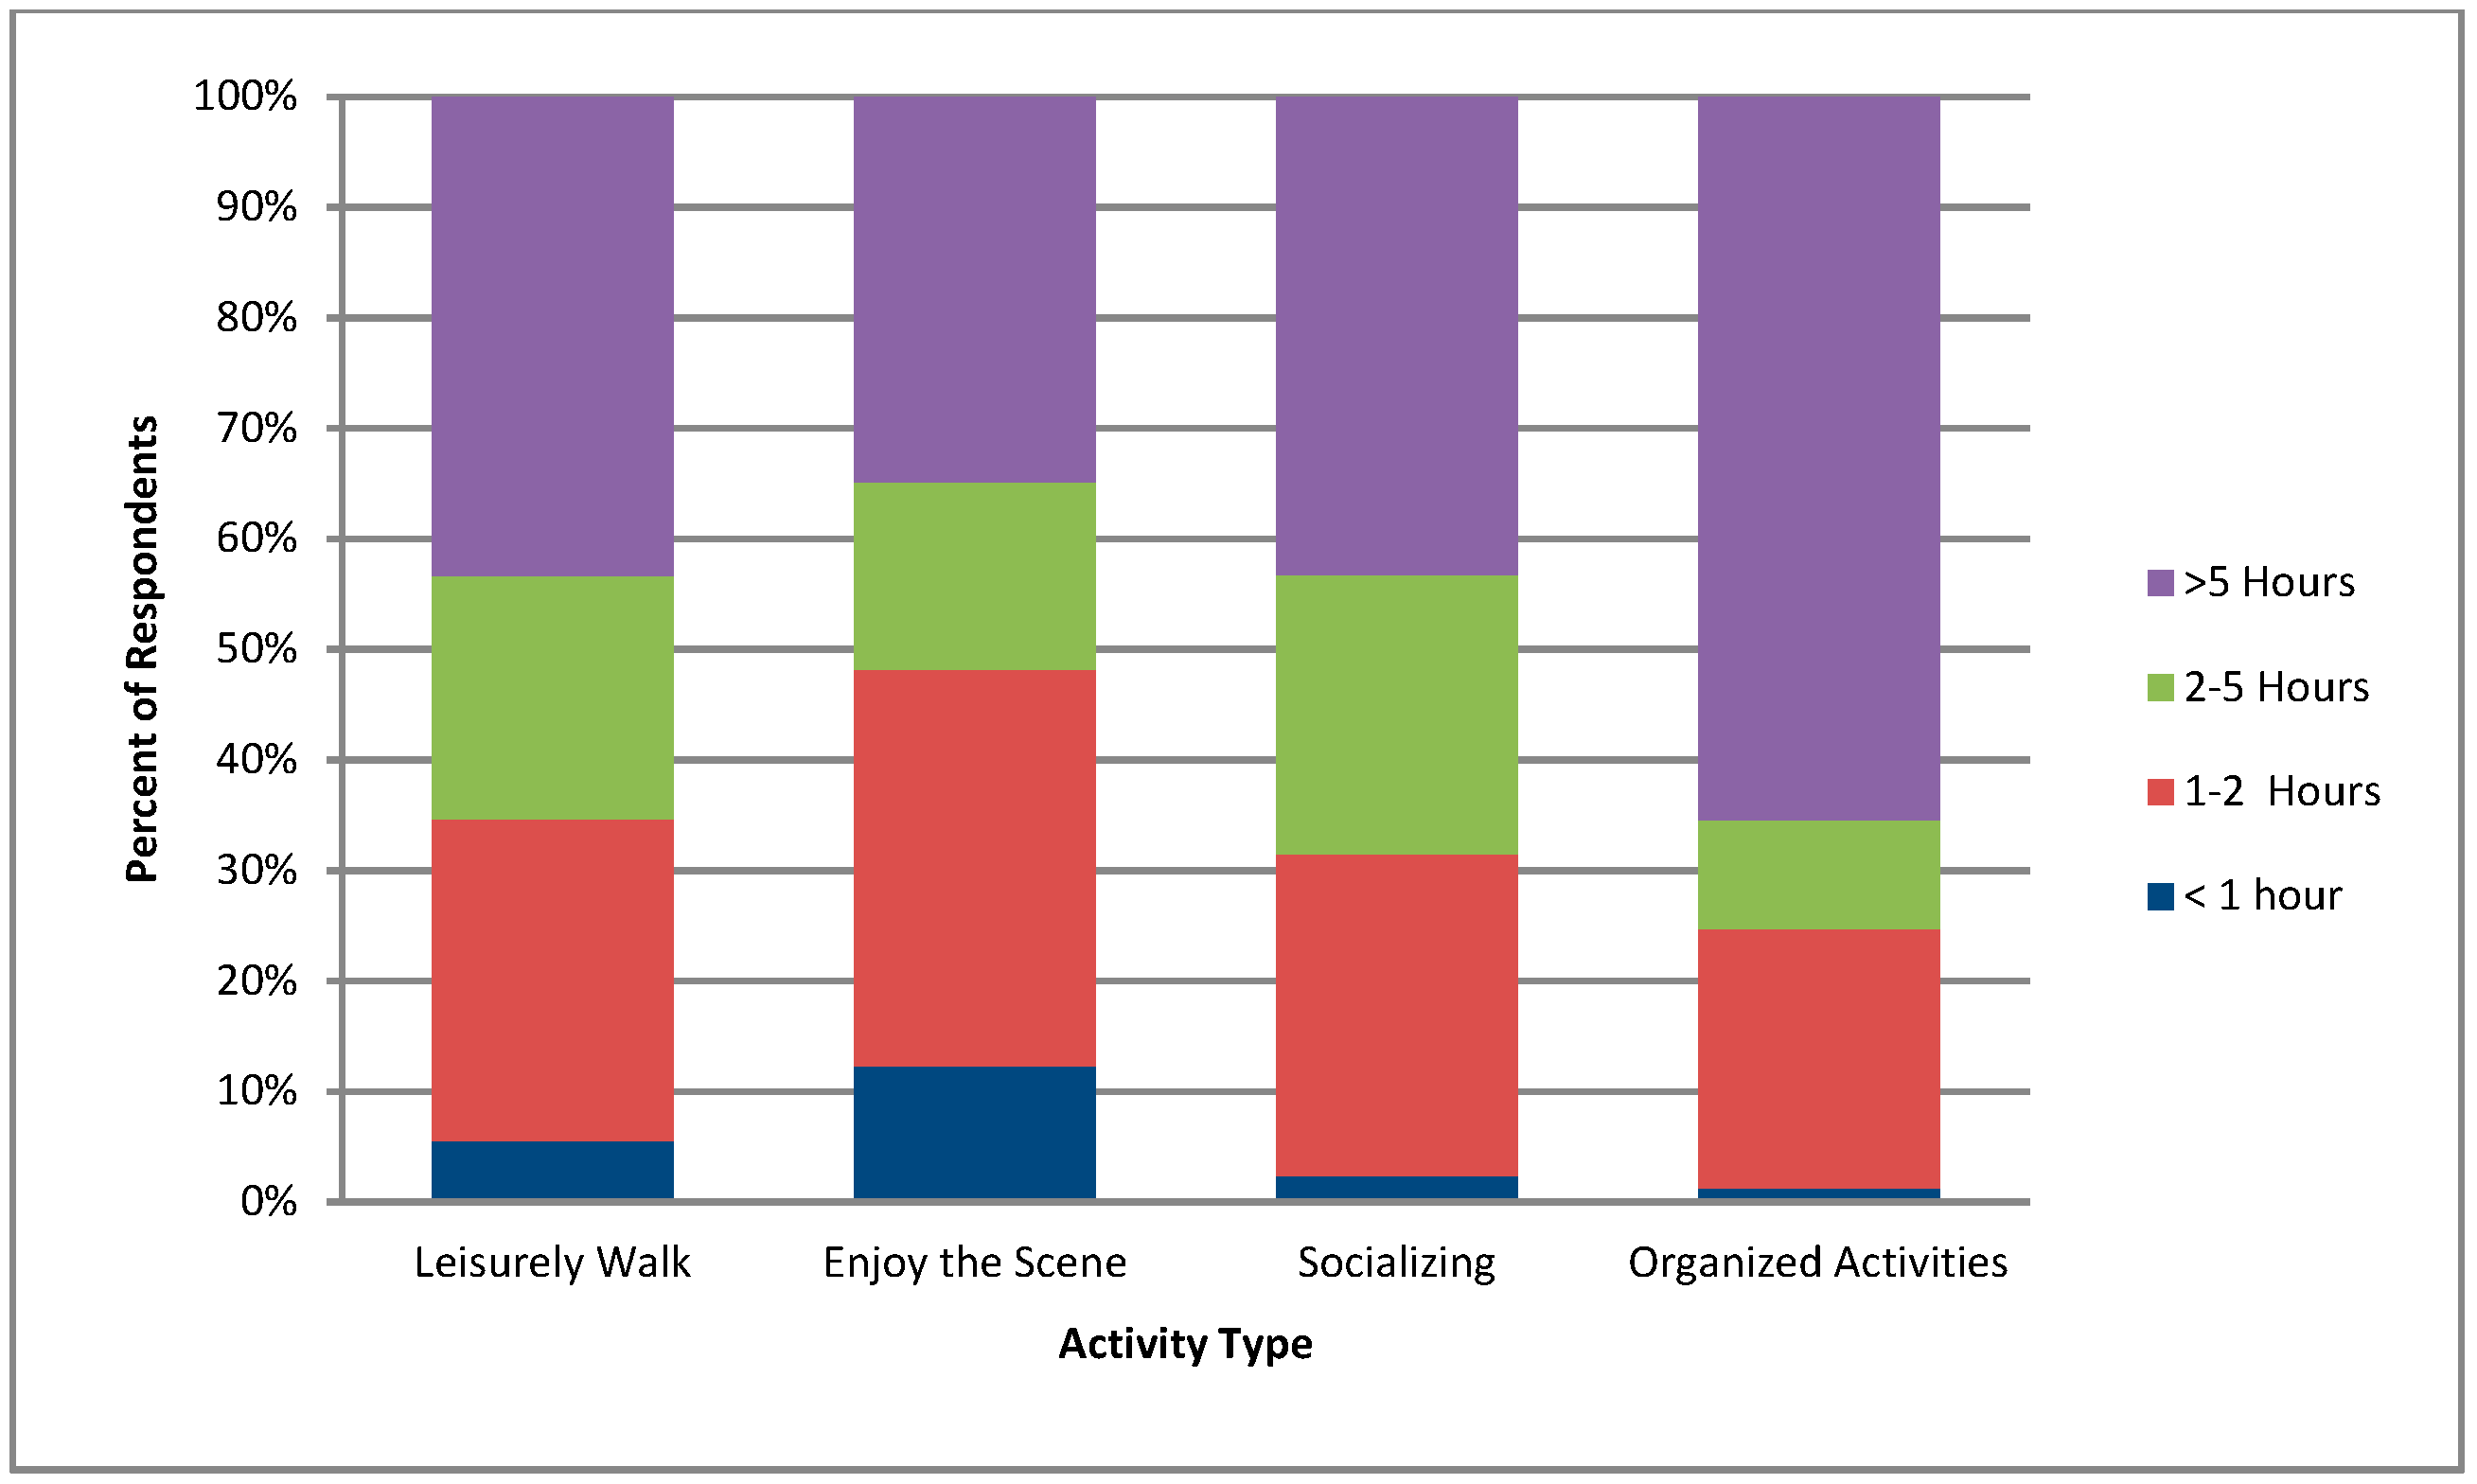
Table 1.
Human Development Index (HDI). Categories developed by Seker et al. 2018 [66].
Table 1.
Human Development Index (HDI). Categories developed by Seker et al. 2018 [66].
| HDI | Districts Falling in Each Group |
|---|---|
| Very High HDI (n = 16): (>0.597) | Ataşehir, Avcılar, Bakırköy, Başaksehir, Beşiktas, Beylikdüzü, Beyoglu, Çekmeköy, Fatih, Kadiköy, Maltepe, Sarıyer, Şişli, Tuzla *, Ümraniye, Üsküdar |
| High HDI Districts (n = 14): (0.491–0.595) | Bahçelievler, Bayrampaşa, Beykoz, Büyükçekmece, Esenler, Eyüpsultan, Gaziosmanpaşa, Güngören, Kağıthane, Kartal, Küçükçekmece, Pendik, Silivri *, Zeytinburnu |
| Middle HDI Districts (n = 9): (0.491–0.595) | Adalar *, Arnavutköy *, Bagcılar, Çatalca *, Esenyurt, Sancaktepe, Şile *, Sultanbeyli *, Sultangazi |
* There were no research participants residing in these districts.
Table 2.
Sample and population characteristics.
| Population of Istanbul | Sample | ||||
|---|---|---|---|---|---|
| N | % | N | % | ||
| All | 15,067,724 | 500 | |||
| Gender | Female | 7,525,493 | 49.95 | 259 | 52.1 |
| Male | 7,542,231 | 50.05 | 238 | 47.9 | |
| Age | 0–15 | 3,331,960 | 22.1 | - | - |
| 16–24 | 2,260,460 | 15.0 | 47 | 9.4 | |
| 25–34 | 2,626,090 | 17.4 | 240 | 48.2 | |
| 35–44 | 2,649,142 | 17.6 | 102 | 20.5 | |
| 45–54 | 1,946,359 | 12.9 | 49 | 9.8 | |
| >55 | 2,253,713 | 14.9 | 60 | 12 | |
| Occupation | Student | NA | 232 | 47.1 | |
| Working | NA | 152 | 30.8 | ||
| Retired | NA | 39 | 7.9 | ||
| Unemployed | NA | 70 | 14.2 | ||
| HDI Level | Very High | 6,228,017 | 41.3 | 330 | 66 |
| High | 5,552,362 | 36.8 | 126 | 25.2 | |
| Low | 3,287,345 | 21.8 | 44 | 8.8 | |
Population statistics are obtained from TurkStat (2018).
Table 3.
Descriptives for outdoor recreation participation.
| Recreation Variables | n | % | |
|---|---|---|---|
| Travel Time | <30 min | 92 | 18.6 |
| 30–60 min | 177 | 35.8 | |
| 1–2 h | 174 | 35.2 | |
| >2 h | 52 | 10.5 | |
| Frequency of Visits | 2–3 times | 85 | 17.1 |
| Once a week | 149 | 30.0 | |
| Once a month | 161 | 32.5 | |
| Seldom | 101 | 20.4 | |
| Duration of Visits | <1 h | 27 | 5.4 |
| 1–2 h | 147 | 29.6 | |
| 2–5 h | 98 | 19.8 | |
| >5 h | 224 | 45.2 | |
| Recreational Activities | Walking | 182 | 36.6 |
| Enjoying the Scene | 106 | 21.3 | |
| Socializing | 128 | 25.8 | |
| Organized Activities | 81 | 16.3 | |
Table 4.
Odds ratios obtained from multiple logistic regression analyses.
| Outcome Variables | |||||||||||||||||
|---|---|---|---|---|---|---|---|---|---|---|---|---|---|---|---|---|---|
| Travel Time | Frequency of Visits | Duration of Visits | Recreation Activities | ||||||||||||||
| Predicting Variables | <30 min | 30–60 min | 1–2 h | >2 h | 2–3 Times a Week | Once a Week | Once a Month | Seldom | <1 h | 1–2 h | 2–5 h | >5 h | Walking | Enjoying the Scene | Socializing | Organized Activities | |
| Gender (Reference = Female) | Male | 0.96 | 1.56 | 0.69 | 0.76 | 1.11 | 1.08 | 0.95 | 0.91 | 0.49 | 1.75 | 0.88 | 0.78 | 1.07 | 0.94 | 0.72 | 1.46 |
| Age (Reference ≥ 55) | 16–24 | 0.56 | 0.93 | 1.34 | 1.27 | 4.24 | 0.86 | 0.38 | 1.33 | 0.27 | 0.97 | 5.12 | 0.56 | 0.46 | 1.08 | 2.33 | 1.15 |
| 25–34 | 1.06 | 0.72 | 1.26 | 1.65 | 1.19 | 2.21 | 0.66 | 0.66 | 0.33 | 0.93 | 3.21 | 0.85 | 0.72 | 1.95 | 1.74 | 0.44 | |
| 35–44 | 1.04 | 0.91 | 1.42 | 0.70 | 0.59 | 1.38 | 0.94 | 1.13 | 0.24 | 1.65 | 1.67 | 0.97 | 0.44 | 2.13 | 2.33 | 0.29 | |
| 45–54 | 1.89 | 0.69 | 1.24 | 0.82 | 0.44 | 1.49 | 0.59 | 1.93 | 0.17 | 1.88 | 1.34 | 0.96 | 0.60 | 1.64 | 0.92 | 0.60 | |
| HDI Level (Reference = Medium) | Very High | 2.52 | 1.09 | 0.641 | 0.67 | 3.07 | 0.97 | 0.68 | 0.97 | 0.81 | 1.58 | 0.62 | 1.01 | 0.92 | 1.30 | 1.18 | 0.43 |
| High | 0.43 | 1.55 | 0.76 | 1.11 | 1.22 | 1.11 | 0.78 | 1.08 | 1.13 | 0.97 | 0.98 | 1.03 | 1.30 | 1.22 | 0.83 | 0.34 | |
| Occupation (Reference = Working) | Student | 1.60 | 1.14 | 1.02 | 0.39 | 0.57 | 1.06 | 1.41 | 0.78 | 0.97 | 2.21 | 0.41 | 1.06 | 1.09 | 0.87 | 1.28 | 0.59 |
| Retired | 0.42 | 0.88 | 2.14 | 0.48 | 0.95 | 1.10 | 0.89 | 1.06 | 0.55 | 2.22 | 1.52 | 0.59 | 1.10 | 1.75 | 0.79 | 0.10 | |
| Unemployed | 1.31 | 1.16 | 0.66 | 1.12 | 0.69 | 1.64 | 0.77 | 0.88 | 1.68 | 1.14 | 0.37 | 1.34 | 1.41 | 0.90 | 0.87 | 0.52 | |
| Travel Time (Reference < 30 min) | 30–60 min | - | - | - | - | 0.25 | 1.28 | 2.7 | 1.93 | 0.52 | 0.69 | 1.39 | 1.35 | 0.78 | 1.18 | 1.33 | 0.68 |
| 1–2 h | - | - | - | - | 0.19 | 0.75 | 3.17 | 3.79 | 0.4 | 0.7 | 1.13 | 1.64 | 0.64 | 1.11 | 1.48 | 0.79 | |
| >2 h | - | - | - | - | 0.05 | 0.19 | 4.26 | 7.69 | 1.83 | 0.53 | 0.24 | 2.44 | 0.35 | 0.43 | 4.95 | 0.31 | |
| Travel Time X Duration | - | - | - | - | 0.61 | 1.26 | |||||||||||
| Frequency of Visits (Reference = 2–3 times a week) | Once a week | 0.32 | 1.88 | 1.5 | 1.21 | - | - | - | - | 0.37 | 0.99 | 1.71 | 0.97 | 1.48 | 0.76 | 1 | 0.47 |
| Once a month | 0.12 | 1.28 | 2.25 | 8.24 | - | - | - | - | 0.21 | 0.31 | 2.05 | 2.48 | 1.14 | 1.22 | 0.67 | 0.42 | |
| Seldom | 0.1 | 0.78 | 2.65 | 7.58 | - | - | - | - | 0.33 | 0.46 | 1.02 | 2.53 | 1.01 | 1.36 | 0.95 | 0.54 | |
| Frequency X Duration | 0.52 | 2.11 | - | - | - | - | |||||||||||
| Duration of visits (Reference ≤ 1 h) | 1–2 h | 0.7 | 1.14 | 1.87 | 0.24 | 0.41 | 1.62 | 1.11 | 0.81 | - | - | - | - | 0.92 | 0.38 | 2.51 | 2.97 |
| 2–5 h | 0.46 | 1.7 | 2.11 | 0.06 | 0.20 | 1.16 | 3.16 | 0.63 | - | - | - | - | 1.17 | 0.21 | 4.15 | 1.72 | |
| >5 h | 0.43 | 1.15 | 2.13 | 0.27 | 0.22 | 0.66 | 2.98 | 1.3 | - | - | - | - | 1.08 | 0.19 | 2.18 | 3.74 | |
| Travel Time X Duration | 0.57 | 1.01 | - | - | - | - | |||||||||||
| Recreational Activities (Reference = Organized Activities) | Walking | 1.38 | 1.35 | 0.8 | 0.52 | 0.68 | 1.72 | 0.73 | 1.14 | 4.44 | 1.18 | 2.54 | 0.44 | - | - | - | - |
| Enjoying the scene | 1.12 | 1.47 | 0.97 | 0.43 | 0.81 | 0.98 | 0.89 | 1.62 | 12.71 | 1.87 | 1.78 | 0.26 | - | - | - | - | |
| Socializing | 0.75 | 1.08 | 0.8 | 2.51 | 0.88 | 1.64 | 0.57 | 1.43 | 2.25 | 1.32 | 3.66 | 0.36 | - | - | - | - | |
Odd ratios in bold p ≤ 0.05.
© 2020 by the authors. Licensee MDPI, Basel, Switzerland. This article is an open access article distributed under the terms and conditions of the Creative Commons Attribution (CC BY) license (http://creativecommons.org/licenses/by/4.0/).
Share and Cite
MDPI and ACS Style
Hayir-Kanat, M.; Breuste, J. Outdoor Recreation Participation in Istanbul, Turkey: An Investigation of Frequency, Length, Travel Time and Activities. Sustainability 2020, 12, 741. https://0-doi-org.brum.beds.ac.uk/10.3390/su12020741
AMA Style
Hayir-Kanat M, Breuste J. Outdoor Recreation Participation in Istanbul, Turkey: An Investigation of Frequency, Length, Travel Time and Activities. Sustainability. 2020; 12(2):741. https://0-doi-org.brum.beds.ac.uk/10.3390/su12020741
Chicago/Turabian StyleHayir-Kanat, Meryem, and Jürgen Breuste. 2020. "Outdoor Recreation Participation in Istanbul, Turkey: An Investigation of Frequency, Length, Travel Time and Activities" Sustainability 12, no. 2: 741. https://0-doi-org.brum.beds.ac.uk/10.3390/su12020741
Note that from the first issue of 2016, this journal uses article numbers instead of page numbers. See further details here.