Article

Reflecting SDG 6.1 in Rural Water Supply Tariffs: Considering ‘Affordability’ Versus ‘Operations and Maintenance Costs’ in Malawi

1
Department of Civil and Environmental Engineering, University of Strathclyde, Glasgow G1 1XJ, UK
2
Department of Accounting and Finance, University of Strathclyde, Glasgow G4 0QU, UK
3
BASEFlow, Galaxy House, Blantyre, Malawi
4
Ministry of Agriculture, Irrigation and Water Development, Government of Malawi, Tikwere House, Lilongwe, Malawi
*
Author to whom correspondence should be addressed.
Sustainability 2020, 12(2), 744; https://0-doi-org.brum.beds.ac.uk/10.3390/su12020744
Submission received: 21 December 2019 / Revised: 12 January 2020 / Accepted: 14 January 2020 / Published: 20 January 2020
(This article belongs to the Section Environmental Sustainability and Applications)

Abstract

:
Local tariffs in the form of household contributions are the primary financial mechanism to fund the maintenance of rural water supplies in Malawi. An investigation was conducted into the tariffs set by rural service providers to sustain drilled boreholes equipped with Afridev handpumps. A binary logistic regression analysis identified significant explanatory variables for the most common identified considerations when setting tariffs, ‘affordability’ and ‘operations and maintenance (O&M) costs’. The results demonstrate tariffs collected less frequently and usage above the design limit of the Afridev (300 users) had lower odds of considering affordability and higher odds of considering O&M costs, than those collected per month and within the design limit. The results further suggest a recognition by service providers of an increased maintenance challenge. High usage, acquiring spare parts, and the collection of tariffs when repairs are required indicate an increased likelihood of considering O&M costs, conversely to considering affordability. The balance of affordability and sustainable maintenance is a perpetual challenge under decentralised service delivery. Investment into ongoing support and supply chains is required for the financial and operational requirements of water supply, to ensure payments for services does not prevent access to clean water at the local level and to achieve the 2030 agenda.

1. Introduction

Investment to increase the coverage of water supply infrastructure has been a key component of global goals, government targets, and projects throughout the aid sector. The Millennium Development Goal (MDG) era set out coverage targets, including target 7c “to halve the proportion of people without sustainable access to safe drinking water and basic sanitation” by 2015. While this target was globally delivered in 2010, areas within Sub-Saharan Africa (SSA) fell behind [1]. A global focus for coverage continued into the Sustainable Development Goal (SDG) era in 2015 through goal 6, which aims to “ensure availability and sustainable management of water and sanitation for all”. The SDGs focus on coverage also requires the same, if not greater, emphasis on local sustainability to ensure continued service delivery, particularly for rural water supply. While the performance under the MDGs expressed positive progress in rural water supply usage and access at the global level, MDG indicators may hide a low level of local service, which may hinder progress under new SDGs coverage targets [2,3].
The SDG agenda makes the commitment to ‘leave no one behind’, in which attention and priorities are required for disadvantaged groups and the elimination of inequalities for service delivery [4]. To fulfil this, SDG target 6.1 states “Achieve access to safe and affordable drinking water”. This ambitious target moves from “halving the proportion without sustainable access” stated in MDG 7c to ‘universal access’ and recognises the importance of reducing inequalities as part of sustainable access. Affordability, a key aspect of equity [5], was initially included in the MDG target for water but later removed, as described by Bartram et al. [6]. Its importance was subsequently recognised for global SDG targets set post-2015 [7]. However, SDG 6.1 still reflects its predecessor (MDG 7c), as focus remains with global coverage of drinking water. Affordability is not reflected by the set indicator (SDG 6.1.1), which states “Proportion of population using safely managed drinking water service”. While the term ‘safely managed’ addresses the quality, availability, and accessibility of an improved source [8], the affordability of the improved source lacks consideration. This has implications for reducing poverty (SDG 1), particularly in low-income countries due to the synergy between the SDG targets [9,10]. Payment for services should not prevent access to clean water, however, there is no commonly agreed approach to defining affordability or its monitoring [4].
The efficient operations and maintenance (O&M) of infrastructure investments are key to fulfilling the SDGs. Discussion around the O&M of infrastructure is common in the rural water sector, and efforts into establishing service provision to conduct and finance O&M have been ongoing since the 1980s [11,12,13,14]. Technologies, national policies, and sector strategies for rural water supply have embraced the ‘village level operations and maintenance’ (VLOM) approach, most notably the development and standardisation of community handpumps [15,16]. However, the movement and argument that ‘communities are always capable of managing their facilities on their own’ has not solved the issues associated with rural water supply in SSA, with only two out of three handpumps working at a given time [17]. It is widely acknowledged that the community based management (CBM) approach to rural water supply is reaching its limits of what can be achieved through informality and voluntarism [12,18,19], particularly when policy dictates for long-term sustainability. Despite this recognition, CBM continues to be the dominant approach to rural water supply management in the sector, which requires professionalism and long term institutional support to mediate the challenges of participation [13,20].
It is well established in CBM that O&M is a continuous challenge for rural water service providers, and sustainability as the success is dependent on multi-dimensional factors, i.e., hydrogeological, socio-cultural, financial, and poor infrastructure [18,21,22,23]. The infrastructure and management of rural water service delivery are interlinked. Exploring the relationships between systems and influencing factors can improve the understanding of how these relationships contribute to water service delivery and system breakdown [24,25,26]. Rural communities and service providers that struggle to provide the required maintenance and major repairs required for operational sustainability will see a decline in service and unreliable sources that undermine the sustainability of service delivery [3,27,28,29]. This negative feedback loop highlights the need to continually support the community to ensure sustainability [4,13].
The lack of financial resources for O&M is one of the many issues that impact the long-term functionality of an asset. Tariffs are typically the primary financial mechanism to fund maintenance for the sustainability of rural water supply assets, which translate to user fees or household contributions [4]. Notably, user contributions may reflect payments upon breakdown, as action may only be taken upon water point breakdown [19]. Tariffs have generally been specified as no more than 3% of household income to reflect affordability within the human right to water. While this benchmark aims to address affordability, this is not guaranteed [30,31]. Furthermore, tariffs may be set to be affordable for users, but insufficient for sustainable service delivery, that may precipitate a high risk of a cycle of service decline, non-payments by users, and further service deterioration [20].
Acceleration towards the attainment and localizing the SDGs is increasingly important [32]. However, the balance between cost recovery and affordability is a complex dilemma when setting tariffs at the local level. Service providers and communities struggle with this balance in which additional financial mechanisms are required to reconcile from a human rights perspective [33]. This raises the question of the effectiveness of fulfilling SDG 6.1 when the balance of affordability and sustainable maintenance in the rural context are a perpetual challenge.
This study investigates the balance of affordability and O&M costs when tariffs are set by rural water service providers, and how these change over different management contexts. To achieve this, data for service providers and tariff coverage for the O&M of drilled boreholes equipped with Afridev handpumps across Malawi were examined. Variations in decentralised service provisions for these assets and the considerations when establishing tariffs and revenue collection were investigated. A binary logistical regression analysis permitted identification of significant explanatory variables for affordability and O&M cost considerations when setting tariffs at the local level.

2. Context, Materials and Methods

2.1. Study Context

This study was conducted across rural areas of Malawi. Approximately 84% of the country’s 18.6 million people are located in the rural setting, with more than 50% below the poverty line [34]. Groundwater exploitation is the primary water source for the rural communities and is commonly accessed through boreholes fitted with Afridev handpumps.
Like many other low-income countries in SSA, Malawi operates rural water service delivery under the CBM approach. The promotion of this model during the 1980s, as a route towards sustainable water supply access, acts to empower communities, but also requires voluntarily undertaking the management and financial responsibilities of service delivery [35]. Through this model, the capital expenditure of implementing rural water supply is covered by external actors while the O&M costs are covered by community based tariffs as a form of cost-recovery [18,36,37]. Malawian national policy and guidelines recommend tariffs are calculated by taking the assumed costs of supplying water over the estimated design life of 15 years (e.g., replacement of spare parts, transportation, preventative maintenance contracts, and total replacement) and the number of contributing households to establish a monthly tariff [38].
Malawian national policy is consistent with MDG 7c [39] that states, “To achieve sustainable provision of community owned and managed water supply and sanitation services that are equitably accessible to and used by individuals and entrepreneurs in rural communities for socio-economic development at affordable cost.” [40]. This also reflects aspects of SDG 6.1. Service providers for decentralised rural water supplies are primarily water point committees (WPCs), who typically contract a local area mechanic to conduct repairs out with any routine O&M conducted by the WPCs. The financial provision for O&M is accomplished through the aforementioned household tariffs, in which amount and frequency are agreed upon by the community [39,40,41]. While the policy positively reflects SDG 6.1, there are challenges with balancing affordability and O&M costs at the local level.

2.2. Data Collection

The Scottish Government Climate Justice Fund (CJF) Water Futures Programme has been working in partnership with the Government of Malawi since 2011, and currently aims to support the country in the achievement of SDG 6. The programme is evaluating the sustainability of all rural water supply assets in Malawi, in which data are collected and collated through the management information systems (MIS), mWater (www.mwater.co). This is accomplished through a water point functionality survey based on SDG 6 indicators and the Government of Malawi’s needs (see www.cjfwaterfuturesprogramme.com).
This study draws upon this dataset, specifically data on the types of service providers managing the assets, financial mechanisms for O&M (primarily in the form of tariffs), and details of the supplied communities. The surveys are subjected to rigorous quality assurance checks to ensure the accuracy of mapped water points and to reject any survey submissions that do not meet these quality checks. This is further described in Miller et al. [42] and Truslove et al. [3].

2.3. Dataset Sampling

This study investigates the types of decentralised service providers and the variations and trends in tariffs for water point O&M across the 28 districts in Malawi across the MDG period to date. The geographical coverage, primarily across the Southern and Central regions of Malawi, is detailed in Appendix A. A subset of 22,316 drilled boreholes equipped with Afridev handpumps was captured from the database for study. The Afridev is an approved technology of the Government of Malawi, and is the dominant handpump through standardisation [16,43], and thus chosen for study. This study focuses on MDG and SDG assets only, therefore, boreholes equipped with Afridevs installed before the beginning of the MDGs were excluded from the study, as this is out with the expected design life of the Afridev. Water points without a date of installation available were also excluded. Taps and piped supplies were excluded, as these fall under water boards primarily in the urban setting [8,44]. Some 84% of the population of Malawi use boreholes equipped with handpumps; the subset hence considers the dominant improved water supply technology in the rural setting [8].

2.4. Methods

Service provider data was interrogated to explore (a) if the supply had a service provider present for O&M, (b) the breakdown of service providers for O&M, (c) if the service providers set a tariff (which is defined as a user fee or household contribution), and (d) the number of water users the water point serves. The tariffs set by the service providers was captured, in relation to (a) the frequency of tariff collection, (b) the variations in the tariff amount, and (c) the costs considered when setting the tariff.
Where the number of users and tariff amount is considered, the raw dataset was consolidated into groups based on similarities in the data. User grouping was stated either above or below the design specification for population using the Afridev (up to 300 users). Where an accurate number is unavailable at the time of audit, the number of users is estimated at approximately 5 members per household (where the statistical average number of members per household in Malawi is 4.4 [45]). Tariff grouping was chosen within the aforementioned 3% of household income benchmark to reflect affordability, above or below 500 Malawian Kwacha (MWK) (approximately 0.66 USD, where 1 USD = 753.66 MWK, as of July 2019). This equates to 2% of household income in Malawi (25,000 MWK per month as of 2019), to account for fluctuating household income and inflation, and the median tariff value in the monitoring of the wider CJF dataset.
A binary logistic regression analysis was used to identify significant explanatory variables for ‘affordability’ and ‘O&M costs’ considerations when setting tariffs, using the statistical package SPSS (version 26). This allowed determination of the relationship between a dichotomous dependant (affordability considered = yes/no and O&M costs considered = yes/no) and an independent predictor variable (categorical or continuous), while controlling for all other independent variables in the logistic regression model. Unadjusted odds ratio indicates the bivariate relationship between the dichotomous dependent variable and the independent predictor variable. Multivariable adjusted odds ratio allows for the calculation of odds ratios in which the effect of the other independent variables is accounted for. Explanatory variables were selected based on their relevance to sustainability and the rural water service provider context established through the water point functionality survey, domains including:
  • Service Delivery—Describing the type of service provider and number of users.
  • Operational—Describing the age and functionality of an asset, preventative maintenance, and if spare parts are kept on site.
  • Financial & Cost Recovery—Specifying the tariff amount and frequency.
  • Geographical—Specifying the region of Malawi.
For the avoidance of doubt where functionality was included, functional describes a water point in operational condition providing water according to design specifications, partially functional describes a water point providing water in a reduced capacity (e.g., repairs required, changes in site, seasonal variations, etc.), and non-functional describes a water point no longer providing water on a regular basis at the time of audit. It is acknowledged in the analysis that the term functionality provides a temporal snapshot indicator for sustainability [24].
Data was cleaned to remove statistical outliers (e.g., abandoned water points), unlikely values (e.g., tariff amount equals zero where a tariff is reportedly in place), and missing data in the explanatory variables. Furthermore, explanatory variables were tested for multicollinearity by calculating the variance inflation factors. The analysis was designed to identify significant explanatory variables rather than to find a predictive model with the ‘best’ fit.

3. Results and Discussion

3.1. Decentralised Service Provision

Table 1 shows the breakdown of service providers for rural drilled boreholes equipped with Afridevs, and whether these service providers establish tariffs for the O&M of these community handpumps. Service provision may differ across rural water service delivery areas. While policy states the service providers for rural water supply consist of WPC’s and a local area mechanic, not all service providers conform to the national policy.
A small percentage of the dataset (5.38%) lack a service provider for the asset, where service provision has broken down or has not been established at all. CBM is typically attributed to two aspects that dictate the functionality of water supply assets: ‘Hardware’, which identifies the physical infrastructure, and ‘software’, which identifies the governance to maintain the physical hardware [36]. While often treated separately, these are in fact interlinked and important for the overall sustainability of service delivery [46]. The lack thereof resulting in declining functionality and early breakdown without service providers to conduct O&M [3,18,46].
The presence of service providers alone does not ensure sustainable functionality across the design life of an asset. Of the service providers that are present to conduct O&M (94.62% of the total dataset), 17.88% do not have tariffs set for O&M (Table 1). Suggesting a lack of support for service providers to establish a tariff in the first instance or a tariff was set, but is no longer present due to impactful factors such as the willingness to pay.
Table 1 shows WPCs are widely present in both single service providers and multiple service providers (alongside Area Mechanic) complying with Malawi national policy. Area Mechanics act as the service provider in 5.19% of singular cases where WPCs are not present. Community members also act as the service provider in 2.01% of cases, in which a significant proportion do not set tariffs compared to WPCs and Area Mechanics. The importance of support for governance and sustainability is hence inferred.
Two thirds of institutions (i.e., health facilities, schools, religious organisations) have not established tariffs for their assets (Table 1). This is possibly attributed to the more structured approach of institutions when compared to other CBM stakeholders. It is possible O&M funding is within the normal operational budget of these institutions, therefore, tariffs are potentially not required at these sites. If the latter is not the case, under the decentralised CBM policy this would result in inconsistencies within aggregate statistics. Moreover, the lack of tariffs and subsequently O&M of assets could result in an overall decline of service delivery. Support for service providers is essential to ensure an appropriate life-cycle is achieved for water supply assets and to avoid the non-functionality of water points, and decline of serviceability [46].
Where single service providers are present, the majority conform to the specifications of rural water supply management in Malawi as WPC’s make up the majority of service provision (79.51%). Where multiple service providers are present, the WPC or Area Mechanic are one of the established service providers (n = 2110, 99.99%). It is assumed a tariff is paid to either one of these, however, the presence of multiple service providers has the potential to create confusion for water users as to whom to pay the tariffs to. This may exacerbate problems associated with willingness to pay by contributing users if clear lines of accountability are not evident. This problem will be compounded if processing charges for tariff collection are levied by individual service providers, essentially duplicating and increasing costs. Establishing service provision that conforms to national policy is important. However, service provision may deteriorate due to various complexities, and in some cases, may not be established in the first instance. Where service provision is present for a rural water supply asset, it may not reflect exactly what is stated within policy and guidelines. As a result, cost recovery through tariffs for O&M and sustainability varies significantly.

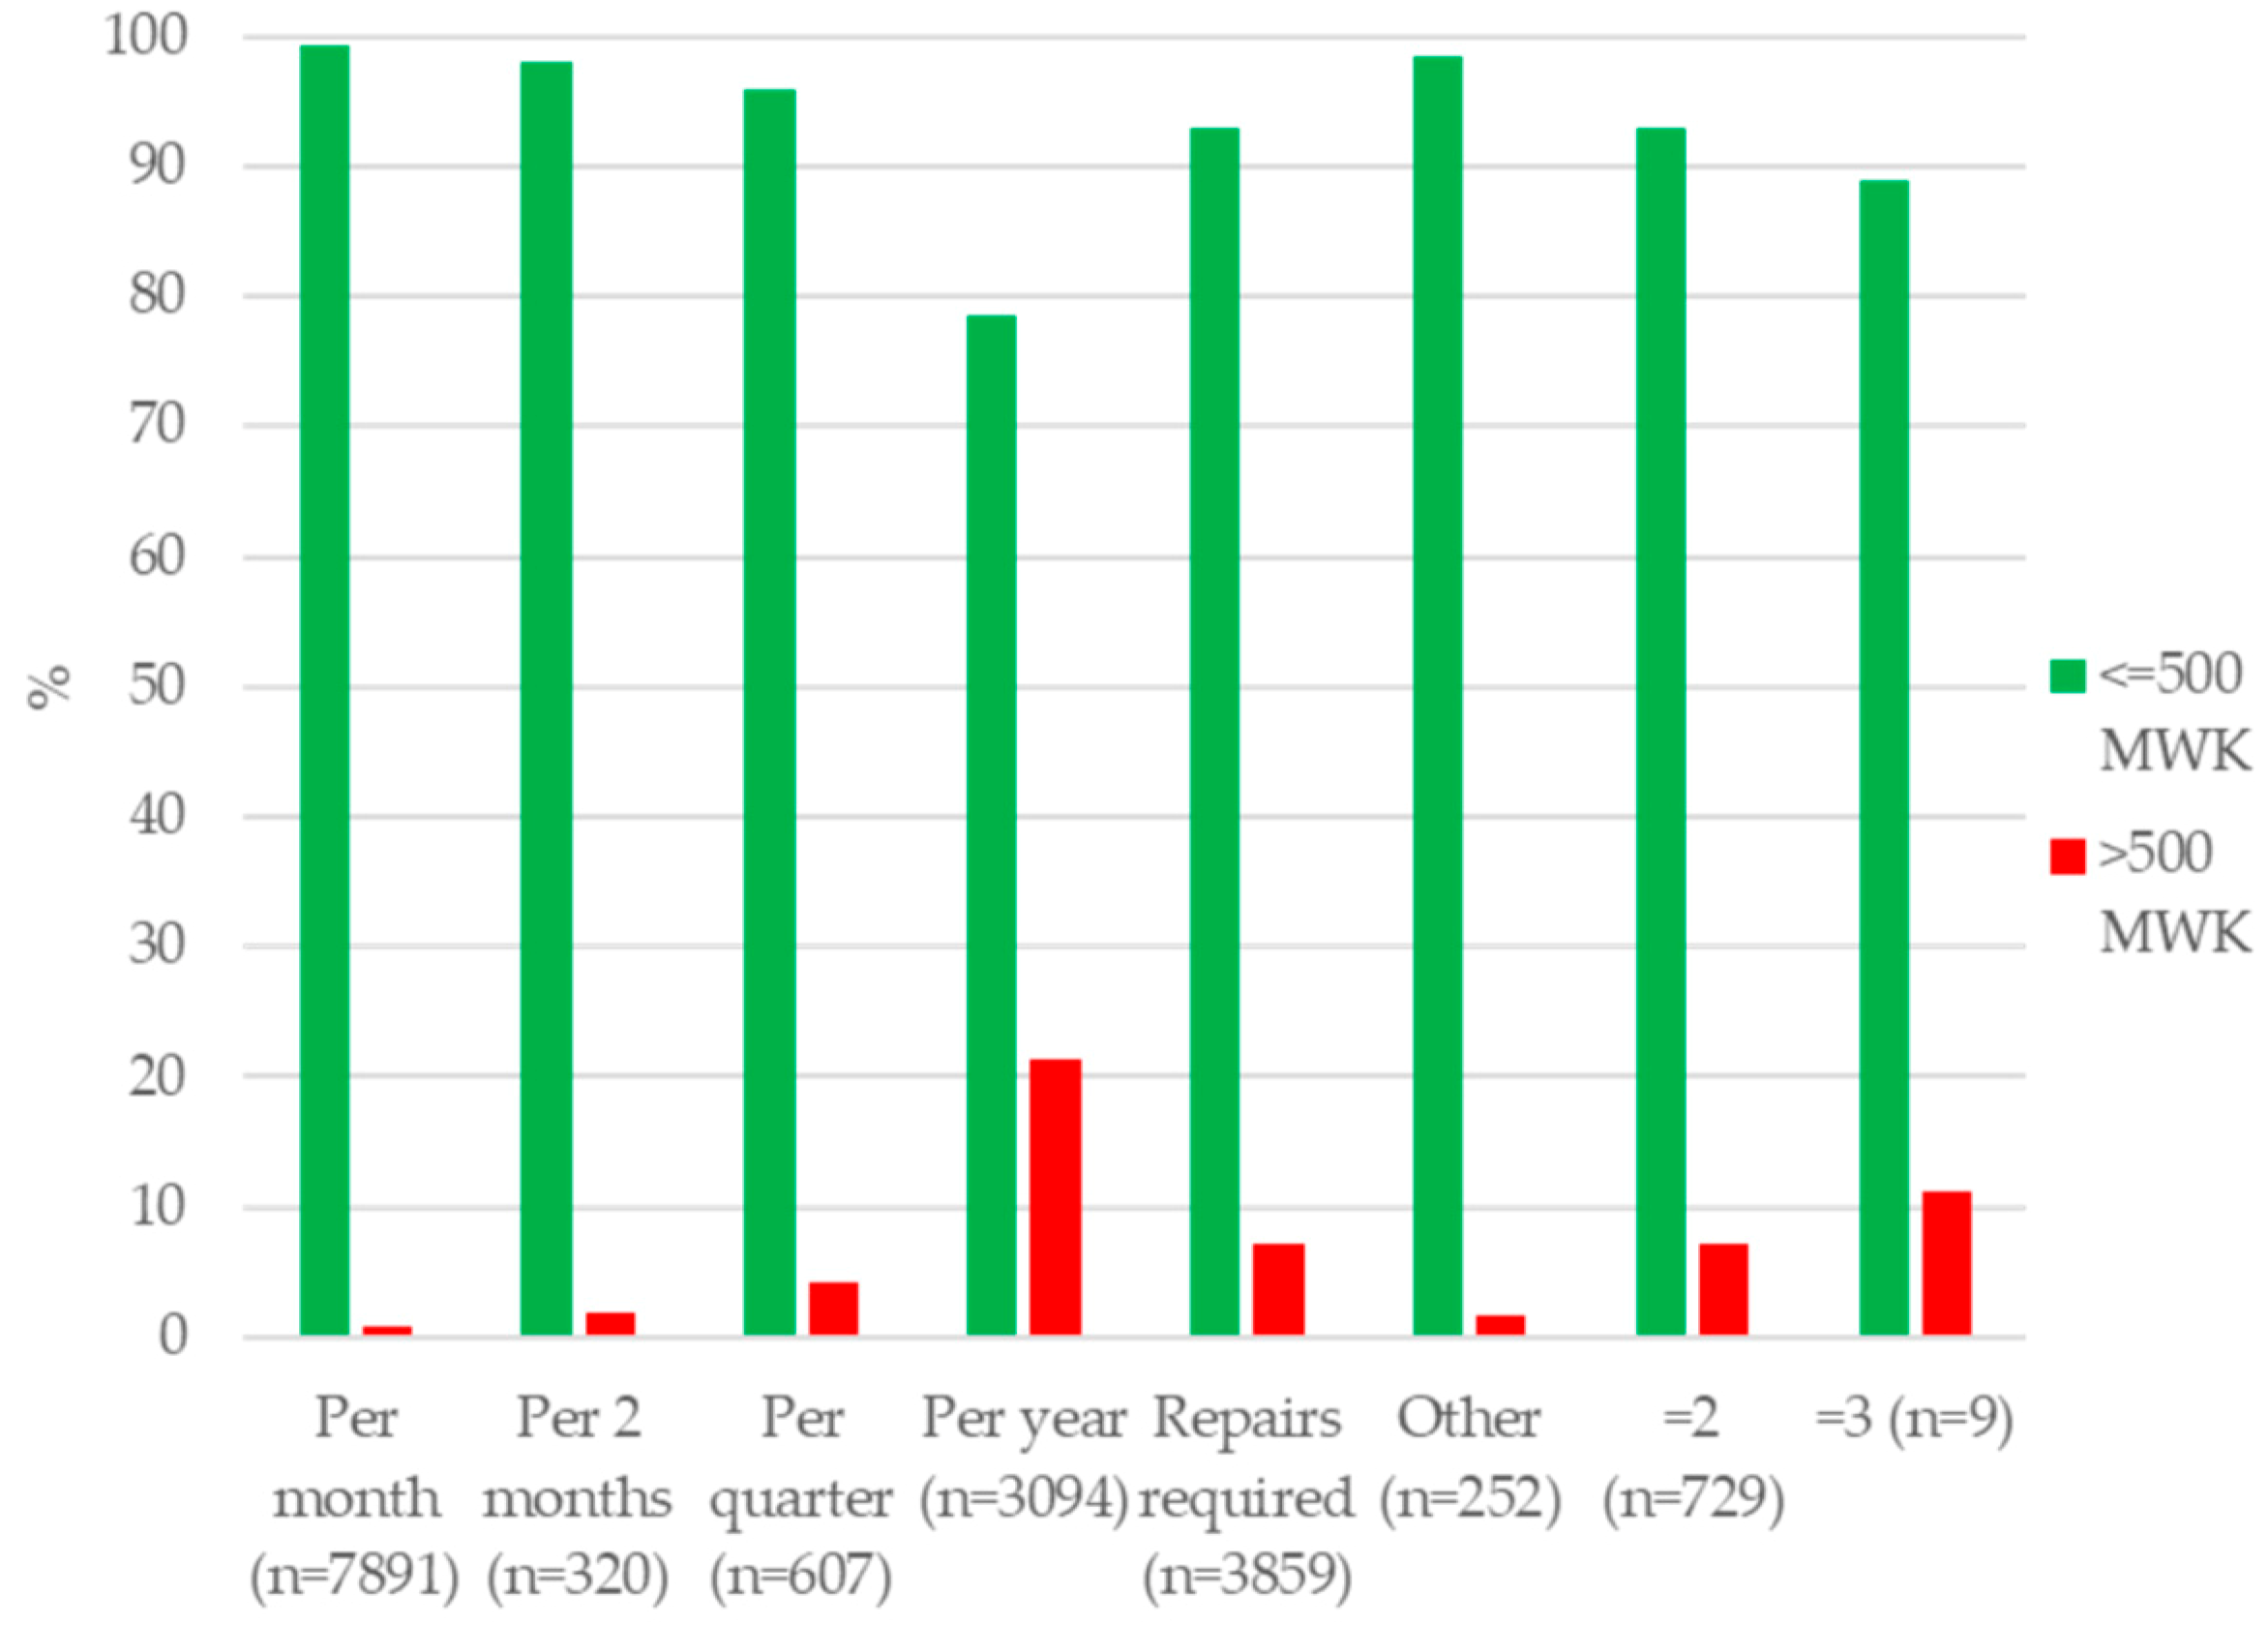
3.2. Frequency of Tariff Collection

A proactive, preventative approach to maintenance is crucial for ongoing sustainability as emphasised in CBM, but rarely conducted [19]. The frequency of tariff collection can impact the potential financial resources available to conduct vital O&M, and varies across site specific circumstances. Frequency of the tariff collection is therefore an important aspect of the life-cycle costing of rural water supply assets. Table 2 presents the distribution of the frequency of tariff collection by the number of users and tariff amount. Where, single frequency refers to a collection by the service provider on a specified occasion (e.g., collection once per month) and multiple frequencies refer to a collection by the service provider on more than one specified occasion (e.g., once per month and when required for repairs). Figure 1 and Figure 2 indicate the breakdown of single and multiple tariff collection frequencies by the number of users and tariff amount, respectively.

3.2.1. Frequency Distribution by Users

Tariff collection behaviour differs between the two user groups, the first up to the design limit of the Afridev (≤300 users), and the second above the design limit of the Afridev (>300 users). Figure 1 demonstrates that as collection becomes less frequent, the distribution between the two user groups moves from a greater weight on ≤300 users for more frequent tariffs, to a greater weight on >300 users for collections per year. As users increase, the tariff collection for repairs as required also notably increases. This suggests that as usage increases above the design limit of the Afridev, tariff collection trends towards a reactive approach to maintenance. Usage within the design limit is more reflective of a proactive approach with tariffs collected more frequently. Where multiple tariff collection frequencies occur, weighting trends towards >300 users (Table 1 and Figure 1).
The number of users at a water point fails to denote that all users contribute, but ideally each user household contributes as defined in Malawian policy (that a tariff is collected per household [40]). Households commonly obtain water from multiple sources despite the global monitoring focus on access to one source of water supply [47]. Sub-standard installations that are subject to premature breakdown, seasonal variations, and poverty can result in users relying on unimproved or multiple improved sources in other service areas [3,48,49,50,51]. This may contribute to the number of users increases above the design limit of the Afridev (300 users).
Assets that are treated as secondary sources may be treated as free and not receive financial contributions from those users. Furthermore, the perception that a neighbouring community’s water supply is free water may impact the willingness to pay of primary users. This impacts the potential financial resources available for O&M, which could attribute to tariffs collected on a reactive basis for maintenance to meet immediate costs to reinstate operations at non-functioning assets when usage is above the intended design. These results underline the shortcomings of single source monitoring, due to the influence multiple source behaviours have for practitioners and stakeholders when establishing and financing service delivery.

3.2.2. Frequency Distribution by Tariff Amount

Table 2 demonstrates single tariff collection frequencies dominate 95.61%, of which the three most common occurrences are collections ‘per month’ (47.13%), ‘repairs required’ (22.94%), and ‘per year’ (18.48%), as demonstrated in Figure 2. Multiple collection frequencies are a minor occurrence with only 4.40% of the total dataset, and only 7.18% of multiple frequencies above 500 MWK.
As tariffs are collected less frequently, the weighting slightly increases to >500 MWK. Figure 2 demonstrates ‘per year’ with the highest weighting above 500 MWK (21.42%). This is to be expected for larger tariffs collected in fewer instances across the life-cycle of the water point to accommodate the annual life-cycle costs. However, as the majority of tariffs collected per year are similar in value to those collected per month, the annualised financial resources available significantly differ. For example, if 500 MWK is collected per month, this cumulatively results in 6000 MWK per annum, compared to a tariff at 500 MWK collected per year. This has implications for the potential financial resources available for O&M across the life-cycle of an asset, and could result in premature failure if no maintenance is conducted. This is further complicated by water user’s willingness or ability to pay the tariff and pay on time. Therefore, financial contributions may be sought at a time when the need is most apparent to users, such as tariffs collected when repairs are required (Figure 2) due to water point failure.
Foster and Hope [52] investigates this community behaviour to water point payment over a large timescale and dataset in rural Kenya. Households were not always able to pay towards tariffs, demonstrating a lack of affordability, or were unwilling to contribute. This may be indicative of the complex socio-cultural nature and risk factors for water point sustainability throughout rural SSA [13,24,27,53]. Considerations when setting these tariffs may be inherently different depending on the contextual factors of the rural communities that have implications for sustainability and fulfilling the 2030 agenda. These financial responsibilities and burdens in this complex rural environment require ongoing external support and monitoring [11].

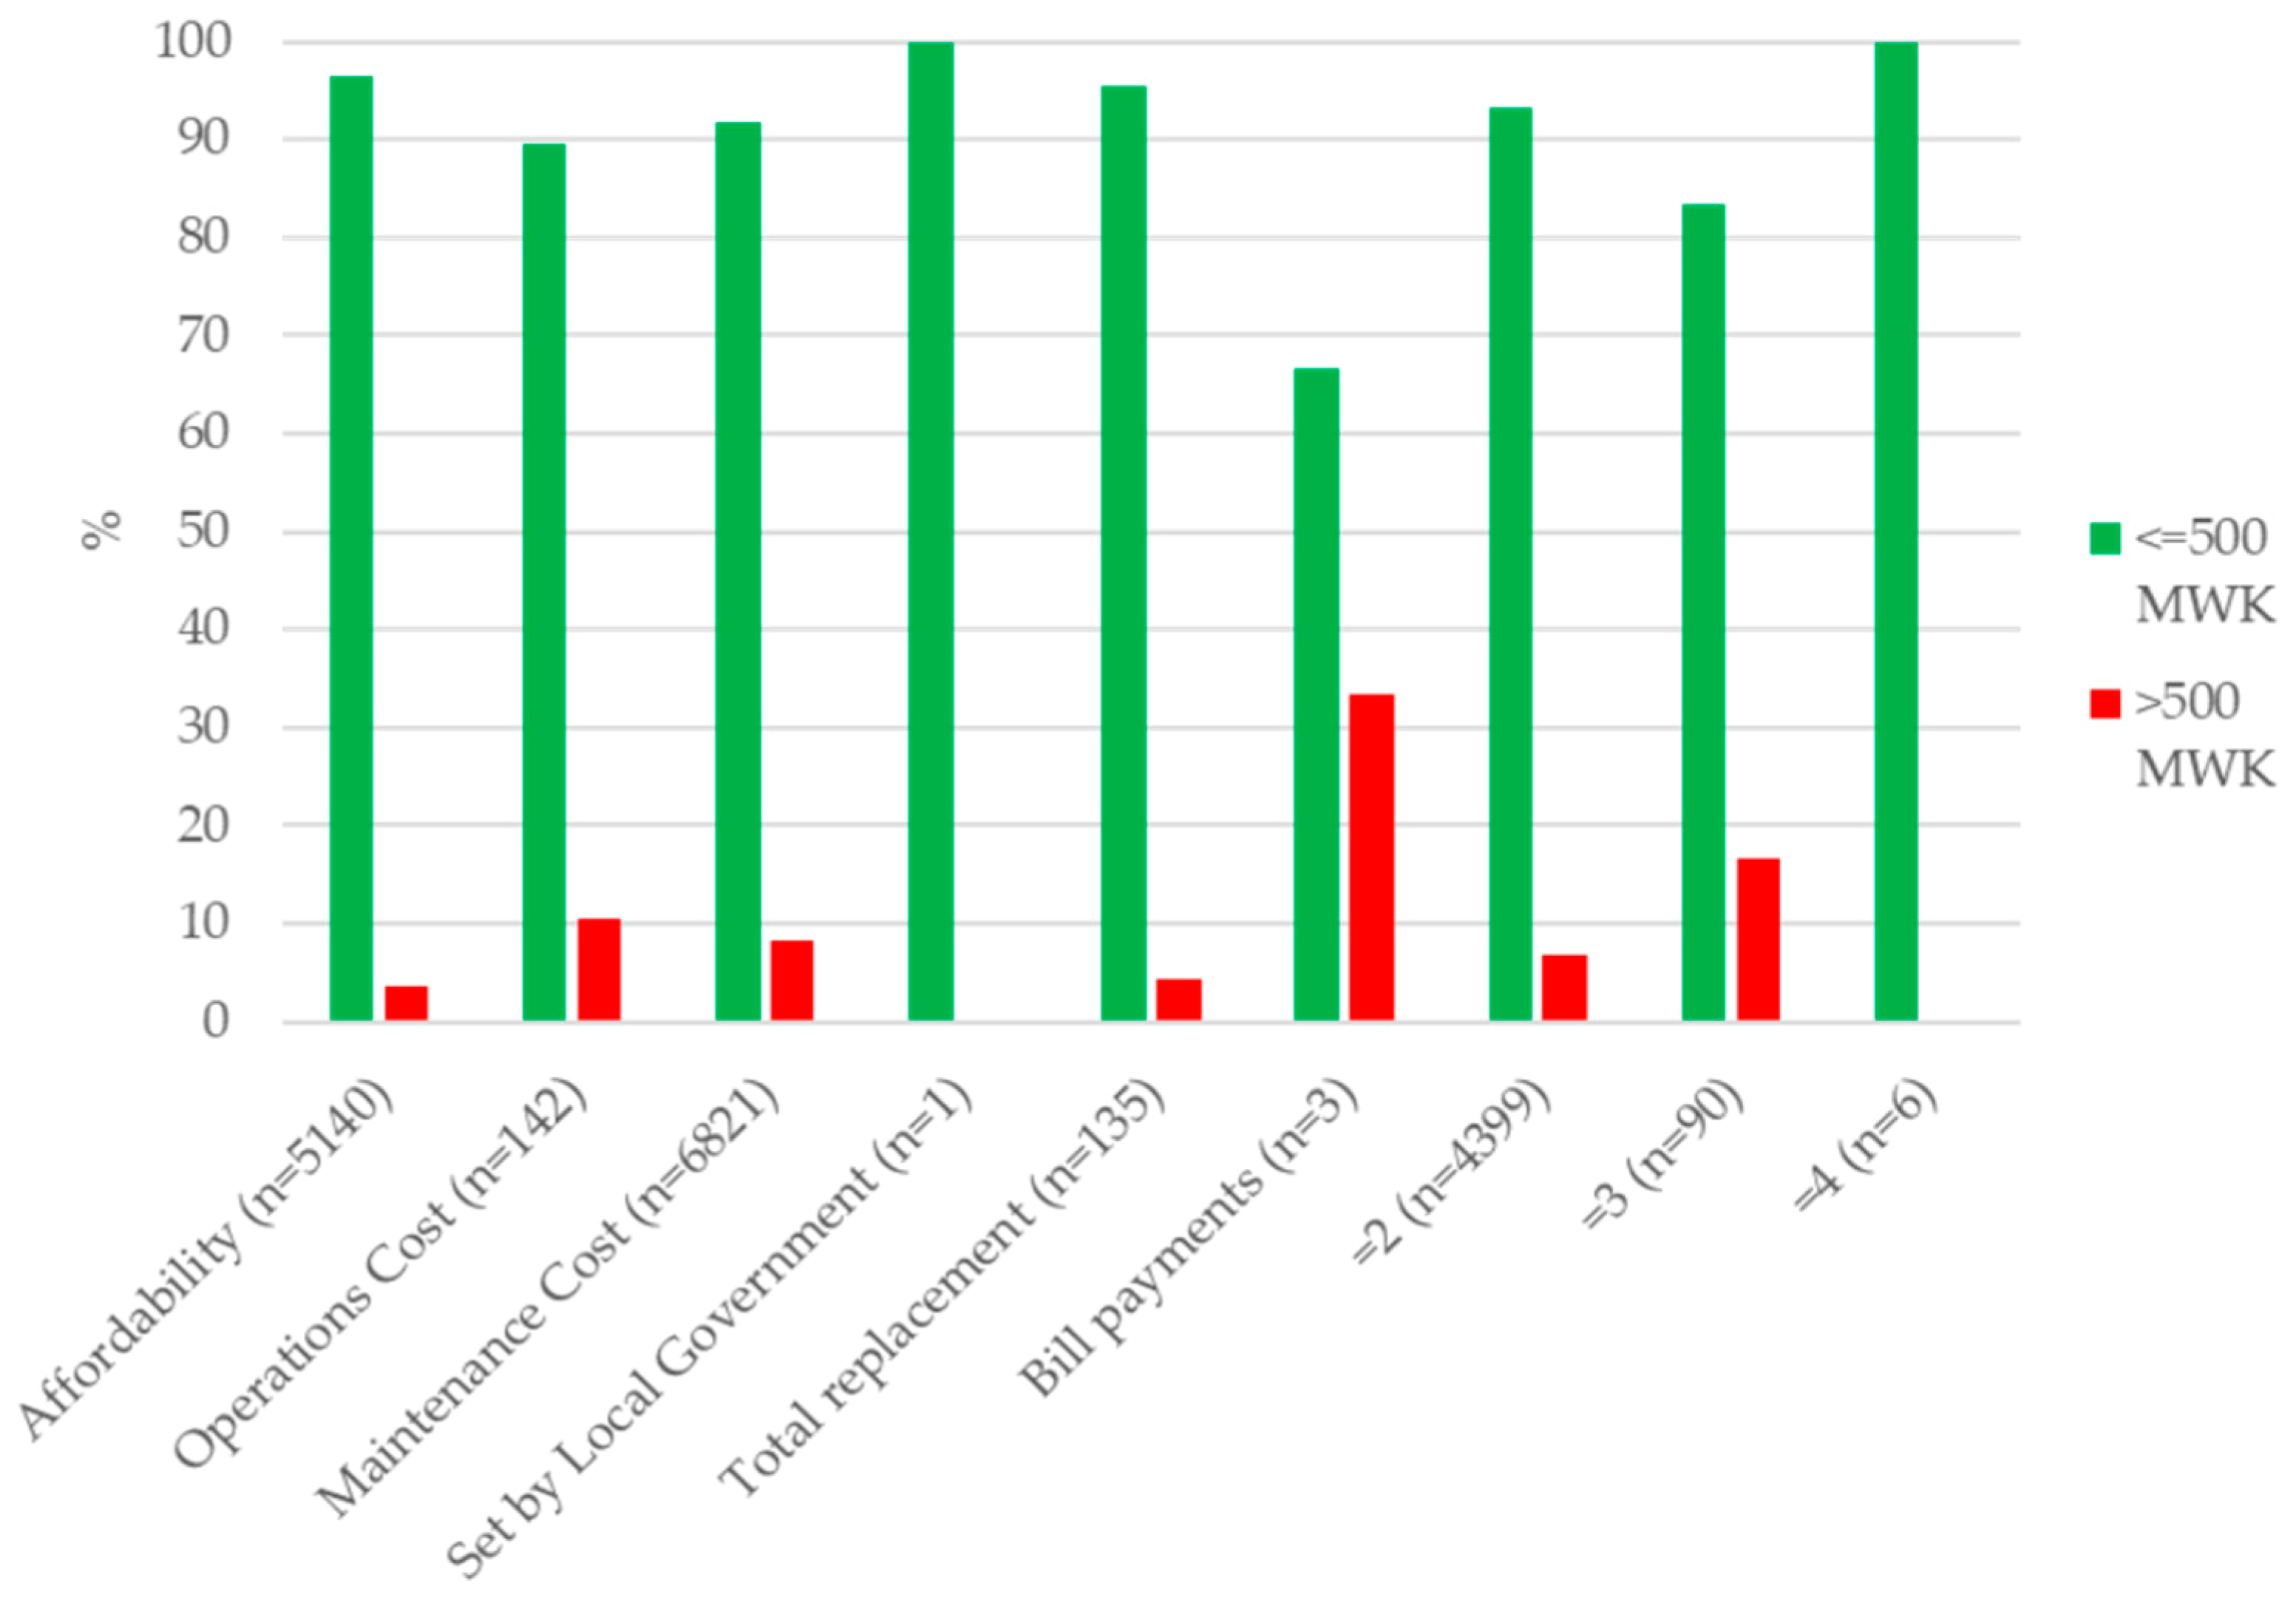
3.3. Considerations When Setting Tariffs

Table 3 shows the distribution of one or multiple factors that are considered when setting tariffs by the number of users and tariff amount. Figure 3 and Figure 4 indicate the breakdown of these factors by the number of water users and tariff amount, respectively. It is crucial to identify what factors service providers consider when setting tariffs when reflecting on the country’s national policy and the SDG agenda to ‘leave no one behind’.
While a single tariff consideration dominates the dataset, multiple considerations also make up a significant proportion (26.89% when users are considered and 26.86% when the tariff amount is considered). In both singular and multiple considerations, the dataset provides valuable insights into what service providers hold most important when setting the tariffs; affordability and maintenance.

3.3.1. Considering Affordable and Maintenance Driven Tariffs

Affordability and maintenance costs dominate tariff considerations, across user and tariff categories, with affordability being a greater consideration when the population is within design specifications. This trend is reflected where multiple considerations (Figure 3 and Figure 4 where considerations are ‘=2’) are examined, as the combination of affordability and maintenance costs contribute to the majority of occurrences for users and tariffs (n = 3986 and n = 3995 respectively). These suggest that service providers consider tariffs as sufficient to maintain assets when ‘affordable’ financial contributions are made from households.
Figure 3 demonstrates that maintenance related costs are more considered when usage is above the design limit. O&M costs (which can include both ‘operations costs’ and ‘maintenance costs’ considerations) shows a slightly larger split towards >300 users, while affordability indicates ~10% greater weighting towards ≤300 users. This suggests that when usage is within the design limit, there is more incentive to ensure willingness to pay of tariffs. With greater use above the design, maintenance costs are more common, resulting from greater wear and tear, and more frequent repairs.
The results present a dominance of tariffs ≤500 MWK, as the primary choice for rural water supplies. This suggests that ≤500 MWK is what rural service providers consider to be affordable for contributing households, however, the annualised financial resources to cover the maintenance costs in their service delivery area vary significantly (Section 3.2.2). Any of the occurrences that express >500 MWK are primarily maintenance based considerations, or where there is more than one consideration when setting the tariff.

3.3.2. Considerations for Long Term Sustainability

Total replacement accounts for a small number of the financial considerations recorded (Figure 3 and Figure 4). Capital Maintenance Expenditure (CapManEx), which accounts for costly major repairs and rehabilitation, is an essential part of the life-cycle of assets which goes beyond routine minor O&M to keep services running [54,55]. These costs are recommended to non-community external support as reflected in Malawian national policy [40] and rely on NGOs for funding [3,56,57]. Total replacement costs are seldom considered when setting the tariffs (n = 135) with a slightly larger weighting towards >300 users, suggesting the acknowledgement of increased burden on infrastructure from increased usage (Figure 3). This small number supports the conclusion that CapManEx/Rehabilitation costs are not a primary concern of service providers. The results endorse the understanding that rehabilitation (excluding maintenance) is regarded as the start of a new service, is not considered in either pre or post construction of assets [17,58]. Tariffs at the local level can fulfil O&M requirements, however, these are unlikely to be sufficient for total cost recovery and rehabilitation [4]. The sustainability of rural water supply is further at risk when rural assets are without appropriate O&M, and prematurely fail after 5 years as described by Baumann [41]. This results in early rehabilitation to bring the service back up to an operational standard.
The balance of cost recovery and affordable water payments is crucial for fulfilling the SDGs that will require increased financing and development assistance, to bridge the funding gap in low-income countries [59]. This has led to affordability schemes throughout the sector to support service delivery. Financing strategies such as microfinance [4] and permaculture [60] can contribute to a reduced financial burden, however, government or external support is fundamental for these to be sustainably successful service delivery initiatives. WHO [33] describes evidence in Zimbabwe of affordability schemes, in which the three most common are government subsidies, reduced tariffs for disadvantaged groups, and block tariffs. However, the urban and rural contexts are also important considerations, as is the case in the mix of these affordability schemes. Capital and rehabilitation costs are reportedly covered through government investment, while preventative O&M is financed by water users. While this is described as an ‘affordability scheme’, it reflects the CBM approach prevalent within Malawi.
The prevalence of ‘one time investment’ for rural water supplies, as evident here, only cover the immediate need and not sustainability or growth [12,27,61]. These results highlight the importance of modelling service provision and the service delivery context alongside water supply assets to better understand the service delivery [24,62,63] and to assist fulfillment of all aspects of SDG 6.1.

4. Binary Logistic Regression—Affordability and O&M

The descriptive statistics for the explanatory variables supporting the binary logistic regression analysis are expressed in Table 4. These present the distribution for the most common considerations when setting tariffs, affordability and O&M costs. The results of the binary logistic regression analysis, that allow for the identification of significant explanatory variables of these considerations, are expressed in Table 5 (affordability) and Table 6 (O&M costs—which include both ‘operations costs’ and ‘maintenance costs’).

4.1. Service Delivery—Service Providers and Maintenance

In the multivariable results, Area Mechanics had 1.629 times higher odds of considering affordability (95% CI: 1.394–1.903) and lower odds of considering O&M (OR: 0.366, 95% CI: 0.313–0.427) compared to WPCs when setting tariffs. This may be considered counter intuitive, as the Area Mechanic under CBM policy conduct repairs out with routine O&M, therefore it would be expected O&M costs would be a driving consideration. However, 46.51% of Area Mechanics considered O&M costs, while 63.91% considered affordability (Table 4). This can be attributed to the nature of the Area Mechanic in the government structure, as the financial contribution is agreed between the community and the Area Mechanic. Challenges arise as Area Mechanics balance social obligations, resulting in voluntary work, and economic relationships with the community in their service delivery area [64].
Community members display lower odds of considering O&M costs compared to WPCs in the multivariable regression (Table 6). This is further evident from descriptive statistics in Table 4, where 68.21% of WPCs consider O&M compared to the 61.75% of community members. This accords with the literature, where lack of external support and training results in an ineffective system for ensuring quality maintenance and savings for O&M [11,12,15,19,46]. Multiple service providers displayed 1.531 times higher odds of considering O&M (95% CI: 1.339–1.751) and 2.397 times higher odds of considering affordability (95% CI: 2.121–2.709) than solely WPCs. Here, multiple service providers primarily consist of both WPCs and Area Mechanics (Table 1) who express 71.72% of cases considering affordability compared to 52.21% and 63.14% of solely WPCs or Area Mechanics respectively (Table 4).
Conducting preventative maintenance displayed higher odds of considering affordability and O&M costs than when unconducted. This was expected as affordable maintenance and repair is a crucial factor to ongoing functionality, discussed at length by Whaley et al. [65]. There is a risk of preventative maintenance being perceived as a redundant exercise to service providers if a water point is operational [19,57,66] as when water supplies are built correctly they can last for years without issue. As depreciation of infrastructure is evident with usage [3,27,41], preventative maintenance is necessary for the continued sustainability of infrastructure. This is reflected in the regression analysis as users above the design limit had higher odds of O&M cost considerations than below, the inference being that service providers recognize the challenge of meeting the increased maintenance requirements. In the univariable and multivariable analysis, keeping spare parts on site had higher odds of considering O&M costs (Table 6) and lower odds of considering affordability in the univariable analysis (Table 5), than when spare parts weren’t kept on site. This is consistent with evidence, as access to spare parts is a significant factor for the continued functionality and sustainability of waters supply, and crucial for the timely repairs of breakdowns [13,27,67]. These results provide further evidence on the importance of continued post-construction support to achieve and mediate the trade-offs within the SDG agenda. Where, service provider training, preventative maintenance approaches, and supply chains mediate the challenges for sustainable water supply delivery and financing.

4.2. Financial Resources—Tariff Frequency, Tariff Amount, and Users

Less frequent tariff collections display a notably higher distribution of considering O&M compared to considering affordability (Table 4). Tariffs collected per year have lower odds of considering affordability (OR: 0.615, 95% CI: 0.555–0.682) and higher odds of O&M (OR: 2.397, 95% CI: 2.127–2.702) than tariffs collected per month in the multivariable analysis. This suggests less frequent tariffs focus on crucial O&M to ensure continued service delivery when repairs and decline of service delivery may be more evident. A similar trend is presented for the tariff frequency when required for repairs, where there were lower odds of considering affordability (OR: 0.598, 95% CI: 0.537–0.666) and higher odds of considering O&M (OR: 2.411, 95% CI: 2.131–2.727), than tariffs collected per month. This was expected due to the nature of payment upon breakdown when the need for repair is high. The tariff amount displays no association with affordability and O&M costs for both the univariable and multivariable regression. This indicates frequency of collection is the primary association between the tariff and the consideration variables rather than the annualized amount.
Users above the 300 user threshold display lower odds of considering affordability while expressing higher odds of O&M costs being considered than below. When usage is greater than the design limit of the Afridev (300 users), additional wear and tear contributes to depreciation of the infrastructure, particularly when willingness to pay and secondary sources are established problems for collecting financial resources (Section 3.2.1). This may attribute to increased odds of considering O&M costs in the set tariffs and decreased odds of affordability compared to usage within the design limit. Furthermore, while there are potentially more households able to contribute towards the O&M of the assets, the increased operational demand results in tariffs reflecting O&M related costs to accommodate the increased wear and tear. This does not suggest that affordability is less relevant or becomes less important as user numbers increase, but rather suggests an increased focus on the O&M costs. This brings into question if the tariffs collected by fewer contributing households are capable of meeting the O&M requirements of the assets. The results thereby suggest that the number of users at a water point can identify potential trade-offs in the financing of services that impact sustainable service delivery and could hinder the fulfilment of the SDGs.
The revenue collected for the maintenance of assets is crucial towards continued functionality [27,65]. Communities that have available financial resources available are less reliant on external support [65,68]. However, annualized financial resources vary significantly, and the regular collection of tariffs are very rarely set to reflect the life-cycle costs of the handpump [69]. Service providers are thus presented with sustainability issues when tariffs do not reflect the life-cycle costs of the water point and households that avoid payments. Understanding how users value water, i.e., reliability, quality, and accessibility, and creating that value is imperative to ensure water payment and deliver sustainable service delivery in the SDGs, rather than solely reducing costs [70].
The tariff amount, frequency of collection, and potentially contributing users can dictate the potential financial resources available for O&M. It is recommended that further study investigate how this varies and meets the life-cycle cost of water supply assets. Furthermore, various demographics and disadvantaged groups are notable factors when considering water payments [71], alongside the willingness to pay the tariffs set by service providers. It is recommended that these contexts be further investigated to identify their significance on rural water service providers considering affordability in the tariffs set. Understanding what tariffs are considered affordable is an important factor for implementing and supporting rural water service delivery and achieving the SDG agenda.

4.3. Malawian Assets—Region, Age, and Functionality

All three regions of Malawi display a higher distribution of cases considering O&M costs compared to considering affordability in the tariffs that are set (Table 4). In the univariable analysis the Central region had lower odds of considering affordability (OR: 0.853, 95% CI: 0.798–0.911) and had lower odds of considering O&M costs in the multivariable analysis (OR:0.598, 95% CI: 0.551–0.649) compared to the Southern region. There is no significant association between the age of the water point asset and considering affordability or O&M costs.
No significant association of considering affordability nor O&M costs was displayed when comparing functional assets and non-functional assets. The multivariable analysis displayed 1.413 times higher odds for considering affordability for partial functionality (95% CI: 1.297–1.539) compared to functionality. Considering affordability when setting tariffs may have an impact on the potential financial resources available for crucial O&M for continued sustainability. However, affordable tariffs do not directly result in a decline of service delivery, as depreciation and sub-standard infrastructure that have higher O&M costs can be attributed to the decline of functional assets across Malawi [3,29]. This is further supported by the descriptive statistics in Table 4, as partial functionality displays the highest number of cases considering affordability (60.12%) alongside the highest number of cases considering O&M costs (69.70%). This provides evidence of the service delivery challenges faced by rural water service providers who inherently balance affordability and O&M costs when tariffs are set, while maintaining sustainable services.

4.4. Limitations

This study was undertaken using a large and detailed dataset. The results presented are statistically significant within the Malawi context. However, in addition to the caveats associated with logistic regression analysis regarding omitted variable bias, the results and interpretations of this study are subject to limitations. First, only data concerning sampling of Afridev handpump boreholes within the MDG period was used. While this considers the dominant improved water supply technology in the rural setting, older systems and other water supply technologies that have variable life-cycle costs were omitted. Second, at the time of evaluation, the Northern region showed less information available compared to the Southern and Central regions of the country. Therefore, it is possible the results are not fully representative of the Northern region. Third, the annualised tariff amount respective of frequency of collection requires an assumption for reactive payments (i.e., when required for repairs) due to the difficulty in predicting water point breakdown. Finally, the functionality of the water points is acknowledged to be a temporal snapshot for sustainability (Section 2.4) and can be variable across the life-cycle. This means tariff frequency and amount may also vary according to site specific circumstances.

5. Conclusions

Tariffs in the form of household contributions have been the primary financial mechanism for sustainably maintaining rural water supplies, however, balancing affordability and O&M costs at the local level has been challenging. This paper provides insights into the setting of tariffs in Malawi for decentralised rural water supplies, that have implications for monitoring the service provision of assets and ultimately meeting SDG 6.1.
The breakdown of service provision primarily conforms to CBM and Malawian national policy in the form of WPCs. A proportion of water supply assets have no service provider or no tariff set for O&M, reinforcing the case for universal post-construction support. Tariffs are primarily collected per month, per year, and when required for repairs across rural Malawi. Potential financial resources hence vary across the water points life-cycle, resulting in implications for long term sustainability and maintenance practices. Long term sustainability is further challenged as tariffs are unlikely to be sufficient for maintaining and eventual, or premature, rehbailitation or replacement of assets.
The results of the binary logistic regression analysis demonstrate significant explanatory variables associated with the most common considerations identified by the results, affordability and O&M costs, in both univariable and multivariable adjusted models. Notable drivers behind these considerations include the frequency of tariff collection and the number of users. In particular, less frequent tariffs and usage above the design limit of the Afridev (300 users) had lower odds of considering affordability and higher odds of considering O&M costs, than tariffs collected per month and within the design limit. This highlights the potential trade-offs in the financing of services due to over usage that can hinder the achievement of the SDGs. Considerations are also influenced by the type of service provision. Area Mechanics are less likely to consider the O&M costs and more likely to consider affordability compared to WPC’s, while community members are less likely to consider O&M costs compared to WPC’s, supporting wider evidence for post-construction support and training. The results further suggest a recognition by service providers of the increased maintenance challenges. Increased usage, conducting preventative maintenance, acquiring spare parts and the collection of tariffs when repairs are required indicate an increased likelihood of considering O&M costs in tariffs. Overall, the balance of affordability and O&M costs is a noticable challenge throughout the results for the various service providers in the tariffs that are set, that have implications for ensuring sustainable service delivery.
Reflection is required into how affordability is established in Malawi and as an indicator of the SDGs. As MDG 7c disregarded affordability as an indicator, it is crucial for SDG 6.1 to address this indicator by looking outside the established models of rural water supply, such as CBM, and consider the context in which user contributions are established. While there are numerous factors when setting tariffs, the priorities of decentralised service providers may drastically differ across contexts and diverge from the required life-cycle costs of assets. Furthermore, tariffs that are considered affordable in one context may not be considered affordable in another. Successful sustainable services require investment to go beyond solely water access, into the monitoring and supporting of the financial and operational requirements of O&M. This is to ensure payment for services does not prevent access to clean water and breaking the cycle of poverty within the SDG agenda.
Further research should address how the trends in tariffs under decentralised service provision varies socio-geographically and environmentally. Determining the influence local socio-cultural contexts have on service providers is important for establishing affordable financial mechanisms for O&M and reflecting the targets of SDG 6.1.

Author Contributions

Conceptualization, J.P.T.; methodology, J.P.T.; formal analysis, J.P.T.; data curation, J.P.T., M.N., and R.M.K.; writing—original draft preparation, J.P.T.; writing—review and editing, J.P.T., A.B.C., M.N., E.M., and R.M.K.; visualization, J.P.T.; supervision, A.B.C. and R.M.K. All authors have read and agreed to the published version of the manuscript.

Funding

This research was funded by the Scottish Government Climate Justice Fund Water Futures Programme research grant HN-CJF-03 awarded to the University of Strathclyde (R.M.K.).

Acknowledgments

The authors would like to acknowledge support from the Scottish Government Climate Justice Fund Water Futures Programme, and the University of Strathclyde. We thank continued direct collaboration with our partner the Government of Malawi Ministry of Agriculture, Irrigation and Water Development (MoAIWD), and implementation partners United Purpose, World Vision, CADECOM, CARE, BAWI and Water for People for their support. In particular, the authors would like to thank BASEFlow for their ongoing technical and logistical support.

Conflicts of Interest

The authors declare no conflict of interest.

Appendix A

Table A1. Distribution of Afridev handpump boreholes (n = 22,316) as of 25 April 2019.
Region of MalawiDistrict of Malawin% of Total Data Set
SouthernBalaka11265.05
Blantyre10334.63
Chikwawa10394.66
Chiradzulu5042.26
Machinga10124.53
Mangochi295313.2
Mulanje3891.74
Mwanza3371.51
Neno1750.78
Nsanje3271.47
Phalombe5272.36
Thyolo8413.77
Zomba13636.11
Total of Southern11,62652.1
CentralDedza13776.17
Dowa12995.82
Kasunga11645.22
Lilongwe317914.2
Mchinji5042.26
Nkhotakota6793.04
Ntcheu12075.41
Ntchisi4191.88
Salima6462.89
Total of Central10,47446.9
NorthernChitipa90.04
Karonga280.13
Likoma30.01
Mzimba850.38
Nkhata Bay140.06
Rumphi280.13
Total of Northern1670.75
No data-490.22
Total-22,316100

References

  1. WHO/UNICEF. Progress on Sanitation and Drinking Water: Update 2010; WHO: Geneva, Switzerland, 2010; pp. 1–55. ISBN 9789241563956. [Google Scholar]
  2. Adank, M.; Butterworth, J.; Godfrey, S.; Abera, M. Looking beyond Headline Indicators: Water and Sanitation Services in Small Towns in Ethiopia. J. Water Sanit. Hyg. Dev. 2016, 6, 435–446. [Google Scholar] [CrossRef] [Green Version]
  3. Truslove, J.P.; Miller, A.V.M.; Mannix, N.; Nhlema, M.; Rivett, M.O.; Coulson, A.B.; Mleta, P.; Kalin, R.M. Understanding the Functionality and Burden on Decentralised Rural Water Supply: Influence of Millennium Development Goal 7c Coverage Targets. Water 2019, 11, 494. [Google Scholar] [CrossRef] [Green Version]
  4. United Nations. Sustainable Development Goal 6 Synthesis Report on Water and Sanitation; United Nations: New York, NY, USA, 2018. [Google Scholar]
  5. United Nations Development Programme. Human Development Report 2006 beyond Scarcity: Power, Poverty and the Global Water Crisis; United Nations: New York, NY, USA, 2006. [Google Scholar]
  6. Bartram, J.; Brocklehurst, C.; Fisher, M.B.; Luyendijk, R.; Hossain, R.; Wardlaw, T.; Gordon, B. Global Monitoring of Water Supply and Sanitation: History, Methods and Future Challenges. Int. J. Environ. Health Res. 2014, 11, 8137–8165. [Google Scholar] [CrossRef] [PubMed] [Green Version]
  7. WHO/UNICEF. Progress on Sanitation and Drinking Water—2015 Update and MDG Assessment. World Health Organ. 2015, 90. [Google Scholar] [CrossRef]
  8. WHO/UNICEF. Progress on Drinking Water, Sanitation and Hygiene: 2017 Update and SDG Baselines; WHO/UNICEF: Geneva, Switzerland, 2017. [Google Scholar] [CrossRef] [Green Version]
  9. Kroll, C.; Warchold, A.; Pradhan, P. Sustainable Development Goals (SDGs): Are We Successful in Turning Trade-Offs into Synergies? Palgrave Commun. 2019, 5. [Google Scholar] [CrossRef] [Green Version]
  10. Mainali, B.; Luukkanen, J.; Silveira, S.; Kaivo-oja, J. Evaluating Synergies and Trade-Offs among Sustainable Development Goals (SDGs): Explorative Analyses of Development Paths in South Asia and Sub-Saharan Africa. Sustainability 2018, 10, 815. [Google Scholar] [CrossRef] [Green Version]
  11. Harvey, P.A.; Reed, R.A. Community-Managed Water Supplies in Africa: Sustainable or Dispensable? Community Dev. J. 2006, 42, 365–378. [Google Scholar] [CrossRef]
  12. Moriarty, P.; Smits, S.; Butterworth, J.; Franceys, R. Trend in Rural Water Supply: Towards a Service Delivery Approach. Water Altern. 2013, 6, 329–349. [Google Scholar]
  13. Hutchings, P.; Chan, M.Y.; Cuadrado, L.; Ezbakhe, F.; Mesa, B.; Tamekawa, C.; Franceys, R. A Systematic Review of Success Factors in the Community Management of Rural Water Supplies over the Past 30 Years. Water Policy 2015, 17, 963–983. [Google Scholar] [CrossRef] [Green Version]
  14. Schouten, T.; Moriarty, P.B. Community Water, Community Management: From System to Service in Rural Areas; ITDG: London, UK, 2003. [Google Scholar]
  15. Baumann, E.; Furey, S. How Three Handpumps Revolutionised Rural Water Supplies a Brief History of the India Mark II/III, Afridev and the Zimbabwe Bush Pump Rural Water Supply Network Field Note No 2013-1; RWSN: St Gallen, Switzerland, 2013. [Google Scholar]
  16. Macarthur, J. Handpump Standardisation in Sub-Saharan Africa Seeking a Champion; RWSN: St Gallen, Switzerland, 2015. [Google Scholar]
  17. RWSN Executive Steering Committee. Myths of the Rural Water Supply Sector; RWSN: St Gallen, Switzerland, 2010. [Google Scholar]
  18. Van den Broek, M.; Brown, J. Blueprint for Breakdown? Community Based Management of Rural Groundwater in Uganda. Geoforum 2015, 67, 51–63. [Google Scholar] [CrossRef] [Green Version]
  19. Chowns, E. Is Community Management an Efficient and Effective Model of Public Service Delivery? Lessons from the Rural Water Supply Sector in Malawi. Public Adm. Dev. 2015, 35, 263–276. [Google Scholar] [CrossRef]
  20. Lockwood, H.; Smits, S. Supporting Rural Water Supply Moving towards a Service Delivery Approach; Practical Action Publishing Ltd.: London, UK, 2011. [Google Scholar]
  21. Hutchings, P.; Franceys, R.; Mekala, S.; Smits, S.; James, A.J. Revisiting the History, Concepts and Typologies of Community Management for Rural Drinking Water Supply in India. Int. J. Water Resour. Dev. 2017, 33, 152–169. [Google Scholar] [CrossRef] [Green Version]
  22. Bonsor, H.; MacDonald, A.; Casey, V.; Carter, R.; Wilson, P. The Need for a Standard Approach to Assessing the Functionality of Rural Community Water Supplies. Hydrogeol. J. 2018, 26, 367–370. [Google Scholar] [CrossRef] [Green Version]
  23. Kativhu, T.; Mazvimavi, D.; Tevera, D.; Nhapi, I. Factors Influencing Sustainability of Communally-Managed Water Facilities in Rural Areas of Zimbabwe. Phys. Chem. Earth Parts A/B/C 2017, 100, 247–257. [Google Scholar] [CrossRef]
  24. Carter, R.C.; Ross, I. Beyond ‘Functionality’ of Handpump-Supplied Rural Water Services in Developing Countries. Waterlines 2016, 35, 94–110. [Google Scholar] [CrossRef]
  25. Liddle, E.S.; Fenner, R. Water Point Failure in Sub-Saharan Africa: The Value of a Systems Thinking Approach. Waterlines 2017, 36, 140–166. [Google Scholar] [CrossRef]
  26. Klug, T.; Cronk, R.; Shields, K.F.; Bartram, J. A Categorization of Water System Breakdowns: Evidence from Liberia, Nigeria, Tanzania, and Uganda. Sci. Total Environ. 2018, 619–620, 1126–1132. [Google Scholar] [CrossRef]
  27. Foster, T. Predictors of Sustainability for Community-Managed Handpumps in Sub-Saharan Africa: Evidence from Liberia, Sierra Leone, and Uganda. Environ. Sci. Technol. 2013, 47, 12037–12046. [Google Scholar] [CrossRef]
  28. Martínez-Santos, P. Does 91% of the World’s Population Really Have “Sustainable Access to Safe Drinking Water”? Int. J. Water Resour. Dev. 2017, 33, 514–533. [Google Scholar] [CrossRef]
  29. Kalin, R.M.; Mwanamveka, J.; Coulson, A.B.; Robertson, D.J.C.; Clark, H.; Rathjen, J.; Rivett, M.O. Stranded Assets as a Key Concept to Guide Investment Strategies for Sustainable Development Goal 6. Water 2019, 11, 702. [Google Scholar] [CrossRef] [Green Version]
  30. Holm, R.; Singini, W.; Gwayi, S. Comparative Evaluation of the Cost of Water in Northern Malawi: From Rural Water Wells to Science Education. Appl. Econ. 2016, 48, 4573–4583. [Google Scholar] [CrossRef]
  31. Lee, C. Privatization, Water Access and Affordability: Evidence from Malaysian Household Expenditure Data. Econ. Model. 2011, 28, 2121–2128. [Google Scholar] [CrossRef]
  32. Nature Publishing Group. Delivering on Sustainable Development. Nat. Sustain. 2019, 2, 783. [Google Scholar] [CrossRef]
  33. WHO. UN-Water Global Analysis and Assessment of Sanitation and Drinking-Water (GLAAS) 2017 Report: Financing Universal Water, Sanitation and Hygiene under the Sustainable Development Goals; WHO: Geneva, Switzerland, 2017. [Google Scholar]
  34. Government of Malawi. Malawi in Figures 2018 Edition; Government of Malawi: Lilongwe, Malawi, 2018.
  35. Briscoe, J.; de Ferranti, D. Water for Rural Communities—Helping People Help Themselves; The World Bank: Washington, DC, USA, 1988. [Google Scholar]
  36. Evans, P.; Appleton, B. Community Management Today: The Role of Communities in the Management of Improved Water Supply Systems; IRC: Delft, The Netherlands, 1993. [Google Scholar]
  37. Fonseca, C.; Smits, S.; Nyarko, K.; Naafs, A.; Franceys, R. Financing Capital Maintenance of Rural Water Supply Systems: Current Practices and Future Options; IRC: The Hague, The Netherlands, 2013. [Google Scholar]
  38. MoAIWD. Rural Water Supply Operation and Maintenance Series 1: Community Based Management (O&M Refresher Course) Training Manual; Ministry of Agriculture, Irrigation and Water Development: Lilongwe, Malawi, 2015.
  39. MoAIWD. National Water Policy; MoAIWD: Lilongwe, Malawi, 2005.
  40. MoAIWD. Implementation Guidelines for Rural Water Supply and Sanitation; MoAIWD: Lilongwe, Malawi, 2010.
  41. Baumann, E. Do Operation and Maintenance Pay? Waterlines 2006, 25, 10–12. [Google Scholar] [CrossRef]
  42. Miller, A.V.M.; Nhlema, M.; Kumwenda, S.; Mbalame, E.; Uka, Z.; Feighery, J.; Kalin, R. Evolving Water Point Mapping to Strategic Decision Making in Rural Malawi. In Proceedings of the 41st WEDC International Conference, Nakuru, Kenya, 9–13 July 2018. [Google Scholar]
  43. ERPF, K. Afridev: Installation and Maintenance Manual for the Afridev Handpump. (Revision 2-2007), v. 2.; SKAT-RWSN, Ed.; Rural Water Supply Network: St Gallen, Switzerland, 2007. [Google Scholar]
  44. Government of Malawi. Market Centre and Rural Piped Water Supply and Sanititaion Programme. Available online: http://www.wesnetwork.org.mw/Documents/Manuals/G-WSS3_Guidelines_for_Establishment_of_WUA.pdf (accessed on 1 November 2016).
  45. National Statistical Office. 2018 Population and Housing Census Preliminary Report; National Statistical Office: Zomba, Malawi, 2018.
  46. Whaley, L.; Cleaver, F. Can ‘Functionality’ Save the Community Management Model of Rural Water Supply? Water Resour. Rural Dev. 2017, 9, 56–66. [Google Scholar] [CrossRef]
  47. Vedachalam, S.; MacDonald, L.H.; Shiferaw, S.; Seme, A.; Schwab, K.J.; On behalf of PMA2020 investigators. Underreporting of High-Risk Water and Sanitation Practices Undermines Progress on Global Targets. PLoS ONE 2017, 12, e0176272. [Google Scholar] [CrossRef]
  48. Mannix, N.; Norrie, J.; Paterson, F.; Nhlema, M.; Mleta, P.; Nkhata, M.; Wanangwa, G.J.; Kumwenda, S.; Clarke, D.; Kalin, R.M. Making the Case for Improved Planning, Construction and Testing of Water Supply Infrastructure in Malawi. In Proceedings of the 41st WEDC International Conference, Nakuru, Kenya, 9–13 July 2018. [Google Scholar]
  49. Kelly, E.; Shields, K.F.; Cronk, R.; Lee, K.; Behnke, N.; Klug, T.; Bartram, J. Seasonality, Water Use and Community Management of Water Systems in Rural Settings: Qualitative Evidence from Ghana, Kenya, and Zambia. Sci. Total Environ. 2018, 628–629, 715–721. [Google Scholar] [CrossRef] [Green Version]
  50. Anthonj, C.; Fleming, L.; Cronk, R.; Godfrey, S.; Ambelu, A.; Bevan, J.; Sozzi, E.; Bartram, J.; Anthonj, C.; Fleming, L.; et al. Improving Monitoring and Water Point Functionality in Rural Ethiopia. Water 2018, 10, 1591. [Google Scholar] [CrossRef] [Green Version]
  51. Tucker, J.; MacDonald, A.; Coulter, L.; Calow, R.C. Household Water Use, Poverty and Seasonality: Wealth Effects, Labour Constraints, and Minimal Consumption in Ethiopia. Water Resour. Rural Dev. 2014, 3, 27–47. [Google Scholar] [CrossRef]
  52. Foster, T.; Hope, R. A Multi-Decadal and Social-Ecological Systems Analysis of Community Waterpoint Payment Behaviours in Rural Kenya. J. Rural Stud. 2016, 47, 85–96. [Google Scholar] [CrossRef]
  53. Foster, T.; Willetts, J.; Lane, M.; Thomson, P.; Katuva, J.; Hope, R. Risk Factors Associated with Rural Water Supply Failure: A 30-Year Retrospective Study of Handpumps on the South Coast of Kenya. Sci. Total Environ. 2018, 626, 156–164. [Google Scholar] [CrossRef] [PubMed]
  54. Fonseca, C.; Franceys, R.; Batchelor, C.; Mcintyre, P.; Klutse, A.; Komives, K.; Moriarty, P.; Naafs, A.; Nyarko, K.; Pezon, C.; et al. Life-Cycle Costs Approach Glossary and Cost Components; IRC: The Hague, The Netherlands, 2010. [Google Scholar]
  55. Franceys, R.; Pezon, C. Services Are Forever: The Importance of Capital Maintenance (CapManEx) in Ensuring Sustainable WASH Services Briefing Note 1b; IRC: The Hague, The Netherlands, 2010. [Google Scholar]
  56. Scanlon, T.; Uguru, O.P.; Jafry, T.; Chinsinga, B.; Mvula, P.; Chunga, J.; Zimba, L.M.; Mwape, M.; Nyundo, L.; Mwiinga, B.; et al. The Role of Social Actors in Water Access in Sub-Saharan Africa: Evidence from Malawi and Zambia. Water Resour. Rural Dev. 2016, 8, 25–36. [Google Scholar] [CrossRef] [Green Version]
  57. Kativhu, T.; Mazvimavi, D.; Tevera, D.; Nhapi, I. Implementation of Community Based Management (CBM) in Zimbabwe: The Dichotomy of Theory and Practice and Its Influence on Sustainability of Rural Water Supply Systems. Phys. Chem. Earth Parts A/B/C 2018, 106, 73–82. [Google Scholar] [CrossRef]
  58. Mcintyre, P.; Casella, D.; Fonseca, C.; Burr, P. Supporting Water Sanitation and Hygiene Services for Life Priceless! Uncovering the Real Costs of Water and Sanitation; IRC: The Hague, The Netherlands, 2014. [Google Scholar]
  59. Sachs, J.D.; Schmidt-Traub, G.; Mazzucato, M.; Messner, D.; Nakicenovic, N.; Rockström, J. Six Transformations to Achieve the Sustainable Development Goals. Nat. Sustain. 2019, 2, 805–814. [Google Scholar] [CrossRef]
  60. Rivett, M.O.; Halcrow, A.W.; Schmalfuss, J.; Stark, J.A.; Truslove, J.P.; Kumwenda, S.; Harawa, K.A.; Nhlema, M.; Songola, C.; Wanangwa, G.J.; et al. Local Scale Water-Food Nexus: Use of Borehole-Garden Permaculture to Realise the Full Potential of Rural Water Supplies in Malawi. J. Environ. Manag. 2018, 209, 354–370. [Google Scholar] [CrossRef] [Green Version]
  61. Whittington, D.; Davis, J.; Prokopy, L.; Komives, K.; Thorsten, R.; Lukacs, H.; Bakalian, A.; Wakeman, W. How Well Is the Demand-Driven, Community Management Model for Rural Water Supply Systems Doing? Evidence from Bolivia, Peru and Ghana. Water Policy 2009, 11, 696. [Google Scholar] [CrossRef] [Green Version]
  62. Fisher, M.B.; Shields, K.F.; Chan, T.U.; Christenson, E.; Cronk, R.; Leker, H.; Samani, D.; Apoya, P.; Lutz, A.; Bartram, J. Understanding Handpump Sustainability: Determinants of Rural Water Source Functionality in the Greater Afram Plains Region of Ghana. Water Resour. Res. 2015, 51, 8431–8449. [Google Scholar] [CrossRef]
  63. Smits, S.; Rojas, J.; Tamayo, P. The Impact of Support to Community-Based Rural Water Service Providers: Evidence from Colombia. Water Altern. 2013, 6, 384–404. [Google Scholar]
  64. Oates, N.; Mwathunga, E. A Political Economy Analysis of Malawi’s Rural Water Supply Sector; ODI: London, UK, 2018. [Google Scholar]
  65. Whaley, L.; MacAllister, D.J.; Bonsor, H.; Mwathunga, E.; Banda, S.; Katusiime, F.; Tadesse, Y.; Cleaver, F.; MacDonald, A. Evidence, Ideology, and the Policy of Community Management in Africa. Environ. Res. Lett. 2019, 14, 085013. [Google Scholar] [CrossRef] [Green Version]
  66. Etongo, D.; Fagan, G.; Kabonesa, C.; Asaba, B.R.; Etongo, D.; Fagan, G.H.; Kabonesa, C.; Asaba, B.R. Community-Managed Water Supply Systems in Rural Uganda: The Role of Participation and Capacity Development. Water 2018, 10, 1271. [Google Scholar] [CrossRef] [Green Version]
  67. Harvey, P.A.; Reed, R.A. Sustainable Supply Chains for Rural Water Supplies in Africa. Proc. Inst. Civ. Eng. Eng. Sustain. 2006, 159, 31–39. [Google Scholar] [CrossRef]
  68. WaterAid. Sustainability Framework; WaterAid: London, UK, 2011. [Google Scholar]
  69. Harvey, P.A. Cost Determination and Sustainable Financing for Rural Water Service in Sub-Saharan Africa. Water Policy 2007, 9, 373–391. [Google Scholar] [CrossRef]
  70. Hoque, S.F.; Hope, R. Examining the Economics of Affordability through Water Diaries in Coastal Bangladesh. Water Econ. Policy 2019. [Google Scholar] [CrossRef]
  71. WAREG. Affordability in European Water; WAREG: Milan, Italy, 2017. [Google Scholar]
Figure 1. Frequency of tariff collection by no. of users.
Sustainability 12 00744 g001
Figure 2. Frequency of tariff collection by tariff amount in (MWK). “Other” tariff collection frequencies of n = 16,670 include: Per unit of water—litre/bucket/jerry can (n = 123, 0.74%), Flat fee plus fee per unit (n = 64, 0.38%), Per week (n = 53, 0.32%), Per day (n = 11, 0.07%).
Sustainability 12 00744 g002
Figure 3. Considerations when setting tariffs by no. of users.
Sustainability 12 00744 g003
Figure 4. Considerations when setting tariffs by tariff amount (MWK).
Sustainability 12 00744 g004
Table 1. Breakdown of service providers and the tariffs set, n = 22,316.
Service ProviderService Provider Variable
w/ Tariffw/o Tariff
Variablen%n%n%
Established 1No11625.38--1162100
Yes20,45694.6216,79682.11365717.88
Total21,61810016,79677.70481922.30
Where Service Provider Present (n = 20,438) 1Service Provider Variable
w/ Tariffw/o Tariff
Variablen%n%n%
Single Service ProviderWPC16,25079.5113,64483.96260416.02
Area Mechanic10605.1988883.7717116.13
Community Members4102.0127065.8514034.15
Institution4302.1014333.2628766.74
Other 21770.879251.988548.02
Total18,32789.6715,03782.05328717.94
Multiple Service Providers=21969 393.27163883.1933116.81
=31407.1110776.433323.57
=421.432100.0000.00
Total2111 410.33174782.7636417.24
1 Excluding data that indicates no response and don’t know. 2 Other service providers of n = 20,438: Owner/Private household (n = 78, 0.38%), Private contractor or operator (n = 59, 0.29%), WUA (n = 17, 0.08%), NGO (n = 9, 0.04%), Local Government (n = 8, 0.04%), Public operator/utilities (n = 6, 0.03%). 3 Includes both WPC and Area Mechanic, n = 1315 (66.82%). 4 SP > 1 includes either a WPC or Area Mechanic, n = 2110 (99.99%).
Table 2. Frequency of tariff collection by no. of users and tariff amount (n = 22,316).
No. of Users 1
VariableTotal≤300>300
n%n%n%
Total, n 116,670100869952.18797147.82
Single Frequency15,93895.61834252.34759647.66
Multiple Frequencies7324.3935748.7737551.23
Tariff (MWK) 1
VariableTotal≤500>500
n%n%n%
Total, n 116,76110015,67493.5110876.49
Single Frequency16,02395.6014,98993.5510346.45
Multiple Frequencies7384.4068592.82537.18
1 Excluding data that indicates no response and don’t know.
Table 3. Considerations when setting tariff by users and tariff amount n = (22,316).
No. of Users 1
VariableTotal≤300>300
n%n%n%
Total, n 116,676100869652.15798047.85
Single Consideration12,19273.11628951.58590348.42
Multiple Considerations 2448426.89240753.68207746.32
Tariff (MWK) 1
VariableTotal≤500>500
n%n%n%
Total, n 116,73710015,65193.5110866.49
Single Considerations12,24273.1411,47393.727696.28
Multiple Considerations 2449526.86417892.953177.05
1 Excluding data that indicates no response and don’t know. 2 Responses include either “Affordability” or “Maintenance” as a consideration, with the exception of n = 2 occurrences in “=2” category.
Table 4. Descriptive statistics for considering Affordability and O&M costs across binary logistic regression analysis explanatory variables.
Explanatory Variables AffordabilityO&M
n% of Totaln% Considering Affordabilityn% Considering O&M
Service Provider
WPC11,85381.95618952.21808568.21
Area Mechanic7575.2347863.1434745.84
Community Members2171.5011553.0013461.75
Institution860.594855.815563.95
Other790.555164.564860.76
Multiple SP147110.17105571.72113877.36
Frequency of Tariff
Per Month732750.66424757.96471164.30
Per Year294820.38149750.78219274.36
When Required for Repairs332923.02169550.92233470.11
Per 2 Months3172.1918357.7320063.09
Per Quarter5423.7531457.9337068.27
Tariff Amount
Tariff (Annual)14,463100793654.87980767.81
Users
≤300816956.48470957.64537165.75
>300629443.52322751.27443670.48
Preventative Maintenance
No268918.59137351.06172564.15
Yes11,77481.41656355.74808268.64
Spare Parts Kept on Site
No464832.14260956.13299264.37
Yes981567.86532754.27681569.43
Functionality
Functional11,00376.08587653.40740467.29
Partially Functional296420.49178260.12206669.70
Non-Functional4963.4327856.0533767.94
Age
Age (Years)14,463100793654.87980767.81
Region
Southern776253.67440456.74542969.94
Central659445.59348152.79430865.33
Northern1070.745147.667065.42
Table 5. Unadjusted and Multivariable Binary Logistic Regression when considering Affordability in tariffs for boreholes equipped with Afridev handpumps.
Explanatory VariablesUnadjustedMultivariable Adjusted
OR(95% CI)p-Value 1OR(95% CI)p-Value 1
Service Provider
WPC1--1--
Area Mechanic1.568(1.347–1.825)<0.0011.629(1.394–1.903)<0.001
Community Members1.032(0.788–1.350)0.8201.105(0.840–1.452)0.476
Institution1.156(0.754–1.772)0.5061.329(0.862–2.047)0.198
Other1.667(1.050–2.647)0.0301.658(1.039–2.646)0.034
Multiple SP2.321(2.060–2.614)<0.0012.397(2.121–2.709)<0.001
Frequency of Tariff 2
Per Month1--1--
Per Year0.748(0.687–0.815)<0.0010.615(0.555–0.682)<0.001
When Required for Repairs0.752(0.693–0.817)<0.0010.598(0.537–0.666)<0.001
Per 2 Months0.990(0.789–1.244)0.9340.922(0.731–1.163)0.492
Per Quarter0.999(0.837–1.192)0.9890.890(0.742–1.068)0.209
Tariff Amount
MWK (Annual) 31.000(1.000–1.000)0.0671.000(1.000–1.000)<0.001
Users
≤3001--1 -
>3000.773(0.724–0.826)<0.0010.764(0.714–0.818)<0.001
Preventative Maintenance
No1--1--
Yes1.207(1.110–1.313)<0.0011.168(1.071–1.273)<0.001
Spare Parts Kept on Site
No1--1--
Yes0.928(0.865–0.995)0.0361.029(0.956–1.109)0.445
Functionality
Functional1--1--
Partially Functional1.315(1.211–1.429)<0.0011.413(1.297–1.539)<0.001
Non-Functional1.113(0.928–1.334)0.2481.193(0.991–1.436)0.063
Age
Age (Years)0.996(0.991–1.002)0.2190.992(0.987–0.998)0.209
Region
Southern1--1--
Central0.853(0.798–0.911)<0.0011.070(0.994–1.151)0.072
Northern0.694(0.474–1.017)0.0610.761(0.513–1.128)0.174
1 Bold represents a statistically significant association (p < 0.05), 2 Categories ‘other’ and ‘multiple’ omitted due to unpredictable annual tariff, 3 Tariff amount annualized respective of tariff collection frequency. ‘When required for repairs’ was assumed to occur once per year for the purpose of analysis.
Table 6. Unadjusted and Multivariable Binary Logistic Regression when considering O&M costs in tariffs for boreholes equipped with Afridev handpumps.
Explanatory VariablesUnadjustedMultivariable Adjusted
OR(95% CI)p-Value 1OR(95% CI)p-Value 1
Service Provider
WPC1--1--
Area Mechanic0.394(0.340–0.457)<0.0010.366(0.313–0.427)<0.001
Community Members0.752(0.571–0.992)0.0440.738(0.553–0.986)0.040
Institution0.827(0.532–1.286)0.3990.724(0.457–1.147)0.169
Other0.722(0.459–1.135)0.1580.738(0.455–1.195)0.216
Multiple SP1.593(1.401–1.810)<0.0011.531(1.339–1.751)<0.001
Frequency of Tariff 2
Per Month1--1--
Per Year1.610(1.463–1.771)<0.0012.397(2.127–2.702)<0.001
When Required for Repairs1.303(1.193–1.423)<0.0012.411(2.131–2.727)<0.001
Per 2 Months0.949(0.752–1.198)0.6611.204(0.934–1.551)0.152
Per Quarter1.195(0.991–1.440)0.0631.567(1.282–1.916)<0.001
Tariff Amount
MWK (Annual) 31.000(1.000–1.000)0.0101.000(1.000–1.000)<0.001
Users
≤3001--1--
>3001.244(1.159–1.335)<0.0011.241(1.151–1.338)<0.001
Preventative Maintenance
No1--1--
Yes1.223(1.120–1.336)<0.0011.160(1.056–1.274)0.002
Spare Parts Kept on Site
No1--1--
Yes1.257(1.168–1.354)<0.0011.301(1.200–1.410)<0.001
Functionality
Functional1--1--
Partially Functional1.118(1.024–1.221)0.0131.043(0.949–1.147)0.378
Non-Functional1.030(0.850–1.249)0.7621.108(0.904–1.358)0.324
Age
Age (Years)0.999(0.993–1.005)0.7980.998(0.992–1.005)0.645
Region
Southern1--1--
Central0.810(0.755–0.869)<0.0010.598(0.551–0.649)<0.001
Northern0.813(0.544–1.214)0.3120.921(0.246–3.448)0.903
1 Bold represents a statistically significant association (p < 0.05), 2 Categories ‘other’ and ‘multiple’ omitted due to unpredictable annual tariff, 3 Tariff amount annualized respective of tariff collection frequency. ‘When required for repairs’ was assumed to occur once per year for the purpose of analysis.

