The Impact of Resource and Nutritional Resilience on the Global Food Supply System


1
Food Insights and Sustainability, National Centre for Food Manufacturing, University of Lincoln, Park Road, Holbeach PE12 7PT, UK
2
Operations Management & Decision Sciences, STFC Food Network+, Sheffield University Management School, The University of Sheffield, Sheffield University Management School, Conduit Road, Sheffield S10 1FL, UK
*
Author to whom correspondence should be addressed.
Sustainability 2020, 12(2), 751; https://0-doi-org.brum.beds.ac.uk/10.3390/su12020751
Submission received: 21 December 2019
/
Revised: 9 January 2020
/
Accepted: 12 January 2020
/
Published: 20 January 2020
(This article belongs to the Special Issue Healthy Sustainable Diets)
Abstract
:Pressure points in global food supply where resilience in supply chains can be limited or controlled are the equivalent of Critical Control Points in food safety systems. The approach of using critical control in supply chains can provide insights for nutritional improvement, sustainable food trade and food waste reduction. The pressure points determine the provision of a secure and sustainable food system where the outcomes of reducing their criticality are identified in the UN Sustainable Development Goals and other international programmes. These seek to reduce climate change impact and improve public health provision. While policy makers are rightly focussed on these targets, the data analysis methods required to rank and associate resource flow pressure points with commercial food supply chains and nutritional goals remain untested. Here, we show how methodologies can identify where opportunities to tackle future criticality exist, and where they are currently being overlooked for food categories that have the greatest consumer and dietary protein demand. The analysis provides insights that identify where latent restrictions in resilience can occur, so that the future risk of food insecurity is reduced.
1. Introduction
Resilience in global food supply; the assessment of food security and sustainability is routinely carried out for food systems so as to project where and when criticality for supply and demand is likely to occur [1]. Such a systemic approach does not need to fully consider the individual supply chain resilience as Critical Control Points (CCPs). These are all too well defined for the risk assessments and Hazard Analysis Critical Control Point frameworks (HACCP) associated with food safety, but the increased risk of malicious and fraudulent contamination of foods is also now known to reduce food security [2]. This means that robust global food defence strategies are vital and necessitate a broader use of CCPs to identify CCPs in risk-based models of food supply chains [3]. Such an approach raises the issue of how such frameworks might be applied to food supply chain resilience and sustainability. The importance of understanding how resources flow through supply chains and their associated data of product provenance, traceability and quality means we can consider what can happen when resilience in food systems becomes corrupted or fail. The failure of resource supply at control points in supply chains can result in the systemic failure of food security, and while systemic models project the high-level impacts of climate change, dietary crisis and food defence, they are not necessarily focussed on supply chain activities [4]. A simplified description of these activities is provided by the following four food supply chain functions; (1), production of biomass and ingredients; (2) processing and manufacturing of foods; (3), distribution and retailing; and (4) utilisation and consumption of food [5].
Current models and indices of food security and sustainability identify high-level policy risks; as such, they focus on the production of agricultural commodities and provide some understanding of resilience in the manufacturing, distribution and retailing functions of supply chains [6]. The development of industrial infrastructure has consistently delivered resilience in food supply chains where the projections of Malthusian and ‘peak resource’ models have not delivered accurate projections so far. This is because the models based on limiting carrying capacity overlook the value of intrinsic innovation, contractual trust and organisational cultures that deliver the commercial requirements of supply chains [7]. Tu et al., 2019 [8], indicated that the increased connectivity of globalised food supply has been shown to not necessarily improve the resilience of natural resource use in response to crisis or change. Any lack of resilience because of increased connectivity is recognised in food safety systems, where there is a crucial requirement to identify CCPs [9]. In small and large manufacturing companies and groups alike, the value of innovation, trust and culture are focused on providing the consumer fulfilment of manufactured foods, and their contribution to sustainable food supply is the focus in the research and methods reported in this paper [10]. Recent food supply chain pressures for fresh produce such as cauliflowers and courgettes have exposed where limits to innovative practice may occur because of rapid changes in weather patterns (see references below); these are often latent but can become active, and understanding where and when this occurs will provide greater supply chain resilience. Such critical latencies are of key importance to all food manufacturing supply chains, and they do not necessarily relate directly to food safety, but maintain accessibility, affordability and fulfilment of foods.
Resilience in global food supply and data; an example of such activated latency is the recent restrictions in the supply of food-grade carbon dioxide that has reduced the supply of beverages, bakery goods and salads in the UK. It was clearly demonstrated that although not consumed as food, the use of food grade gases is critical, in this case for proving doughs, carbonating beverages and providing modified atmosphere packaging [11]. Such limitations provide an opportunity to test latency within the food system because they can determine the level of control of supply and the quality attributes of foods. The reduction of supply by such resources results in limitations to accessibility, which are not considered because they do not directly supply or produce food products, but are concerned with fulfilment and utilisation of foods. The criticality of resource flow has importance to emerging and developed economies alike, because they will demonstrate where the CCPs for consumer goods moving through supply chains actually are. For example, the volume of imported agricultural products exposes resource latencies because they are critically dependent on a few major exporters, and a key driver for importing produce is the specific manufacturing or dietary qualities of food ingredients [12]. An example of this is the trade of high protein wheat and pulses, for which it is the quality and functionality requirements of food manufacturers that increases their demand [13].
The reliance of importers on large exporter or ‘bread-basket’ regions means it is critical to understand the sensitivities between them, because the warning signs of failure in supply due to demands of quality or functionality of foods have already been tested [12]. A recent restriction of fresh produce supply in Europe known as the “courgette crisis” exposed such a fragility and latent dependence on food exporting regions [14]. This fresh produce crisis followed a harsh winter in southern Europe in 2017 that resulted in a limitation of supply from regions that provide over half of the vegetable produce supply required by the UK for year-round consumer fulfilment. While this is a relatively surface-level indication of supply chain failure for fresh produce, there are far greater concerns surrounding the availability of skills in our food system. The latent criticality of management skills restricted UK food supply in 2017, where a lack of knowledge associated with the supply of frozen foods severely disrupted chicken supply to catering and service providers [15] The skills market and its free movement of labour is in nothing short of a potential freefall in Europe; the solution to this crisis is often identified as the application of robotics and automation in the food supply chain, because these will increase supply chain resilience with respect to shortages in skilled labour [16]. Current projection models for food security do not consider the impact of integrating these technologies, so a default position of only prioritising crop or livestock production is flawed. The requirement to associate data within and between supply chains is crucial for latency to be considered, and the use of new analytical methods to identify CCPs relevant to security and sustainability is demonstrated in the research reported here.
An additional factor in utilising these methods is the use of digital technologies that have transformed how assessment data can be transferred and scaled up with the use of data carriers such as radio frequency tags, optical character recognition and bar codes on packaging [17]. This is because the transfer of data cannot now be corrupted, edited or changed if supply chain assessments use standardised distributed ledger technologies (DLT’s) that use real-time cloud computing platforms [18]. The inclusion of metrics that can report security and sustainability outcomes of different food and feed categories in these systems is nothing short of revolutionary because of the ability to scale sustainability assessment across supply chains [19]. These all need suitable metrics to be developed that measure impacts across supply chains; these are described in the methodology reported in this research.
Analytical procedures for identifying latency; robust metrics of the sustainability of the global food and feed system could be used to strategically plan resourcing if universal impacts of food consumption such as GHG emissions and waste are established. A limiting point is how metrics and assessment methods are developed to analyse data. The typical approach has been to ‘search and classify’ information. Future assessments must effectively transform this approach to one of ‘association and projection’, where quantification of associated or homologous data between different datasets can assess sustainability attributes between supply chains. The associative approach is tested in the research reported here for the food manufacturing industry so that risks and threats to food security can be more readily identified. It is a step change that is presented with respect to identifying associations so a more robust analysis of databases is achieved and strategic actions can be applied more effectively. This will eventually require all consumption scenarios for all food products to be assessed. There are indications that digital applications can do this, but assessment methods must be fit for purpose. The research reported here demonstrates how this can be achieved by using methods that identify CCPs in food supply chains that provide potential latency for sustainability and security impacts. With regard to improving the resilience of food supply to change, the methods demonstrated here enable users to identify points in protein supply where any environmental, social or economic change is most critical, i.e., those food categories where supply by production alone will not be possible, therefore requiring imports or production improvement. The presented methods potentially guide and focus practices that can improve resilience to changes in protein supply.
2. Materials and Methods
The FAOSTAT open access databases for Food Supply—Crops, Livestock and Fish Primary Equivalent, was used for dietary protein supply benchmarking. The last reported year, 2013, was used for the analysis so that the rank and association method could be tested. The food categories identified in the FAOSTAT were ranked in order of protein supply from highest to lowest, and further attributes of DSQ and food loss were benchmarked against protein supply. The protein supply for each food category is used to benchmark the ranking of production, Domestic Supply Quantity (DSQ) and food loss. DSQ is (production + imports) – exports + changes in stocks (decrease or increase) = supply for domestic utilization). The food losses reported by FAOSTAT are the amount of the commodity in question lost through wastage (waste) during the year at all stages between the level at which production is recorded and the household, i.e., storage and transportation. Losses occurring before and during harvest are excluded. Waste from both edible and inedible parts of the commodity occurring in the household is also excluded. Quantities lost during the transformation of primary commodities into processed products are taken into account in the assessment of respective extraction/conversion rates.
The quantities for livestock and crop food categories were then ranked from greatest to least protein quantity supplied. The ranking from greatest to least was carried out independently across the livestock and crop categories for production (tonnes per year), DSQ (tonnes per year) and food losses (tonnes per year). The analysis of the ranked data for production, DSQ and food loss were then associated with the ranked protein supply data by the order number of their ranking with respect to protein supply. The protein content of food supply was used as a benchmark for dietary requirements in this study. The importance of the protein content of foods is a major driver of dietary change; it was selected for this reason. The FAOSTAT open access databases for Food Supply—Crops, Livestock and Fish Primary Equivalent, was used for dietary protein supply benchmarking. The benchmarking of protein supply was carried out by selecting crop and livestock primary equivalent products and their protein supplied on a grams of protein per capita per day basis. The quantities for livestock and crop food categories were then ranked from greatest to least protein quantity supplied. The ranking from greatest to least was carried out independently across the livestock and crop categories for production (tonnes produced per year), Domestic Supply Quantity (DSQ, tonnes per year, the product of (production + imports) - exports) and food losses (tonnes of supply chain losses per year). The analysis of the ranked data for production, DSQ and food loss were then associated with the ranked protein supply data by the order number of their ranking with respect to protein supply. The rank and associative order enables the identification of limitations in protein supply chains. The approach of using protein benchmarking was developed and branded as the Centreplate Model, a method that we have used with food manufacturing companies to guide sustainability policy that is relevant to national and cultural diets.
The reported study uses data obtained from the world total to provide an overview of protein supply and association rank with DSQ, production and food loss, as reported by FAOSTAT. The Centreplate Model is also tested on national protein supply profiles for the UK and Japan, which were selected for the benchmarking analysis. The UK was selected as a typical food system that has access to crop and livestock proteins, and Japan was selected because its national diet has been cited as the healthiest globally by FAO [20]. The association of global crop production data to food supply, feed supply and export was obtained using data from FAOSTAT and presented as a chord diagram using the Circos Table Viewer v0.63-9 © 2008-2019 [21]. These crops were selected by ranking FAOSTAT food supply and export quantity of crop products across all global regions. This global analysis was developed using a regional classification for the highest ranked exported crops for crops which are ranked as most important with respect to production in chord diagrams.
3. Results
The rank and association analysis described in this paper was developed using the Centreplate Model, reflecting the importance of protein portions of meals. The rank and association methods were tested for the global protein supply (Table 1). The production order starts at 2 in this series, because the greatest production of crops is for sugar cane (1.88 × 10⁹ tonnes, 2013, ranked first for production), which is not a protein crop, followed by maize and related products (1.02 x 10⁹ tonnes, 2013, ranked second for production) and vegetables (0.88 x 10⁹ tonnes, 2013, ranked third). Table 2 shows how the Centreplate Model is used for the analysis of the national dietary protein supply for Japan and the United Kingdom. Food losses reported by FAOstat are used in the Centreplate Model using the rank and association method with the proviso that there is high variability in food loss data that is not necessarily evident in nationally-reported data. The global assessment (Table 1) does not include the DSQ rank because it is equivalent to production quantity, because imports and exports are the same, in that they cancel each other out on a global scale.
The global assessment in Table 1 shows that meat and livestock categories are CCPs because their protein supply rank is at least 5 rank scores above their production rank scores, even though they supply increased protein with respect to each meal portion. Whole milk is significant because it delivers agility into the global system, because the supply of protein and production quantity of milk are ranked equivalently. Cereal products are critical with rice and wheat production which are ranked lower than supply, and food losses are a similar rank as production. This relationship is biased by maize and soybean, where large volumes are used for processing and feeds. Table 1 identifies that global CCPs for protein are not only associated with livestock products, with the beans and groundnuts categories having high protein supply rank but low production rank. Opportunities to ameliorate this exist for soybeans, potatoes, maize and vegetables, where production rank is greater than protein supply rank.
The data association and filtering techniques used to represent food supply data here can inform security and sustainability actions so that more biosecure utilisation of food across supply chains is achieved. This is developed further in Table 2, where the benchmark of protein supply is used to rank food categories and associate this with respective ranking of production (in tonnes) DSQ (in tonnes) and food loss (in tonnes). This provides an indication of how food moves within a supply system, and focusses on the identification of pressure points for national food balance with respect to production, food trade and food loss. The rank score of DSQ with respect to production rank score for a specific agricultural source category provides an indication of how reducing pressure points can deal with criticality with respect to imports while remaining dependent on exporting nations. For example, wheat and soybeans are ranked second and third for the supply of protein in Japan (Table 2), but their production rank is considerably lower, i.e., 19 and 34 respectively. This is ameliorated by imports because the DSQ rank reduces this criticality to a rank score of 5 and 10 for wheat and soybeans. This is because the import of these materials reduces the criticality of protein supply for these food materials. It also means that the food system is dependent on continued trade. Japan is highlighted here because the national diet is often cited as being one of the healthiest national dietary balances. Seafood categories are always high value ranked with respect to protein supply, and national production is typically low; the criticality of this is not reduced by imports, because DSQ rank scores are still equivalent to those of production. This indicates that the demand for seafood categories is high, together with production and import. Such compounded criticality between protein supply and DSQ is less pronounced for poultry, pork and beef food material categories. This is apparent because the productivity of animal systems has increased in terms of the yield of food material per animal; this results in the reduction of criticality of supply [22]. Table 1 and Table 2 identify the protein value of crop and livestock products, and their reduced criticality is highly dependent on the productivity of livestock systems. This is particularly noted for dairy supply in the UK where milk protein supply rank is equivalent to that of production and DSQ. A notable opportunity for protein supply identified in Table 1 and Table 2 is for the vegetable category, where protein content is lower than livestock or small grains, but there is developing demand for plant-based proteins.
There are a growing number of livestock product alternatives that are protein fortified from across the vegetable and fruit categories [23]. The vegetable category is also a major source of food loss in Table 1 and Table 2; these observations are supported by recently-reported research [24]. Developing robust food loss data is a priority for the assessment of accurate supply chain food utilisation indices, and the Centreplate Model assessment identifies correlations between nationally reported data in FAOSTAT and studies that document food losses in vegetable supply chains. FAOSTAT data also reports zero food losses for UK milk categories excluding butter, although these data must be viewed with caution. It should be emphasised that the reported loss is from production to retailer functions, because milk products are identified as one of the most wasted food categories by consumers in the UK [25].
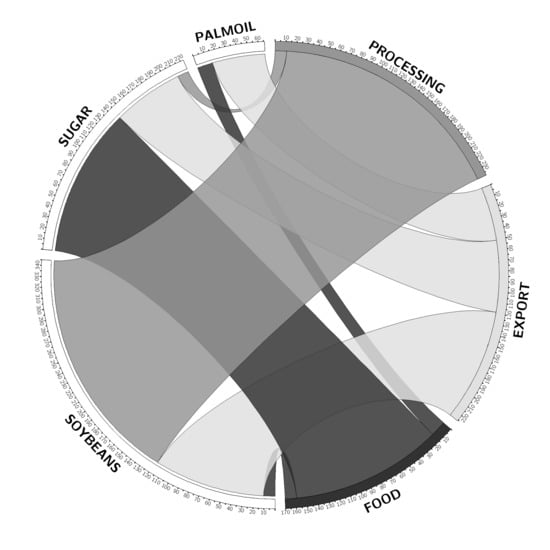
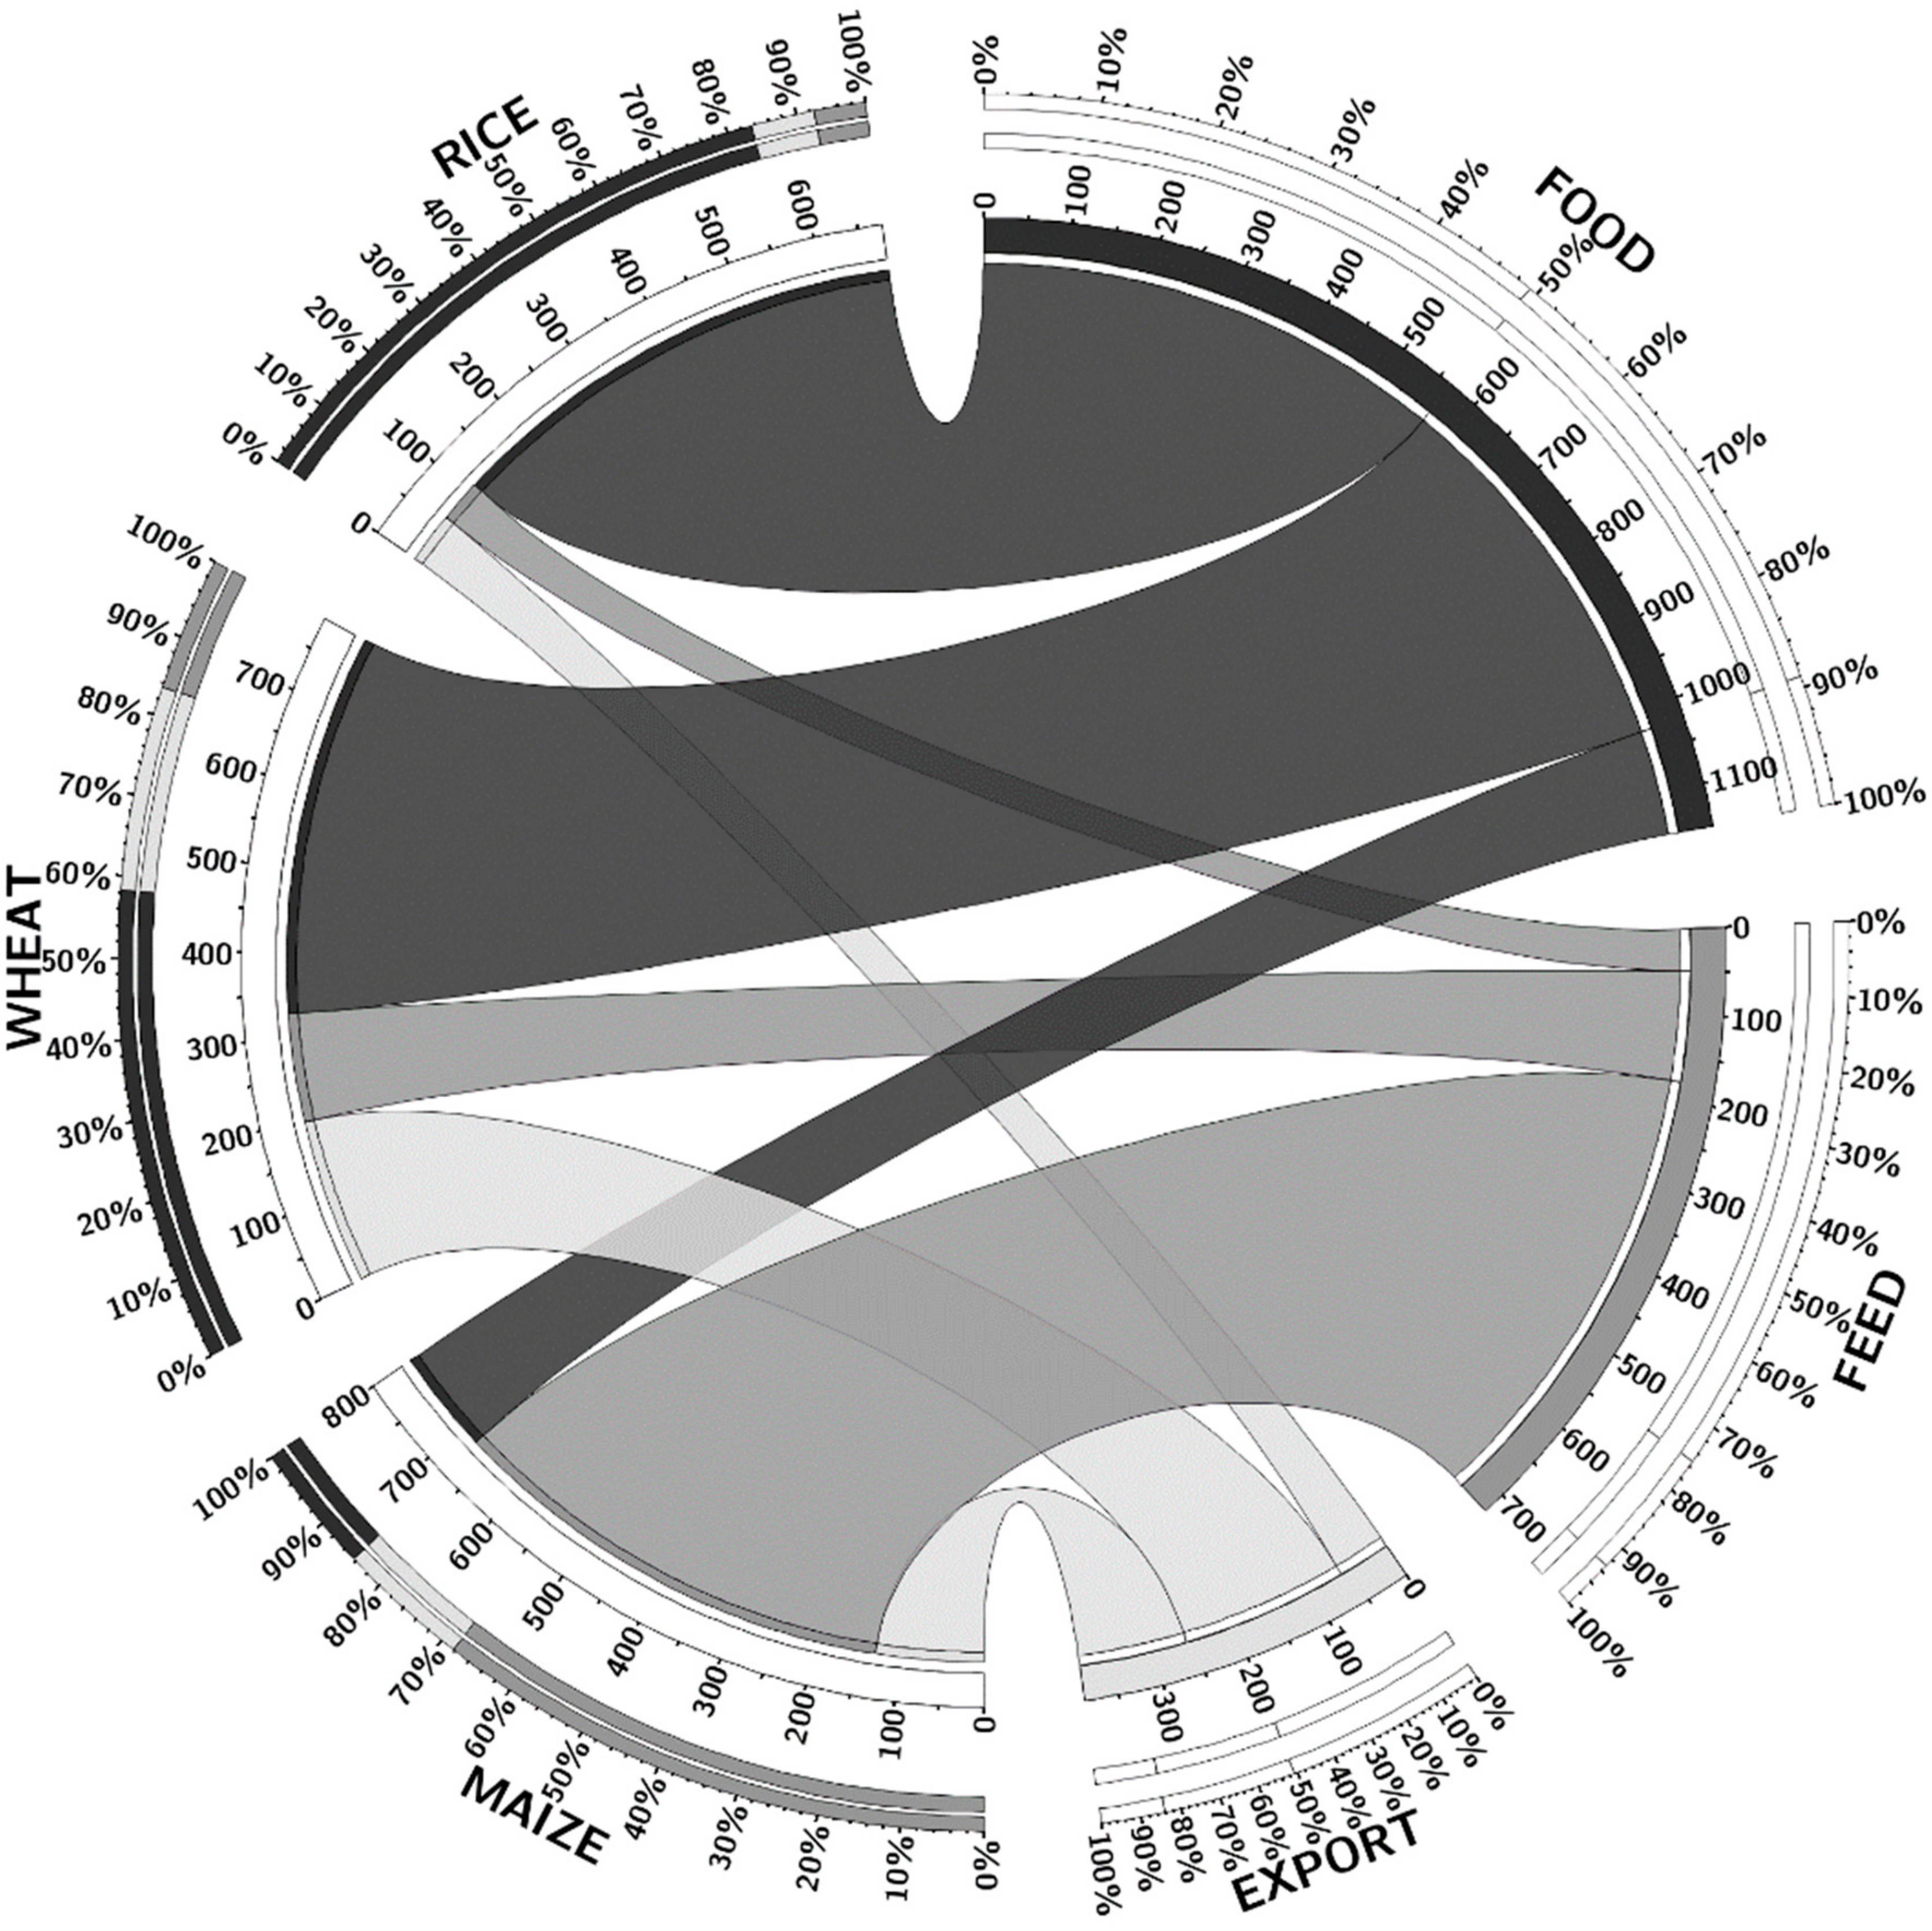
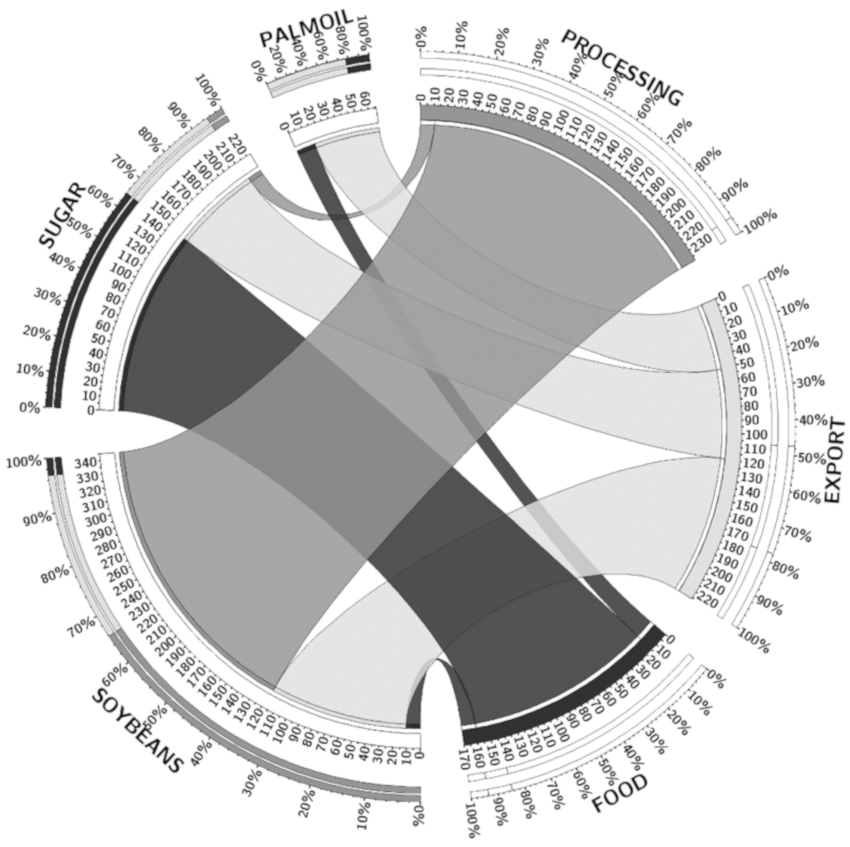
The development of statistical data for production and trade in this way ensures (1) that data is effectively mapped, (2) that data mapping will enable the identification of trends and pressure points; and (3) it enables the projection of biosecurity and food defence measures that can provide a more robust and sustainable food trading system. The association of global crop production data to food supply, feed supply and export using a chord diagram is shown in Figure 1 for maize, rice and wheat. Figure 2 shows a chord diagram of food supply, processing and export association with soybean, sugar (raw equivalent) and palm oil. These crops were selected by ranking food supply and export quantity of crop products across all global regions (Table 3). The use of regional classification provides the most likely highest ranked exported crops and those crops which are most important with respect to production. Rice, wheat and sugar were the highest order production crops for food supply, and were selected for the association assessment (Figure 1). In addition, soybeans, palm oil and maize were the highest order export crops, and were selected for the association assessment (Figure 2). Crop products were considered without livestock products in this test because of their requirement as feed.
Figure 1 shows a synteny graph for the FAOSTAT food commodity categories that have the greatest global production for feed and food; these are the cereals of wheat, rice and maize. Figure 1, shows 80% of rice production and 55% of wheat production enters supply chains for food, with wheat being an important export crop at 25% of production. Maize is a critical feed crop, with 75% being supplied as feed and the reminder shared equivalently between export and food. Figure 1 shows that rice and wheat are critical for food supply, with rice crops being produced and consumed where they are produced. Wheat is also important for direct food supply, but it accounts for 60% of the global export volume for these three cereals. Wheat is currently the critical pressure point for the export of cereals globally, but the major producers of wheat in China and India have changed this dynamic. This is because wheat improvement programmes in these nations have increased production, so there is less reliance on imported wheat. Even so, the export of wheat remains an important pressure point while global production continues to increase. Figure 2 shows a synteny graph for the greatest global export of additional crop categories. Figure 2 shows that 65% of soybeans are processed for oil and feed cakes; 176 million tonnes of feed cake was produced in 2013, corresponding to 63% of production. The remainder of soybean production is exported, with 8% entering food supply directly. Sugar crystals or as an ingredient (e.g., in syrups) is 65% supplied as food, and 30% of production is exported. Palm oil has 75% of it production exported, indicating that the production of palm oil is an important global pressure point because it is grown in specific regions [26].
4. Discussion
The associative techniques tested in this research identify that critical control is not only concerned with pressure points associated with the movement of resources within and across supply chains. It is also the nutritional quality of food materials that determines demand and value, even though they are rarely considered in trade data because of the importance of volume and price. Protein content is used as an indicator of the nutritional value of crops such as pulses and grains, and it is use here in the Centreplate Model to rank food materials for protein supply nationally (Table 2). It is the measurement of nutritional value and the risk of food being wasted that provide important outcomes for consumption, because if food is not utilised, any resources used to make it consumable are lost. It is the insight on the utilisation of foods by consumers that is the principle here, rather than sustainability, but the two are connected to make nutritional and waste universal impacts in this arena. In this study, the association with protein supply, as a nutritional benchmark, is tested, but the data available for the amount of food waste associated with food categories from FAOSTAT limits any further development of consumer waste risk indicators.
The nutritional value of foods have been integrated with GHG emissions using a nutrient density index for food groups; it provides important insights that are identified here with associations with protein supply [27]. When food groups are benchmarked by calorific content rather than protein, it provides important outcomes for improving vegetable processing. This is because products such as soups have some of the greatest GHG footprints per calorie of all food groups, but the greatest nutritional density. The issue is not uncommon for the fruit and vegetable group, where GHG footprints per calorie are increased; the same relationship is in place for benchmarking to protein content. The Centreplate Model highlights the facts that the vegetable food category is one that can be developed for the provision of protein, and the use of plant based diets is a significant consumer trend (Table 1 and Table 2) [28]. The benefits of using plant protein ingredients offer GHG emission reduction opportunities with nutritional benefits, but there remains the important requirement of improving material properties in manufactured products and taste in recipes [29]. Of course, this has been notoriously difficult to achieve with nations that have well developed food supply chains, including the USA and UK, who fail to meet even basic food consumption targets such as recommended daily amounts of fruit and vegetables [30]. These barriers are recognised, and there are multi-indicator methods that seek to guide and align food sustainability actions across different countries [31].
Multi-indicator methods identify that the focus on the right indicators for both security or sustainability is crucial; the typical approach is to focus on GHG emissions while other critical indicators are overlooked or over-discounted. Examples of this oversight are exposed in this research, which demonstrates the value of applying market and consumer data to food utilisation scenarios across several product categories. Real-time supply chain data is a future capability that can be provided by the application of cloud-based data transfer, which is secured by Distributed Ledger Technologies (DLTs) in the food industry. Even if the algorithms for assessing sustainability become relevant to supply chain partners, it is their communication that becomes key [29]. This is dependent on scaling data to the global food marketplace, where the ability to obtain verified and transparent data for products in these supply chains has previously limited sustainability assessments of consumer goods. This is now being overcome using technologies that tag products using data carriers such as optical characters and bar codes, which ensure that secure supply chain records are available. The application in sustainability is only beginning to be tested here; in the case of waste reduction, more efficient inventory planning will mean that quality is maximised and dramatic reductions in household food waste are observed. Of course, the data for consumer utilisation of food will still limit data in the supply chain; the use of digital applications associated with purchasing are already making such consumer feedback possible.
5. Conclusions
The metrics and algorithms used to associate different food categories are tested in this research, as they can provide communications that resonate with consumers. All external resources used to manufacture and distribute food focus on the final experience of consuming it, whether this is for fuel, enjoyment or any combination of both. The innovative approach to averting a resource crisis based on this research is to make sure that product fulfilment meets the sustainability requirement of food products. The methods demonstrated here highlight the potential supply restrictions to protein categories so that the responses of operations in food supply chains, whether they are in companies or regulatory roles, can be strengthened to provide the most proteins. This will ultimately improve the resilience of food supply in response to environmental, social and economic changes.
Author Contributions
For research articles with several authors, a short paragraph specifying their individual contributions must be provided. The following statements should be used “conceptualization, W.M.; methodology, W.M.; software, W.M.; validation, W.M., M.S. and S.C.; formal analysis, W.M.; investigation, W.M.; M.S. and S.C.; resources, W.M. and M.S.; data curation, W.M.; writing—original draft preparation, W.M.; writing—review and editing, W.M., M.S. and S.C.; visualization, W.M.; supervision, W.M.; project administration, W.M. and M.S.; funding acquisition, W.M. and M.S.”, please turn to the CRediT taxonomy for the term explanation. Authorship must be limited to those who have contributed substantially to the work reported. All authors have read and agreed to the published version of the manuscript.
Funding
This research and APC was funded by Global SCOPE project, funded by the University of Lincoln’s QR Global Challenges Research Fund allocation 2018/19.
Acknowledgments
W.M. and M.S. acknowledge the support of the Global Challenges Research Fund allocation 2018/19, University of Lincoln.
Conflicts of Interest
“The authors declare no conflict of interest.” “The funders had no role in the design of the study; in the collection, analyses, or interpretation of data; in the writing of the manuscript, or in the decision to publish the results”.
References
- Auestad, N.; Fulgoni, V.L. What Current Literature Tells Us about Sustainable Diets: Emerging Research Linking Dietary Patterns, Environmental Sustainability, and Economics. Adv. Nutr. 2015, 6, 19–36. [Google Scholar] [CrossRef]
- Van Ruth, S.M.; Huisman, W.; Luning, P.A. Food fraud vulnerability and its key factors. Trends Food Sci. Technol. 2017, 67, 70–75. [Google Scholar] [CrossRef]
- Soon, J.M.; Manning, L.; Smith, R. Advancing understanding of pinch-points and crime prevention in the food supply chain. Crime Prev. Community Saf. 2019, 21, 42–60. [Google Scholar] [CrossRef]
- Ingram, J.S.I.; Wright, H.L.; Foster, L.; Aldred, T.; Barling, D.; Benton, T.G.; Berryman, P.M.; Bestwick, C.S.; Bows-Larkin, A.; Brocklehurst, T.F.; et al. Priority research questions for the UK food system. Food Secur. 2013, 5, 617–636. [Google Scholar] [CrossRef] [Green Version]
- Martindale, W. Global Food Security and Supply; Wiley: New York, NY, USA, 2014; ISBN 9781118699287|9781118699324. [Google Scholar]
- Notarnicola, B.; Tassielli, G.; Renzulli, P.A.; Castellani, V.; Sala, S. Environmental impacts of food consumption in Europe. J. Clean. Prod. 2017, 140, 753–765. [Google Scholar] [CrossRef]
- White, J.C.; Gardea-Torresdey, J. Achieving food security through the very small. Nat. Nanotechnol. 2018, 13, 627–629. [Google Scholar] [CrossRef] [PubMed]
- Tu, C.; Suweis, S.; D’Odorico, P. Impact of globalization on the resilience and sustainability of natural resources. Nat. Sustain. 2019, 2, 283. [Google Scholar] [CrossRef]
- Ercsey-Ravasz, M.; Toroczkai, Z.; Lakner, Z.; Baranyi, J. Complexity of the international agro-food trade network and its impact on food safety. PLoS ONE 2012, 7, e37810. [Google Scholar] [CrossRef]
- Ingram, J.S.I.; Porter, J.R. Plant science and the food security agenda. Nat. Plants 2015, 1, 15173. [Google Scholar] [CrossRef]
- Chris, S.-W. UK’s CO2 Shortage Is a Total Disaster for Beer, Beef and Salad. 2018. Available online: https://www.wired.co.uk/article/carbon-dioxide-shortage-europe-beer-problems (accessed on 4 January 2019).
- Wood, S.A.; Smith, M.R.; Fanzo, J.; Remans, R.; DeFries, R.S. Trade and the equitability of global food nutrient distribution. Nat. Sustain. 2018, 1, 34. [Google Scholar] [CrossRef] [Green Version]
- Tyler, R.; Wang, N.; Han, J. Composition, Nutritional Value, Functionality, Processing, and Novel Food Uses of Pulses and Pulse Ingredients. Cereal Chem. 2017, 94, 1. [Google Scholar] [CrossRef]
- Emment, L. Courgette Crisis: Poor Spanish Weather Deprives UK of Green Vegetables. 2017. Available online: https://www.politico.eu/article/poor-spanish-weather-deprives-uk-of-green-vegetables (accessed on 27 February 2019).
- Financial Times. KFC’s UK chicken run caused by too many eggs in one basket. 2019. Available online: https://www.ft.com/content/9613f7c8-1870-11e8-9376-4a6390addb44 (accessed on 4 January 2019).
- Heasman, M.; Morley, A.S. Earning a Crust? A Review of Labour Trends in UK Food Manufacturing; Food Research Collaboration: London, UK; City University: London, UK, 2017. [Google Scholar]
- Piramuthu, S.; Farahani, P.; Grunow, M. RFID-generated traceability for contaminated product recall in perishable food supply networks. Eur. J. Oper. Res. 2013, 225, 253–262. [Google Scholar] [CrossRef]
- Francisco, K.; Swanson, D. The Supply Chain Has No Clothes: Technology Adoption of Blockchain for Supply Chain Transparency. Logistics 2018, 2, 2. [Google Scholar] [CrossRef] [Green Version]
- Pearson, S.; May, D.; Leontidis, G.; Swainson, M.; Brewer, S.; Bidaut, L.; Frey, J.G.; Parr, G.; Maull, R.; Zisman, A. Are Distributed Ledger Technologies the panacea for food traceability? Glob. Food Secur. 2019, 20, 145–149. [Google Scholar] [CrossRef]
- FAO. Japanese Food, a Global Model for Healthy Diets. 2019. Available online: http://www.fao.org/director-general/newsroom/news/detail/en/c/903066/ (accessed on 27 February 2019).
- Krzywinski, M.I.; Schein, J.E.; Birol, I.; Connors, J.; Gascoyne, R.; Horsman, D.; Jones, S.J.; Marra, M.A. Circos: An information aesthetic for comparative genomics. Genome Res. 2009, 19, 1639–1645. [Google Scholar] [CrossRef] [PubMed] [Green Version]
- Capper, J.L. Should we reject animal source foods to save the planet? A review of the sustainability of global livestock production. S. Afr. J. Anim. Sci. 2013, 43, 233–246. [Google Scholar] [CrossRef] [Green Version]
- Hoek, A.C.; Pearson, D.; James, S.W.; Lawrence, M.A.; Friel, S. Shrinking the food-print: A qualitative study into consumer perceptions, experiences and attitudes towards healthy and environmentally friendly food behaviours. Appetite 2017, 108, 117–131. [Google Scholar] [CrossRef]
- Porter, S.D.; Reay, D.S.; Bomberg, E.; Higgins, P. Avoidable food losses and associated production-phase greenhouse gas emissions arising from application of cosmetic standards to fresh fruit and vegetables in Europe and the UK. J. Clean. Prod. 2018, 201, 869–878. [Google Scholar] [CrossRef] [Green Version]
- Stenmarck, A.; Jensen, C.; Quested, T.; Moates, G.; Buksti, M.; Cseh, B.; Juul, S.; Parry, A.; Politano, A.; Redlingshofer, B. Estimates of European Food Waste Levels; IVL Swedish Environmental Research Institute: Stockholm, Sweden, 2016; ISBN 9188319016. [Google Scholar]
- Oosterveer, P. Promoting sustainable palm oil: Viewed from a global networks and flows perspective. J. Clean. Prod. 2015, 107, 146–153. [Google Scholar] [CrossRef]
- Drewnowski, A.; Rehm, C.D.; Martin, A.; Verger, E.O.; Voinnesson, M.; Imbert, P. Energy and nutrient density of foods in relation to their carbon footprint. Am. J. Clin. Nutr. 2015, 101, 184–191. [Google Scholar] [CrossRef]
- Cole, J.R.; McCoskey, S. Does global meat consumption follow an environmental Kuznets curve? Sustain. Sci. Pract. Policy 2013, 9, 26–36. [Google Scholar] [CrossRef] [Green Version]
- Sautron, V.; Péneau, S.; Camilleri, G.M.; Muller, L.; Ruffieux, B.; Hercberg, S.; Méjean, C. Validity of a questionnaire measuring motives for choosing foods including sustainable concerns. Appetite 2015, 87, 90–97. [Google Scholar] [CrossRef] [PubMed]
- Miller, V.; Yusuf, S.; Chow, C.K.; Dehghan, M.; Corsi, D.J.; Lock, K.; Popkin, B.; Rangarajan, S.; Khatib, R.; Lear, S.A. Availability, affordability, and consumption of fruits and vegetables in 18 countries across income levels: Findings from the Prospective Urban Rural Epidemiology (PURE) study. Lancet Glob. Health 2016, 4, e695–e703. [Google Scholar] [CrossRef] [Green Version]
- Chaudhary, A.; Gustafson, D.; Mathys, A. Multi-indicator sustainability assessment of global food systems. Nat. Commun. 2018, 9, 848. [Google Scholar] [CrossRef] [Green Version]
Figure 1.
Synteny assessment for rice, wheat and maize with food, feed and export mass (106 tonnes and ratio as a percentage of the total). The inner axis shows the amount of crop in million tonnes.yr−1 and the outer axis shows the proportion as a percentage. Plots developed using Circos Table Viewer v0.63-9 © 2008–2019 [21].

Figure 2.
Synteny assessment for palm oil, sugar (refined equivalent) and soybeans with food, processing and export mass (106 tonnes and ratio as a percentage of the total). The inner axis shows the amount of crop in million tonnes.yr−1 and the outer axis shows the proportion as a percentage. Plots made using Circos Table Viewer v0.63-9 © 2008–2019 [21].


Table 1.
The rank of protein supply for the global food system across different food material categories, the rank score of protein supply (g. capita−1.day−1) benchmarked against production and food loss rank scores. The data was obtained from FAOSTAT for 2013 categories. The rice category is for milled equivalent mass, milk mass excludes butter, and groundnuts are shelled equivalent mass. For the global production, ranked over 96 is zero and food loss ranked over 78 is zero, and therefore, not applicable (NA). The rank values have no units because they are ratios.
| Rank Value | |||
|---|---|---|---|
| Global Rank | Protein Supply g/Day/Capita | Production * | Food Loss |
| 1. Wheat and products | 15.87 | 5 | 6 |
| 2. Rice | 10.13 | 6 | 7 |
| 3. Milk | 8.22 | 4 | 8 |
| 4. Poultry | 5.16 | 17 | 46 |
| 5. Pork | 4.65 | 16 | 49 |
| 6. Vegetables, Other | 3.96 | 3 | 1 |
| 7. Maize and products | 3.58 | 2 | 3 |
| 8. Beed | 3.54 | 26 | 43 |
| 9. Eggs | 2.79 | 24 | 20 |
| 10. Pulses, Other and products | 2.25 | 35 | 27 |
| 11. Freshwater Fish | 2.04 | 31 | NA |
| 12. Potatoes and products | 1.5 | 7 | 4 |
| 13. Beans | 1.47 | 50 | 32 |
| 14. Soybeans | 1.35 | 8 | 18 |
| 15. Pelagic Fish | 1.14 | 36 | NA |
| 16. Groundnuts | 1.1 | 37 | 30 |
| 17. Offal, Edible | 1.1 | 55 | 60 |
Note: * The orange shading of production data shows points where production rank is lower than protein rank; green shading shows where production rank is greater than protein rank.
Table 2.
The national rank of protein supply for Japan and the United Kingdom (UK) across different food material categories, the rank score of protein supply (g. capita−1.day−1) benchmarked against production, DSQ and food loss rank order value. The data is obtained from FAOSTAT for 2013 categories. The rice category is for milled equivalent mass, milk mass excludes butter, and groundnuts are shelled equivalent mass. For Japan, production ranked over 63 is zero and food loss ranked over 33 is zero, and therefore, not applicable (NA). For the UK, production ranked over 44 is zero and food loss ranked over 22 is zero, and therefore, not applicable (NA). The rank values have no units because they are ratios.
| Rank Order Value | Rank Order Value | ||||||||
|---|---|---|---|---|---|---|---|---|---|
| Japan | Protein Supply g/Day/Capita | Production * | DSQ | Food Loss | UK 2013 | Protein Supply g/Day/Capita | Production * | DSQ | Food Loss |
| 1. Rice | 11.52 | 3 | 4 | 7 | 1. Wheat and products | 24.25 | 2 | 2 | 2 |
| 2. Wheat and products | 10.7 | 19 | 5 | 4 | 2. Milk | 19.05 | 1 | 1 | 0 |
| 3. Soybeans | 7.66 | 34 | 10 | 12 | 3. Poultry | 12.78 | 9 | 10 | 0 |
| 4. Milk | 7.19 | 2 | 3 | NA | 4. Pork | 7.12 | 14 | 14 | 0 |
| 5. Pelagic Fish | 7.18 | 8 | 9 | NA | 5. Beef | 6.45 | 13 | 18 | 0 |
| 6. Poultry | 6.95 | 9 | 13 | 15 | 6. Potatoes and products | 4.17 | 5 | 4 | 3 |
| 7. Eggs | 6.02 | 6 | 12 | 13 | 7. Eggs | 3.43 | 16 | 22 | 15 |
| 8. Pork | 5.6 | 10 | 11 | 14 | 8. Vegetables, Other | 2.34 | 7 | 6 | 1 |
| 9. Beef | 3.59 | 26 | 25 | 17 | 9. Demersal Fish | 2.2 | 24 | 28 | 0 |
| 10. Demersal Fish | 3.33 | 25 | 31 | NA | 10. Oats | 1.59 | 12 | 23 | 16 |
| 11. Vegetables, Other | 3.05 | 1 | 2 | 1 | 11. Mutton and Goat Meat | 1.51 | 21 | 33 | 0 |
| 12. Marine Fish, Other | 2.3 | 35 | 34 | NA | 12. Pelagic Fish | 1.49 | 22 | 32 | 0 |
| 13. Freshwater Fish | 1.75 | 32 | 37 | NA | 13. Meat, Other | 1.42 | 42 | 52 | 0 |
| 14. Cephalopods | 1.54 | 31 | 40 | NA | 14. Rice | 1.28 | NA | 31 | 0 |
| 15. Offal, Edible | 1.36 | 30 | 45 | NA | 15. Groundnuts | 1.23 | NA | 51 | 19 |
| 16. Peas | 1.2 | 31 | 47 | 20 | |||||
| 17. Beer | 0.96 | 6 | 7 | 0 | |||||
Note: * The orange shading of production data shows points where production rank is lower than protein rank; green shading shows where production rank is greater than protein rank.
Table 3.
The regional global rank order value of primary crop production and export.
| Food Supply Quantity 2013 | Export Quantity 2013 | ||||
|---|---|---|---|---|---|
| Region | Item | Million Tonnes | Region | Item | Million Tonnes |
| Asia | Rice (Paddy Equivalent) | 497 | Americas | Soybean | 102 |
| Asia | Rice (Milled Equivalent) | 332 | Europe | Wheat and products | 91 |
| Asia | Wheat and products | 268 | Americas | Maize and products | 78 |
| Europe | Wheat and products | 81 | Americas | Wheat and products | 63 |
| Asia | Sugar ingredients, Raw Equivalent inverted sugar and syrups | 75 | Americas | Soybean Cake | 46 |
| Asia | Sugar crystalline (Raw Equivalent) | 66 | Asia | Rice (Paddy Equivalent) | 46 |
| Asia | Sugar, Refined Equivalent | 60 | Asia | Palm Oil | 45 |
| Americas | Wheat and products | 59 | Americas | Sugar ingredients, Raw Equivalent inverted sugar and syrups | 41 |
| Americas | Sugar, Raw Equivalent | 48 | Europe | Maize and products | 40 |
| Africa | Wheat and products | 47 | Americas | Sugar crystalline (Raw Equivalent) | 38 |
© 2020 by the authors. Licensee MDPI, Basel, Switzerland. This article is an open access article distributed under the terms and conditions of the Creative Commons Attribution (CC BY) license (http://creativecommons.org/licenses/by/4.0/).
Share and Cite
MDPI and ACS Style
Martindale, W.; Swainson, M.; Choudhary, S. The Impact of Resource and Nutritional Resilience on the Global Food Supply System. Sustainability 2020, 12, 751. https://0-doi-org.brum.beds.ac.uk/10.3390/su12020751
AMA Style
Martindale W, Swainson M, Choudhary S. The Impact of Resource and Nutritional Resilience on the Global Food Supply System. Sustainability. 2020; 12(2):751. https://0-doi-org.brum.beds.ac.uk/10.3390/su12020751
Chicago/Turabian StyleMartindale, Wayne, Mark Swainson, and Sonal Choudhary. 2020. "The Impact of Resource and Nutritional Resilience on the Global Food Supply System" Sustainability 12, no. 2: 751. https://0-doi-org.brum.beds.ac.uk/10.3390/su12020751
Note that from the first issue of 2016, this journal uses article numbers instead of page numbers. See further details here.