Article

Efficacy of Supplemental Irrigation and Nitrogen Management on Enhancing Nitrogen Availability and Urease Activity in Soils with Sorghum Production

1
United States Department of Agriculture, Agricultural Research Service, Coastal Plains Soil, Water, and Plant Research Center, Florence, SC 29501, USA
2
Retired Agronomist, USDA-ARS, Florence, SC 29501, USA
*
Author to whom correspondence should be addressed.
Sustainability 2020, 12(20), 8358; https://doi.org/10.3390/su12208358
Submission received: 31 August 2020 / Revised: 2 October 2020 / Accepted: 6 October 2020 / Published: 12 October 2020

Abstract

:
The soil nitrogen (N) availability and urease activity (UA) in a humid ecosystem with variable rainfall distribution and poor soil fertility are not well understood. A complete appreciation of N cycling in the soil–water–plant continuum is needed to better manage N and water in regions that will be strongly affected by climate change. A sorghum (Sorghum bicolor L.) study located in Florence, South Carolina, USA, was conducted using a variable-rate pivot system. We hypothesized that supplemental irrigation (SI) and N would enhance UA and N uptake while minimizing the concentration of N in porewater (TINW). The aim of the study was to assess the impact of SI (0, 50, and 100%) and N fertilization (0, 85, and 170 kg N ha−1) on: UA; total N (TNS); total inorganic N (TINS); TINW; and N uptake of sorghum. Results support our research hypothesis. The greatest UA was from 0% SI and 170 kg ha−1 (18.7 µg N g−1 ha−1). Porewater N (mg L−1), when averaged across SI and N showed a significantly lower concentration at lower soil depth (9.9 ± 0.7) than the upper depth (26.1 ± 2.4). The 100% SI had the greatest biomass N uptake (NUPB) of 67.9 ± 31.1 kg ha−1 and grain N uptake (NUG) of 52.7 ± 20.5 kg ha−1. The greatest NUPB (70.9 ± 30.3 kg ha−1) and NUG (55.3 ± 16.5 kg ha−1) was from the application of 170 kg N ha−1. Overall, results showed that proper use of water and N enhanced soil N dynamics, and improved biomass productivity and N uptake of sorghum.

1. Introduction

Sorghum (Sorghum bicolor, L.) production in the southeastern Coastal Plain region of the USA is becoming problematic because of the vastly variable climate along with the low water holding capacity and low fertility of the soils. The present and future climate alterations in this region could have the potential to significantly modify the cultural settings for sorghum production, with important implications of irrigation and nutrient management. The likely financial return from sorghum production may hinge on the water supply, soil productivity, and other inputs (i.e., fertilizers) that farmers are adding to the field. Hence, the efficient use of N fertilizers has major consequence in crop sustainability and productivity [1,2]. For example, Sinclair and Ruffy [3] concluded that the major management drivers that improved crop yield are availability of water and soil N. Similarly, Gonzales-Dugo et al. [4] claimed that water supply and N availability can be modified by farmers to control plant growth. There has been a mounting awareness in reducing and enhancing irrigation technology due to current water scarcity in agricultural domains because of the current variable climate [1,5,6].
Recently, there are qualms on the accessibility of water and N, as well as the influence of agricultural practices on the environment, such as NO3 leaching due to lopsided application of N [7,8,9,10]. On the other hand, improved water and N uptake by crops, along with efficient irrigation will diminish nutrient leaching [1,7]. Katterer et al. [11] claimed that while reducing environmental pollution risk, the proper application of irrigation water and N fertilizer have dual roles of increasing water and N productivity. In some light-textured soils, the intensive use of fertilizer may lead to NO3 leaching. The development of best management strategy that maximizes usage of N and water and enhances enzyme activity in the soil will be critical to accomplishing environmental sustainability and agricultural productivity in humid regions [12].
Results have been mixed and still unreliable on how changes in climate could affect the use of irrigation water by agricultural producers [13,14]. A review paper published by McDonald and Girvetz [13] is quite disturbing because of potential challenges for the U.S. irrigation usage due to climate change namely: (i) Increasing the irrigated area in wet states and (ii) increasing irrigation rates in dry states. Despite the variety of methods and established protocols to schedule irrigation, farmer acceptance of irrigation scheduling practice is still limited because of recent rainfall variability making it more difficult to adequately accommodate the planning of irrigation calendar in humid Coastal Plain region [15,16].
While several researches have been conducted to assess the impact of N application on crop yield and nutrient balance in the soil [17], relatively few efforts have been extended to measure N availability, soil enzymes (e.g., urease) activities, N uptake, N loss, and crop efficiency in humid regions. Moreover, as the availability of irrigation water decreases along with potential high costs of operation and increase regulation of N usage, there is a dire necessity to better understand how irrigation levels interact with N fertilizer rates that led us to our research hypothesis. We hypothesized that supplemental irrigation in combination with N application would enhance UA, N availability, N uptake, and sorghum yield while minimizing the concentration of N in soil porewater. Furthermore, supplemental irrigation in combination with N application could significantly influence the final quality and the characteristics of the harvested cereal, affecting both post-harvest [18], and successive transformation processes (such as the milling [19] and kneading processes ([20,21]). The aim of our study was to evaluate the efficacy of SI (0, 50, and 100% of the full irrigation rate) and application of N (0, 85, and 170 kg N ha−1) on UA, total soil N (TNS), total soil inorganic N (TINS), porewater N (TINW), N uptake in biomass (NUPB), and N uptake in grain (NUG) of sorghum (Sorghum bicolor L.).

2. Materials and Methods

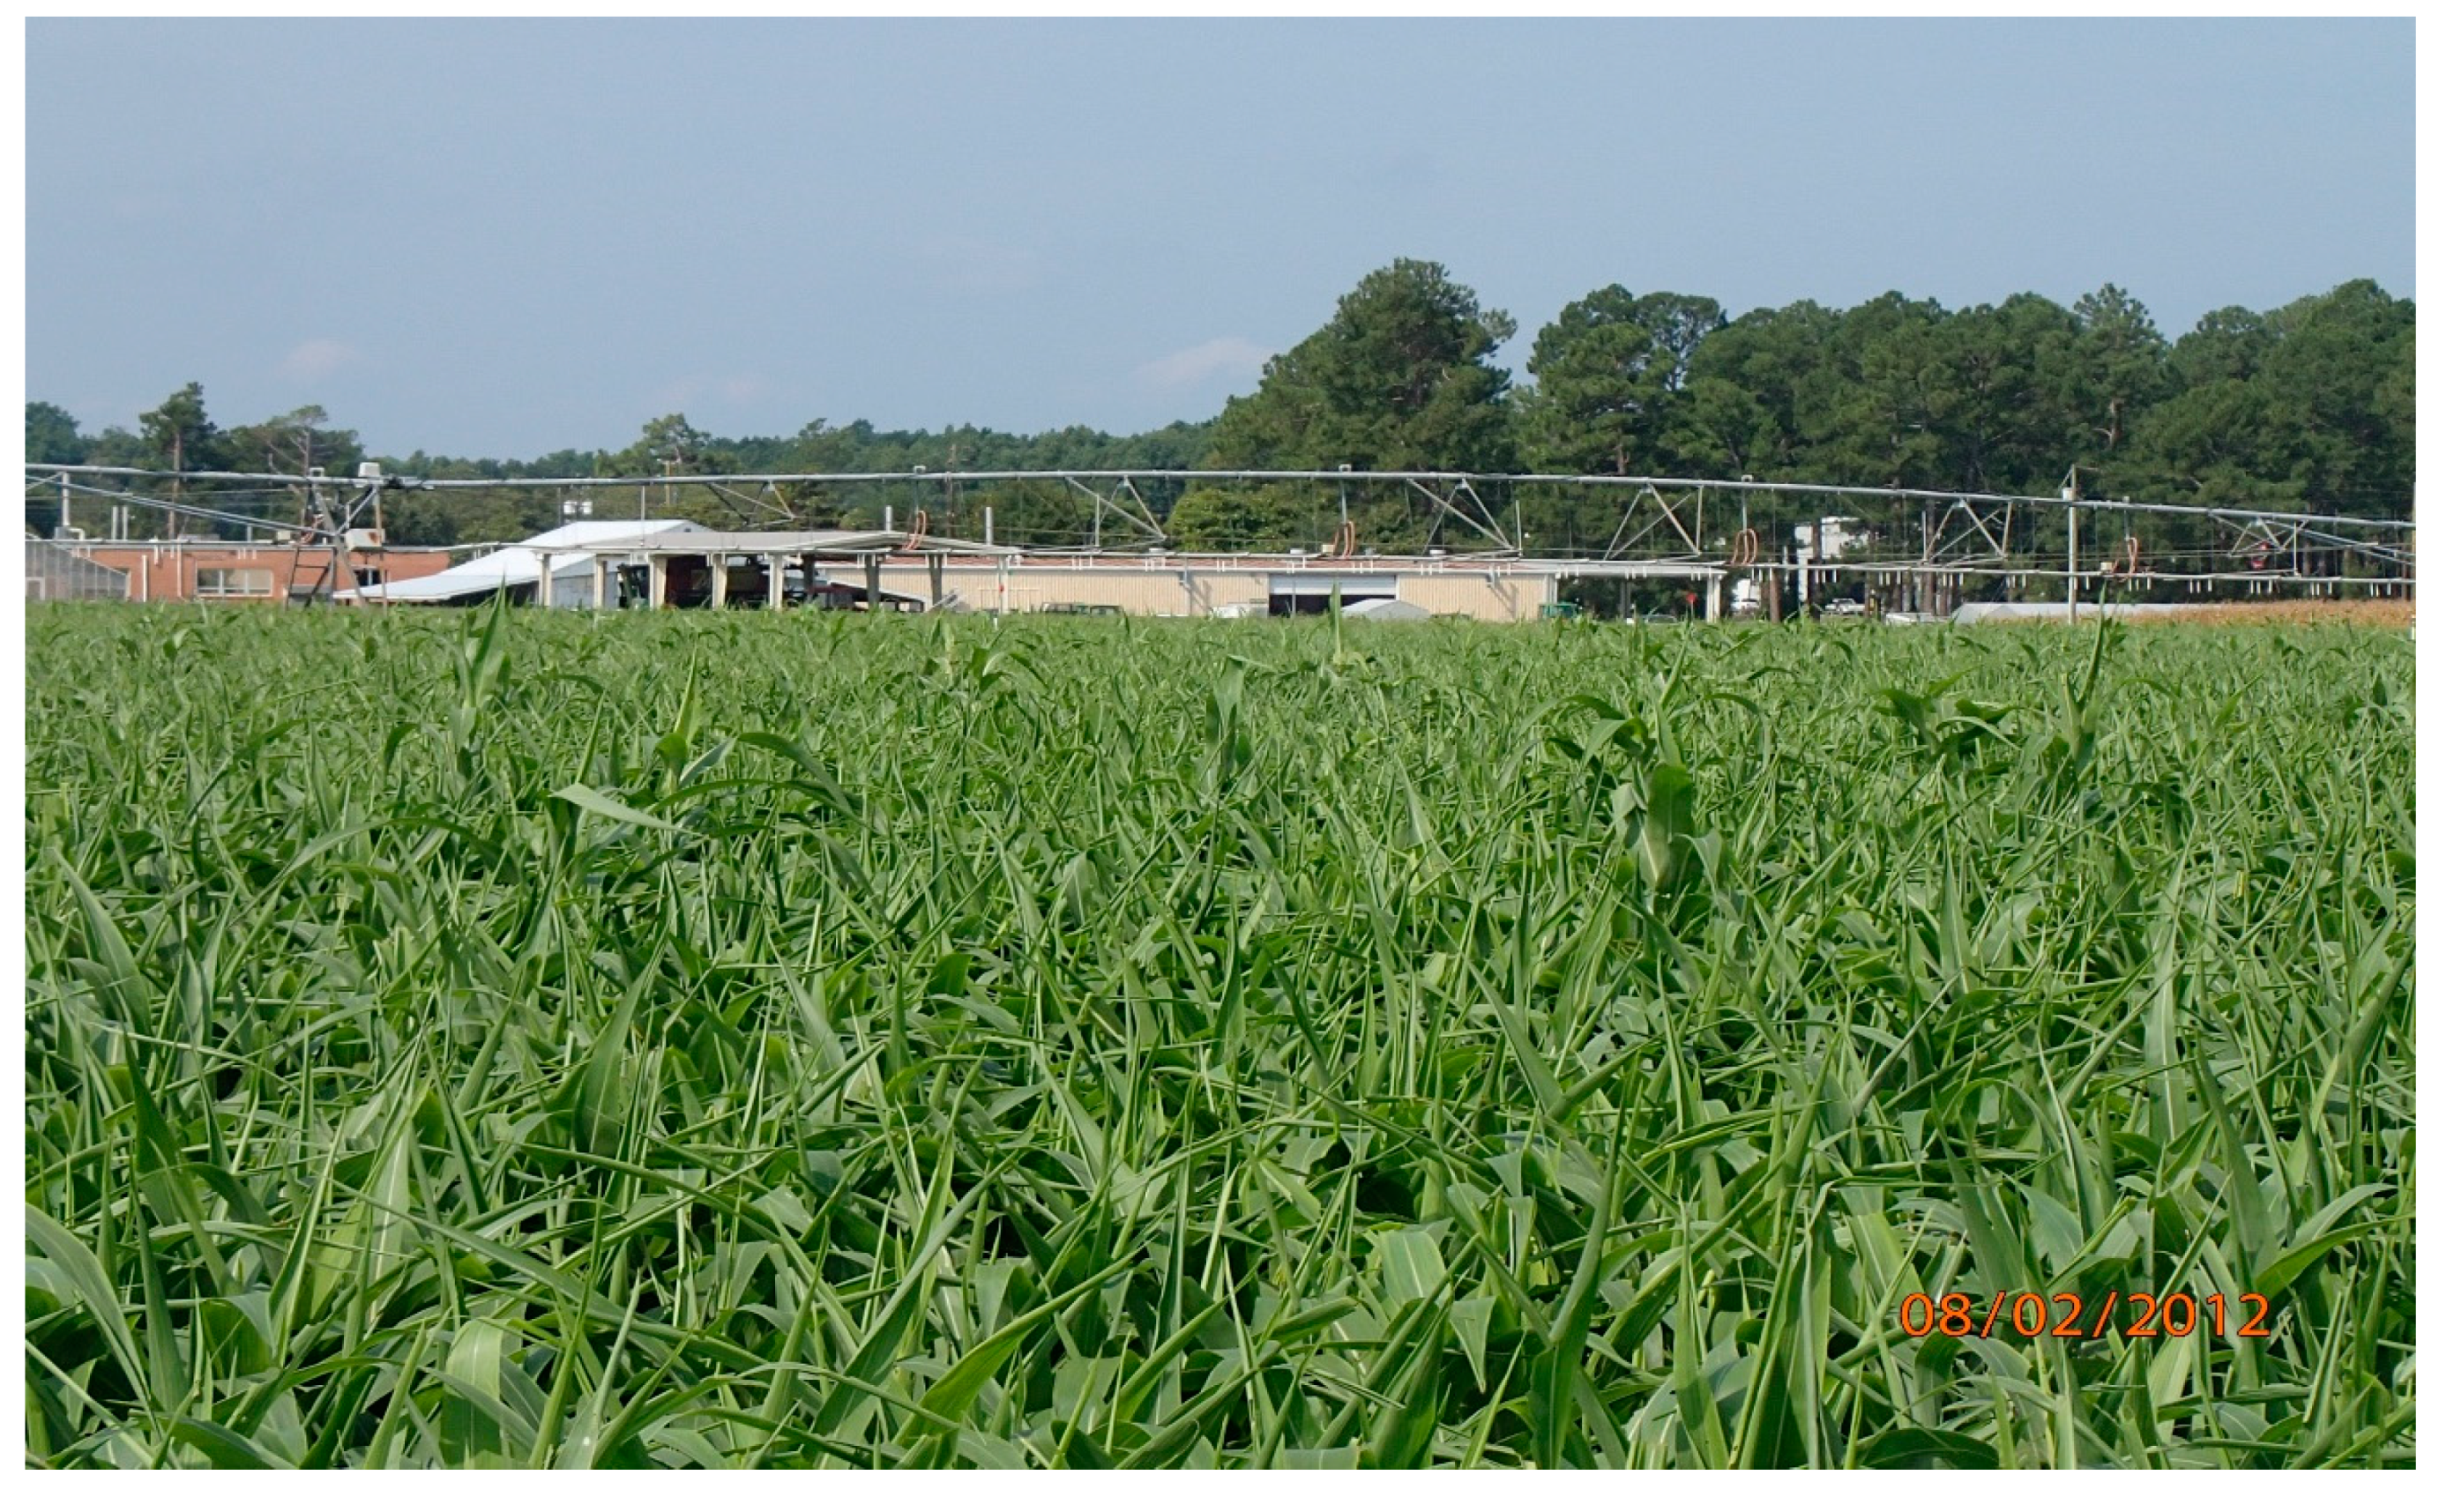
2.1. Site Description and Experimental Treatments

A field study was conducted under a variable-rate center pivot irrigation system in Florence, South Carolina, USA from 2013 to 2014 (Figure 1). Each year, the field was applied with “Glyphosate” and “Roundup” to control weeds. “Clarity” (1.12 kg ai ha−1) and “Atrazine” (2.8 kg ai ha−1) were also applied in the field for weed control two days after the emergence of grain sorghum in 2013 and 2014, respectively. Sorghum variety (Dekalb A571) was planted with 10 cm between plants and 75 cm between rows (272,277 seeds per hectare). Sorghum seeds were planted on 7 July 2013 and 18 June 2014. The soil type at the study site is a Norfolk sandy loam (fine-loamy, kaolinitic, thermic Typic Kandiudults). Table 1 showed some selected physical and chemical properties of the Norfolk soils. Figure 2 shows the average monthly rainfall distribution at the study site in 2013 and 2014.
Experimental treatments in split-split plot arrangement were consisted of three levels of SI (0%, 50%, and 100% of full irrigation rate), three application rates of N (0, 85, and 170 kg N ha−1), and two soil depths (0–15 cm and 15–30 cm) for two years with four replications. Main plots (27 m × 13 m) was the SI levels and subplots were the rates of N and soil depths. Each subplot was about 9 m wide and about 13 m long. The supplemental irrigation and N management treatments are described below.

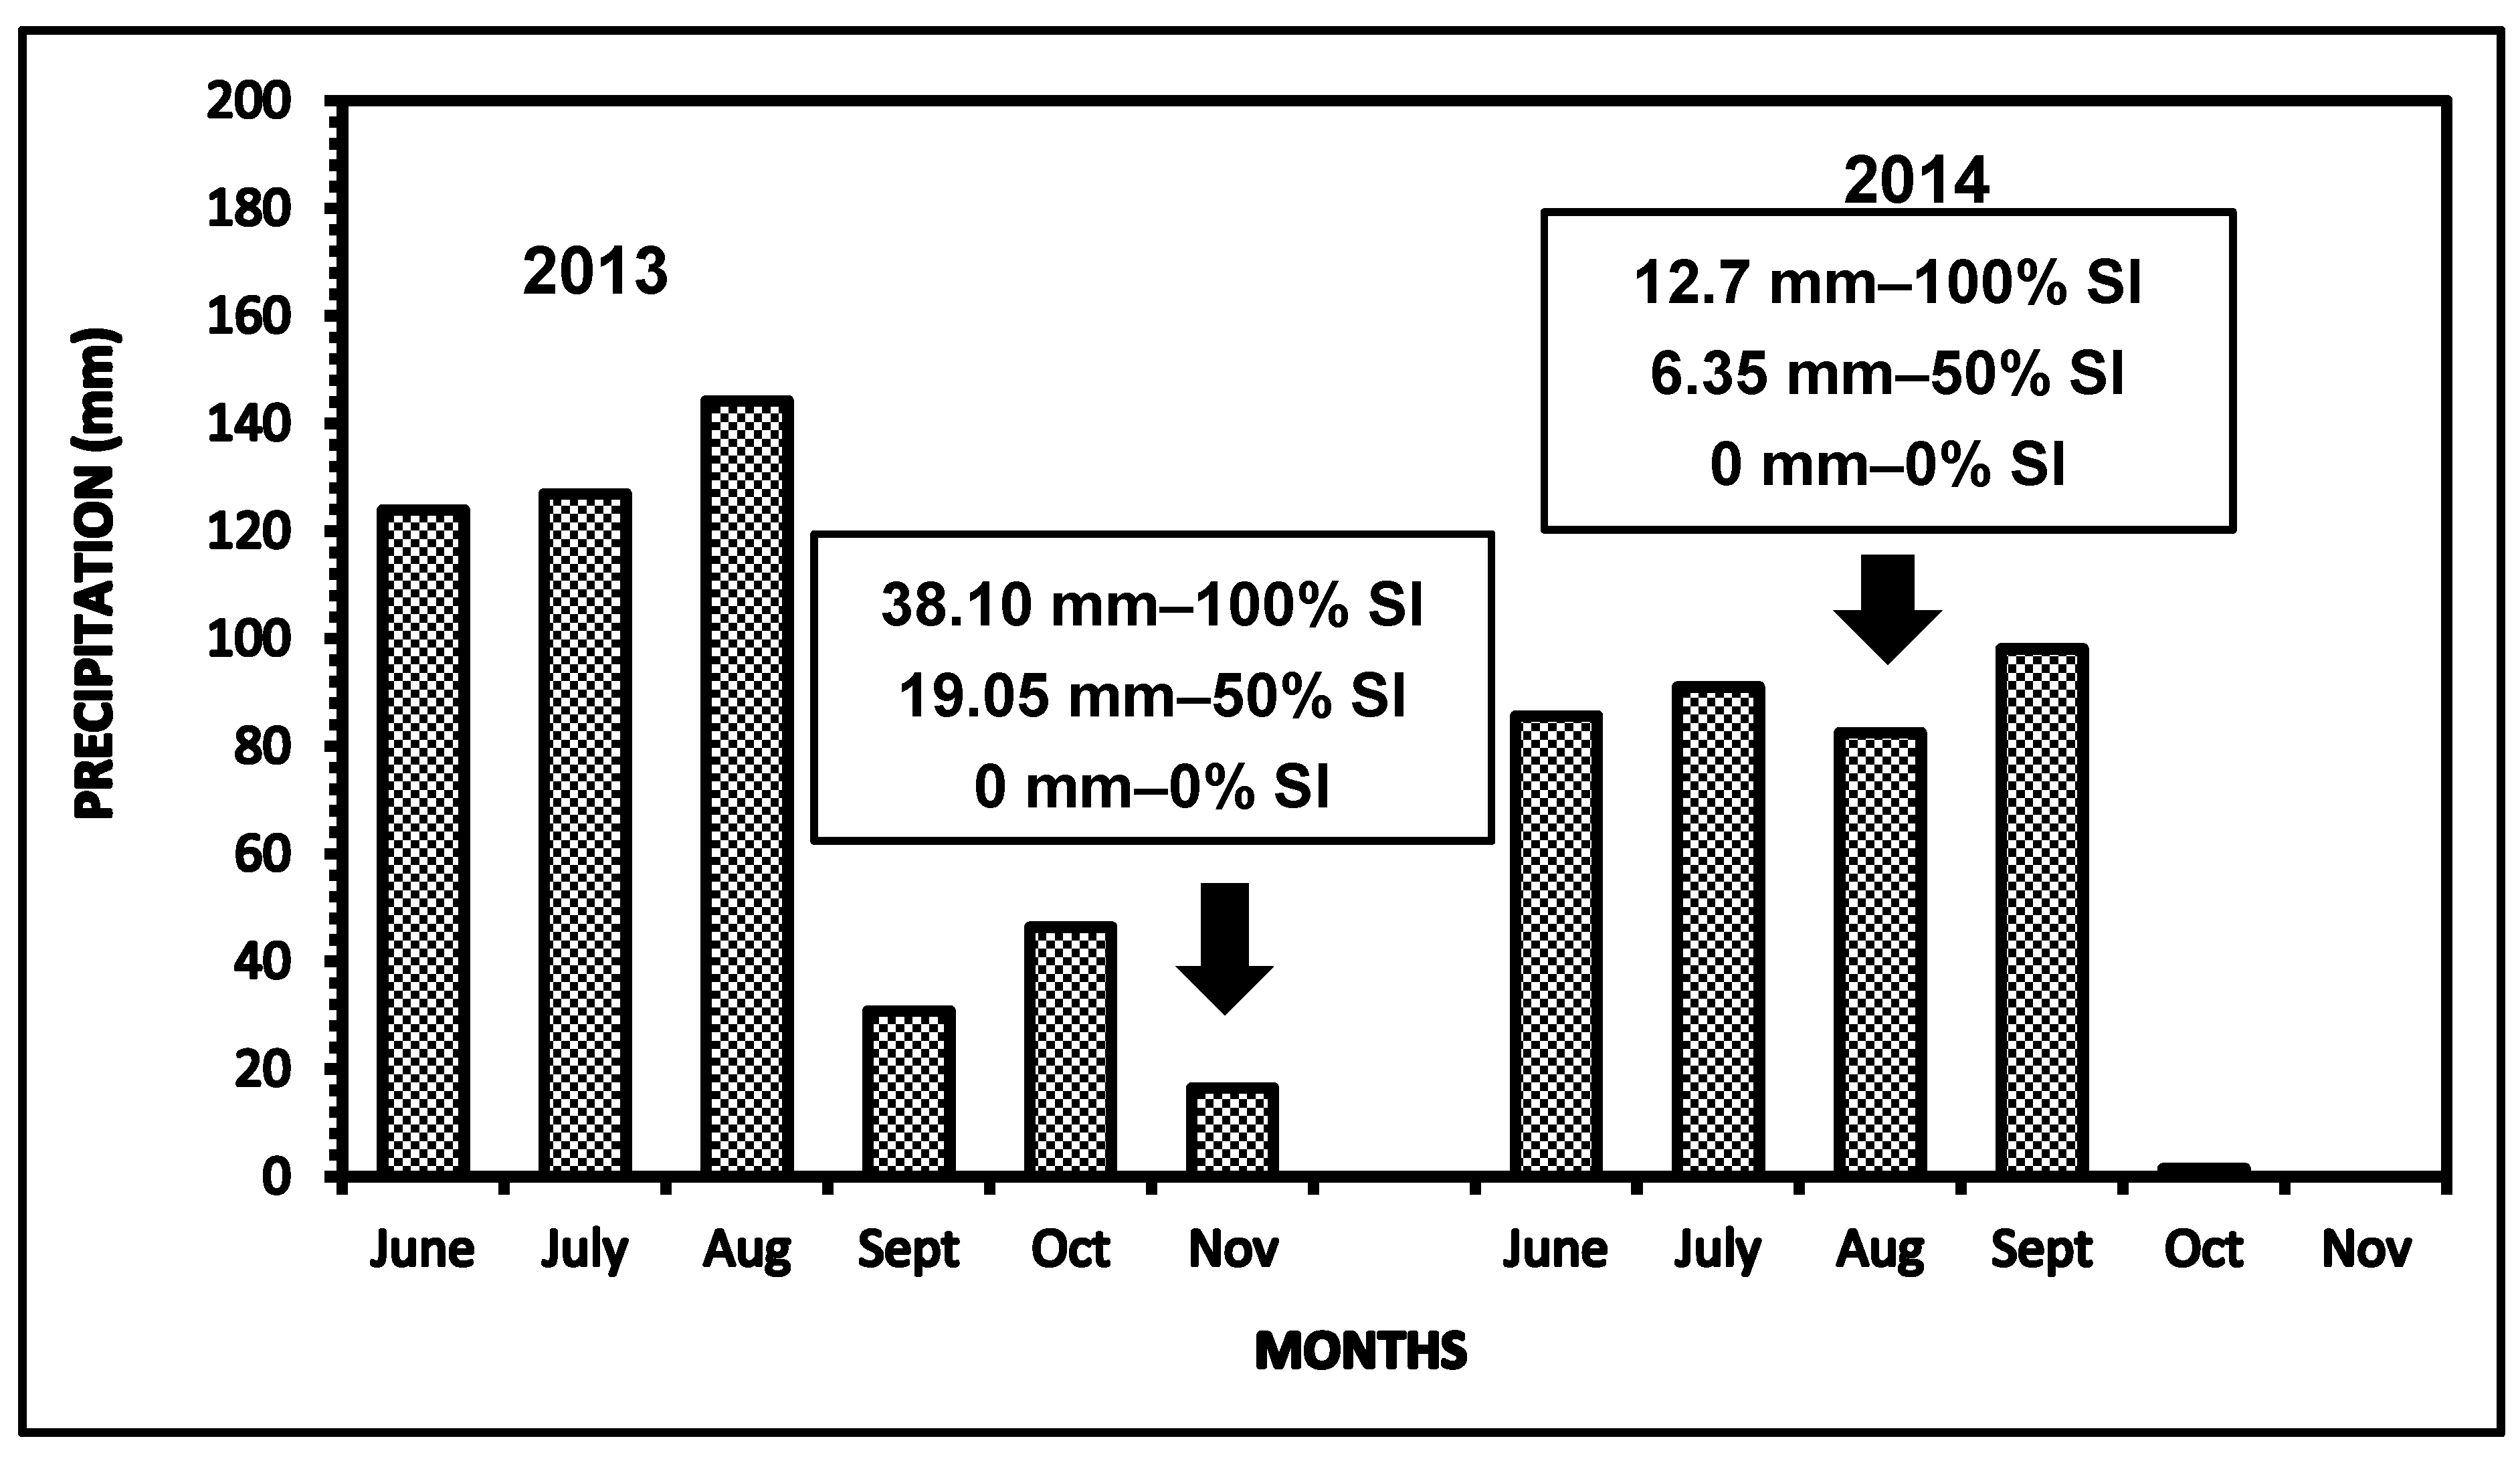
2.2. Supplemental Irrigation Management

A center pivot irrigation system was used to perform the supplemental irrigation management treatment. Details concerning operation of the center pivot irrigation system are found in the early paper of Sigua et al. [7] and Omary et al. [22]. The SI treatments were consisted of non-irrigated (0%), limited irrigation (50%), and full irrigation (100%) rates. Figure 2 shows the amount of supplemental irrigation applied in the field based on the precipitation data in 2013 and 2014.

2.3. Nitrogen Management

The N applications consisted of 0, 85, and 170 kg ha−1 was based on a sorghum yield goal potential ranging from 5380 kg ha−1 (80 bushels acre−1) to 8070 kg ha−1 (120 bushels acre−1). Nitrogen was applied using the center-pivot irrigation system by injecting urea and ammonium nitrate (30%) into the incoming water stream. Nitrogen applications were applied with the minimal water application depths to minimize irrigation water applications to non-irrigated plots. For this experiment, all N was delivered with 1.8 mm irrigation depth operating at a 100% duty cycle. Phosphorus (P) and potassium (K) containing fertilizers were applied to all subplots at the rate of 34 and 28 kg P2O5 ha−1 and 90 and 67 kg K2O ha−1 in 2013 and 2014, respectively.

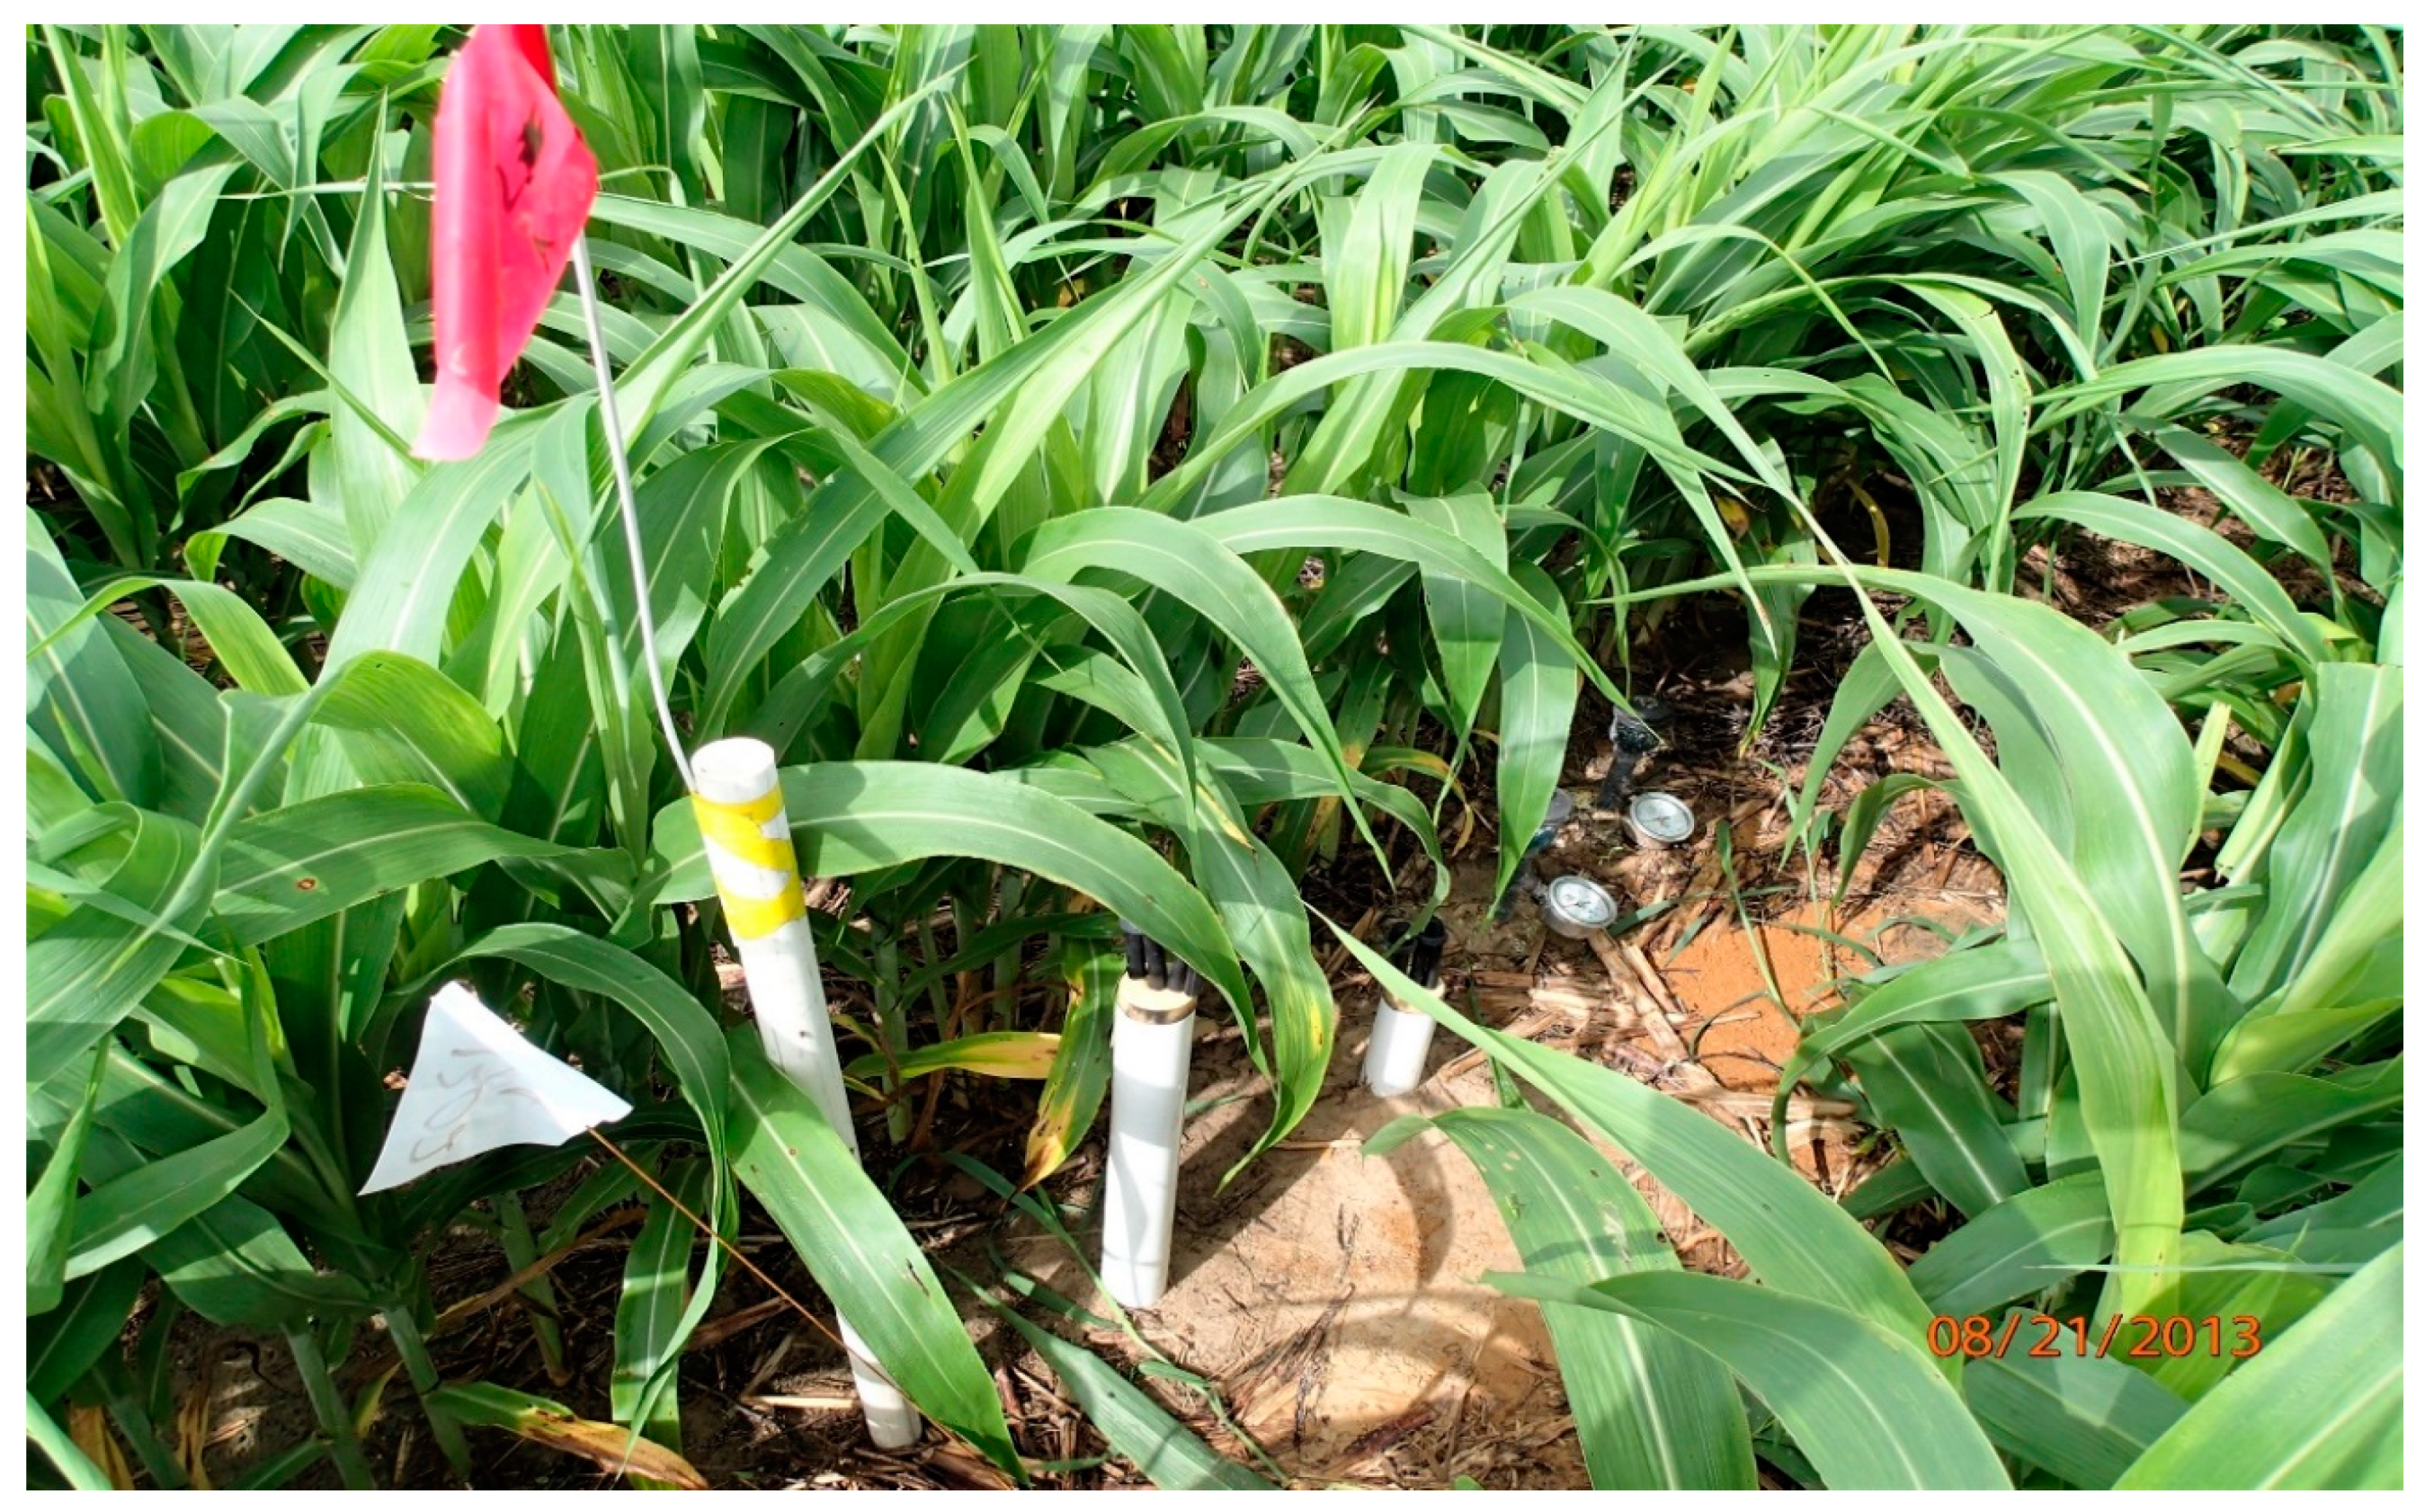
2.4. Suction Lysimeters and Soil Moisture Tensiometers Installations

Installation of lysimeters and soil moisture tensiometers was reported in earlier work of Sigua et al. [1]. The procedure reported in Figure 3 could be summarized as follows. Each plot was instrumented with suction lysimeters (Soil Moisture Equipment Corp., Model 1900, Santa Barbara, CA, USA) installed at 30.5 cm and 91.4 cm soil depth. The site was cored to a depth of 46 cm and 107 cm using a 10.2-cm soil auger and sieved through a 0.6-cm mesh screen to removed rock fragments. Subsequently, a bentonite clay was added into the hole followed by silica sand layer of about 15.2 cm. Soil moisture tensiometer (Soil Moisture Equipment Corp., Santa Barbara, CA, USA) was installed at soil depths of 30 cm and 60 cm, respectively. The suction lysimeters were inserted into the hole and backfilled slowly with the screened soil materials, followed by slow tamping using a metal rod around the hole to prevent surface water from channeling down between the soil and the body of the sampler. Measurements of soil moisture were repeated three times each week.

2.5. Collection and Analyses of Porewater Samples

Details concerning porewater sample collection from suction lysimeter using a flask with a two-hole rubber stopper are found in an early published paper of Sigua et al. [1,7]. Porewater samples were transported to the laboratory following collection and refrigerated at 4 °C. Samples were filtered using a 0.2 µm nylon filter. Porewater samples were analyzed for soluble nitrate (NO3) and ammonium (NH4) following the procedures outlined in ASTM International [23,24] using an Ion Chromatography (IC, Dionex IC-2000, Dionex Corp., Sunnyvale, CA, USA).

2.6. Sampling and Analyses of Soil (TNS, TINS, and UA) and Plant Samples

Soil samples were collected at three growth stages of sorghum namely 30, 60, 90 days after planting (DAP) from 0–15 and 15–30 cm soil depths. A total of 432 soil samples were collected from 2013 to 2014. Soil samples during each collection date (i.e., 30, 60, and 90 DAP) were air-dried and passed through a 2-mm mesh sieve. The concentration of TN in the soil was analyzed using the Elementar®®® Carbon-Nitrogen-Sulfur (CNS) Analyzer. The water-soluble concentration of ammonium (NH4) and nitrate (NO3) was extracted with deionized distilled water (1:5 soil: DI) and were analyzed following the procedures outlined in ASTM International [19,20] using an Ion Chromatography (IC, Dionex IC-2000, Dionex Corp., Sunnyvale, CA., USA). The concentration of the urease enzyme (UA) in the soil was analyzed following the procedures described by Kandeler and Gerber [25]. Plant aboveground biomass (PB) and grain (G) of sorghum at maturity (90 DAP) were ground to pass through a 1-mm mesh screen using a Wiley mill. An Elementar CNS analyzer was used to analyze the total concentration of N (%) in plant biomass and grain samples. Nitrogen uptake (NU) was calculated using equations 1 and 2 below.
NUPB = [Concentration of Total Nitrogen in Biomass, CTNB] × PBY
NUG = [Concentration of Total Nitrogen in Grain, CTNG] × GY
where NUPB = nitrogen uptake (kg ha−1) of plant aboveground biomass; NUG = grain (G) uptake (kg ha−1); CTNb = concentration of N (%) in plant aboveground biomass; CTNg= concentration of N (%) in grain; PBY = aboveground biomass yield (kg ha−1); and GY grain yield (kg ha−1).

2.7. Data Reduction and Statistical Analysis

Nitrogen concentration in the soils (TNS and TINS), porewater (TINW), and urease activity (UA) were analyzed with a multi-way ANOVA using the PROC GLM [26] based on four sources of variation namely: (i) Year (Y); (ii) supplemental irrigation (SI); (iii) nitrogen (N); and (iv) soil depth (SD). The effects of Y, SI, and N on N uptake (NUPB and NUG) of sorghum were analyzed with three-way ANOVA using PROC GLM model [26]. Means of Y, SI, N, and SD were separated using the Least Significance Difference Test (LSD).

3. Results

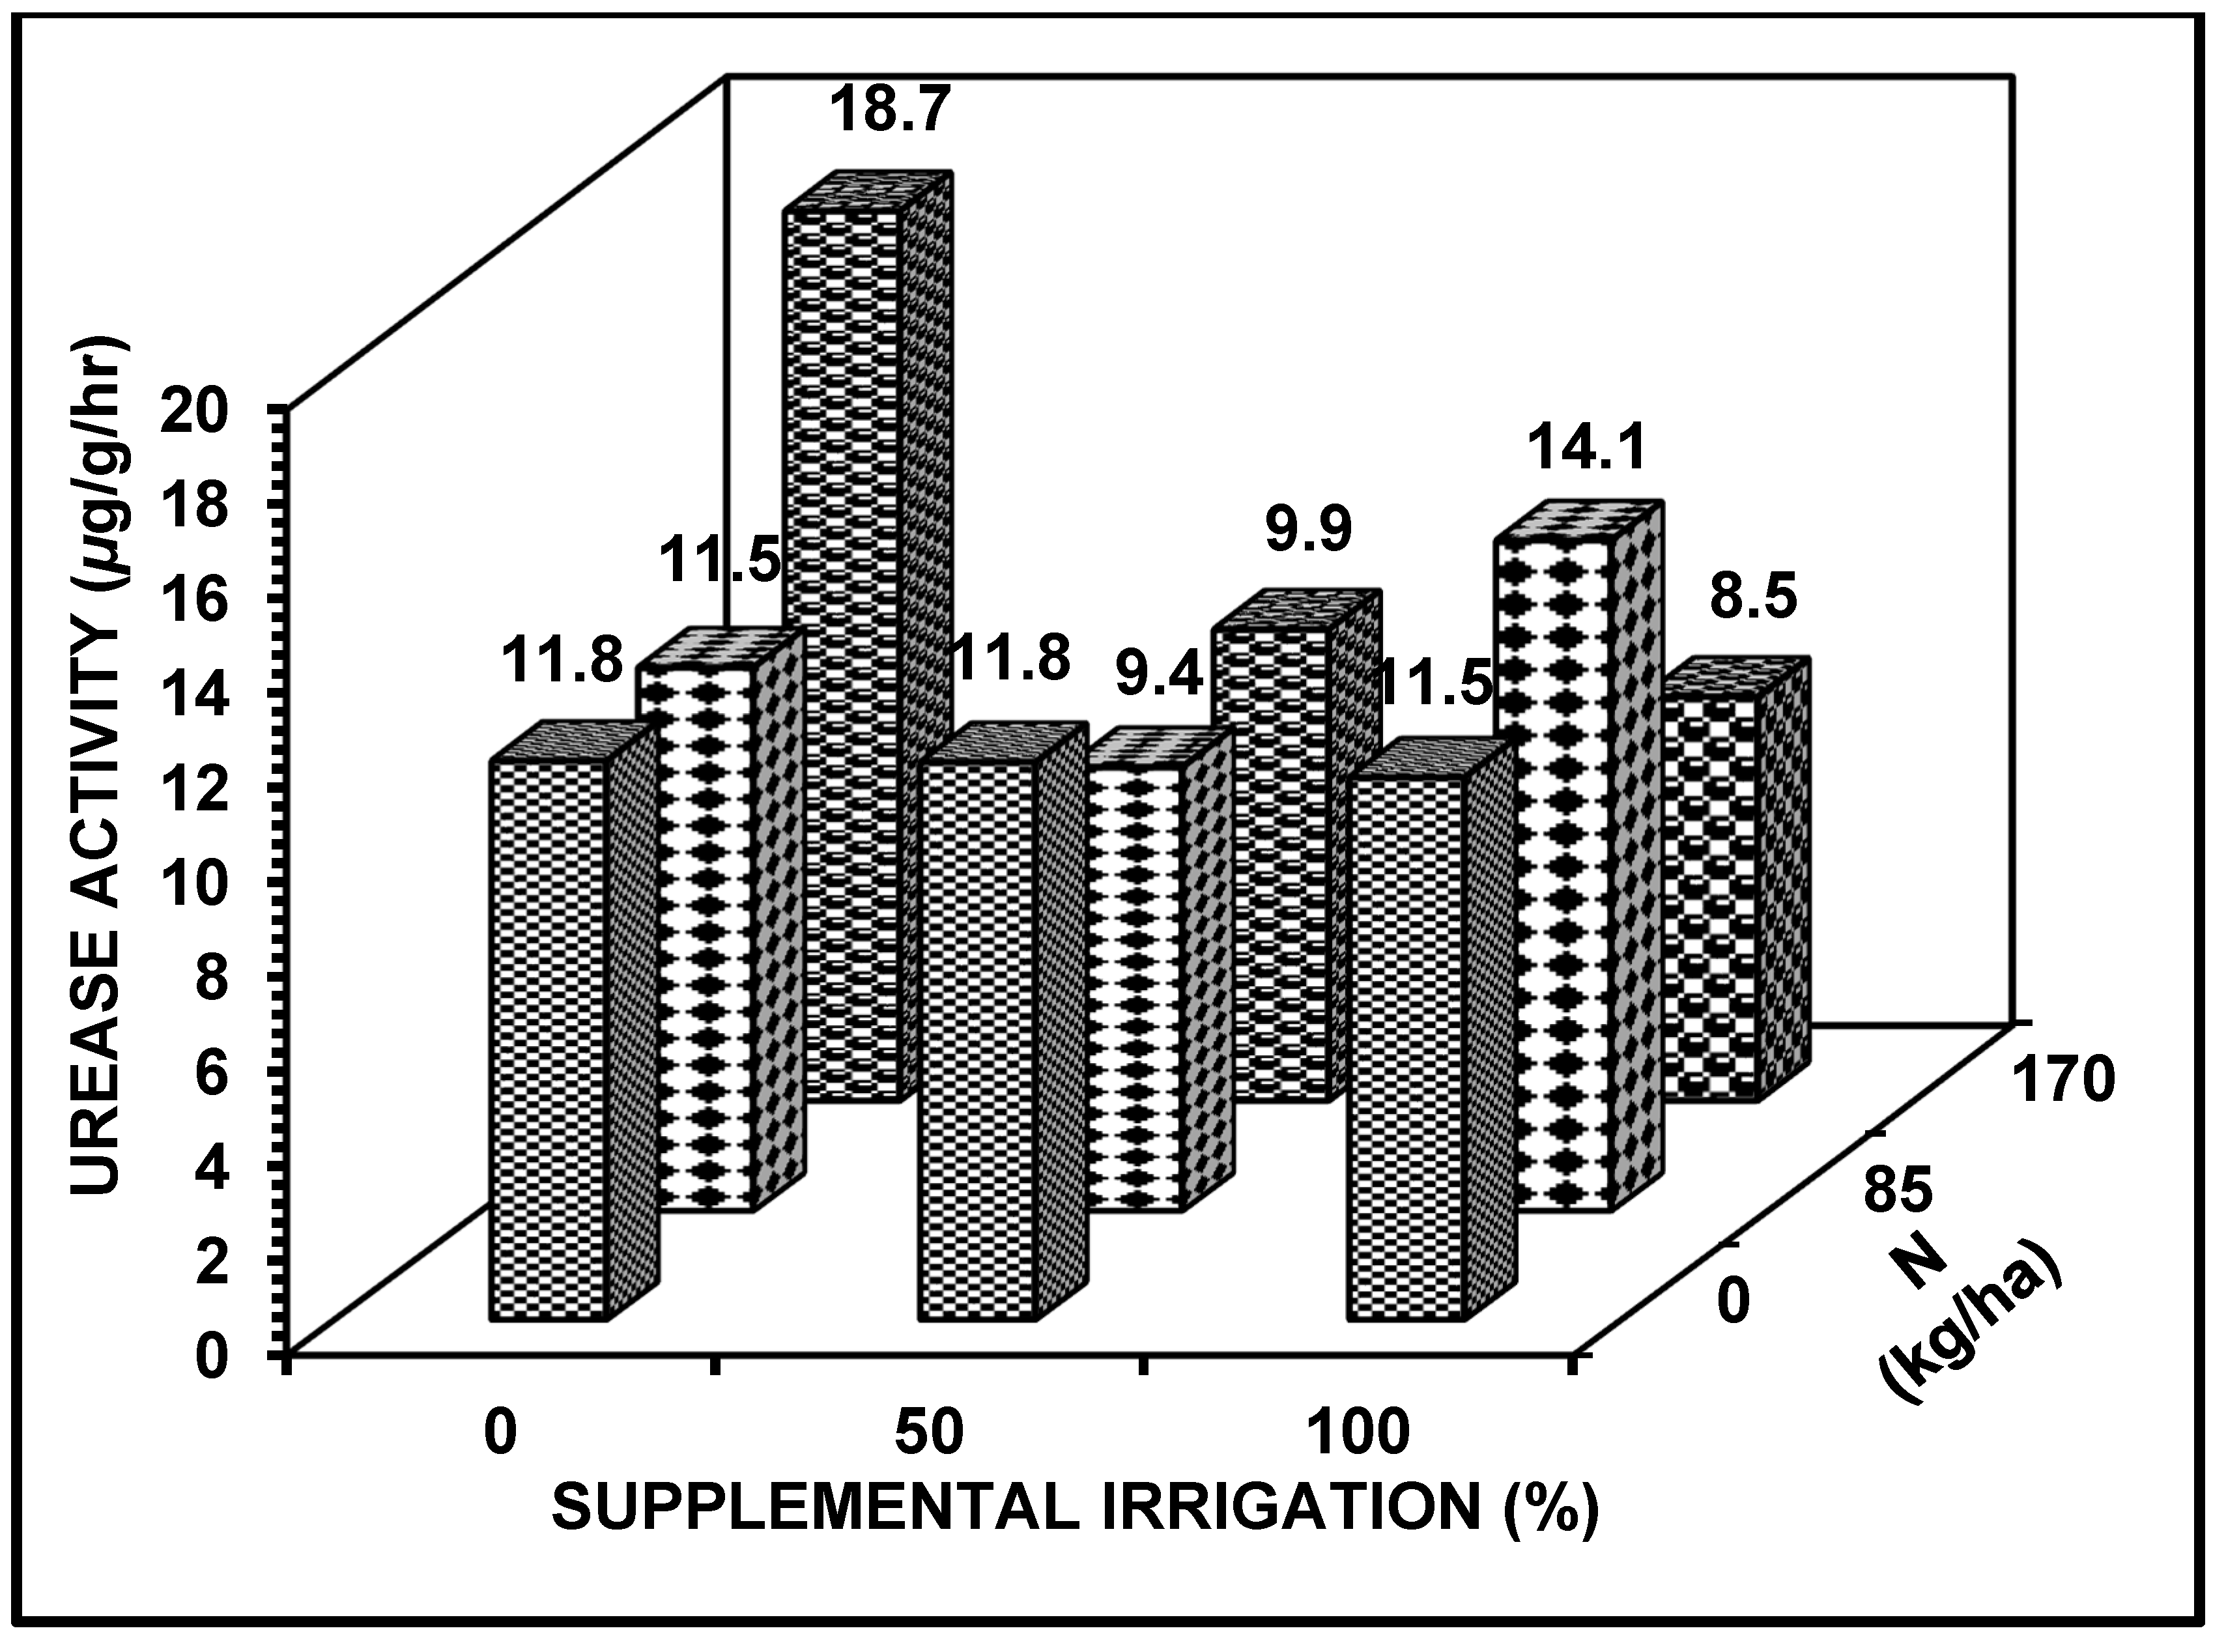
3.1. Urease Activity in Soils

Overall, the concentration of UA varied significantly with the interactions of SI and N (Table 2, Figure 4). The greatest UA was from 0% SI with 170 kg N ha−1 (18.7 µg N g−1 h−1), while the lowest UA was from the soils treated with 100% SI and 170 kg N ha−1 (8.5 µg N g−1 h−1). Urease activity was also affected by SI, N fertilization, and SD. The soils from plots with 0% SI had the greatest annual average of UA (11.8 ± 5.3 µg N g−1 h−1) compared with plots that received 50% and 100% SI with mean UA of 9.9 ± 5.8 and 10.8 ± 5.1 µg N g−1 h−1, respectively. On the effect of N, the soils with 170 kg N ha−1 (10.9 ± 5.8 µg N g−1 h−1) and the control (11.6 ± 6.2 µg N g−1 h−1) had the greatest concentration of UA (Figure 4). Urease activity in the soil was not affected by the Y variability (Table 2). The annual average of UA in SD of 0–15 cm was significantly different from the UA in SD of 15–30 cm. The average UA in 0–15 cm was 14.9 ± 5.01 µg N g−1 h−1, while the average UA in SD of 15–30 cm was 6.78 ± 2.71 µg N g−1 h−1 (Table 2). Our results showed the positive effect of managing the N fertilization and irrigation on UA in the humid region.

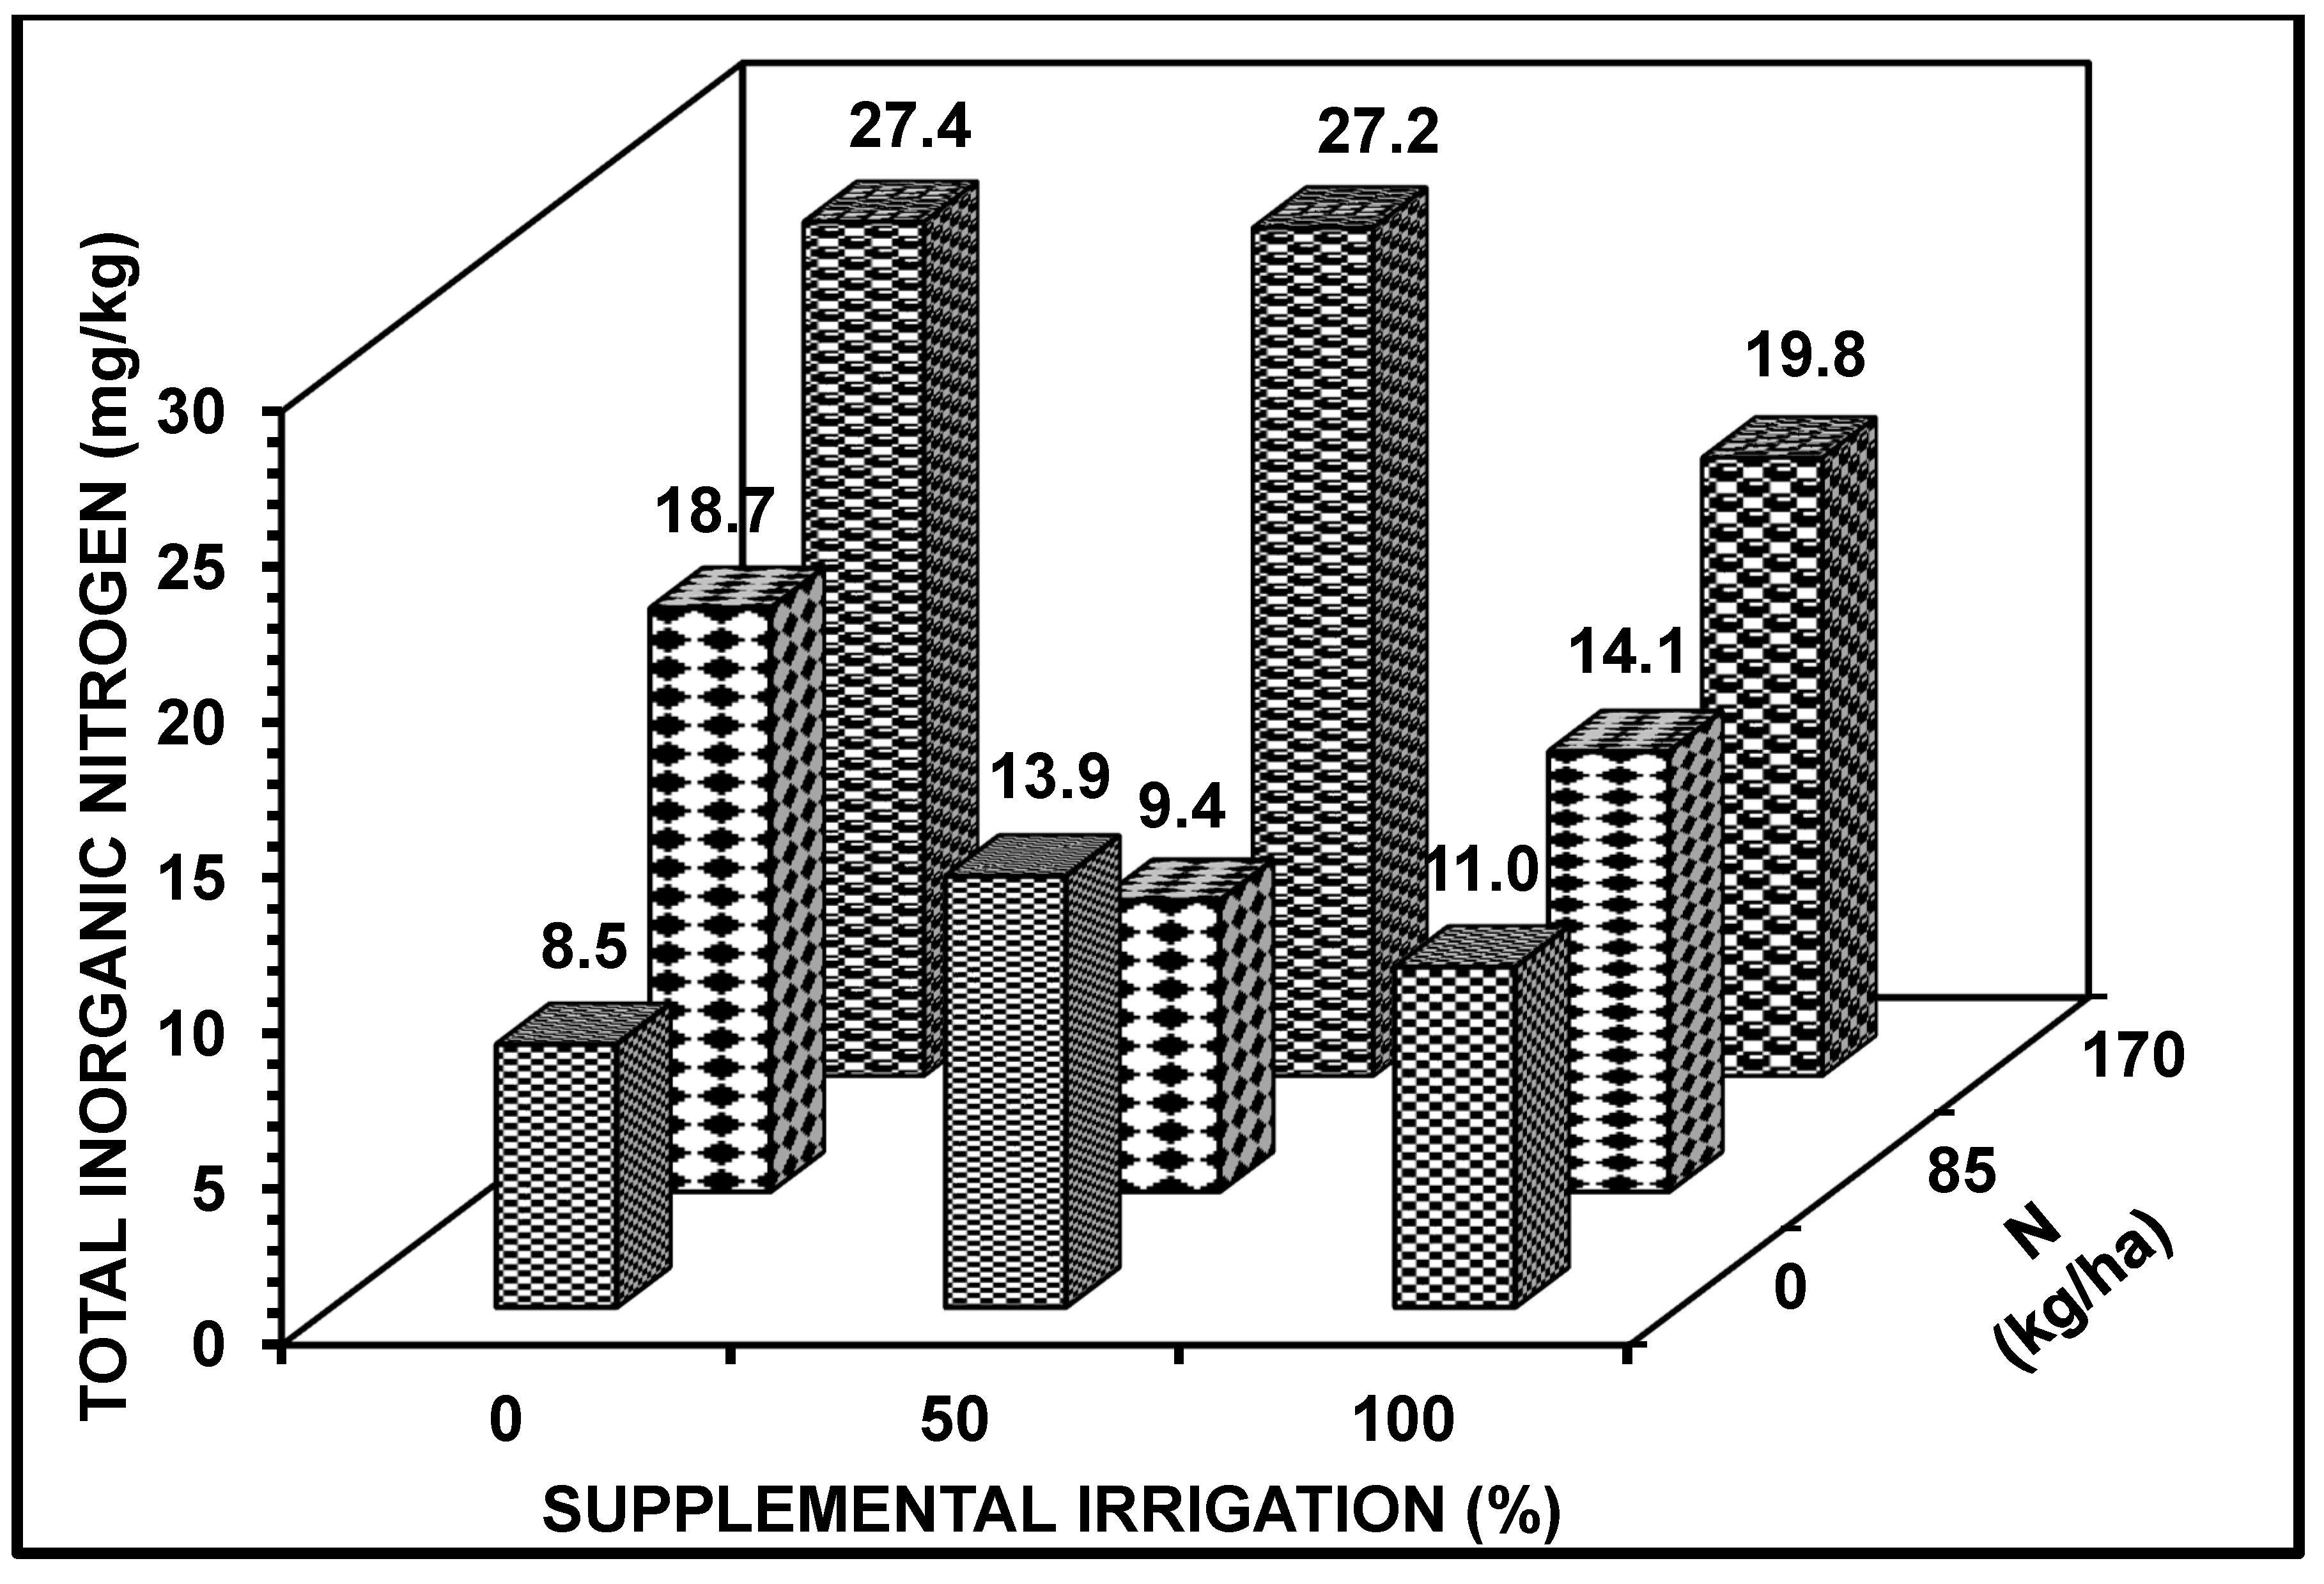
3.2. Total Nitrogen and Total Inorganic Nitrogen in Soils

While TNS varied significantly with Y (p ≤ 0.001), SI (p ≤ 0.001), N fertilization (p ≤ 0.001), and SD (p ≤ 0.001), the concentration of TNS was not affected by any interaction effect of SI, N, and SD (Table 2). Between 2013 and 2014, there was a decreasing trend in the concentrations of TNS (Table 2). In the plots with N treatments, the highest concentration of TNS was from soil treated with 170 kg N ha−1 (0.073 ± 0.026%) followed by soil with 85 kg N ha−1 (0.069 ± 0.024%). The least amount of TNS was from the control plots (0.068 ± 0.025%).
Of the irrigation treatments (Table 2), the highest concentration of TNS was from the plots with 0% SI (0.072 ± 0.023%), while the least amount of TNS (0.065 ± 0.025%) was from plots with 50% SI. The concentration of TNS showed a significant reduction from SD of 0–15 cm to SD of 15–30 cm. The amount of TNS in the surface SD (0–15 cm) was about 0.086 ± 0.017% compared with 0.051 ± 0.021% at SD of 15–30 cm, which is equivalent to a total reduction of about 38% (Table 2). The concentration of TINS was significantly affected by the interaction of SI and N (Table 2 and Figure 5). Total inorganic N in the soil was significantly affected by the different levels of SI (p ≤ 0.001), N fertilization (p ≤ 0.001), and SD (p ≤ 0.001). Overall, the concentration of TINS showed an increasing trend with N application. Except for the control, TINS showed a decreasing trend with SI (Figure 5). The greatest concentration of TINS in the soil was from plots treated with 170 kg N ha−1 and 0% SI (27.4 mg kg−1), while the least amount of TINS was from the control plots (8.5 mg kg−1). With the increasing amount of N application from 0 to 170 kg N ha−1 in combination with 0% SI, 50% SI, and 100% SI, the concentrations of TINS have increased from 8.5 to 27.4, 13.9 to 27.2 and 11.0 to 19.8 mg kg−1, respectively (Figure 5).

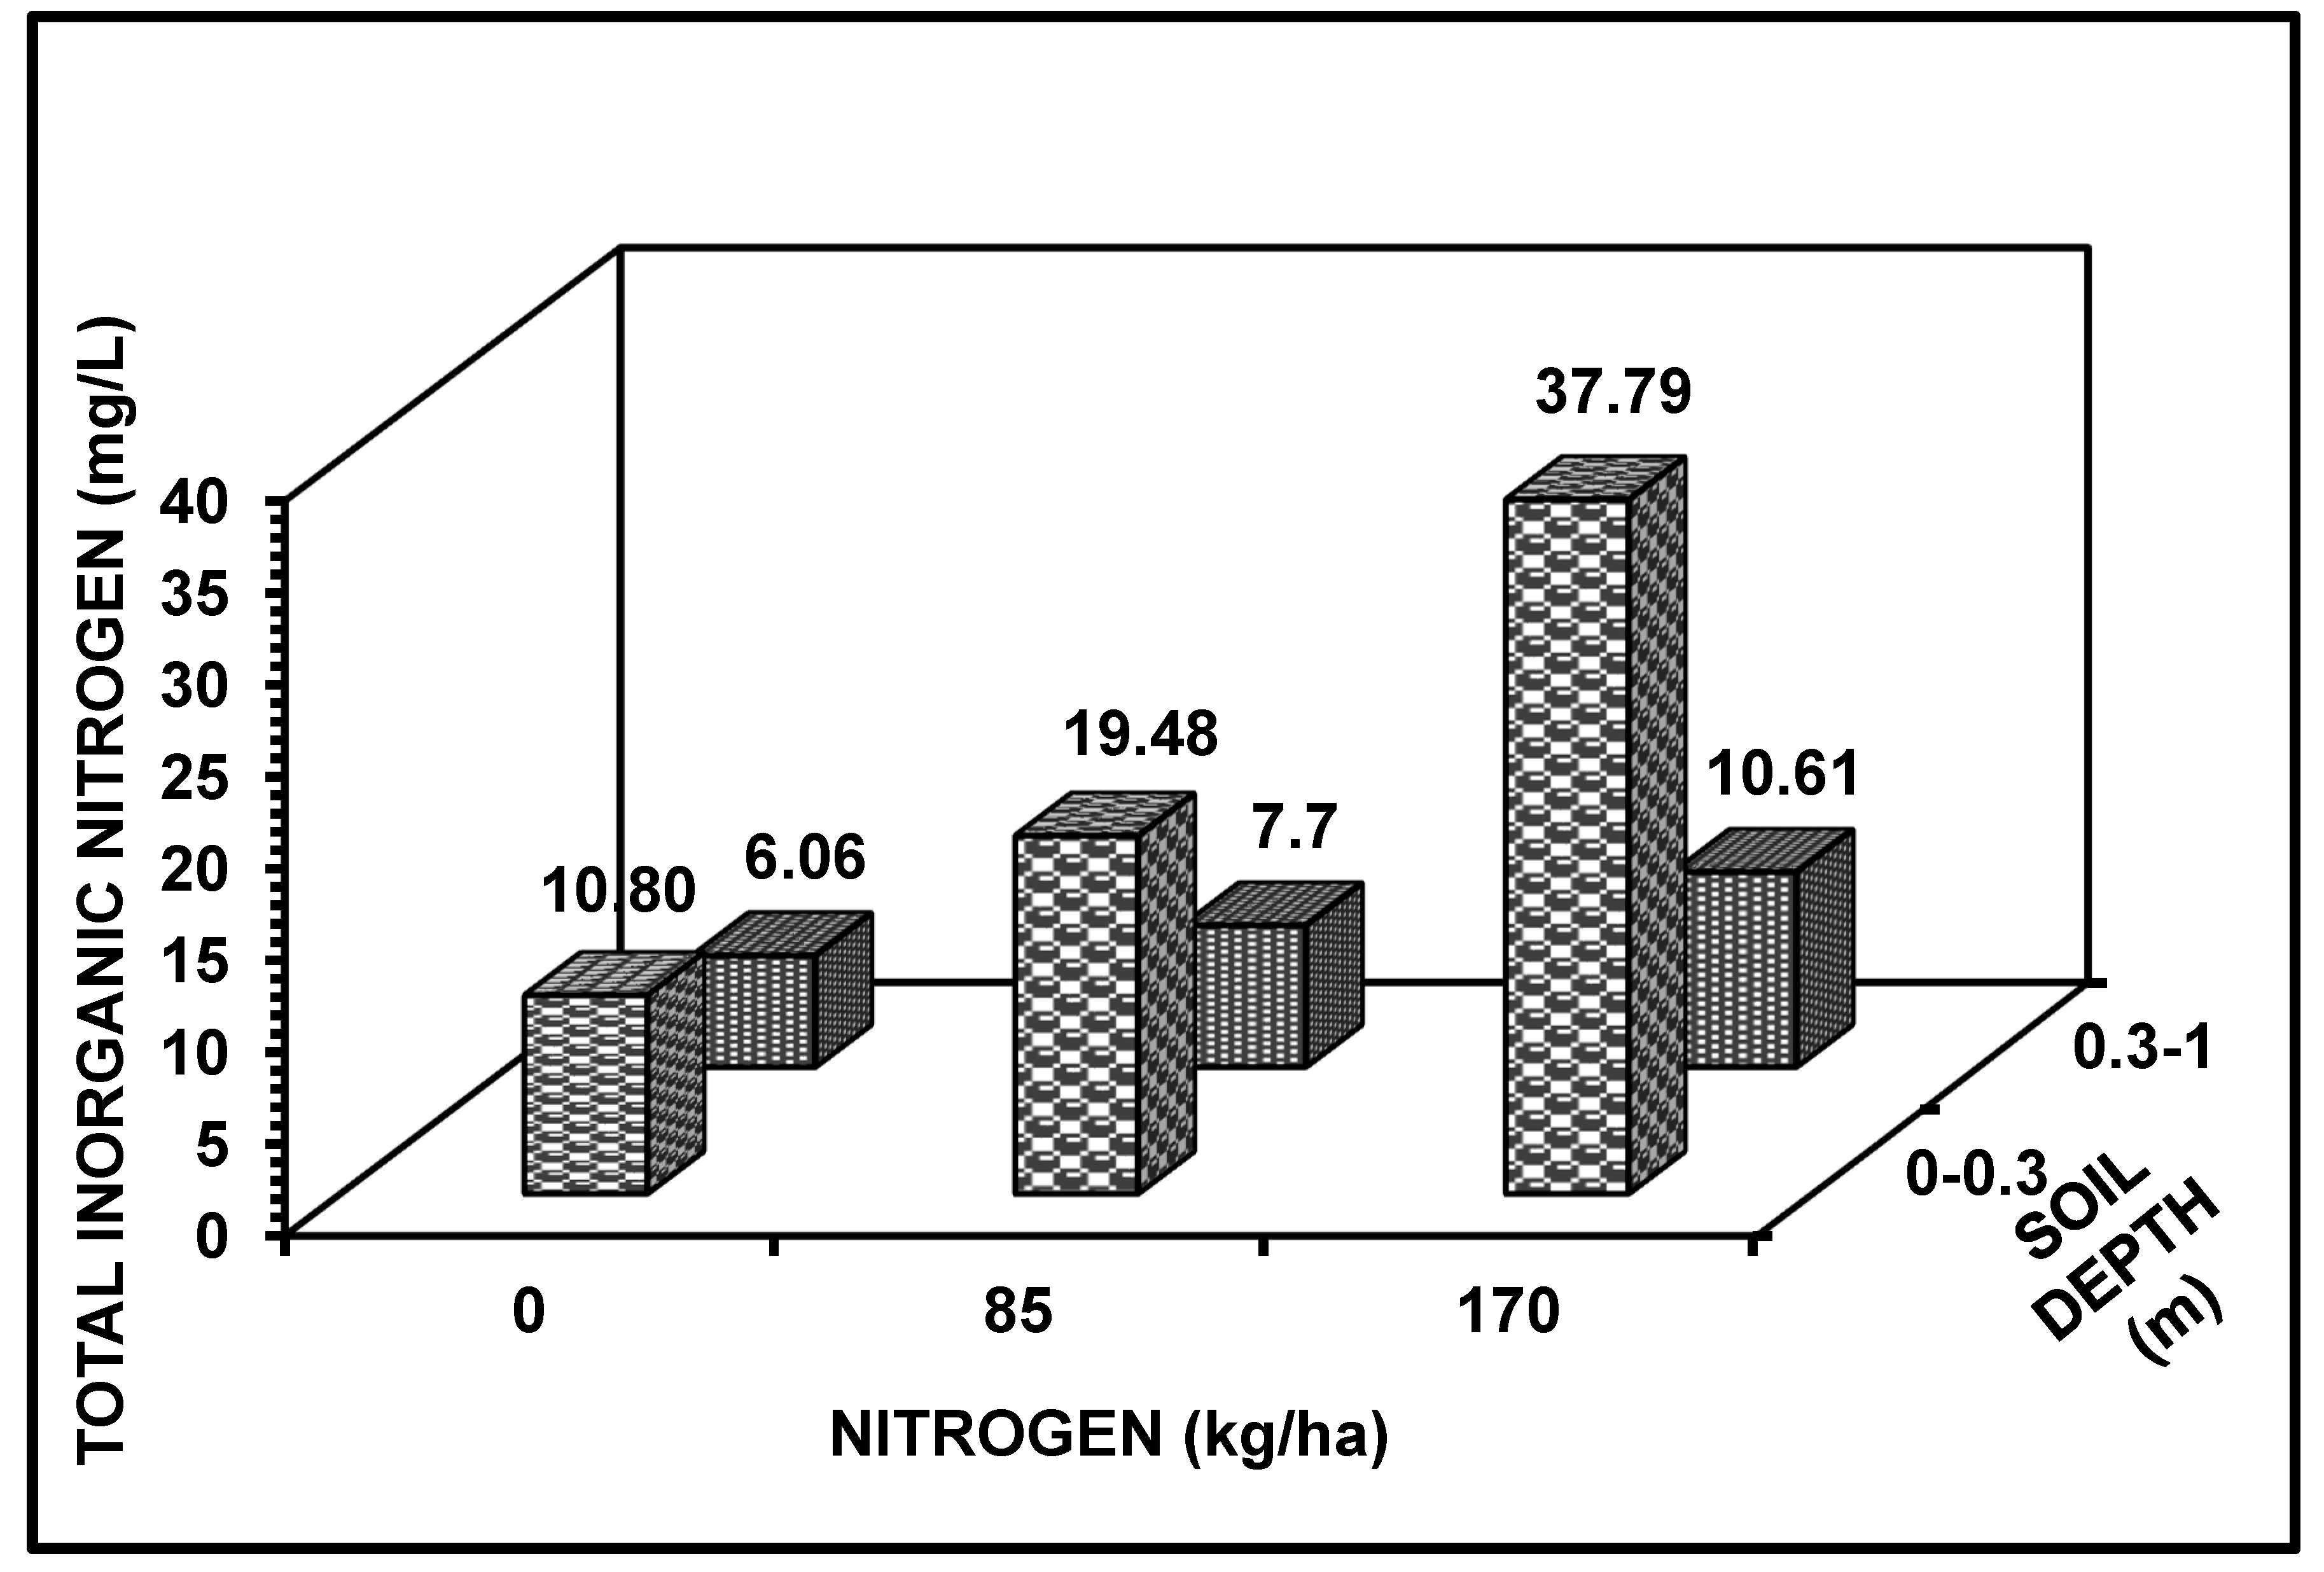
3.3. Porewater Concentration of Total Inorganic Nitrogen

The concentration of TINW (NH4 + NO3) was not affected by Y variability and SI but varied significantly with N (p ≤ 0.001), SD (p ≤ 0.001), and the interaction of SI and N (p ≤ 0.01). The level of TINW in the soil varied significantly with the interaction of N and SD (p ≤ 0.01). The concentration of TINW at 0–30 cm was significantly higher than the concentration of TINW at lower SD (30–100 cm). Averaged across Y, TINW in plots with 0% SI was about 17.81 ± 2.07 mg L−1 compared with 50% SI and 100% SI with mean TINW of 18.33 ± 2.25 and 17.87 ± 2.79 mg L−1, respectively (Table 3). When averaged across Y, the greatest concentration of TINW was from 170 kg N ha−1 followed by 85 kg N ha−1 with mean TINW concentrations of 23.64 ± 1.55 and 13.78 mg L−1, respectively. Figure 6 showed that the least concentration of TINW was from the control plots at SD of 30–100 cm of about 6.06 ± 0.77 mg L−1, while the greatest amount of TINW was from plots that were fertilized with 170 kg N ha−1 at SD of 0–30 cm (37.79 ± 5.32 mg L−1). Overall, the concentration of TINW had an increasing trend with increasing N application, but TINW concentration decreased significantly with SD (Figure 6).
Results showed that the concentration of porewater nitrate (NO3) between 30 cm and 100 cm soil depths was below the threshold level of 10 mg L−1 NO3 for drinking water [27]. When averaged across SI and N, the concentration of NO3 at SD between 30 and 100 cm was about 9.99 ± 0.69 mg L−1 compared with 26.06 ± 2.38 mg L−1 at SD of 0–30 cm (Table 3). Our results showed that SI and N treatments were not likely to exceed the concentration of NO3 above 10 mg L−1 at soil depths between 30 and 100 cm in the humid region with sorghum production (Table 3).

3.4. Uptake of Sorghum Aboveground Biomass and Grain

The uptakes of sorghum (NUPB and NUG) were not affected by any interaction effect of SI and N (Table 4). On the other hand, NUPB and NUG were both significantly affected by Y variability (p ≤ 0.001), SI (p ≤ 0.001), and N fertilization (p ≤ 0.001). Biomass uptake showed an increasing trend from 2013 to 2014 and a slight decrease in NUG between 2013 and 2014 (Table 4). Sorghum with 100% SI had the greatest NUPB of 67.86 ± 31.11 kg ha−1 and NUG of 52.76 ± 20.51 kg ha−1 (Table 4) when averaged across years. The NUPB and NUG of sorghum with 50% SI and 0% SI were not significantly different from each other. As might be expected, the greatest NUPB (70.98 ± 30.27 kg ha−1) and NUG (55.34 ± 16.48 kg ha−1) were observed from plots that were fertilized with 170 kg N ha−1, while the least amount of NUPB (45.80 ± 21.47 kg ha−1) and NUG (27.40 ± 12.08 kg ha−1) were from the control plots.
When averaged across SI, total N uptake (NUPB + NUG) of sorghum showed an increasing trend with increasing amount of N application. The average total N uptake of sorghum treated with 170 kg N ha−1 was about 126.3 kg N ha−1 followed by 85 kg N ha−1 and the control with mean total N uptake of 103.8 and 73.2 kg N ha−1, respectively (Table 4). Our results showed that soils applied with 170 kg N ha−1 had increased the total N uptake by about 73% when compared with the control. The increase in net N uptake between 85 kg ha−1 and the control was about 42% (Table 4). Overall, these results may have important consequences in improving the N fertilization for sorghum with or without supplemental irrigation.

4. Discussion

Our present study provided the optimistic impact of different SI and N treatments for maximizing agronomic productivity of sorghum. Results have demonstrated that supplemental irrigation and optimum application N fertilizer had increased water-use efficiency and nitrogen-use efficiency along with potential reduction of environmental pollution risk. Adequate amount of water in the soil has beneficial effect on N availability and the capacity of the plant for simultaneous uptake of water and N. Additionally, the soil enzyme activity has been enhanced when both water and N were at their optimal level in the field [11,28,29].
Overall, the concentration of UA in the tested soils varied significantly with the interaction of SI and N. The greatest UA was from soils with 0% SI and 170 kg N ha−1 (18.7 µg N g−1 h−1). Potential UA in the soil was found to be correlated with the amount of mineralized N. Ruppel and Makswitat [30] reported that the application of 80 kg N ha−1 without irrigation increased N mineralization up to 280 kg N ha−1. Our results were different because the lowest UA was found in soils treated with 100% SI and 170 kg N ha−1 (8.5 µg N g−1 h−1). Urease activities in the soil depend on soil water and nutrient content, pore size, pore distribution, and oxygen content of the soil. Our results had corroborated with Ruppel and Makswitat [30] who claimed that substrate-induced respiration activity and basal respiration activity of the soil microflora had resulted to higher concentration of UA in the unfertilized and non-irrigated plots. Dash et al. [31] reported a positive correlation between UA, total N, organic carbon, and a negative correlation with pH and soil moisture. On the other hand, Yang et al. [32] and Wang [33] claimed that application of N fertilizer could lower the activities of UA in the soil. Our results have shown that the greatest UA in our soils were from the control plots (11.86 ± 5.27 µg N g−1 h−1), suggesting that N fertilization and SI may lead to shifts in microbial population and subsequently, to a different N transforming process involving soil mineralization. The actual rate of enzyme production and activity in the soil can be modified and regulated by environmental effects and ecological interactions of naturally occurring stresses like water, temperature, and substrate fluctuation [34,35].
The substantial effects of Y on NUPB, NUG, TNS, and TINS can be explained by the differences in the amount of irrigated water due to the variable amount of rainfall during the growing season of sorghum in 2013 and 2014. The total amount of irrigation water applied in 2013 and 2014 were 38.1 mm and 12.9 mm at 100% SI, respectively. On the other hand, the total amount of irrigation water applied at 50% SI in 2013 and 2014 in plots was 19.05 mm and 6.35 mm, respectively (Figure 2). In 2014, a greater amount of rainfall was received during the growing season of sorghum when compared with the amount of rainfall received in 2013 and the difference in total rainfall resulted in greater NUPB and NUG. The greatest NUPB and NUG of sorghum were from plots with 100% SI (Table 4).
The total N uptake (NUPB + NUG) of sorghum was significantly affected by SI and N application. The average total N uptake of sorghum that were fertilized with 170 kg N ha−1 was about 126.3 kg N ha−1 followed by 85 kg N ha−1 and the control with mean total N uptake of 103.8 kg N ha−1 and 73.2 kg N ha−1, respectively. The amount of plant-available N and N released during the growing season through mineralization of soil organic matter can determine the supply of N in the soil [36]. The overall availability of N in the soil and the N transferring quantity in the soil can be affected by the levels of irrigation and N fertilizer. Within a given soil depth (e.g., 0–30 cm), the soil N concentration may increase or decrease with time [37,38]. Therefore, we can surmise that the efficient N uptake of sorghum in our plots with 100% SI and fertilized with N between 85 and 170 kg N ha−1 resulted in lower concentrations of TNS and TINS being left or accumulated in the soils. The overall reductions in the concentration of TNS and/or TINS in our study were related to the total amount of N uptake of sorghum at various growth stages of sorghum. The amount of N being removed by sorghum aboveground biomass and grain would constitute N losses, so there is a likely need for additional application of nutrients in the forms of organic and/or inorganic fertilizers [39].
Our results showed that the application of 170 kg N ha−1 resulted in an increase in the total N uptake of about 73% over the control. The increase in net N uptake between the application of 85 kg ha−1 and the control was about 42%. Our findings corroborated the published results of Roy and Wright [40] who reported that application of 60 to 120 kg N ha−1 had significantly greater N uptake in sorghum when compared with the unfertilized plants. Sorghum has continued to absorb N from the soil throughout the growing season until maturity [40,41]. Furthermore, as for sorghum being a drought-tolerant crop, our results demonstrated similar results when compared with the findings of Smith et al. [42]. There are requirements to be balanced for crops to confirm that yields and uptake are limited by water and N, as well as to ensure not over application contributing to elevated production expenses and efficiency reduction.
Results demonstrated that differences in N utilization could be related to disparity response of sorghum to N fertilizer with or without SI, as well as differences in absorption and utilization of absorbed N. These results suggest that improvement of biomass productivity and nutrient uptake of sorghum are correlated to effective use of irrigation and sufficient amount of N in the soil. An early paper published by Sigua et al. [1] reported two critical processes namely: (i) Water flows from the soil to the root systems; and (ii) ion diffusion fluxes in the rhizosphere affecting nitrogen uptake in plants. A critical linkage between nutrient supply and soil water balance is the increase in plant shoot sizes due to improved nutritional status and water requirement of the crop [43].
Nitrogen absorption shown in Table 4 was reduced under 0% SI. These findings were corroborated by the early published works of Gonzalez-Dugo et al. [44]; Williams and Yanai [45]; Passiorra [46]; and Garwood and Williams [47]. Absorption of N by roots requires the presence of water in the soil, as the agent that transports solutes from soil to root interface. The concentration of N in the tissue drops to a much lower value when nitrogen is less available and less sufficient soil moisture are present for transport, suggesting that the interaction between adequate water use and better nutrient availability may have both direct and indirect effects on N uptake [48,49].
We have demonstrated that our SI and N treatments were environmentally friendly, resulted in lower TINW of 9.99 ± 0.69 mg L−1 at lower soil depth between 30 and 100 cm, which is consistent with the early findings of Benjamin et al. [50]. Nitrate may reach groundwater by being transported with water that percolates through the soil. Any irrigation or precipitation that exceeds the soil’s water holding capacity in the root zone will cause chemicals solubilization, including NO3 to leach into deeper groundwater. The concentration of TINW that we measured from the soil porewater varied greatly with N fertilization. We found that the application of 85 kg N ha−1 resulted in lower TINW concentration (13.78 mg L−1) than the high N rate of 170 kg N ha−1 (23.64 mg L−1). We have seen higher porewater NO3 from the application of high N rate, but the overall concentration of NO3 at soil depth beyond the rooting depths of sorghum was much lower in concentration when compared with the upper 30 cm. This observation provided important information in managing N fertilization for sorghum in the humid region.
Recently, Sigua et al. [7,51] reported similar results from their work of irrigation scheduling on soil porewater NO3 in the southeastern Coastal Plain region. Irrigation management can affect N availability for attaining an optimum yield for corn. The application of heavy irrigation in sandy soil may result in greater leaching of nutrients, especially N, to deeper soil layers below the rooting zone. Irrigation water applied more than the soil water holding capacity may go directly through the soil profile below the root zone capable of reaching the water table [51]. If water is applied above the amount required to refill the soil in the root zone may potentially contribute to water contamination. Similar results were reported by Morgan et al. [52]. Irrigation water management could be extremely difficult in predominantly sandy soils because sands are dominated by large pores that have little capacity to hold water through capillarity [53]. Additionally, porewater NO3 could be increased sharply when the N fertilizer application rate exceeds the optimum crop needs for nitrogen [27,54].

5. Conclusions

Results are summarized as follows: (i) Supplemental irrigation and N treatments have highlighted the importance of water and N availability in sorghum production and soil sustainability in humid region; (ii) application of 170 kg N ha−1 with 100% SI resulted in the greatest N uptake and a significantly lower concentration of porewater NO3 at soil depth between 30 and 100 cm when compared with the EPA’s threshold concentration of NO3 (10 mg L−1) for drinking water; and (iii) results support our research hypothesis that supplemental irrigation and N enhanced UA and improved total N uptake of sorghum with significantly lower concentration of N in porewater.
Given all the useful information above, we can conclude that proper management of irrigation water and the right amount of nitrogen application will improve soil productivity and could enhance the total N uptake of grain sorghum while minimizing the concentration of porewater NO3 in the humid southeastern region of the United States.

Author Contributions

All authors contributed to this research project. Individual contributions to the following categories are as follows: Research Conceptualization: G.C.S., K.C.S., P.J.B., and A.A.S.; Methodology: G.C.S. and K.C.S.; Data Analyses: G.C.S.; Writing–Original draft preparation: G.C.S.; Review and Editing: K.C.S., P.J.B., and A.A.S. All authors have read and agreed to the published version of the manuscript.

Funding

This research received no external funding.

Acknowledgments

The authors expressed their gratitude to the staff of USDA-ARS in Florence, SC especially William Myers for his help and assistance in the laboratory analyses of soils, water, and plant samples. He also provided significant assistance in collecting field data, soil sampling, porewater sampling, and plant sampling.

Conflicts of Interest

The authors declare no conflict of interest.

References

  1. Sigua, G.C.; Stone, K.C.; Bauer, P.J.; Szogi, A.A. Biomass and nitrogen-use efficiency of grain sorghum with nitrogen and supplemental irrigation. Agron. J. 2018, 110, 1119–1127. [Google Scholar] [CrossRef]
  2. Moll, R.H.; Kamprath, E.J.; Jackson, W.A. Analysis and interpretation of factors which contribute to efficiency of nitrogen utilization. Agron. J. 1982, 74, 562–564. [Google Scholar] [CrossRef]
  3. Sinclair, T.R.; Ruffy, T.W. Nitrogen and water resources commonly limit crop yield increases, not necessarily plant genetics. Glob. Food Secur. 2012, 1, 94–98. [Google Scholar] [CrossRef]
  4. Gonzales-Dugo, V.; Durand, J.L.; Gastal, F. Water deficit and nitrogen nutrition of crops. Agron. Sustain. Dev. 2010, 30, 529–544. [Google Scholar] [CrossRef] [Green Version]
  5. Gheysari, M.; Mirlatifi, S.M.; Bannayan, M.; Homaee, M.; Hoogenboom, G. Interaction of water and nitrogen on maize grown for silage. Agric. Water Manag. 2009, 96, 809–821. [Google Scholar] [CrossRef]
  6. Su, Y.Z.; Zhang, Z.H.; Yang, R. Amount of irrigation and nitrogen application for maize grown on sandy farmland in the marginal oasis in the middle of Heihe River Basin. Acta Agron. Sin. 2007, 33, 2007–2015. [Google Scholar]
  7. Sigua, G.C.; Stone, K.C.; Bauer, P.J.; Szogi, A.A.; Shumaker, P.P. Impact of irrigation scheduling on pore water nitrate and phosphate in coastal plain region of the United States. Agric. Water Manag. 2017, 186, 75–85. [Google Scholar] [CrossRef]
  8. Gholamhoseini, M.; Agha Alikhani, M.; Sanavy, S.A.M.; Mirlafiti, S.M. Interaction of irrigation, weed and nitrogen on corn yield, nitrogen use efficiency and nitrate leaching. Agric. Water Manag. 2013, 126, 9–18. [Google Scholar] [CrossRef]
  9. Li, X.; Hu, C.; Delgado, J.A.; Zhang, Y.; Ouyang, Z. Increase nitrogen use efficiency as a key mitigation alternative to reduce nitrate leaching in north China plain. Agric. Water Manag. 2007, 89, 137–147. [Google Scholar] [CrossRef]
  10. Fang, Q.; Yu, E.; Wang, Y.; Chen, G.; Zhang, J.; Wang, J.; Li, L. Soil nitrate accumulation, leaching and crop nitrogen use as influenced by fertilization and irrigation in an intensive wheat-maize double cropping system in the North China Plain. Plant Soil 2006, 284, 335–350. [Google Scholar] [CrossRef]
  11. Katterer, T.; Hansson, A.C.; Andren, O. Wheat root biomass and nitrogen dynamics-effects of daily irrigation and fertilization. Plant Soil 1993, 151, 21–30. [Google Scholar] [CrossRef]
  12. Zougmore, R.; Mando, A.L.; Stroosnijder, S. Effect of soil and water conservation and nutrient management on the soil-plant water balance in semi-arid Burkina Faso. Agric. Water Manag. 2004, 65, 103–120. [Google Scholar] [CrossRef]
  13. McDonald, R.I.; Girvetz, E.H. Two challenges of U.S. irrigation due to climate change: Increasing irrigated area in wet states and increasing irrigation rates in dry states. PLoS ONE 2013, 8, e65589. [Google Scholar] [CrossRef] [PubMed]
  14. Fischer, G.; Tubiello, F.N.; van Velthuizen, H.; Wiberg, D.A. Climate change impacts on irrigation water requirements: Effects of mitigation, 1990–2080. Technol. Forecast. Soc. Chang. 2007, 74, 1083–1107. [Google Scholar] [CrossRef] [Green Version]
  15. Stone, K.C.; Sigua, G.C.; Bauer, P.J. Supplemental irrigation for grain sorghum production in the US eastern Coastal Plain. Appl. Eng. Agric. 2018, 34, 395–402. [Google Scholar] [CrossRef]
  16. Stone, K.C.; Bauer, P.J.; Busscher, W.J.; Millen, J.A.; Evans, D.E.; Strickland, E.E. Variable-rate irrigation management using an expert system in the eastern coastal plain. Irrig. Sci. 2015, 33, 167–175. [Google Scholar] [CrossRef]
  17. Liu, X.J.; Ju, X.T.; Zhang, F.S. Nitrogen dynamics and budgets in a winter-maize cropping system in the North China Plain. Field Crop. Res. 2003, 83, 111–124. [Google Scholar] [CrossRef] [Green Version]
  18. Cappelli, A.; Guerrini, L.; Parenti, A.; Palladino, G.; Cini, E. Effects of wheat tempering and stone rotational speed on particle size, dough rheology and bread characteristics for a stone-milled weak flour. J. Cereal Sci. 2020, 91, 102879. [Google Scholar] [CrossRef]
  19. Cappelli, A.; Oliva, N.; Cini, E. Stone milling versus roller milling: A systematic review of the effects on wheat flour quality, dough rheology, and bread characteristics. Trends Food Sci. Technol. 2020, 97, 147–155. [Google Scholar] [CrossRef]
  20. Cappelli, A.; Bettaccini, L.; Cini, E. The kneading process: A systematic review of the effects on dough rheology and resulting bread characteristics, including improvement strategies. Trends Food Sci. Technol. 2020, 104, 91–101. [Google Scholar] [CrossRef]
  21. Cappelli, A.; Guerrini, L.; Cini, E.; Parenti, A. Improving whole wheat dough tenacity and extensibility: A new kneading process. J. Cereal Sci. 2019, 90, 102852. [Google Scholar] [CrossRef]
  22. Omary, M.; Camp, C.R.; Sadler, E.J. Center pivot irrigation system modification to provide variable water application depths. Appl. Eng. Agric. 1996, 13, 235–239. [Google Scholar] [CrossRef]
  23. ASTM International. Anions in Water by Suppressed ion Chromatography. ASTM Standard D4327-11. Available online: https://www.astm.org/DATABASE.CART/HISTORICAL/D4327-11.htm (accessed on 10 March 2013).
  24. ASTM International. Determination of Dissolved Alkali and Alkaline Earth Cations and Ammonium in Water and Wastewater by Ion Chromatography. ASTM Standard D6919-09. Available online: https://www.astm.org/DATABASE.CART/HISTORICAL/D6919-09.htm (accessed on 10 March 2013).
  25. Kandeler, E.; Gerber, H. Short-term assay of soil urease activity using colorimetric determination of ammonium. Biol. Fertil. Soils 1988, 6, 68–72. [Google Scholar] [CrossRef]
  26. SAS Institute. SAS/STAT User’s Guide. Release 6.03. Available online: https://support.sas.com/documentation/onlinedoc/91pdf/sasdoc_91/stat_ug_7313.pdf (accessed on 10 February 2013).
  27. Sigua, G.C.; Hubbard, R.; Coleman, S.W. Nitrogen in soils, plants and shallow groundwater beneath a bahiagrass-based pasture with cow-calf operations. Nutr. Cycl. Agroecosyst. J. 2009, 86, 175–187. [Google Scholar] [CrossRef]
  28. Cosentino, S.L.; Mantineo, M.; Testa, G. Water and nitrogen balance of sweet sorghum (Sorghum bicolor moench (L)) under semi-arid conditions. Ind. Crops Prod. 2012, 36, 329–342. [Google Scholar] [CrossRef]
  29. Pandey, R.K.; Maranville, J.W.; Admou, A. Tropical wheat response to irrigation and nitrogen in a Sahelian environment. I. Grain yield, yield components and water use efficiency. Eur. J. Agron. 2001, 15, 93–105. [Google Scholar] [CrossRef]
  30. Ruppel, S.; Makswitat, E. Effect of nitrogen fertilization and irrigation on soil microbial activities and population dynamics—A field study. J. Plant Nutr. Soil Sci. 1999, 162, 75–81. [Google Scholar] [CrossRef]
  31. Dash, M.C.; Mishra, P.; Mohanty, R.K.; Bath, N. Effects of specific conductance and temperature on urease activity in some Indian soils. Soil Biol. Biochem. 1981, 13, 73–74. [Google Scholar] [CrossRef]
  32. Yang, L.; Li, T.; Li, F.; Lemcoff, J.H.; Cohen, S. Fertilization regulates soil enzymatic activity and fertility dynamics in cucumber fields. Sci. Hortic. 2008, 116, 21–26. [Google Scholar] [CrossRef]
  33. Wang, Y.Z. Significance of several soil enzymatic activities for indicating soil fertility. Chin. J. Soil Sci. 1982, 11, 16–23. [Google Scholar]
  34. Klose, S.; Moore, J.M.; Tabatabai, M.A. Arysulfatase activity of the microbial biomass in soils as affected by cropping systems. Biol. Fertil. Soils 1999, 29, 46–54. [Google Scholar] [CrossRef]
  35. Kandeler, E.; Kampichler, C.; Horak, O. Influence of heavy metals on the functional diversity of soil microbial communities. Biol. Fertil. Soils 1996, 23, 229–306. [Google Scholar] [CrossRef]
  36. Domsch, K.H.; Jagnow, G.; Anderson, T.H. An ecological concept for assessment of side-effects of agrochemicals on soil microorganisms. Residue Rev. 1983, 86, 65–105. [Google Scholar]
  37. Wang, Z.H.; Li, S.X.; Malhi, S. Effects of fertilization and other agronomic measures on nutritional quality of crops. J. Sci. Food Agric. 2008, 88, 7–23. [Google Scholar] [CrossRef]
  38. Beuters, P.; Scherer, H.W.; Spout, O.; Vetterlein, D. Impact of potassium on plant uptake on non-exchangeable NH4+-N. Plant. Soil 2014, 387, 37–44. [Google Scholar] [CrossRef]
  39. Hons, F.M.; Moresco, R.F.; Wiedenfield, R.P.; Green, J.T. Applied nitrogen and phosphorus effects on yield and nutrient uptake by high-energy sorghum produced for grain and biomass. Agron. J. 1986, 78, 1069–1078. [Google Scholar] [CrossRef]
  40. Roy, R.N.; Wright, B.C. Sorghum growth and nutrient uptake in relation to soil fertility, II. N, P, and K uptake pattern by various plant parts. Agron. J. 1974, 66, 5–10. [Google Scholar] [CrossRef]
  41. Herron, G.M.; Grimes, D.W.; Musick, J.T. Effects of soil moisture and nitrogen fertilization of irrigated grain sorghum on dry matter production and nitrogen uptake at selected stages of plant development. Agron. J. 1973, 55, 393–396. [Google Scholar] [CrossRef]
  42. Smith, J.; North, S.; Quayle, W.; Jones, D.; Fisher, R.; Griffin, D.; Lurbe, C.; Brinkhoff, J.; Hornbuckle, J. The Impact of Irrigation and Nitrogen Management on Nitrogen Uptake and Yield in Maize. Available online: https://grdc.com.au/resources-and-publications/grdc-update-papers/tab-content/grdc-update-papers/2016/07/the-impact-of-irrigation-and-nitrogen-management-on-nitrogen-uptake-and-yield-in-maize (accessed on 10 March 2013).
  43. Vetterlein, D.; Marschner, H. Interaction between water and nutrient supply under semi-arid conditions. In Reiniers; Reyniers, F.N., Netoyo, L., Eds.; Bilkan Hydrique Agricole et Seschresse en Afrique Tropicale; John Libbey Eurotext: Paris, France, 1994; pp. 103–110. [Google Scholar]
  44. Gonzalez-Dugo, V.; Durand, J.L.; Gastal, F.; Picon-Cochard, C. Short-term response of the nitrogen nutrition status of tall fescue and Italian ryegrass swards under water deficit. Aust. J. Agric. Res. 2005, 56, 1269–1276. [Google Scholar] [CrossRef]
  45. Williams, M.; Yanai, R.D. Multi-dimensional sensitivity analysis and ecological implications of a nutrient uptake model. Plant Soil 1996, 180, 311–324. [Google Scholar] [CrossRef]
  46. Passiorra, J. A mathematical model for the uptake of ions from the soil solution. Plant Soil 1963, 18, 225–238. [Google Scholar] [CrossRef]
  47. Garwood, E.A.; Williams, T.E. Growth, water use and nutrient uptake from the subsoil by grass swards. J. Agric. Sci. 1967, 93, 13–24. [Google Scholar] [CrossRef]
  48. Whitfield, D.M.; Smith, C.J. Nitrogen uptake, water use, grain yield and protein content in wheat. Field Crops Res. 1992, 29, 1–14. [Google Scholar] [CrossRef]
  49. van Kuelen, H. Modelling the interaction of water and nitrogen. Plant Soil 1981, 58, 205–229. [Google Scholar] [CrossRef]
  50. Benjamin, J.G.; Ahuja, J.G.; Allmaras, R.R. Modelling corn rooting patterns and their effects on water uptake and nitrate leaching. Plant Soil 1996, 179, 223–232. [Google Scholar] [CrossRef]
  51. Sigua, G.C.; Stone, K.C.; Bauer, P.J.; Szogi, A.A. Nitrate leaching, water-use efficiency and yield of corn with different irrigation and nitrogen management systems in Coastal Plains, USA. WIT Trans. Ecol. Environ. 2016, 203, 159–170. [Google Scholar]
  52. Morgan, K.T.; Hanlon, E.A.; Obreza, T.A. A web-based irrigation scheduling model to improve water use efficiency and reduce nutrient leaching for Florida citrus. EDIS 2009, 4, 4. [Google Scholar]
  53. Kern, J.S. Geographic patterns of soil water-holding capacity in the contiguous United States. Soil Sci. Soc. Am. J. 1992, 59, 1126–1133. [Google Scholar] [CrossRef]
  54. Bhogal, A.; Rochford, A.D.; Sylvester-Bradley, R. Net changes in soil and crop nitrogen in relation to the performance of winter wheat given wide-ranging annual nitrogen application at Ropsley, U.K. J. Agric. Sci. 2000, 135, 139–149. [Google Scholar] [CrossRef]
Figure 1. Center pivot irrigation system at the experimental site, Florence, South Carolina, USA.
Sustainability 12 08358 g001
Figure 2. Average monthly rainfall distribution during the growing season of sorghum (2013–2014) at the study site.
Sustainability 12 08358 g002
Figure 3. Installed suction lysimeters and soil moisture tensiometers.
Sustainability 12 08358 g003
Figure 4. Average (2013–2014) urease activity in soils with nitrogen fertilization and supplemental irrigation.
Sustainability 12 08358 g004
Figure 5. Average concentration (2013–2024) of total inorganic nitrogen in soils with nitrogen and supplemental irrigation.
Sustainability 12 08358 g005
Figure 6. Averaged (2013–2014) porewater nitrogen (TINW) in soils with nitrogen fertilization.
Sustainability 12 08358 g006
Table 1. Selected properties of the soil used in the study.
Soil PropertiesSoil Depth (cm)
0–1515–30
1. 
Physical Properties
Sand (g kg−1)807-
Silt (g kg−1)167-
Clay (g kg−1)26-
TextureLoamy Sand-
2. 
Chemical Properties
pH5.715.96
EC (dS m−1)0.250.14
TN (%)0.0980.051
TC (%)1.2780.741
TIN (NH4 +NO3-N) (mg kg−1)19.1111.12
PO4-P (mg kg−1)6.673.18
Al (mg kg−1)1236.21354.5
Ca (mg kg−1)527.5398.7
Fe (mg kg−1)22.522.2
K (mg kg−1)101.254.5
Mg (mg kg−1)82.348.1
Mn (mg kg−1)13.49.2
Na (mg kg−1)41.941.6
P (mg kg−1)51.438.6
3. 
Mineralogy
Kaolinite, chlorite, quartz
Table 2. Total nitrogen (TNS), total inorganic nitrogen (TINS), and urease activity (UA) in soils with supplemental irrigation and nitrogen at two soil depths in 2013 and 2014.
TreatmentTotal NitrogenTotal Inorganic NUrease ActivityTotal NitrogenTotal Inorganic NUrease Activity
(%)(mg/kg)(ug N/g/h)(%)(mg/kg)(ug N/g/h)
YEAR 1: 2013YEAR 2: 2014
1. Irrigation (SI)
a. 0%0.077 ± 0.039.9 ± 6.811.9 ± 6.70.066 ± 0.0310.9 ± 8.311.7 ± 5.6
b. 50%0.073 ± 0.029.7 ± 8.610.3 ± 5.30.058 ± 0.0210.2 ± 8.79.7 ± 4.9
c. 100%0.071 ± 0.0210.2 ± 8.410.8 ± 5.90.067 ± 0.0213.6 ± 7.910.6 ± 5.5
LSD0.050.0031.800.890.0031.800.89
2. Nitrogen (N)
a. 0 kg N/ha0.074 ± 0.037.4 ± 4.911.9 ± 6.50.063 ± 0.026.1 ± 2.911.3 ± 5.6
b. 85 kg N/ha0.072 ± 0.039.0 ± 6.69.9 ± 5.20.065 ± 0.0211.5 ± 11.210.0 ± 5.2
c. 170 kg/ha0.075 ± 0.0313.4 ± 10.211.2 ± 6.10.072 ± 0.0217.1 ± 13.410.6 ± 5.3
LSD0.050.0031.790.890.0031.790.89
3. Soil Depth (SD)
a. 0–15 cm0.087 ± 0.0212.6 ± 9.214.9 ± 5.70.084 ± 0.0114.8 ± 12.715.0 ± 4.1
b. 15–30 cm0.060 ± 0.027.2 ± 5.37.1 ± 3.20.042 ± 0.018.3 ± 5.36.3 ± 1.7
LSD0.050.0021.470.730.0021.470.73
Source of VariationsLevel of Significance
Year (Y)*****ns
Irrigation (SI)*********
Nitrogen (N)*********
Soil Depth (SD)*********
SI x Nns**
***—p ≤ 0.001 **—p ≤ 0.01 *—p ≤ 0.05 ns- not significant.
Table 3. Concentrations of NH4, NO3, and total inorganic nitrogen (TINW) in pore water.
TreatmentNH4NO3TINWNH4NO3TINW
(%)(mg/kg)(ug N/g/h)(%)(mg/kg)(ug N/g/h)
YEAR 1: 2013YEAR 2: 2014
1. Irrigation (SI)
a. 0%0.20 ± 0.0118.69 ± 7.3218.89 ± 2.070.28 ± 0.1116.46 ± 2.7916.74 ± 4.58
b. 50%0.21 ± 0.0519.92 ± 8.1320.13 ± 2.250.34 ± 0.0216.19 ± 7.1216.53 ± 7.00
c. 100%0.30 ± 0.1517.49 ± 8.8417.79 ± 2.790.22 ± 0.1315.62 ± 5.5917.95 ± 8.07
LSD0.050.145.795.780.145.795.78
2. Nitrogen (N)
a. 0 kg N/ha0.21 ± 0.0510.01 ± 6.0210.22 ± 8.020.22 ± 0.1216.58 ± 5.0716.80 ± 5.07
b. 85 kg N/ha0.30 ± 0.0817.24 ± 3.1217.54 ± 3.120.34 ± 0.229.67 ± 2.0710.01 ± 4.07
c. 170 kg/ha0.26 ± 0.3924.56 ± 1.5624.82 ± 1.550.29 ± 0.0722.18 ± 6.0722.47 ± 2.07
LSD0.050.145.775.760.145.775.76
3. Soil Depth (SD)
a. 0–15 cm0.27 ± 0.0924.20 ± 12.3824.47 ± 10.380.35 ± 0.0927.31 ± 12.0727.66 ± 14.01
b. 15–30 cm0.22 ± 0.019.25 ± 8.6612.47 ± 8.690.21 ± 0.1014.52 ± 2.0710.73 ± 1.11
LSD0.050.124.714.700.124.714.70
Source of VariationsLevel of Significance
Year (Y)nsnsns
Irrigation (SI)nsnsns
Nitrogen (N)ns******
Soil Depth (SD)ns******
SI × Nns**
N × SDns**
***—p ≤ 0.001 *—p ≤ 0.05 ns- not significant.
Table 4. Average annual nitrogen uptake (kg/ha) in plant aboveground biomass and grain of sorghum.
TreatmentBiomassGrainBiomassGrain
(kg/ha)
YEAR 1: 2013YEAR 2: 2014
1. Irrigation (SI)
a. 0%44.69 ± 23.4837.66 ± 16.6268.32 ± 43.4835.29 ± 12.62
b. 50%43.53 ± 23.7841.82 ± 22.7863.62 ± 36.1330.47 ± 13.25
c. 100%49.58 ± 24.2050.78 ± 24.0686.13 ± 50.5254.73 ± 15.49
LSD0.055.739.785.739.78
2. Nitrogen (N)
a. 0 kg N/ha31.96 ± 15.6226.89 ± 11.3259.64 ± 39.7327.92 ± 13.68
b. 85 kg N/ha48.36 ± 22.3742.91 ± 19.8873.92 ± 39.5242.35 ± 17.80
c. 170 kg/ha57.47 ± 25.2260.47 ± 18.2584.50 ± 50.7750.22 ± 12.41
LSD0.055.739.785.739.78
Source of VariationsLevel of Significance
Year (Y)nsns
Irrigation (SI)nsns
Nitrogen (N)ns***
***—p ≤ 0.001 ns- not significant.

