Accuracy Assessment of the FROM-GLC30 Land Cover Dataset Based on Watershed Sampling Units: A Continental-Scale Study

Abstract
:1. Introduction
2. Data and Methods
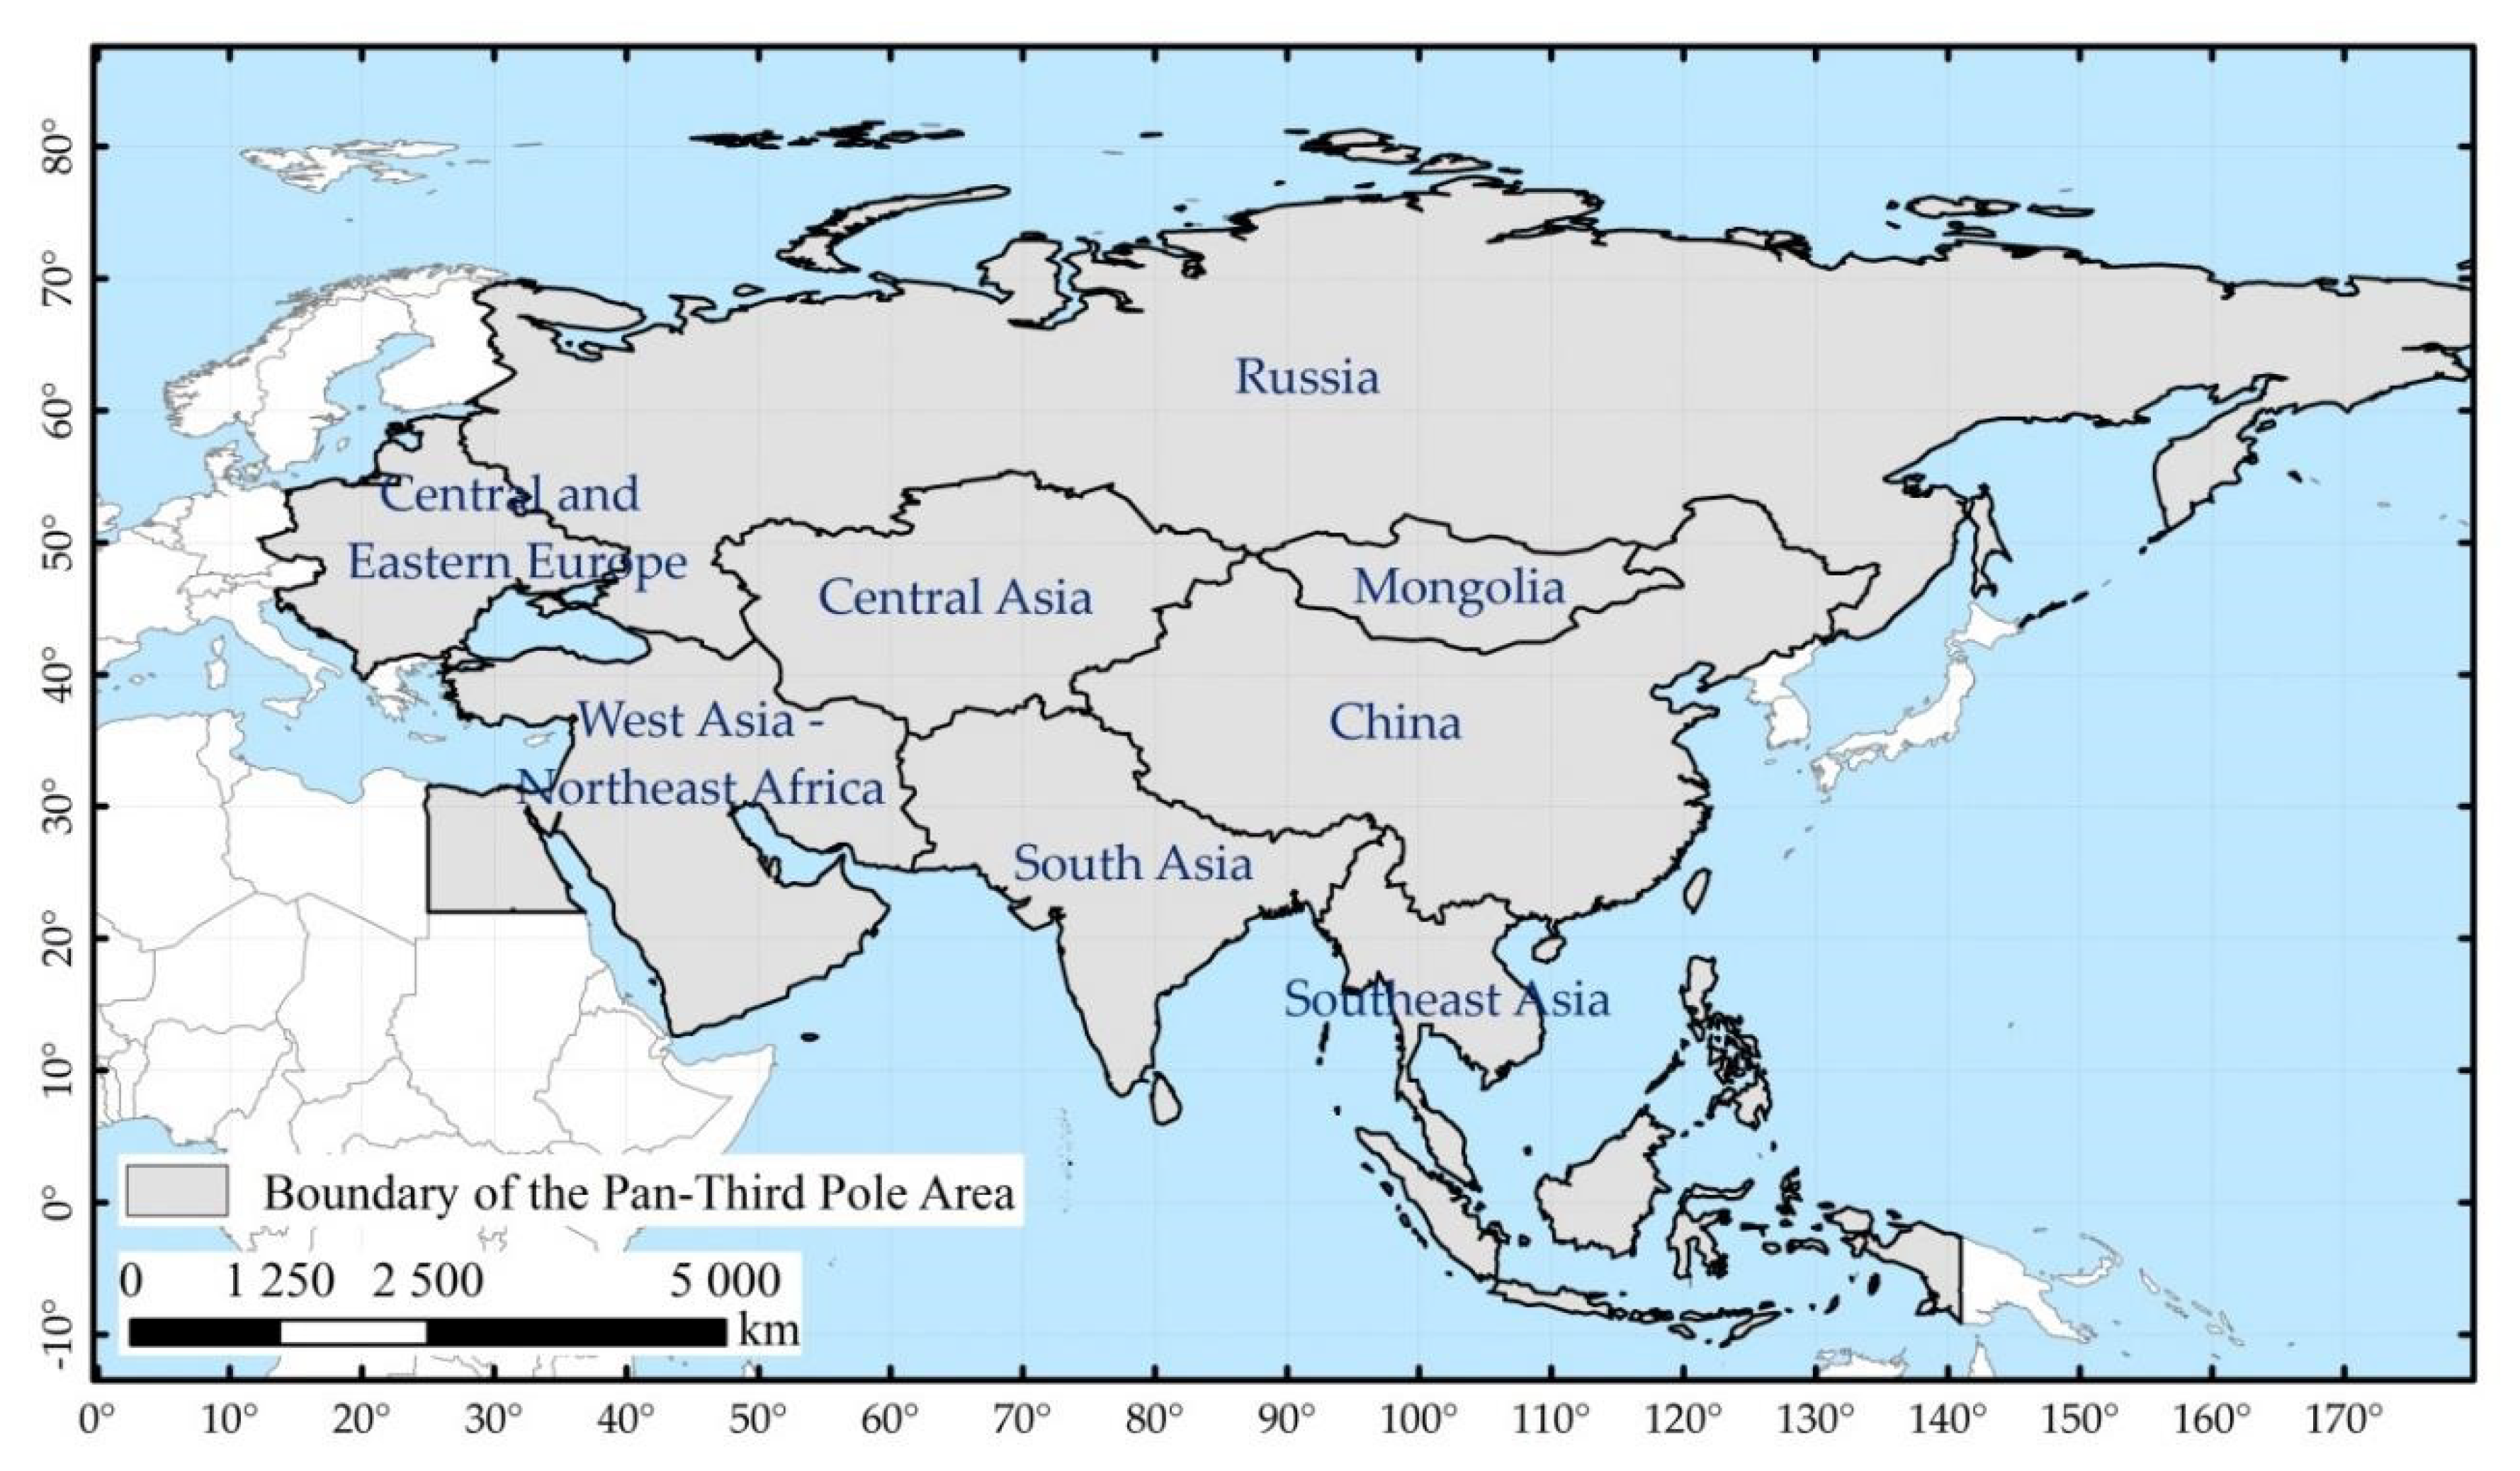
2.1. Study Area
2.2. Base Data
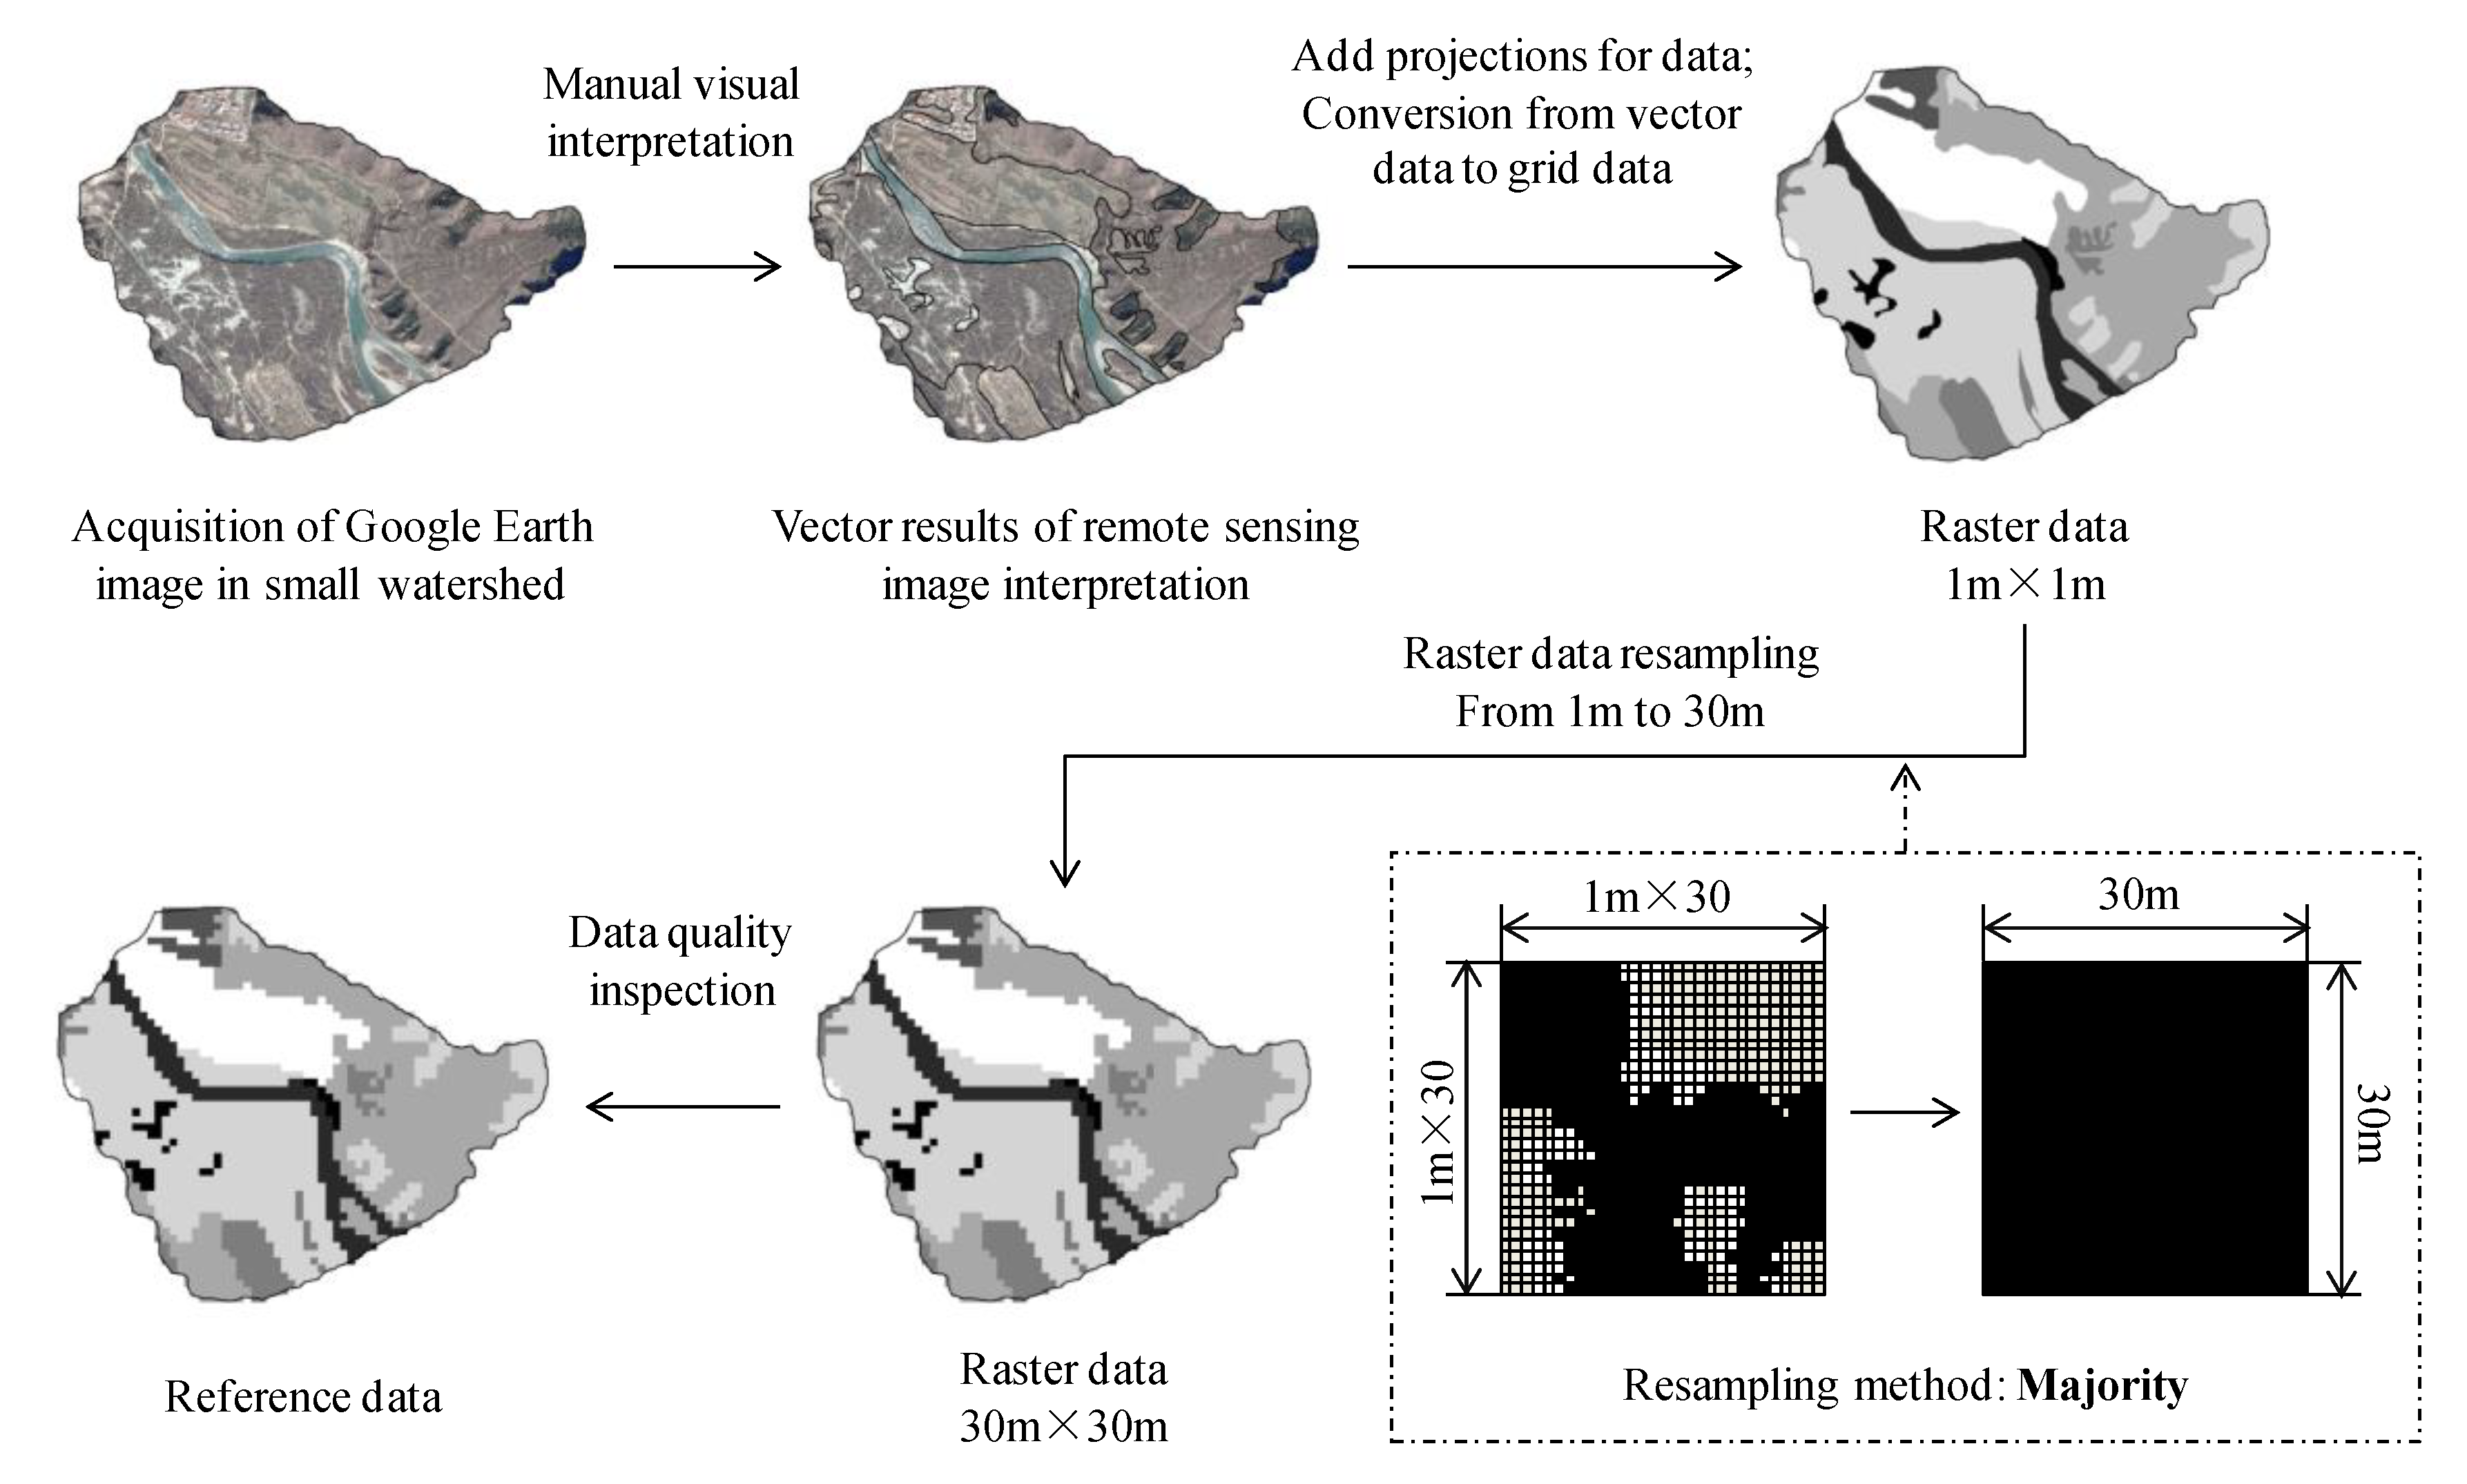
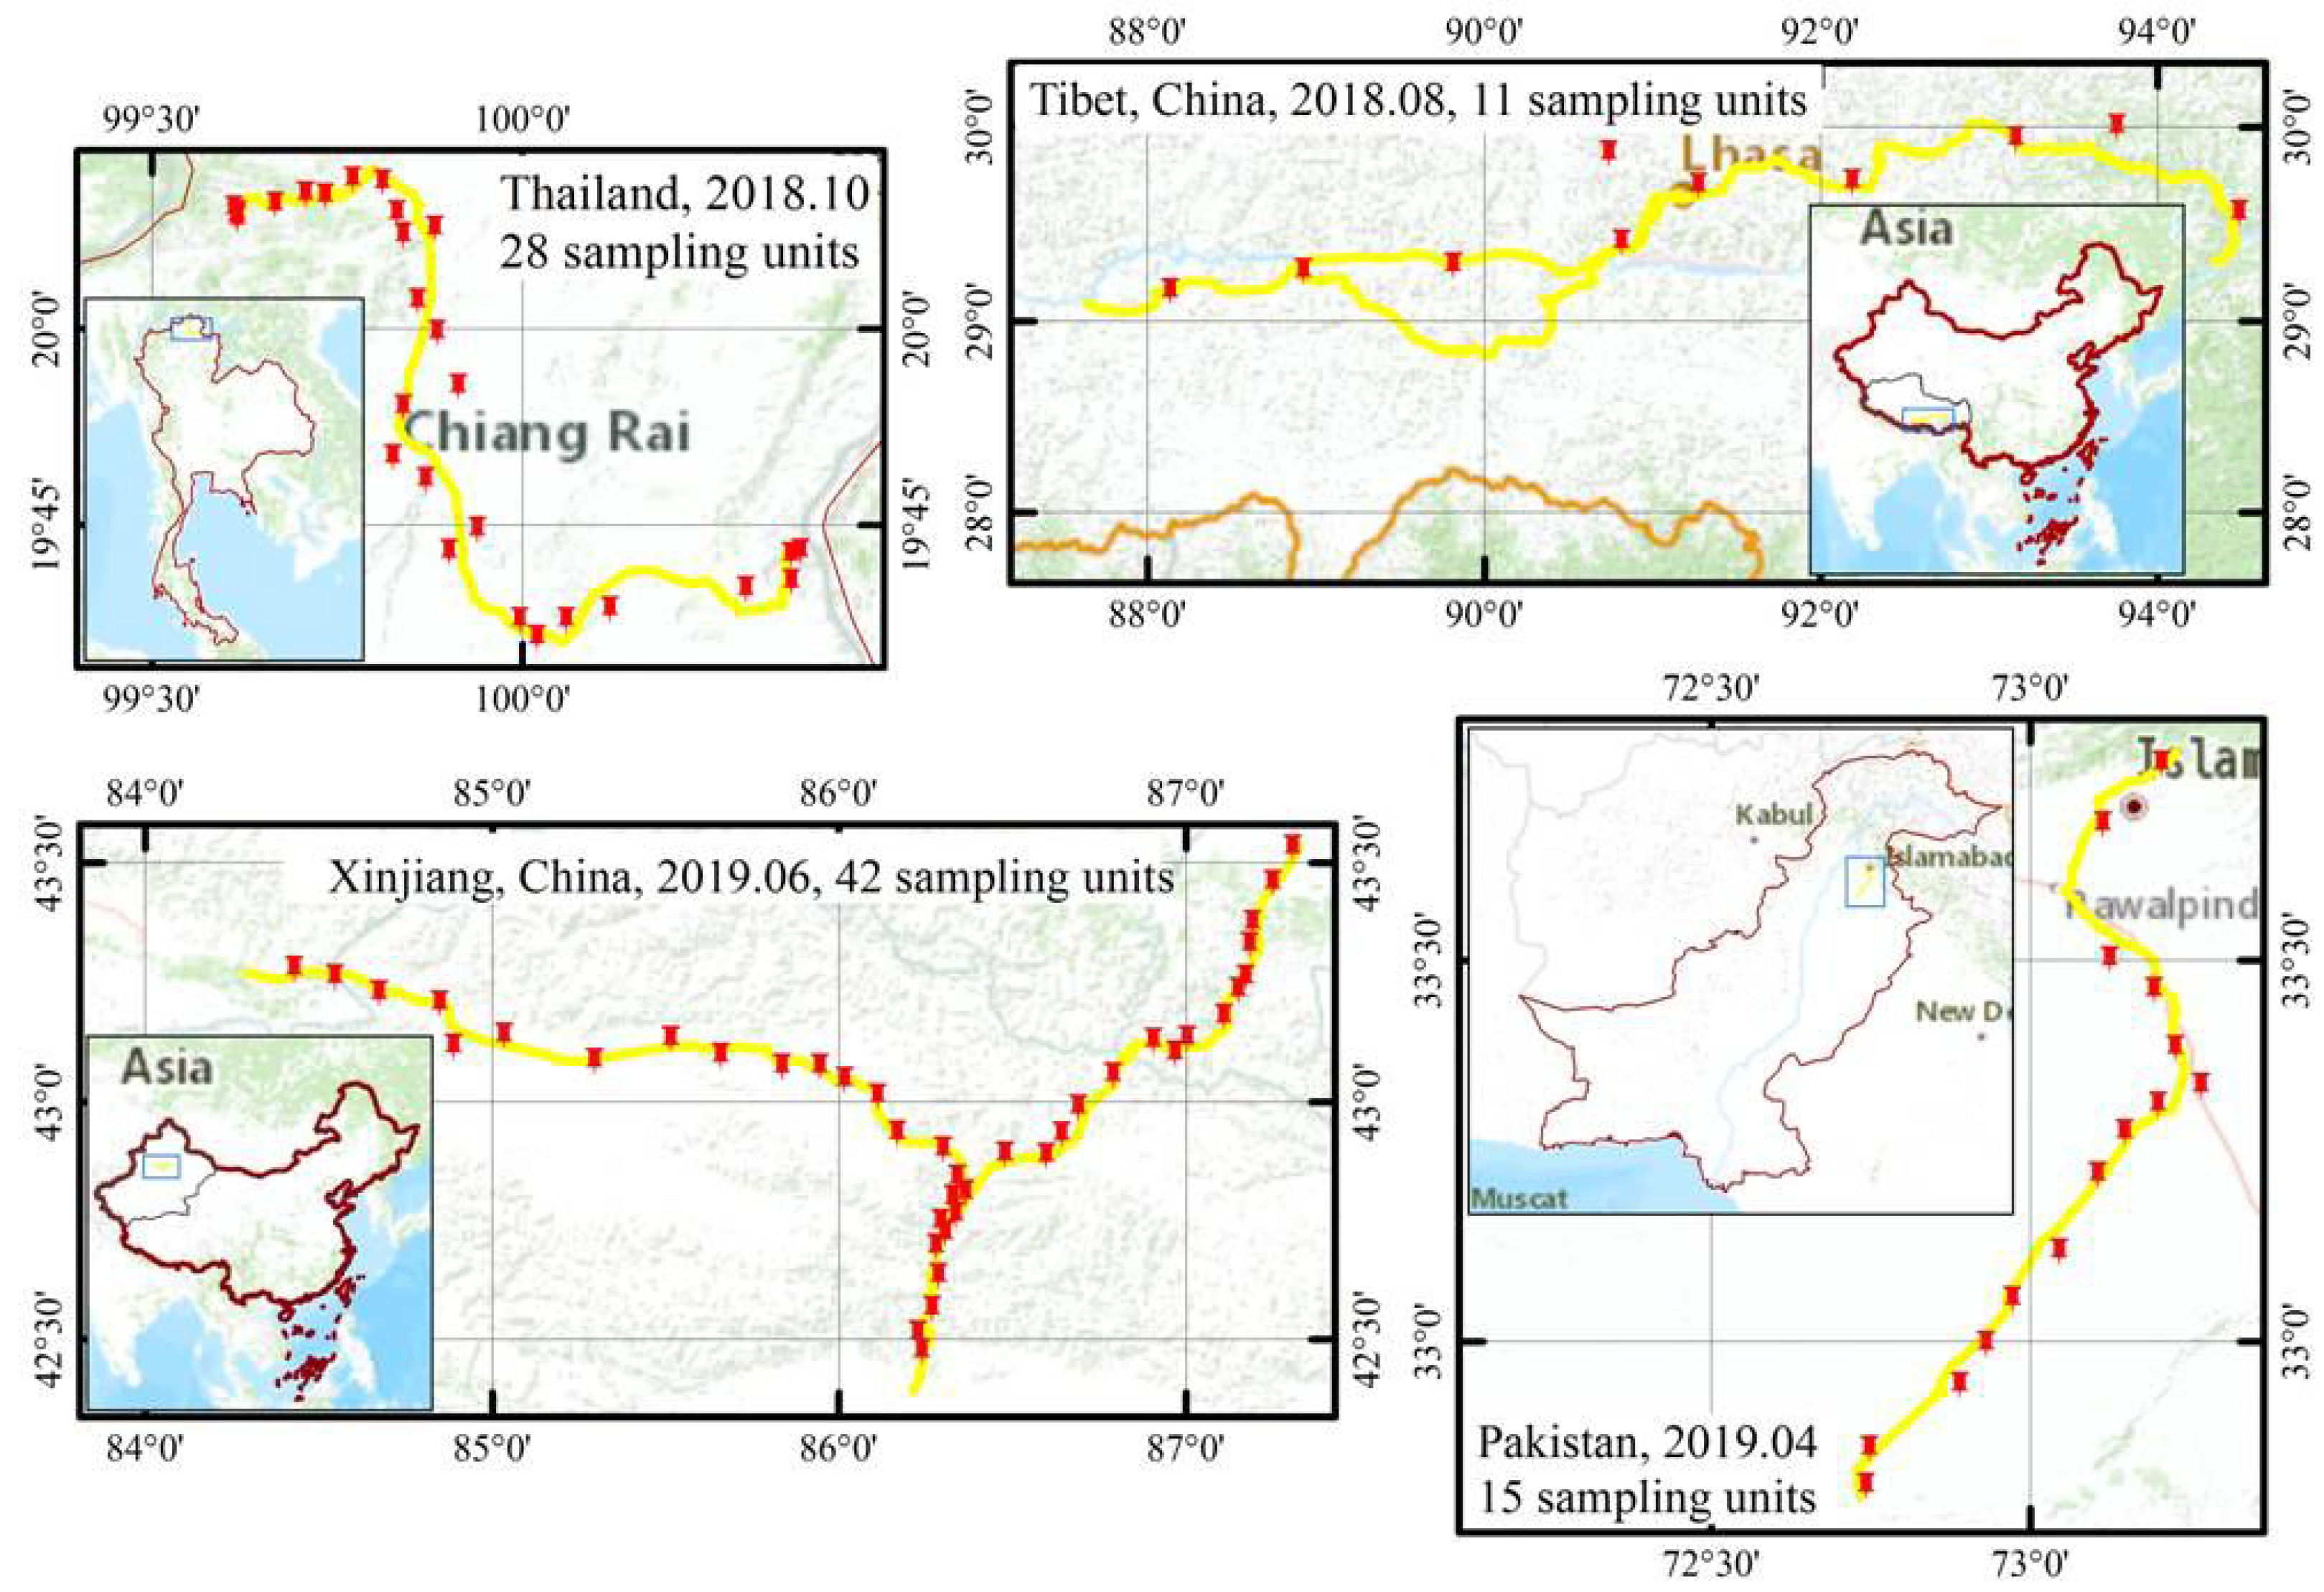
2.2.1. Sampling Units (SUs) and Source of Reference Data
2.2.2. FROM-GLC30 2017 Dataset
2.3. Accuracy Assessment Methods
2.3.1. Area Proportion Analysis
2.3.2. Accuracy Assessment Index
3. Results
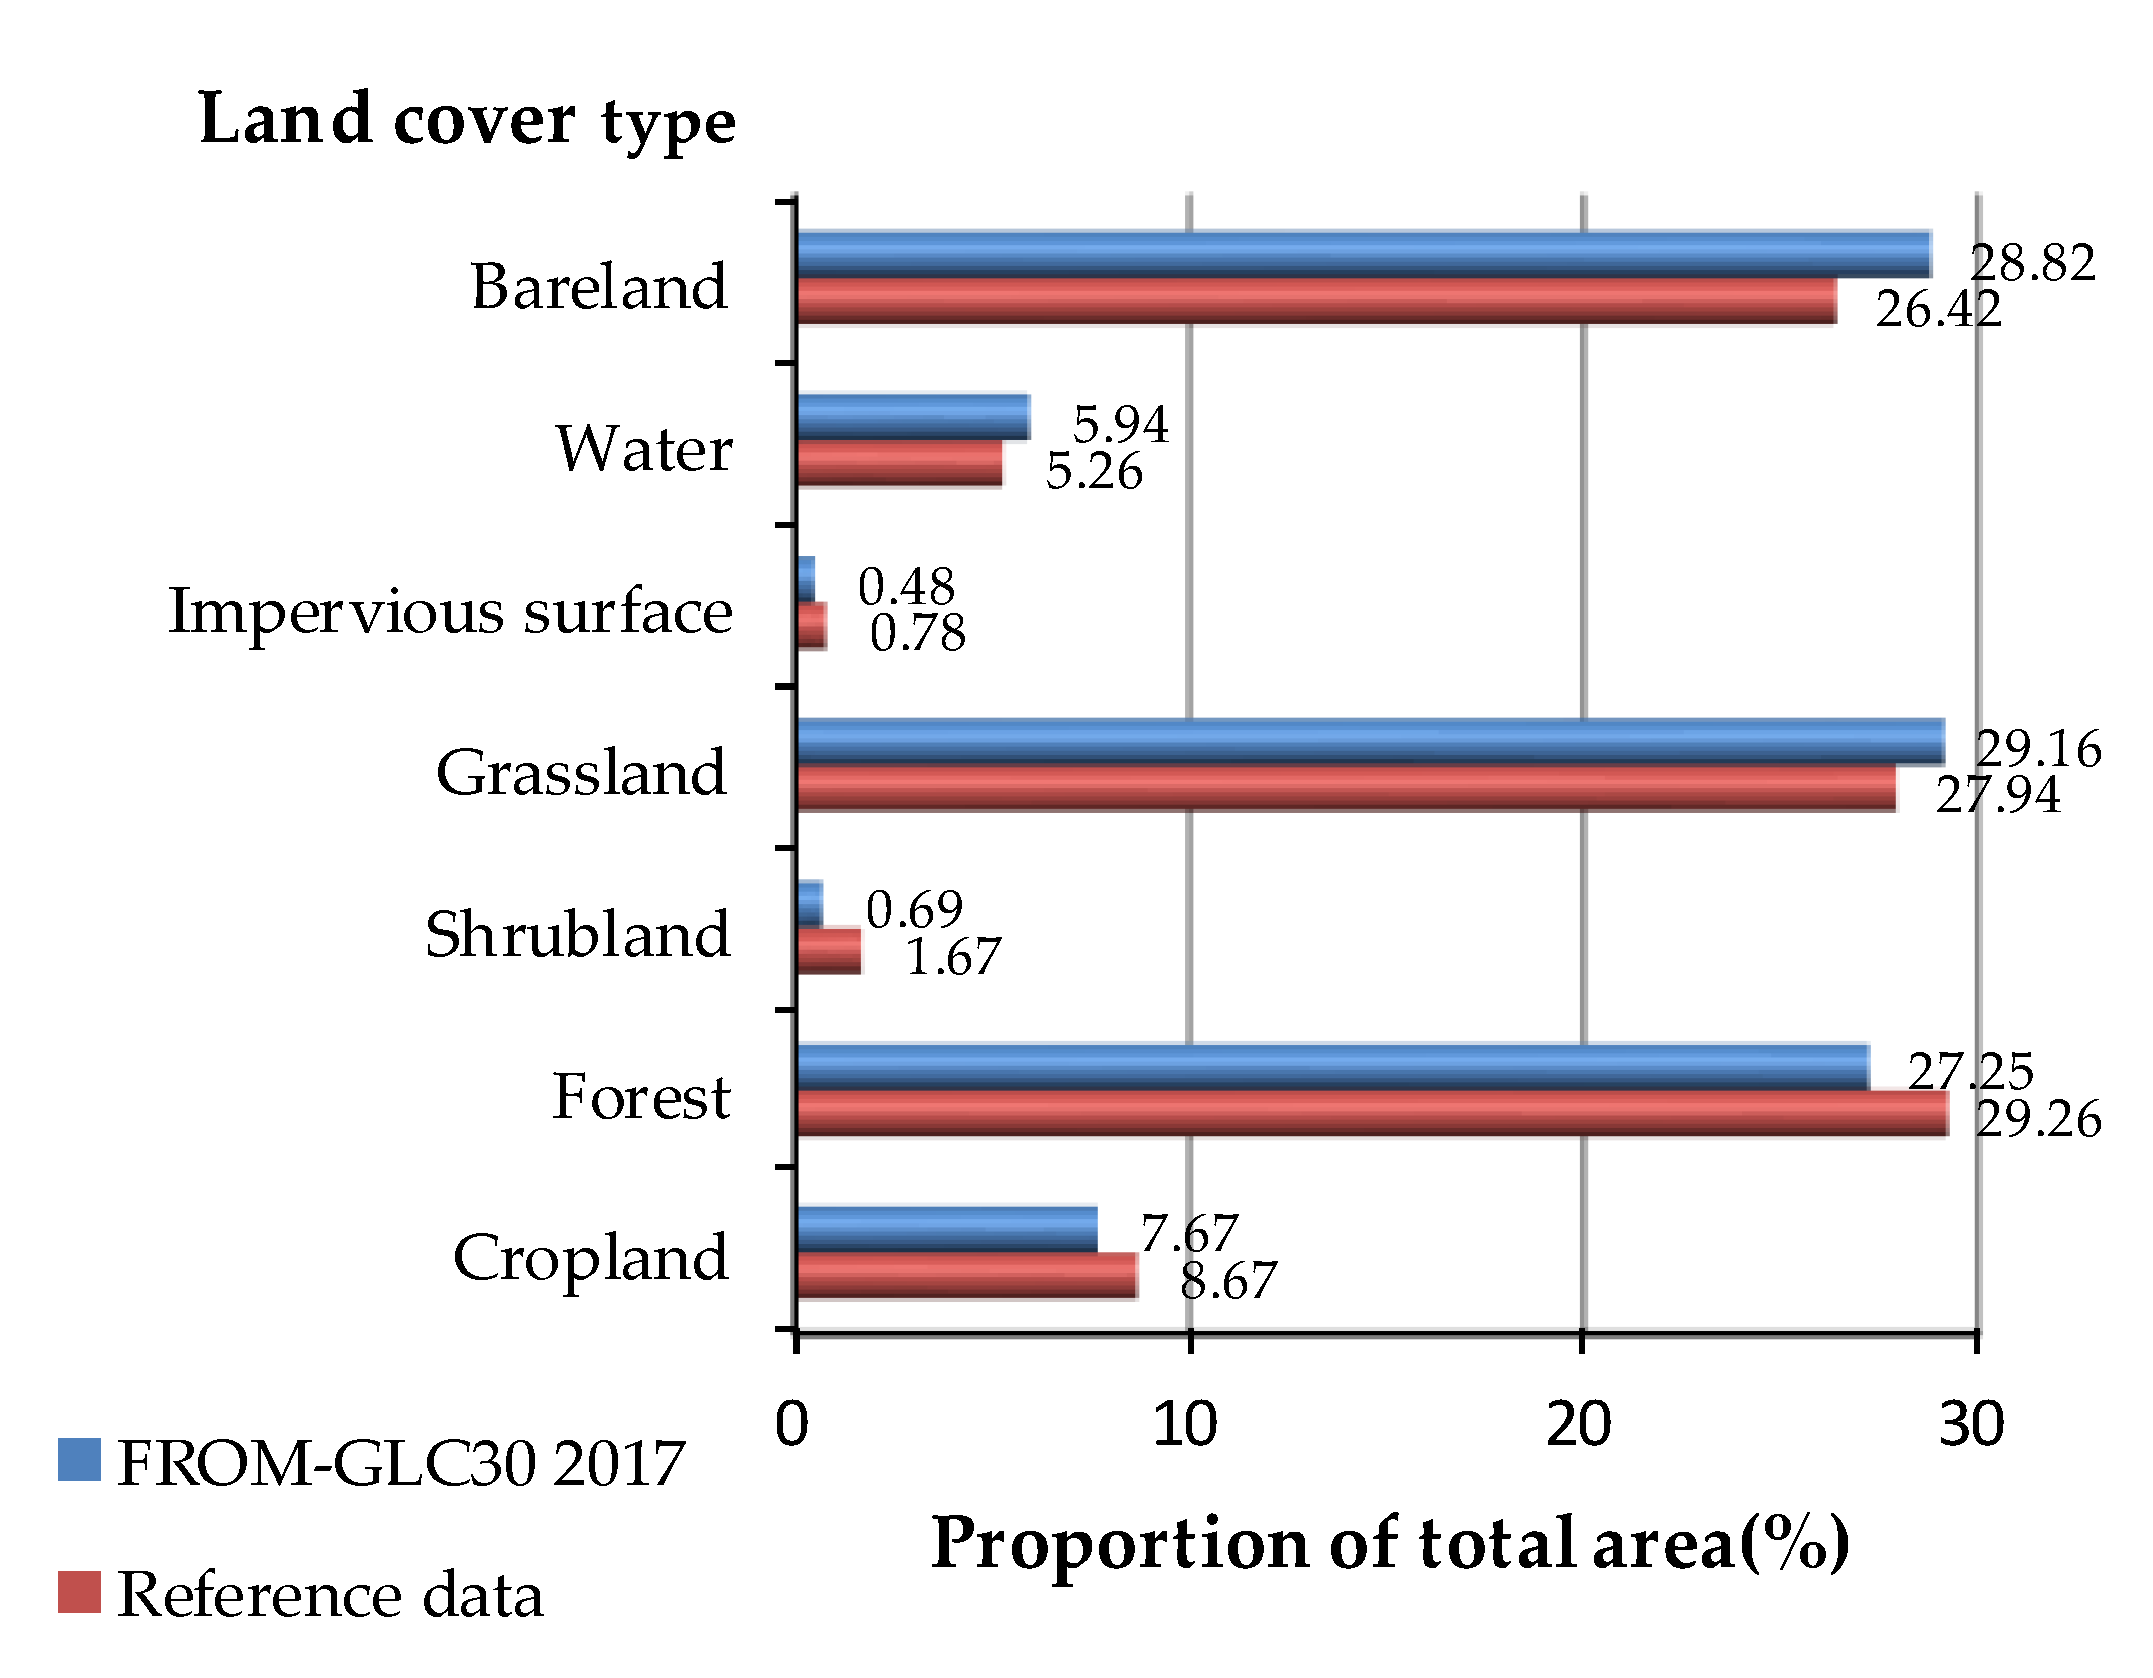
3.1. The Area Proportion Analysis of Each Land Cover Type
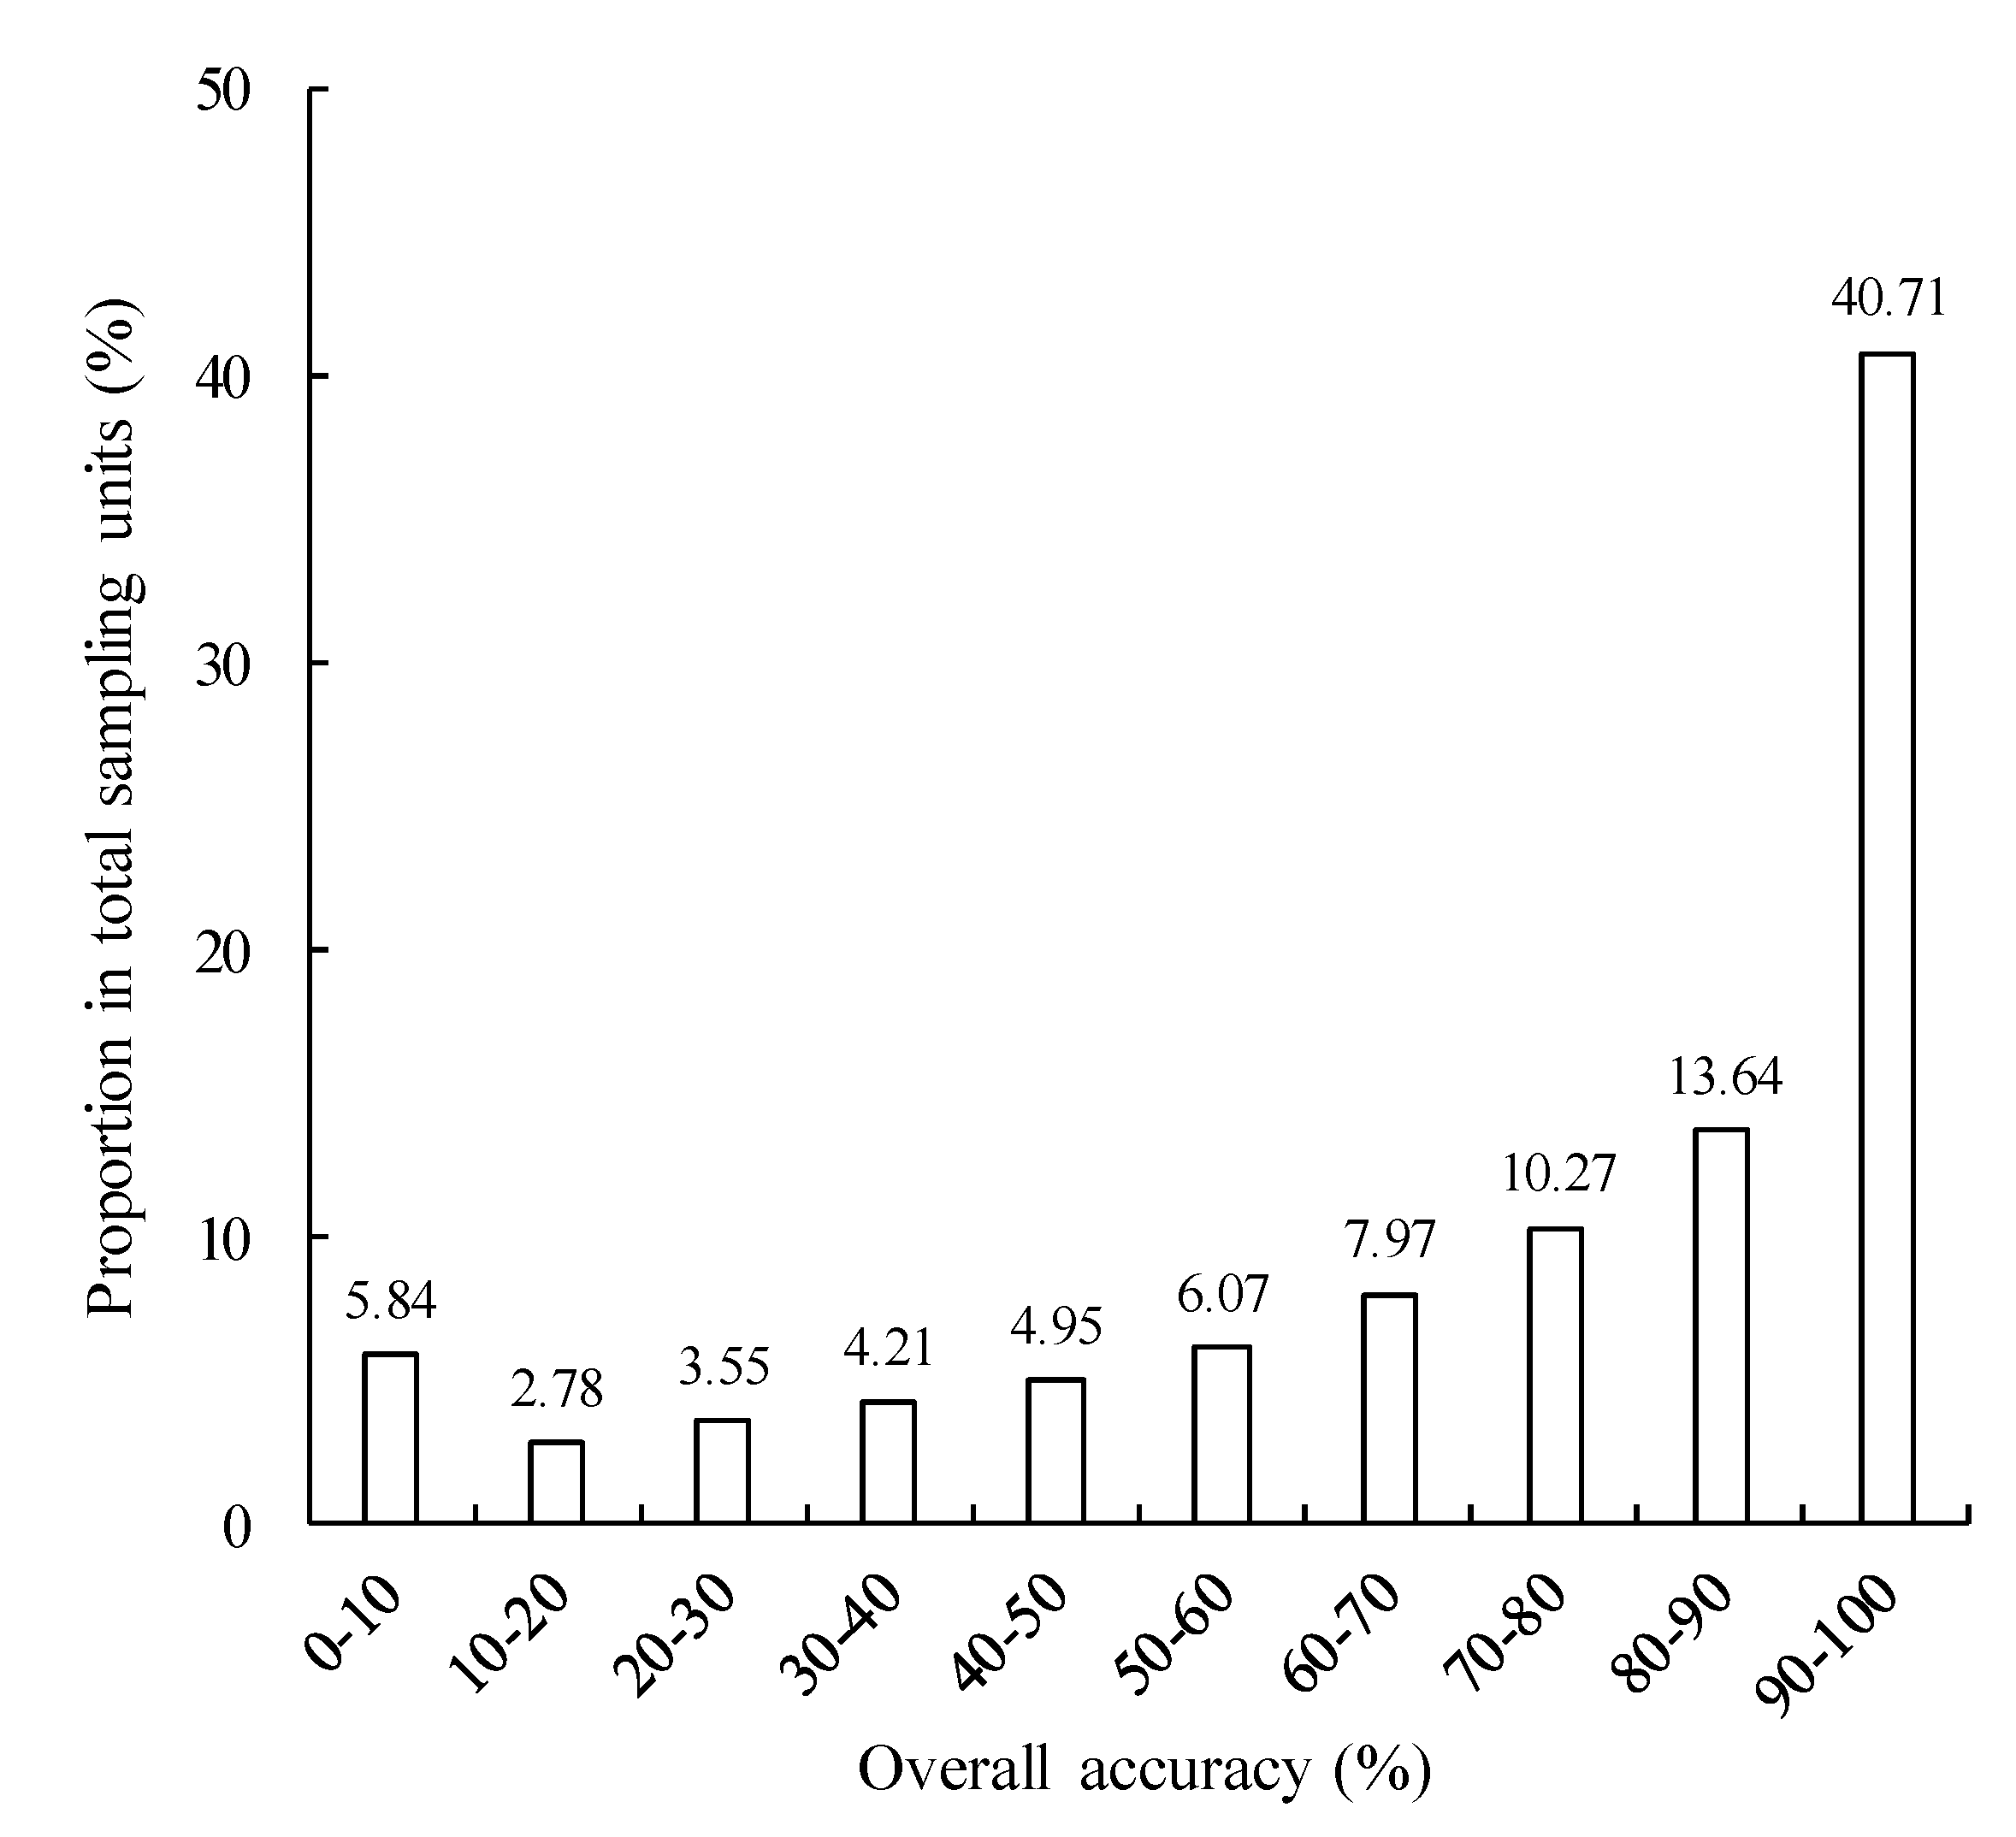
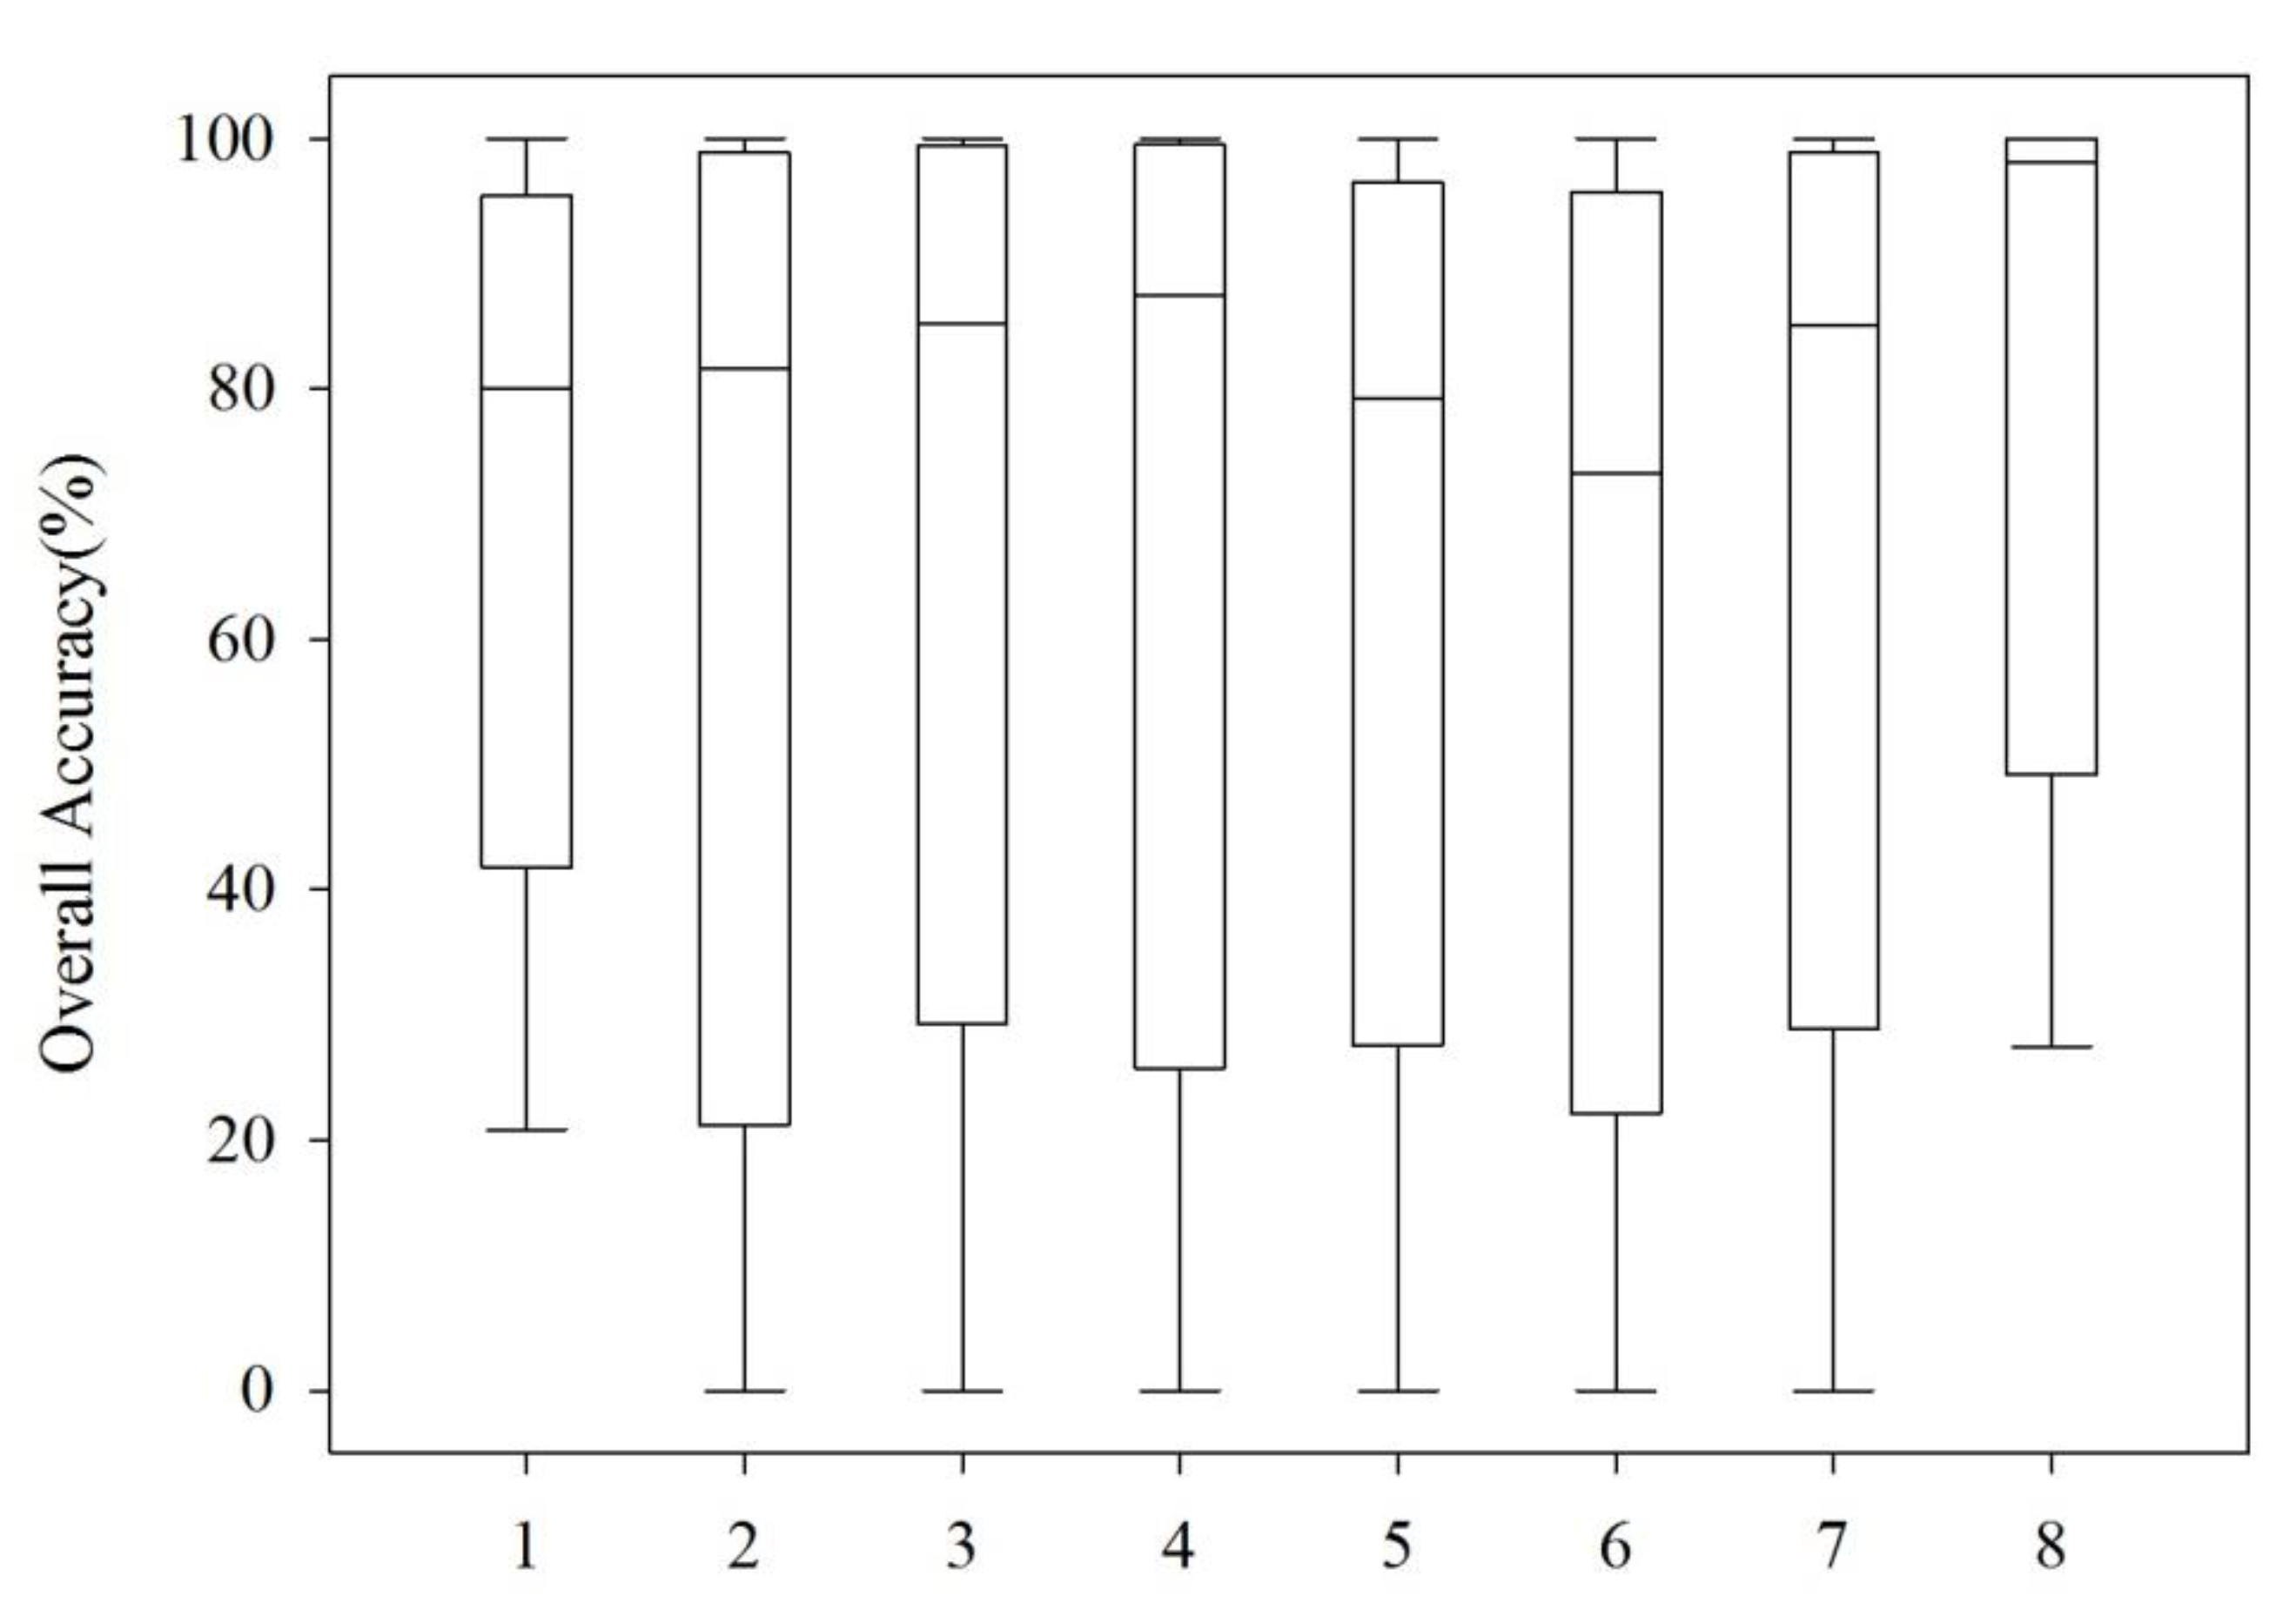
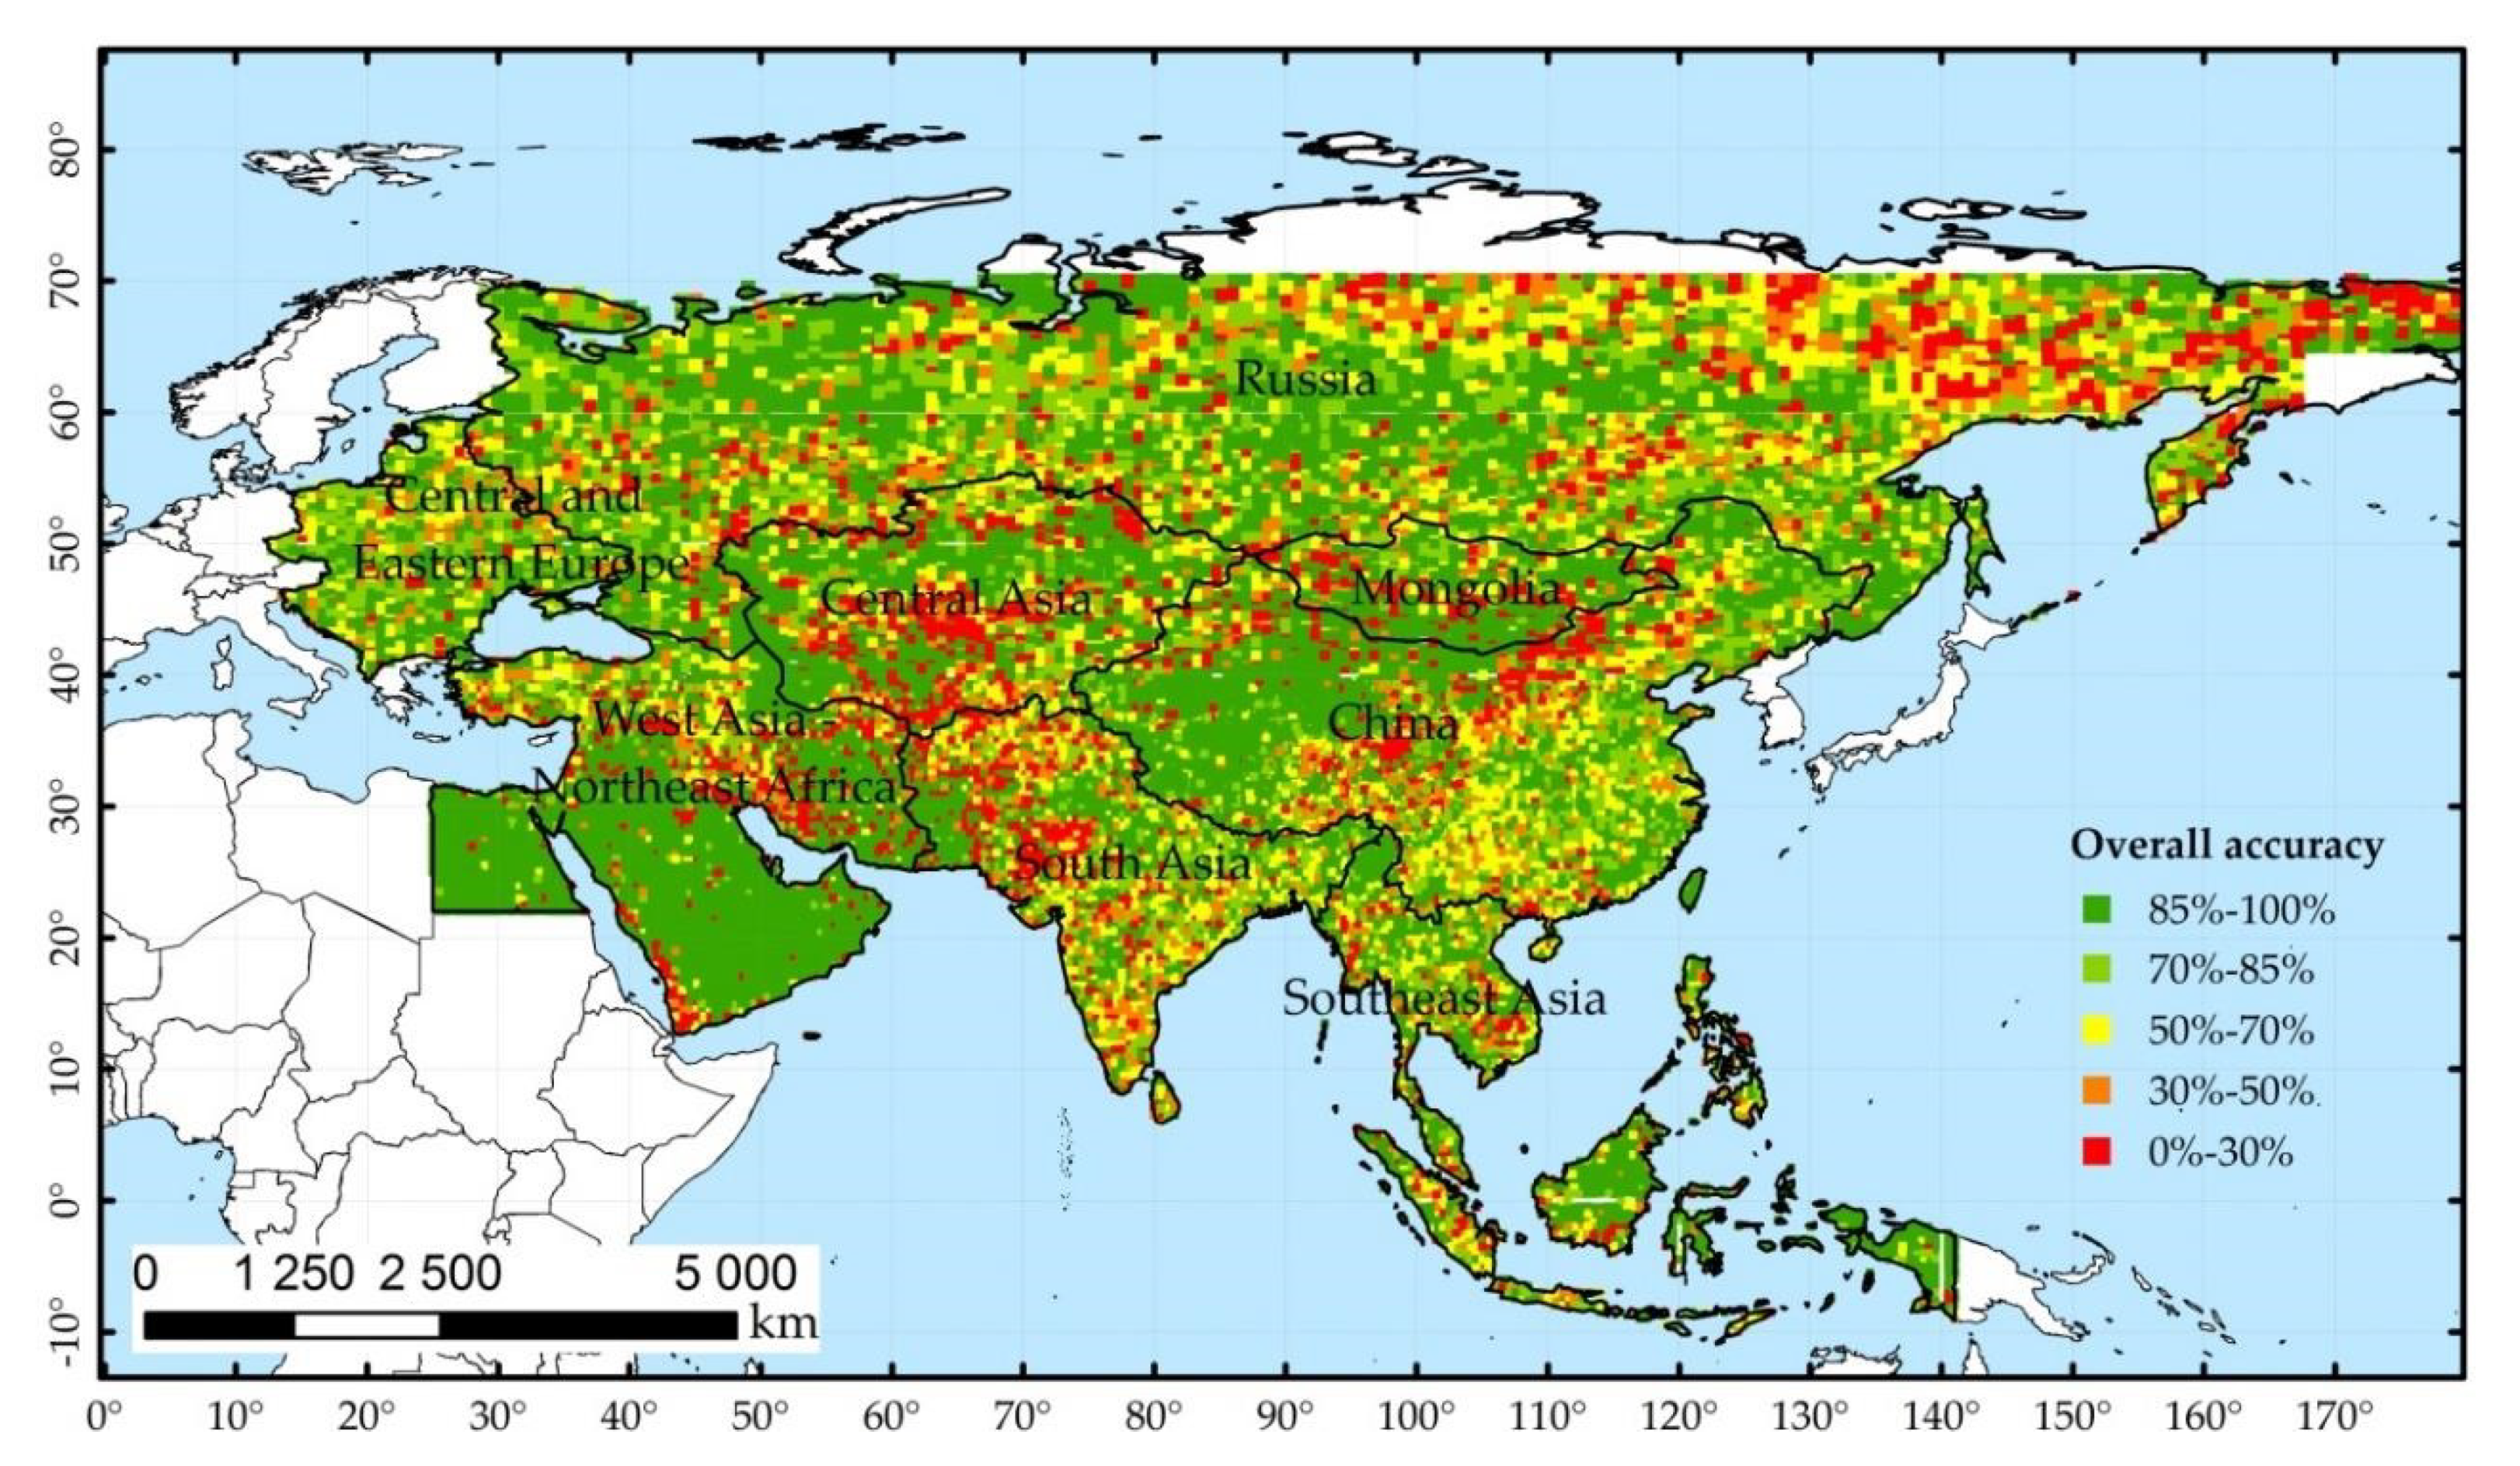
3.2. Overall Accuracy in Different Regions
3.3. Regional Accuracy of Different Land Cover Types
4. Discussion
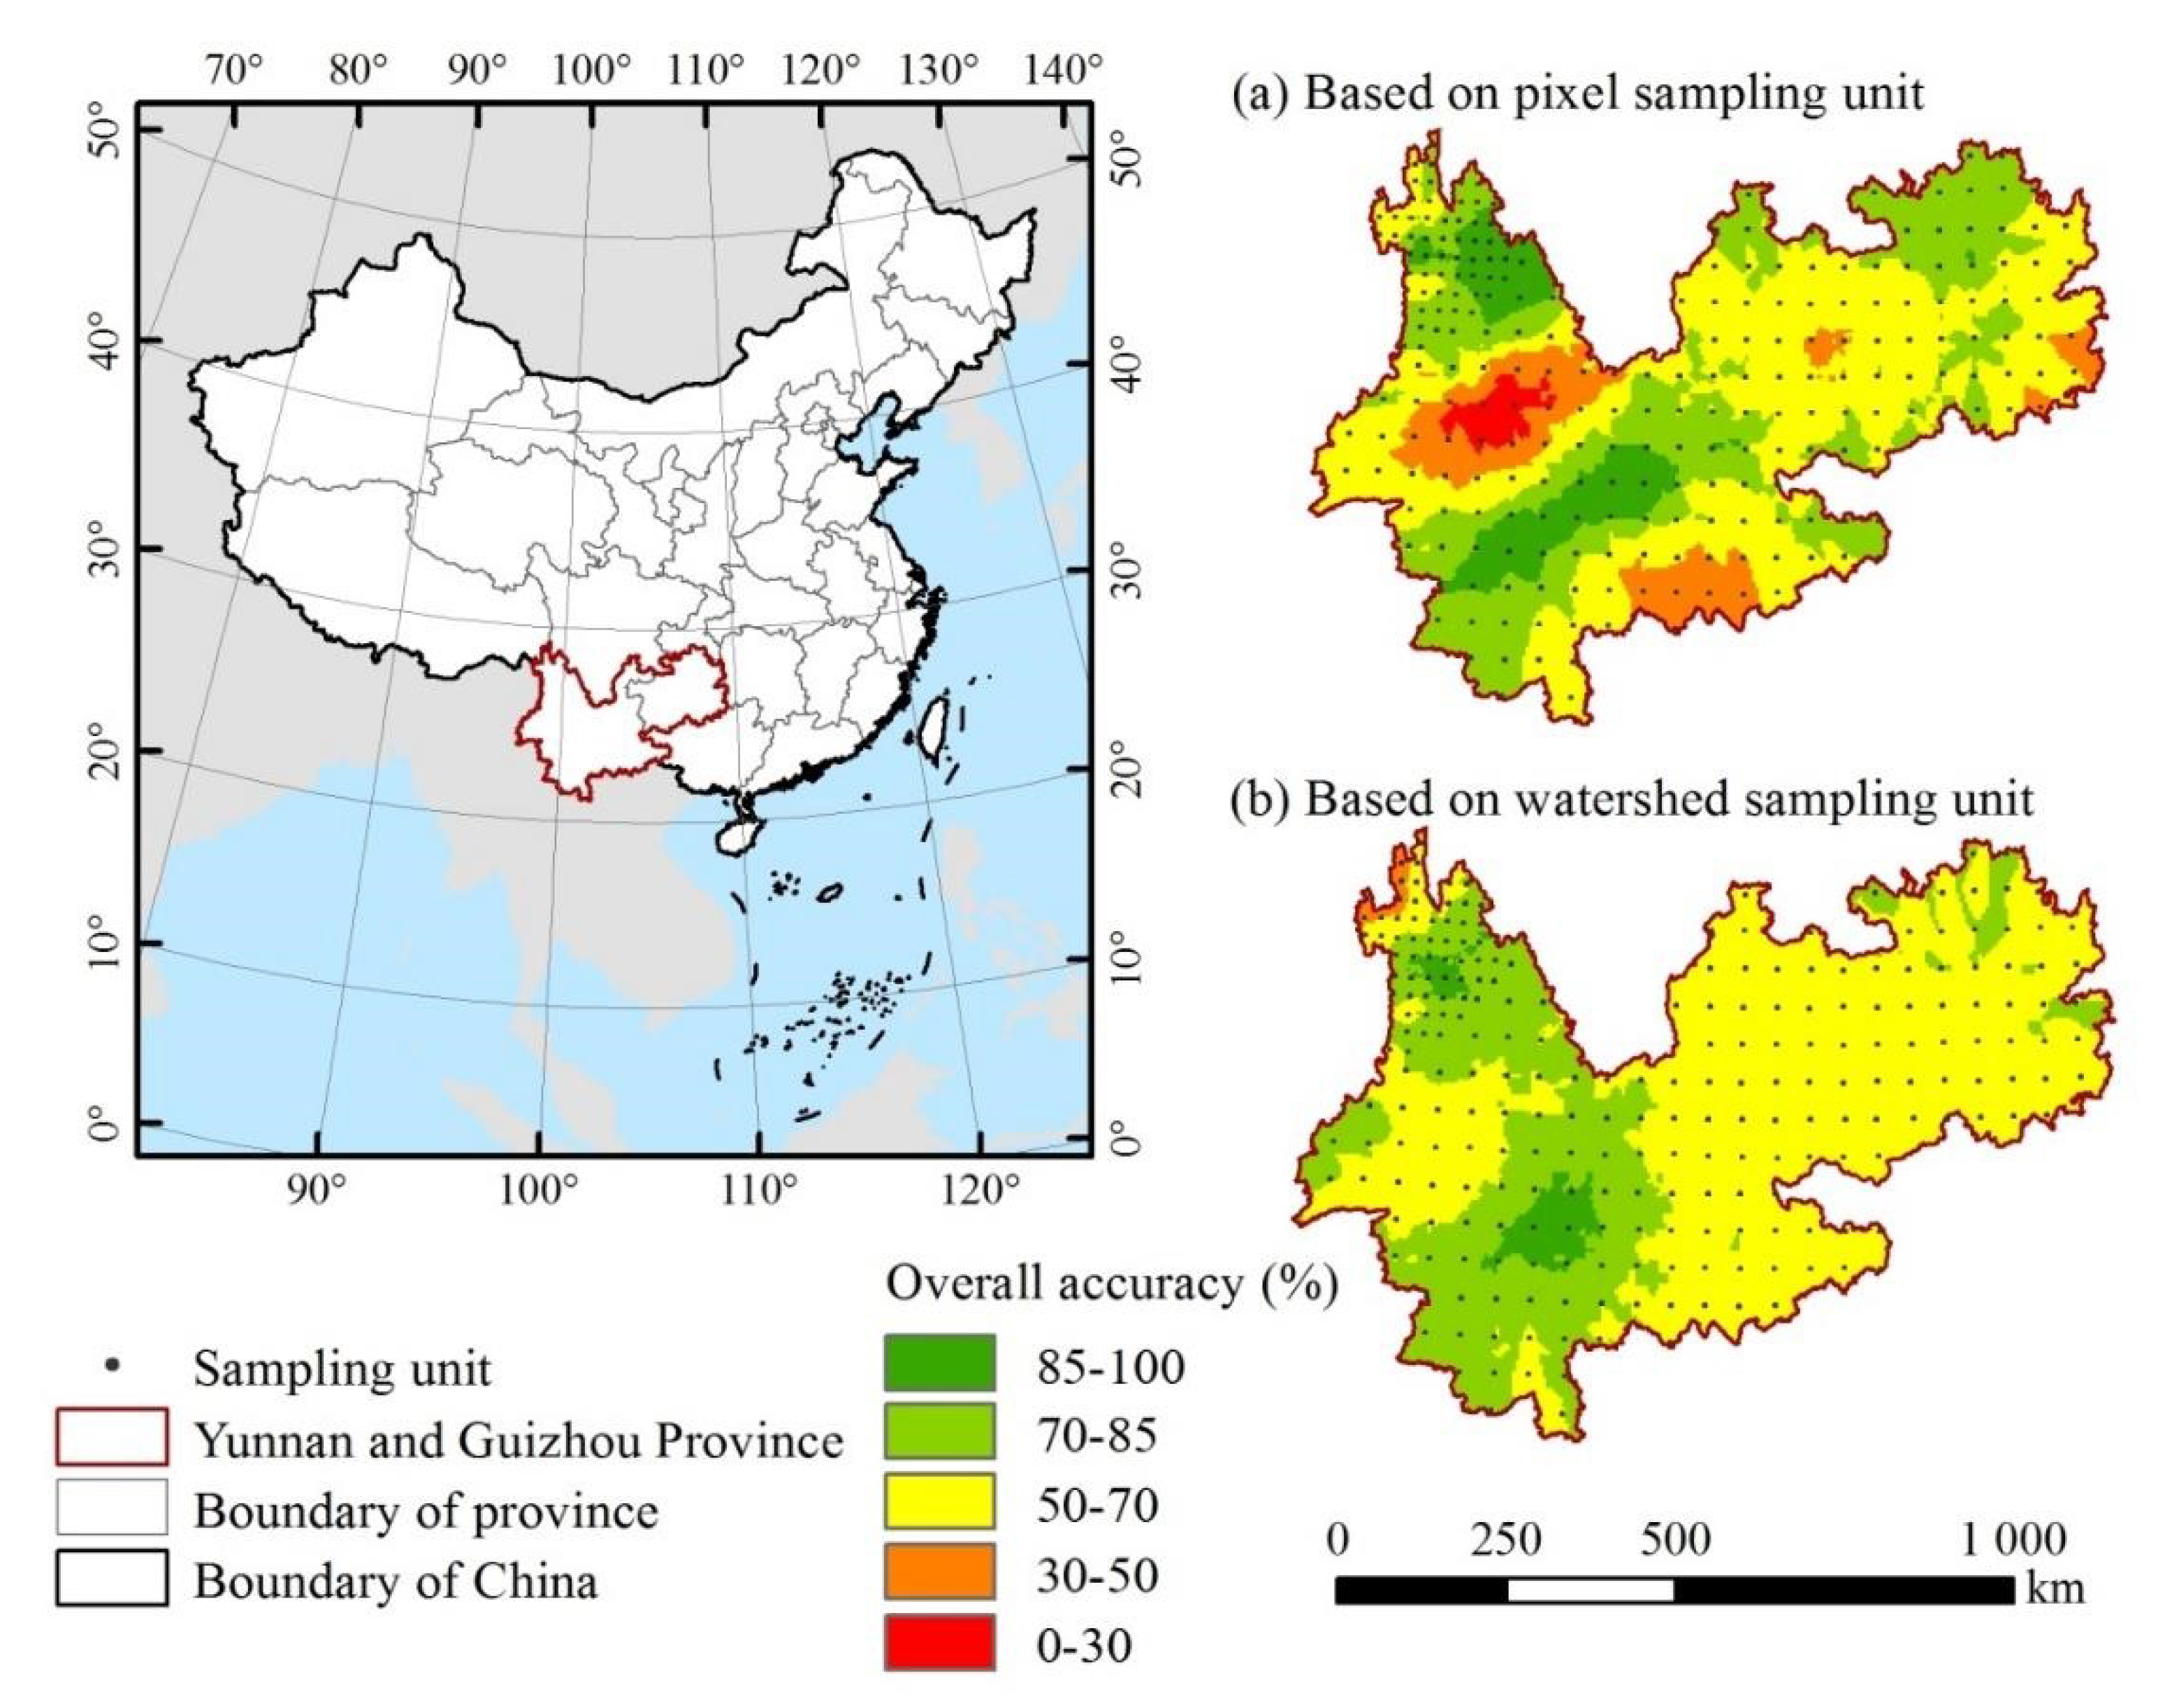
4.1. The Influence of Sampling Units on Land Cover Accuracy: Small Watershed vs. Pixel
4.2. Geographical Interpretation of the Spatial Differentiation of the FROM-GLC30 2017 Dataset Accuracy
4.3. Explanation of the Accuracy Differences between Different Land Cover Types
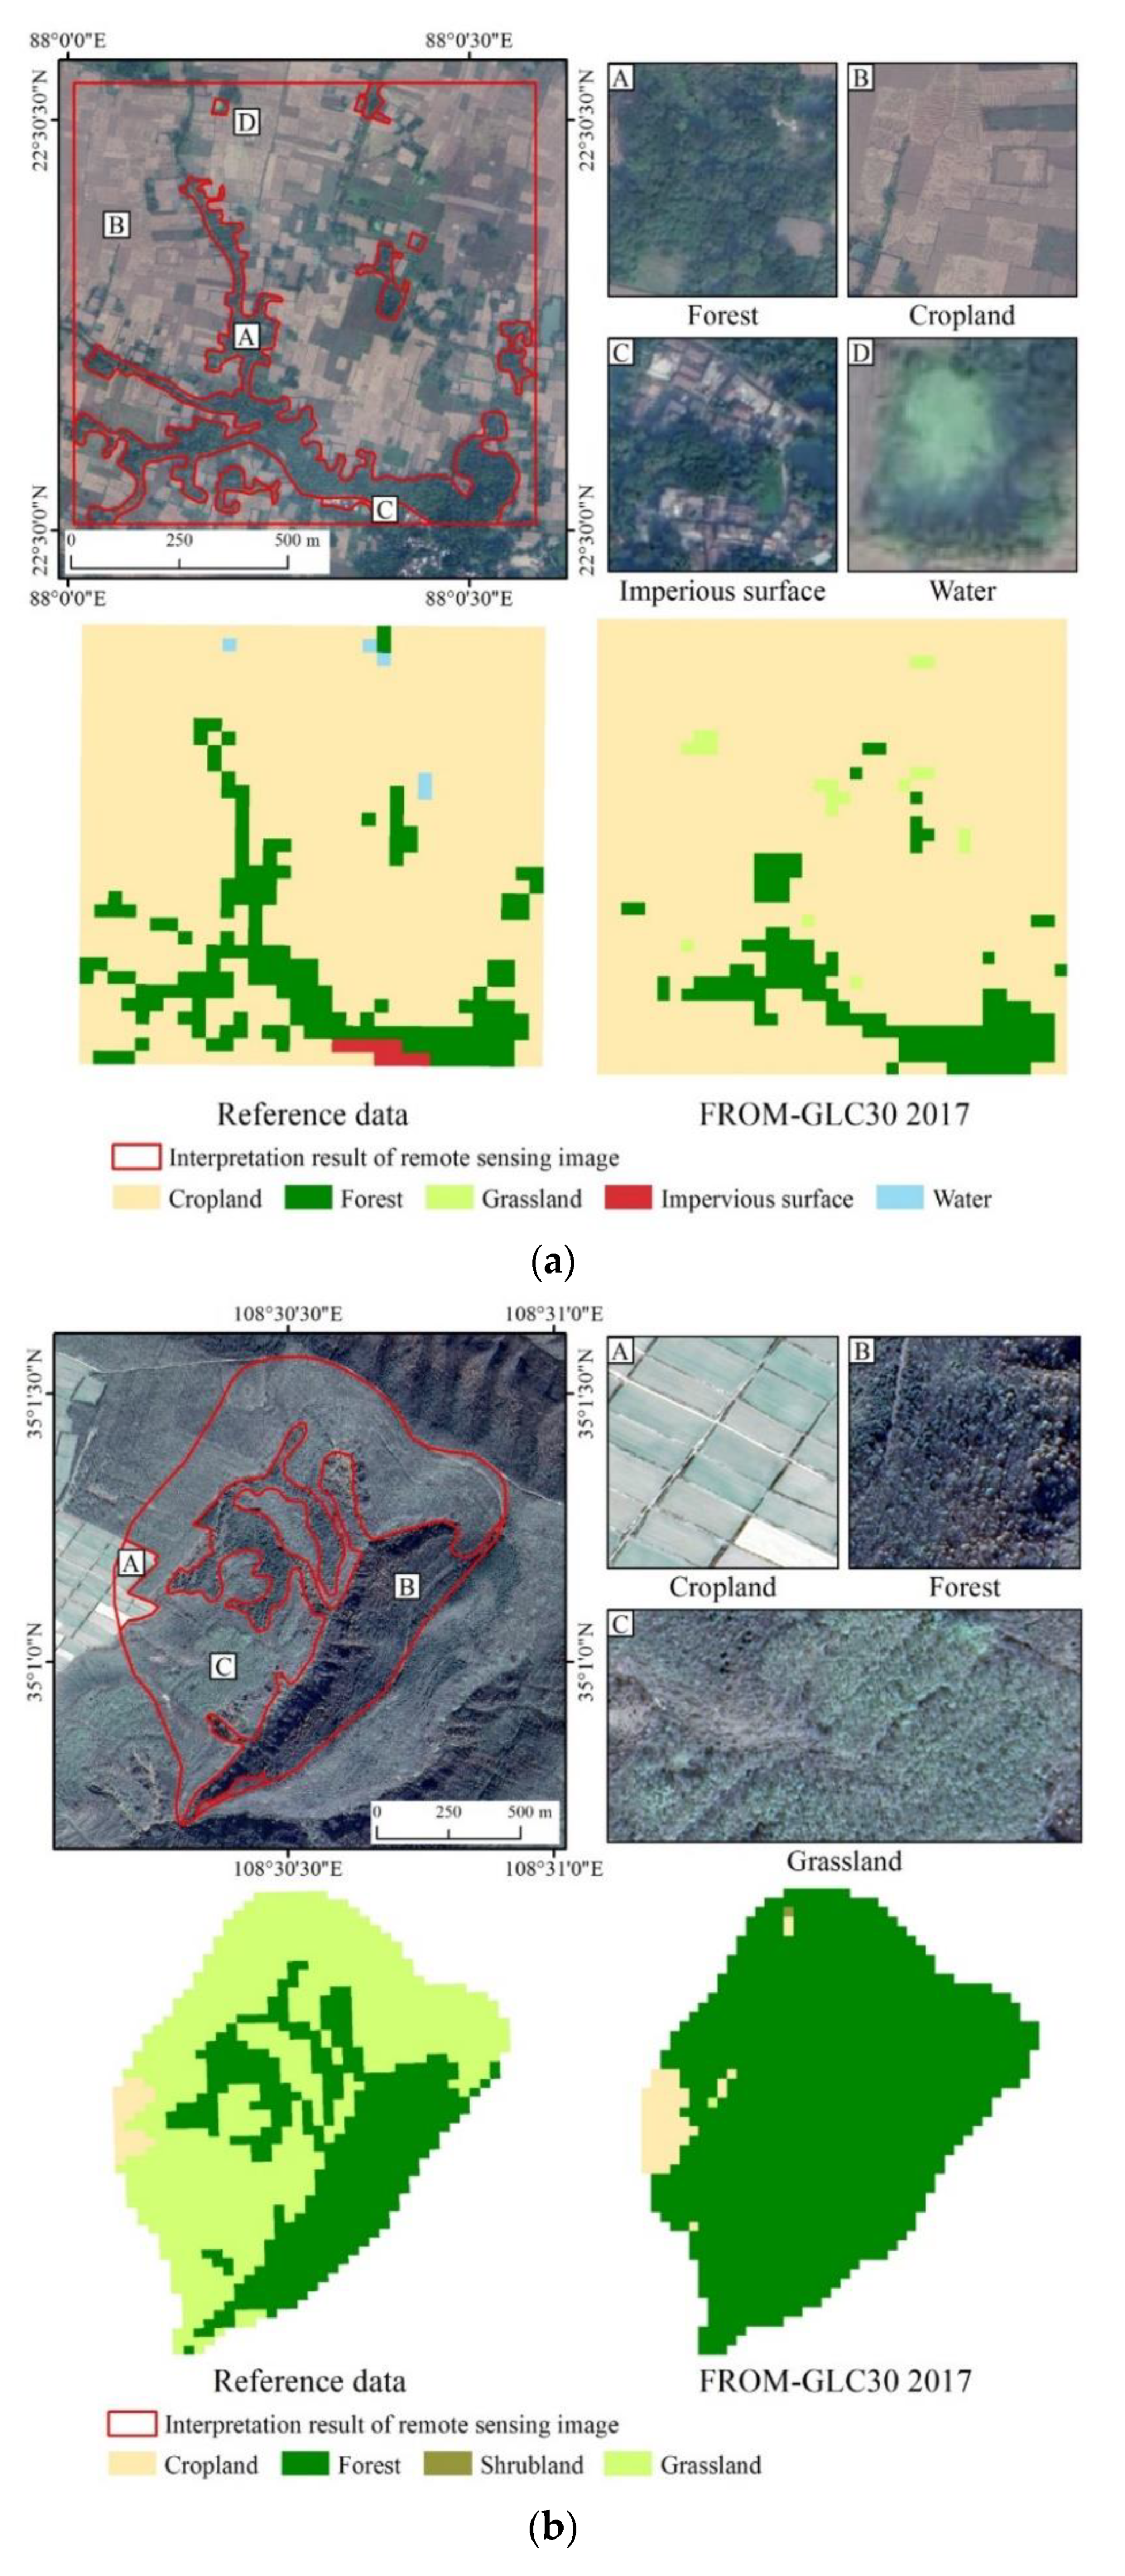
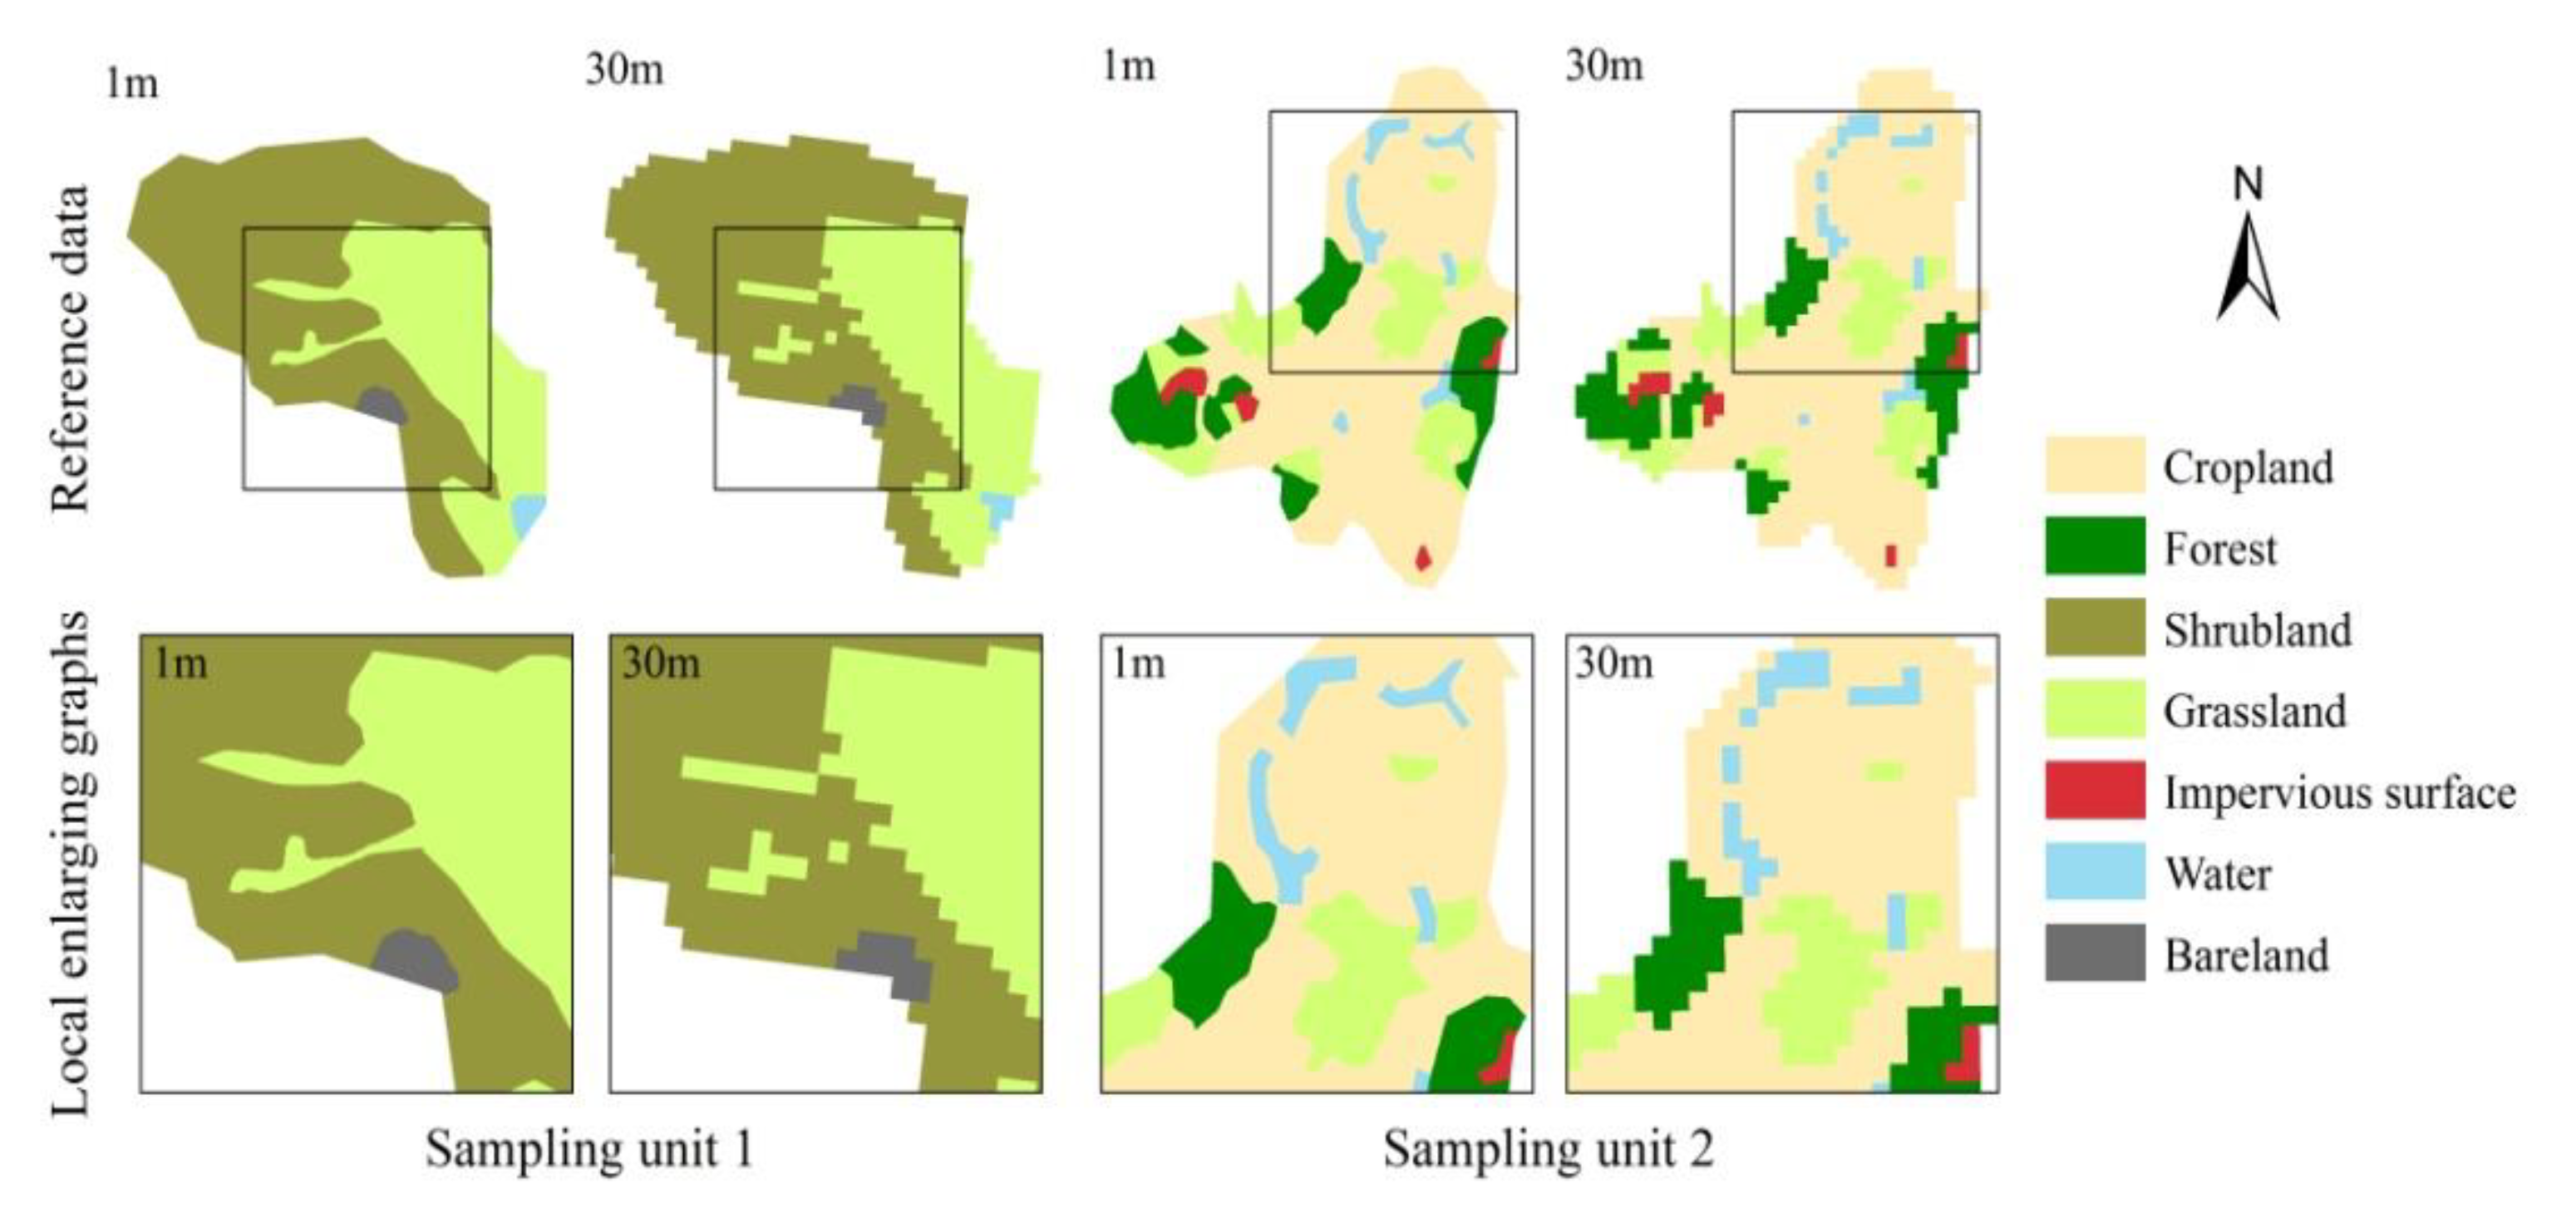
4.4. Scale Effect on Reference Data
5. Conclusions
- (1)
- In the study area, the proportion of land cover types in the FROM-GLC30 dataset was similar to that in the reference data. The difference between the two datasets for all the land types was small.
- (2)
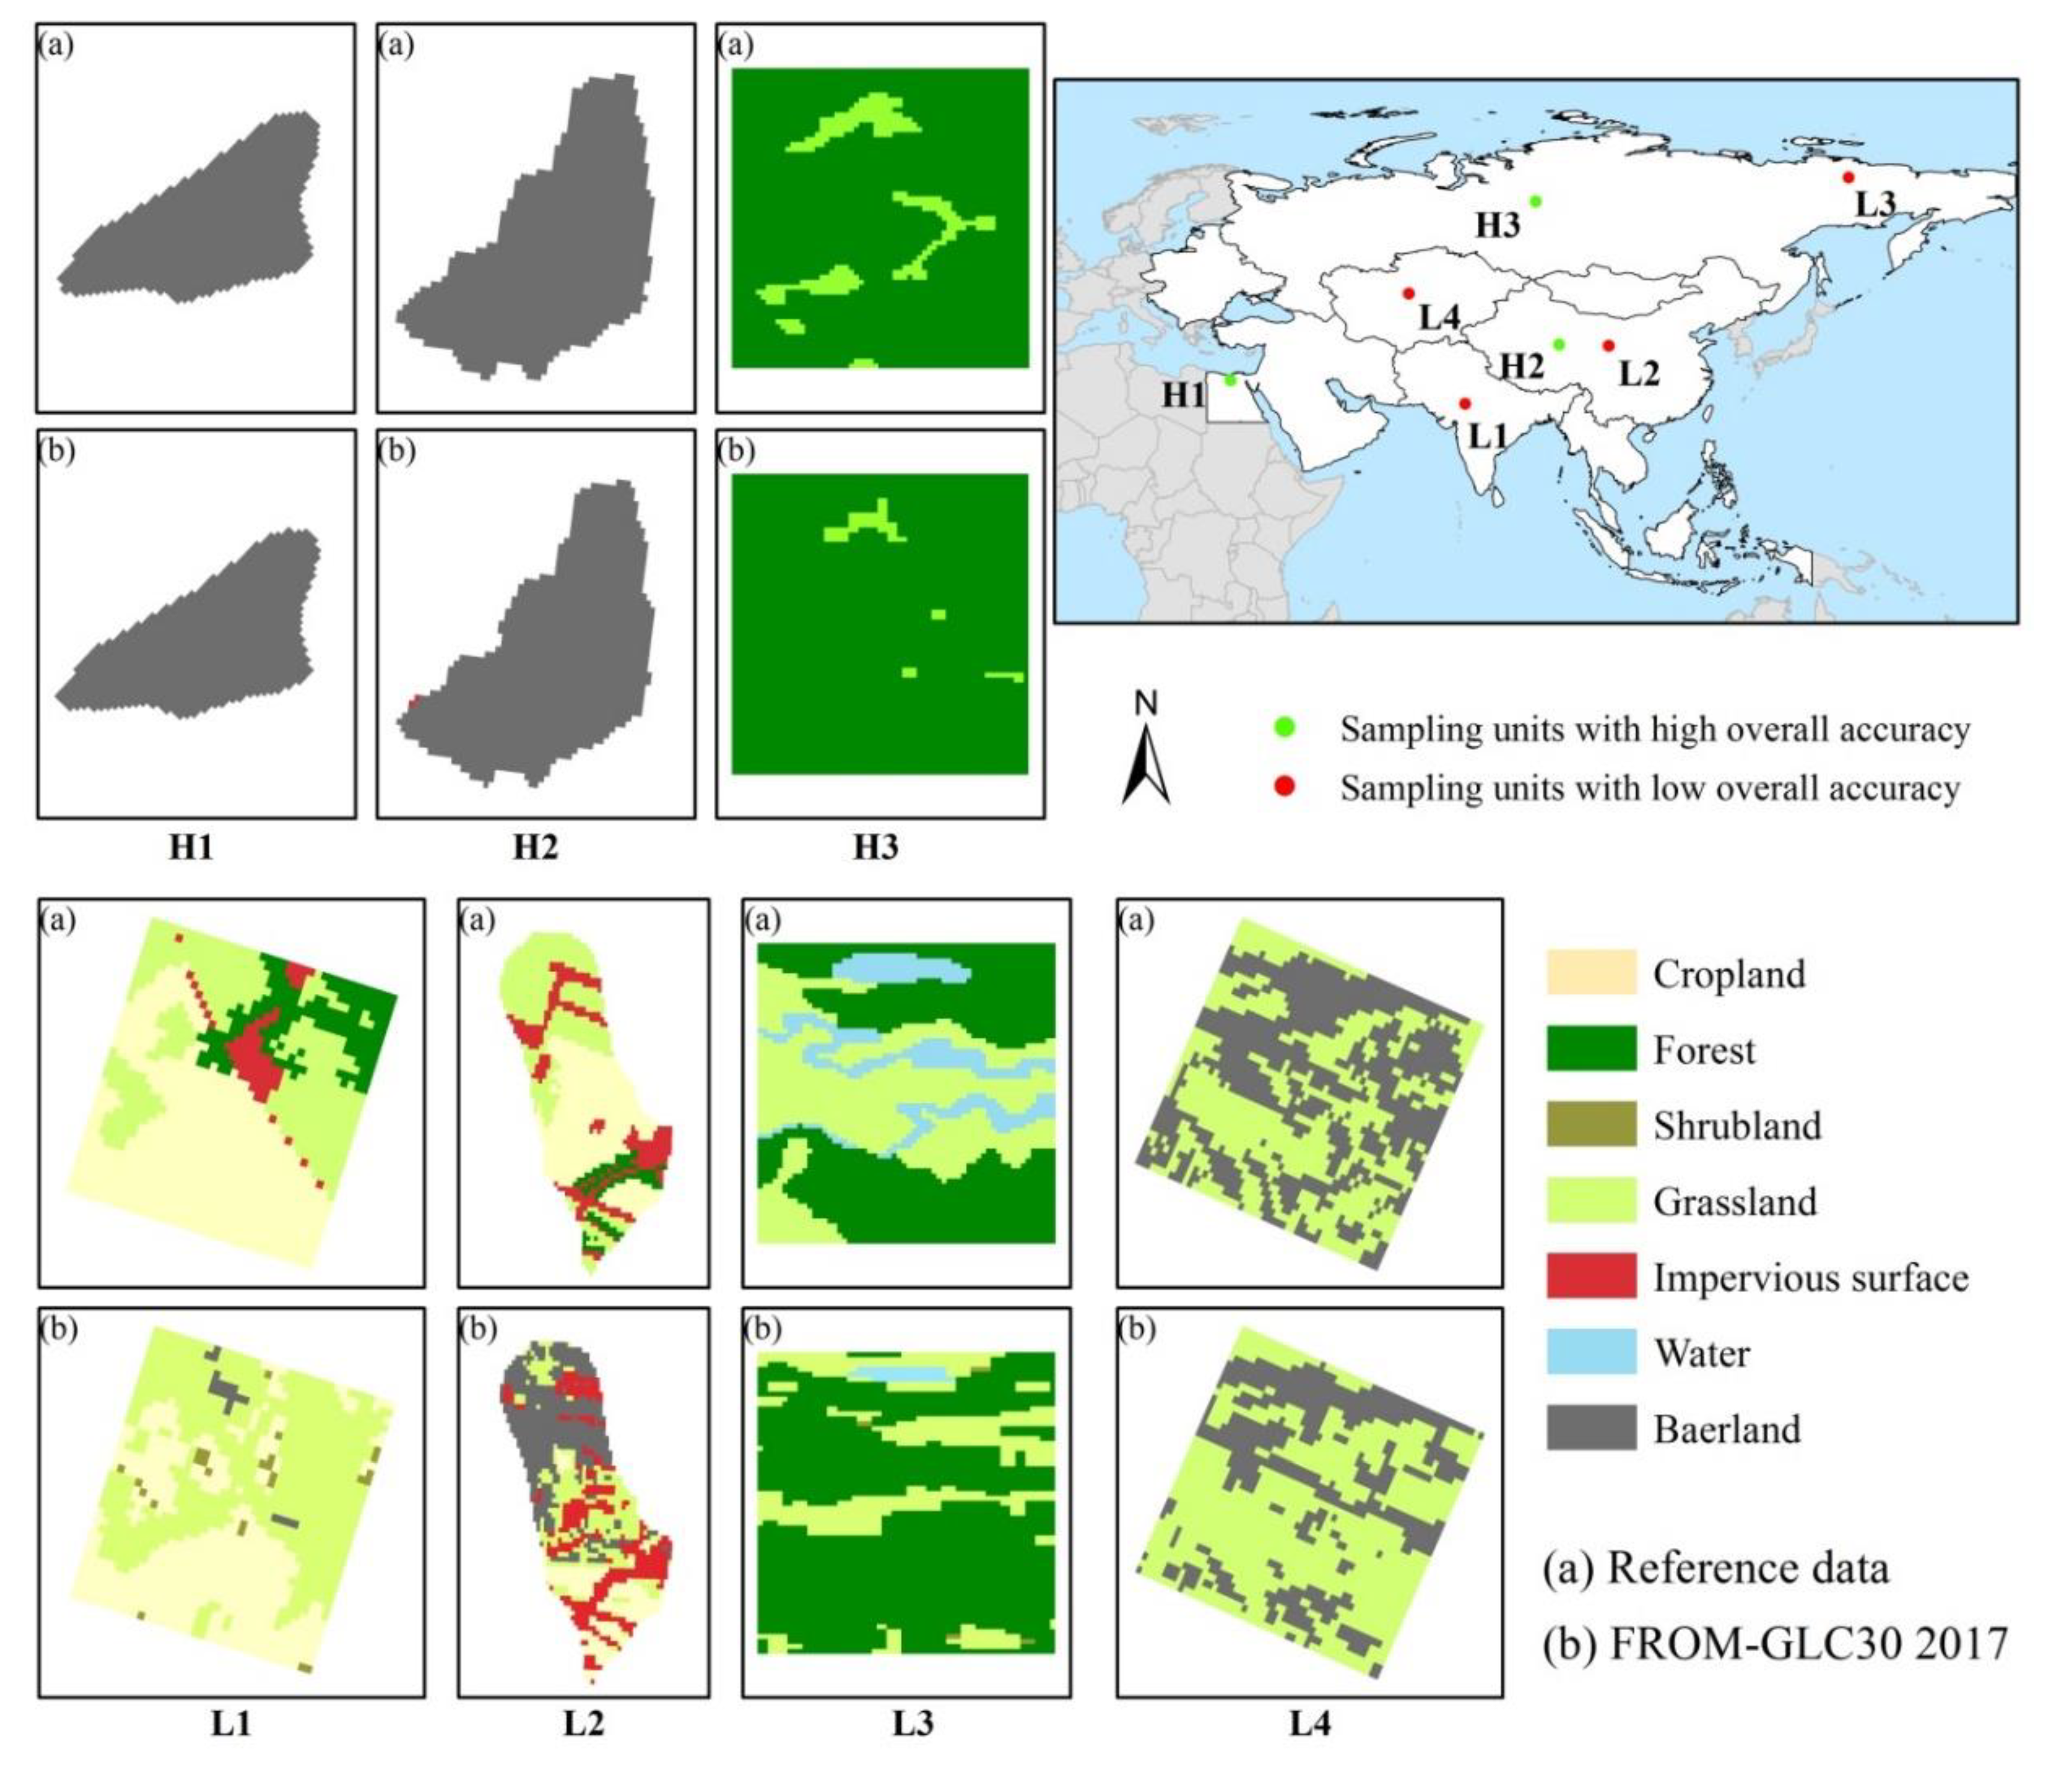
- The overall accuracy of the FROM-GLC30 2017 dataset in the Pan-Third Polar Area was 72.78%. The sample units with an overall accuracy of more than 50% accounted for 78.66% of the total sample units, and the sample units with an overall accuracy of 80–100% accounted for 54.35% of the total sample units. The regions with the highest and lowest overall accuracy were located in West Asia–Northeast Africa and South Asia, respectively.
- (3)
- The accuracy for different land cover types differed. Generally, the accuracy for bareland and forest was high, which was higher than 80%, the accuracy for water, cropland, and grassland was medium, and the accuracy was low for shrubland and impervious surface, which was only 4.67% and 34.26%. The accuracy for each land cover type differed in different regions.
Author Contributions
Funding
Acknowledgments
Conflicts of Interest
References
- Hailu, B.T.; Fekadu, M.; Nauss, T. Availability of global and national scale land cover products and their accuracy in mountainous areas of Ethiopia: A review. J. Appl. Remote Sens. 2018, 12, 041502. [Google Scholar] [CrossRef]
- Liang, D.; Zuo, Y.; Huang, L. Evaluation of the consistency of MODIS land cover product (MCD12Q1) based on Chinese 30 m GlobeLand30 datasets: A case study in Anhui Province, China. ISPRS Int. Geo Inf. 2015, 4, 2519–2541. [Google Scholar] [CrossRef] [Green Version]
- Son, S.; Kim, J. Accuracy assessment of global land cover datasets in South Korea. Kor. J. Remote Sens. 2018, 34, 601–610. [Google Scholar]
- Senanayake, S.; Pradhan, B.; Huete, A. Assessing Soil Erosion Hazards Using Land-Use Change and Landslide Frequency Ratio Method: A Case Study of Sabaragamuwa Province, Sri Lanka. Remote Sens. 2020, 12, 1483. [Google Scholar] [CrossRef]
- Minaei, M.; Shafizadeh-Moghadam, H.; Tayyebi, A. Spatiotemporal nexus between the pattern of land degradation and land cover dynamics in Iran. Land Degrad. Dev. 2018, 29, 2854–2863. [Google Scholar] [CrossRef]
- Li, S.; Cui, Y.; Liu, M. Integrating Global Open Geo-Information for Major Disaster Assessment: A Case Study of the Myanmar Flood. ISPRS Int. J. Geo Inf. 2017, 6, 201. [Google Scholar] [CrossRef]
- Bartholome, E.; Belward, A.S. GLC2000: A new approach to global land cover mapping from earth observation data. Int. J. Remote Sens. 2005, 26, 1959–1977. [Google Scholar] [CrossRef]
- Congalton, R.G.; Gu, J.Y.; Yadav, K. Global land cover mapping: A review and uncertainty analysis. Remote Sens. 2014, 6, 12070–12093. [Google Scholar] [CrossRef] [Green Version]
- Hansen, M.C.; Defries, R.S.; Townshend, J.R.G. Global land cover classification at 1km spatial resolution using a classification tree approach. Int. J. Remote Sens. 2000, 21, 1331–1364. [Google Scholar] [CrossRef]
- Loveland, T.R.; Reed, B.C.; Brown, J.F. Development of a global land cover characteristics database and IGBP DISCover from 1 km AVHRR data. Int. J. Remote Sens. 2000, 21, 1303–1330. [Google Scholar] [CrossRef]
- Liu, Q.H.; Zhang, Y.L.; Liu, L.S. The spatial local accuracy of land cover datasets over the Qiangtang Plateau, High Asia. J. Geogr. Sci. 2019, 29, 1841–1858. [Google Scholar] [CrossRef] [Green Version]
- Wang, Y.; Zhang, J.; Liu, D. Accuracy assessment of GlobeLand30 2010 land cover over China based on geographically and categorically stratified validation sample data. Remote Sens. 2018, 10, 1213. [Google Scholar] [CrossRef] [Green Version]
- Tsendbazar, N.E.; Herold, M.; Bruin, S.D. Developing and applying a multi-purpose land cover validation dataset for Africa. Remote Sens. Environ. 2018, 219, 298–309. [Google Scholar] [CrossRef] [Green Version]
- Arsanjani, J.J.; See, L.; Tayyebi, A. Assessing the suitability of GlobeLand30 for mapping land cover in Germany. Int. J. Digit. Earth 2016, 9, 873–891. [Google Scholar] [CrossRef] [Green Version]
- Yang, Z.Q.; Dong, J.W.; Liu, J.Y. Accuracy Assessment and Inter-Comparison of Eight Medium Resolution Forest Products on the Loess Plateau, China. ISPRS Int. Geo Inf. 2017, 6, 152. [Google Scholar] [CrossRef] [Green Version]
- Samasse, K.; Hanan, N.P.; Tappan, G. Assessing cropland area in West Africa for agricultural yield analysis. Remote Sens. 2018, 10, 1785–1803. [Google Scholar] [CrossRef] [Green Version]
- Gong, P.; Wang, J.; Yu, L. Finer resolution observation and monitoring of global land cover: First mapping results with Landsat TM and ETM+ data. Int. J. Remote Sens. 2013, 34, 2607–2654. [Google Scholar] [CrossRef] [Green Version]
- Ji, L.Y.; Gong, P.; Geng, X.R. Improving the accuracy of the water surface cover type in the 30 m FROM-GLC product. Remote Sens. 2015, 7, 13507–13527. [Google Scholar] [CrossRef] [Green Version]
- Yu, L.; Wang, J.; Gong, P. Improving 30 m global land-cover map FROM-GLC with time series MODIS and auxiliary data sets. Int. J. Remote Sens. 2013, 34, 5851–5867. [Google Scholar] [CrossRef]
- Yu, L.; Wang, J.; Cao, X.L. A multi-resolution global land cover dataset through multisource data aggregation. Sci. China Earth Sci. 2014, 57, 2317–2329. [Google Scholar] [CrossRef]
- Lu, M.; Wu, W.; Zhang, L. A comparative analysis of five global cropland datasets in China. Sci. China Earth Sci. 2016, 59, 2307–2317. [Google Scholar] [CrossRef]
- Chen, X.Y.; Lin, Y.; Zhang, M. Assessment of the cropland classifications in four global land cover datasets: A case study of Shaanxi Province, China. J. Integr. Agric. 2017, 16, 298–311. [Google Scholar] [CrossRef] [Green Version]
- Kang, J.M.; Wang, Z.H.; Sui, L.C. Consistency Analysis of Remote Sensing Land Cover Products in the Tropical Rainforest Climate Region: A Case Study of Indonesia. Remote Sens. 2020, 12, 1410. [Google Scholar] [CrossRef]
- Islam, S.; Zhang, M.; Yang, H. Assessing inconsistency in global land cover products and synthesis of studies on land use and land cover dynamics during 2001 to 2017 in the southeastern region of Bangladesh. J. Appl. Remote Sens. 2019, 13, 048501. [Google Scholar] [CrossRef]
- Yao, T.D.; Chen, F.H.; Cui, P. From Tibetan Plateau to Third Pole and Pan-Third Pole. Bull. Chin. Acad. Sci. 2017, 32, 924–931. (In Chinese) [Google Scholar]
- Ma, W.Q.; Zhong, L. Monitoring and Modeling the Tibetan Plateau’s climate system and its impact on East Asia. Sci. Rep. 2017, 7, 44574–44579. [Google Scholar] [CrossRef] [Green Version]
- Berkowitz, R. Move a plateau, change a climate. Phys. Today 2018, 71, 21–23. [Google Scholar] [CrossRef]
- Yin, S.Q.; Zhu, Z.Y.; Wang, L. Regional soil erosion assessment based on a sample survey and geostatistics. Hydrol. Earth Syst. Sci. 2018, 22, 1695–1712. [Google Scholar] [CrossRef] [Green Version]
- Liu, B.Y.; Guo, S.Y.; Li, Z.G. China water erosion survey based on sampling stategy. Soil Water Conserv. China (Soil Water Conserv. China) 2013, 34, 30–38. (In Chinese) [Google Scholar]
- Clark, M.L.; Aide, T.M.; Grau, H.R. A scalable approach to mapping annual land cover at 250 m using MODIS time series data: A case study in the dry chaco ecoregion of South America. Remote Sens. Environ. 2010, 114, 2816–2832. [Google Scholar] [CrossRef]
- Friedl, M.A.; Sulla-Menashe, D.; Tan, B. MODIS collection 5 global land cover: Algorithm refinements and characterization of new datasets. Remote Sens. Environ. 2010, 114, 168–182. [Google Scholar] [CrossRef]
- National Earth System Science Data Center, National Science & Technology Infrastructure of China. Available online: http://www.geodata.cn (accessed on 21 September 2018).
- Foody, G.M. Status of land cover classification accuracy assessment. Remote Sens. Environ. 2002, 80, 185–201. [Google Scholar] [CrossRef]
- Herold, M.; Mayaux, P.; Woodcock, C.E. Some challenges in global land cover mapping: An assessment of agreement and accuracy in existing 1 km datasets. Remote Sens. Environ. 2008, 112, 2538–2556. [Google Scholar] [CrossRef]
- Rijsbergen, V.; Joost, C.K. Information Retrieval, 2nd ed.; Butterworths: Waltham, MA, USA, 1979. [Google Scholar]
- Manakos, I.; Karakizi, C.; Gkinis, I. Validation and Inter-Comparison of Spaceborne Derived Global and Continental Land Cover Products for the Mediterranean Region: The Case of Thessaly. Land Degrad. Dev. 2017, 6, 34. [Google Scholar] [CrossRef] [Green Version]


| Unified Classification | Reference Data | FROM-GLC30 2017 | Definition |
|---|---|---|---|
| 1 Cropland | 1 Cropland | 1 Cropland | Land used for growing crops and economic crops. |
| 2 Forest | 2 Forest | 2 Forest | The land covered by trees with coverage over 30% and the sparse forest land with crown coverage of 10–30%. |
| 3 Shrubland | 3 Shrubland | 4 Shrubland | The land with shrub coverage higher than 30%, and the desert shrub with desert area coverage higher than 10%. |
| 4 Grassland | 4 Grassland | 3 Grassland, 7 Tundra | The land mainly covered with herbaceous vegetation, and the vegetation coverage is more than 10%, including the land covered by bryophytes, lichens, and cold-resistant herbaceous and shrub vegetation in the alpine area. |
| 5 Impervious surface | 5 Impervious surface | 8 Impervious surface | Including urban land, industrial and mining land, commercial land, storage land, transportation facilities land, etc. |
| 6 Water | 6 Water | 5 Wetland, 6 Water, 10 Snow/Ice | Including the areas covered by liquid water, glaciers, and permanent snow within the land area, as well as the land with shallow water or soil moisture at the water/land interface. |
| 7 Bareland | 7 Bareland | 9 Bareland | Including bare soil, bare rock, desert, sandy land, gravel land, saline alkali land, and other natural land with vegetation coverage less than 10%. |
| Regions | Mean of OA (%) | Median of OA (%) | Standard Deviation of OA (%) |
|---|---|---|---|
| Central and Eastern Europe | 74.42 | 80.13 | 21.01 |
| Central Asia | 67.71 | 81.64 | 34.58 |
| China | 74.38 | 85.31 | 28.88 |
| Mongolia | 71.53 | 87.54 | 33.91 |
| Russia | 70.81 | 79.29 | 27.78 |
| South Asia | 65.36 | 73.37 | 30.86 |
| Southeast Asia | 74.86 | 85.05 | 26.50 |
| West Asia—Northeast Africa | 80.11 | 98.04 | 31.22 |
| Pan-Third Pole Area | 72.78 | 83.70 | 29.38 |
| Code | Land Cover Type | UA (%) | PA (%) | Difference between UA and PA (%) | |
|---|---|---|---|---|---|
| 1 | Cropland | 74.44 | 66.34 | 70.16 | 8.1 |
| 2 | Forest | 83.95 | 78.73 | 81.26 | 5.22 |
| 3 | Shrubland | 7.95 | 3.31 | 4.67 | 4.64 |
| 4 | Grassland | 62.26 | 65.44 | 63.81 | −3.18 |
| 5 | Impervious surface | 44.71 | 27.77 | 34.26 | 16.94 |
| 6 | Water | 71.14 | 80.87 | 75.69 | −9.73 |
| 7 | Bareland | 77.65 | 85.31 | 81.30 | −7.66 |
| Regions | Cropland (%) | Forest (%) | Shrubland (%) | Grassland (%) | Impervious Surface (%) | Water (%) | Bareland (%) |
|---|---|---|---|---|---|---|---|
| 1 | 79.60 (92.24, 70.01) | 85.96 (86.27, 85.66) | 0.23 (3.50, 0.12) | 38.43 (26.59, 69.29) | 41.89 (66.80, 30.51) | 89.75 (92.72, 86.97) | 0.82 (0.63, 1.18) |
| 2 | 8.51 (72.11, 34.52) | 47.87 (70.92, 36.13) | 1.84 (28.26, 0.95) | 76.61 (77.15, 76.07) | 14.46 (16.89, 12.64) | 87.01 (84.56, 89.60) | 65.42 (55.71, 79.23) |
| 3 | 71.18 (74.43, 68.21) | 82.90 (80.17, 85.82) | 3.14 (9.60, 1.88) | 52.27 (78.81, 39.10) | 44.89 (48.90, 41.49) | 63.87 (58.22, 70.74) | 57.42 (42.18, 89.90) |
| 4 | 22.90 (15.94, 40.67) | 71.93 (89.47, 60.14) | Null (Null, Null) | 74.02 (82.72, 66.98) | Null (Null, Null) | 72.18 (66.63, 78.75) | 76.75 (65.53, 92.60) |
| 5 | 61.94 (85.02, 48.72) | 79.50 (82.24, 76.94) | 1.35 (2.44, 0.93) | 13.44 (64.84, 67.50) | 27.06 (44.79, 19.39) | 70.03 (63.59, 77.93) | 7.14 (4.06, 29.55) |
| 6 | 77.21 (75.35, 79.17) | 76.94 (86.50, 69.29) | 9.2 (8.92, 9.49) | 37.69 (50.40, 30.10) | 26.16 (51.02, 17.59) | 15.67 (50.35, 9.28) | 66.58 (53.62, 87.80) |
| 7 | 57.26 (46.81, 73.72) | 89.17 (91.85, 86.64) | 4.21 (3.65, 4.96) | 20.30 (24.16, 17.51) | 29.98 (56.08, 20.46) | 74.79 (76.44, 73.21) | 11.78 (14.95, 9.72) |
| 8 | 66.76 (75.61, 59.77) | 68.16 (86.08, 56.42) | 17.01 (17.96, 16.16) | 44.59 (60.99, 35.14) | 19.31 (19.90, 18.75) | 95.87 (96.43, 95.32) | 92.32 (87.01, 98.32) |
© 2020 by the authors. Licensee MDPI, Basel, Switzerland. This article is an open access article distributed under the terms and conditions of the Creative Commons Attribution (CC BY) license (http://creativecommons.org/licenses/by/4.0/).
Share and Cite
Guo, Z.; Wang, C.; Liu, X.; Pang, G.; Zhu, M.; Yang, L. Accuracy Assessment of the FROM-GLC30 Land Cover Dataset Based on Watershed Sampling Units: A Continental-Scale Study. Sustainability 2020, 12, 8435. https://0-doi-org.brum.beds.ac.uk/10.3390/su12208435
Guo Z, Wang C, Liu X, Pang G, Zhu M, Yang L. Accuracy Assessment of the FROM-GLC30 Land Cover Dataset Based on Watershed Sampling Units: A Continental-Scale Study. Sustainability. 2020; 12(20):8435. https://0-doi-org.brum.beds.ac.uk/10.3390/su12208435
Chicago/Turabian StyleGuo, Zitian, Chunmei Wang, Xin Liu, Guowei Pang, Mengyang Zhu, and Lihua Yang. 2020. "Accuracy Assessment of the FROM-GLC30 Land Cover Dataset Based on Watershed Sampling Units: A Continental-Scale Study" Sustainability 12, no. 20: 8435. https://0-doi-org.brum.beds.ac.uk/10.3390/su12208435