Multi-Energy School System for Seasonal Use in the Mediterranean Area


1
Department of Engineering, University of Palermo, Viale delle Scienze, Building n. 9, 90128 Palermo, Italy
2
Faculty of Engineering and Architecture, Kore University of Enna, Cittadella Universitaria, 94100 Enna, Italy
*
Author to whom correspondence should be addressed.
Sustainability 2020, 12(20), 8458; https://0-doi-org.brum.beds.ac.uk/10.3390/su12208458
Submission received: 7 September 2020
/
Revised: 10 October 2020
/
Accepted: 11 October 2020
/
Published: 14 October 2020
(This article belongs to the Special Issue Feature Papers in Resources and Sustainable Utilization)
Abstract
:School buildings represent an energy-consuming sector of real estate where different efficiency actions are necessary. The literature shows how the design of a multi-energy system offers numerous advantages, however, there are problems related to the integration of cogeneration units with renewable energy sources due to the low flexibility of the first one and the high degree of uncertainty of the latter. The authors provide an alternative solution through the analysis of a case study consisting of a multiple energy system in three Sicilian schools, focusing on the system’s operational strategy, on the design and sizing of components and trying to exploit the energy needs complementarity of buildings instead of integrating the conventional energy storage systems. Not considering school activities in summer, it was decided to install a cogeneration unit sized on winter thermal loads, whereas the electricity demand not covered was reduced with photovoltaic systems designed to maximize production for seasonal use and with loads concentrated in the morning hours. The effectiveness of this idea, which can be replicated for similar users and areas, is proved by a payback time of less than 11 years and a reduction of 31.77% of the CO2 emissions.
1. Introduction
Nowadays, the increase in energy efficiency is a priority topic in the world’s scientific community, which mainly focuses its attention especially on those energy-intensive sectors considered weaker from the efficiency point of view. Among the several energy-intensive sectors, the civil sector, generally represented by cities as a whole, covers around 70% of global energy demand, representing one of the most important fields to focus efforts to effectively reduce energy consumption and CO2 emissions [1,2].
There are many studies carried out in this sector, which involve various modeling approaches and tools [3,4]. In this sense, Keirstead et al. [5] seek to clarify the topic with a review including the analysis of 219 papers examining the opportunities to improve the modeling of urban energy systems. Macarella [6] highlights how the multi-energy systems, abbreviated as MES, on a regional, city or district scale, represents an optimal solution to increase the technical, economic and environmental performance of “classic” energy systems whose sectors are treated separately. To support this thesis, a paper by Connolly et al. [7] highlights how district-scale building energy planning through district heating plants could play a strategic role in the cost-effective decarbonization of the EU’s energy system, reducing CO2 emissions and using primary energy at a lower cost. Actually, a district approach allows for a transition away from fossil fuel use towards forms of cleaner energy, which alone can reduce the primary energy consumption by about 30–50% [8]. This happen because the district energy systems (DESs) simultaneously supply users with electricity and heat for heating and/or cooling.
The advantages offered by these applications in the city network have been proved; these include the possibility of a more accessible energy system, better integration of renewable energy sources (RESs) into the urban energy mix, less dependence on imports of fossil fuel and on the economic and political pressures deriving from it, as well as the several benefits deriving from the reduction of pollution [9]. For these reasons, several countries have made district heating an important reality for the achievement of their environmental goals [10]. For example, since 1990, Denmark obtained a CO2 emission reduction of about 20%, Paris predicts a reduction of 75% by 2050 and, thanks to the presence of district heating and cooling systems, Tokyo achieved a primary energy saving of 44% if compared to individual heating and cooling systems [8]. Furthermore, the combination of the district energy system with combined heat and power (CHP) systems offers further advantages, because it allows for the reuse of residual heat by reducing the consumption of fossil fuels and promoting an efficient use of available resources [11,12]. As highlighted by Thornton and Monroy [13], with the continuous increase in the population, and the following growth in energy demand, United States has also shown a propensity for the distributed energy generation where the production center is physically close to the district or consumers, thus avoiding losses in the transmission and distribution phase.
However, facing the diversity of existing applications, technologies, interactions between users and/or energy carriers, as reported by Sayegh et al. [9], the main challenge to be faced lies in the development of district heating systems based on more flexible energy systems, characterized by more penetration and integration towards systems powered by RESs [14], coupled with “smart” buildings and with a more dynamic vision of prosumers.
Moreover, despite the evident advantages in the diffusion of these systems, as shown by the sector literature [15,16], there is still some reluctance by some regulators and public utilities that needs to be overcome, as it has numerous technical, regulatory and commercial obstacles [13]. For this reason, several universities, research centers, engineers and experts in energy and sustainability have conducted their research to promote the diffusion of the energy districts through new applications and studies that reduce the reluctances expressed and contribute to the achievement of the environmental objectives. An example is represented by a study conducted by Lizana et al. [17], where a district heating system powered by solar energy systems and by a biomass powered plant serves areas with moderate population density in the Mediterranean, with a payback period of 10–13 years.
Sibilla and Kurul [18] presented an interesting study where, in 23 school buildings in Rome, Italy, a procedure was tested which aimed to reconcile distributed, renewable and interactive energy systems (DRIs) with urban-scale models, providing a positive contribution in the urban design phase. Cortés et al. [19] analyzed a smart energy microgrid district in the Canary Islands characterized by several households and a school building that included photovoltaic plants, domestic hot water (DHW) heaters and a pool for the balance of energy consumption. Alavijeh et al. [16] analyzed the cost-effectiveness of CO2 reduction strategies in a multi-energy system at the Chalmers University of Technology, for heating, cooling and electrical energy services. Rosato et al. [20] have modeled in a TRNSYS environment [21] a hybrid district heating system based on solar and geothermal energy sources with seasonal storage to satisfy the thermal needs of an energy district consisting of six residential buildings and three schools in Naples. The results show a significant reduction in primary energy consumption, CO2 emissions and costs compared to “separated” conventional heating systems.
Considering these applications, and on the basis of the potential deriving from the involvement of public structures such as schools and/or university campuses, the authors of this paper analyze the feasibility of an energy district powered by a CHP system totally integrated with photovoltaic (PV) systems. In detail, it was decided to design a multiple energy school system (MESS) in Palermo, a city of southern Italy, by choosing three of the biggest schools that are complementary in their energy consumption. Indeed, the first school is characterized by electrical consumption only because air conditioning is guaranteed by heat pumps, while in the other two buildings have heating systems powered by boilers, therefore, most of the energy needs are thermal. These buildings represent the typical buildings of the 1950s, built before the law [22] on the energy containment of buildings [23], characterized by an envelope of low quality, built without paying attention to the occupants’ comfort and the efficiency of the air conditioning plants. Generally, the existing Heating, Ventilation and Air Conditioning (HVAC) plants are old, in poor condition and not correctly sized. Furthermore, the particular and articulated urban context typical of old Italian cities, such as Palermo, makes some retrofit operations difficult to apply. On one hand, the application of retrofit actions on the building envelope would create significant inconveniences to the actual road system due to the construction sites and the lack of alternative routes. On the other hand, the MESS realization would require minimally invasive and low-impact road conditions.
Furthermore, as illustrated by Melgar et al. [24], trying to achieve high-efficiency conditions in buildings located in subtropical areas is still a great challenge for architecture and engineering designers, indeed, a similar solution must solve the heat loss in winter and the heat gain in summer. In this regard, in [25], a structured methodology for the proper decision-making process during all the different stages of creating a minimum energy building is developed.
Based on these considerations, the authors propose an alternative procedure to design an energy district. The purpose of this work is to demonstrate how, to reduce the overall energy consumption in a small district of school buildings, it could be possible to realize an effective multi-energy system in a particular urban context characterized by countless architectural constraints that generally limit the envelope retrofit actions.
The MESS proposed in this work aims to overcome obstacles mainly due to the coupling of renewable energy systems and the CHP units themselves. In fact, the integration of multiple energy systems would lead, if not carefully designed, to the reduction of the working hours at full load of the CHP unit with the consequent reduction of the efficiency of the unit. In some cases, this hypothesis would make the integration itself and the realization of the multi-energy district not convenient from an energy and economic point of view. Unlike many works, for instance [14,26], where these critical issues are shown, the proposed study aims to design the CHP unit only for the full satisfaction of the heating load of the total district requirement, and to cover the electrical part not covered by the cogeneration unit thanks to the coupling with a photovoltaic system.
In the proposed MESS, the CHP unit is sized according to the seasonal use of the buildings and only for the thermal energy needs for the winter period when the buildings are open. Indeed, the thermal energy needs for cooling are not necessary, because in summer (from June to September) schools are closed, and thanks to their massive structure, comfortable conditions for users are also guaranteed. Electricity consumption that cannot be covered by the CHP system are reduced thanks to the installation of large PV systems. This installation, as demonstrated, is sustainable in a highly sunny area like the Mediterranean.
This is an alternative solution compared to others in the literature, for example, the problem of the flexibility of the cogeneration system is partially solved with the installation of thermal storage systems (TESs) [27,28] or through technological improvements [29,30]. Otherwise, in the proposed paper, the authors solve the mismatch between the lack of flexibility of the CHP system and the uncertainty of the RES through operational, design and sizing strategies that simultaneously take into account the climatic conditions, the latitude and the intended use.
This work fits perfectly within the perspective of promoting energy districts, through new applications and studies by universities, research centers and experts in the energy sector, which especially involve those companies characterized by large margins of energy saving and high consumption, such as schools, universities and public administration buildings, or in those particular urban contexts where the classic efficiency measures of the building envelope are complex.
In addition, for all users with similar intended use that are characterized by substantial thermal loads for space heating and, where thanks to the high levels of insolation, large surfaces can be available for the installation of PV systems, this design strategy it is perfectly practicable and replicable.
2. Materials and Methods
For greater clarity and to guide the reader to a simpler understanding of the investigated study, this section illustrates the main line followed to achieve the research aim. This research arises from the idea to provide a valid example of a multi-energy system for a small urban district composed by three school buildings located in Palermo, with the aim to promote the suitability and efficacy of this system.
Step by step, the following work involved the analysis of the following key points in order to pinpoint the fundamental aspects; in detail:
- Analysis of the Italian building context and identification of critical issues in the non-residential sector, underlining that retrofit actions in the school sector have a great potential for energy saving and the reduction of greenhouse gas emissions;
- Identification of three big schools in the city of Palermo, typical of the building landscape of southern Italy and characterized by complementary consumption of electricity and thermal energy and located in a position almost equidistant from the installation area of the CHP system;
- Energy audit of the buildings. In this phase, the authors collected the main features about the geometry, thermophysics, HVAC plants and intended use of each building, checked the actual situation during some inspections and the actual consumption [31];
- Modeling and dynamic analysis of thermal energy needs of the three buildings in the TRNSYS software environment [21];
- Design of a CHP system to cover the thermal needs of the MESS;
- Design and integration of PV systems in each building, maximizing the production in the morning hours;
- Integration of the PV system with the national electricity grid;
- Economic and environmental analysis of the MESS district.
3. Case Study: An Energy District in Palermo, Southern Italy
The aim of this work is to verify the conditions for the construction of an energy district in a complex and articulated urban context typical of southern Italy. In particular, the possibility of creating a MESS that serves three large buildings located in the city of Palermo was evaluated.
3.1. Italian Energy Context
Italy intends to pursue an indicative target for a reduction in consumption by 2030 equal to 43% of primary energy and 39.7% of final energy with respect to the reference scenario PRIMES 2007 [32].
In this sense, it would be appropriate to use the resources available to “attack” those energy-efficient sectors that are considered weaker. First among these, the civil sector in 2015 in Italy contributed 41.1% to national end uses, revealing that it is the segment with the greatest savings potential [33], with a reduction in energy consumption of approximately 5.7 Mtoe with respect to the reference scenario in 2030.
In detail, the non-residential sector should have achieved by 2020, compared to 2015, a reduction in energy consumption of 1.23 Mtoe/year, but in the span of 2009–2017, despite the drop due to the economic crisis, there was a doubling of its consumption, reaching in 2017 an energy consumption of 18.2 Mtoe, a significant increase compared to 2016 (+18.2%). The main energy sources in the sector are electricity and natural gas: together, they meet over 80% of total demand [32].
The Italian legislation, according to the energy policies of the European Union, predicts the redevelopment of at least 3% of the air-conditioned useful surface [34] for public administration buildings with the aim of the net zero energy building (nZEB) standards.
Since the public building sector, including schools, has a key role in relation to energy saving for the whole community, it is considered as one of the starting points for energy efficiency. It is known, in fact, that a drastic drop in energy consumption is needed both for new buildings and for existing school buildings. Series of procedures have been used in different studies, according to the local climate and the construction style [35].
In Italy, the higher energy consumption of public structures is attributed to about 20% of the school real estate park, equal to 2.6 TWh, with an expenditure of EUR 351 million per year. Assuming a reduction in this consumption of 45%, an annual saving of approximately EUR 169 million would be achieved [36].
Several studies [37,38] report that a healthy school environment and an adequate climatization system improve the performance of students. The investment aimed to improve the conditions of comfort in schools is therefore also justified by the promotion of a healthy learning environment [39].
In this way, investing in the energy requalification of school buildings could have great economic and social impacts, resulting in significant savings for the public administration budget and becoming a prime mover for job creation [40].
3.2. Italian School Buildings
In the Italian territory, there are 51,904 buildings for exclusive or prevalent school use. The area covered by school buildings is 73.2 million m2, equal to a volume of approximately 256.4106 m3 [33].
An analysis of the school consumption shows that they have an unbalanced energy consumption towards thermal use compared to electricity [41]. In [42], the authors affirm that the heating energy requirements of school buildings represent a significant part of the total energy demands and, due to this, proper cost-effective strategies for retrofitting are needed.
Generally, Italian public building stock is characterized by inadequate envelopes, in which the transmittance value of all envelope surfaces is very far from the limit values indicated by the actual law [43] and low-performance HVAC systems. The average specific electricity consumption of Italian school buildings is 50 kWh/m2 per year and the thermal consumption is 130 kWh/m2 per year. This aspect is mainly due to the limited use of modern heat pump systems powered by electricity and to the prevalent use of fossil fuels in the combustion generation systems.
In particular, considering the interventions already carried out since 2014, the schools represent the type of building with the greatest energy saving potential, estimated at 5821 GWh/year, corresponding to 0.55 Mtoe/year [33]. The high percentage of savings achievable is linked to the fact that public buildings were often built before the first Italian energy containment of buildings law [22]. These buildings make up about 60% of school buildings, built without paying attention to the comfort of the occupants, or historical buildings adapted and often built with a different intended use (improper buildings). Only buildings built after 2006 have a greater focus on achieving comfortable conditions, reducing energy needs and a vision focused on sustainability.
3.3. Palermo’s Background
The city of Palermo is characterized by a complex and tortuous historical center, which looks like a place in its own right compared to the rest of so-called Palermo Nuova. This particular road layout makes any modernization or retrofit actions complex, such as the possibility of identifying areas that can become energy districts.
From the climate point of view, Palermo, following the Köppen climate classification, belongs in the Csa group and is characterized by a hot summer Mediterranean climate with moderate seasonality [44,45]. According to the Italian national guidelines for building energy certification [43,46], the city of Palermo belongs in the B climatic zone, in which the heating period is from 1st December to 31st March and heating systems must be turned on for eight hours a day, while the cooling period is suggested to be from 20th May to 30th September [44].
In order to achieve the objective of the work, a careful analysis of the school building heritage of the city of Palermo was carried out. Thanks to “Palermo Energia Spa” [47], it was possible to identify the buildings with similar technical and construction aspects, consumption needs and proximity to each other, which were studied for the development of an energy district. In detail, due to the particular urban network of the city of Palermo and the presence of urban, historical and architectural constraints, in this work were excluded school buildings located in the historic center of the city.
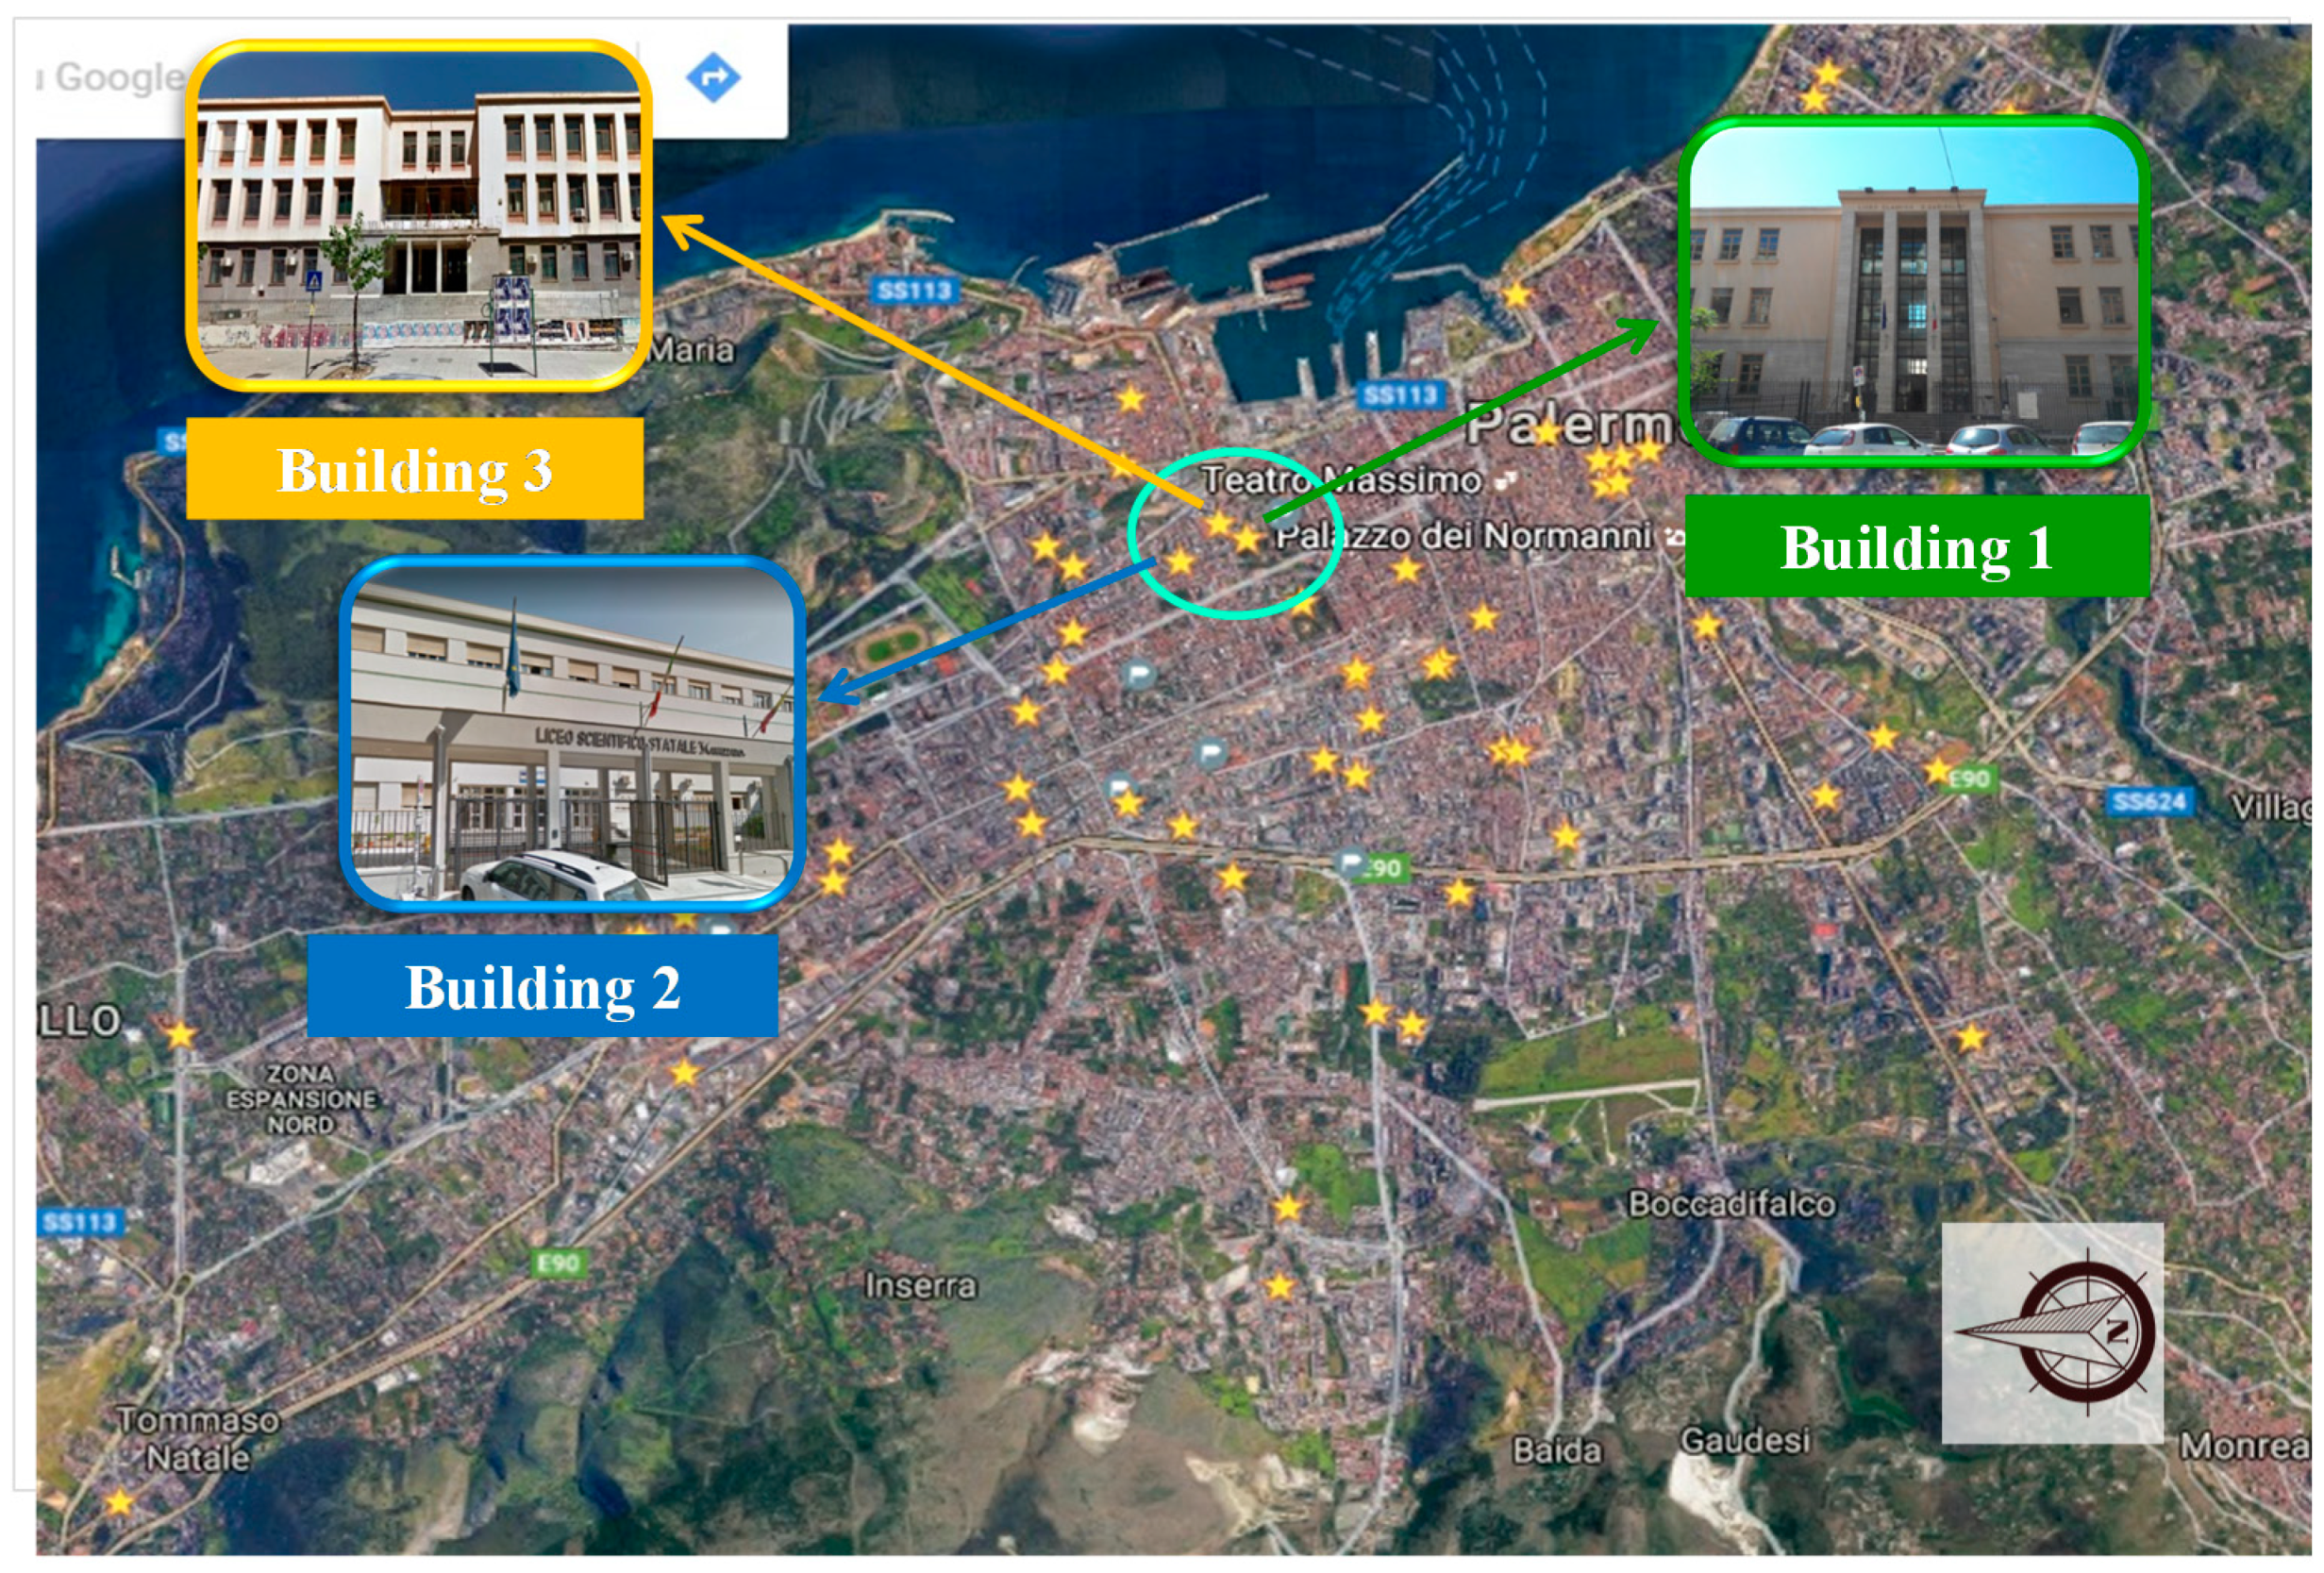
The remaining schools were analyzed basing on their size, proximity to each other and the possibility of identifying a free urban area for placing the power plant. Indeed, this area must be as close to the center of gravity as possible with respect to the position of the schools, to make its position equidistant from each individual building. On the basis of these needs and the actual state of the Palermo school heritage, the authors identified three large and energy complementary buildings, namely: Building 1, Building 2 and Building 3.
The three schools are located in the “Libertà” district, and all three buildings are within the urban context and surrounded by building agglomerations. In Figure 1, each star identifies the position of the school buildings.
3.4. School Building Description
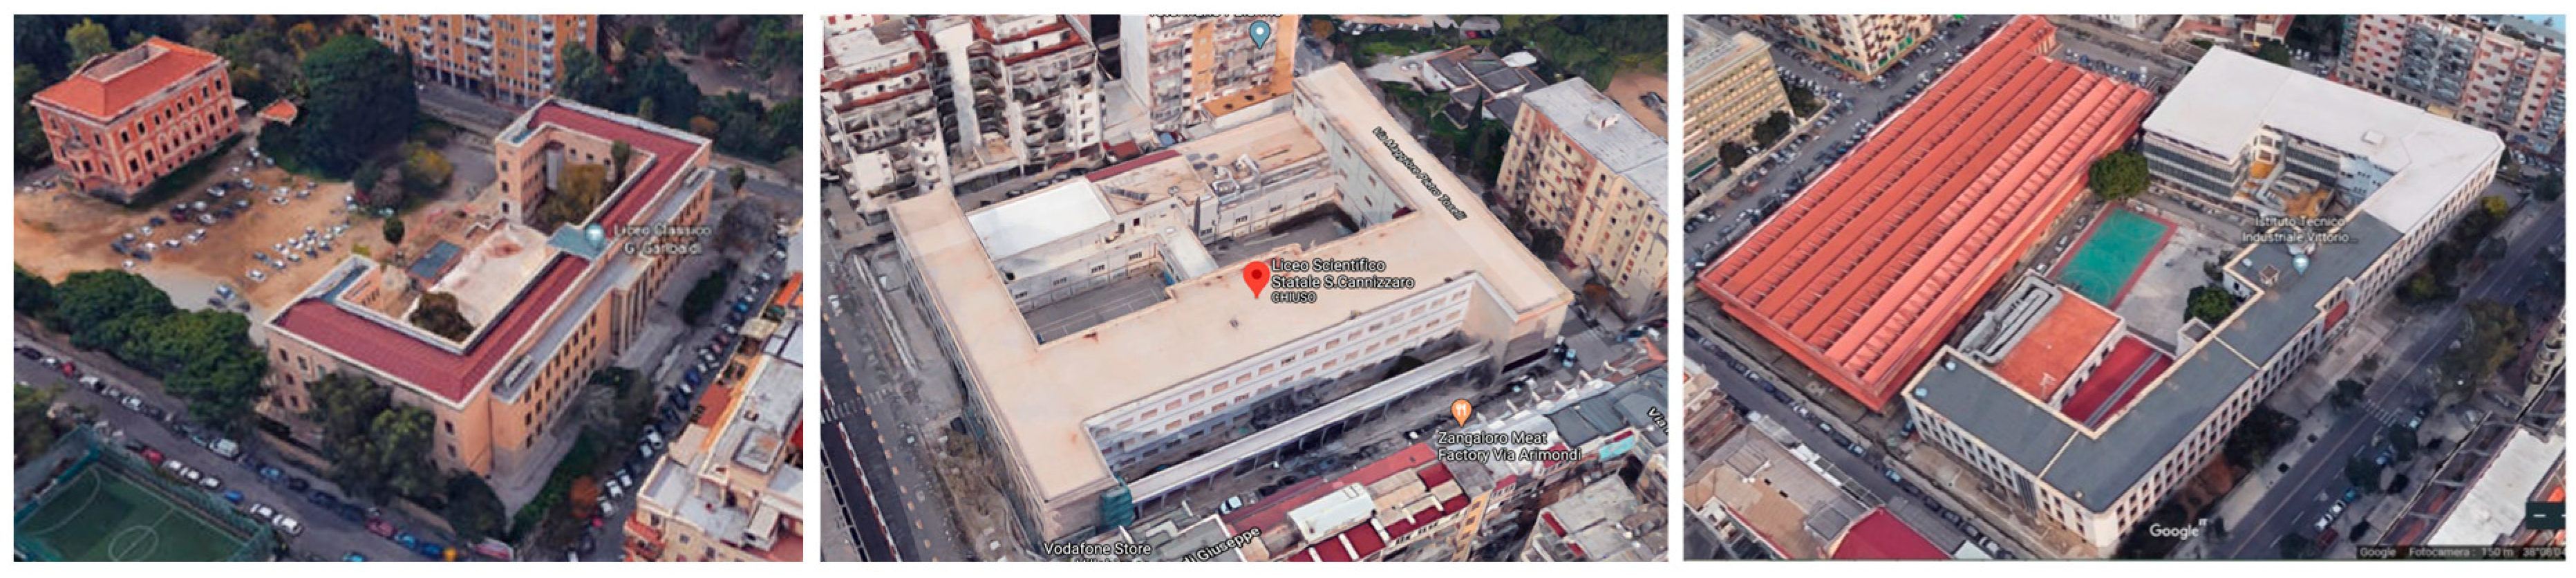
The three school buildings (Figure 2), built in the 1950s, are among the oldest educational institutions in Palermo.
Building 1 presents the peculiar characteristics of a “hall building”, with a “C” shape characterized by the succession of communicating classrooms connected together by linear halls. The main facade is exposed to the northwest and overlooks a six-storey residential building; the other facades are surrounded by large spaces without buildings and characterized by scarce vegetation. Building 2 was founded in 1923 and was the first high school established in Palermo, but only in 1955 was the current building constructed. The main facade faces southeast and the whole building is spread over four levels.
Finally, Building 3, a state technical institute, is one of the biggest schools in Palermo and it has the main facade facing southeast, while on the northwest side. There is a low body that houses laboratories.
From the geometrical point of view, the main features are collected in Table 1.
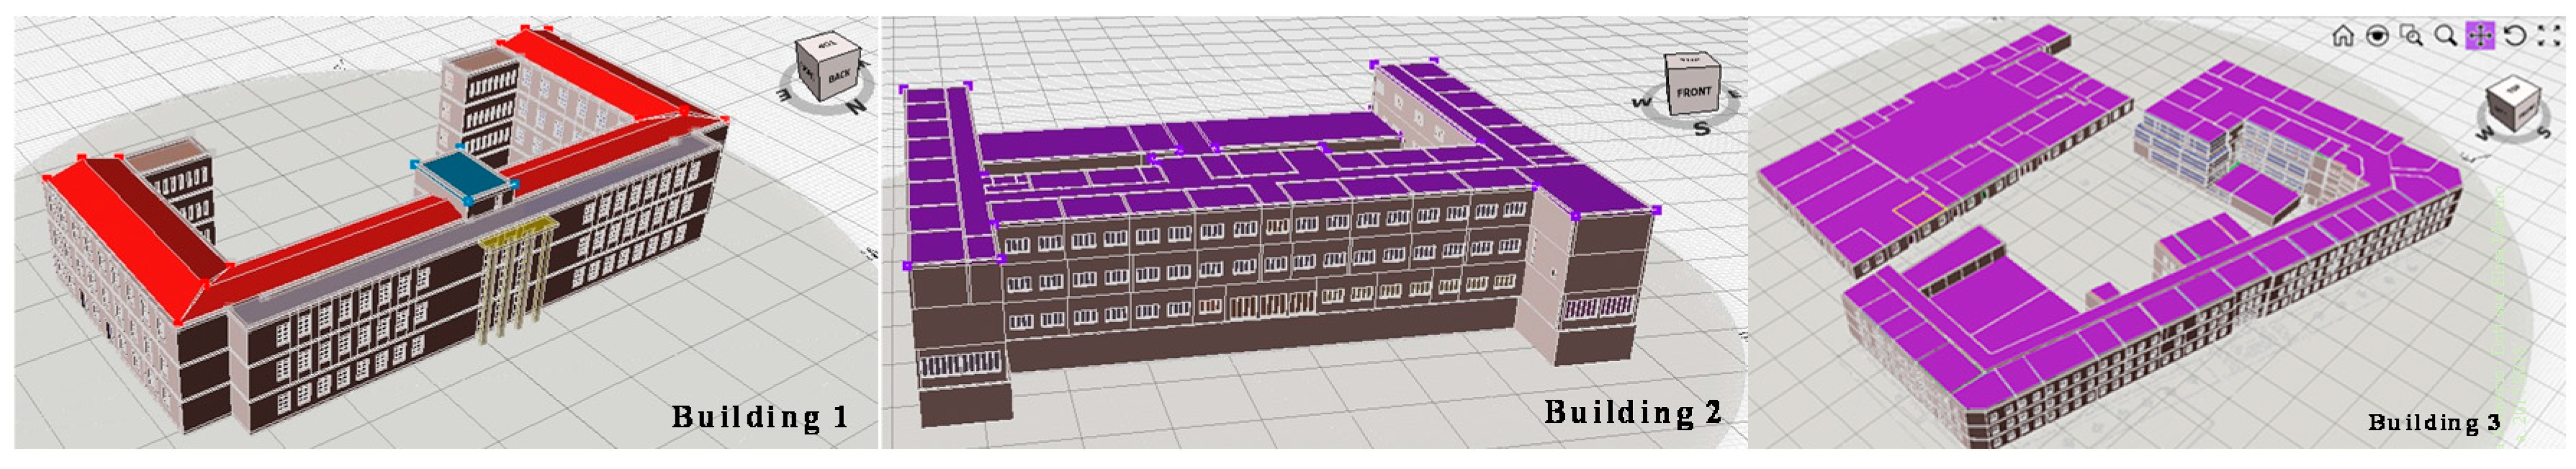
As shown in Table 1 and in the 3D model renderings shown in Figure 3, the three buildings, although characterized by a similar line geometry (C shape), are heterogeneous in their complexity, with different volumes, expositions and the ratio of the glass surface to the opaque one.
Regarding the opaque envelope, the buildings are characterized by a massive structure (thickness greater than 40 cm), with self-supporting perimeter walls formed by tuff blocks of about 50 cm and by internal partitions of 50 and 20 cm and an internal height greater than 3 m. The fixtures are various according to the building, for example, in Building 2, there are different types of windows because the school was subject of several renovation interventions over time (windows with aluminum frames and single glass, or with PVC frames and double glazing (4-12-4)), while in Building 1, the windows have wooden frames and double glazing (4-12-4). In Building 3, on the other hand, there are windows with a polyurethane frame and double glazing (4-12-4). For each school building, the main thermophysical and geometrical features are collected in Table 2.
In general, this envelope is characterized by a low energy performance because the transmittance values are higher than the limit values. In Table 3 is illustrated the comparison between the actual transmittance values of each envelope surface with the limit value indicated in the Italian law in the field of energy retrofit [48] and all surfaces are characterized by higher values of transmittance than the limit values.
For artificial internal lighting, in these buildings are installed the linear fluorescent type (18 and 36 W). Thanks to a careful inspection, it was possible to calculate the total installed power for each school.
The air conditioning systems of the three buildings are heterogeneous both in the generative unit and with regard to the emissive elements. Building 1 is equipped with a variable refrigerant flow (VRF) direct expansion multi-split air conditioning system with a total of 12 external units, of which six units are 26 kW and six are 32.6 kW for heating, equipped with 50 internal units distributed in all the rooms of the complex, except in the corridors where 24 wall units are installed (from 3.2 to 4 kW for heating and from 2.8 to 3.2 kW for cooling). The system is centralized, guaranteeing a temperature of 18–20 °C in winter and 25–26 °C in summer. The heating of Building 2 is carried out thanks to column and plate cast iron radiators connected to an old oil boiler of 450 kW. As the heating system is undersized, mono-split units are installed in some areas of the building (2.93–3.81 kW for heating and 2.64–3.52 kW for cooling). In addition, the area used as a lecture hall and for state exams is characterized by the presence of two rooftop-packaged HVAC units for air conditioning of the rooms with a net heating capacity of 34.9 and 40.8 kW, respectively; the emission takes place through helical diffusers. Finally, Building 3 is equipped with the presence of a heating system which, during the inspection phase, due to the age of the distribution system and therefore the work in progress for commissioning, was not operational; furthermore, the building does not have a cooling system. For each building with a heat pump system, according to the technical data sheets, a variable coefficient of performance (COP) function of the external temperature has been considered.
In all three buildings, the production of DHW is limited to only the toilets using electrical boilers.
3.5. Actual Energy Performance of School Buildings
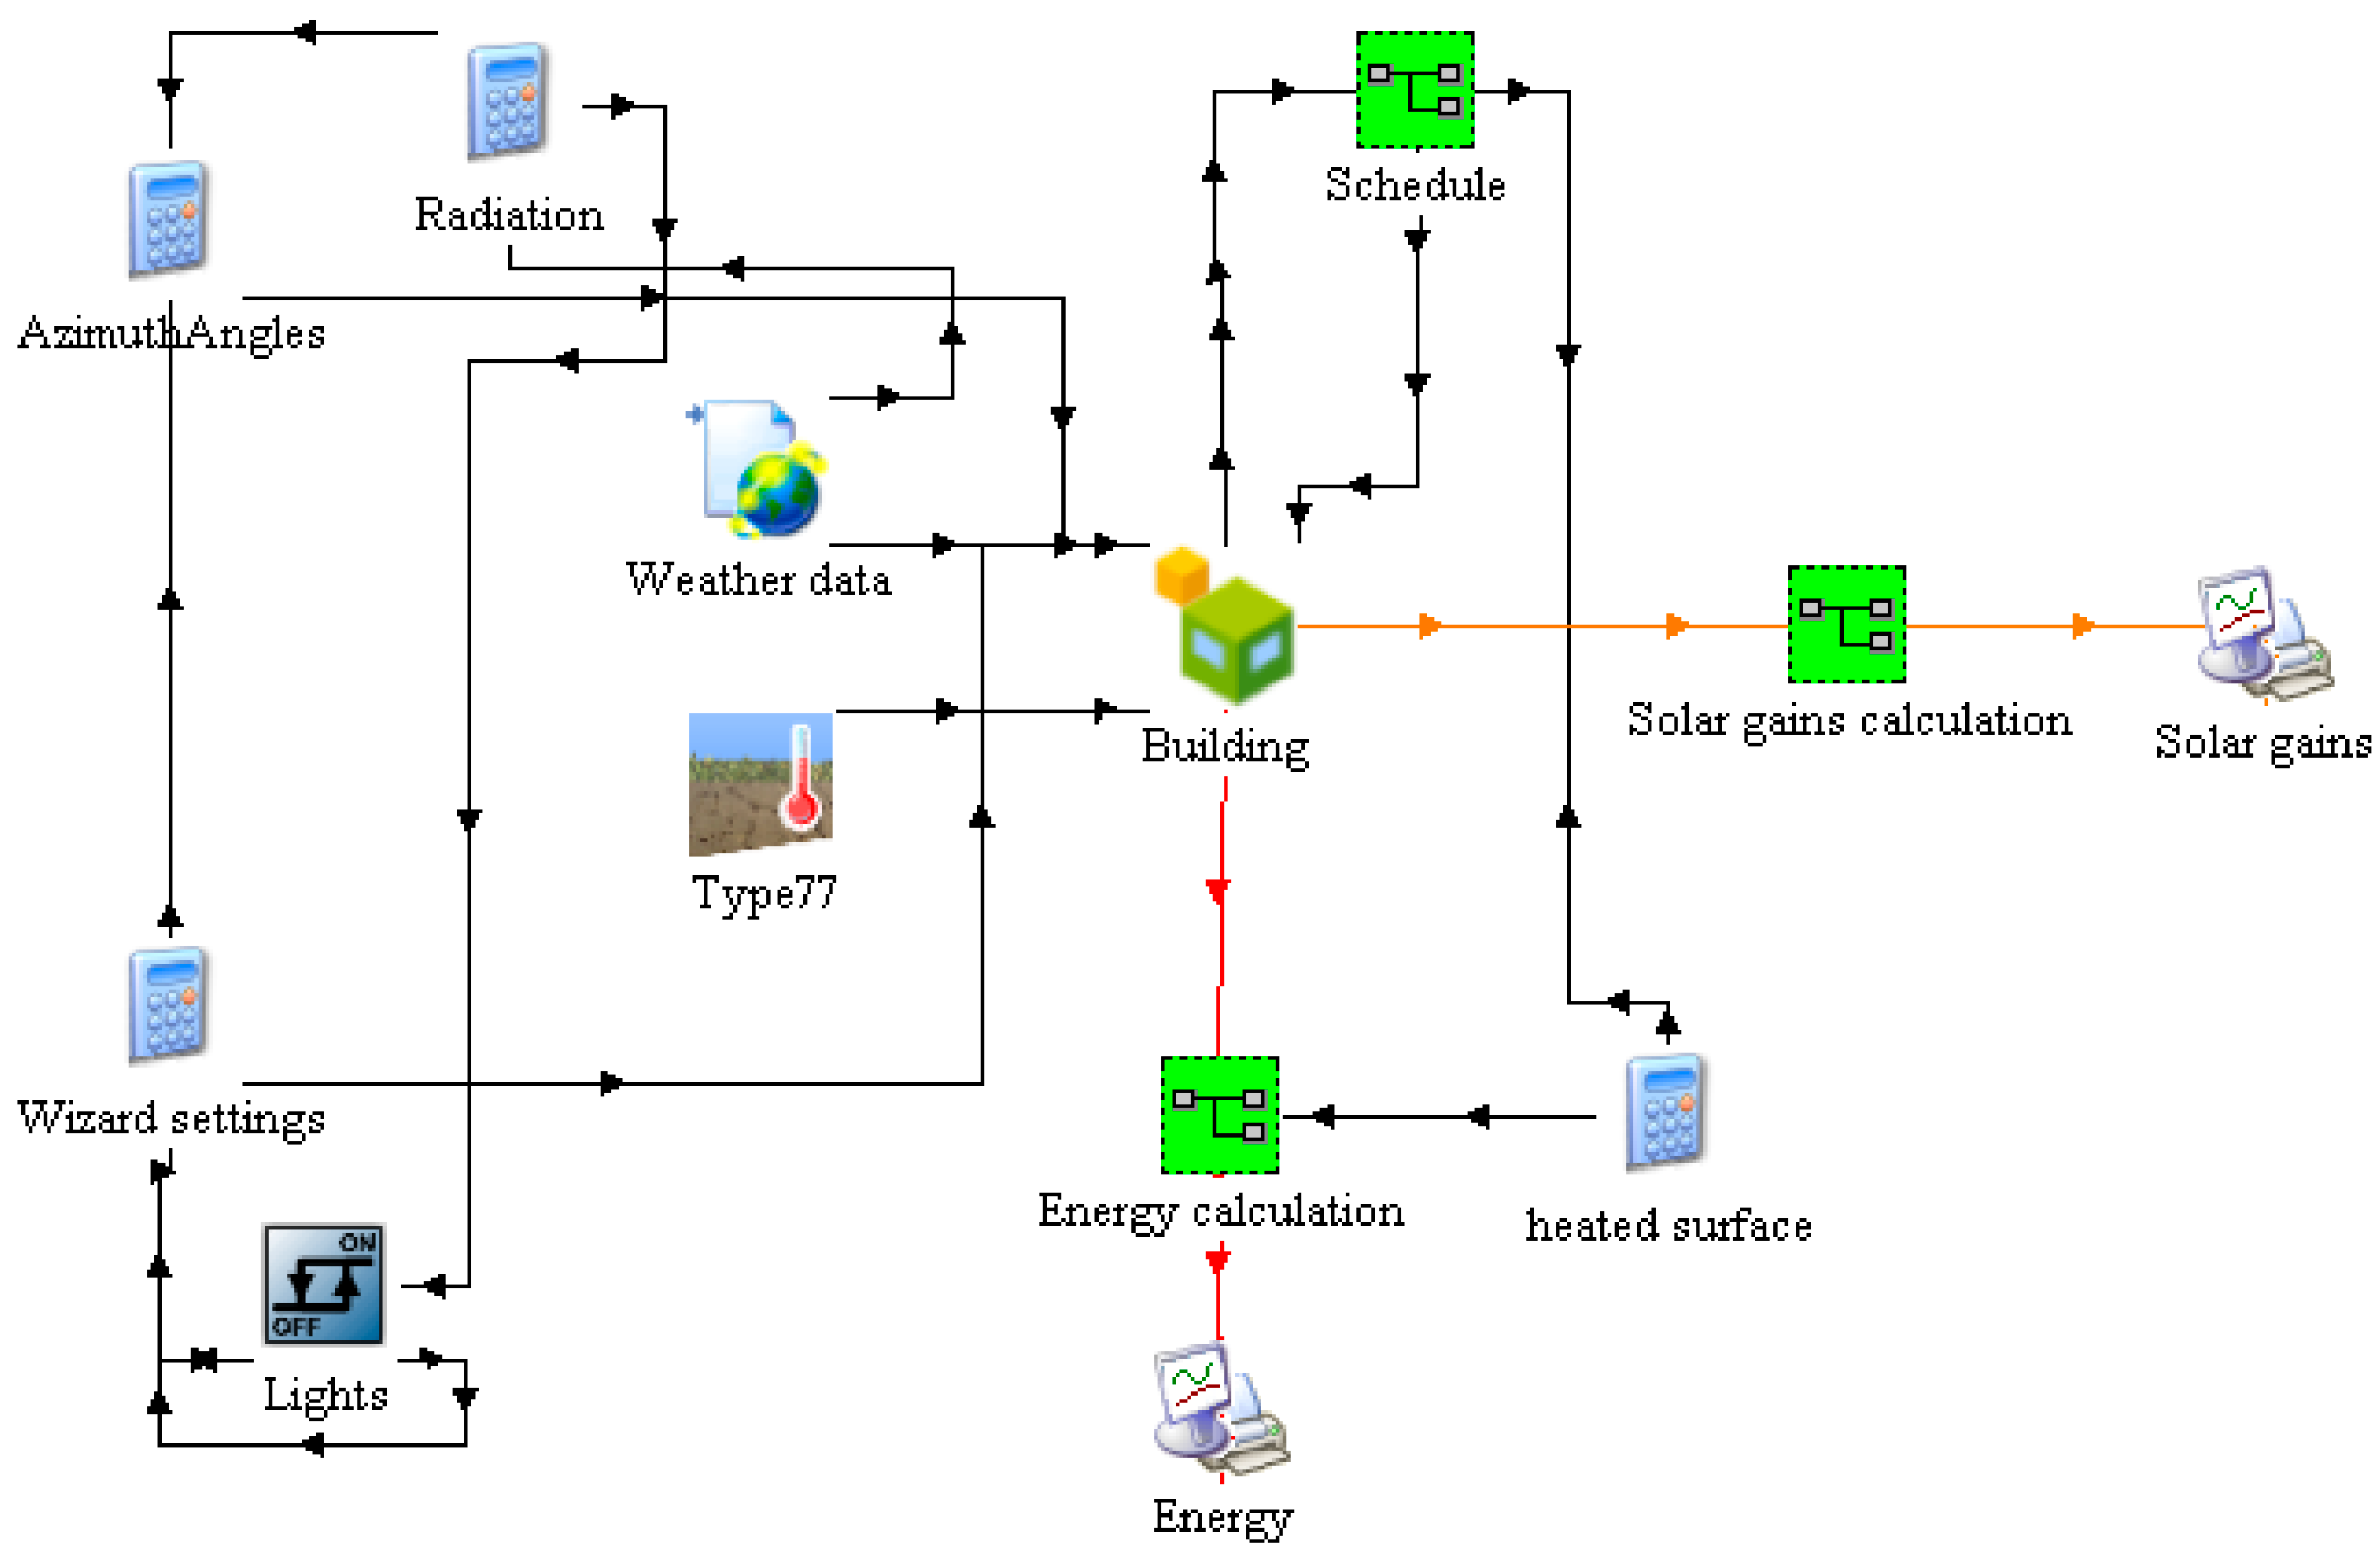
A detailed building thermal balance assessment was carried out by developing dynamic models in the TRNSYS environment [21]. Figure 4 shows the general layout of the implemented model.
The heart of the model is represented by the type 56 “Building” which represents the building model in which all thermophysical, geometric, thermal load, etc. features have been implemented. Directly connected to the “Building”, there are: the macro “schedule” that explains in detail the on/off times of all the utilities in the building; the type 77 “ground temperature” which models the thermal exchange of the building with the ground and the “Weather data” which represent the climatic context in which the building is located. Depending on the type of study, it is possible to calculate and/or plot one or more contributions that come into play, such as the dispersing surfaces through a calculator or the solar gains with a plot. The input or output data with respect to the considered type are represented by the connections (solid lines) that enter or leave the type itself. To facilitate reading, these links can be characterized by different shading and/or colors.
At first, each building was divided into several thermal zones, each zone being representative of the main intended use and characterized by the internal gains and thermal and electric loads. In general, it was possible to identify, for each building, the following thermal zones shown in Table 4.
In detail, Special Classrooms are identified as all laboratories, libraries, gyms, multimedia classrooms and all those environments where the employment rate is not continuous; the No-Clima Zones identify all parts of the building without a climatization system and with HVAC.
The solar gains were determined from the dynamic simulation, based on the meteorological data, the geometric characteristics and the orientations of the building. Internal heat gain contributions from users were evaluated, creating specific schedules for occupancy, electrical equipment and the lighting system [50]. The internal gains are related to the office workers with sedentary activity, in detail, 120 W/person, with 65 W sensible and 55 W latent. [51].
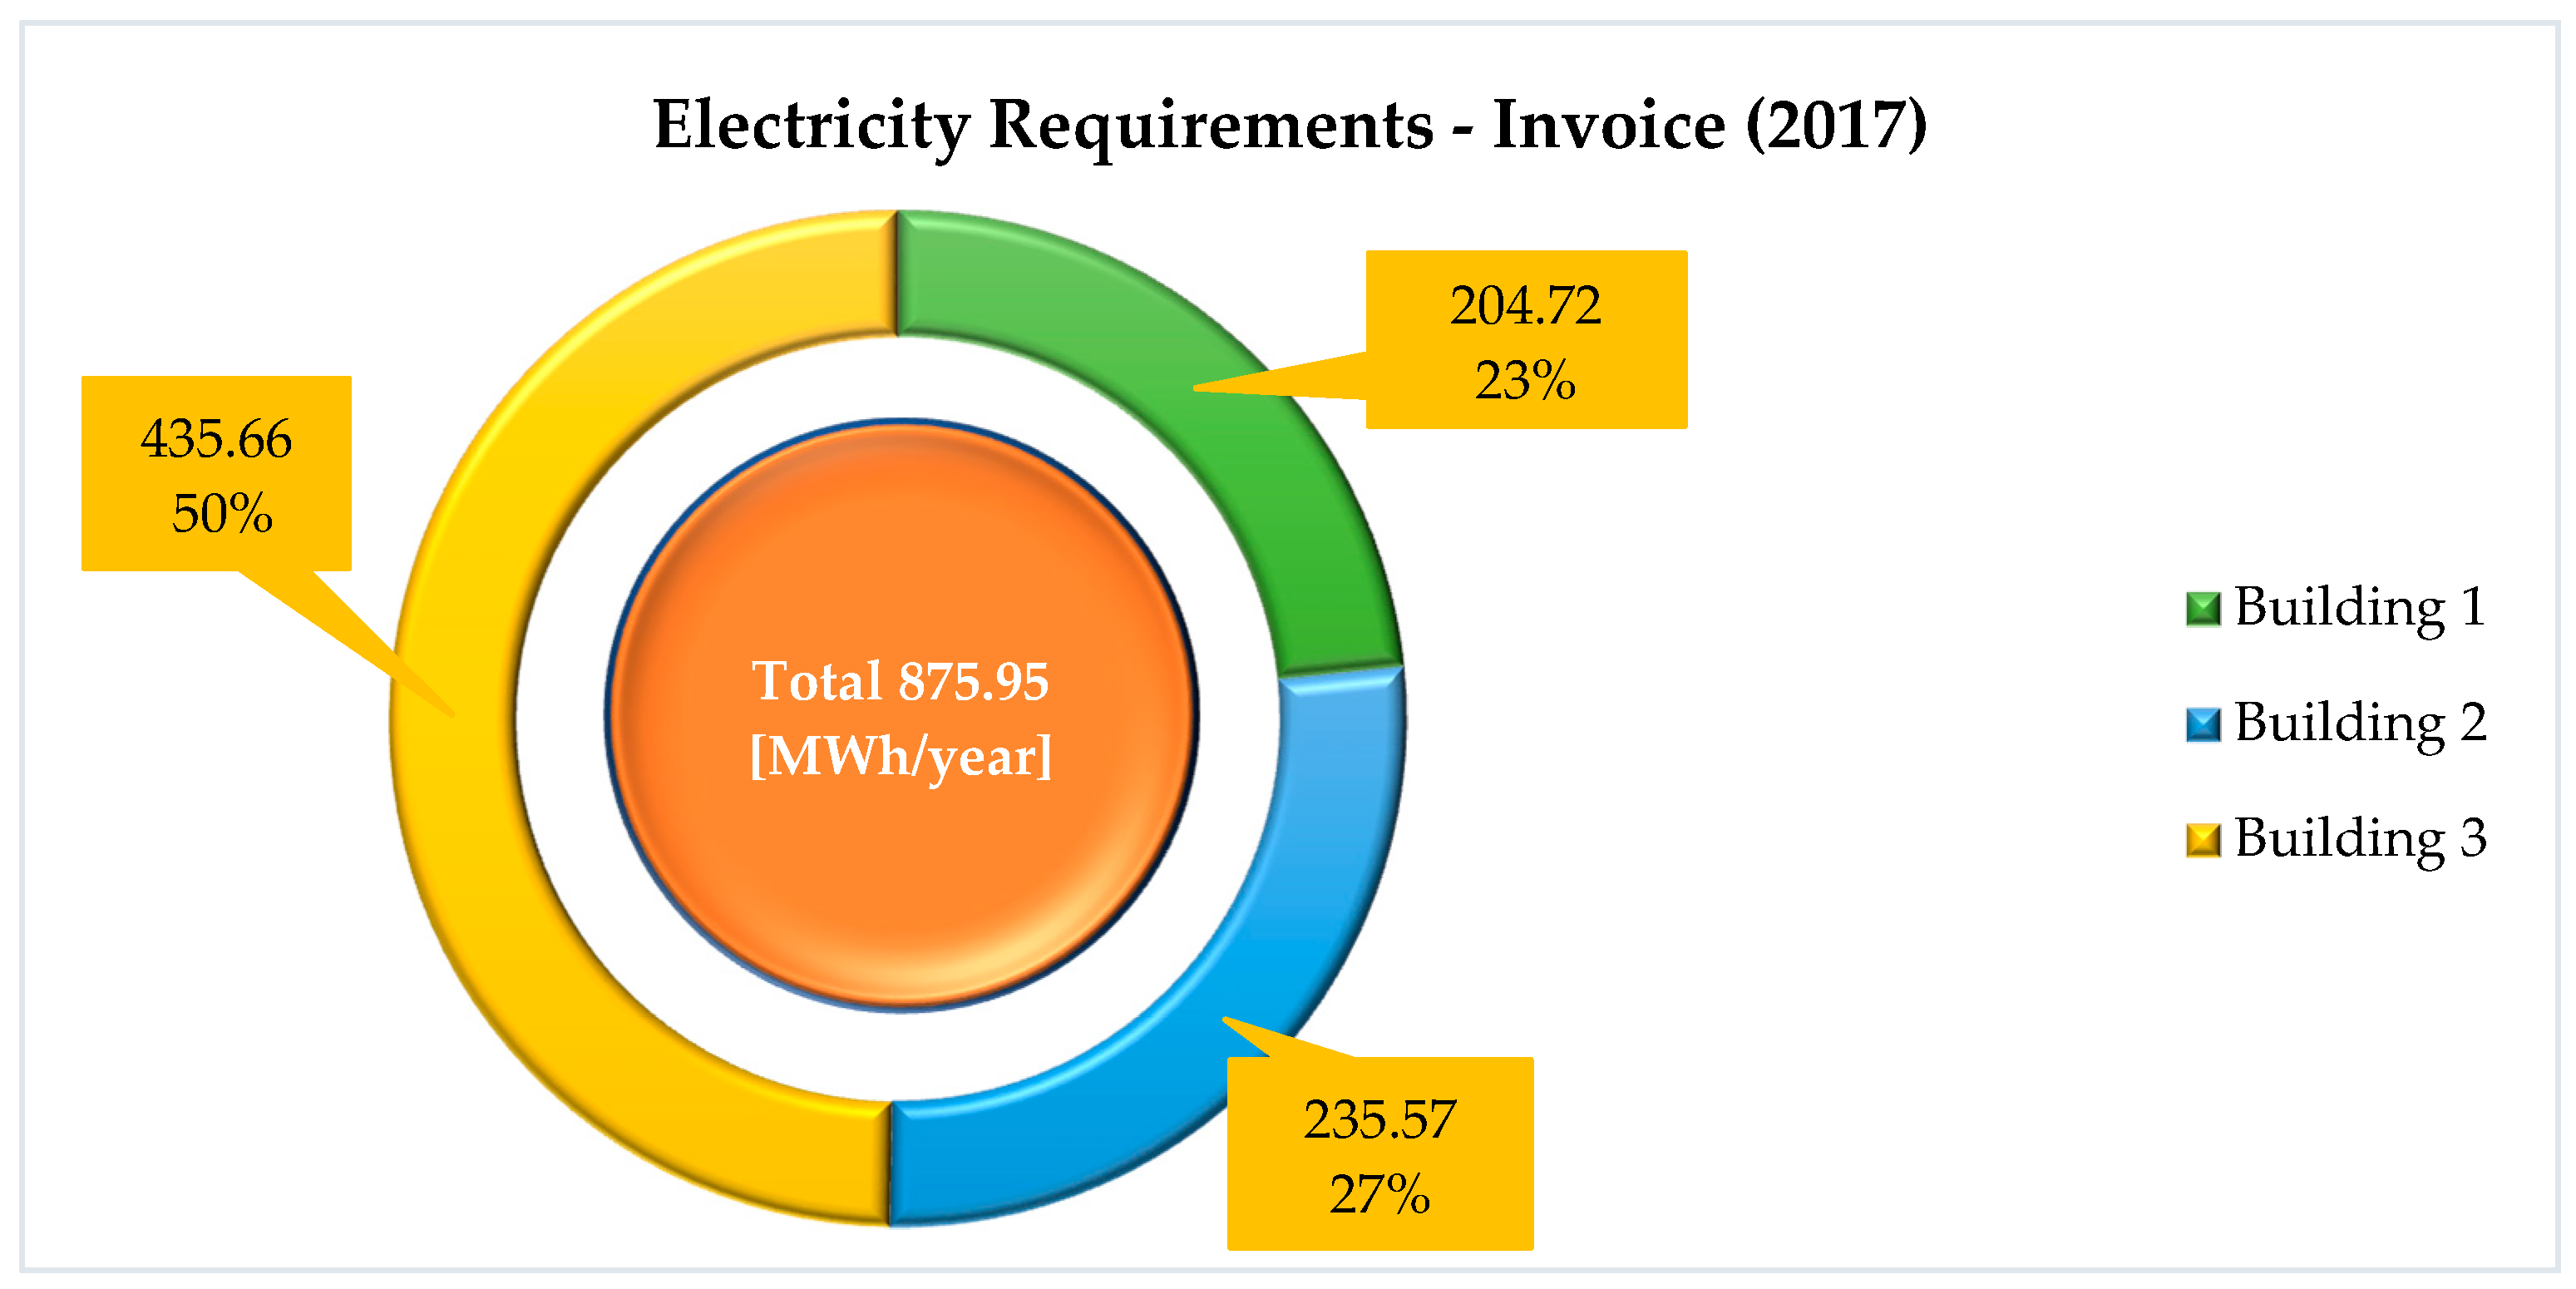
According to the various thermal zones and considering the actual annual opening and closing calendar of the school, the authors hypothesized, on an hourly basis, the thermal contributions due to the presence of electrical equipment and the average utilization levels of the schools’ equipment. The values of thermal power emitted by the various electrical users, differentiated in convective and radiative contributions, were taken from the guide “ASHRAE Handbooks 2009—Fundamentals” [52]. The electrical equipment contributions were implemented considering a partial or total use according to the working hours, assessing the radiative and convective contributions. To understand the total electrical consumption, the invoices of 2017 were analyzed, evaluating the total electrical consumption plotted in Figure 5. In detail, 50% of consumption is linked to a single school building, Building 3, while the remaining half is shared between the other two school buildings.
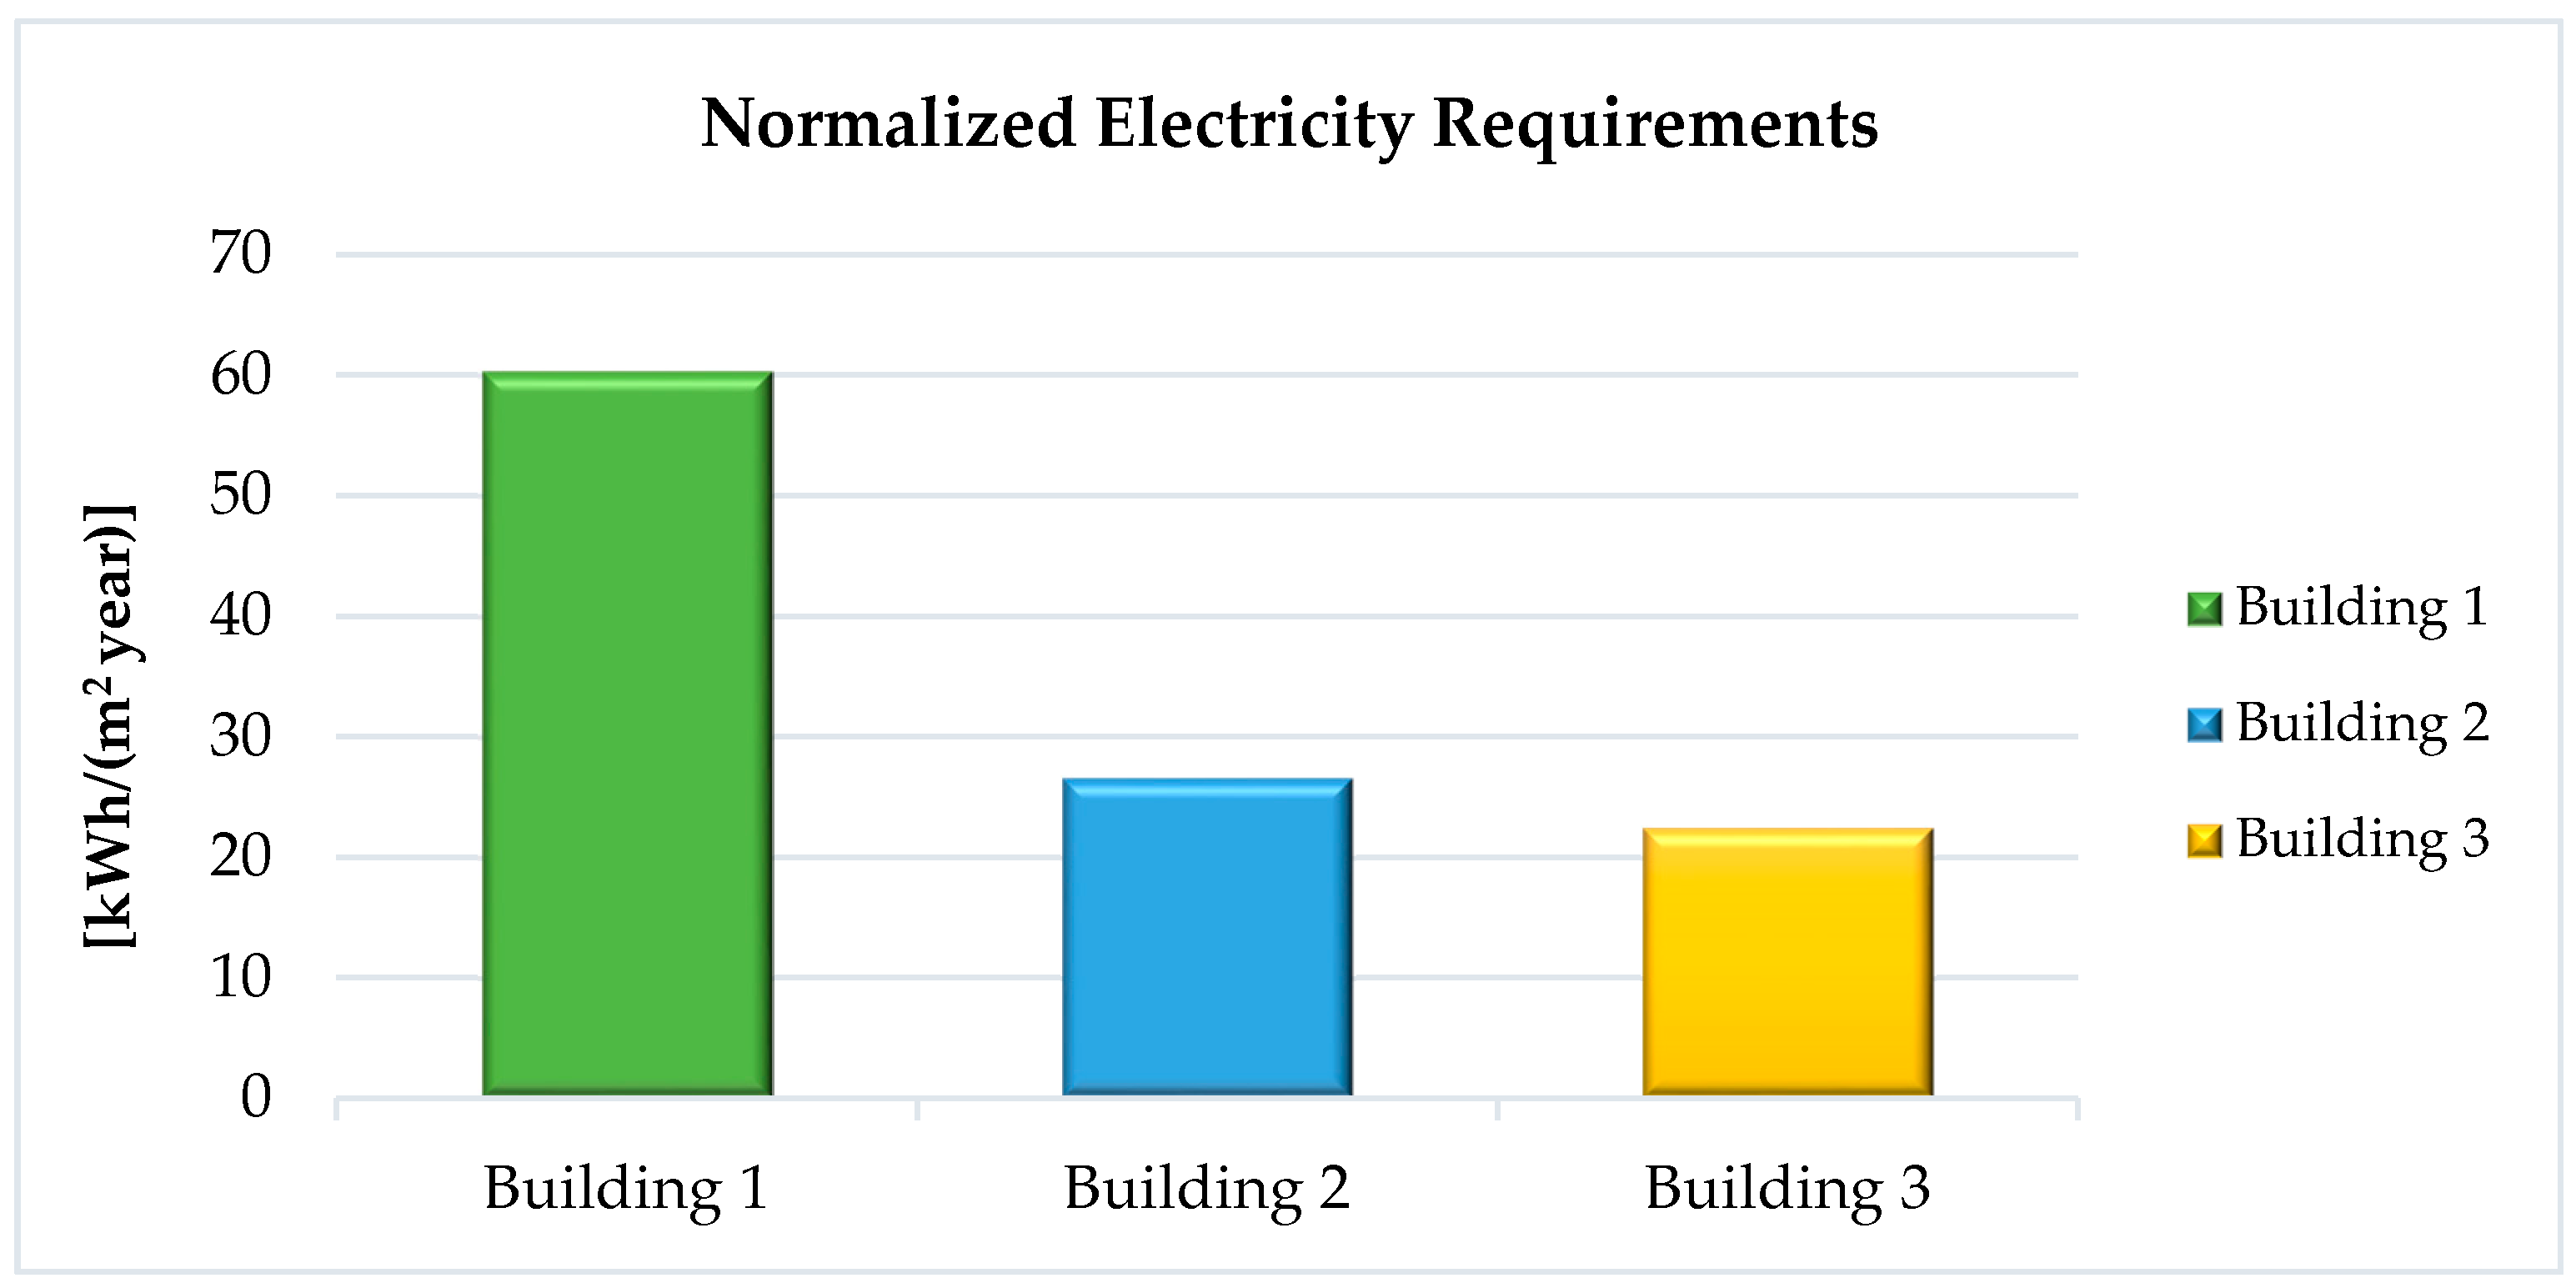
In order to better compare the energy performance of the three buildings, in Figure 6 the authors calculated and displayed the electricity consumption normalized to square meters of useful surface of each building.
According to the Italian regulation, for a non-residential building, the heating system is turned on eight hours per day. In general, these school buildings are open from Monday to Saturday from 7.00 a.m. to 3.00 p.m. and, one time a week, the offices are open until 6.00 p.m. The cooling period, for the B climatic zone, is suggested to be from 20th May to 30th September, remembering that, generally, from mid-June to mid-September, the school is closed, while the offices are closed only during the month of August. Obviously, the climatization systems were considered to also be turned off during all holiday periods (Sunday, Christmas, Easter, national holidays, etc.).
For each zone, the indoor temperature (T) and relative humidity (R.H.) were imposed; in all zones except in the hallway zone, were T = 20 °C and R.H. = 50% considered for the heating period, and T = 26 °C and R.H. = 60% for the cooling period; while in the hallway zone, T = 18 °C and R.H. = 50% were considered for the heating period, and T = 28 °C and R.H. = 60% for the cooling period.
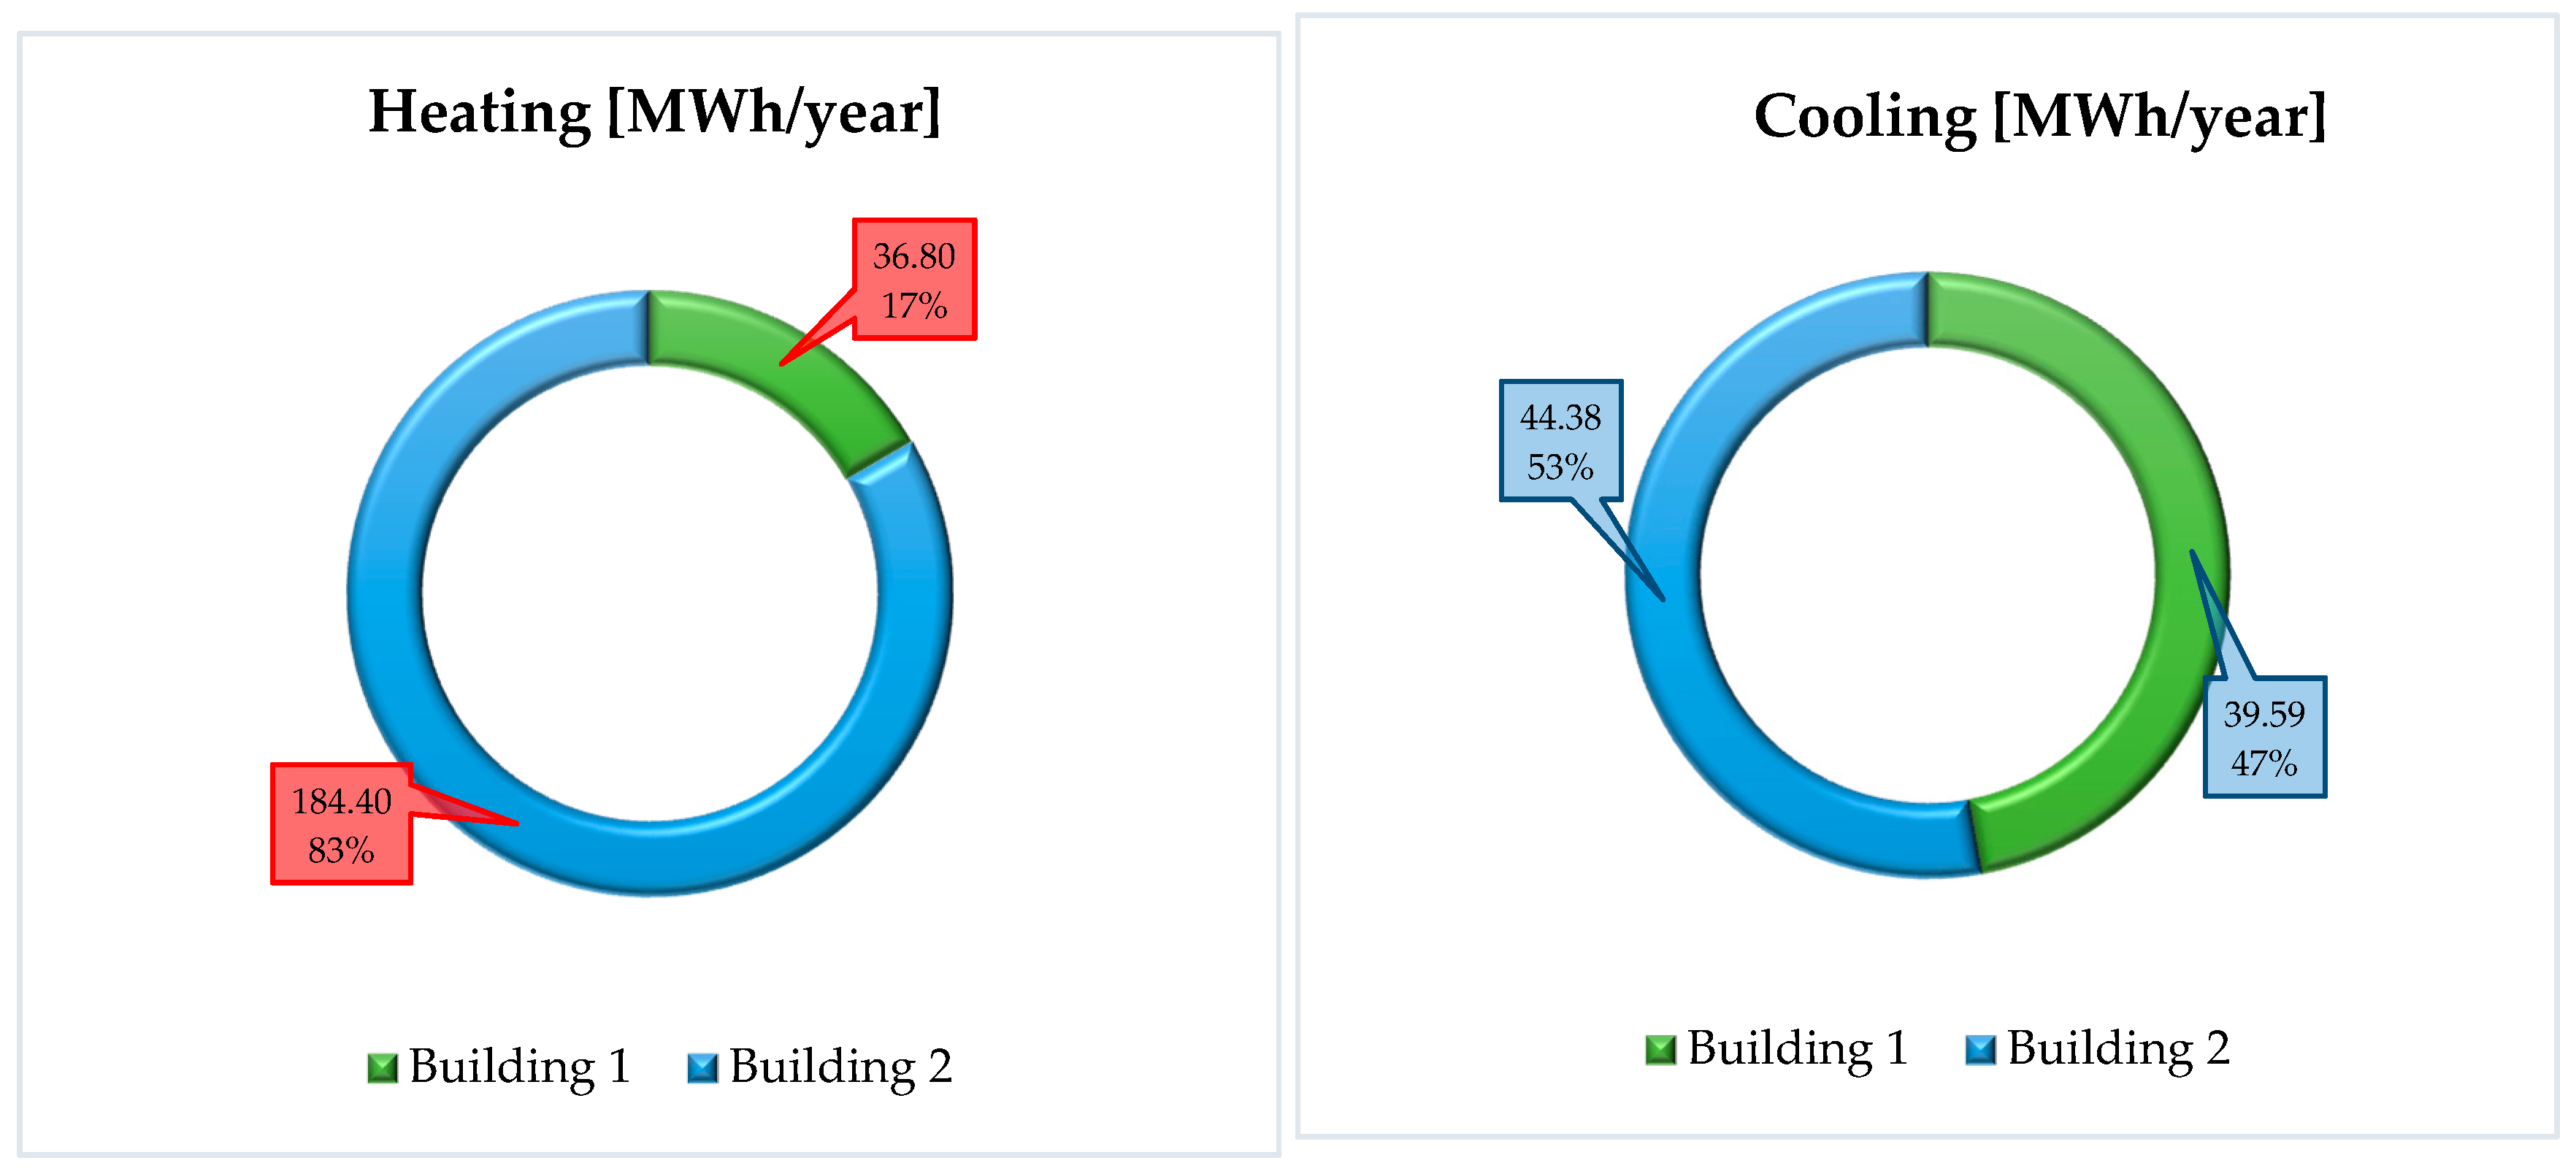
The school buildings were simulated considering two different scenarios. In the first case, the performance of each school building linked to the actual climatization systems was simulated to assess the actual thermal consumption (Figure 7).
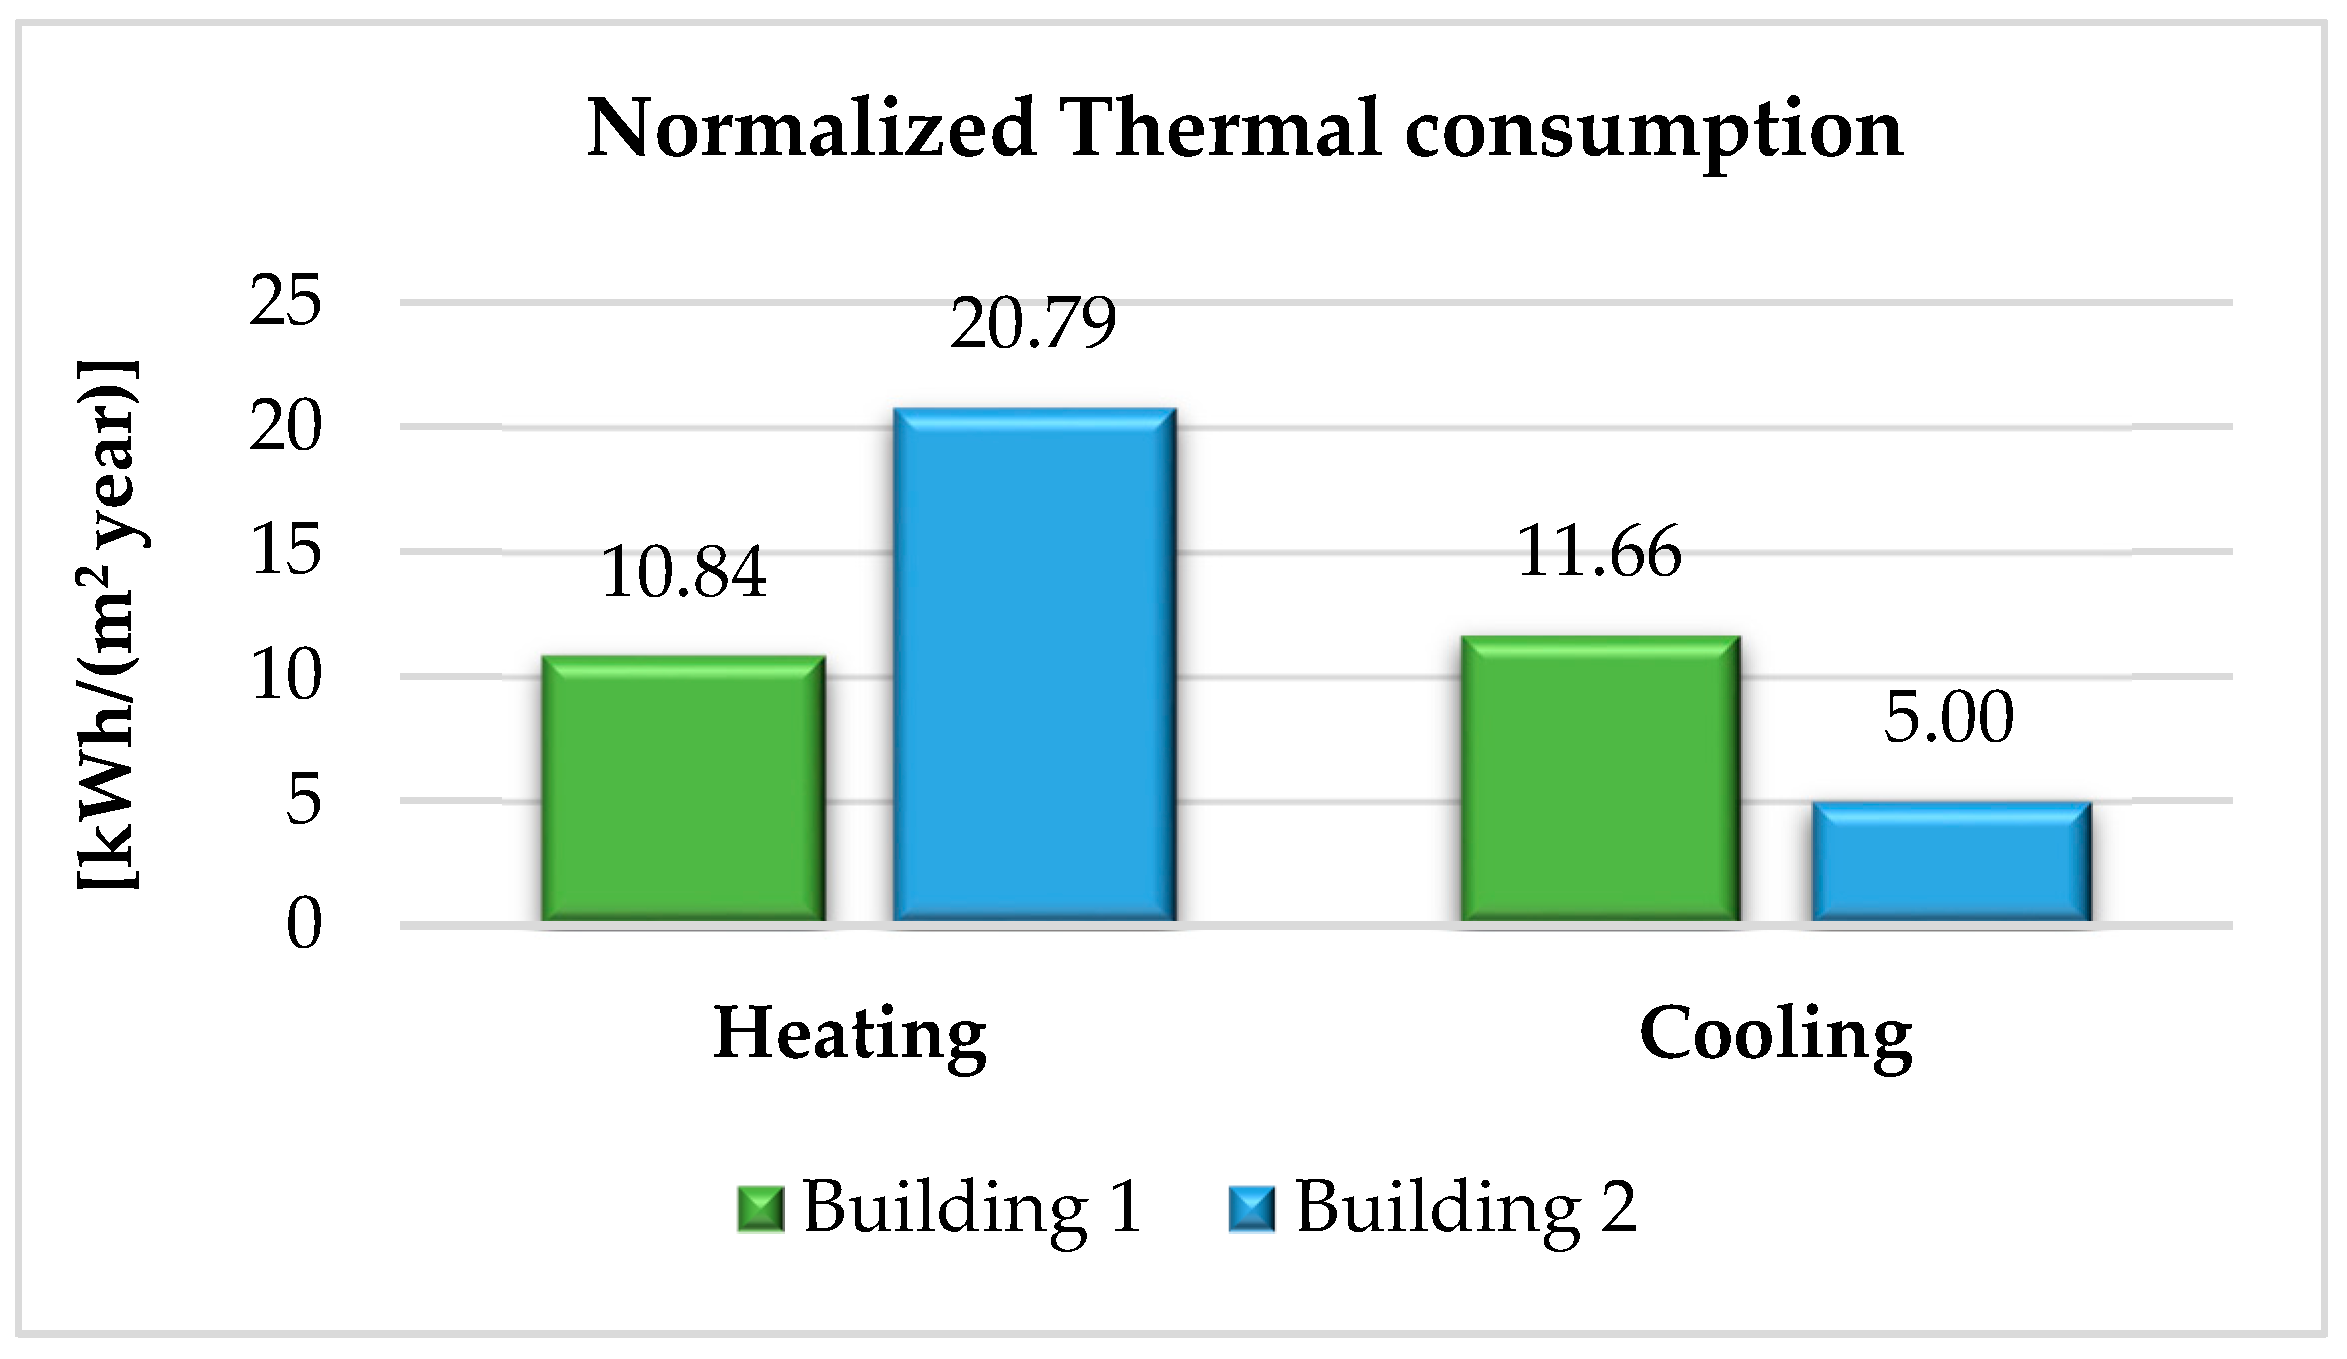
The graph shows how, in the heating period, Building 1 is characterized by a thermal consumption four times greater than that required by Building 2. Similar consumption occurs for the cooling of the two buildings; the normalized results per m2 of air-conditioned surface are shown in Figure 8.
For the first scenario, because the climatization system of Building 3 is turned off, this condition was not simulated.
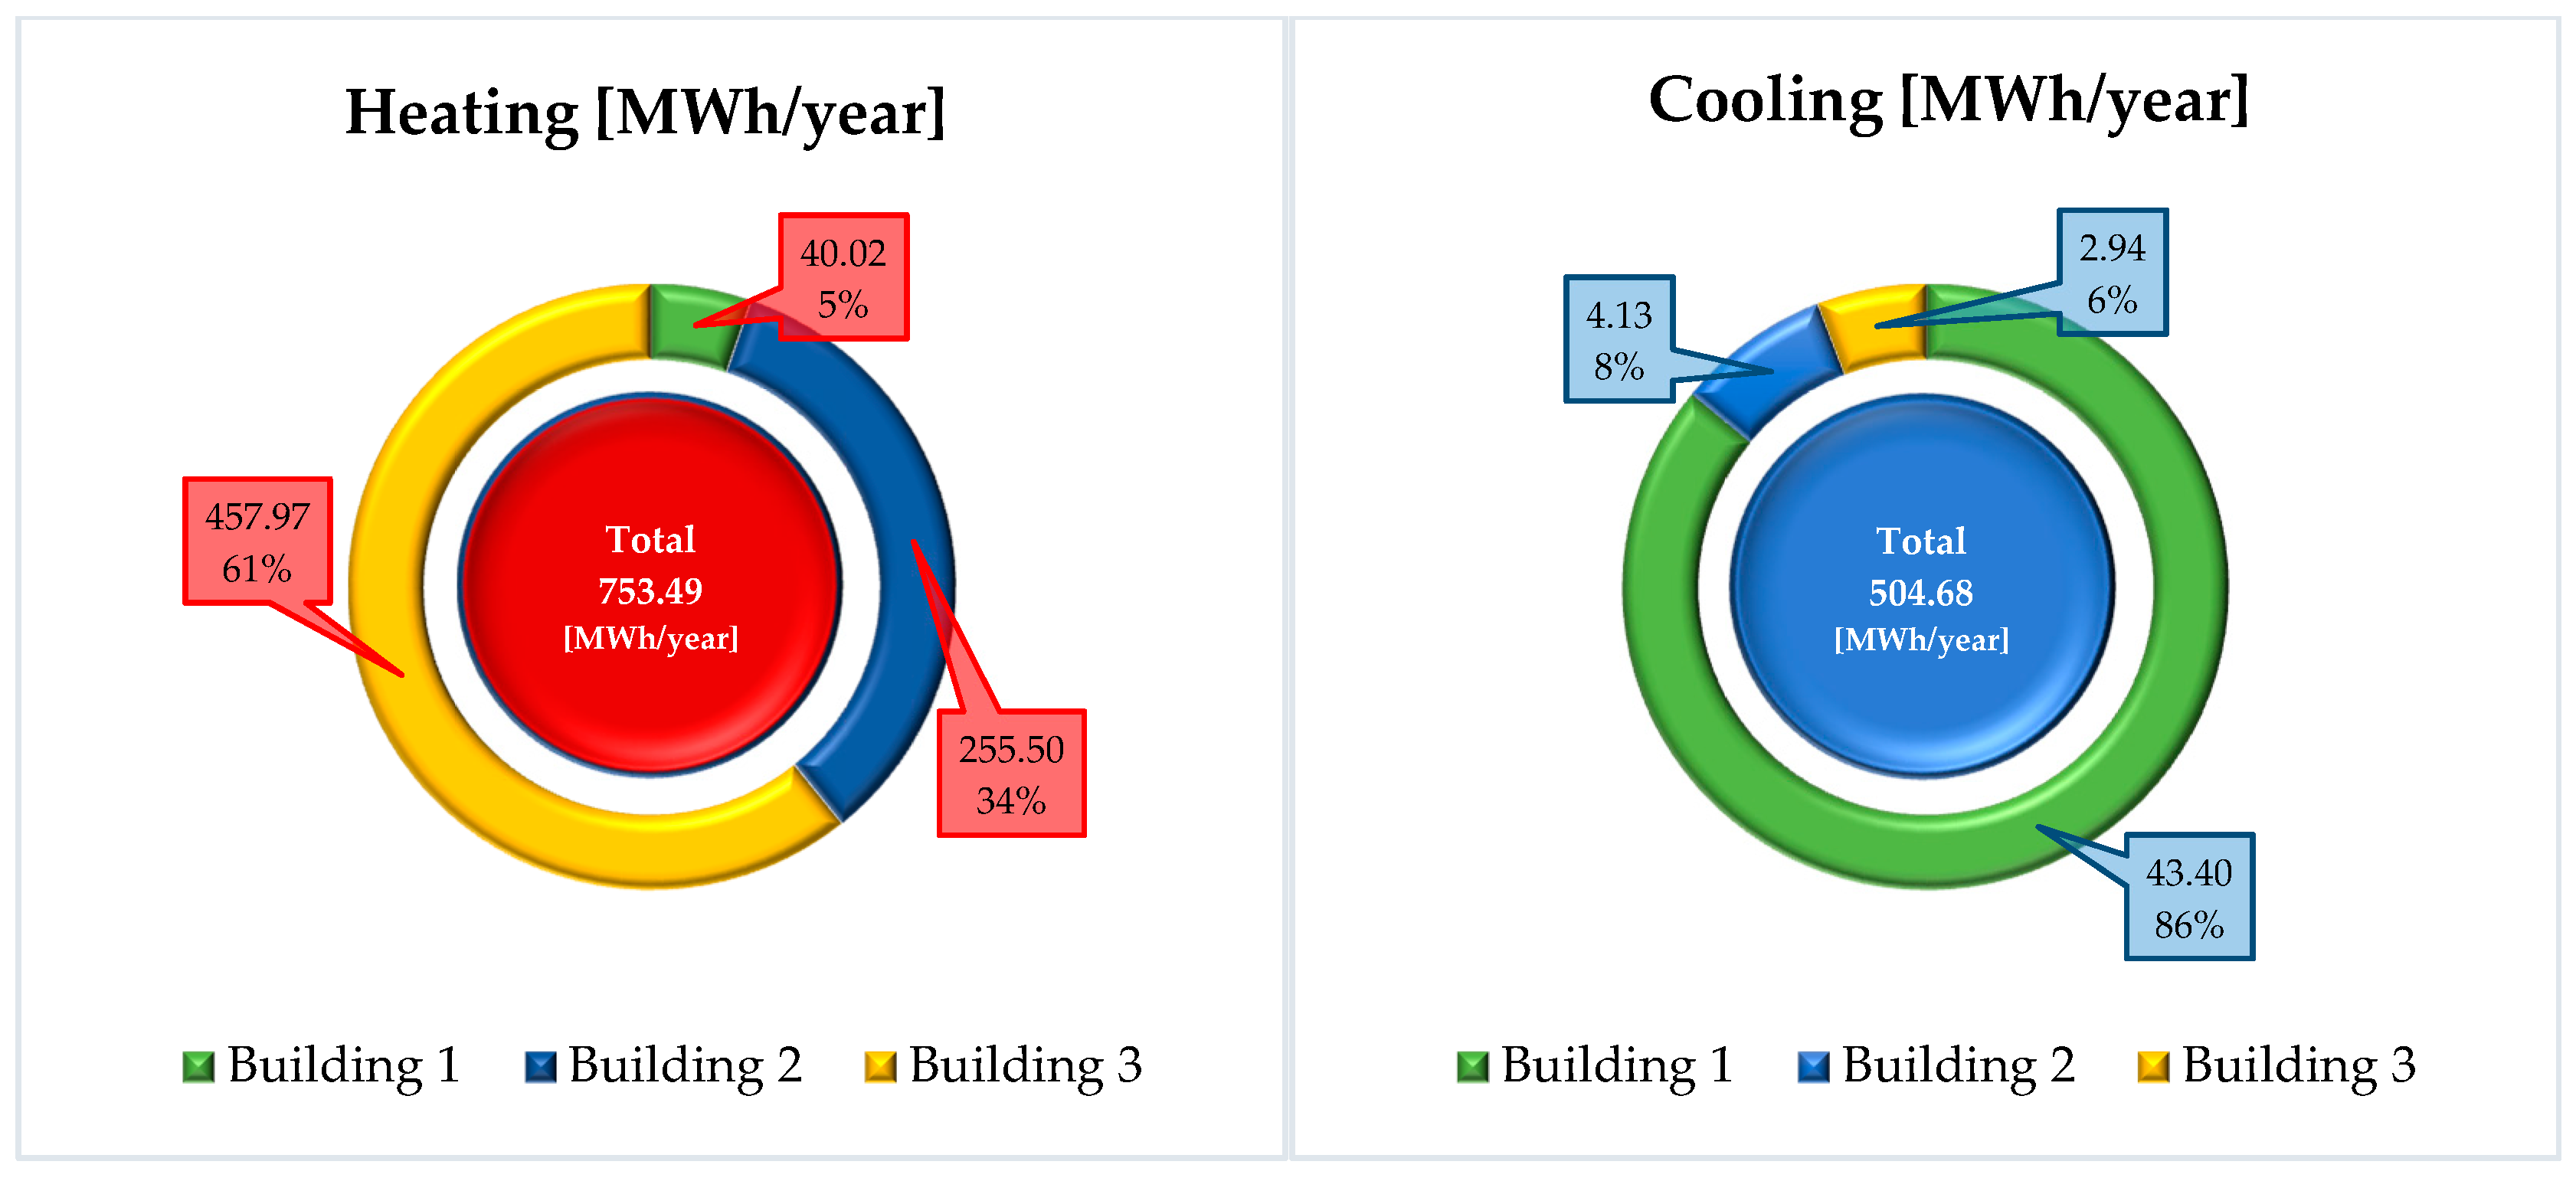
In the second scenario, the energy performance of each school building was simulated, assuming the achievement of comfortable conditions in each thermal zone. In this way, the authors obtained the total thermal loads. The results for each school are plotted in Figure 9.
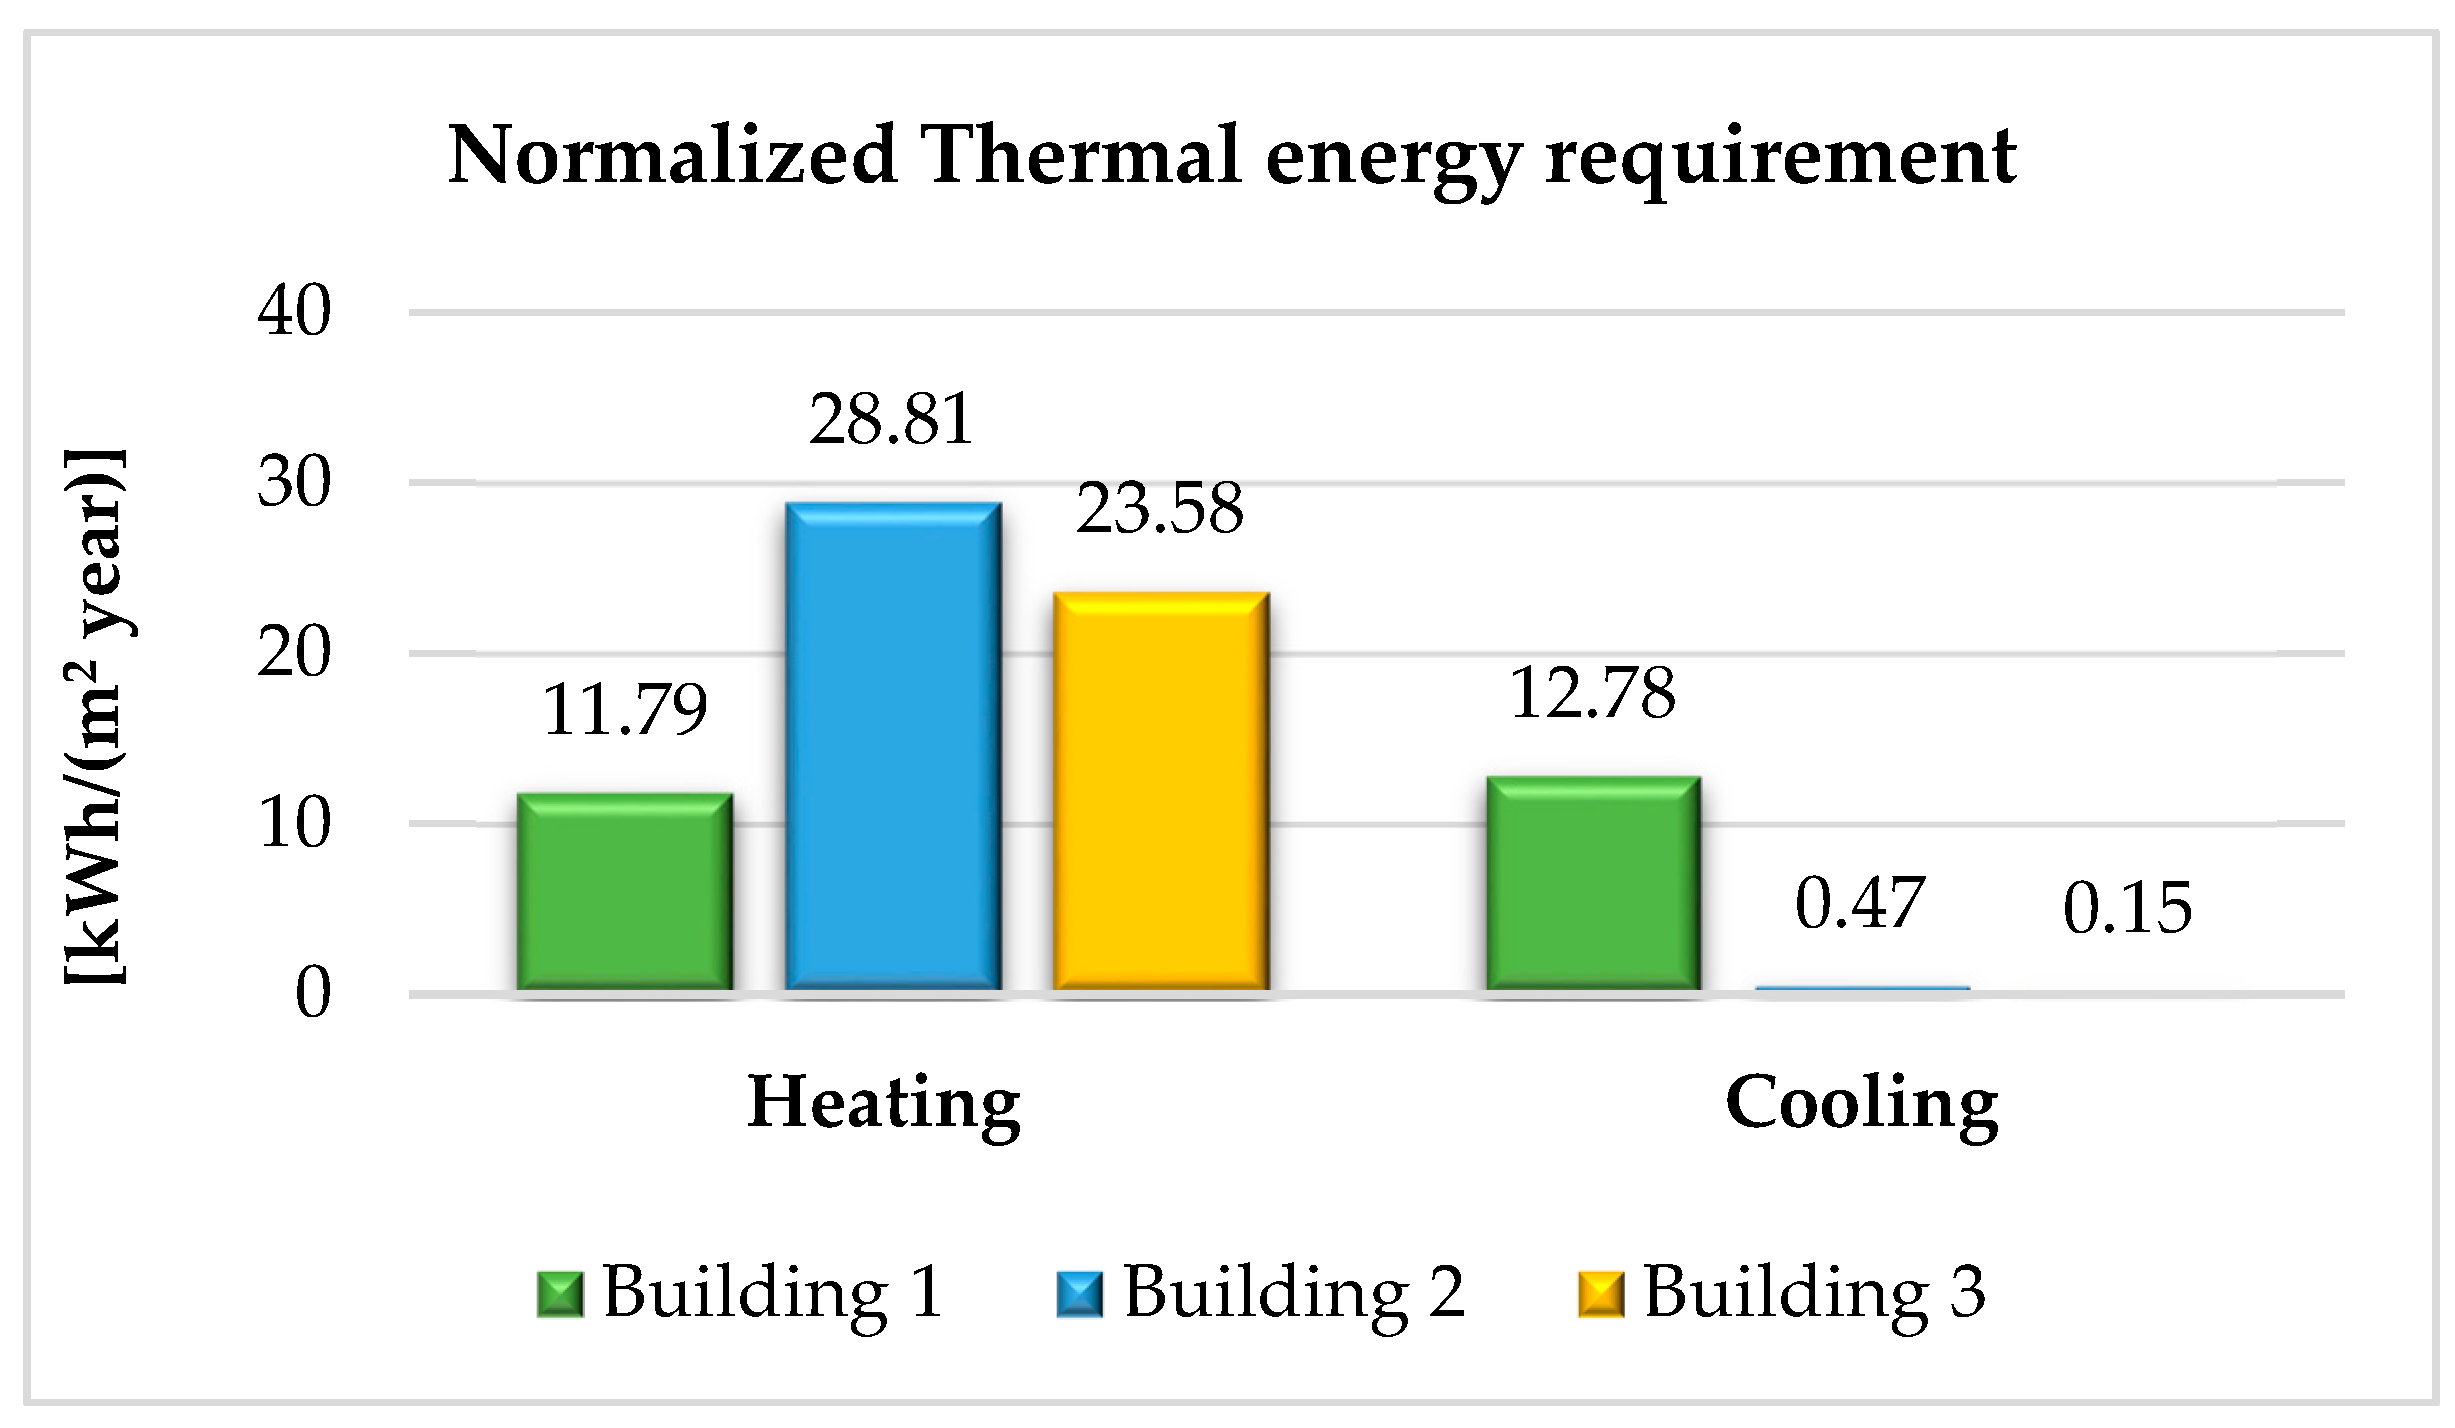
The results in Figure 9 show that more than 60% of the thermal loads for heating are related to Building 3 only, while almost 90% of the thermal loads for cooling are related only to Building 1. These results are associated with the type of envelope that the individual buildings present; in Figure 10, values normalized to m2 of air-conditioned surface are plotted.
To guarantee the reliability of the results, it was verified if the two models are calibrated. In detail, the criterion for calculating the calibration index k was followed, a procedure indicated by the Comitato Termotecnico Italiano (CTI). The k parameter (Equation (1)) measures the difference between operational consumption C0 (simulated) and actual consumption Ce (bill); the model is calibrated if for each energy carrier the calibration index is contained within ±5%.
As shown in Table 5, the actual electrical consumption (bill) is compared with simulated values, and in all cases, the k parameter shows the validity of the model.
Furthermore, for Building 3, it was also possible to determine the k parameter related to the thermal needs. Thanks to the knowledge of diesel consumption, the winter heat requirement was determined and compared with the simulated value; as shown in Table 6, parameter k is within the validity range.
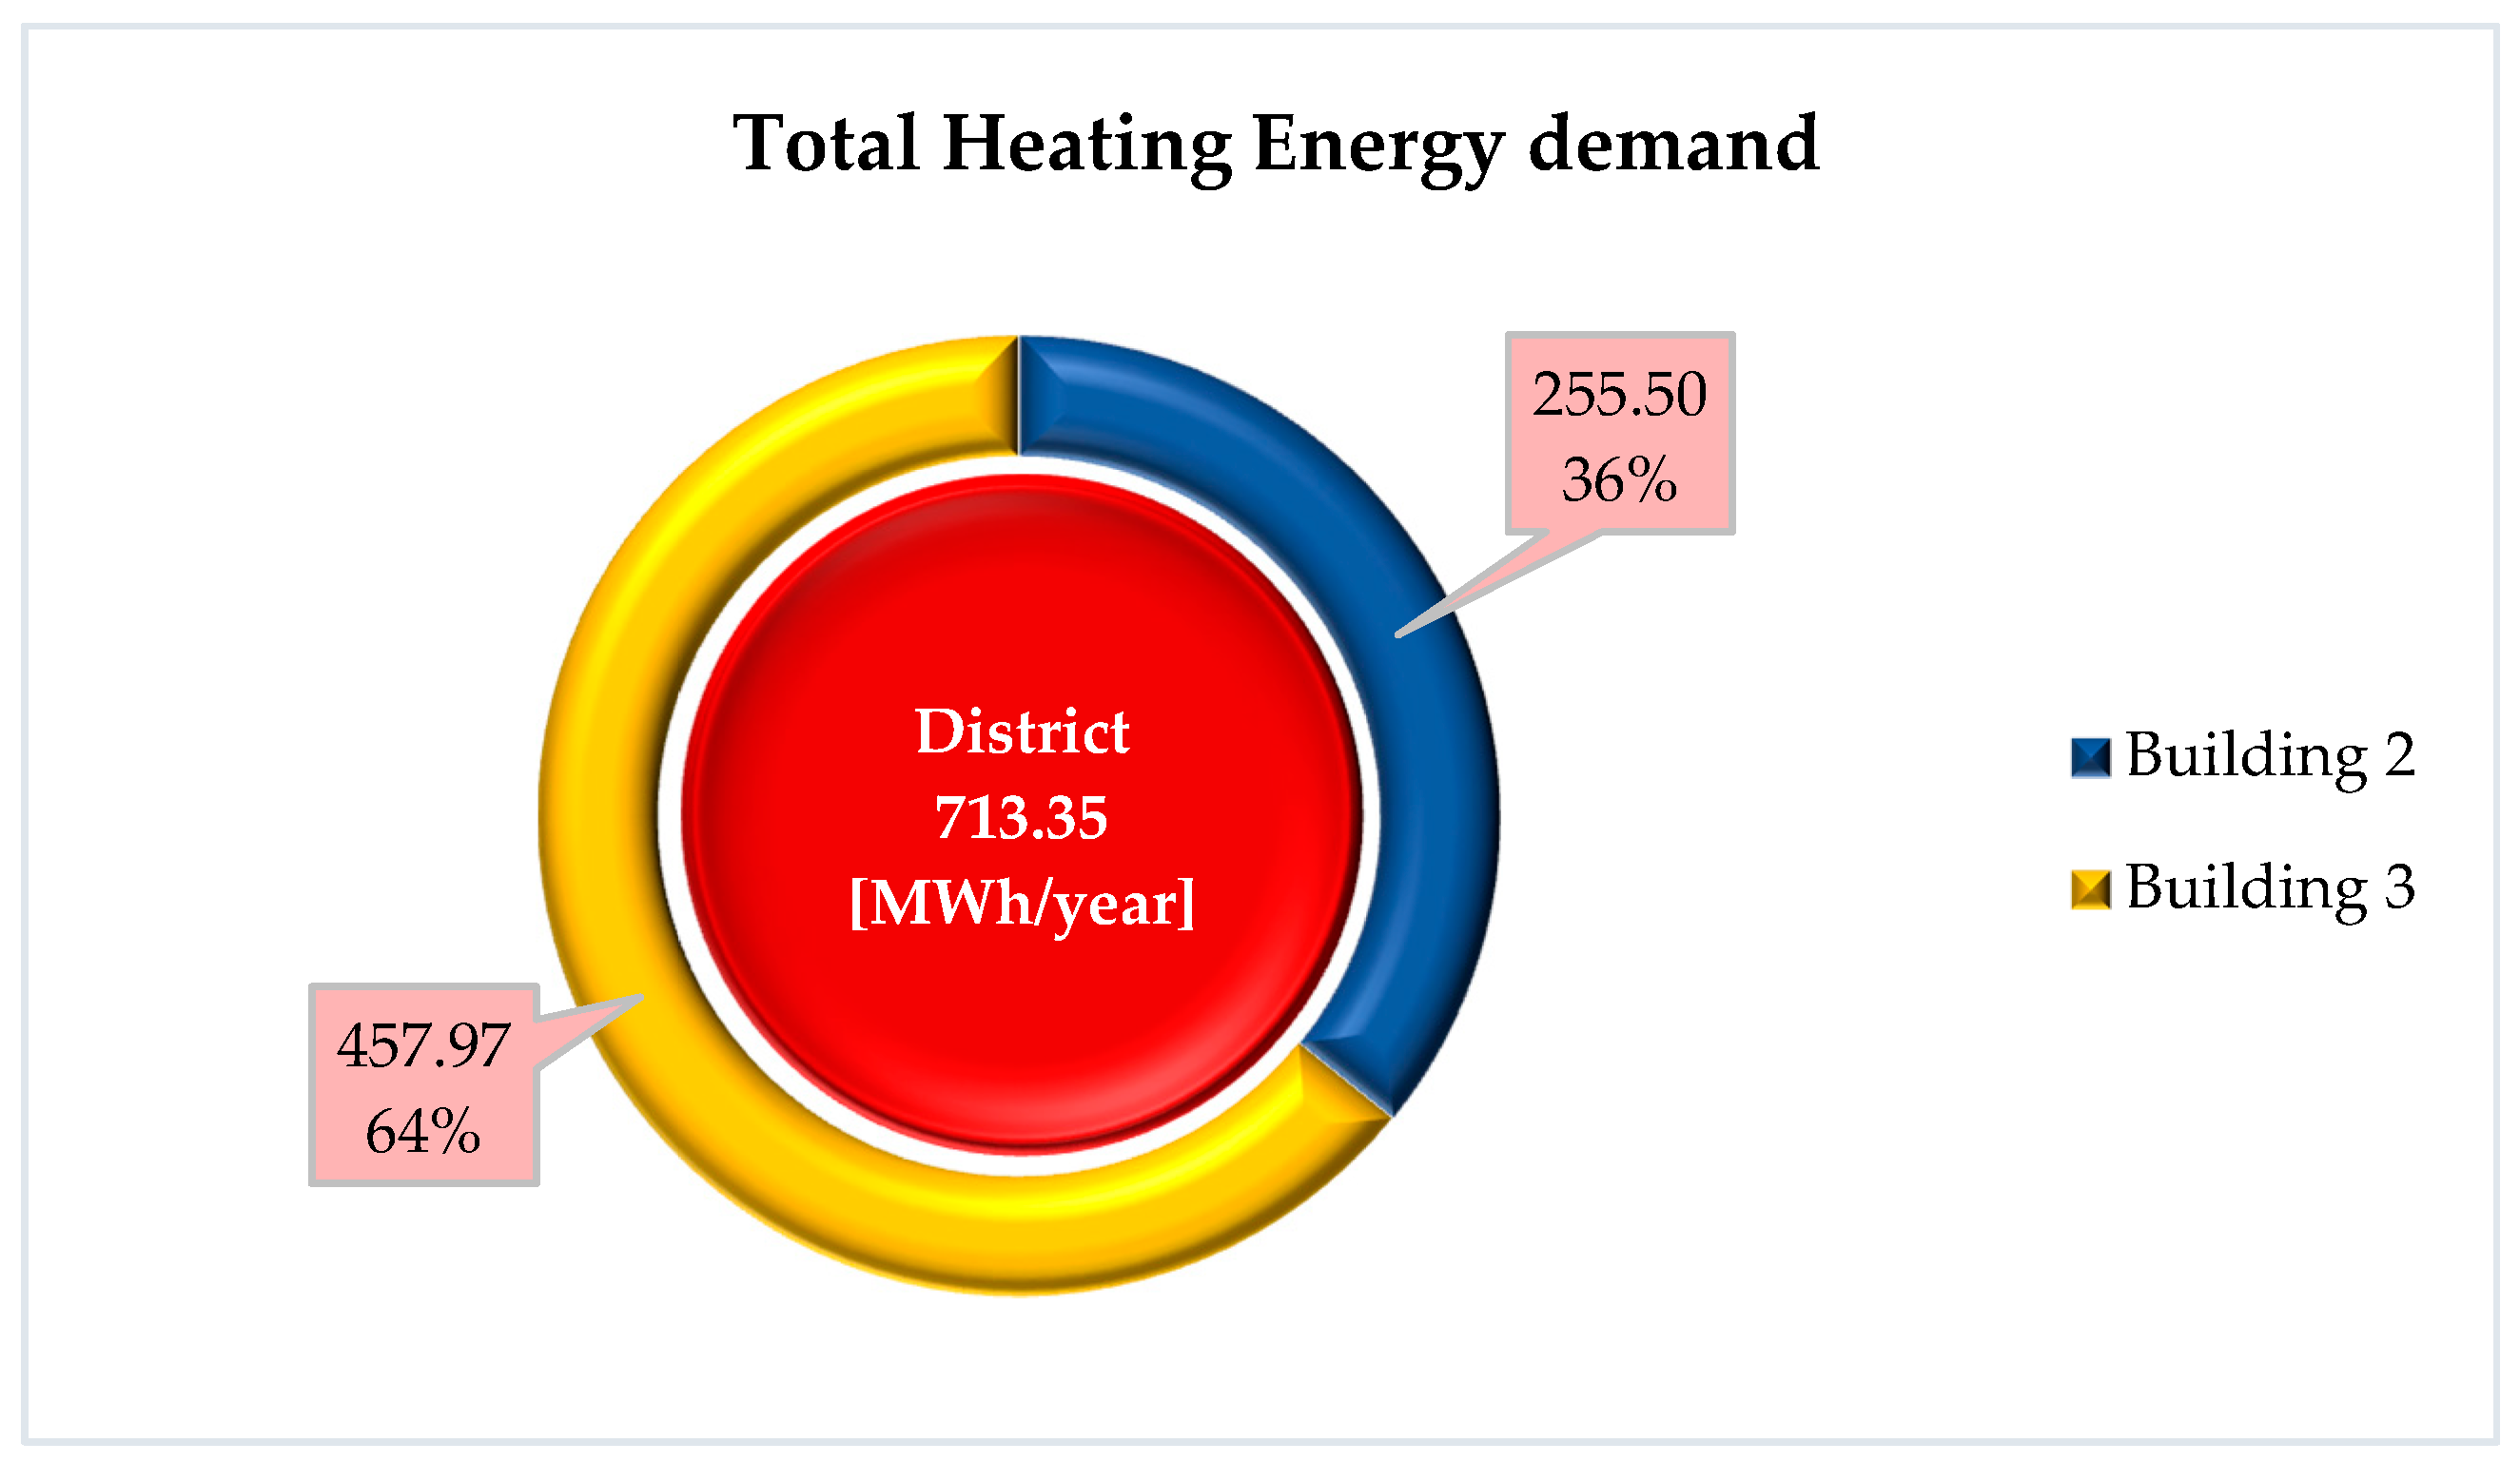
This evaluation was not possible for other two schools because there were no bills related to the thermal consumption in Building 1 thanks to the VRF system or in Building 2 because the air conditioning system was turned off. The sum of the heating thermal loads related to Building 2 and Building 3 represents the thermal energy requirement that the district heating plant will have to meet (713,464.31 kWh/year).
4. MESS: Multi-Energy School System
Starting from the results obtained by dynamic simulations of the three building TRNSYS models [21], the authors identified and designed appropriate air conditioning plant retrofit actions with the aim of reducing the energy consumption, greenhouse emissions and the energy costs of schools.
The simultaneous demand for electricity, for the electric utilities of all schools and for the heating and cooling of Building 1, and of thermal energy for the heating of the other two schools, suggests the possibility of installing a CHP system to partially meet the comprehensive district energy loads. In fact, CHP systems are widely recognized as a viable solution to reduce primary energy needs, costs and CO2 emissions. This is mainly due to the greater efficiency achievable by cogeneration systems compared to the separate generation of electricity and heat, as indicated in [14]. Therefore, these systems could well represent an efficient solution for the supply of energy districts with complementary loads, both from a temporal and type point of view, and an integrated RES [53,54]. However, their performance depends heavily on their sizing and operational strategy, especially if coupled with renewable energy plants [14]. Therefore, optimization methods are needed to exploit their full potential [55] because the over sizing or under sizing of the CHP plant could completely compromise the achievable energy saving potential [56].
In this work, to ensure the technical–economic feasibility of the integrated system, the authors decided to size the CHP unit in order to ensure a complete coverage of the thermal energy requirement and, considering the great availability of surfaces of the school buildings and high values of solar radiation, typical of the Mediterranean latitudes, the residual electricity rate would be partially compensated by installing a PV system in each building.
The CHP system chosen is characterized by an internal combustion engine powered by natural gas. Furthermore, due to the low cooling loads, which would not justify the investment costs, the possibility of using an absorption machine for the production of chilled water was excluded.
In the sizing of the integrated system, the heat losses of the district heating network pipe lines, heat storage and distribution systems lines were taken into account. Finally, evaluating the cash flows, the net present value (NPV) and the return of investment linked to the variation of the interest rates applied, the economic analysis of both the PV systems and the CHP unit was carried out.
Since over the years the gradual application of some necessary efficiency actions have been hypothesized, a decreasing energy consumption was considered. As regards the costs of energy supplies, according to the data obtained from the GSE website [57] for electricity, and ARERA for gas [58], an annual increase was considered. Finally, calculating the reduction of CO2 emissions was done to assess the environmental impacts.
4.1. CHP System
The most important and delicate phase of the design of a district heating plant using a CHP system is the correct sizing of the cogeneration unit according to the energy requirements of the users, excluding the possibility of dissipating heat into the environment. Therefore, the best management strategy is to strictly follow the thermal demand.
As indicated in Section 3, one of the main reasons that led to the identification of the three examined buildings lies in their complementarity in terms of electricity and thermal energy demands. In fact, Building 1 is powered by a heating system with direct expansion heat pumps driven by an electric motor, while the other two schools are equipped with hydronic heating systems powered by gas or oil-fired boilers. Therefore, supplying the two hydronic heating systems (Building 2 and Building 3) with the thermal energy produced by the CHP plant was hypothesized. The yearly thermal loads of the two users served by the district heating network were obtained by dynamic simulation carried out in TRNSYS, whereas, as regards the electricity consumption of all three schools, the data reported in the energy bills for the year 2017, provided by the “Metropolitan City of Palermo”, was used (Figure 5). Figure 11 shows the heating loads of the entire energy district.
Considering the intended use of the buildings, the thermal energy demands are linked with the schools’ opening hours and with the winter heating period set by [46] for the B climatic zone relating to the city of Palermo. Accordingly, the CHP plant would be active only for 764 h per year. As mentioned above, the possibility of using an absorption machine to take advantage of the thermal energy production in the summer regime was excluded.
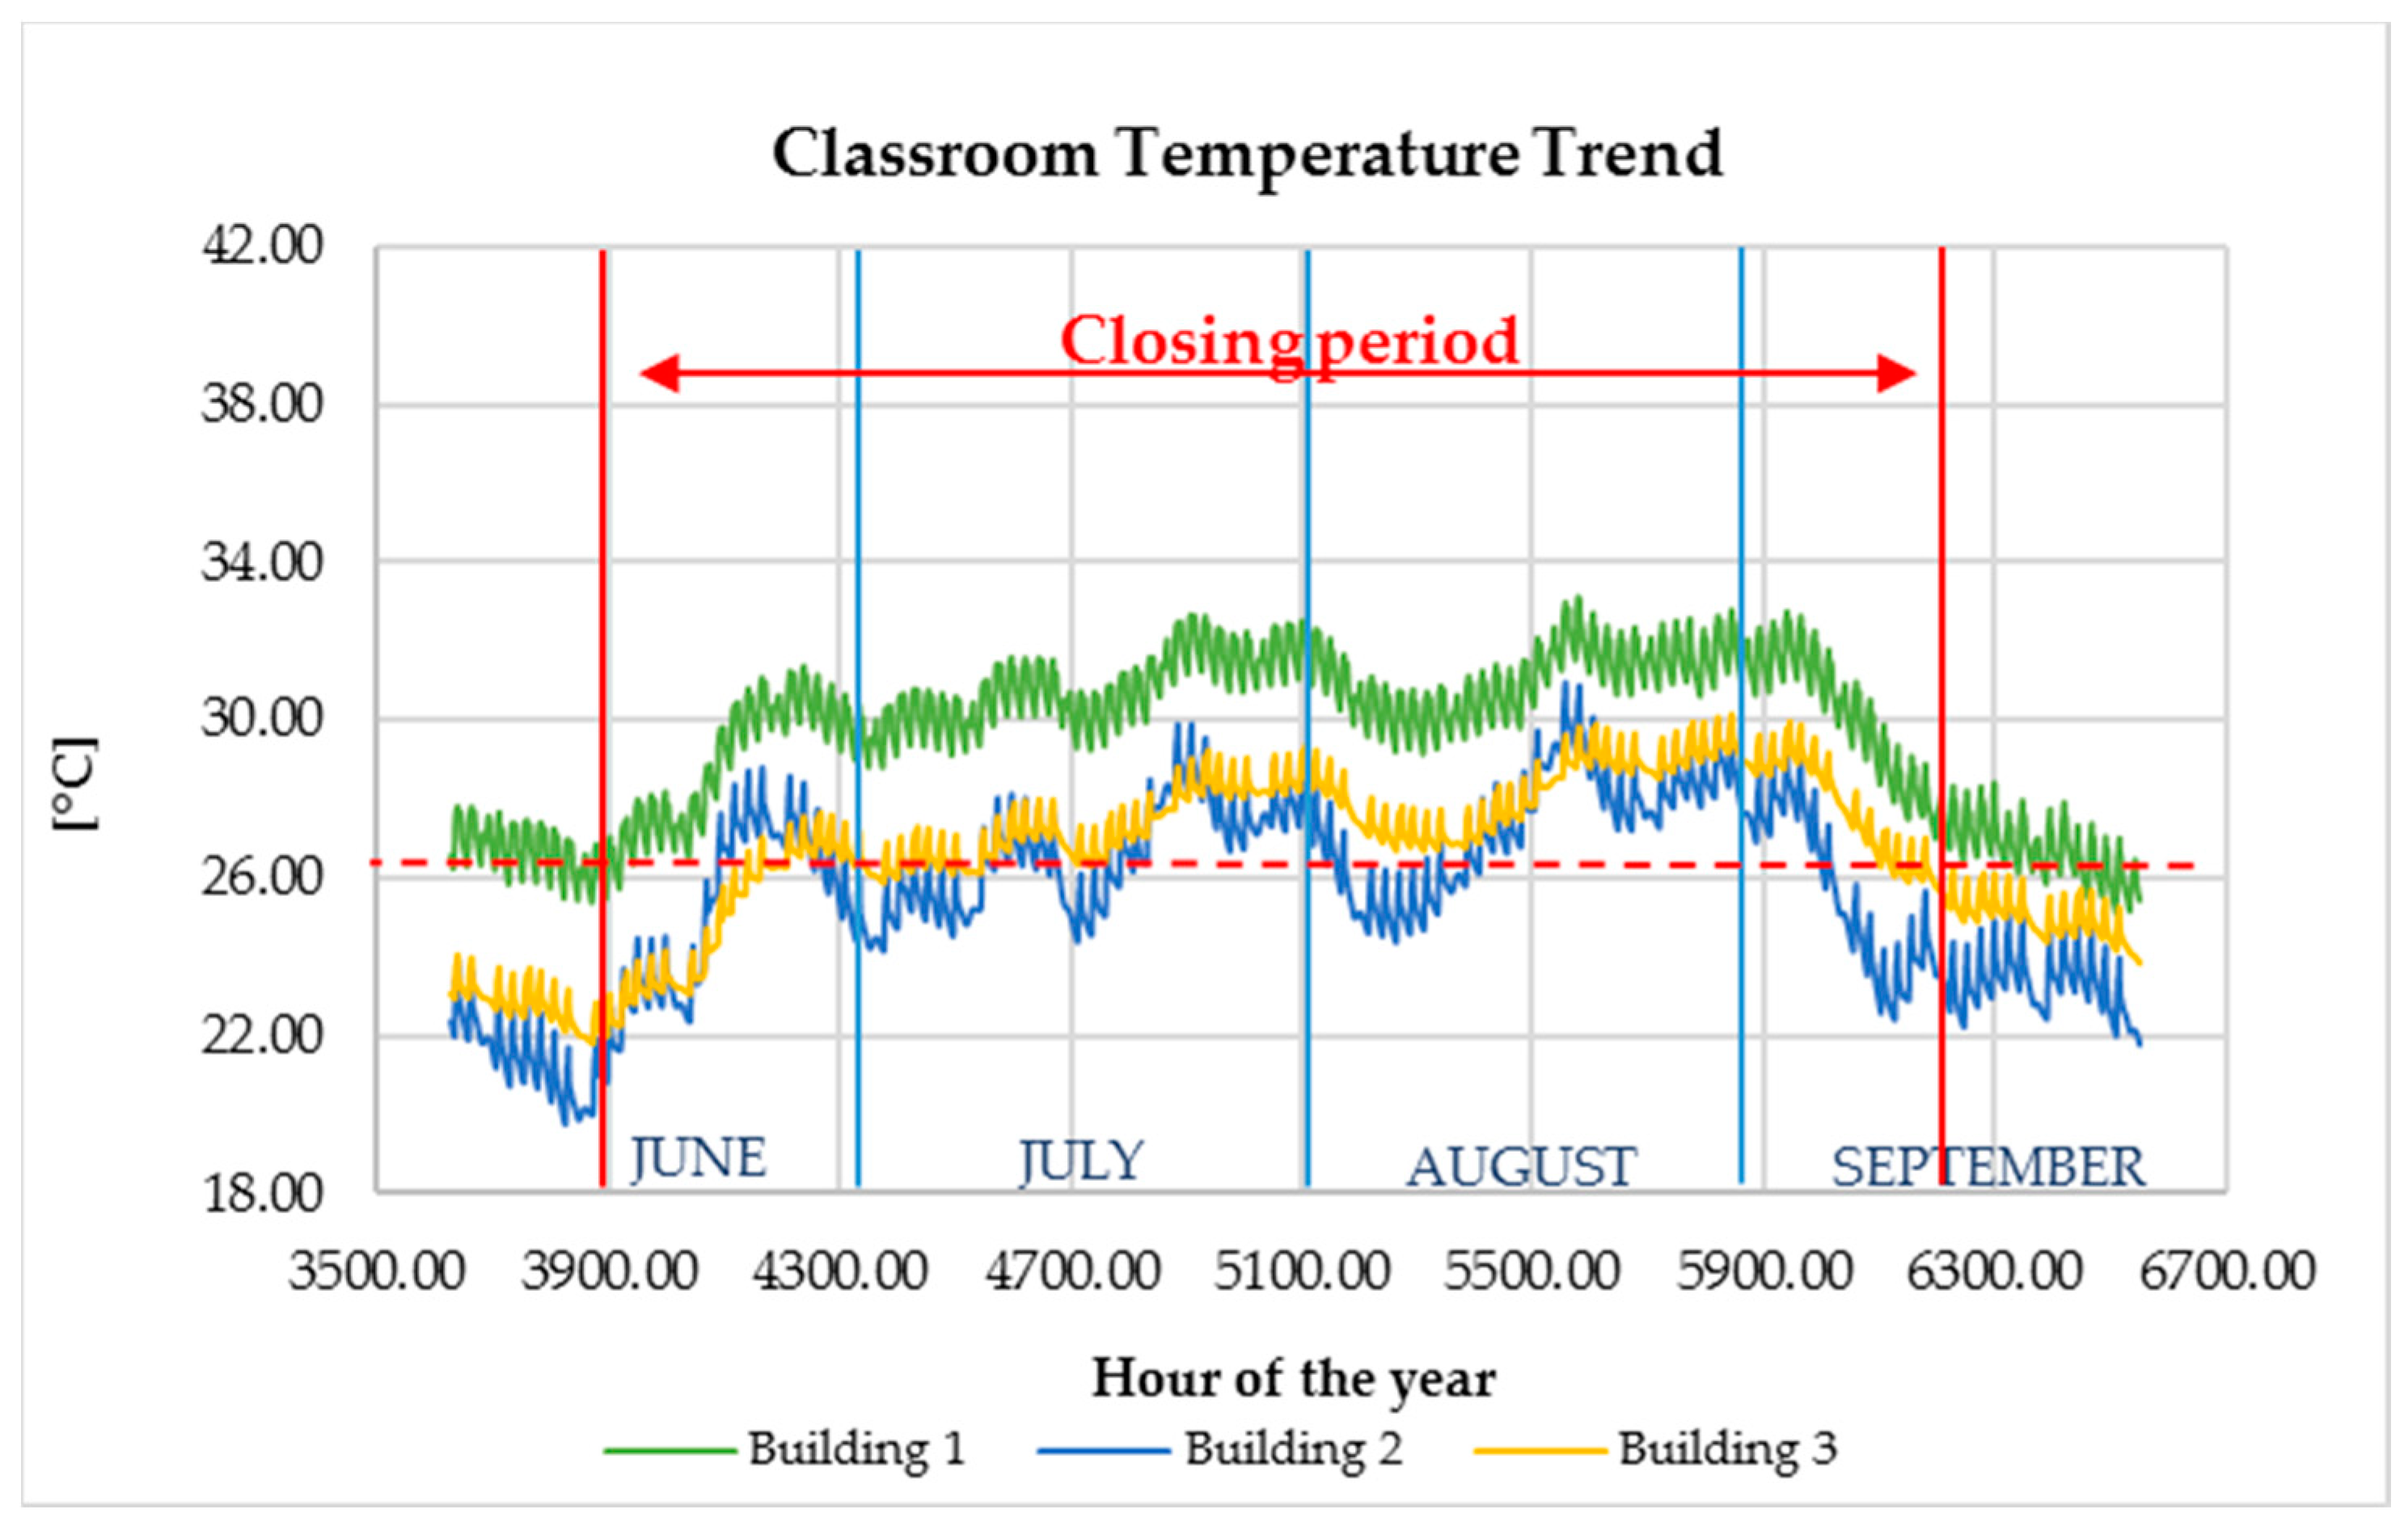
To clarify the choice to not consider the loads for the cooling period, in Figure 12 are the internal temperature trends of the summer period (from June to September) of three thermal zones, one for each school. These results refer to models with the air conditioning system turned off.
The graph also shows the closing period of the schools (from 10 June to 15 September) and the internal comfort temperature of 26 °C. For the entire opening period, the comfort conditions for the summer period are guaranteed, justifying the choice not to cool the school buildings.
In order to maximize the benefits produced by the CHP system, in terms of primary energy saving, emission reduction or investment profitability, the authors accurately designed the sizes of the several unit components.
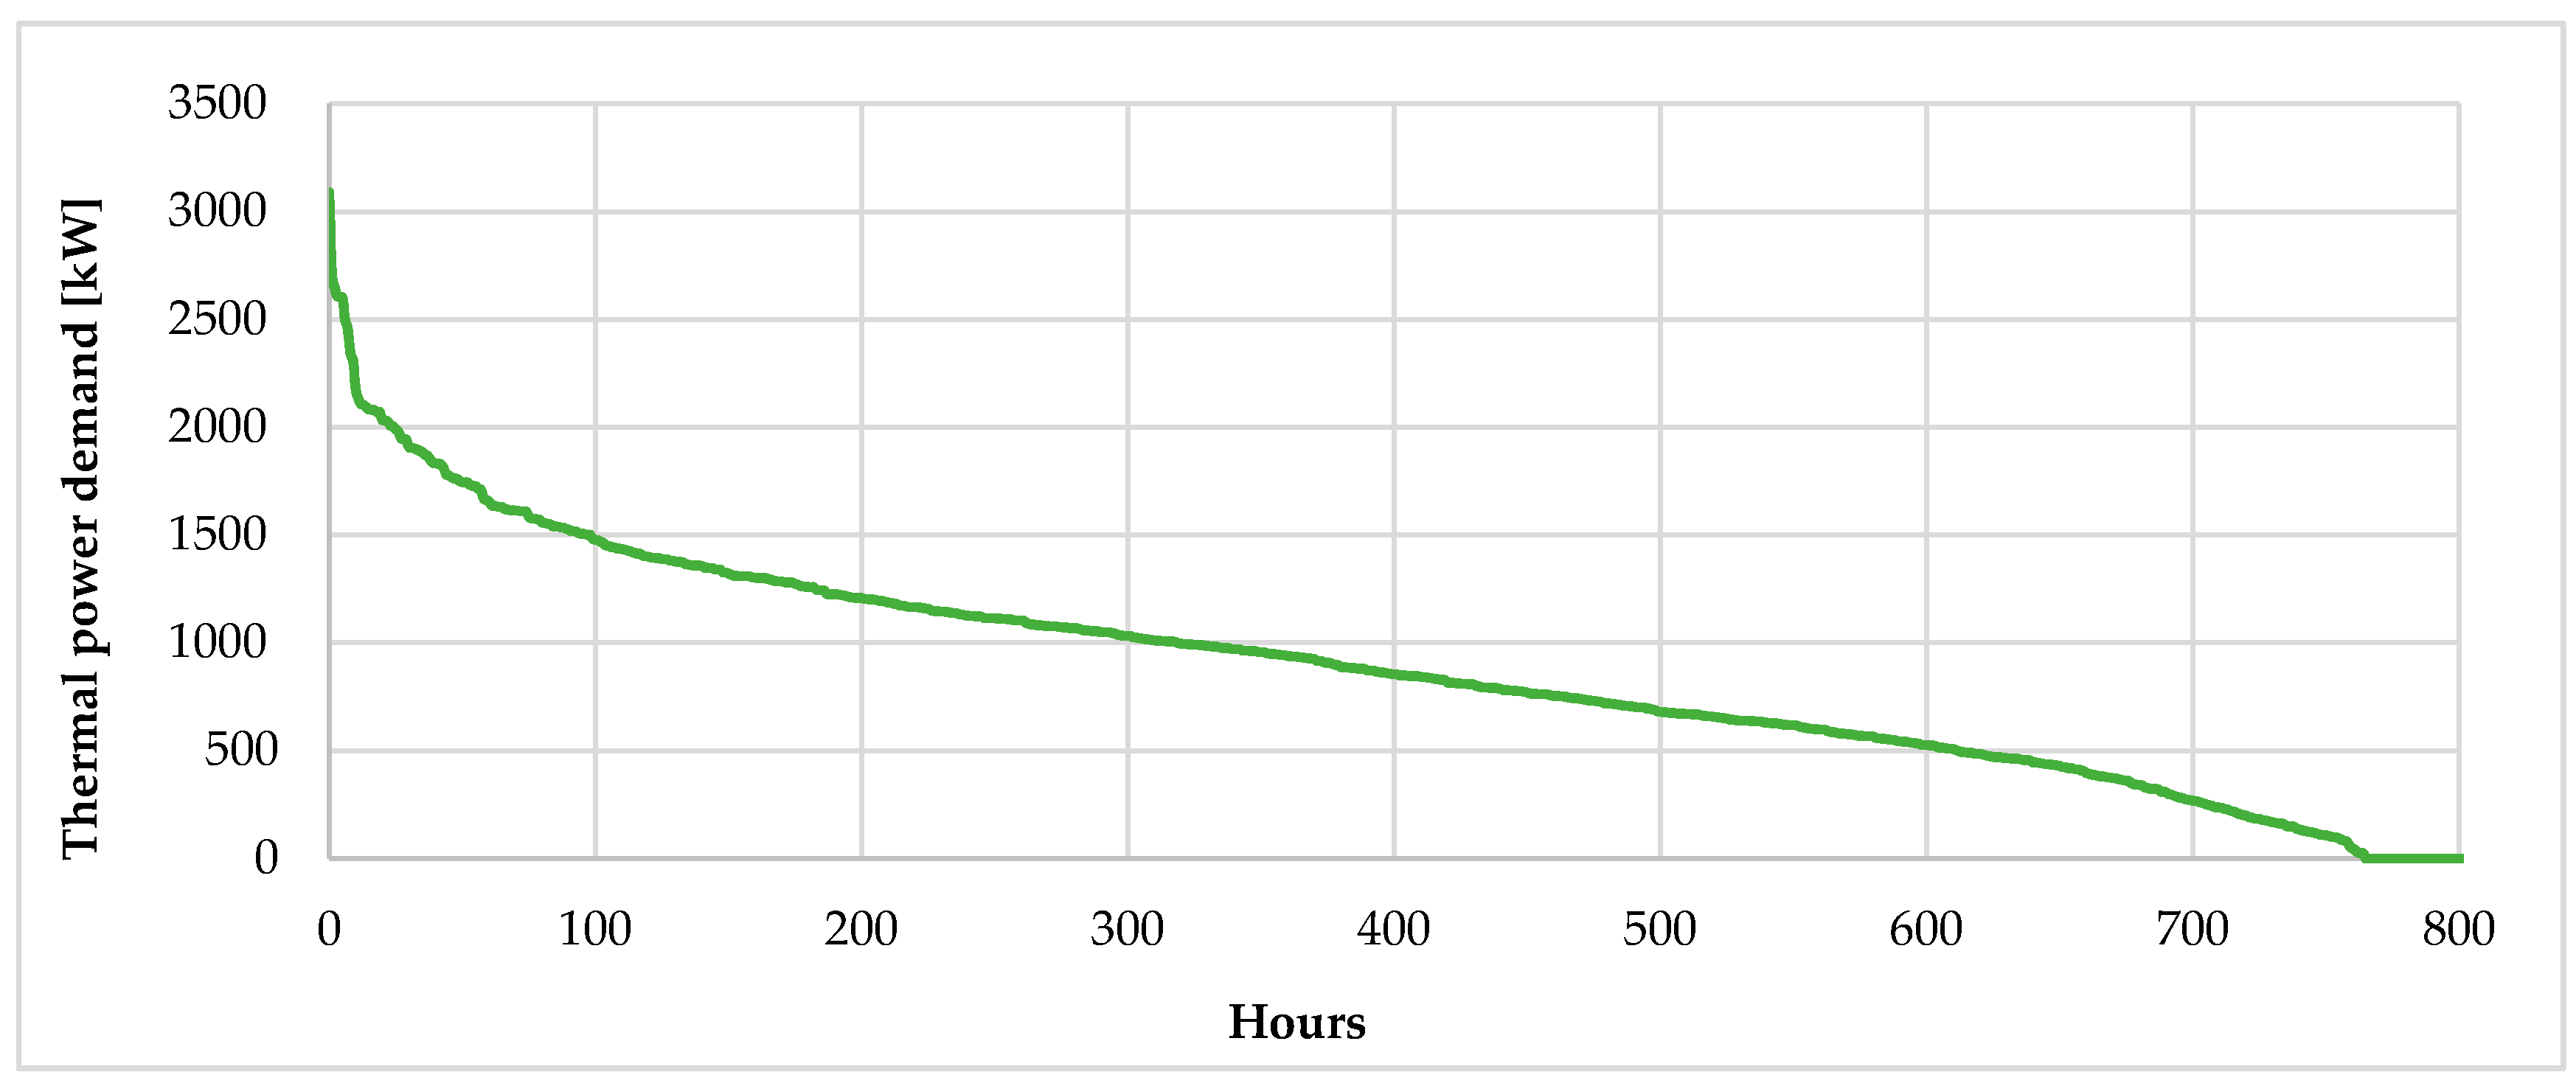
Knowing the shared hourly consumption, for each school, the annual frequency distribution of heating demand was calculated. With this information, the authors developed the district heating demand cumulative curves (Figure 13), adding the values obtained from the frequency distribution to associate each level of the thermal power demand with the number of hours in which the demand is not less than the power. In this way, it is possible to identify the minimum thermal demand levels, which allow the engine to work at full load, and so to obtain an energy saving for those hours when the demand is not lower than these levels [59].
According to the methodology of the maximum energy supplied at full load, the size of the CHP engine is identified by the heat power that maximizes the area under the cumulative frequency curve of the winter loads.
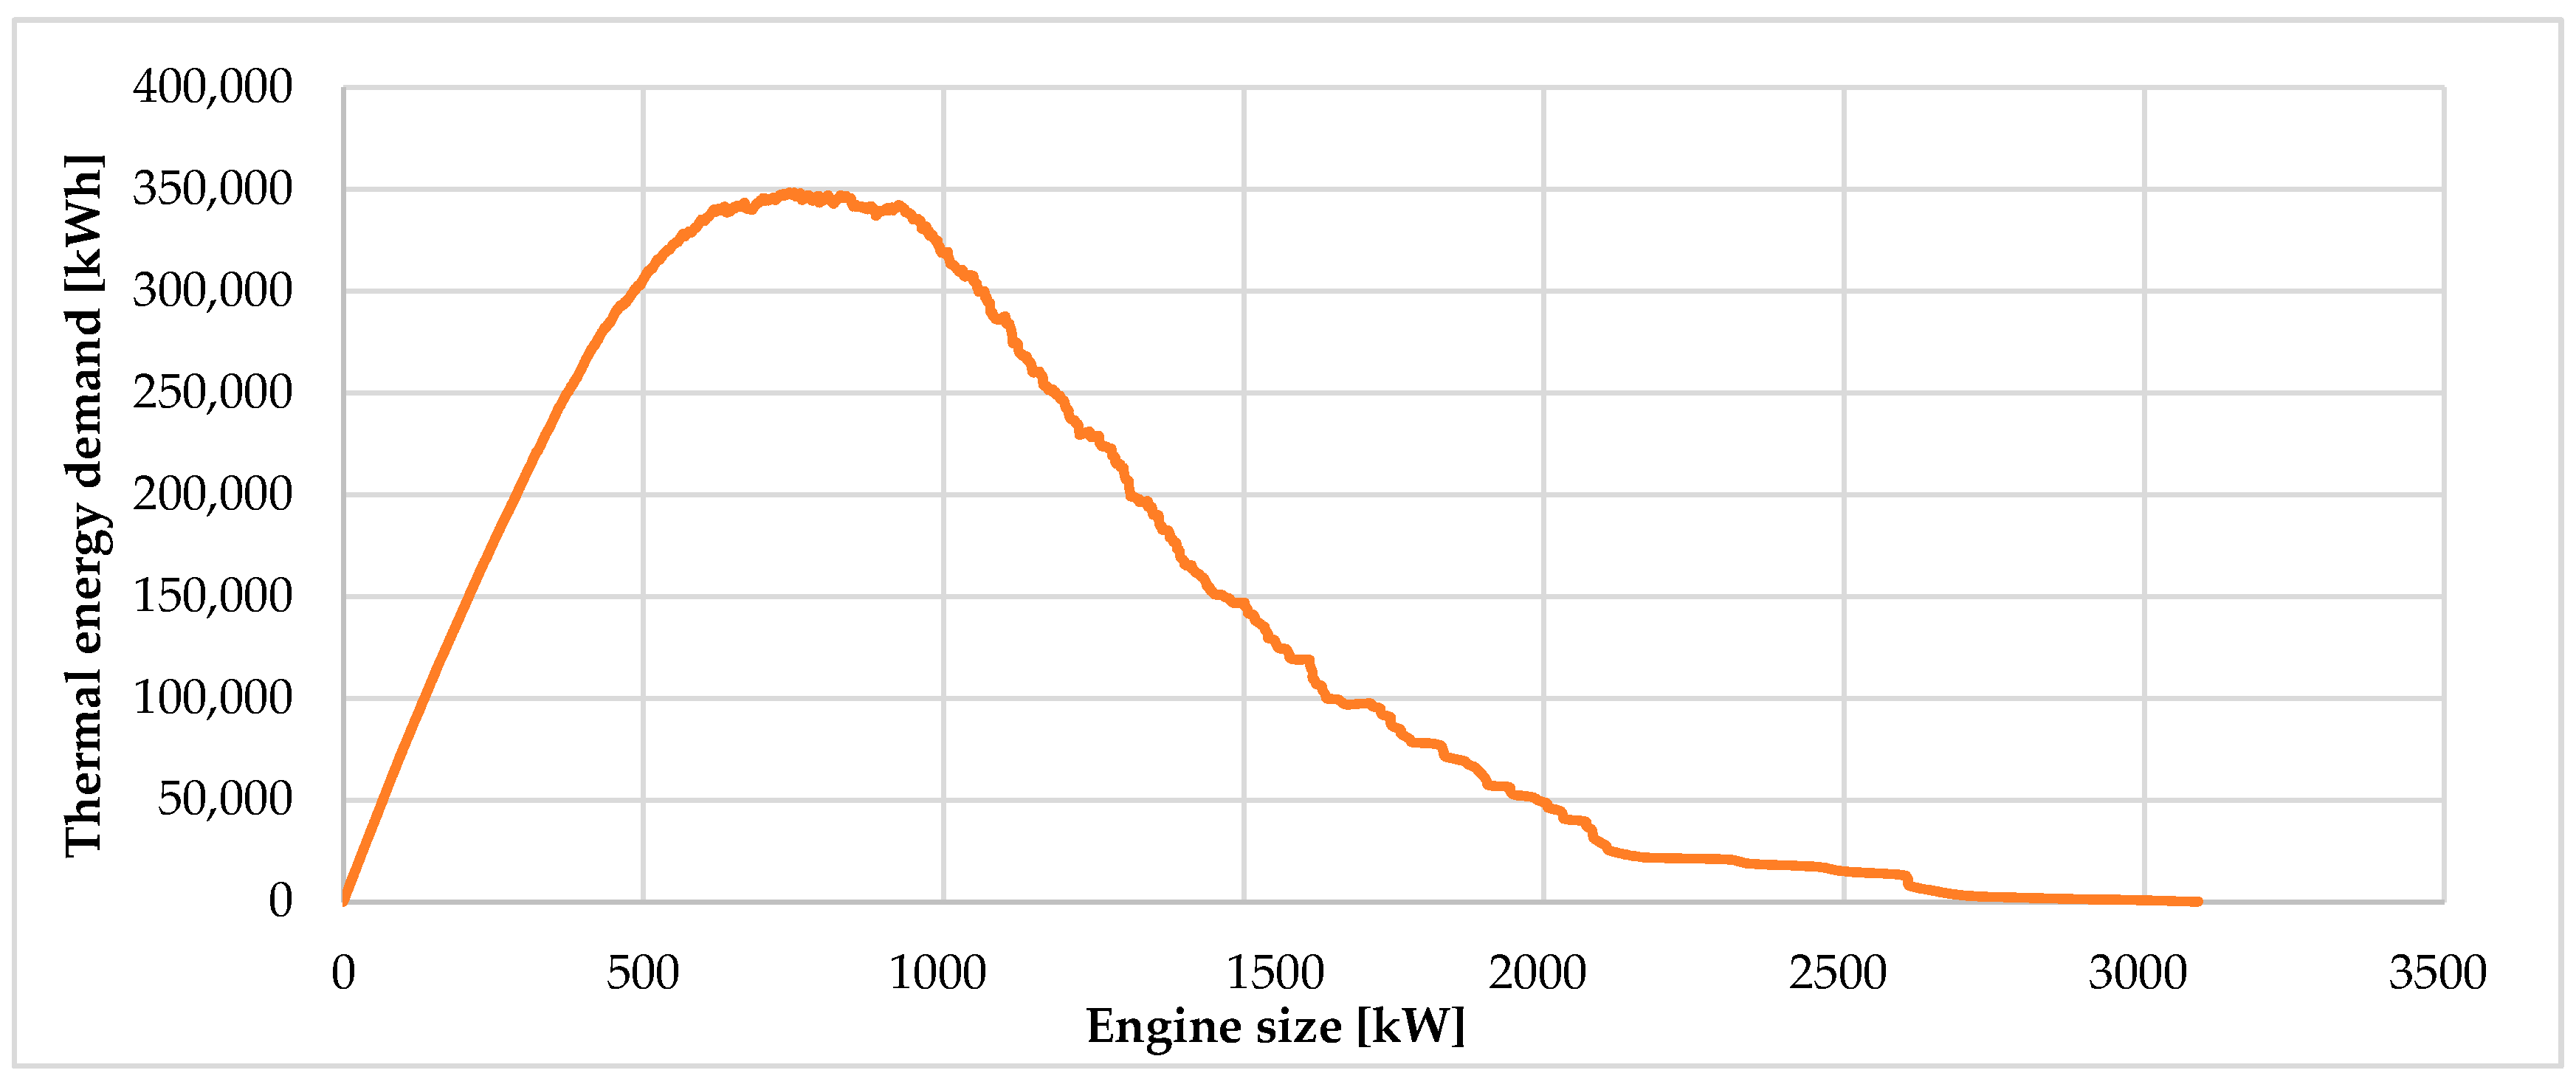
Furthermore, by plotting the power levels against the energy supplied at full load, the full load energy curve (FLEC) (Figure 14) was developed, whose maximum indicates the optimum point for power sizing. This criterion is a good compromise between the need for a sufficiently large CHP unit for a good exploitation of the cogeneration potential, and a high annual operating duration necessary to achieve a good economic feasibility.
Based on the operating hours and on the analysis of the two previous graphs (Figure 13 and Figure 14), the optimum engine size is equal to 742.93 kWt. This value maximizes the energy supplied at full load by the CHP engine.
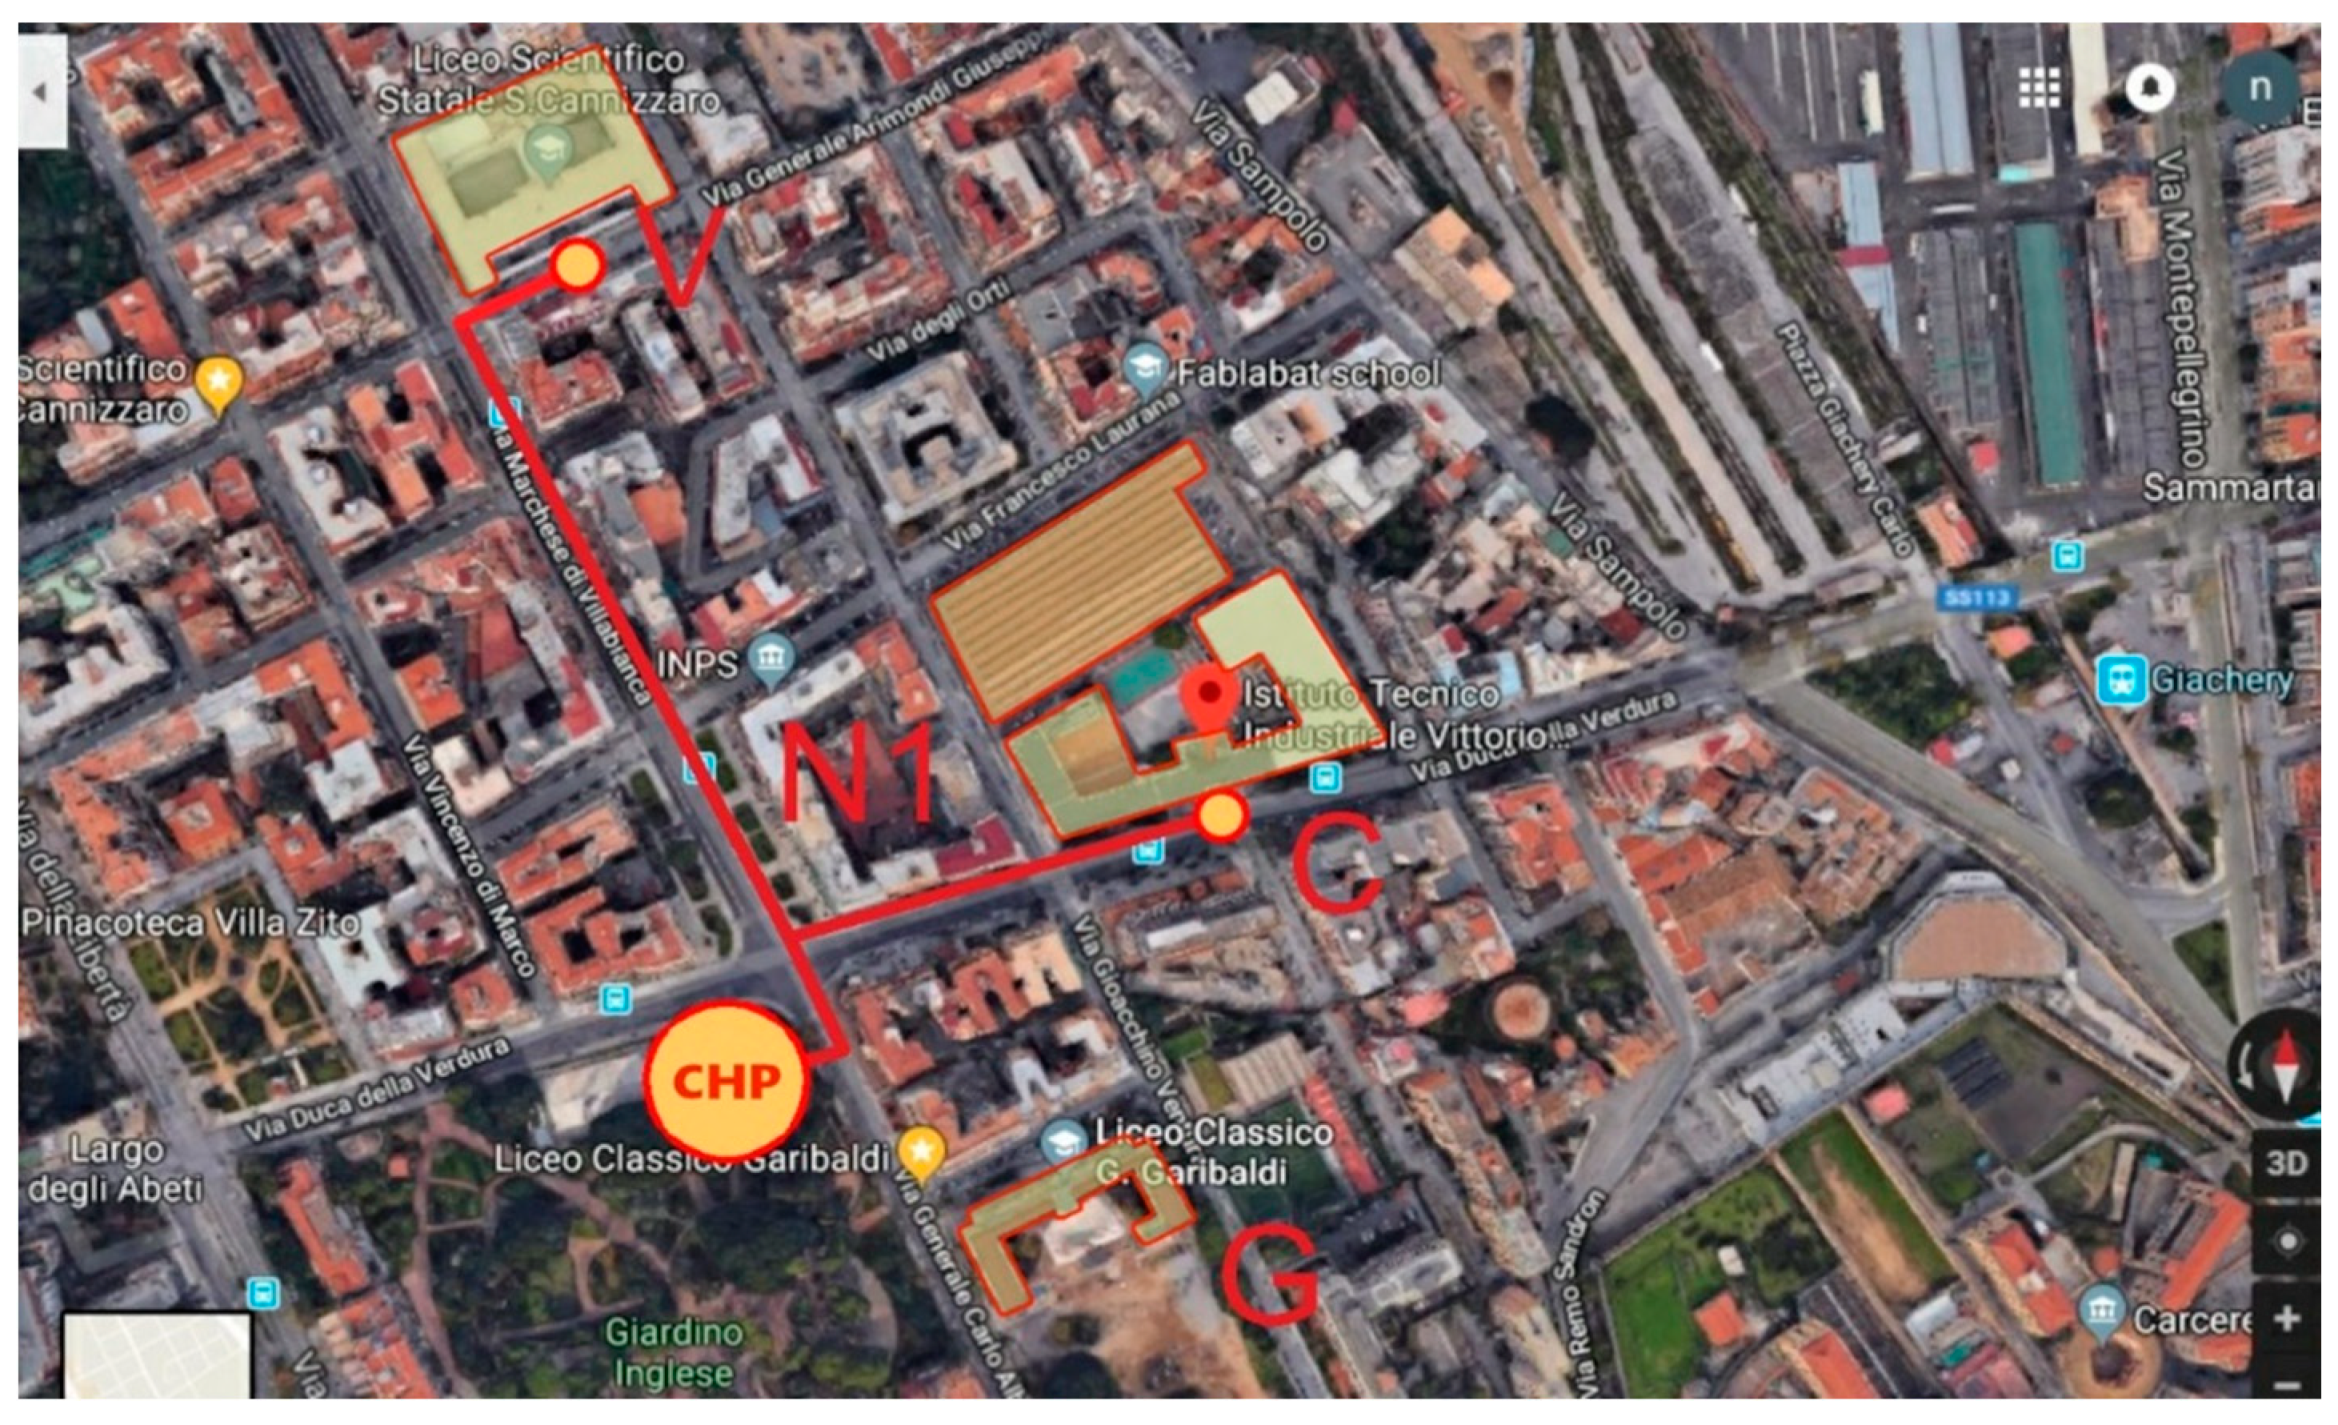
The selected CHP unit is an internal combustion engine powered by natural gas, which is fuel available in the urban area of Palermo and with low environmental impact. The layout of the transmission pipe lines of the district is illustrated in Figure 15.
Owing to the nature of the emission terminals present in the two schools (radiators), the delivery and return temperature of the heat transfer fluid from and to the CHP unit were set equal to 80 °C (T1) and equal to 65 °C (T2), respectively. The transmission pipe lines must be isolated so as not to exceed the value of P = 11 W/m [46]. Accordingly, considering the distances between the cogeneration plant and the users, equal to 561 m, a loss of thermal power was estimated to be around 6.2 kW (Ptl), corresponding to 4736.8 kWh/year. Therefore, the overall thermal energy demand that the CHP system would have to satisfy amounted to 718,201.11 kWh (school heating demand and pipeline thermal losses). Table 7 shows the characteristics of the selected engine and the availability of commercial sizes.
The amounts of thermal and electrical energy produced by the CHP unit during the 764 annual operating hours are shown in Table 8.
By comparing the obtained production data by the CHP system with the overall energy demands of the district school, it was possible to determine the amount of electricity that must be covered, and the thermal energy rate to integrate with existing boilers. In detail, the thermal requirement of Building 2 is completely satisfied, while for Building 3, an integration with the installed boiler is required. Table 9 shows the energy covered by the CHP plant.
In this way, the district is characterized by a CHP unit that is not oversized, in order to work normally at the nominal power. Furthermore, the choice of a small size for the CHP unit allows for containing investment costs, given the few operating hours.
4.2. PV Plant System
Based on the criterion used to size the CHP plant, to satisfy the total electrical needs of the three schools, it was necessary to integrate the energy production through PV plants. Considering the large availability of surfaces of the school buildings and the geographical location, the possibility of installing a PV system on each building was assessed. The sizing of PV plants was done, focusing on:
- Shading analysis;
- Optimal exposure and positioning of each photovoltaic system;
- Maximum coverage.
Building 2 and Building 3 have a flat roof, while Building 1 is characterized by a double pitch roof. In order to determine the maximum useful surface and considering the presence of the surrounding buildings, the authors carried out a shading analysis with Ecotec software [60]. In detail, the sizing was carried out considering the least favorable conditions that occur when the value of the maximum daily solar height reaches its minimum during the winter solstice.
In all cases, monocrystalline panels were chosen, each consisting of 60 cells in series and with a peak power of 285 W; in Table 10, for each building, the size of the PV area installation is shown.
In the two schools with flat roofs, to avoid self-shading, the spacing between the panel rows was calculated according to the CEI 82-25 standard [61], while to identify the best exposure for the PV system, UNI 10349: 2016 was used [62]. Different PV plant exposures were simulated, and the one that manages to maximize the production of electricity during school opening hours was chosen.
Once the available surface and the optimal orientation were determined, the maximum installable power and the electricity produced annually in the three schools were calculated. Table 11 shows the main features of the identified PV plants.
From the economic point of view, based on [63], the installation and management costs were evaluated (Table 12).
The cash flows were calculated considering only the electricity produced during the hours of operation of the schools. The economic value of this energy was considered to be equal to the purchase price of the energy from the public grid by the schools in 2017 (0.2418 EUR/kWhe); instead, the energy produced during the closing hours was valued at the sale price of the energy fed into the grid as established in Italy by the GSE [57] for the Sicily area. In Table 13 are collected the annual energy production and the economic evaluations.
5. Results and Discussion
5.1. Economic CHP and PV Analysis
To assess the economic feasibility of the school energy district, it was necessary to quantify the actual energy annual costs before and after the CHP and PV system installation.
Considering probable building efficiency actions and the increase in energy costs over the years, the considered scenario expects that the thermal energy demands and related costs would vary over the 20 years of the plant’s useful life. In detail, the following were considered:
- Increase in annual electricity costs: +0.77%;
- Decrease in annual energy consumption: −1.2% (when it is possible to implement appropriate energy efficiency actions);
- Increase in annual gas costs: +2.28%;
- Increase in annual oil costs: +5.56%.
The annual percentage changes, for natural gas and oil costs, were obtained from the average sales prices and net of taxes on the final market, recorded on the ARERA portal [58]. For natural gas, the period 2004–2016 was considered and consumption between 50,000 and 200,000 Sm3; while for oil, the period 2003–2017 was computed.
For all 20 years of the plant’s useful life, these trends were assumed to be unchanged. The electricity costs purchased from the public grid and the fuel costs were obtained from the analysis of the school invoices for the year 2017. In detail, the electricity-specific cost was equal to EUR 0.242/kWh; the natural gas cost was equal to 0.57 EUR/Sm3; the oil cost was equal to 0.96 EUR/l, while the cost of natural gas used in the CHP system, considering the tax exemption allowed for use in cogeneration devices, was considered to be equal to 0.446 EUR/Sm3. Table 14 shows the energy costs and consumption for 2017 in each school building.
The annual savings obtained by the use of the CHP system are between EUR 91,025.95 for the first year and EUR 132,027.45 for the twentieth year, for a total saving equal to EUR 2,302,552. For NPV determination, the installation costs of the CHP system were calculated considering a specific cost of 1300 EUR/kWe. The specific annual maintenance cost was considered to be equal to 0.013 EUR/kWh and, finally, the annual costs of management were considered to be equal to EUR 23,000.
The installation and management costs of the CHP plant are:
- Installation cost EUR 780,000;
- Maintenance costs EUR 6209 per year;
- Staff costs: EUR 23,000 per year.
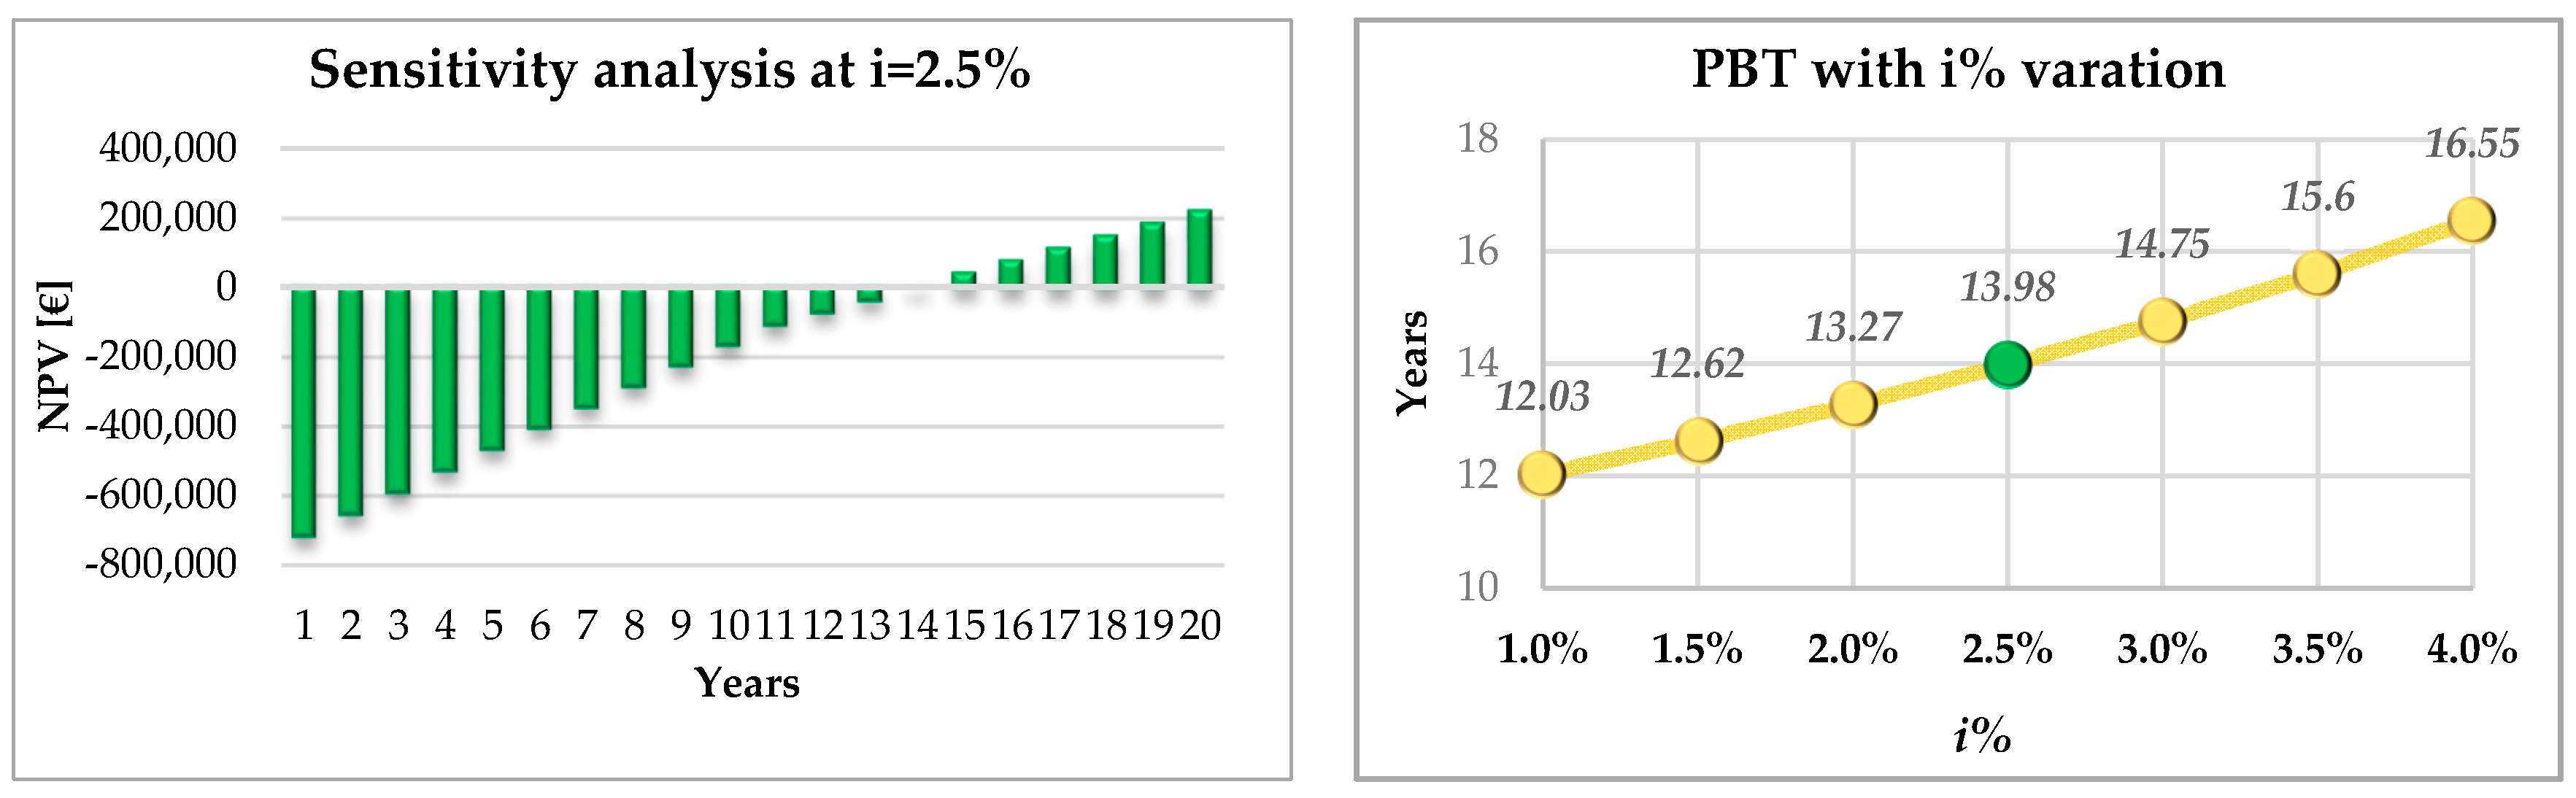
As shown in Figure 16, the pay-back time (PBT) for an interest rate “i“ of 2.50% is about 14 years, a rather high value which reduces the possibility of carrying out the intervention.
Such long return times are because the CHP plant is in operation for a limited number of hours during the year, due to the characteristics of the use of the school buildings, compared to the number of hours of optimal operation (at least 5000 h a year).
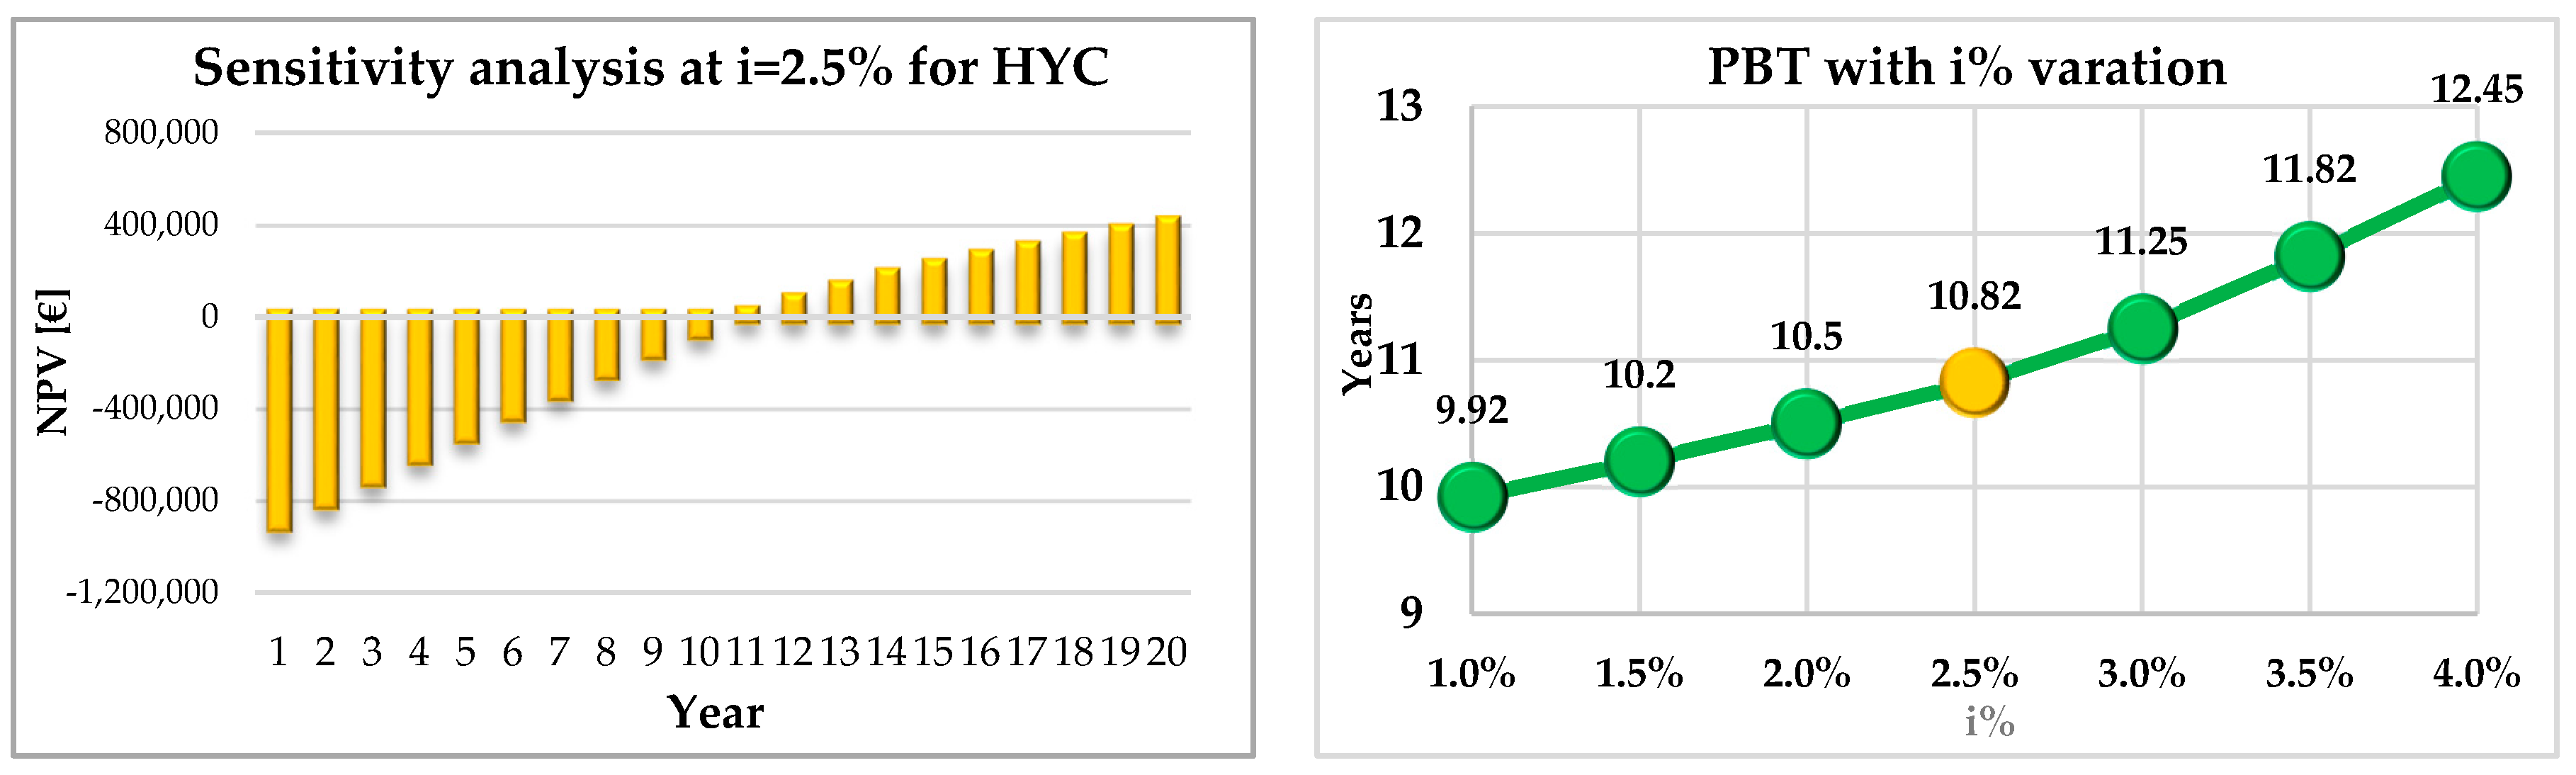
Focusing on the actual Italian incentives for the high-yield cogeneration (HYC) [64], which provides for the achievement of the white certificates, the PBT is reduced to less than 11 years.
Figure 17 shows the NPV values with an interest rate (i%) of 2.5% and PBT trends for different i%.
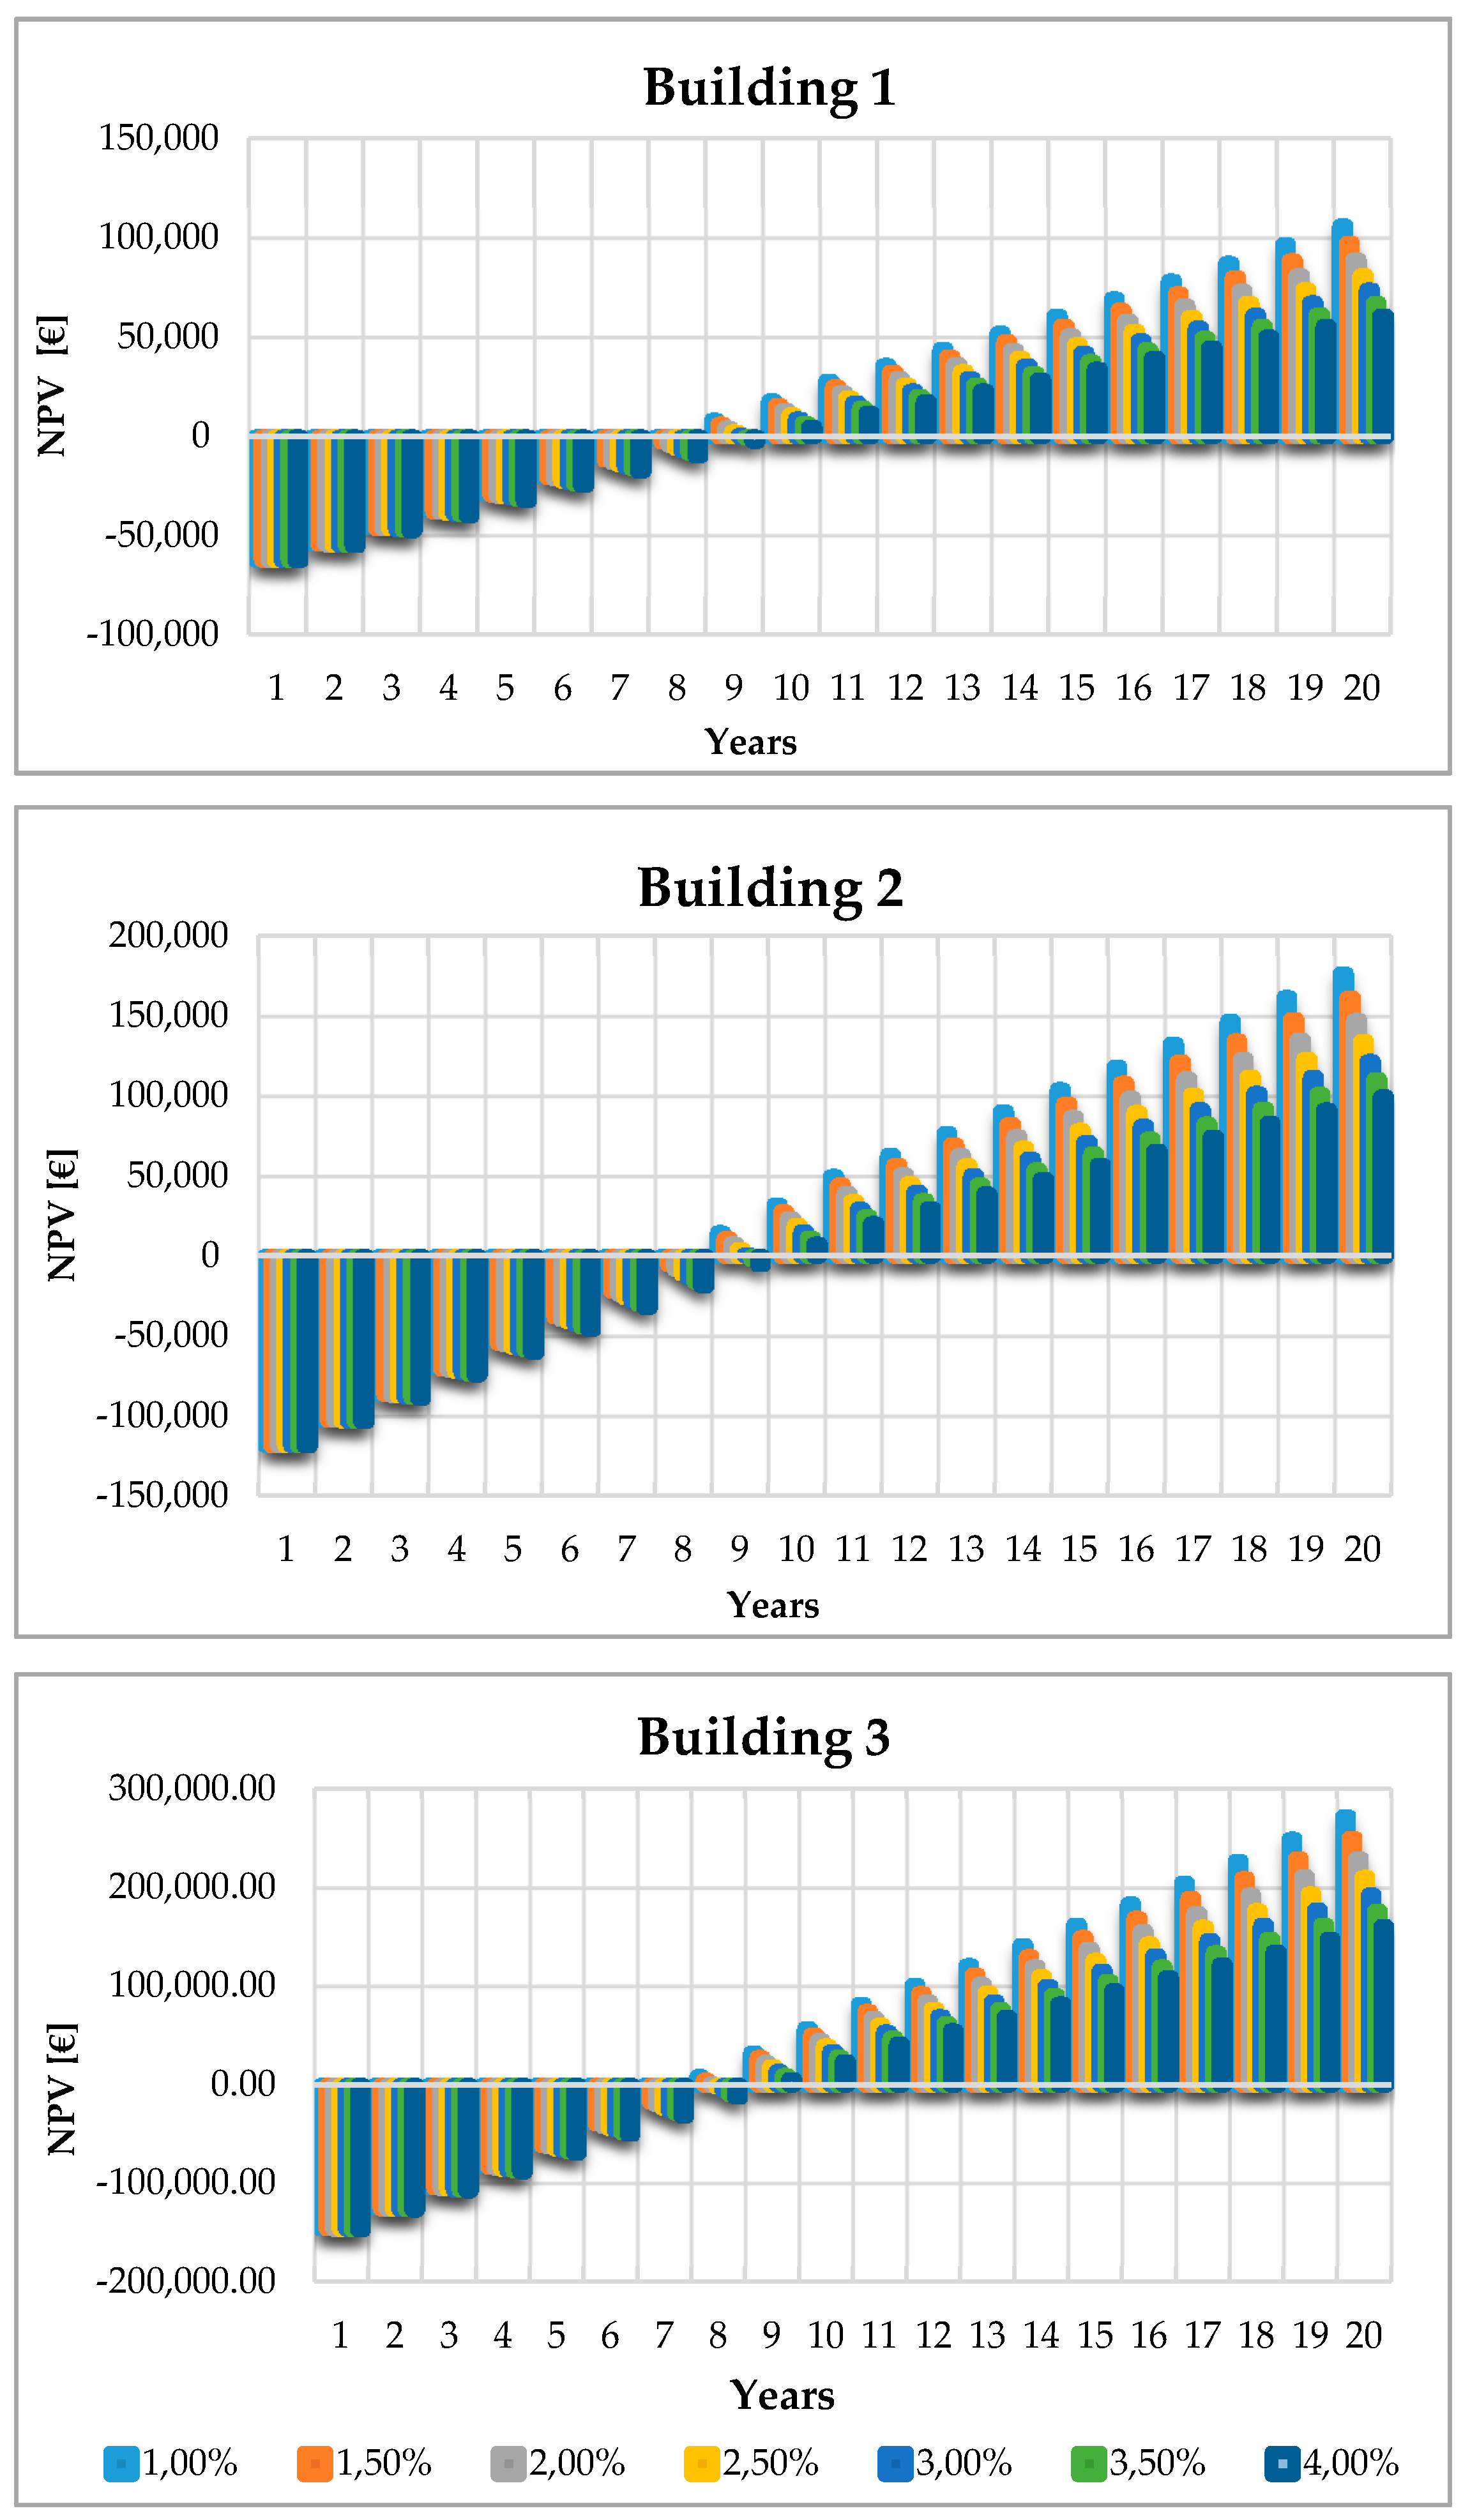
Based on the same cost assumptions and the trends over time that were previously indicated, the 20-year NPV values were positive for all the proposed PV plants. Considering an interest rate of 2.5%, they are:
- Twenty-year NPV for PV plant at Building 1: EUR 81,261.00;
- Twenty-year NPV for PV plant at Building 2: EUR 134,347.11;
- Twenty-year NPV for PV plant at Building 3: EUR 211,022.54.
Figure 18 shows the trend of the PV system NPV in each high school, for different interest rates (i%).
Each graph shows the presence of an inflection point in approximately the eleventh year, corresponding to the year in which the investment is fully amortized. The PBT and the electricity production covered by PV systems (EPV), considering an interest rate of 2.5%, are:
- Building 1: EPV = 18.2%; PBT = 8.7 years;
- Building 2: EPV = 33.4%; PBT = 8.7 years;
- Building 3: EPV = 23.5%; PBT = 8.1 years.
5.2. Environmental Analysis
In order to evaluate the influence that the proposed energy district has on the environment, we used the data provided by ISPRA [65].
In particular, the combustion of natural gas has a specific emission index of 0.0561 kg CO2/MJ and a combustion of diesel fuel equal to 0.0741 kg CO2/MJ, while the production of electricity in Italy is characterized by an index of 0.312 kg CO2eq/kWh (data from 2017) [66].
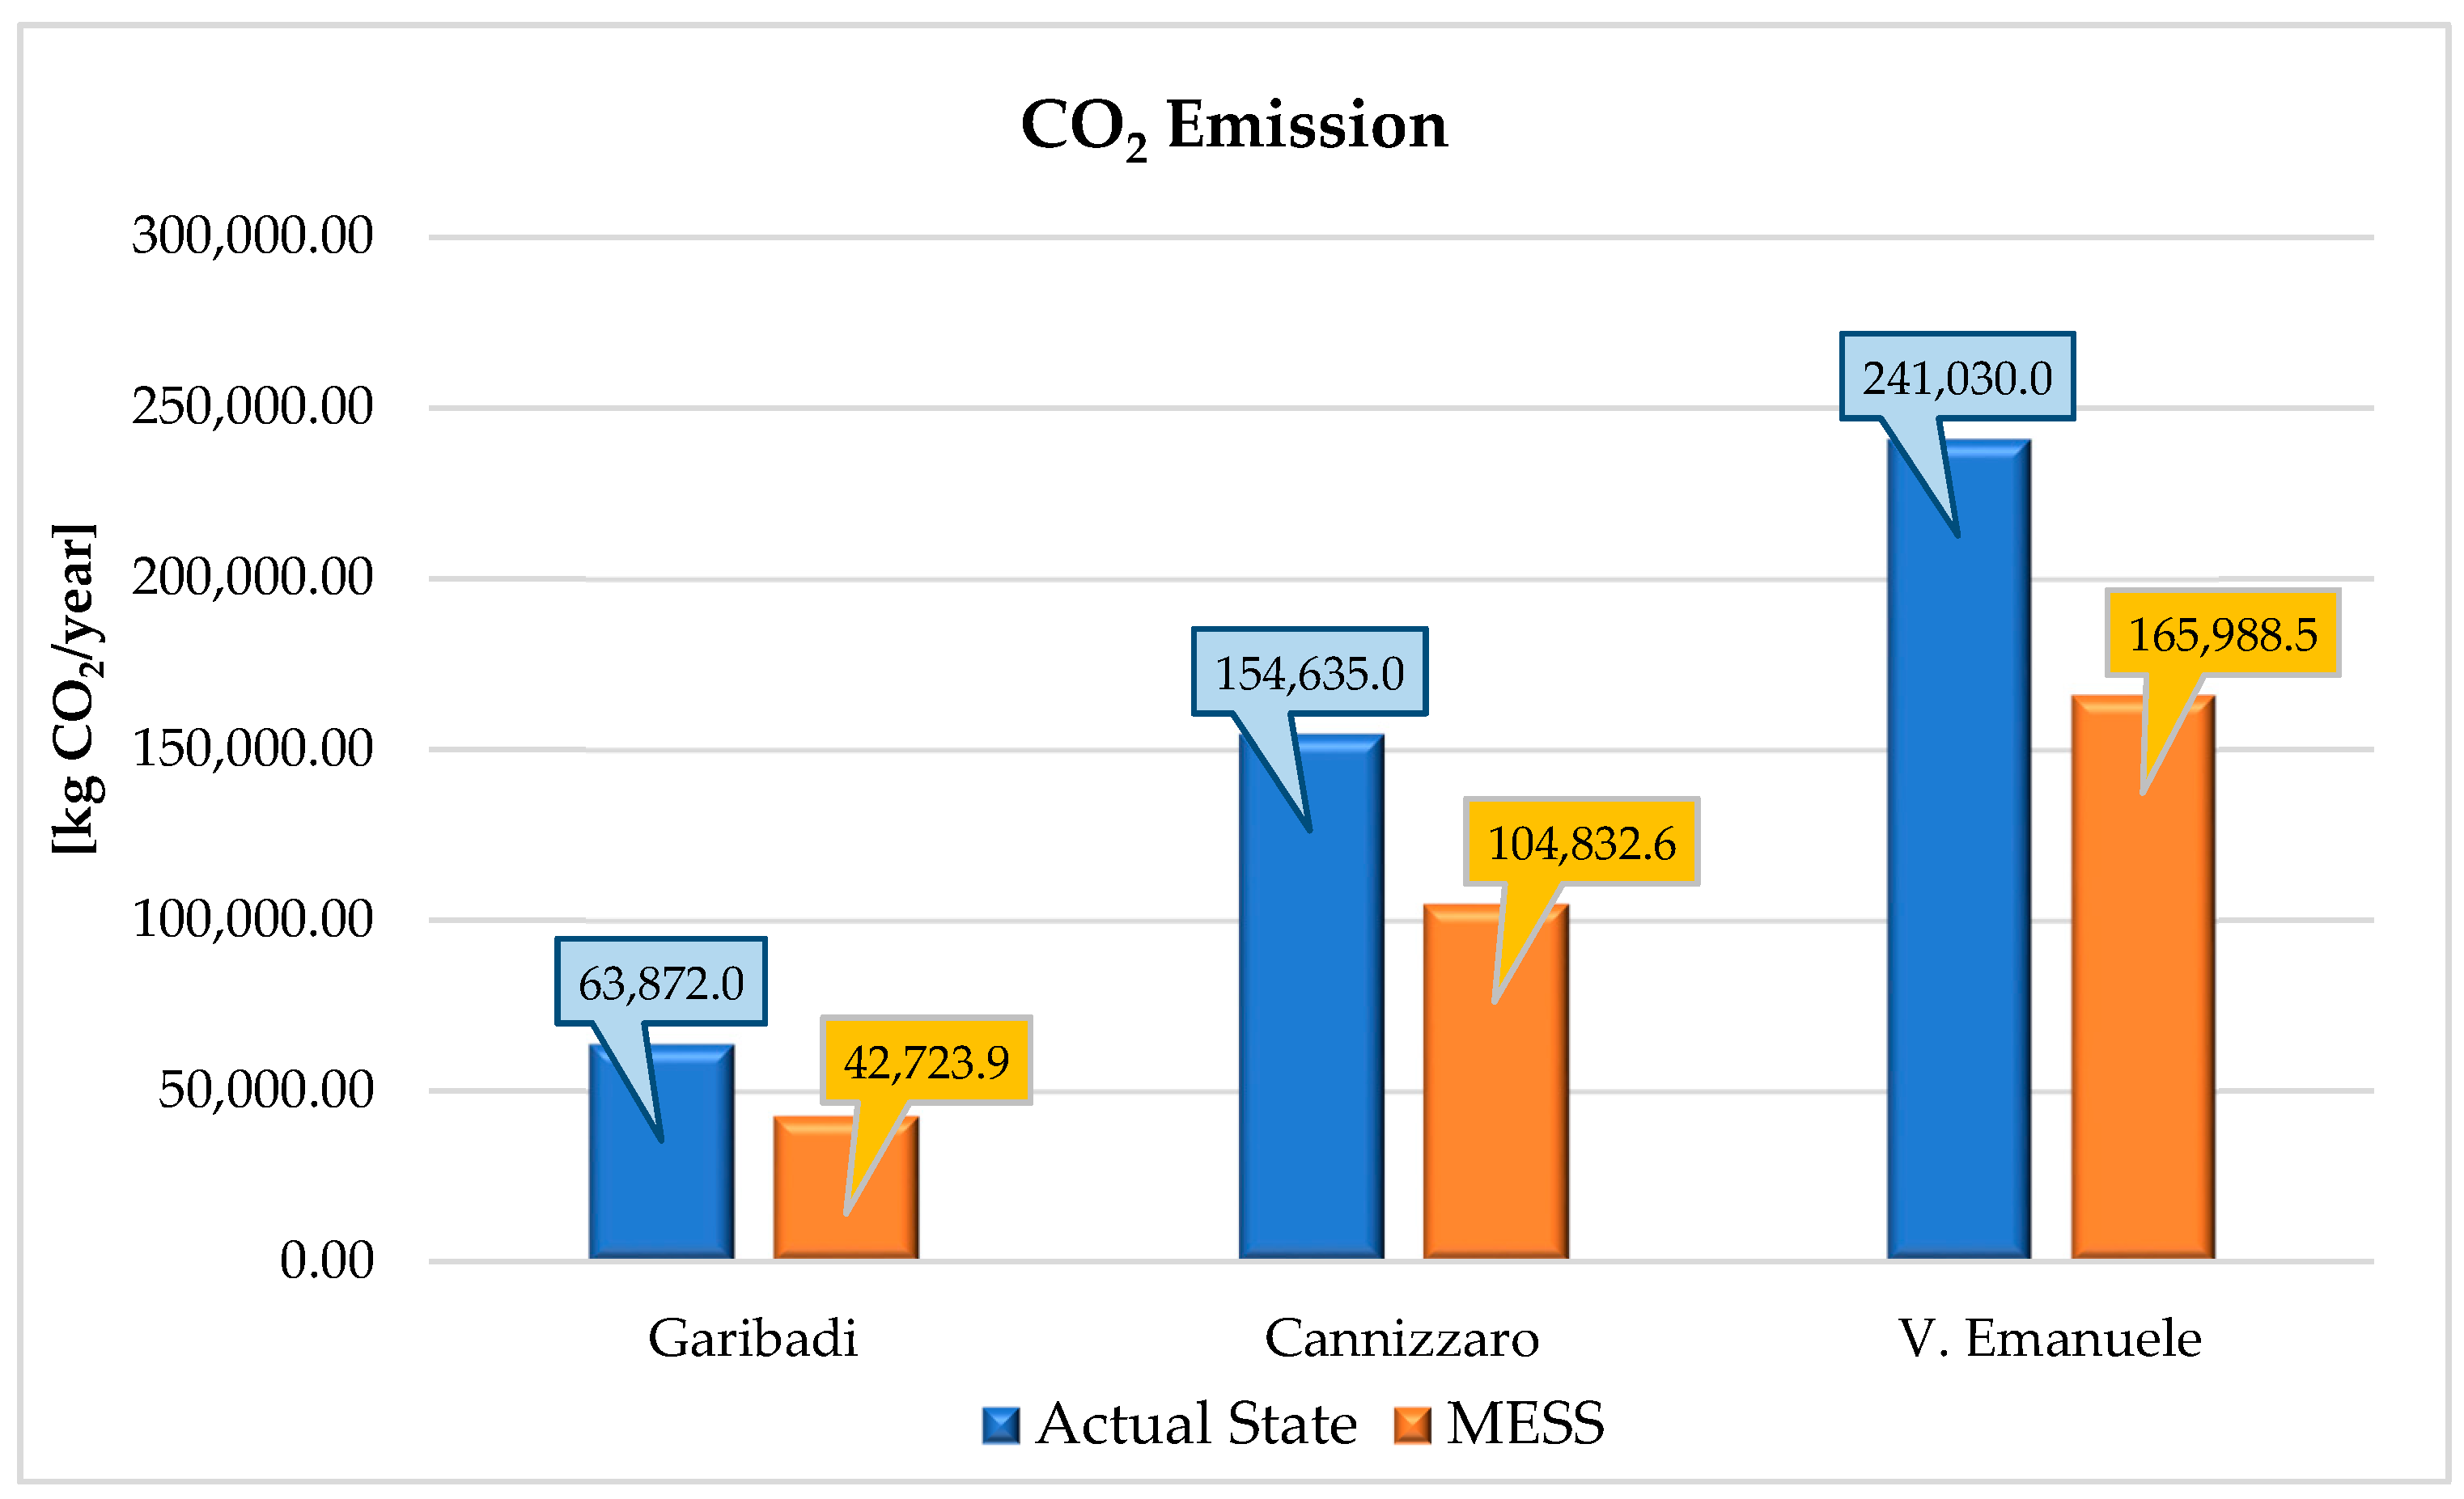
Based on the literature data and the actual situation, the energy needs of the three schools produce 459,537 kg of CO2. Figure 19 compares the CO2 emissions related to the actual scenario with the emissions released from the MESS district.
In more detail, the installation of the three PV systems reduces the value of CO2 emissions to 391,426 kg of CO2, with a percentage reduction equal to 14.82%. However, the MESS installation brings the annual emissions to a value of 313,545 kg of CO2, with a reduction of 31.77%, a percentage that highlights the significant reduction obtained by the installation of the proposed energy district.
6. Conclusions
The study proposed the development of an energy district in the city of Palermo.
In detail, the authors provide an alternative solution through the analysis of a case study consisting of a multiple energy school system in three 1950s Sicilian schools, focusing on the system’s operational strategy, on the design and sizing of components and trying to exploit the complementarity of the energy needs of the buildings instead of integrating the conventional energy storage systems.
From the analysis of the actual consumption of the schools and the results obtained from the simulations, it was shown that only two of the three buildings require the CHP unit and this system will be necessary only for the heating period. In fact, the closure of the school buildings from mid-June to mid-September shows that for the remaining days of the entire cooling period, the indoor temperatures are below the design temperature, justifying the choice not to install an absorption machine coupled to the CHP unit. Based on these considerations, the CHP system was sized considering only a heating thermal load of about 718,000 kWt.
From the electric consumption point of view, in order to minimize the consumption from the national grid, it was decided to integrate the production with photovoltaic renewable energy. The study considered the percentage of energy produced by the plants during the schools’ opening hours and during the closing hours. These quantities of energy were valued at the purchase price of electricity from the grid in the first case (self-consumption) and at the sale price to the grid in the second case.
The economic analysis showed the pay-back time of the three PV investments to be less than nine years. This assessment was carried out on the basis of the sensitivity analysis carried out on the interest rate (i%), a value that, if the plants were built in the absence financing and incentives, is absolutely realistic in the southern regions, which benefit from high solar radiation. For the year 2017, the year in which the installation was hypothesized, the photovoltaic systems would guarantee 18.18% of the electricity needs for Building 1, 33.48% for Building 2 and 23.47% for Building 3. As for the cogeneration designed to exclusively serve the thermal demand of two schools, it is evident that during the twenty years of useful life, it always provides the necessary thermal needs, while there is an inversion of the trend as regards the electricity produced, which is in deficit for the first eight years of operation of the unit, but in surplus for the remaining years. It was also considered that the combined heat and power plant, when it produces more than its needs, it will sell electricity to the national grid.
The economic savings obtained at the end of the useful life of the cogeneration system amount to approximately EUR 2800 compared to the costs incurred to obtain the same energy requirement from separate production. The overall economic saving obtained thanks to the three photovoltaic systems is instead equal to EUR 426,630.65.
The integrated cogeneration unit with the three photovoltaic systems also allows for to obtaining important results in terms of preventing CO2 from being released into the atmosphere compared to the production of thermal and electrical energy from traditional systems. The saving amounts to about 5750 tons of CO2 prevented from entering the atmosphere.
Finally, an analysis of the results according to the investment made for the cogeneration unit would fall within a time span from 9.9 to 12.5 years, depending on the variation in the interest rate applied, between 1% and 4%. These long return times are linked to the fact that the system would be active only during the opening hours of the school buildings and therefore for a reduced number of operating hours compared to the characteristic times that allow for reaching the maximum cost–benefit ratio. While on the one hand, cogeneration allows for obtaining valid results from an environmental, energy and economic point of view, as it reduces atmospheric pollution, dependence on fossil sources and allows for the recovery of waste thermal energy, on the other hand, the economic feasibility does not always include these aspects, since the purchase and management costs are still quite high and therefore presuppose an intense use of the system.
In conclusion, the alternative procedure to sizing the combined heat and power function of the heating thermal loads only is justified by the particular case study and the urban context. This approach can be used in the case of seasonal or non-conventional use, customizing the energy district to the needs of the user, avoiding oversizing and therefore the consequent economic losses that could occur. Obviously, an interesting possibility to increase the operating hours of the combined heat and power could be that of creating a district heating network that includes the residential buildings close to the cogeneration plant; these buildings have a thermal energy requirement even in the afternoon and evening hours. In this way, during the closing hours of the school, the combined heat and power could be in operation by feeding the electricity produced into the public grid and providing heating services to nearby buildings; increasing annual operating hours would significantly increase the net present value and at the same time reduce the pay-back time. This idea will be explored in future work.
Author Contributions
Conceptualization, D.P. and G.C.; methodology, A.D., G.C. and D.P.; software, A.D.; validation, D.P., G.C., A.D. and A.M.; formal analysis, A.D., G.C. and D.P.; investigation, A.D. and D.P.; resources, A.D., G.C. and D.P.; data curation, A.D. and G.C.; writing—original draft preparation, A.D. and D.P.; writing—review and editing, G.C., A.D. and A.M.; visualization, A.M.; supervision, G.C. and A.M. All authors have read and agreed to the published version of the manuscript.
Funding
This research received no external funding.
Acknowledgments
Thanks to Energia Palermo SpA and the Metropolitan City of Palermo for the great support given in the data collection phase and for ensuring the site inspections of the buildings. We also thank Eng. Valentina Nemesio and Eng. Elisa Marino who during their thesis period collaborated in the research.
Conflicts of Interest
The authors declare no conflict of interest.
Nomenclature
| Acronym | |
| CHP | Combined Heat and Power |
| DES | District Energy System |
| DHW | Domestic Hot Water |
| DRI | Distributed, Renewable and Interactive Energy System |
| FLEC | Full Load Energy Curve |
| HYC | High-Yield Cogeneration |
| HVAC | Heating, Ventilation and Air Conditioning System |
| MES | Multiple Energy System |
| MESS | Multiple Energy School System |
| NPV | Net Present Value |
| nZEB | Net Zero Energy Building |
| PBT | Pay-Back Time |
| PV | Photovoltaic |
| SEN | National Energy Strategy |
| VRF | Variable Refrigerant Flow (direct expansion multi-split air conditioning system) |
| Variables | |
| EPV | Electricity Production Covered by Photovoltaic [%] |
| HDD | Heating Degree Days (K day) |
| R.H. | Relative Humidity (%) |
| T | Temperature (°C) |
References
- Ferrari, S.; Zagarella, F.; Caputo, P.; D’Amico, A. Results of a literature review on methods for estimating buildings energy demand at district level. Energy 2019, 175, 1130–1137. [Google Scholar] [CrossRef]
- Ciulla, G.; Lo Brano, V.; D’Amico, A. Modelling relationship among energy demand, climate and office building features: A cluster analysis at European level. Appl. Energy 2016, 183, 1021–1034. [Google Scholar] [CrossRef]
- Ciulla, G.; D’Amico, A.; Lo Brano, V.; Traverso, M. Application of optimized artificial intelligence algorithm to evaluate the heating energy demand of non-residential buildings at European level. Energy 2019, 176, 380–391. [Google Scholar] [CrossRef]
- Ciulla, G.; Lo Brano, V.; D’Amico, A. Numerical Assessment of Heating Energy Demand for Office Buildings in Italy. Energy Procedia 2016, 101, 224–231. [Google Scholar] [CrossRef]
- Keirstead, J.; Jennings, M.; Sivakumar, A. A review of urban energy system models: Approaches, challenges and opportunities. Renew. Sustain. Energy Rev. 2012, 16, 3847–3866. [Google Scholar] [CrossRef] [Green Version]
- Mancarella, P. MES (multi-energy systems): An overview of concepts and evaluation models. Energy 2014, 65, 1–17. [Google Scholar] [CrossRef]
- Connolly, D.; Lund, H.; Mathiesen, B.V.; Werner, S.; Möller, B.; Persson, U.; Boermans, T.; Trier, D.; Østergaard, P.A.; Nielsen, S. Heat roadmap Europe: Combining district heating with heat savings to decarbonise the EU energy system. Energy Policy 2014. [Google Scholar] [CrossRef]
- Steiner, A.; Yumkella, K.K.; Clos, J.; Begin, G.V. District Energy in Cities—Unlocking the Potential of Energy Efficiency and Renewable Energy; United Nations Environment Programme (UNEP): Nairobi, Kenya, 2015. [Google Scholar]
- Sayegh, M.A.; Danielewicz, J.; Nannou, T.; Miniewicz, M.; Jadwiszczak, P.; Piekarska, K.; Jouhara, H. Trends of European research and development in district heating technologies. Renew. Sustain. Energy Rev. 2017, 68, 1183–1192. [Google Scholar] [CrossRef] [Green Version]
- Lake, A.; Rezaie, B.; Beyerlein, S. Review of district heating and cooling systems for a sustainable future. Renew. Sustain. Energy Rev. 2017, 67, 417–425. [Google Scholar] [CrossRef]
- Rezaie, B.; Rosen, M.A. District heating and cooling: Review of technology and potential enhancements. Appl. Energy 2012, 93, 2–10. [Google Scholar] [CrossRef]
- Johansson, P.-O. Buildings and District Heating-Contributions to Development and Assessments of Efficient Technology; Lund University: Lund, Sweden, 2011. [Google Scholar]
- Thornton, A.; Monroy, C.R. Distributed power generation in the United States. Renew. Sustain. Energy Rev. 2011, 15, 4809–4817. [Google Scholar] [CrossRef] [Green Version]
- Bloess, A. Modeling of combined heat and power generation in the context of increasing renewable energy penetration. Appl. Energy 2020, 267, 114727. [Google Scholar] [CrossRef]
- Revesz, A.; Jones, P.; Dunham, C.; Davies, G.; Marques, C.; Matabuena, R.; Scott, J.; Maidment, G. Developing novel 5th generation district energy networks. Energy 2020, 201, 117389. [Google Scholar] [CrossRef]
- Mirzaei Alavijeh, N.; Steen, D.; Norwood, Z.; Anh Tuan, L.; Agathokleous, C. Cost-Effectiveness of Carbon Emission Abatement Strategies for a Local Multi-Energy System—A Case Study of Chalmers University of Technology Campus. Energies 2020, 13, 1626. [Google Scholar] [CrossRef] [Green Version]
- Lizana, J.; Ortiz, C.; Soltero, V.M.; Chacartegui, R. District heating systems based on low-carbon energy technologies in Mediterranean areas. Energy 2017, 120, 397–416. [Google Scholar] [CrossRef]
- Sibilla, M.; Kurul, E. Assessing a simplified procedure to reconcile distributed renewable and interactive energy systems and urban patterns. The case study of school buildings in Rome. J. Urban Des. 2019, 25, 328–349. [Google Scholar] [CrossRef] [Green Version]
- Cortés, P.; Auladell-León, P.; Muñuzuri, J.; Onieva, L. Near-optimal operation of the distributed energy resources in a smart microgrid district. J. Clean. Prod. 2020, 252, 119772. [Google Scholar] [CrossRef]
- Rosato, A.; Ciervo, A.; Ciampi, G.; Sibilio, S. Effects of solar field design on the energy, environmental and economic performance of a solar district heating network serving Italian residential and school buildings. Renew. Energy 2019, 143, 596–610. [Google Scholar] [CrossRef]
- Klein, S.A. TRNSYS-A Transient System Simulation Tool, Ver 14.2. In Solar Energy Laboratory; University of Wisconsin: Madison, WI, USA, 1996. [Google Scholar]
- Norme per il Contenimento del Consumo Energetico per Usi Termici Negli Edifici; Legge 30 marzo 1976, n. 373; Gazzetta Ufficiale: Rome, Italy, 1976; (Abrogate in 1991).
- Regolamento di Esecuzione Alla Legge 30 Aprile 1976, n. 373, Relativa al Consumo Energetico per Usi Termici Negli Edifici; Decreto del Presidente Della Repubblica 28 Giugno 1977, n. 1052; Normattiva: Rome, Italy, 1977.
- Gómez Melgar, S.; Martínez Bohórquez, M.Á.; Andújar Márquez, J.M. uhuMEBr: Energy Refurbishment of Existing Buildings in Subtropical Climates to Become Minimum Energy Buildings. Energies 2020, 13, 1204. [Google Scholar] [CrossRef] [Green Version]
- Melgar, S.; Bohórquez, M.; Márquez, J. uhuMEB: Design, Construction, and Management Methodology of Minimum Energy Buildings in Subtropical Climates. Energies 2018, 11, 2745. [Google Scholar] [CrossRef] [Green Version]
- Mignard, D.; Harrison, G.P.; Pritchard, C.L. Contribution of wind power and CHP to exports from Western Denmark during 2000–2004. Renew. Energy 2007, 32, 2516–2528. [Google Scholar] [CrossRef] [Green Version]
- Haeseldonckx, D.; Peeters, L.; Helsen, L.; D’haeseleer, W. The impact of thermal storage on the operational behaviour of residential CHP facilities and the overall CO2 emissions. Renew. Sustain. Energy Rev. 2007, 11, 1227–1243. [Google Scholar] [CrossRef]
- Pagliarini, G.; Rainieri, S. Modeling of a thermal energy storage system coupled with combined heat and power generation for the heating requirements of a University Campus. Appl. Therm. Eng. 2010, 30, 1255–1261. [Google Scholar] [CrossRef]
- Nuytten, T.; Claessens, B.; Paredis, K.; Van Bael, J.; Six, D. Flexibility of a combined heat and power system with thermal energy storage for district heating. Appl. Energy 2013, 104, 583–591. [Google Scholar] [CrossRef]
- Sartor, K.; Dewallef, P. Integration of heat storage system into district heating networks fed by a biomass CHP plant. J. Energy Storage 2018, 15, 350–358. [Google Scholar] [CrossRef]
- Città Metropolitanadi Palermo-L’Ente. Available online: http://www.cittametropolitana.pa.it/provpa/provincia_di_palermo/l_ente/00003762_L_Ente.html (accessed on 15 May 2020).
- Analisi e Risultati Delle Policy di Efficienza Energetica del Nostro Paese Agenzia Nazionale Efficienza Energetica. Available online: www.efficienzaenergetica.enea.it (accessed on 9 May 2020).
- Piano d’Azione Italiano per l’Efficienza Energetica. 2017. Available online: http://enerweb.casaccia.enea.it/enearegioni/UserFiles/PAEE-2017.pdf (accessed on 9 May 2020).
- Ministero dell’Istruzione Ministero dell’Università e della Ricerca. PREPAC. Available online: https://www.mise.gov.it/images/stories/documenti/LINEE-GUIDA-PREPAC-maggio-2017.pdf (accessed on 9 May 2020).
- Tahsildoost, M.; Zomorodian, Z.S. Energy retrofit techniques: An experimental study of two typical school buildings in Tehran. Energy Build. 2015, 104, 65–72. [Google Scholar] [CrossRef]
- CRESME Estratto Rapporto. RIUSO03—Ristrutturazione Edilizia, Riqualificazione Energetica, Rigenerazione Urbana 2014; CRESME: Rome, Italy, 2014. [Google Scholar]
- Jain, N.; Burman, E.; Robertson, C.; Stamp, S.; Shrubsole, C.; Aletta, F.; Barrett, E.; Oberman, T.; Kang, J.; Raynham, P.; et al. Building performance evaluation: Balancing energy and indoor environmental quality in a UK school building. Build. Serv. Eng. Res. Technol. 2020, 41, 343–360. [Google Scholar] [CrossRef]
- Wargocki, P.; Wyon, D.P. Providing better thermal and air quality conditions in school classrooms would be cost-effective. Build. Environ. 2013, 59, 581–589. [Google Scholar] [CrossRef]
- Barbosa, F.C.; de Freitas, V.P.; Almeida, M. School building experimental characterization in Mediterranean climate regarding comfort, indoor air quality and energy consumption. Energy Build. 2020, 212, 109782. [Google Scholar] [CrossRef]
- D’Amico, A.; Ciulla, G.; Traverso, M.; Lo Brano, V.; Palumbo, E. Artificial Neural Networks to assess energy and environmental performance of buildings: An Italian case study. J. Clean. Prod. 2019, 239. [Google Scholar] [CrossRef]
- Ministero Dell’economia e Delle Finanze Dipartimento Della Ragioneria Generale Dello Stato Servizio. Studi Analisi Dell’Efficienza Delle Scuole Italiane Rispetto Agli Apprendimenti Degli Studenti Differenze Territoriali e Possibili Determinanti; Ministero Dell’economia e Delle Finanze Dipartimento Della Ragioneria Generale Dello Stato Servizio: Rome, Italy, 2012. [Google Scholar]
- Marrone, P.; Gori, P.; Asdrubali, F.; Evangelisti, L.; Calcagnini, L.; Grazieschi, G. Energy Benchmarking in Educational Buildings through Cluster Analysis of Energy Retrofitting. Energies 2018, 11, 649. [Google Scholar] [CrossRef] [Green Version]
- Ministero Dello Sviluppo Economico Italiano Decreto Ministeriale—Applicazione Delle Metodologie di Calcolo Delle Prestazioni Energetiche e Definizione Delle Prescrizioni e dei Requisiti Minimi Degli Edifici; Ministero dello Sviluppo Economico: Rome, Italy, 2015.
- D’Amico, A.; Ciulla, G.; Panno, D.; Ferrari, S. Building energy demand assessment through heating degree days: The importance of a climatic dataset. Appl. Energy 2019, 242, 1285–1306. [Google Scholar] [CrossRef]
- Ciulla, G.; D’Amico, A.; Lo Brano, V.; Buscemi, A. Regression analysis to design a solar thermal collector for occasional use. Sustain. Energy Technol. Assess. 2020, 37. [Google Scholar] [CrossRef]
- Presidente Della Repubblica Italiana DPR 412 del 26 Agosto 1993—Progettazione, Regolamento Recante Norme per la L’installazione, l’esercizio e la Manutenzione Degli Impianti Di, Termici Degli Edifici ai Fini del Contenimento dei Consumi Energia, in Attuazione Dell’art; 4, comma 4, della le; Gazzetta Ufficiale: Rome, Italy, 1993.
- Palermo Energia SpA. Available online: http://www.palermoenergiaspa.it/?idPlugin=20586&idx=579 (accessed on 9 May 2020).
- Repubblica Italiana Decreto Legge 19 Maggio 2020 n.34; Gazzetta Ufficiale: Rome, Italy, 2020.
- Ciulla, G.; D’Amico, A. Building energy performance forecasting: A multiple linear regression approach. Appl. Energy 2019, 253, 113500. [Google Scholar] [CrossRef]
- Ciulla, G.; D’Amico, A.; Lo Brano, V. Evaluation of building heating loads with dimensional analysis: Application of the Buckingham π theorem. Energy Build. 2017. [Google Scholar] [CrossRef]
- Ente Nazionale Italiano di Normazione. UNI EN ISO 7730:2006: Ergonomia Degli Ambienti Termici—Determinazione Analitica e Interpretazione del Benessere Termico Mediante il Calcolo Degli Indici PMV e PPD e dei Criteri di Benessere Termico Locale; Ente Nazionale Italiano di Normazione: Milano, Italy, 2006. [Google Scholar]
- Ying, X.; Jianshun, Z. ASHRAE Climatic Design Information. In ASHRAE Fundamentals Handbook; Syracuse University: Syracuse, NY, USA, 2009. [Google Scholar] [CrossRef] [Green Version]
- Lund, H.; Münster, E. Modelling of energy systems with a high percentage of CHP and wind power. Renew. Energy 2003, 28, 2179–2193. [Google Scholar] [CrossRef]
- Wang, H.; Yin, W.; Abdollahi, E.; Lahdelma, R.; Jiao, W. Modelling and optimization of CHP based district heating system with renewable energy production and energy storage. Appl. Energy 2015, 159, 401–421. [Google Scholar] [CrossRef]
- Urbanucci, L.; D’Ettorre, F.; Testi, D. A Comprehensive Methodology for the Integrated Optimal Sizing and Operation of Cogeneration Systems with Thermal Energy Storage. Energies 2019, 12, 875. [Google Scholar] [CrossRef] [Green Version]
- Franco, A.; Versace, M. Optimum sizing and operational strategy of CHP plant for district heating based on the use of composite indicators. Energy 2017, 124, 258–271. [Google Scholar] [CrossRef]
- GSE. Available online: https://www.gse.it/ (accessed on 15 May 2020).
- ARERA. Available online: https://www.arera.it/it/index.htm# (accessed on 15 May 2020).
- Cardona, E.; Piacentino, A. A methodology for sizing a trigeneration plant in mediterranean areas. Appl. Therm. Eng. 2003, 23, 1665–1680. [Google Scholar] [CrossRef]
- Autodesk Ecotect Analysis. Autodesk 2011. Available online: https://knowledge.autodesk.com/search-result/caas/sfdcarticles/sfdcarticles/Ecotect-Analysis-Discontinuation-FAQ.html (accessed on 13 October 2020).
- CEI 82-25. Guide for Design and Installation of Photovoltaic (PV) Systems Connected to MV and LV Networks; Comitato Elettrotecnico Italiano: Milano, Italy, 2018. [Google Scholar]
- Ente Nazionale Italiano di Normazione. UNI 10349:2016. Riscaldamento e Raffrescamento Degli Edifici—Dati Climatici; Ente Nazionale Italiano di Normazione: Milano, Italy, 2016. [Google Scholar]
- Regione Siciliana—Official Web Site. Available online: http://pti.regione.sicilia.it/portal/page/portal/PIR_PORTALE/PIR_LaStrutturaRegionale/PIR_AssInfrastruttureMobilita/PIR_Diptecnico/PIR_Areetematiche/PIR_CRLLPP-Prezziario/PIR_Prezzarioregionalenew/PIR_Prezzariovigente (accessed on 15 May 2020).
- Car e Certificati Bianchi. Available online: https://www.gse.it/servizi-per-te/efficienza-energetica/cogenerazione-ad-alto-rendimento/car-e-certificati-bianchi (accessed on 15 May 2020).
- Fattori di Emissione Atmosferica di Gas a Effetto Serra Nel Settore Elettrico Nazionale e Nei Principali Paesi Europei; ISPRA Report 303-2019; ISPRA: Rome, Italy, 2019.
- Nicolosi, G.; Volpe, R.; Messineo, A. An innovative adaptive control system to regulate microclimatic conditions in a greenhouse. Energies 2017, 10, 722. [Google Scholar] [CrossRef] [Green Version]
Publisher’s Note: MDPI stays neutral with regard to jurisdictional claims in published maps and institutional affiliations. |
Figure 1.
Position of the school buildings in Palermo, Libertà district.

Figure 2.
The three school buildings in Palermo.

Figure 3.
The 3D models of three school buildings in Palermo.

Figure 4.
The TRNSYS model [49].
Figure 4.
The TRNSYS model [49].

Figure 5.
Annual electricity consumption (MWh/year) for each school building.

Figure 6.
Comparison of normalized annual electricity consumption (kWh/(m2year)) for each school building.
Figure 6.
Comparison of normalized annual electricity consumption (kWh/(m2year)) for each school building.

Figure 7.
Thermal consumption of each school simulated with the actual climatization system.

Figure 8.
Normalized thermal consumption of each school simulated with actual climatization system.

Figure 9.
Total thermal loads of each school.

Figure 10.
Normalized total thermal loads of each school.

Figure 11.
Total heating energy demand (MWh/year) of the energy district.

Figure 12.
Indoor temperature trends in the classroom thermal zones.

Figure 13.
Cumulative curve of the total thermal power demand.

Figure 14.
Full load energy curve.

Figure 15.
Schema of the energy district.

Figure 16.
Sensitivity analysis at 2.5% and pay-back time (PBT) for the CHP system.

Figure 17.
Sensitivity analysis at 2.5% and PBT for the CHP system, considering the high-yield cogeneration (HYC).
Figure 17.
Sensitivity analysis at 2.5% and PBT for the CHP system, considering the high-yield cogeneration (HYC).

Figure 18.
The PV system net present value (NPV) for different interest rates (i%) in each school.

Figure 19.
Comparison of the CO2 emission pre- and post-multi-energy school system (MESS).


Table 1.
The main geometrical features of the three school buildings.
| Geometrical Features of School Buildings | ||||
|---|---|---|---|---|
| Building 1 | Building 2 | Building 3 | ||
| Total gross surface | [m2] | 4591.4 | 11,768.01 | 22,439.26 |
| Total net surface | [m2] | 3598.9 | 8867.72 | 19,418.16 |
| Total losses surface | [m2] | 8076.3 | 9952.53 | 23,491.36 |
| Heat gross volume | [m3] | 18,631.3 | 39,194.08 | 89,897.25 |
| Shape factor | [m−1] | 0.43 | 0.25 | 0.26 |
| Glazed surface | [m2] | 741.62 | 1503.65 | 2382.65 |
Table 2.
Thermophysical and geometrical features of each school building.
| Thermophysical and Geometrical Features | |||
|---|---|---|---|
| Building 1 | Building 2 | Building 3 | |
| Bearing structure | tuff blocks | tuff blocks | tuff blocks |
| Internal height [m] | 3.7–4.2 | 4–4.5 | 3–4.1 |
| External wall thickness [cm] | 50 | 40 | 56.00 |
| Floor thickness [cm] | 40 | 40 | 40 |
| Ground floor thickness [cm] | 56 | 56 | 57 |
Table 3.
The actual transmittance values and the limit values.
| Thermal Transmittance [W/m2K] | ||||
|---|---|---|---|---|
| Limit Value | Building 1 | Building 2 | Building 3 | |
| Uwall | 0.38 | 1.93 | 2.178–2.359 * | 0.86–1.445 * |
| Uroof | 0.27 | 0.285/1.318 * | 1.96 | 2.10 |
| Ufloor | 0.40 | 1.82 | 0.76 | 1.95 |
| Uwindow (average) | 2.6 | 2.3–3.27 * | 2.9–5.8 * | 3.2–5.8 * |
* Range of values from minimum to maximum.
Table 4.
The thermal zones for each school building.
| School Building Thermal Zones [m2] | |||
|---|---|---|---|
| Building 1 | Building 2 | Building 3 | |
| Classrooms | 1203.90 | 3035.7 | 5769 |
| Special Classrooms | 454.8 | 1044.6 | 4668.8 |
| Hallway | 1284 | 1754 | 6237.6 |
| Offices | 165.3 | 223.6 | 595.9 |
| No-Clima Zones | 287.4 | 2135.3 | 2147.7 |
| HVAC | absent | 674.5 | absent |
| Total | 3395.40 | 8867.70 | 19,419.00 |
Table 5.
Determination of k parameter for electrical consumption of three building models.
| Electrical Consumption [kWhele] | |||
|---|---|---|---|
| Bill | Simulated | k [%] | |
| Building 1 | 236,304.43 | 245,757.7 | −3.85 |
| Building 2 | 204,569.31 | 213,637 | −4.244 |
| Building 3 | 435,662.5 | 452,238 | −3.665 |
Table 6.
Determination of k parameter for thermal loads of Building 3 TRNSYS model.
| Building 3 | |||
|---|---|---|---|
| Bill | Simulated | k [%] | |
| Diesel Fuel [L] | 13,500 | 12,956.71 | |
| Heating Thermal Loads [kWh/year] | 192,132 | 184,399.93 | |
| Normalized Heating Thermal loads | 21.67 | 20.79 | 4.193 |
Table 7.
The combined heat and power (CHP) system technical features.
| CHP Features | ||
|---|---|---|
| Electric Power | [kW] | 600 |
| Thermal Power | [kW] | 743 |
| Electric Efficiency | ηe | 0.42 |
| Thermal Efficiency | ηth | 0.52 |
| Global Efficiency | ηglob | 0.94 |
| Power Input with Fuel | [kW] | 1433 |
Table 8.
CHP system energy and consumption features.
| CHP Energy Features | ||
|---|---|---|
| Electric Energy | [kWh/year] | 458,400.00 |
| Thermal Energy | [kWh/year] | 567,652.00 |
| Energy Input with Fuel | [kWh/year] | 1,094,812.00 |
| Natural Gas Consumption | [Sm3] | 116,188.85 |
Table 9.
Energy coverage degree by the CHP system.
| Energy Vector Needs | Quantity | |
|---|---|---|
| Overall Electric Energy Demand | [kWh/year] | 875,948.3 |
| Overall Thermal Energy demand | [kWh/year] | 713,464.13 |
| Electric Energy by CHP System | [kWh/year] | 458,400 |
| Electric energy Not Covered | [kWh/year] | −417,548.30 |
| Net Thermal Energy by CHP System | [kWh/year] | 562,916.00 |
| Thermal Energy by Boiler | [kWh/year] | 150,396.31 |
| Boiler Natural Gas Consumption | [Sm3] | 17,070.67 |
| Total Natural Gas Consumption | [Sm3] | 133,259.52 |
Table 10.
Available area for photovoltaic (PV) installation for each school building.
| Building 1 | Building 2 | Building 3 | |
|---|---|---|---|
| Available area [m2] | 440.06 | 2325.95 | 3104.24 |
| Shaded area [m2] | 0 | 133.34 | 831.71 |
| Total area [m2] | 440.06 | 2459.29 | 3935.95 |
Table 11.
PV plant features for each school building.
| Building 1 | Building 2 | Building 3 | |
|---|---|---|---|
| Module number | 160 | 324 | 420 |
| Tilt angle β | 18° | 30° | 30° |
| Peak power [kW] | 45.6 | 92.34 | 119.70 |
| Energy produced [kWh/year] | 54,515.93 | 113,717.67 | 147,558.56 |
Table 12.
PV installation and management costs.
| Costs | Building 1 | Building 2 | Building 3 |
|---|---|---|---|
| Installation [EUR] | 70,112.7 | 133,852.4 | 166,633.4 |
| Specific installation [EUR/kWp] | 1537.6 | 1449.56 | 1392.1 |
| Management [EUR/year] | 1459.2 | 2770.2 | 3591.0 |
Table 13.
Annual PV energy production and cost saving.
| Building 1 | Building 2 | Building 3 | |
|---|---|---|---|
| Overall electric energy need [kWh/year] | 204,569.30 | 235,568.2 | 435,662.50 |
| PV electric energy production [kWh/year] | 54,515.93 | 113,717.67 | 147,588.56 |
| PV electric energy production during schools opening hours [kWh/year] | 37,194.44 | 78,868.05 | 102,241.44 |
| PV electric energy production during schools closing hours [kWh/year] | 17,321.49 | 34,849.62 | 45,347.12 |
| Cost saving [EUR/year] | 8993.61 | 19,070.29 | 24,721.98 |
| Gain from energy sales [EUR/year] | 865.71 | 1743.68 | 2269.99 |
| Total revenue [EUR/year] | 9859.32 | 20,813.97 | 26,991.97 |
Table 14.
Total energy consumption and costs for 2017 in each school building.
| Buildings | Electricity | Natural Gas | Oil | |||
|---|---|---|---|---|---|---|
| [kWh] | [EUR/Year] | [Sm3] | [EUR] | [L] | [EUR] | |
| 1 | 204,569 | 49,506 | - | - | - | - |
| 2 | 235,568 | 57,007 | - | - | 22,482 | 21,582 |
| 3 | 435,662 | 105,430 | 51,981 | 29,626 | - | - |
| Total | 875,799 | 211,943 | 51,981 | 29,626 | 22,482 | 21,582 |
© 2020 by the authors. Licensee MDPI, Basel, Switzerland. This article is an open access article distributed under the terms and conditions of the Creative Commons Attribution (CC BY) license (http://creativecommons.org/licenses/by/4.0/).
Share and Cite
MDPI and ACS Style
D’Amico, A.; Panno, D.; Ciulla, G.; Messineo, A. Multi-Energy School System for Seasonal Use in the Mediterranean Area. Sustainability 2020, 12, 8458. https://0-doi-org.brum.beds.ac.uk/10.3390/su12208458
AMA Style
D’Amico A, Panno D, Ciulla G, Messineo A. Multi-Energy School System for Seasonal Use in the Mediterranean Area. Sustainability. 2020; 12(20):8458. https://0-doi-org.brum.beds.ac.uk/10.3390/su12208458
Chicago/Turabian StyleD’Amico, Antonino, Domenico Panno, Giuseppina Ciulla, and Antonio Messineo. 2020. "Multi-Energy School System for Seasonal Use in the Mediterranean Area" Sustainability 12, no. 20: 8458. https://0-doi-org.brum.beds.ac.uk/10.3390/su12208458
Note that from the first issue of 2016, this journal uses article numbers instead of page numbers. See further details here.