“If only I Could Decide”: Opinions of Food Category Managers on in-Store Food Waste
by
 , ,
, ,
Clara Cicatiello
1 ,
,
Emanuele Blasi
1,
Claudia Giordano
2,* ,
,
Angelo Martella
3 and
Silvio Franco
3 1
Department for Innovation in Biological, Agro-food and Forest Systems, University of Tuscia, 01100 Viterbo, Italy
2
Department of Agricultural, Food and Environmental Sciences, University of Bologna, 40127 Bologna, Italy
3
Department of Economy, Engineering, Society and Business, University of Tuscia, 01100 Viterbo, Italy
*
Author to whom correspondence should be addressed.
Sustainability 2020, 12(20), 8592; https://0-doi-org.brum.beds.ac.uk/10.3390/su12208592
Submission received: 2 August 2020
/
Revised: 10 October 2020
/
Accepted: 12 October 2020
/
Published: 16 October 2020
(This article belongs to the Special Issue The Challenge of Food Waste Reduction to Achieve More Sustainable Food Systems)
Abstract
:Retail food waste represents a minor fraction of the total amount of food waste produced along the food supply chain (tenfold lower than the quantity of food disposed of by consumers at home). However, the role of retailers is crucial in shaping both the behavior of upstream food chain actors and the preferences of consumers. This paper studies the causes of food waste in retail stores and discusses potential mitigating actions based on the results of nine focus groups held in 2017 with 67 foods category managers. Participants used sticky notes to outline both the causes of in-store food waste and potential actions to address it. Sticky notes reporting 228 causes and 124 actions were collected during the study. Data were analyzed across thematic macro-categories and linked to the responsibility of supply chain actors, including managers at all store management levels. Results revealed that food category managers consider in-store operations (which include their actions and those of their subordinates) to be most responsible for retail food waste. However, when it comes to proposing actions against food waste, they believe that store managers are mainly responsible for the implementation of waste reduction actions. This study suggests that food category managers are key actors to involve in the fight against retail food waste. Greater effort should also be put towards informing and encouraging store managers to take action against food waste in supermarkets.
1. Introduction
Appropriate food waste management is recognized as an essential element of sustainable development [1]; for this reason, food waste prevention and management is gaining increased attention at both the food supply chain and policy levels [2]. Different definitions of food waste have been discussed in the literature [2,3]. In the EU, the official definition of food waste is “any food, and inedible parts of food, removed from the food supply chain to be recovered or disposed” [4]. However, an important debate is ongoing about whether or not to include—in the concept of food waste—inedible parts of food [2,5], food byproducts that are diverted to other production processes [6], and overnutrition [3,7]. Currently, “food losses” is the term commonly used to refer to food that is discarded in the first stages of the supply chain [3].
Official EU figures dating back to 2016 report that retail food waste represents about 5% of total food waste generated along the food supply chain [8]. In the US, more recent estimates report a share of 13% [9]. Quantification studies that focused on the direct assessment of food waste at retail stores have shown that about 1–2% of marketed food (in volume) is discarded [10,11], and that the quantity of food waste depends on the size of the store, with an annual food waste average of 19 kg per square meter of sales area [12]. Direct measurement [13]—based on stores’ records of unsold products removed from shelves—is the most frequently used methodology for assessing the quantity and type of food waste at retail stores. However, these records have shown significant underreporting, and actual food waste quantities may be one-third more than what is usually recorded in stores [12].
Food waste at retail stores is usually made of perishable products such as bread, fresh fruits, vegetables, and dairy products [14,15,16,17]. Waste rates reported in literature vary, but they reach up to 9% for fruits and vegetables and up to 5% for bread in two different studies conducted in 2013 and 2014 [11,16]. Other recent studies report even higher waste rates for cooked foods [12].
Although the quantity of food waste generated at the retail level is low, relative to other stages of the food supply chain (especially the consumption stage [8,18]), retail food waste reduction is now attracting increased attention. This is due, first, to the influence of retail strategies on both the behavior of upstream food chain actors and consumer preferences [19,20], and second, to the increasing evidence that a meaningful portion of products discarded at the retail level is still suitable for human consumption [17]. This explains why food donation and redistribution are regarded as main strategies against retail food waste both at the store level [21,22] and in policy-making [23].
In line with priorities set in the food waste hierarchy [24], prevention should be regarded as the first strategy against food waste, with re-use or recycling of food waste only considered where prevention is impossible. In order to implement food waste prevention at the retail level, it is crucial to first fully understand the causes of in-store waste. Studies that analysed the causes of food waste commonly report the following as important factors: damaged or inappropriate packaging; unsold/surplus products after holidays or promotions; spillages, abrasion, bruising, or excessive trimming of unpacked foods; excessive or insufficient heat; inadequate storage; technical malfunctions; overstocking due to inaccurate prediction of the number of customers; and out-grading of blemished, misshapen, or wrong-sized foods by customers [25]. The identification of these causes is mostly based on direct observation by researchers or on information provided by retail managers [26]. Food category managers are seldom involved in the analysis of food waste causes for research purposes. However, their role is crucial because they manage or contribute to the management of pricing, shelving, marketing, and promotion of specific categories of products. More importantly, they are responsible for supplier relations, including orders and take-back agreements, which represent key hotspots for food waste generation at retail stores [27]. Their point of view could be valuable in research on retail food waste, as they understand in depth the processes behind store operations and how they can eventually result in the generation of food waste.
To involve food category managers in the investigation of food waste at retail stores, a switch from quantitative to qualitative approaches is required. In the retail sector, food waste is usually studied both through interviews with experts or key actors to gather qualitative information such as causes [19,26] and through recording (mass balance) to detect quantities. Questionnaires have been used extensively, even though their capacity to produce reliable information is still debated [28,29]. However, qualitative methods have especially been used to study consumer food waste: for example, Farr-Wharton [30] and Aschemann-Witzel [31] used mixed methods, including direct observation, to study consumer behavior related to food waste. Soma [32] opted to run an ethnographic study on the role of class and privilege in food waste creation. Finally, in 2020, Rosenlund et al. [33] applied a mixed methodology composed of field observations, interviews, media study, and quantitative data to enquire into food waste in retail in Sweden. Targeting the same stage in the food supply chain, Refsgaard and Magnussen [34] used focus groups to analyze householders’ behavior with respect to recycling.
This paper aims to contribute to this stream of research by conducting a direct analysis of the causes of food waste at retail stores based on discussions with food category managers in a wide qualitative study. The choice of method suits the main aim of the research question, which is to ascertain food waste causes from the direct perspective of individuals well-versed in the background operations in retail stores. Data were gathered from nine focus groups held in 2017 with 67 food category managers employed in 16 different food retail stores in Italy. The objective of the study was to analyze the root causes of food waste and the possible prevention initiatives at the retail level, based on the internal perspective (opinions) of retail food category managers.
2. Materials and Methods
2.1. Structure of the Study
The study involved 16 stores that all belong to the same chain (a major retailer in Italy). The stores were located in 11 different municipalities in Central Italy, and they were selected in a way that captured variation of the chain’s stores in terms of sales area and turnover. The selection included three hypermarkets (S14, S15, S16). The main features of the stores are reported in Table 1.
This group of stores was used as a panel to monitor quantities of food waste over one year. S1–S13 were monitored from May 2016 to April 2017, while S14–S16 were monitored from January to December 2016. Following this quantification effort, a qualitative study was conducted to investigate the causes of food waste. Because they belong to the same chain, most management practices and technical assets of the stores are similar; for example, all stores use the same calendar for the removal of near-expiration products from the shelves. All stores are equipped with a central air conditioning system, and most of the refrigerators are wall types. However, some features—such as parking space for customers, building type, roof height, and number of cashiers—largely depend on the type of store and its location, e.g., whether it is in a residential building in the middle of the city or in a dedicated facility in the suburbs.
In the quantification study, the data collection process was daily based and followed the usual waste recording routine at the stores (electronic scanning of bar codes of culled products and acquisition of the resulting database [12,17,35]). In the smaller stores, these data were supplemented with a manual recording of the weight and value of discarded unpacked products that escaped the recording process.
Table 2 shows the quantity and value of food waste recorded in one year at the 16 stores involved in the study. While the values recorded vary substantially from store to store, there is a clear relationship between sales area and food waste quantities, with large stores producing more food waste than smaller ones.
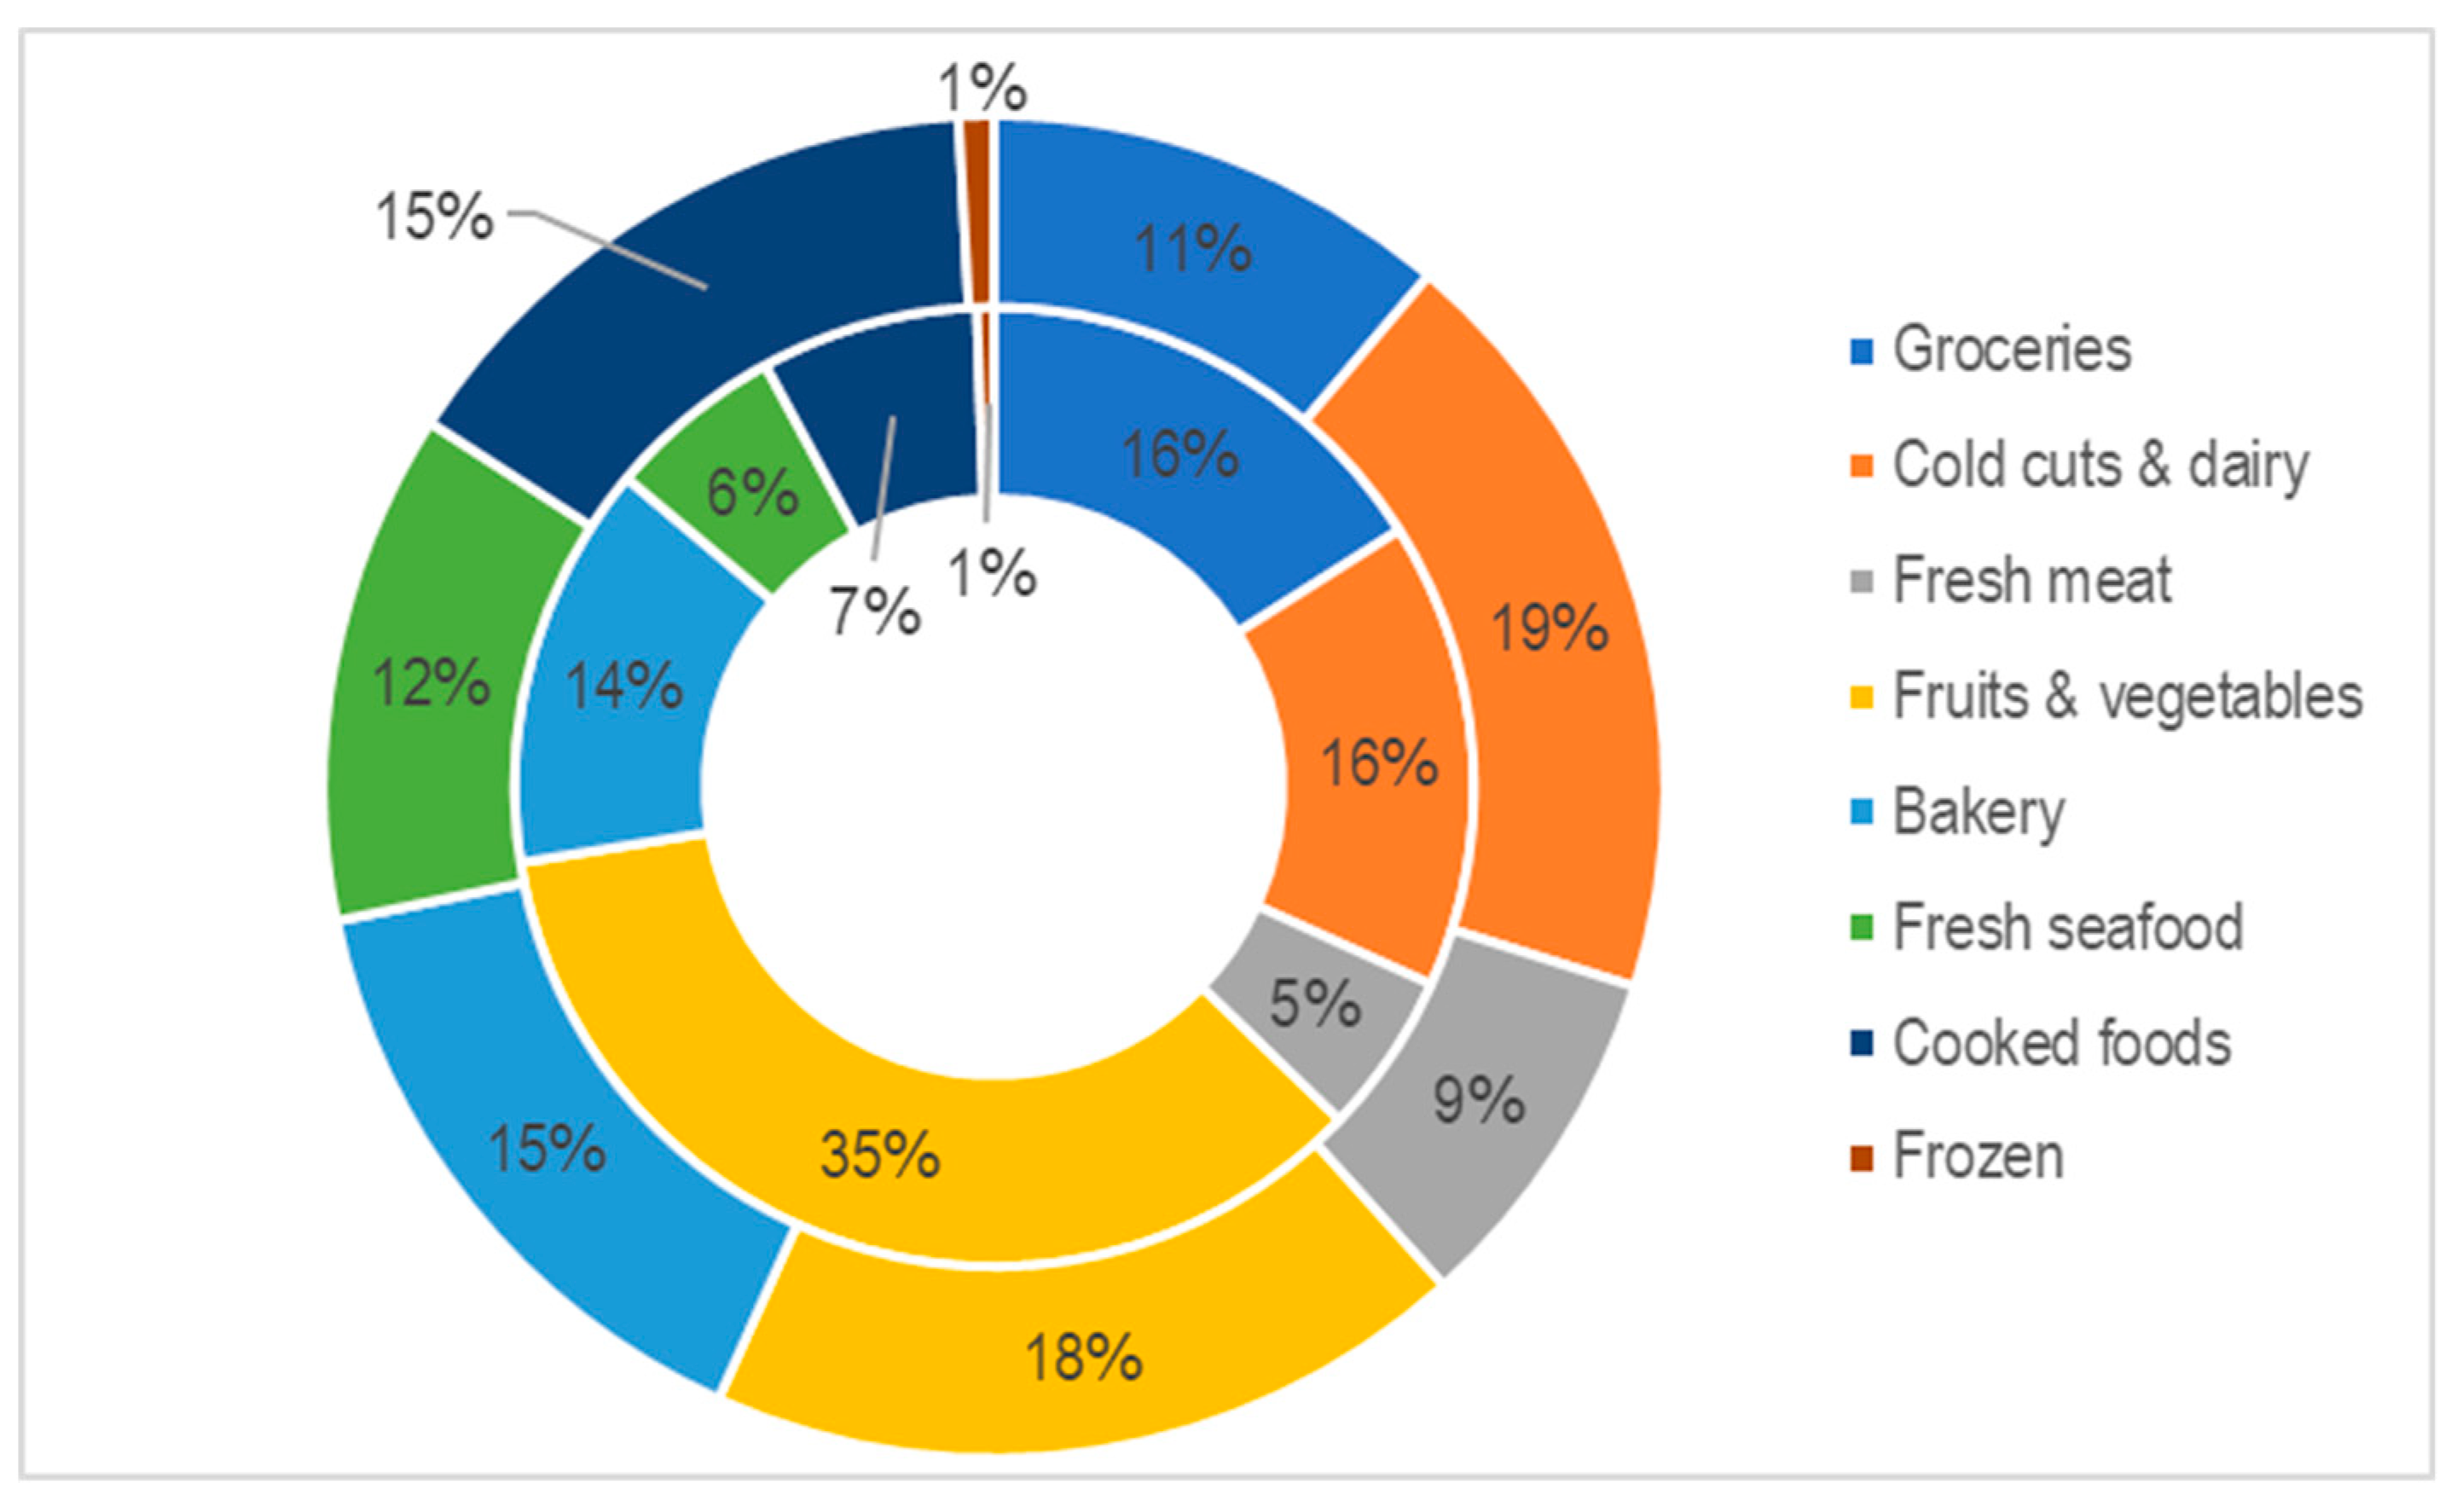
Figure 1 displays a breakdown of the quantity and value of food waste among the different food categories. As widely reported in the literature [12,17,35], a majority of the food waste produced in the retail sector comprises of the bread, dairy, and fruits and vegetables categories. The breakdown of food waste by economic value revealed that waste from cooked foods resulted in substantial financial loss for the retail stores despite the category’s relatively small volume.
After the conclusion of the quantification study, which data is presented here as background information (see references [12,17] for more details), a qualitative study was conducted in the spring of 2017 to investigate the causes of food waste in these stores. A series of focus groups with stores’ staff was selected as an appropriate method for gathering information that would otherwise not have been accessible to researchers. Indeed, focus groups allow for free discussions among participants that could reveal important inputs and explanations for recorded observations. The choice of the type of staff to involve in the focus groups fell on food category managers, who are in charge of running individual departments of the store. They depend on the store manager for all strategical decisions (e.g., assortment, display of products, etc.) but are autonomous in the management of orders and in the relation with suppliers. They supervise the work of the staff in charge of shelf management, in such a way that they monitor all the products entering/leaving the shelves of their department. Food category managers’ position in the decision-making process at the store is therefore crucial, especially for what concerns waste-related issues.
2.2. Selection of Focus Group Participants
Participants were selected among food category managers from all stores in the panel. Food category managers were defined as persons who were responsible for orders and the display and management of products for one or more departments of the stores. The stores were typically organized into 9 departments: Groceries, unpacked cold cuts and cheeses, packed cold cuts and cheeses, fruits and vegetables, fresh meat, frozen products, fresh seafood, bakery, and cooked foods. In smaller stores, a food category manager would typically manage more than one department. A letter of invitation to join the focus groups was sent to store managers of the 16 stores, with a request to forward it to all food category managers in the stores. Store managers were asked to particularly push for the participation of food category managers responsible for the packed and unpacked cold cuts and cheeses, fruits and vegetables, meat and seafood, and bakery categories, as these are the categories that exhibit the largest amounts of waste [16,25]. Approximately 120 food category managers were invited to the focus groups. Of these, 73 informed their store managers that they were available to partake in the discussion.
To maintain a range of 7–9 participants per focus group, 9 different focus groups were organized, 3 involving the food category managers of the hypermarkets and 6 involving those of other stores. The discussion sessions were scheduled over three full days between April and June 2017, in the pattern reported in Table 3. In total, 67 participants joined the focus groups, while 6 were either unavailable or not allowed to leave the store during their working hours on the agreed dates and times. The focus groups were facilitated by 6 researchers in the pattern reported in Table 3.
Store managers approved the participation of food category managers from their stores and supported logistics by providing rooms and equipment. However, they were explicitly asked to leave the room once discussions started so that participants could freely express their opinions even in cases where they were critical of management operations in the stores.
2.3. Methodology of Focus Group Discussion
The focus group methodology was selected because it enables a feedback effect among participants that spurs conversation that may not have come up otherwise. Each session was divided into 3 phases.
- Phase 1: Introduction to the session and a survey on the perception of waste.
- Phase 2: Presentation of food waste data collected for the stores under study.
- Phase 3: Guided discussion on the possible causes of waste and the possible reduction actions.
After an introduction and presentation of the research objectives, participants of the focus groups were asked to fill out a survey composed of six questions on the perception of food waste in the stores. Participants were asked: In Question 1, to assign a value of importance (from 1 to 10) to the topic of food waste in society, where 10 represented highest importance; in Question 2, to indicate whether food waste is an economic, environmental, social, or socio-economic-environmental problem; in Question 3, to indicate which phase of the agri-food supply chain accounted for the largest amount of food waste; in Question 4, to indicate which department accounted for the largest amount of food waste; in Question 5, to express, as a percentage, how many products end up as unregistered food waste in the participants’ departments; and finally, in Question 6, to indicate the quarter in which food waste is largest in the participants’ departments.
Once the surveys were collected (Phase 2), the data on food waste compiled from the panel of stores during the previous year were presented. At the same time, a research assistant analyzed the results of the completed surveys.
After a discussion of the presented data and a comparison of participants’ perceptions as reported in the survey, participants were divided into groups (Phase 3), with an aim to bring together, as best as possible, participants that managed the same departments. The discussion was facilitated by a researcher who instructed participants to use sticky notes to keep track of the different causes they were listing. These notes were later discussed one after the other and then aggregated by theme. Participants were asked to think about food waste at their store throughout the year, with no specific reference to seasons. After all the causes had been fully discussed, the facilitating researcher instructed participants to write down potential waste reduction actions that specifically addressed the different groups of causes previously identified.
The causes and potential actions mentioned in the discussion were discussed with store managers a few weeks after completion of the focus groups to check for consistency and validity of issues raised by the participants.
2.4. Data Analysis
Results from the focus groups were treated as one dataset, meaning that information gathered from staff of all supermarkets and hypermarkets were analyzed together.
Responses to the survey on the perception of food waste were analyzed first, with the aim to determine the participants’ stance on the food waste issue. Descriptive statistics and graphical representations of the responses are provided in Section 3.1.
Next, the content of the sticky notes collected during the focus group discussions were analyzed. The analysis approach was inspired by the methodology described by Fereday and Muir-Cochrane in 2006 [36] based on methods developed in the 1990s [37,38]. The first round of analysis focused on the 228 causes of in-store food waste recorded by participants on the sticky notes. These were encoded in an Excel file and classified into macro-categories. At this stage, Boyatszis’ thematic analysis [37] approach was implemented, in which classification was based on a template method [38]. The codebook was run a-priori—as illustrated by Fereday and Muir-Cochrane [36]—and was based on classifications suggested by the panel for the Future of Science and Technology (STOA) [39] and the EU-funded FUSIONS project [40]. The STOA classification was useful for (i) getting a broad idea of the possible causes that could emerge during the focus groups, and (ii) testing the first draft of themes. FUSIONS offered another possible classification that was adapted to the needs of the current work through the deletion of the “policy/normative causes” category and the re-encoding of its contents under the “others” label.
The causes detected in this first round of classification were:
- Technical issues: Infrastructure-related issues (e.g., temperature of refrigerators and trucks);
- Human-related issues: Errors by store staff, including mistakes during logistics calculations and shelf management (e.g., mishandling of products during transportation);
- Customers’ behavior: Careless behavior of customers (e.g., products handled and abandoned afterwards, damaging of packages);
- Sales management: Mistakes or market-driven decisions that generate waste (e.g., mistakes during orders, product display, promotions).
- Other: Events that cannot be grouped into any of the earlier themes (e.g., competitors’ strategies, general trends of the demand, seasonality etc.).
In a second round of analysis, each cause reported by the participants was interpreted in terms of the responsibility of food chain actors [41]. The aim of this second round of analysis was to detect how the causes of retail food waste are linked to individual operations conducted across all stages of the food supply chain, and as a consequence, to identify the actors that, from the perspective of food category managers, are most responsible for the generation of food waste in the retail sector. To this end, each cause was assigned to one or more of the following groups:
Group 1—supplier/retailer interface: The food industry and wholesale supply and logistics.
Group 2—store management: All store operations such as stock management, shelf management, store internal production, food category management (including orders and selection), store management choices, and chain-level marketing strategies.
Group 3—consumers: Consumer preferences and behavior.
Group 4—non-accountable (external/accidental factors): External or accidental factors that are not linked to any operations conducted across the food supply chain (e.g., weather or electricity power jumps).
This classification results in the conceptual design of data analysis illustrated in Figure 2. The figure shows the different levels of the food supply chain and the steps possibly linked to food waste generation.
For each of the 228 sticky notes delivered by the participants during the focus group, a score of 1 was allocated in the Excel file. When the cause reported on a sticky note could apply to multiple classification groups, the score was equally divided among the different groups concerned. The allocation of the score was performed through iterative revision among three of the authors, in which the authors analyzed each cause/sticky note individually and consulted the notes taken during the focus groups to ensure that the intended meaning of the cause was retained.
The same procedure was applied in the classification of the 124 sticky notes reporting actions against food waste. Each action was assigned to one or more groups of food chain operations to highlight who, according to the category managers, might be responsible for its implementation.
The data obtained through the classification of causes and potential food waste reduction actions were analyzed by means of descriptive statistics and graphical representations that reflected the responsibility of all food chain actors with respect to the generation of retail food waste and the potential prevention/reduction initiatives. These results, reported in Section 3.2 and Section 3.3, should be considered as the main output of the focus group discussion, reflecting the views of the food category managers, while the post-hoc classification is the authors’ classification. Additional information is reported in the results section in the form of quotes collected from participants during the focus group discussions that explain—sometimes better than numbers—the reasons behind the generation of food waste at retail stores and the potential actions to implement in order to tackle the problem.
A full list of the content of the sticky notes is available in Appendix A.
3. Results
3.1. Awareness of the Food Waste Issue among Focus Group Participants
The analysis of the 67 surveys revealed a high sensitivity of the focus groups’ participants to the issue of food waste. In fact, 96% considered the topic to be extremely important. For 91% of the participants, food waste was a socio-economic-environmental problem, thus emphasizing a strong interconnection among these three areas. Six percent of participants considered waste to be a purely economic problem, while 3% considered it to be a purely environmental one.
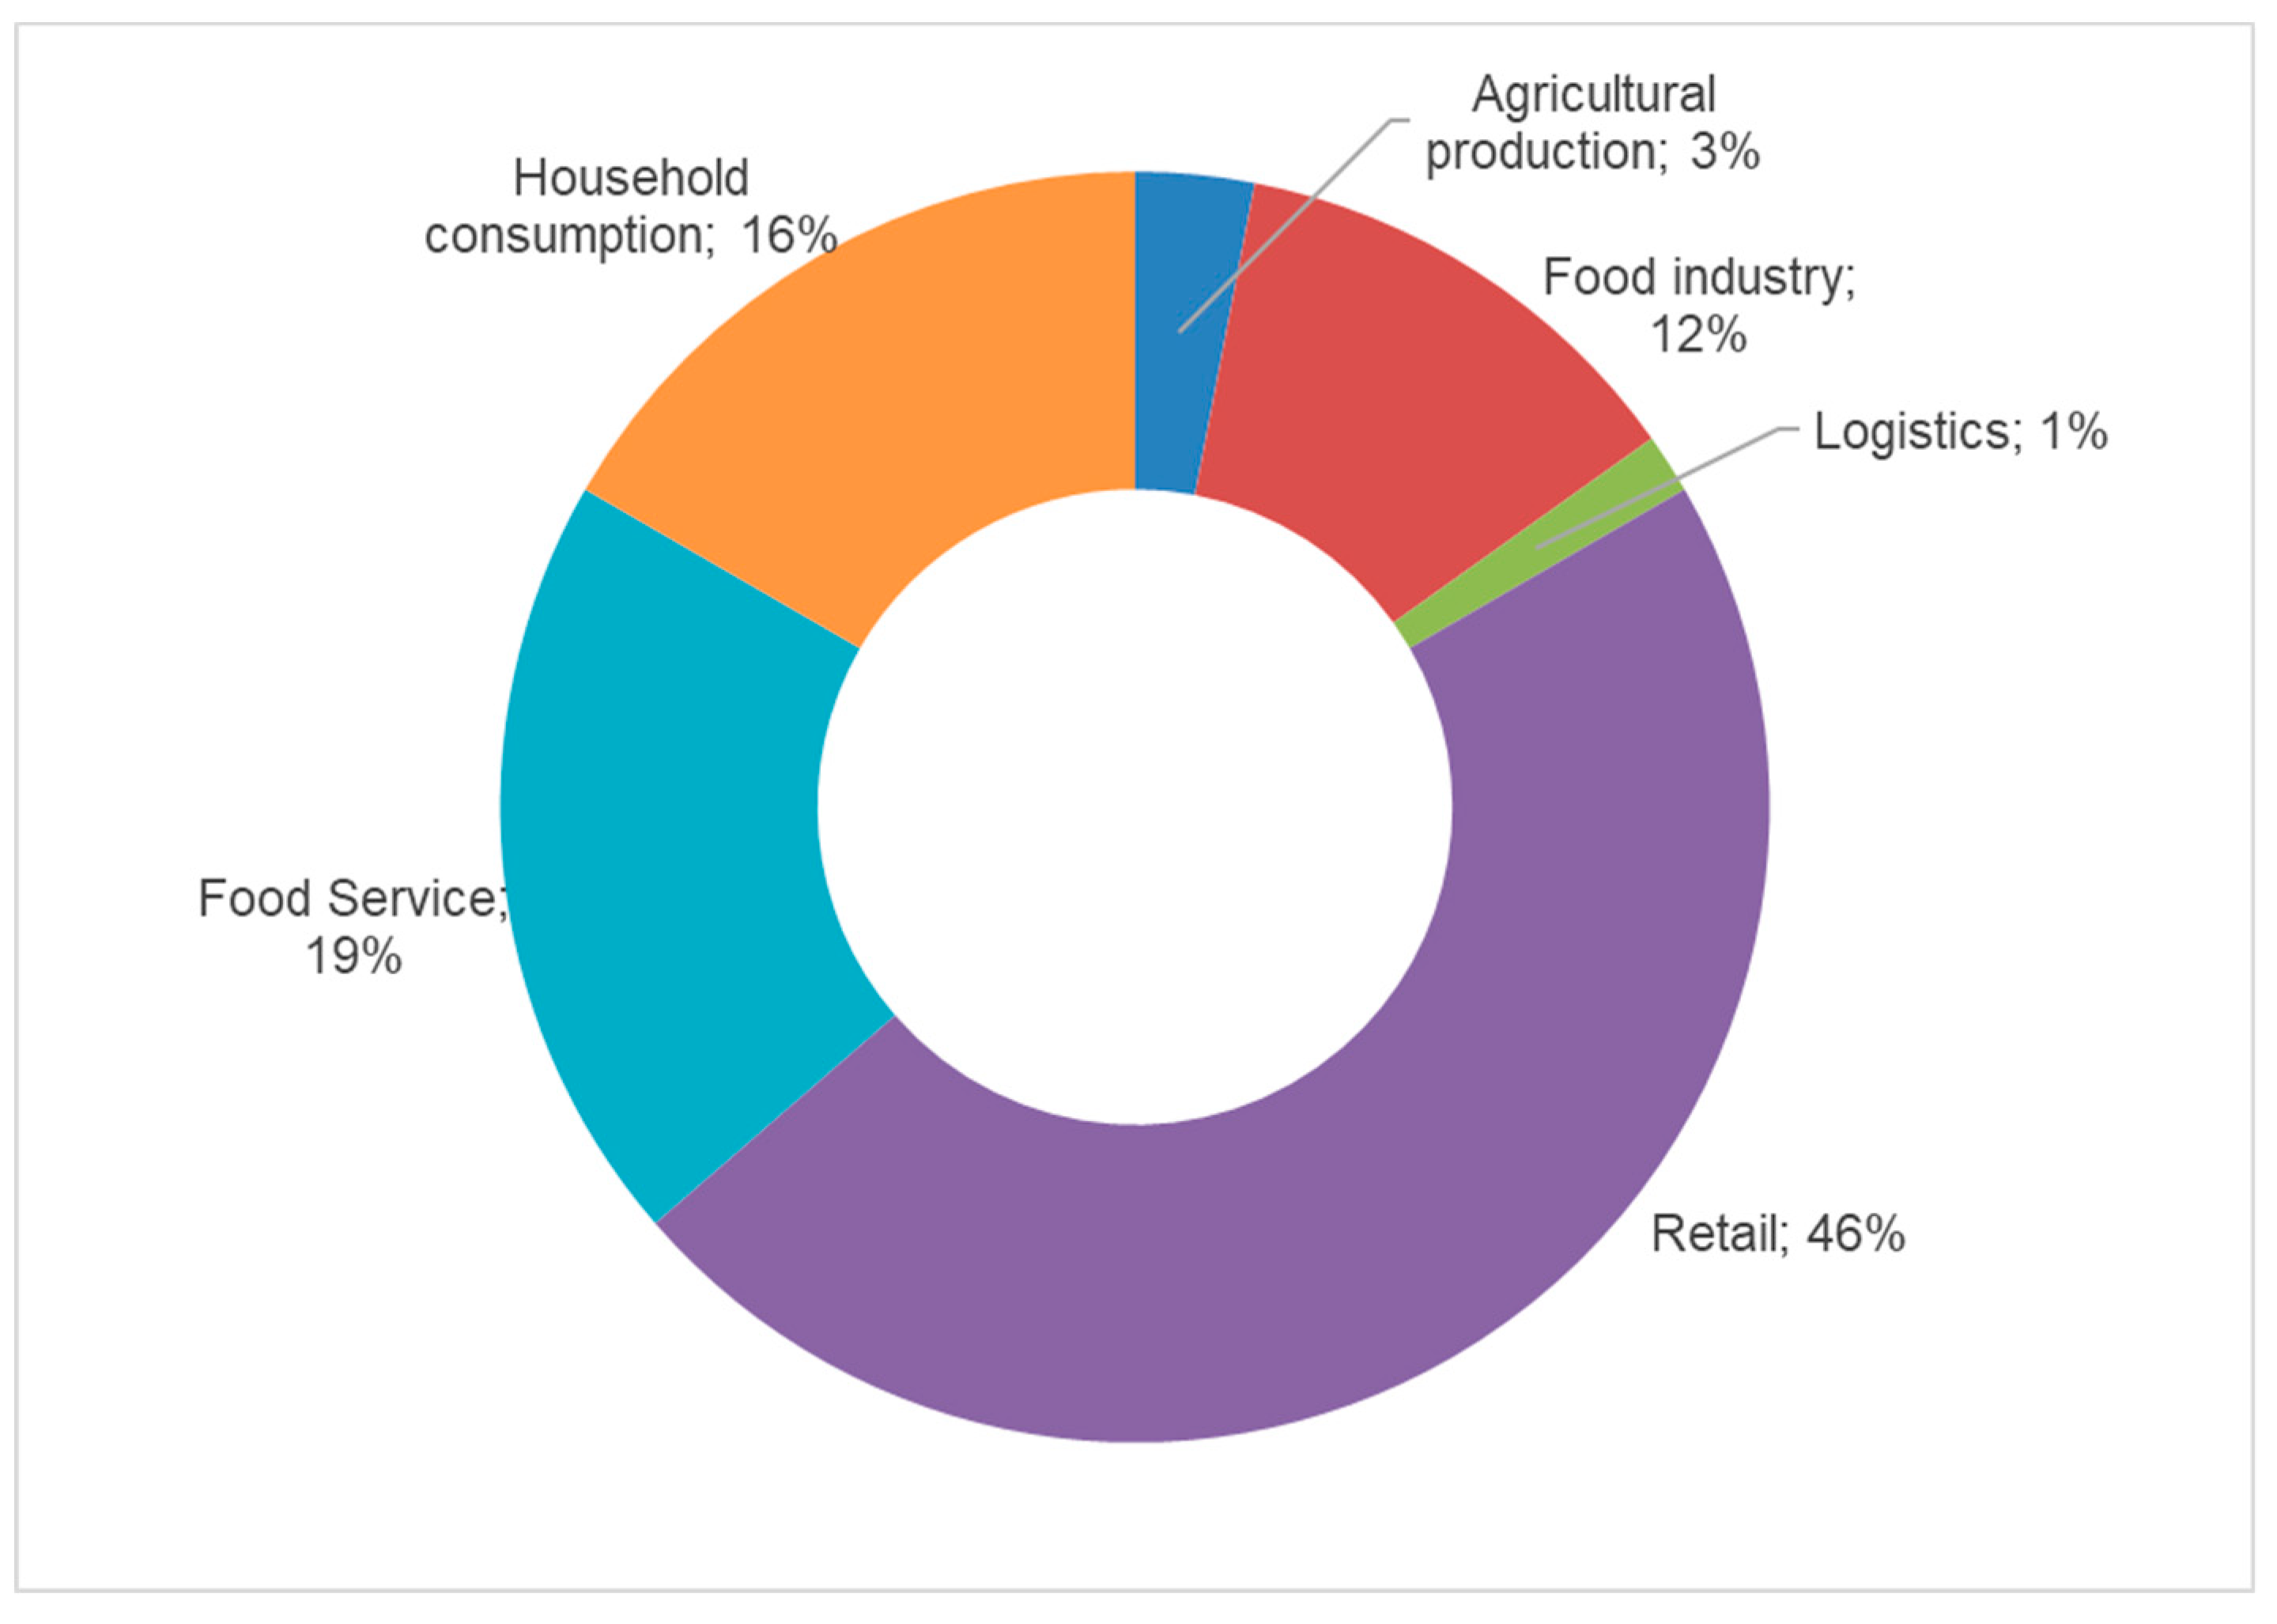
Forty-six percent of participants selected the retail phase as responsible for the largest amount of food waste. This is followed by food services (19%), household consumption (16%), and industrial transformation (12%). Only 3% of participants selected the agricultural sector in response to this question (Figure 3).
On a department level, the department characterized by the largest amount of waste, according to participants, is that of cold cuts and cheese (23%), followed by the fruits and vegetables department (22%), the bakery department (16%), and the fresh meat department (11%). According to participants, the department most affected by unrecorded food waste is the fruits and vegetables department, and for all departments, waste was said to be concentrated in the summer period and in the first quarter of the year.
3.2. Causes of Food Waste as Identified in Focus Groups
Participants mentioned a total of 228 causes of food waste during the nine focus groups by writing each of them on a sticky note. Each sticky note was fully discussed during the focus groups to ensure that the intended meaning was well understood by other participants and the facilitator. Five types of causes were identified during the data analysis stage (see Appendix A for a full list).
Technical issues (12 sticky notes, 5% of the total): Poor infrastructure in stores was mentioned by several participants, especially those working at smaller stores. Specifically, old refrigerators and insufficient maintenance were reported as the main cause of malfunctions and breakdowns that resulted in the discarding of products placed in said refrigerators. Another issue mentioned by several participants is the inappropriate temperature within the stores sometimes, which results in the stores being too hot to ensure the preservation of products on the shelves.
«Temperature drops are a serious issue.»Quote (1G8)
Human-related issues (34 sticky notes, 15% of the total): Several participants mentioned causes related to reckless handling of products during transportation (resulting in the discard of products on arrival) or in stores during shelf restocking. Another issue mentioned is the possible lack of attention to the rotation of products by store staff, causing products approaching their expiration date to be left behind new ones.
«In almost every pallet, there is a broken product, especially at the edges.»Quote 2(FG1)
«In some cases, the carelessness (of employees) led to the waste of entire pallets.»Quote 3(FG5)
Customers’ behavior (46 sticky notes, 20% of the total): Many causes mentioned by participants relate to inappropriate behavior by customers that result in the accidental or intentional damaging of products. These behaviors include touching fruits and vegetables, opening multi-packs, and leaving fresh foods outside the refrigerators. The volatility of consumers’ preferences—resulting in sudden changes in purchasing trends or turnout—was also often mentioned as a cause of food waste at stores.
«They (the customers) really lack respect.»Quote 4(FG2)
«They do not realize that when packaging is damaged, we have to throw the product.»Quote 5(FG2)
«They think that stuff is nobody’s; they touch, they taste … they wouldn’t do it at the greengrocer.»Quote 6(FG5)
Sales management (118 sticky notes, 52% of the total): Inaccurate sales forecasting—due to difficulties in predicting the quantity of products that will be demanded by consumers—was often mentioned as a cause of food waste. The same issue was mentioned in relation to internal production of bread and cooked foods at the store. Other important issues related to sales management include the choice (made at the chain level) to remove items from the shelves, days before their expiration date and the well-established habit of overfilling shelves to attract customers.
«The mandate to have full shelves implies that we order more products than we will ever sell.»Quote 7(FG6)
«Even at the end of the day, I have to keep the shelves full.»Quote 8(FG4)
«In the fruits and vegetables department, we have to make piles of products. Can you imagine what happens to the products under the pile? Yet, in the end, customers look for abundance, so what shall we do? We need to do the piles.»Quote9(FG1)
Other (18 sticky notes, 8% of the total): Some causes of food waste relate to circumstances and factors that cannot be controlled at the store level, such as weather or unexpected drops in demand.
«They say in the news that blueberry is good for the health, and the week after, you can only sell blueberry juice. All other juices remain on the shelves.»Quote 10(FG7)
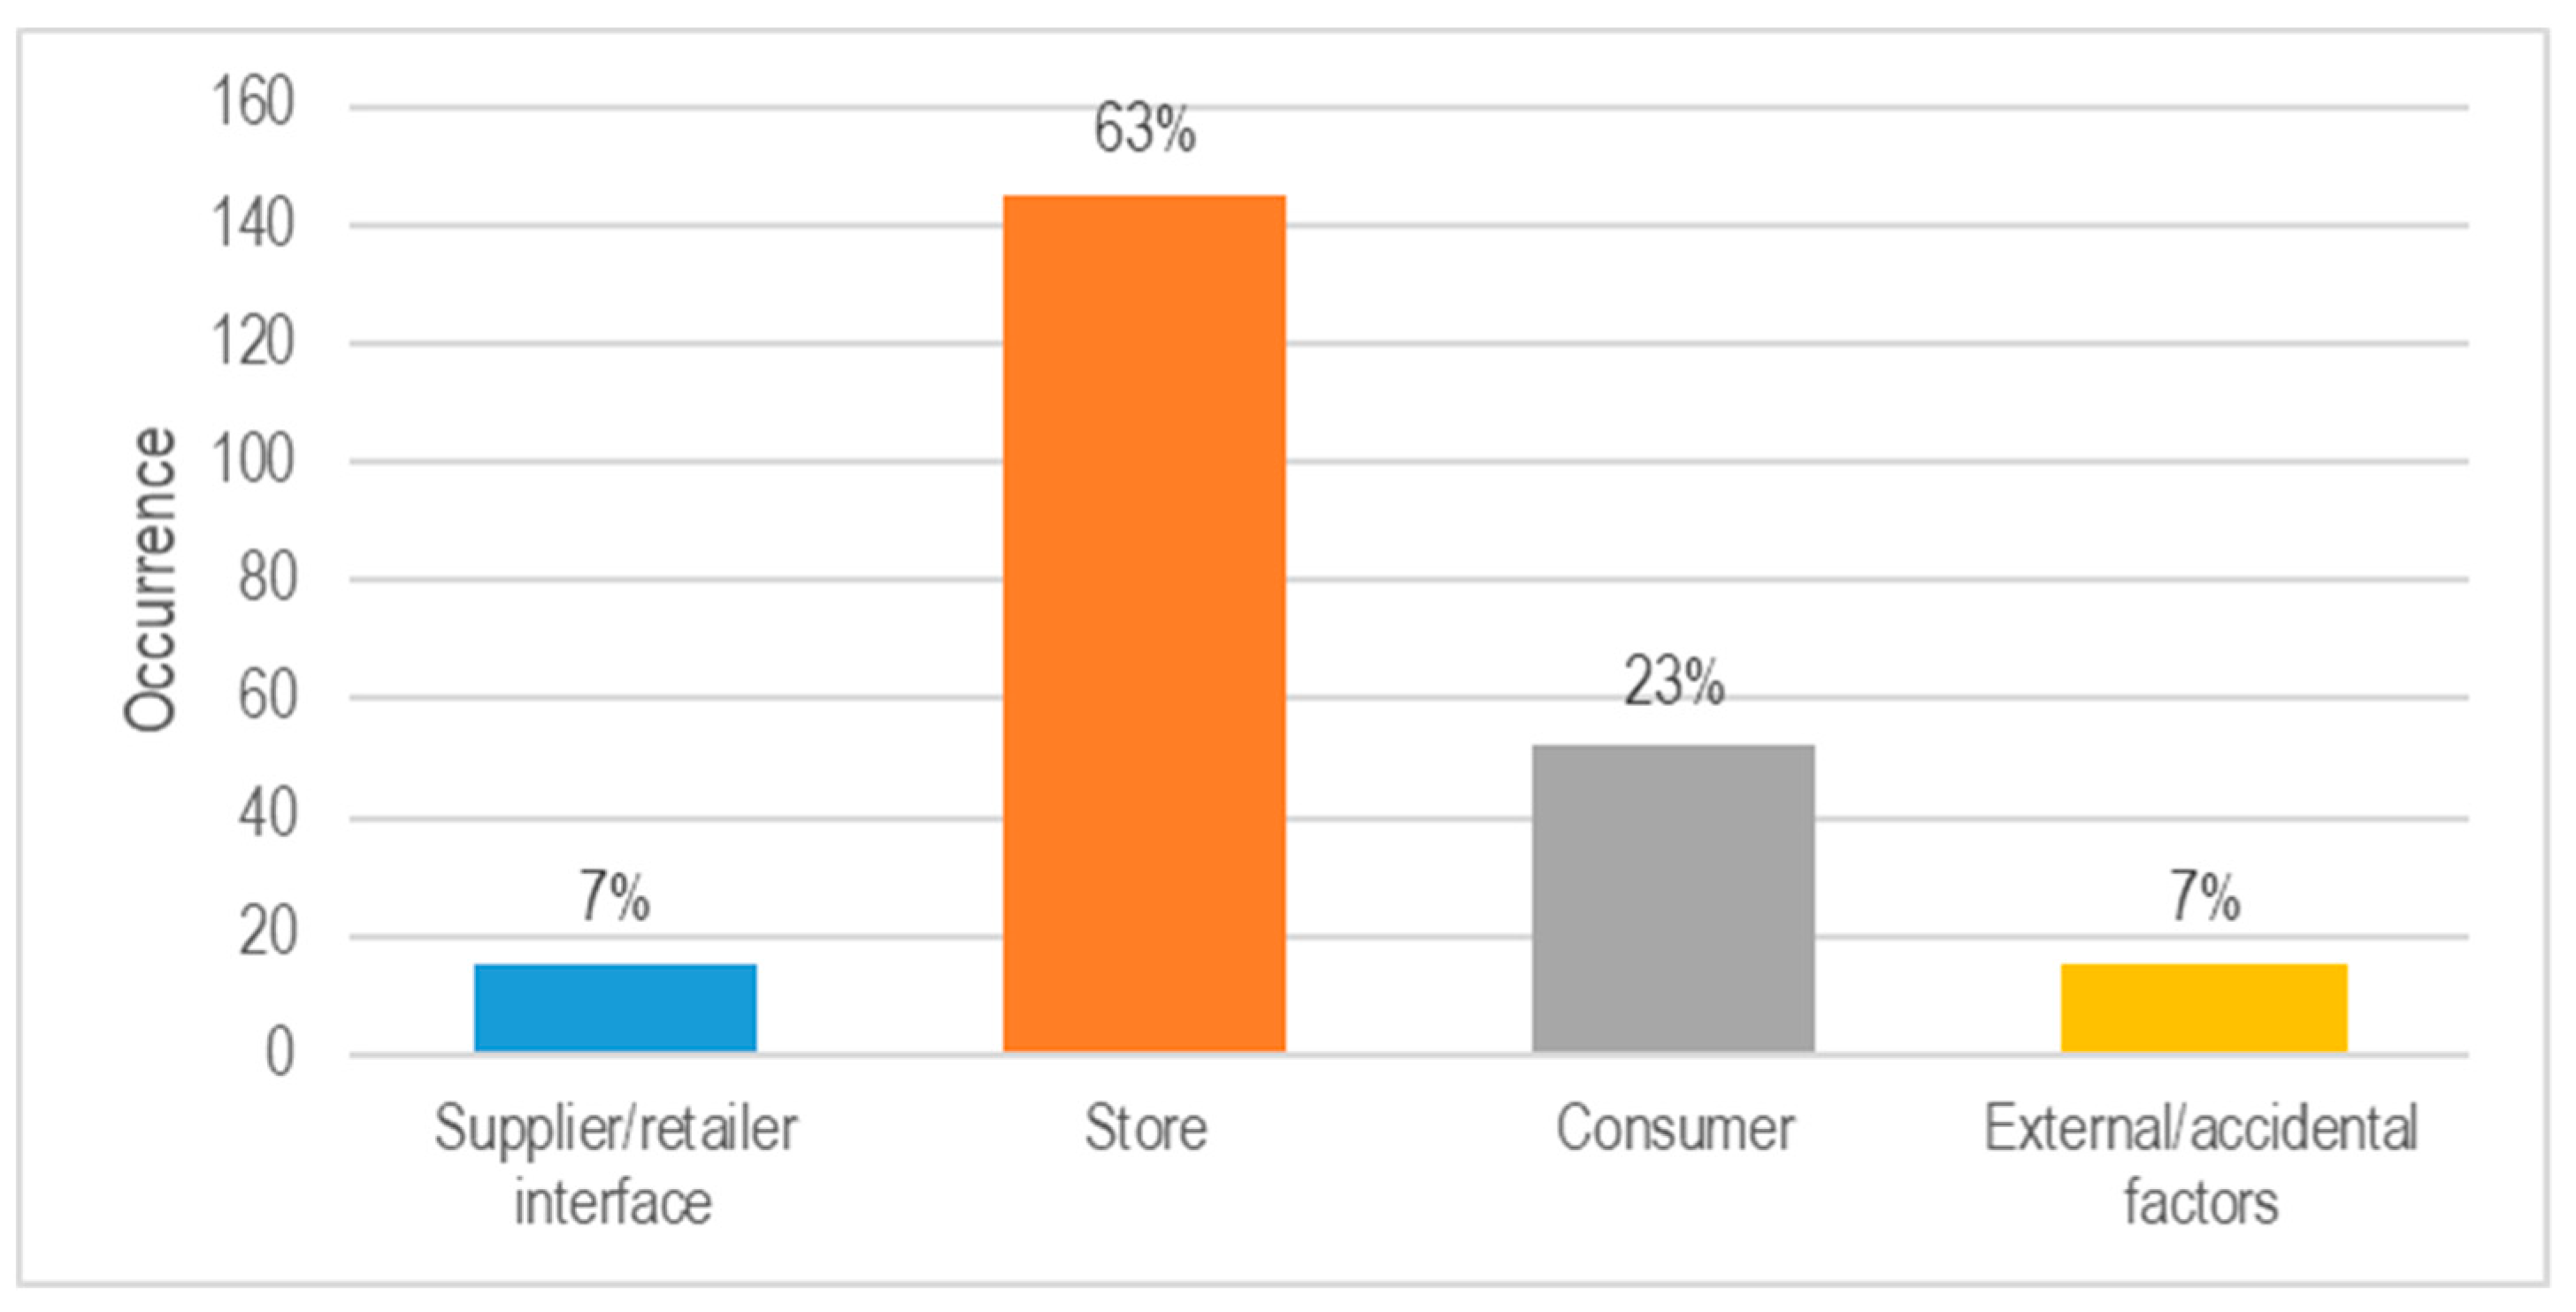
During the second round of analysis, each of the sticky notes reporting one of the above-mentioned causes was interpreted in terms of the responsibility of food chain actors (i.e., the four groups of supply chain operations listed in the methodology section). The assigned responsibility of each group was calculated by counting how many causes had a clear relation to the group. Figure 4 shows the results, with 63% of causes relating to store operations, 23% relating to consumers, and lower percentages of causes (7% each) relating to the first and fourth groups of chain operations.
Among operations occurring in the supplier/retailer interface, those related to the wholesale phase (nine occurrences) and the food industry phase (five occurrences) were more often considered as causes of food waste, while causes related to logistics were only mentioned twice.
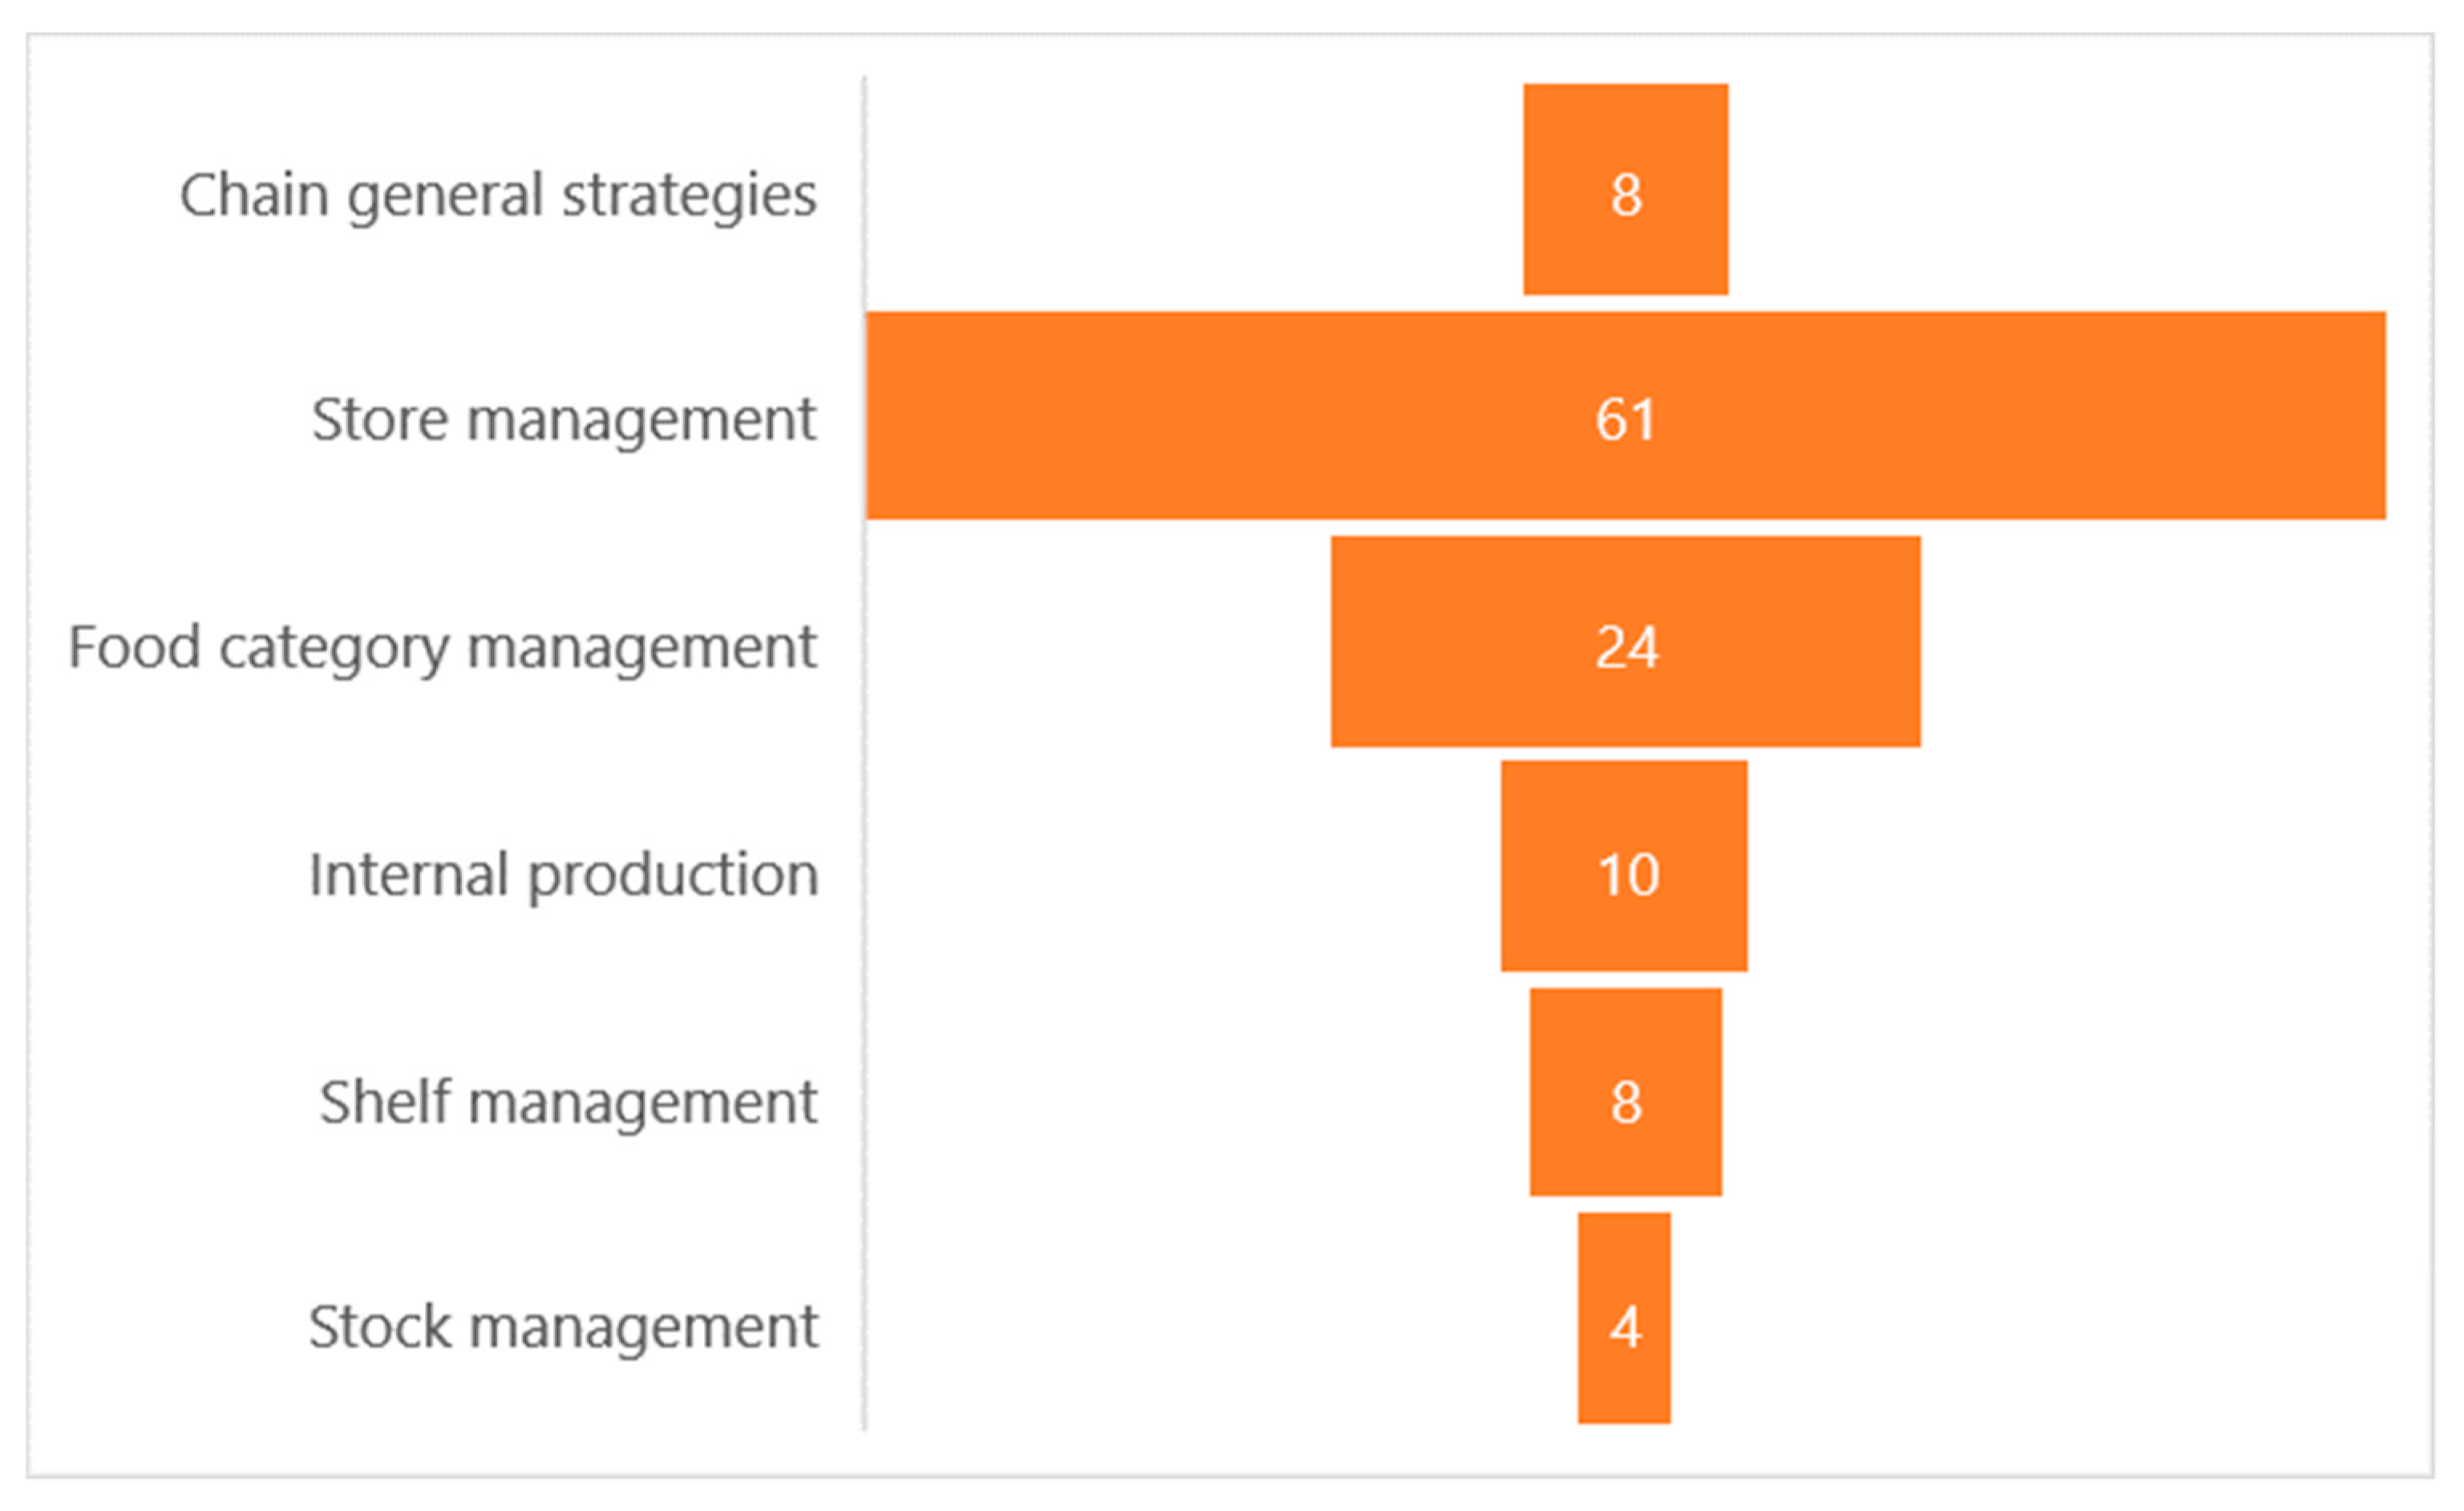
Causes related to in-store operations were analyzed in more detail, resulting in the funnel chart displayed in Figure 5.
Shelf management and other choices made at the store level were more often considered to be responsible for food waste generated in stores. With regard to shelf management, the inaccuracy of staff in applying the FIFO (First-In First-Out) approach was mentioned by several participants, along with poor attention to proper product handling. As for store management, the problematic desire of store managers to always have full shelves was very often mentioned by participants.
3.3. Actions against Food Waste as Identified in Focus Groups
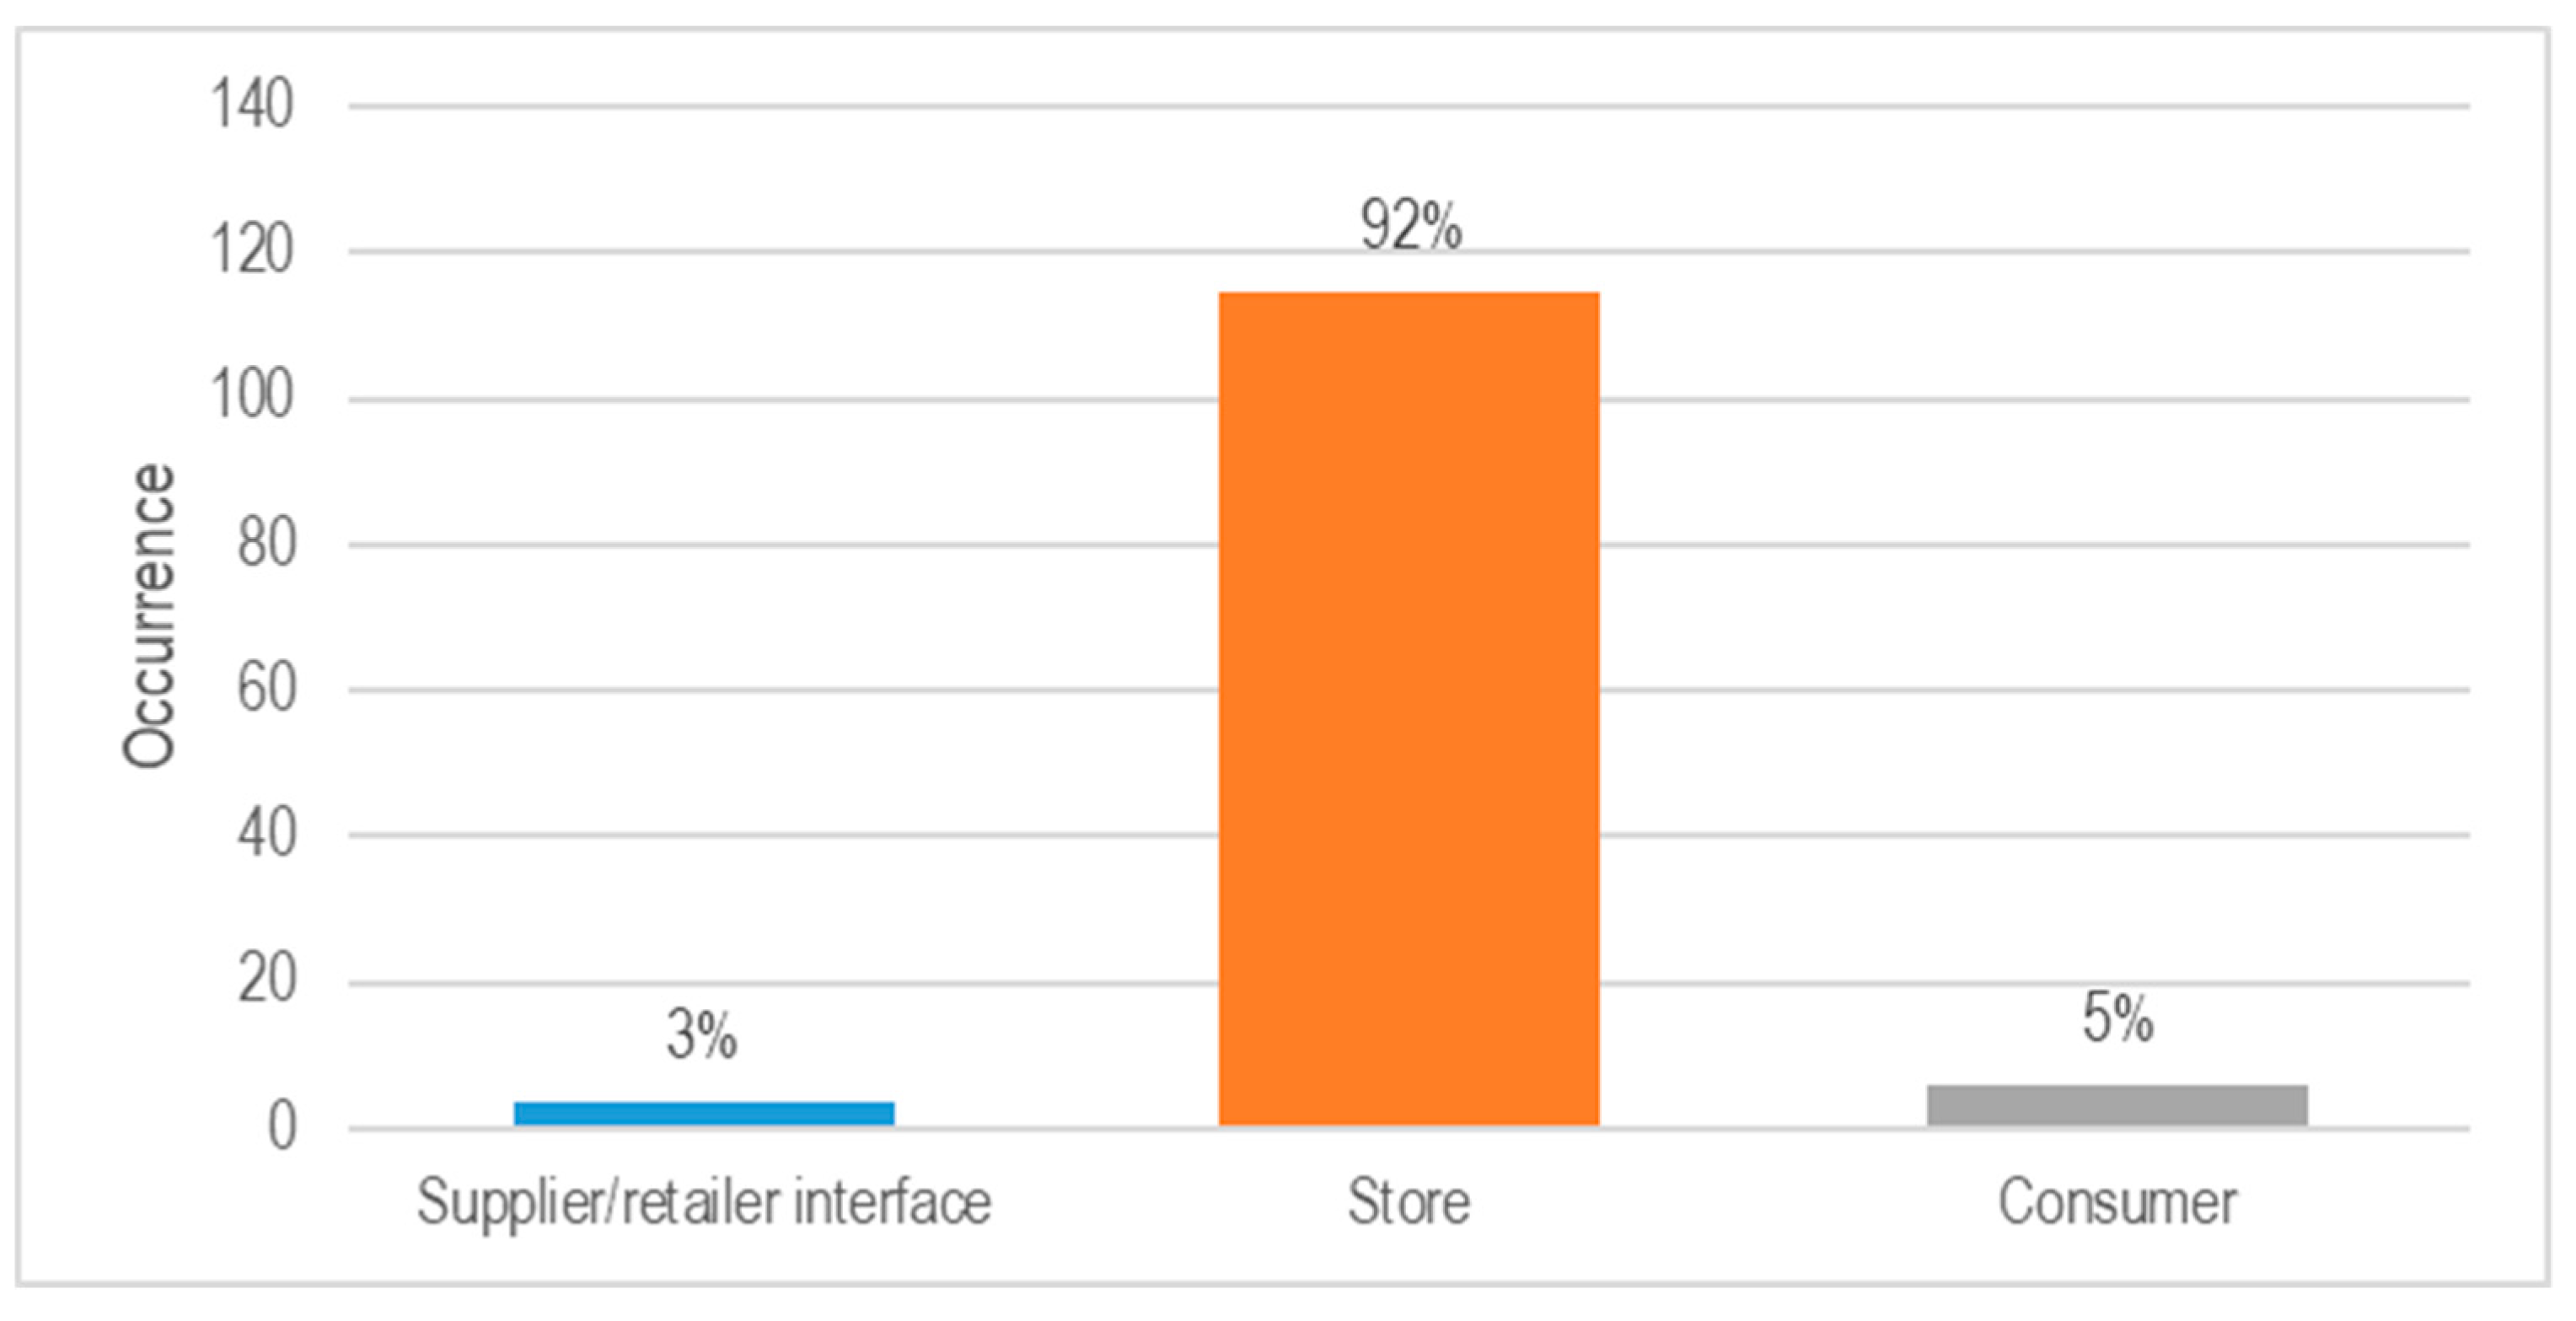
Almost all of the 124 actions mentioned by participants were related to in-store operations (Figure 6). Most of the actions suggested (see Appendix A for a full list) suggested that qualification and attention of personnel should be improved. Others proposed changes in sales management; specifically, modifications to product display and assortment on one hand, and a greater accuracy in organizing promotions, on the other hand, were frequently mentioned. The need of an improved internal communication among the store staff, especially across different hierarchical levels was mentioned in seven sticky notes; two participants included among the actions against food waste the need to “listen to feedbacks of the food category managers” while another mentioned that a greater trust among staff member would reduce the quantity of food waste produced at stores. The need to improve customer awareness towards food waste was reported in eight sticky notes, six of which suggested that it is a responsibility of the customer to behave well at the store.
Figure 7 is a funnel chart representing a breakdown of proposed actions across the different store-related operations. It is evident that food category managers assign responsibility for actions against food waste to the managers that supervise them. As many as 61 out of the total 124 actions mentioned in the focus groups are considered to be the responsibility of store managers. Among these actions, the possibility of revising the stores’ product display policy and its variety is often mentioned.
«A full shelf is attractive, but some days, half of the food is thrown away.»Quote 11(FG8)
The next group most responsible for taking action against food waste, according to food category managers, is themselves. Such actions particularly relate to improving accuracy when placing orders and managing promotions.
«Sometimes we have similar products on offer at the same time.»Quote 12(FG3)
According to the food category managers, the store staff they directly supervise have lower responsibility for taking action against food waste. Proposed actions for these staff mostly pertain to the amount of attention put into restocking shelves and handling products. Staff commitment to avoiding waste in the cooked foods department by reusing leftover items in the next preparations were also mentioned several times in the focus groups.
«For sure, some leftovers may be reused as ingredients for food preparation in the next days, but we do not have enough time.»Quote 13(FG9)
«For instance, some types of bread are really the same, only with a different shape. Maybe baking less bread would be better.»Quote 14(FG2)
Another issue that appears central, especially for staff working at the counter where fresh products are sold by weight, is the need to establish positive relationships with customers. Many participants considered the existence of such relationships to be crucial for pushing sales and, as a result, avoiding the waste of perishable products.
«Staff working in a specific context are well aware of how to deal with their customers.»Quote 15(FG6)
It should be mentioned that only 1 participant out of 67 mentioned food redistribution as a possible action against food waste during the focus group discussions.
4. Discussion
Retail food waste only represents a small fraction of total food waste along the supply chain [8]; however, when asked to select the stage of the supply chain that generates the largest amount of waste, food category managers selected the retail stage as their response (Figure 3). This skewed perception contrasts with the common tendency of interviewees to blame other actors for incorrect food waste-related behaviors [42]. Handling food waste every day during their jobs may play a role in this perception. Food category managers’ interest in the food waste issue was confirmed by responses provided to the question “How important is food waste reduction to the society?”, for which more than 95% of the managers responded that food waste is a very important issue in society.
Most of the causes of retail food waste identified in this study are well-known in the literature [16,17,25,27], confirming the external validity of the methodological approach adopted here; however, the findings from the focus groups provide a different point of view for analyzing in-store food waste and identifying preventive actions.
Although food category managers often mentioned consumer behavior as a cause of food waste [43] (due to lack of respect while handling food at the supermarket), the managers recognized that store staff and upper level management were still the actors mainly responsible for retail food waste generation (Figure 4). In some cases, the responsibility was not clearly assigned, for instance, with regard to the need to display abundance in the fresh sector (fruit, vegetables, and bread) or the role of competition that encourages single stores or chains to push for promotions. In the rare cases that the food category managers admitted to playing a role in the generation of food waste, the root cause was identified as a lack of time.
Store managers were held as most responsible for in-store food waste generation due to their power to decide the priorities of the store (Figure 5 and Figure 6). Indeed, among the potential actions against food waste mentioned by the food category managers, many fall under the responsibility of store managers (Figure 7). This confirms the moral burden that store managers must deal with while managing stores [19], and the importance of targeting them during information campaigns and in policies aiming to reduce food waste in supermarkets [12,26,44]. It should be mentioned that the prioritization of food waste reduction can have positive effects on the reputation and image of a store in the local community [19]. Economic incentives can also be implemented at the policy level, as in the case of Italy where waste tax discounts are offered to retailers who donate surplus food [16].
One of the recurring observations during the focus group discussion was the willingness of food category managers to provide suggestions and help to upper-level management on how best to reduce food waste. Indeed, one of the actions most frequently cited by the food category managers as a possible solution to retail food waste is an enhanced communication system in stores—specifically, the need for information exchange across all “hierarchical” levels, which should result in more efficient management of food products. This reveals a commitment to the cause and a feeling of being voiceless with reference to the issue.
Most of the causes identified in the focus groups are consistent with previous research [45]; however, what is different is the general sense of powerlessness of the actors interviewed—the food category managers seldom reported that they could instigate changes in the practices identified as food waste drivers. There is a reported sense of “being excluded” from the decision-making process by upper-level management, who report that (i) they are already doing as much as possible, and (ii) that some waste drivers, such as wrong forecasting, cannot be improved or depend too much on unpredictable factors.
The first action that should be recommended at the retail level to address food waste is the creation of a clear accountability system for all involved actors through cooperation and information exchange. If the different actors of the store communicate, they may be able to establish new shared procedures to avoid food waste and, thus, improve accountability for each department of the store. The promotion of in-store contests among departments could be a good instrument to promote in-store food waste reduction by engaging employees in the prevention of food waste. Including food waste reduction strategies in the training of new employees could also be a preventive action, as it fosters a common commitment among staff to reduce waste. Selling suboptimal products at a discounted price and re-using leftovers as ingredients for new preparations were also cited as possible solutions to food waste.
As mentioned, consumers still play a role in the generation of food waste at the retail level. Awareness–raising campaigns have been frequently mentioned as effective actions against food waste. These campaigns could not only emphasize that food waste is bad for the environment/society but also stress the consequences of specific actions made in the store, such as what happens to products that are touched, moved, and abandoned during the purchasing process [46]. Encouraging consumers to plan their shopping in advance is another frequently proposed action for reducing food waste [47,48]. The food category managers mentioned that higher supervision of departments in smaller stores discouraged poor behavior from customers, while customers in large stores were more likely to incorrectly handle products due to lower supervision and because they felt that the products did not belong to anyone. Of course, an improved supervision in both environments could be of help to discourage such bad practices from the client.
It should be mentioned that only one manager mentioned food donation as a possible action against food waste. This finding is not supportive of the recent push on research and policy actions aimed at enhancing the donation of surplus food from the retail sector to charities [15,16,21,22,44] and could be explained by a lack of knowledge about this practice in the Italian context. Indeed, a study conducted in Germany with semi-structured interviews reported high engagement of retailers in the redistribution of surplus food [49]. This is a lost opportunity for the Italian retailers, considering that a law against food waste approved by the Italian Parliament in 2016 mentions, among its main objectives, an aim to promote food donation by retail stores through strong economic incentives (e.g., waste tax reduction) [23]. More effort should be put on promoting the benefits of this law for retailers who donate: the involvement of local municipalities is also crucial at this stage, as they are responsible for the waste tax management.
Regarding the debated issue of take-back agreements among suppliers and retailers, one food category manager mentioned that:
Food waste is much lower when take-back agreements are in place.Quote 16(FG4)
It seems that the store staff prefers to send surplus products back to supplier rather than throwing them out at the supermarket. Literature has demonstrated that take-back agreements increase, rather than decrease, the quantity of food waste in a supply chain perspective [50] and food category managers are probably aware that these foods will be discarded anyway. Nonetheless, they likely prefer avoiding the responsibility of throwing out food, shifting it to somebody else.
Consistent with the causes highlighted, most of the actions proposed fall under the responsibility of the store management. It is important to note that, according to food category managers, many causes related to the chain general strategies can potentially be addressed by management on the individual store level. For instance, demand forecasting, frequent staff turnover, and “always full shelves” are considered individual store choices that could be changed independently of the chain and regardless of competitors’ choices. In reality, the response of store managers to food waste is hindered by the lack of flexibility of corporate chain strategies and rules [44]. Improving communication both among in-store hierarchical levels and between retailers and other actors in the chain is frequently mentioned as a potential strategy for the prevention of food waste [25].
Finally, it is important to mention the main limitation of the present study, which is that it reflects solely the opinions and ideas of food category managers. From past studies on food waste in other stages of the food supply chain, we know that the issue generates strong feelings, cognitive biases, and a strong tendency to self- absolve while blaming others [51]. While this study highlighted the possibility of increasing commitment to food waste reduction in stores through the improvement of communication and accountability among staff, it also demonstrated that so far, small and routine actions that generate food waste are hard to be recalled and rationally detected [12,51].
5. Conclusions
Although the retail sector produces a relatively small share of food waste relative to other stages of the food supply chain, increased attention is being paid to food waste at supermarkets. This study discloses the in-store dynamics that result in the generation of food waste from an internal perspective, i.e., by directly involving food category managers in a discussion about food waste. Food category managers rest at the center of the stores’ organization and thus have a privileged corner from which they can observe food waste-related operations in their stores.
To gather information about causes of food waste and potential preventive actions, this study adopted a qualitative approach, using focus groups to foster discussion among a selection of food category managers and then designing a structured procedure to analyze the resulting information.
The results of the study offered some important insights. First, food category managers assume the retail sector to be responsible for the largest amount of food waste generation across the food supply chain, which is not actually true. This may be due either to a lack of information about waste produced at other stages or as a direct consequence of daily exposure to food waste at their supermarkets. Second, the discussions held during focus groups revealed that food category managers consider the decisions of store management to be a key factor in preventing or favoring food waste. Third, a general positive attitude towards food waste prevention was observed among food category managers, which is important if any action is to be taken at the store level. This responsible and constructive attitude is reflected in the proposed actions for reducing waste. These actions were not limited to improving supplier and consumer habits, which, from the category managers’ perspective, are external actors; rather, they focused mainly on potential improvements in the organization and management of stores.
This study suggests that the voices and opinions of retail staff are a good source for further analyzing the causes of food waste, as new and important information emerged from the focus group discussions. The contribution of the food category managers in the identification of potential actions against food waste in retail stores was also valuable. This confirms that the involvement of such personnel in these studies, and their engagement in the implementation of actions, may bring advantages to the stores’ management and to society as a whole.
Author Contributions
Conceptualization, C.C. and S.F.; methodology, E.B.; data curation, A.M.; writing—original draft preparation, C.C. and C.G.; writing—review and editing, E.B. and S.F.; visualization, A.M.; supervision, S.F.; project administration, S.F. All authors have read and agreed to the published version of the manuscript.
Funding
This research is a part of the REDUCE project funded by the Italian Ministry of the Environment [RINDEC-2015-0000088] and coordinated by Alma Mater Studiorum University of Bologna. The general aim of the project is to contribute to reducing food waste at the national level by quantifying food waste in Italy and proposing preventive measures to reduce food waste at different stages of the food supply chain.
Acknowledgments
Giulia Avolio, Barbara Pancino and Nicolò Passeri contributed to the management of the focus groups together with the authors. Luca Falasconi coordinated the REDUCE project. The authors acknowledge the managers of the stores involved in the study and the stores’ staff who participated to the focus groups.
Conflicts of Interest
The authors declare no conflict of interest.
Appendix A
This appendix reports the procedure of coding of the sticky notes, both for the causes of food waste and for the actions against its generation.
For each set of sticky notes (228 for the causes and 124 for the actions) a list of the most recurrent contents is shown in the following tables. Table A1 reports a list of the content of sticky notes about causes of food waste at retail stores, while Table A2 includes the list of potential actions.
Literal translation of the individual sticky notes is not provided because several of the sticky notes required a discussion during the focus group to be fully understood. In this case, the researchers added notes on the original sticky notes, to report their real meaning to the analysis.

Table A1.
Content of sticky notes about CAUSES of food waste at retail stores.
| Content of Sticky Notes | Explanation | Macro-Category | Number of Notes |
|---|---|---|---|
| Attention to expiration dates | Lack of attention by store’s staff, poor product rotation | Human-related issues | 7 |
| Personnel qualification | Lack of knowledge by stores’ staff about how to deal with products | Human-related issues | 19 |
| Other human-related issues | Lack fo personnel, lack of attention | Human-related issues | 8 |
| Assortment | Too many products on assortment | Sales management | 13 |
| Display | Too many products on the shelves | Sales management | 12 |
| Orders | Surplus food ordered (intentionally or by mistake) | Sales management | 18 |
| Perishability | Spoiling of perishable products | Sales management | 45 |
| Promotions | Surplus products for promotions, unsuccessful promotions | Sales management | 19 |
| Other management issues | Products of low quality in assortment, problems with suppliers | Sales management | 11 |
| Misbehavior | Spoiling of products touched/broken by customers, theft of parts of the products | Customers’ behavior | 23 |
| Safety concerns | Products approaching the expiration date left on the shelves | Customers’ behavior | 3 |
| Customer satisfaction | Trust, unsatisfactory products | Customers’ behavior | 6 |
| Discontinuity in customers’ flow | Instability of customers’ habitudes of food purchasing | Customers’ behavior | 14 |
| Technical issues | Malfunction of fridges, air conditioning, cold-chain efficiency | Technical issues | 12 |
| Competitors | Promotions by competitors | Other | 3 |
| Seasonality | Seasonal preferences, higher spoiling during hot season | Other | 8 |
| Trends of the demand | General modification of preferences (e.g., less meat in the diet) | Other | 7 |
| Total | 228 |
Table A2.
Content of sticky notes about ACTIONS against food waste at retail stores.
| Content of Sticky Notes | Explanation | Macro-Category | Number of Notes |
|---|---|---|---|
| Improve staff qualification/attention | Training, greater accuracy in product handling, higher control on customers | Human-related issues | 33 |
| Date-based pricing | Reduced price for items approaching the expiration date | Sales management | 6 |
| More efficient orders | Avoid surplus orders, improve forecasting | Sales management | 11 |
| Revise assortment/display | Better choice of products, higher quality, less products on the shelves | Sales management | 11 |
| Tailored promotions | Avoid too many promotions, better selection of products on offer | Sales management | 14 |
| Take-back agreements | Establish take-back agreements with suppliers | Sales management | 2 |
| Customer awareness | Inform consumers about how to handle products, information signs against waste | Customers’ behavior | 8 |
| Maintenance | Renovation and maintenance of facilities and refrigerators | Technical issues | 14 |
| Communication and trust among staff | Listening to feedback by other staff members, sharing of marketing strategies | - | 7 |
| Reuse | Reuse of products for other preparations, redistribution | - | 3 |
| Relation with neighborhood | Social responsibility activities, communication | - | 2 |
| Other | Better organization at the store, revision of protocols of products’ management | - | 13 |
| Total | 124 |
References
- United Nations. Sustainable Development Goals. Available online: https://www.un.org/sustainabledevelopment/ (accessed on 10 June 2020).
- Parfitt, J.; Barthel, M.; Macnaughton, S. Food waste within food supply chains: Quantification and potential for change to 2050. Philos. Trans. R. Soc. B Biol. Sci. 2010, 365, 3065–3081. [Google Scholar] [CrossRef] [PubMed] [Green Version]
- Papargyropoulou, E.; Lozano, R.; Steinberger, J.K.; Wright, N.; Ujang, Z. Bin The food waste hierarchy as a framework for the management of food surplus and food waste. J. Clean. Prod. 2014, 76, 106–115. [Google Scholar] [CrossRef]
- Östergren, K. FUSIONS Definitional Frameword for Food Waste (FP7-Rapport); 2014. European Commission (FP7), Coordination and Support Action–CSA. Available online: https://www.eu-fusions.org/phocadownload/Publications/FUSIONS%20Definitional%20Framework%20for%20Food%20Waste%202014.pdf (accessed on 10 June 2020).
- Gustavsson, J.; Cederberg, C.; Sonesson, U. Global Food Losses and Food Waste; FAO: Rome, Italy, 2011. [Google Scholar]
- Stuart, T. Waste—Uncovering the Global Food Scandal; Penguin Books, Ed.; Penguin Books: London, UK, 2009. [Google Scholar]
- Franco, S.; Cicatiello, C. Food waste due to over-nutrition in the Italians’ dietary habits. Riv. Studi Sulla Sostenibilità 2018, 1, 159–180. [Google Scholar] [CrossRef]
- Stenmarck, Å.; Jensen, C.; Quested, T.; Moates, G.; Buksti, M.; Cseh, B.; Juul, S.; Parry, A.; Politano, A.; Redlingshofer, B.; et al. Estimates of European Food Waste Levels: Reducing Food Waste through Social Innovation; 2016. European Commission (FP7), Coordination and Support Action—CSA. Available online: https://www.eu-fusions.org/phocadownload/Publications/Estimates%20of%20European%20food%20waste%20levels.pdf (accessed on 10 June 2020).
- Chen, C.R.; Chen, R.J. Using two government food waste recognition programs to understand current reducing food loss and waste activities in the US. Sustainability 2018, 10, 2760. [Google Scholar] [CrossRef] [Green Version]
- Katajajuuri, J.M.; Silvennoinen, K.; Hartikainen, H.; Heikkilä, L.; Reinikainen, A. Food waste in the Finnish food chain. J. Clean. Prod. 2014, 73, 322–329. [Google Scholar] [CrossRef]
- Beretta, C.; Stoessel, F.; Baier, U.; Hellweg, S. Quantifying food losses and the potential for reduction in Switzerland. Waste Manag. 2013, 33, 764–773. [Google Scholar] [CrossRef] [Green Version]
- Cicatiello, C.; Franco, S. Disclosure and assessment of unrecorded food waste at retail stores. J. Retail. Consum. Serv. 2020, 52, 101932. [Google Scholar] [CrossRef]
- World Resource Institute. Food Loss and Waste Accounting and Reporting Standard. 2016. Available online: https://flwprotocol.org/wp-content/uploads/2017/05/FLW_Standard_final_2016.pdf (accessed on 29 June 2020).
- Eriksson, M.; Persson Osowski, C.; Malefors, C.; Björkman, J.; Eriksson, E. Quantification of food waste in public catering services—A case study from a Swedish municipality. Waste Manag. 2017, 61, 415–422. [Google Scholar] [CrossRef]
- Cicatiello, C.; Franco, S.; Pancino, B.; Blasi, E. The value of food waste: An exploratory study on retailing. J. Retail. Consum. Serv. 2016, 30, 96–104. [Google Scholar] [CrossRef]
- Lebersorger, S.; Schneider, F. Food loss rates at the food retail, influencing factors and reasons as a basis for waste prevention measures. Waste Manag. 2014, 34, 1911–1919. [Google Scholar] [CrossRef]
- Cicatiello, C.; Franco, S.; Pancino, B.; Blasi, E.; Falasconi, L. The dark side of retail food waste: Evidences from in-store data. Resour. Conserv. Recycl. 2017, 125, 273–281. [Google Scholar] [CrossRef]
- Cicatiello, C.; Giordano, C. Measuring household food waste at national level: A systematic review on methods and results. CAB Rev. Perspect. Agric. Vet. Sci. Nutr. Nat. Resour. 2018, 13, 1–8. [Google Scholar] [CrossRef]
- Gruber, V.; Holweg, C.; Teller, C. What a waste! Exploring the human reality of food waste from the store manager’s perspective. J. Public Policy Mark. 2016, 35, 3–25. [Google Scholar] [CrossRef]
- Young, C.W.; Russell, S.V.; Robinson, C.A.; Chintakayala, P.K. Sustainable Retailing—Influencing Consumer Behaviour on Food Waste. Bus. Strategy Environ. 2018, 27, 1–15. [Google Scholar] [CrossRef] [Green Version]
- Giuseppe, A.; Enea, M.; Muriana, C. Economic benefits from food recovery at the retail stage: An application to Italian food chains. Waste Manag. 2014, 34, 1306–1316. [Google Scholar] [CrossRef]
- Alexander, C.; Smaje, C. Surplus retail food redistribution: An analysis of a third sector model. Resour. Conserv. Recycl. 2008, 52, 1290–1298. [Google Scholar] [CrossRef]
- Giordano, C.; Falasconi, L.; Cicatiello, C.; Pancino, B. The role of food waste hierarchy in addressing policy and research: A comparative analysis. J. Clean. Prod. 2020, 252, 119617. [Google Scholar] [CrossRef]
- Papargyropoulou, E.; Wright, N.; Lozano, R.; Steinberger, J.; Padfield, R.; Ujang, Z. Conceptual framework for the study of food waste generation and prevention in the hospitality sector. Waste Manag. 2016, 49, 326–336. [Google Scholar] [CrossRef]
- De Moraes, C.C.; de Oliveira Costa, F.H.; Roberta Pereira, C.; da Silva, A.L.; Delai, I. Retail food waste: Mapping causes and reduction practices. J. Clean. Prod. 2020, 256, 120124. [Google Scholar] [CrossRef]
- Mena, C.; Adenso-Diaz, B.; Yurt, O. The causes of food waste in the supplier–retailer interface: Evidences from the UK and Spain. Resour. Conserv. Recycl. 2011, 55, 648–658. [Google Scholar] [CrossRef]
- Eriksson, M. Retail Food Wastage: A Case Study Approach to Quantities and Causes; Lantbruksuniv; Sveriges: Uppsala, Sweden, 2012; ISBN 978-91-576-9107-1. [Google Scholar]
- Giordano, C.; Alboni, F.; Cicatiello, C.; Falasconi, L. Do discounted food products end up in the bin? An investigation into the link between deal-prone shopping behaviour and quantities of household food waste. Int. J. Consum. Stud. 2019, 43, 199–209. [Google Scholar] [CrossRef]
- Giordano, C.; Piras, S.; Boschini, M.; Falasconi, L. Are questionnaires a reliable method to measure food waste? A pilot study on Italian households. Br. Food J. 2018, 120, 2885–2897. [Google Scholar] [CrossRef]
- Farr-Wharton, G.; Foth, M.; Choi, J.H.-J. Identifying factors that promote consumer behaviours causing expired domestic food waste. J. Consum. Behav. 2014, 13, 393–402. [Google Scholar] [CrossRef] [Green Version]
- Aschemann-Witzel, J.; Jensen, J.H.; Jensen, M.H.; Kulikovskaja, V. Consumer behaviour towards price-reduced suboptimal foods in the supermarket and the relation to food waste in households. Appetite 2017, 116, 246–258. [Google Scholar] [CrossRef] [PubMed]
- Soma, T. Gifting, ridding and the “everyday mundane”: The role of class and privilege in food waste generation in Indonesia. Local Environ. 2017, 22, 1444–1460. [Google Scholar] [CrossRef]
- Roselund, J.; Nyblon, Å.; Matschke Ekholm, H.; Sorme, L. The emergence of food waste as an issue in Swedish retail. Br. Food J. 2020. ahead-of-print. [Google Scholar]
- Refsgaard, K.; Magnussen, K. Household behaviour and attitudes with respect to recycling food waste—Experiences from focus groups. J. Environ. Manag. 2009, 90, 760–771. [Google Scholar] [CrossRef]
- Eriksson, M.; Strid, I.; Hansson, P.A. Food losses in six Swedish retail stores: Wastage of fruit and vegetables in relation to quantities delivered. Resour. Conserv. Recycl. 2012, 68, 14–20. [Google Scholar] [CrossRef]
- Fereday, J.; Muir-Cochrane, E. Demonstrating rigor using thematic analysis: A hybrid approach of inductive and deductive coding and theme development. Int. J. Qual. Methods 2006, 5, 80–92. [Google Scholar] [CrossRef]
- Boyatzis, R.E. Transforming Qualitative Information: Thematic Analysis and Code Development; SAGE: Thousand Oaks, CA, USA, 1998; ISBN 0761909613. [Google Scholar]
- Crabtree, B.F.; Miller, W.F. A Template Approach to Text Analysis: Developing and Using Codebooks; SAGE: Thousand Oaks, CA, USA, 1992. [Google Scholar]
- Priefer, C.; Jörissen, J.; Bräutigam, K.R. Technology Options for Feeding 10 Billion People. Options for Cutting Food Waste. Sci. Technol. Options Assess. Eur. Parliam. Bruss. Belg. 2013. Report. Available online: https://www.europarl.europa.eu/RegData/etudes/etudes/join/2013/513515/IPOL-JOIN_ET%282013%29513515_EN.pdf (accessed on 28 July 2020).
- Bos-Brouwers, H.E.J.; Soethoudt, J.M.; Canali, M.; Östergren, K.; Amani, P.; Aramyan, L.; Sijtsema, S.J.; Korhonen, O.; O’Connor, C. Drivers of Current Food Waste Generation, Threats of Future Increase and Opportunities for Reduction; FUSIONS N FP7-KBBE-2012-6-311972; The European Commission, FP7-Coordination and Support Action. 2014. Available online: https://www.wur.nl/en/Publication-details.htm?publicationId=publication-way-343833323936 (accessed on 28 July 2020).
- Devin, B.; Richards, C. Food Waste, Power, and Corporate Social Responsibility in the Australian Food Supply Chain. J. Bus. Ethics 2018, 150, 199–210. [Google Scholar] [CrossRef]
- Falasconi, L.; Cicatiello, C.; Franco, S.; Segrè, A.; Setti, M.; Vittuari, M. Such a shame! A study on self-perception of household food waste. Sustainability 2019, 11, 270. [Google Scholar] [CrossRef] [Green Version]
- Evans, D. Blaming the consumer—Once again: The social and material contexts of everyday food waste practices in some English households. Crit. Public Health 2011, 21, 429–440. [Google Scholar] [CrossRef]
- Filimonau, V.; Gherbin, A. An exploratory study of food waste management practices in the UK grocery retail sector. J. Clean. Prod. 2017, 167, 1184–1194. [Google Scholar] [CrossRef] [Green Version]
- Teller, C.; Holweg, C.; Reiner, G.; Kotzab, H. Retail store operations and food waste. J. Clean. Prod. 2018, 185, 981–997. [Google Scholar] [CrossRef] [Green Version]
- Block, L.G.; Keller, P.A.; Vallen, B.; Williamson, S.; Birau, M.M.; Grinstein, A.; Haws, K.L.; LaBarge, M.C.; Lamberton, C.; Moore, E.S.; et al. The Squander Sequence: Understanding Food Waste at Each Stage of the Consumer Decision-Making Process. J. Public Policy Mark. 2016, 35, 292–304. [Google Scholar] [CrossRef]
- Principato, L. Food Waste at Consumer Level: A Comprehensive Literature Review; Springer International Publishing, Ed.; Springer: Cham, Switzerland, 2018. [Google Scholar]
- Stefan, V.; van Herpen, E.; Tudoran, A.A.; Lähteenmäki, L. Avoiding food waste by Romanian consumers: The importance of planning and shopping routines. Food Qual. Prefer. 2013, 28, 375–381. [Google Scholar] [CrossRef]
- David, H.; Meike, R.; Vera, B. Food waste reduction practices in German food retail. Br. Food J. 2017, 119, 2532–2546. [Google Scholar]
- Eriksson, M.; Ghosh, R.; Mattsson, L.; Ismatov, A. Take-back agreements in the perspective of food waste generation at the supplier-retailer interface. Resour. Conserv. Recycl. 2017, 122, 83–93. [Google Scholar] [CrossRef]
- Giordano, C.; Alboni, F.; Falasconi, L. Quantities, Determinants, and Awareness of Households’ Food Waste in Italy: A Comparison between Diary and Questionnaires Quantities. Sustainability 2019, 11, 3381. [Google Scholar] [CrossRef] [Green Version]
Figure 1.
Quantity (internal ring) and value (external ring) of waste broken down by food category.

Figure 2.
Conceptual design of the assignment of causes to sources of responsibility.
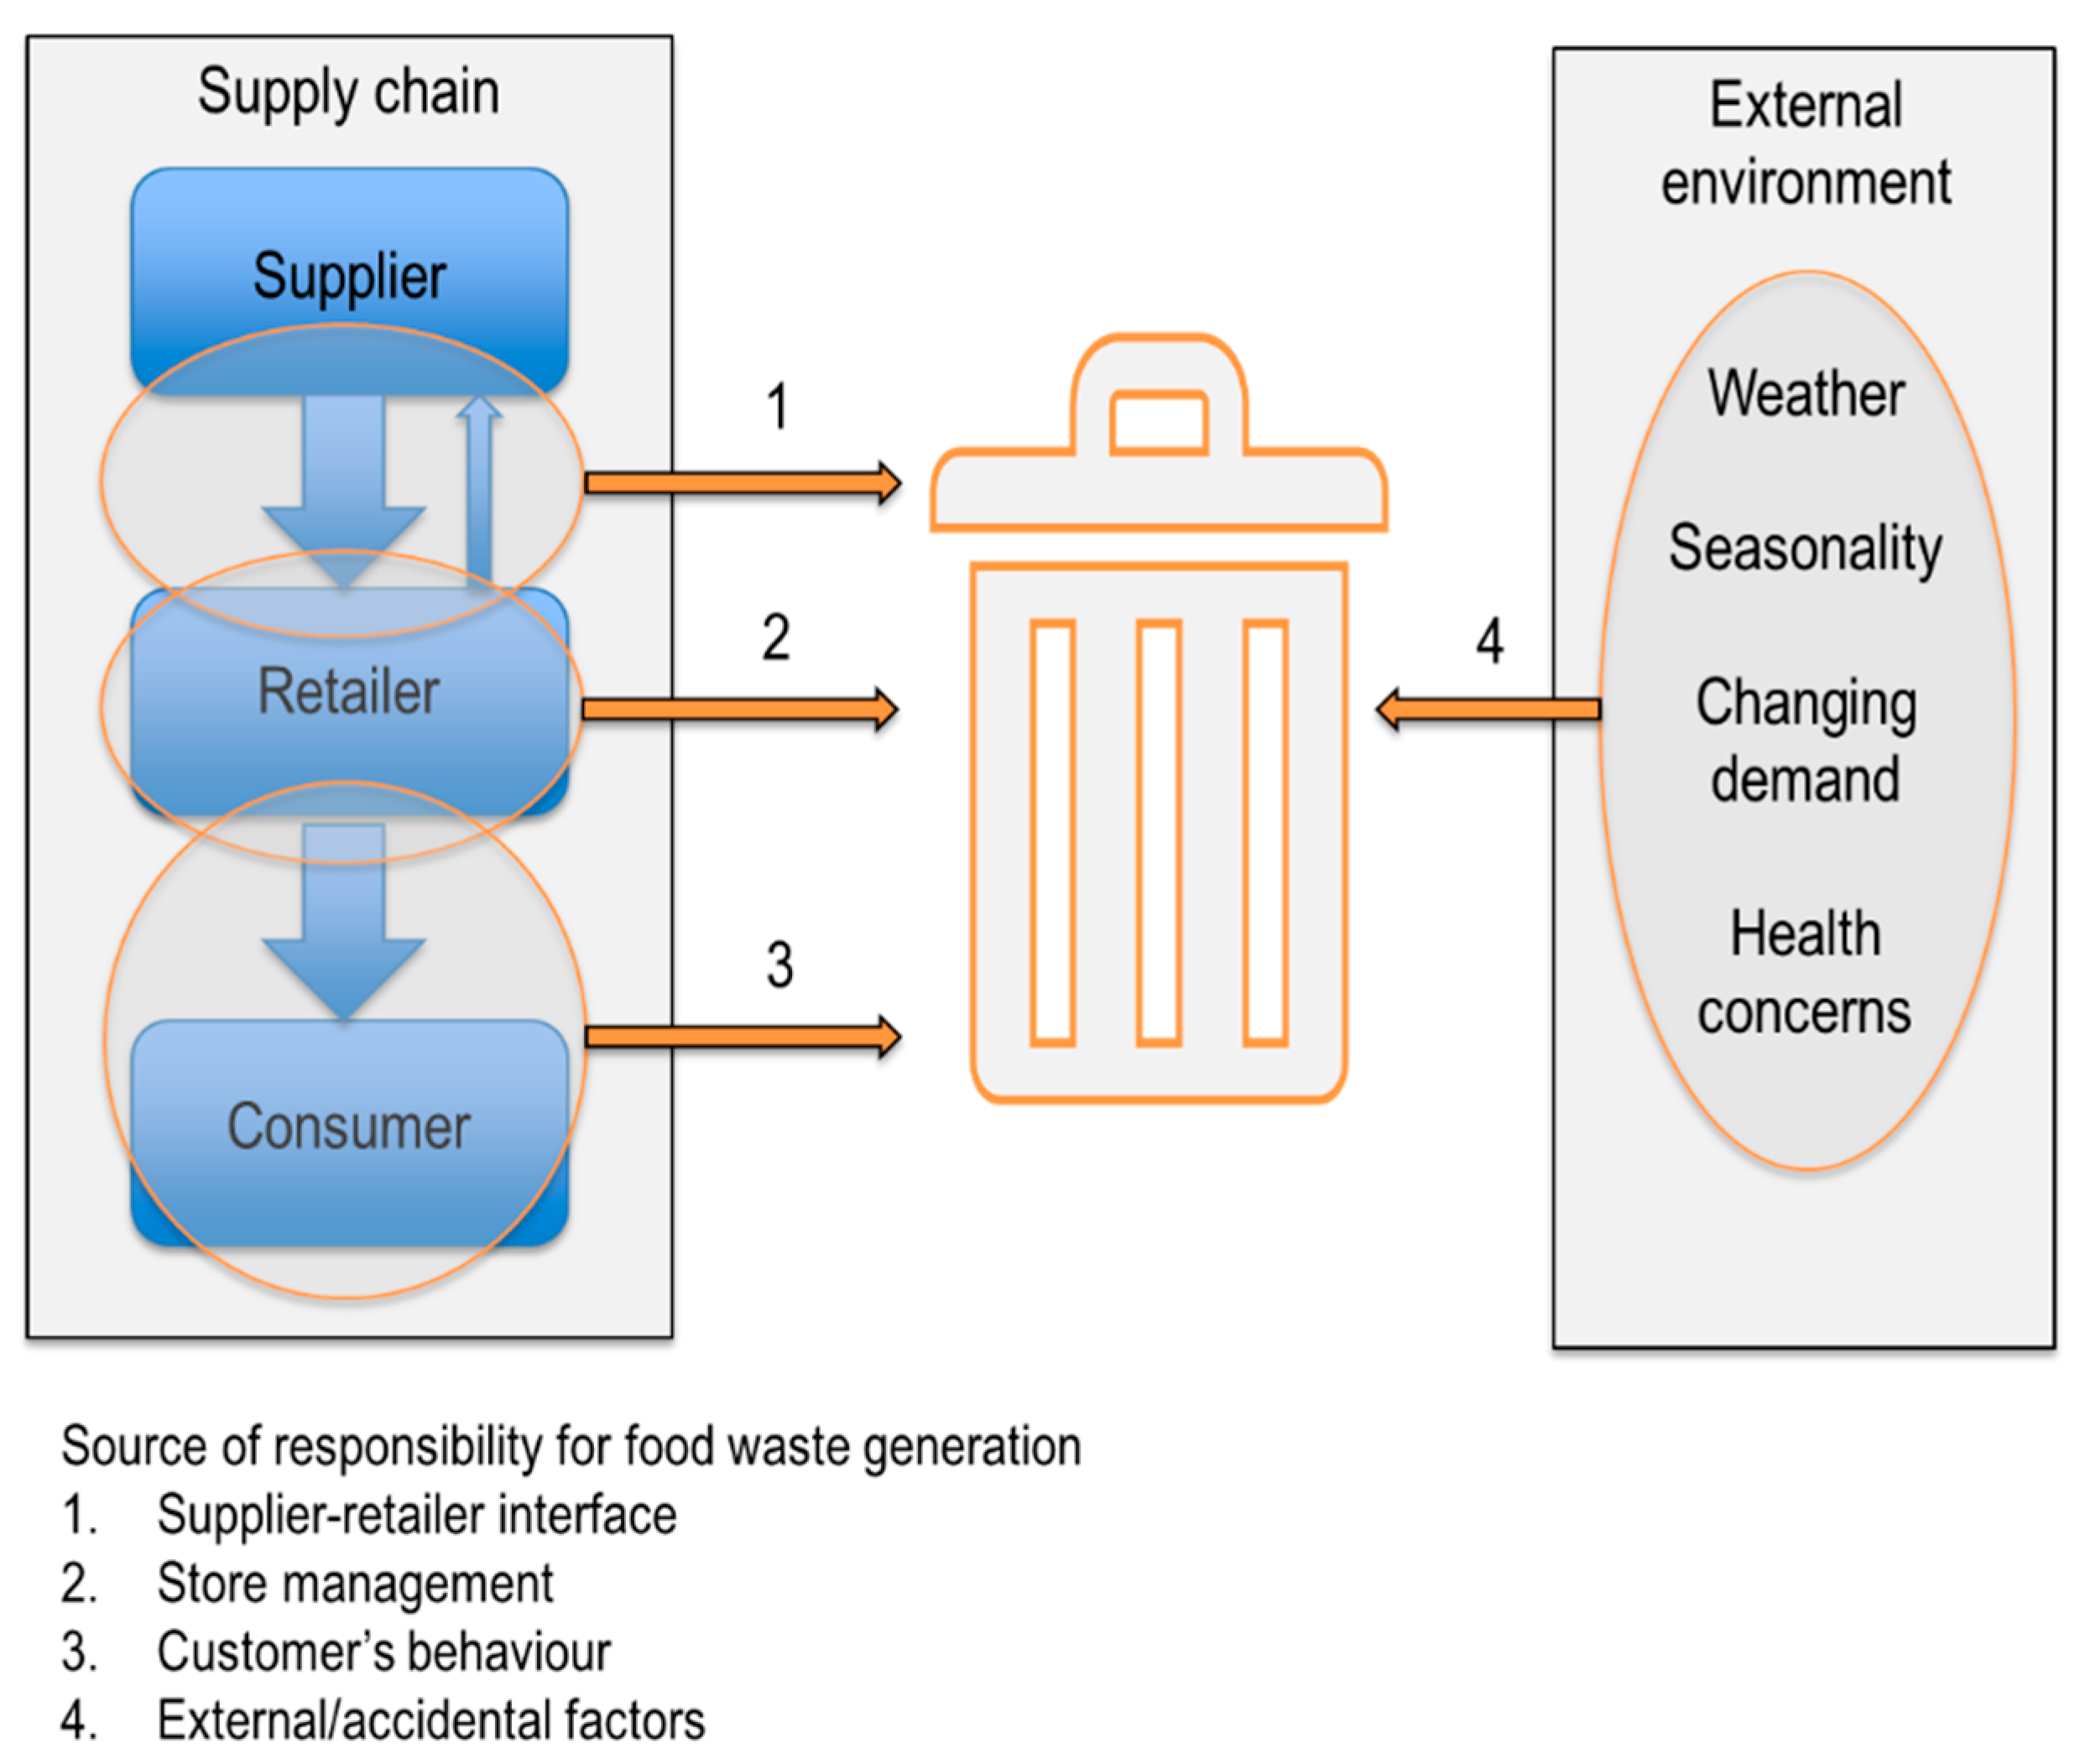
Figure 3.
Response to the question: “In your opinion, what is the stage of the food supply chain producing more food waste?”.
Figure 3.
Response to the question: “In your opinion, what is the stage of the food supply chain producing more food waste?”.

Figure 4.
Retail food waste causes attributed to each group of supply chain operations (N = 228).

Figure 5.
Retail food waste causes broken down by store-related operations (N = 145).
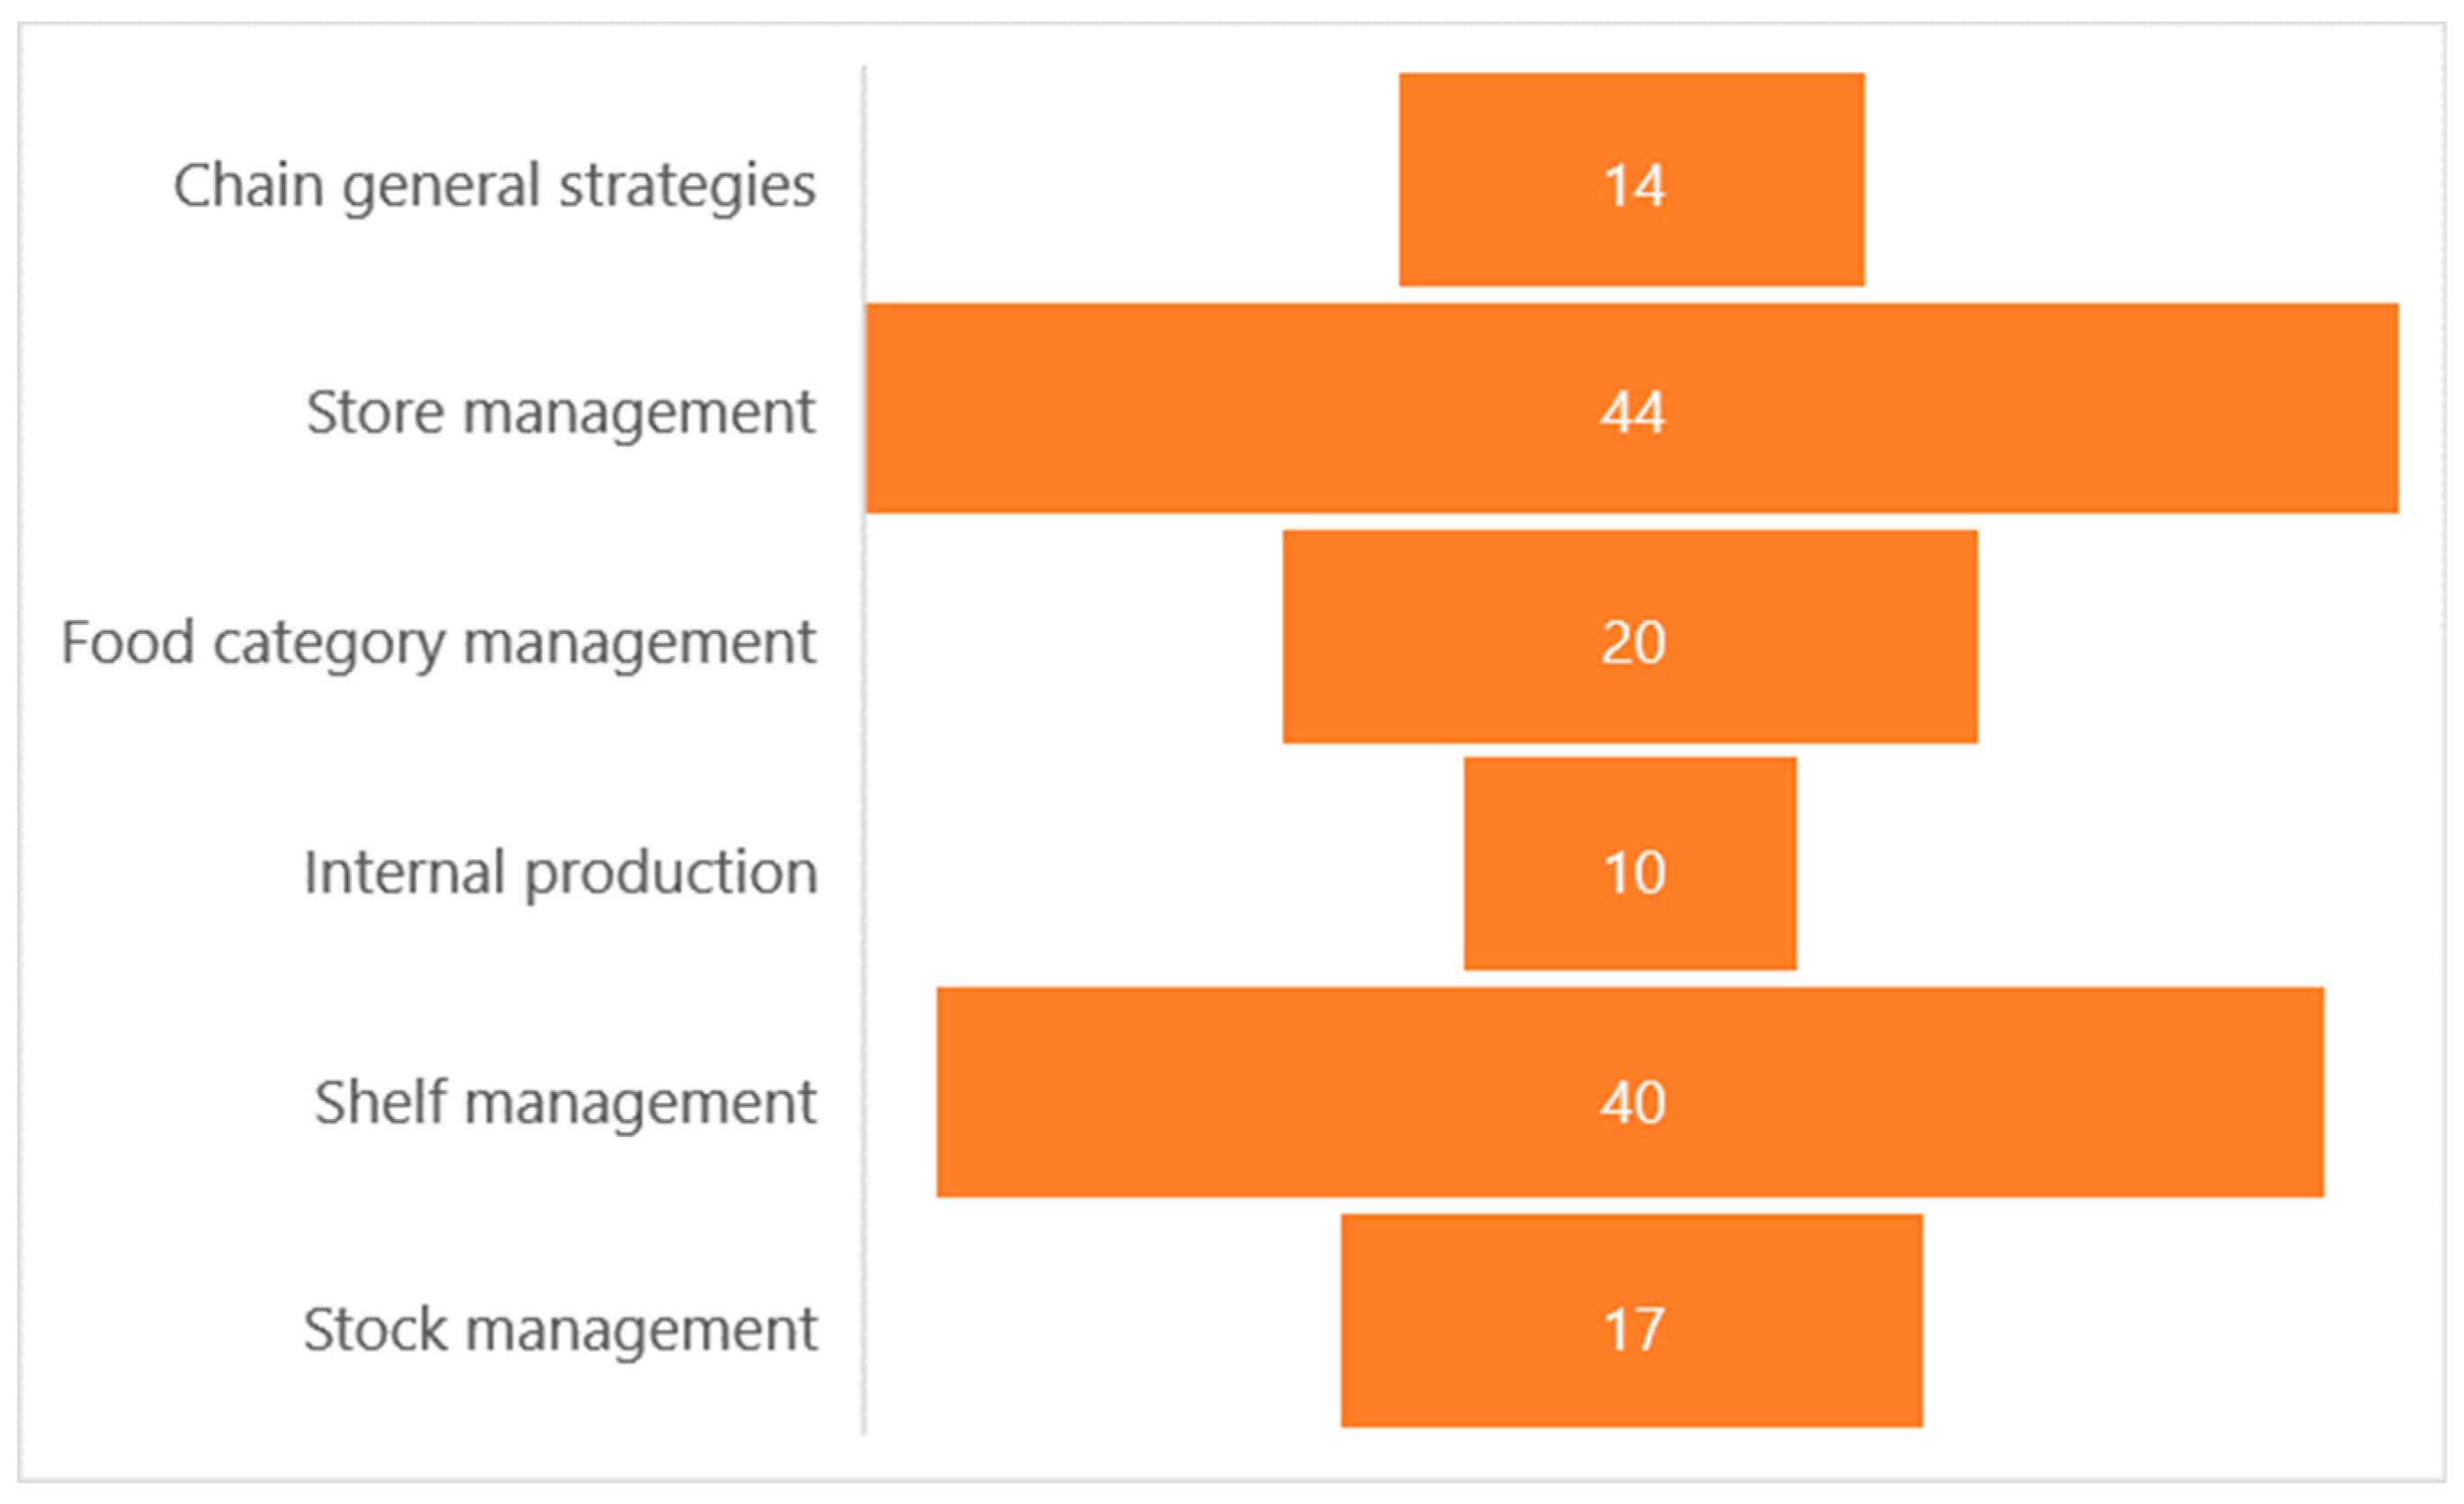
Figure 6.
Breakdown of retail waste reduction actions by groups of supply chain operations (N = 124).
Figure 6.
Breakdown of retail waste reduction actions by groups of supply chain operations (N = 124).

Figure 7.
Actions against retail food waste broken down by store-related operations (N = 115).

Table 1.
Features of the stores involved in the study.
| Stores | Sales Area (m2) | Yearly Turnover (Thousand €) | Population of the Municipality (Residents) |
|---|---|---|---|
| S1 | 1500–2500 | 10,000–12,500 | 10,000–50,000 |
| S2 | 1000–1500 | 7500–10,000 | 100,000–250,000 |
| S3 | 1000–1500 | 7500–10,000 | <10,000 |
| S4 | 1000–1500 | 7500–10,000 | 10,000–50,000 |
| S5 | 1000–1500 | 10,000–12,500 | 10,000–50,000 |
| S6 | 1000–1500 | 10,000–12,500 | 10,000–50,000 |
| S7 | 1500–2500 | 7500–10,000 | 50,000–100,000 |
| S8 | <1000 | 5000–7500 | >250,000 |
| S9 | 1000–1500 | 5000–7500 | >250,000 |
| S10 | <1000 | 5000–7500 | >250,000 |
| S11 | 1500–2500 | 10,000–12,500 | >250,000 |
| S12 | 1000–1500 | 10,000–12,500 | 50,000–100,000 |
| S13 | 1000–1500 | 5000–7500 | >250,000 |
| S14 | >2500 | >12,500 | 50,000–100,000 |
| S15 | >2500 | >12,500 | 10,000–50,000 |
| S16 | >2500 | >12,500 | 100,000–250,000 |
Table 2.
Quantity and value of food waste recorded in the 16 stores in one year.
| Stores | Quantity of Food Waste Recorded (kg) | Value of Food Waste Recorded (€) 1 |
|---|---|---|
| S1 | 40,518 | 176,476 |
| S2 | 22,353 | 80,043 |
| S3 | 22,579 | 140,929 |
| S4 | 25,949 | 139,100 |
| S5 | 31,499 | 194,651 |
| S6 | 39,307 | 198,796 |
| S7 | 20,181 | 76,188 |
| S8 | 16,788 | 70,254 |
| S9 | 20,974 | 82,544 |
| S10 | 15,057 | 62,165 |
| S11 | 37,416 | 178,595 |
| S12 | 33,578 | 153,895 |
| S13 | 20,346 | 75,695 |
| S14 | 54,650 | 154,165 |
| S15 | 27,107 | 86,699 |
| S16 | 39,328 | 144,340 |
1 The value of food waste is expressed as the selling price (including VAT) for stores S1–S13, while it is recorded as cost (excluding VAT) for stores S14–S16. This is due to different waste accounting procedures across stores of different dimensions.
Table 3.
Calendar and organization of focus group sessions.
| Focus Groups | Date | Stores Involved | Location | N. Participants | Researchers |
|---|---|---|---|---|---|
| FG1 | Day 1—morning | S16 | Meeting room at S16 | 8 | R1, R3 |
| FG2 | Day 1—afternoon | S14 | Meeting room at S14 | 4 | R1, R2 |
| FG3 | Day 2—morning (in parallel with FG4) | S2, S3, S4, S5 | Distribution center A | 10 | R1, R4 |
| FG4 | Day 2—morning (in parallel with FG4) | S1, S3, S4, S5 | Distribution center A | 11 | R2, R6 |
| FG5 | Day 2—afternoon | S15 | Meeting room at S15 | 7 | R1, R2 |
| FG6 | Day 3—morning (in parallel with FG7) | S8, S9, S13 | Distribution center B | 5 | R1, R4 |
| FG7 | Day 3—morning (in parallel with FG6) | S8, S9, S13 | Distribution center B | 6 | R2, R5 |
| FG8 | Day 3—afternoon (in parallel with FG9) | S6, S7, S11, S12 | Distribution center B | 9 | R1, R4 |
| FG9 | Day 3—afternoon (in parallel with FG8) | S6, S7, S11, S12 | Distribution center B | 7 | R2, R5 |
Publisher’s Note: MDPI stays neutral with regard to jurisdictional claims in published maps and institutional affiliations. |
© 2020 by the authors. Licensee MDPI, Basel, Switzerland. This article is an open access article distributed under the terms and conditions of the Creative Commons Attribution (CC BY) license (http://creativecommons.org/licenses/by/4.0/).
Share and Cite
MDPI and ACS Style
Cicatiello, C.; Blasi, E.; Giordano, C.; Martella, A.; Franco, S. “If only I Could Decide”: Opinions of Food Category Managers on in-Store Food Waste. Sustainability 2020, 12, 8592. https://0-doi-org.brum.beds.ac.uk/10.3390/su12208592
AMA Style
Cicatiello C, Blasi E, Giordano C, Martella A, Franco S. “If only I Could Decide”: Opinions of Food Category Managers on in-Store Food Waste. Sustainability. 2020; 12(20):8592. https://0-doi-org.brum.beds.ac.uk/10.3390/su12208592
Chicago/Turabian StyleCicatiello, Clara, Emanuele Blasi, Claudia Giordano, Angelo Martella, and Silvio Franco. 2020. "“If only I Could Decide”: Opinions of Food Category Managers on in-Store Food Waste" Sustainability 12, no. 20: 8592. https://0-doi-org.brum.beds.ac.uk/10.3390/su12208592
Note that from the first issue of 2016, this journal uses article numbers instead of page numbers. See further details here.