1. Introduction
In this study, we used space syntax and geographic information systems (GIS) to examine the syntactic measures and built-environment factors that affect pedestrian volume in different land-use zones. A few previous studies have indicated that the urban spatial configuration variables used in space syntax analyses are significant determinants of pedestrian movement [
1,
2,
3,
4,
5]. For instance, Baran et al. [
1] used space syntax to examine walking activities in New Urbanist and suburban neighborhoods and found a consistent positive relationship between total utilitarian walking and two of the space syntax variables, control and global integration. Jung and Choi [
3] also used a space syntax analysis to examine the pedestrian volume in downtown Daegu, Korea, and their results suggest that the street integration variable, supplemented by the accessibility factor, was helpful in estimating pedestrian volume.
Although several researchers in the architectural and urban design fields have tried to address the connection between urban morphological factors and pedestrian volume on urban streets, the urban spatial configuration measures derived from the space syntax of the street axial line have limitations in addressing the effects of the physical and socioeconomic characteristics of the surrounding urban built environment [
6,
7]. Furthermore, the space syntax technique is unable to take into account the surrounding land use, which is a critical limitation when estimating or predicting pedestrian volume and walking activities [
8].
Because GIS is one of the most powerful tools for analyzing an urban built environment, combining GIS-based built-environment variables with space syntax has great potential in examining pedestrian walking activities. In this research, we examined whether a composite model combining space syntax metrics and built-environment variables explains more variations in the pedestrian volume on the streets of Seoul than older models. The source data are from the Seoul Pedestrian Flow Survey (2009) that covered 10,000 locations across the City of Seoul and was conducted from July 2009 to November 2009. This database contains a comprehensive and unique set of survey data that not only includes pedestrian volume by date and time but also includes specific information about geographic variables on the streets. We developed multivariate statistical models to estimate pedestrian volume, including urban morphological variables from space syntax analyses and urban built-environment variables such as density, land use, accessibility, buildings, and street design features. The key space syntax metrics in this research are global integration, local integration, and control values.
Our results from this research illustrate the determinant factors of pedestrian volume in different land-use zones and have policy implications for promoting urban vitality through pedestrian volume in a variety of land use areas. This study also has the advantages of using a composite model that combines space syntax and GIS to estimate and predict pedestrian volume and extends the usefulness of space syntax techniques in analyzing the built environment for both architectural and urban planning purposes. These analysis results can help to promote urban vitality through pedestrian volume in a variety of land use zones.
2. Literature Review
Many studies have already examined the relationship between the built environment and walking activities and found significant associations between them [
4,
9,
10,
11,
12,
13]. In particular, the 5Ds, which are density, diversity of land use, design (including safety and amenities), destination accessibility, and distance to transit, have been suggested as critical built-environment factors that affect the relationship between the built environment and pedestrian movement [
14]. The 5Ds are considered to be elements in designing walking-friendly neighborhoods [
15], and several empirical studies have found the 5Ds to have a significant relationship with walking behavior or pedestrian volume [
14,
16,
17]. Although some studies have suggested that each of the 5Ds can have a unique relationship with different types of walking, in general, “a higher level of density, land use diversity, design, destination accessibility, and distance to transit are related to a higher level of walking” [
17] (p. 3). A significant body of literature suggests that the built environment, which has often been conceptualized as the 5Ds, affects walking activity and pedestrian volume.
Configuration has also been suggested as an influential factor in walking behavior. Kang [
4] focused on the relationship between street network configurations and pedestrian volume in Seoul, Korea, and he concluded that the structure of street patterns is associated with pedestrian volume. Several studies focused on the configurational factor and found that space has its own social logic that affects human behavior, such as pedestrian movement from one place to another [
18,
19]. Those studies used space syntax to confirm the strong association between a street network’s spatial configuration and pedestrian mobility.
Space syntax is a theory that explains the consequences of human activities, such as pedestrian flow and land use, using an axial line analysis of road networks. It is a kind of spatial language that can explain the relationship between a spatial form and human behavior. The space syntax theory and its analytical methods have primarily been applied to morphological analyses of architectural design and urban forms. The space syntax theory has several computational measures that are used with axial maps in an urban context. The primary syntactic measures of space syntax are connectivity, integration, and control values that are calculated with the axial lines of the road network structure [
20]. In this context, connectivity refers to: the degree of connection that each axial line has with other axial lines, global integration indicates the degree of accessibility that each axial line has with other axial lines to enable large-scale movement, local integration indicates the degree of localized accessibility between an axial line and its adjacent axial lines, and the control value of space syntax. On the other hand, it is the sum of the inverse values for the connectivity of all neighboring axial lines, measuring “what degree of choice each space represents for its immediate neighbors as a space to move to” [
18] (p. 109). As the space syntax method has advanced, other methods for drawing the syntactic measures have become available, such as the commonly used segment analysis, for analyzing pedestrian activities.
Several space syntax-related studies [
1,
5,
18,
19,
20] have shown that space syntax theory is a useful technique for investigating pedestrian movements. According to a meta-analysis by Sharmin and Kamruzzaman [
21], four classic space syntax measures have been applied in studies and found to be relevant factors in pedestrian activity: integration, connectivity, choice, and control. They found that integration is the most frequently applied measure in studies of pedestrian movement and the built environment. In particular, several studies have shown positive associations between the integration value of street networks and pedestrian movements [
22,
23,
24,
25,
26]. Foltête and Piombini [
24] examined the effects of urban layout and landscape features on pedestrian activities in Lille, France. They indicated that local integration explained 25 percent of the variance in pedestrian frequency. They also argued that the view of squares, commercial buildings, and trees had positive associations with pedestrian movement. In contrast, Hajrasouliha and Yin [
22] examined the determinants of pedestrian volume using pedestrian counts on 302 street segments in Buffalo, New York. They found that both conventional street network connectivity and the visual connectivity of a space syntax segment analysis were positively associated with pedestrian volume, as were job density and land use mix. Similarly, Ozbil et al. [
23] found significant associations among street connectivity, land use, and pedestrian flow in their case study areas in Atlanta, Georgia.
Only a few studies have integrated space syntax measures with other built-environment variables to examine how the built environment affects walking activities. For instance, Koohsari et al. [
27] found an association between the frequency of walking for transport and the integration value. They also found that the availability of local destinations was associated with walking frequency. However, their study’s built environment was limited to the availability of local destinations, which was objectively measured by correspondents. Furthermore, the space syntax technique could not take into account the surrounding land use, which is a critical limitation when estimating or predicting pedestrian volume and walking activities [
8]. One notable study conducted by Lamíquiz and López-Domínguez [
11] applied space syntax values, such as integration and intelligibility, with land use density and land use mix as built-environment variables in a single model. Then, they investigated the relationship between the space syntax values and the built-environment variables. However, although they considered several built-environment variables, they did not consider built environments such as street design features. A recent study by Kim and Yang [
28] considered those micro-scale built environments. In their research on the vitalization factors of commercial streets, they analyzed commercial streets and their surrounding building usage, integration, and control, as well as the width of the road. Although they found that pedestrian volume tended to have a more positive relationship with the control value than integration, the relevance of their results could be limited to certain commercial streets.
Despite its limitations, space syntax theory has great potential to explain walking activity if we can combine space syntax variables and built-environment variables into analytical models. Pedestrian walking activities are associated with the surrounding built environments, such as land use, accessibility to the public transportation system, and street design features. Jiang and Claramunt [
29] pointed out that the collaborative integration of space syntax and GIS gives new perspectives to analyses of urban morphology. Furthermore, the effects of syntactic measures and built-environment variables on pedestrian volume could differ by land-use zone. Therefore, we have combined space syntax measures with variables about the surrounding built environment to analyze pedestrian volume in different land-use zones in Seoul, Korea.
Although space syntax and similar methods for analyzing spatial accessibility and its relevant attributes have been used in several studies in Korea, only a few studies used those approaches to study pedestrian volume. In particular, several studies used the same dataset and adopted approaches similar to ours to explore the relationship between street configuration and walking activity in Seoul. Kang [
4] applied the spatial design network analysis (sDNA) method in GIS to examine the effects of street network configuration and the built environment on pedestrian volume. The sDNA method measures “localized network accessibility, centrality, and navigability indices pertaining to radius-based networks, destination density, detour and flow, and link structure and shape” [
4] (p. 32). That study applied four street-network configuration metrics: closeness, betweenness, severance, and efficiency.
Two other studies used the urban network analysis (UNA) method. The UNA is similar to the space syntax method in analyzing spatial accessibility. However, the UNA measures the distance between connected elements, whereas space syntax applies topological features [
14]. Moreover, the UNA uses address points as the unit of analysis when analyzing spatial accessibility, unlike space syntax, which takes lines or segments as the unit. Therefore, the proponents of UNA claim that the UNA can incorporate spatial configuration and other relevant factors (such as land use) into its analyses. To identify how accessibility to an urban environment can influence pedestrian volume in Seoul, Kang [
14,
30] applied several spatial accessibility measures based on the UNA and other relevant variables, such as land use, land-use accessibility, location attributes, street conditions, and spatial access to pedestrian environments. Specifically, Kang [
30] focused on how spatial accessibility to nearby buildings affected pedestrian volume. That study used four indices and a UNA tool to measure accessibility, a gravity index, betweenness, straightness, and closeness. The results show that all the street accessibility indices significantly affect pedestrian volume. That study also incorporated the control metric from space syntax to measure the street layout and found that a higher control value is linked to more pedestrian volume. In the same vein, Kang [
14] integrated several spatial accessibility and street configuration measures in a multilevel regression model to investigate the effects of built-environment factors on pedestrian volume. That study used two accessibility measures, reach and gravity index, and three centrality measures, betweenness, straightness, and closeness. In particular, that study found a statistically significant relationship between pedestrian volume and the accessibility measures, which are equivalent to the space syntax measures of choice (betweenness) and integration (closeness).
The studies mentioned above revealed several significant factors that influence pedestrian volume in Seoul. Possible contributions of our study can be related to the limitations of the previous studies as follow. First, although a few studies [
31,
32,
33] emphasized the importance of a topological analysis of axial lines to pedestrian movement, a recent meta-analysis of the space syntax literature indicated that segment-based angular analyses explained pedestrian movement better than topological analyses [
21]. Furthermore, some empirical studies also confirmed the appropriateness of using segment-based angular analyses to study pedestrian movement [
21,
25,
34].
Second, the sDNA method, which was used in Kang [
4], considers local scale accessibility, because “sDNA measures localized network accessibility, centrality, and navigability indices pertaining to radius-based networks” [
4] (p. 32). Similarly, Kang [
14,
30] applied a single radius per model, although he also applied the control measure of space syntax. Although those studies used a multilevel model and incorporated several variables to address the effects of greater geographic context, their spatial accessibility measures—e.g., closeness and betweenness—reflect only local scale accessibility. Moreover, the different scales of the measures were applied separately with different network radii, rather than being applied in a single model to concurrently examine their effects. Unlike those studies, we use accessibility measures at both the local and global level (the entire system) and apply both measures together in each model.
Third, the UNA measures do not reflect only the effects of the street network configuration, instead, they represent the accessibility of individual streets to their surroundings, which can make them advantageous and sophisticated measures. However, those measures will not provide a clear picture of the spatial configuration’s effects, especially in terms of topology. Because we aim to examine the effects of street configuration in the context of other relevant factors, our model uses space syntax measures that can analyze spatial configuration in a simple manner.
Fourth, the previous studies did not adequately consider the contextual characteristics of the area within the entire city. Instead, they incorporated neighborhood attributes measured in census tract units and location attributes measured from points in the pedestrian volume survey. The census tract is a small geographic unit that possesses detailed information, but it is too small to reflect contextual information about the surrounding area. Although previous studies used multilevel regressions and applied other measures to consider the contextual effects of the greater area, such as the distance to the Central Business District (CBD), they still inadequately incorporated the aerial influence that can be captured at different geographic levels of analysis.
The most significant difference between our study and previous work is that our focus is “how street networks differently affect pedestrian volume in different land use settings.” Our logic is that land use, which is determined by zoning, is a significant contextual factor that affects pedestrian volume. Lee et al. [
35] examined spatial variations in the relationship between the built environment and pedestrian volume in the different land-use zones in Seoul, Korea. Their study, however, did not consider the topological aspect of the street configuration.
In this study, we hypothesized that different land-use zones in an area can have different interactions with street configuration and the factors relevant to pedestrian activity. Accessibility to individual buildings with varying land use might explain pedestrian activity. However, the context of an area, which can also influence pedestrian activity, cannot be completely explained without zoning information. The same degree of accessibility to a particular land use might affect pedestrian activity differently depending on the general background of an area, as expressed by zoning information. By building different models using land-use zones, we answered our research question.
3. Methodology
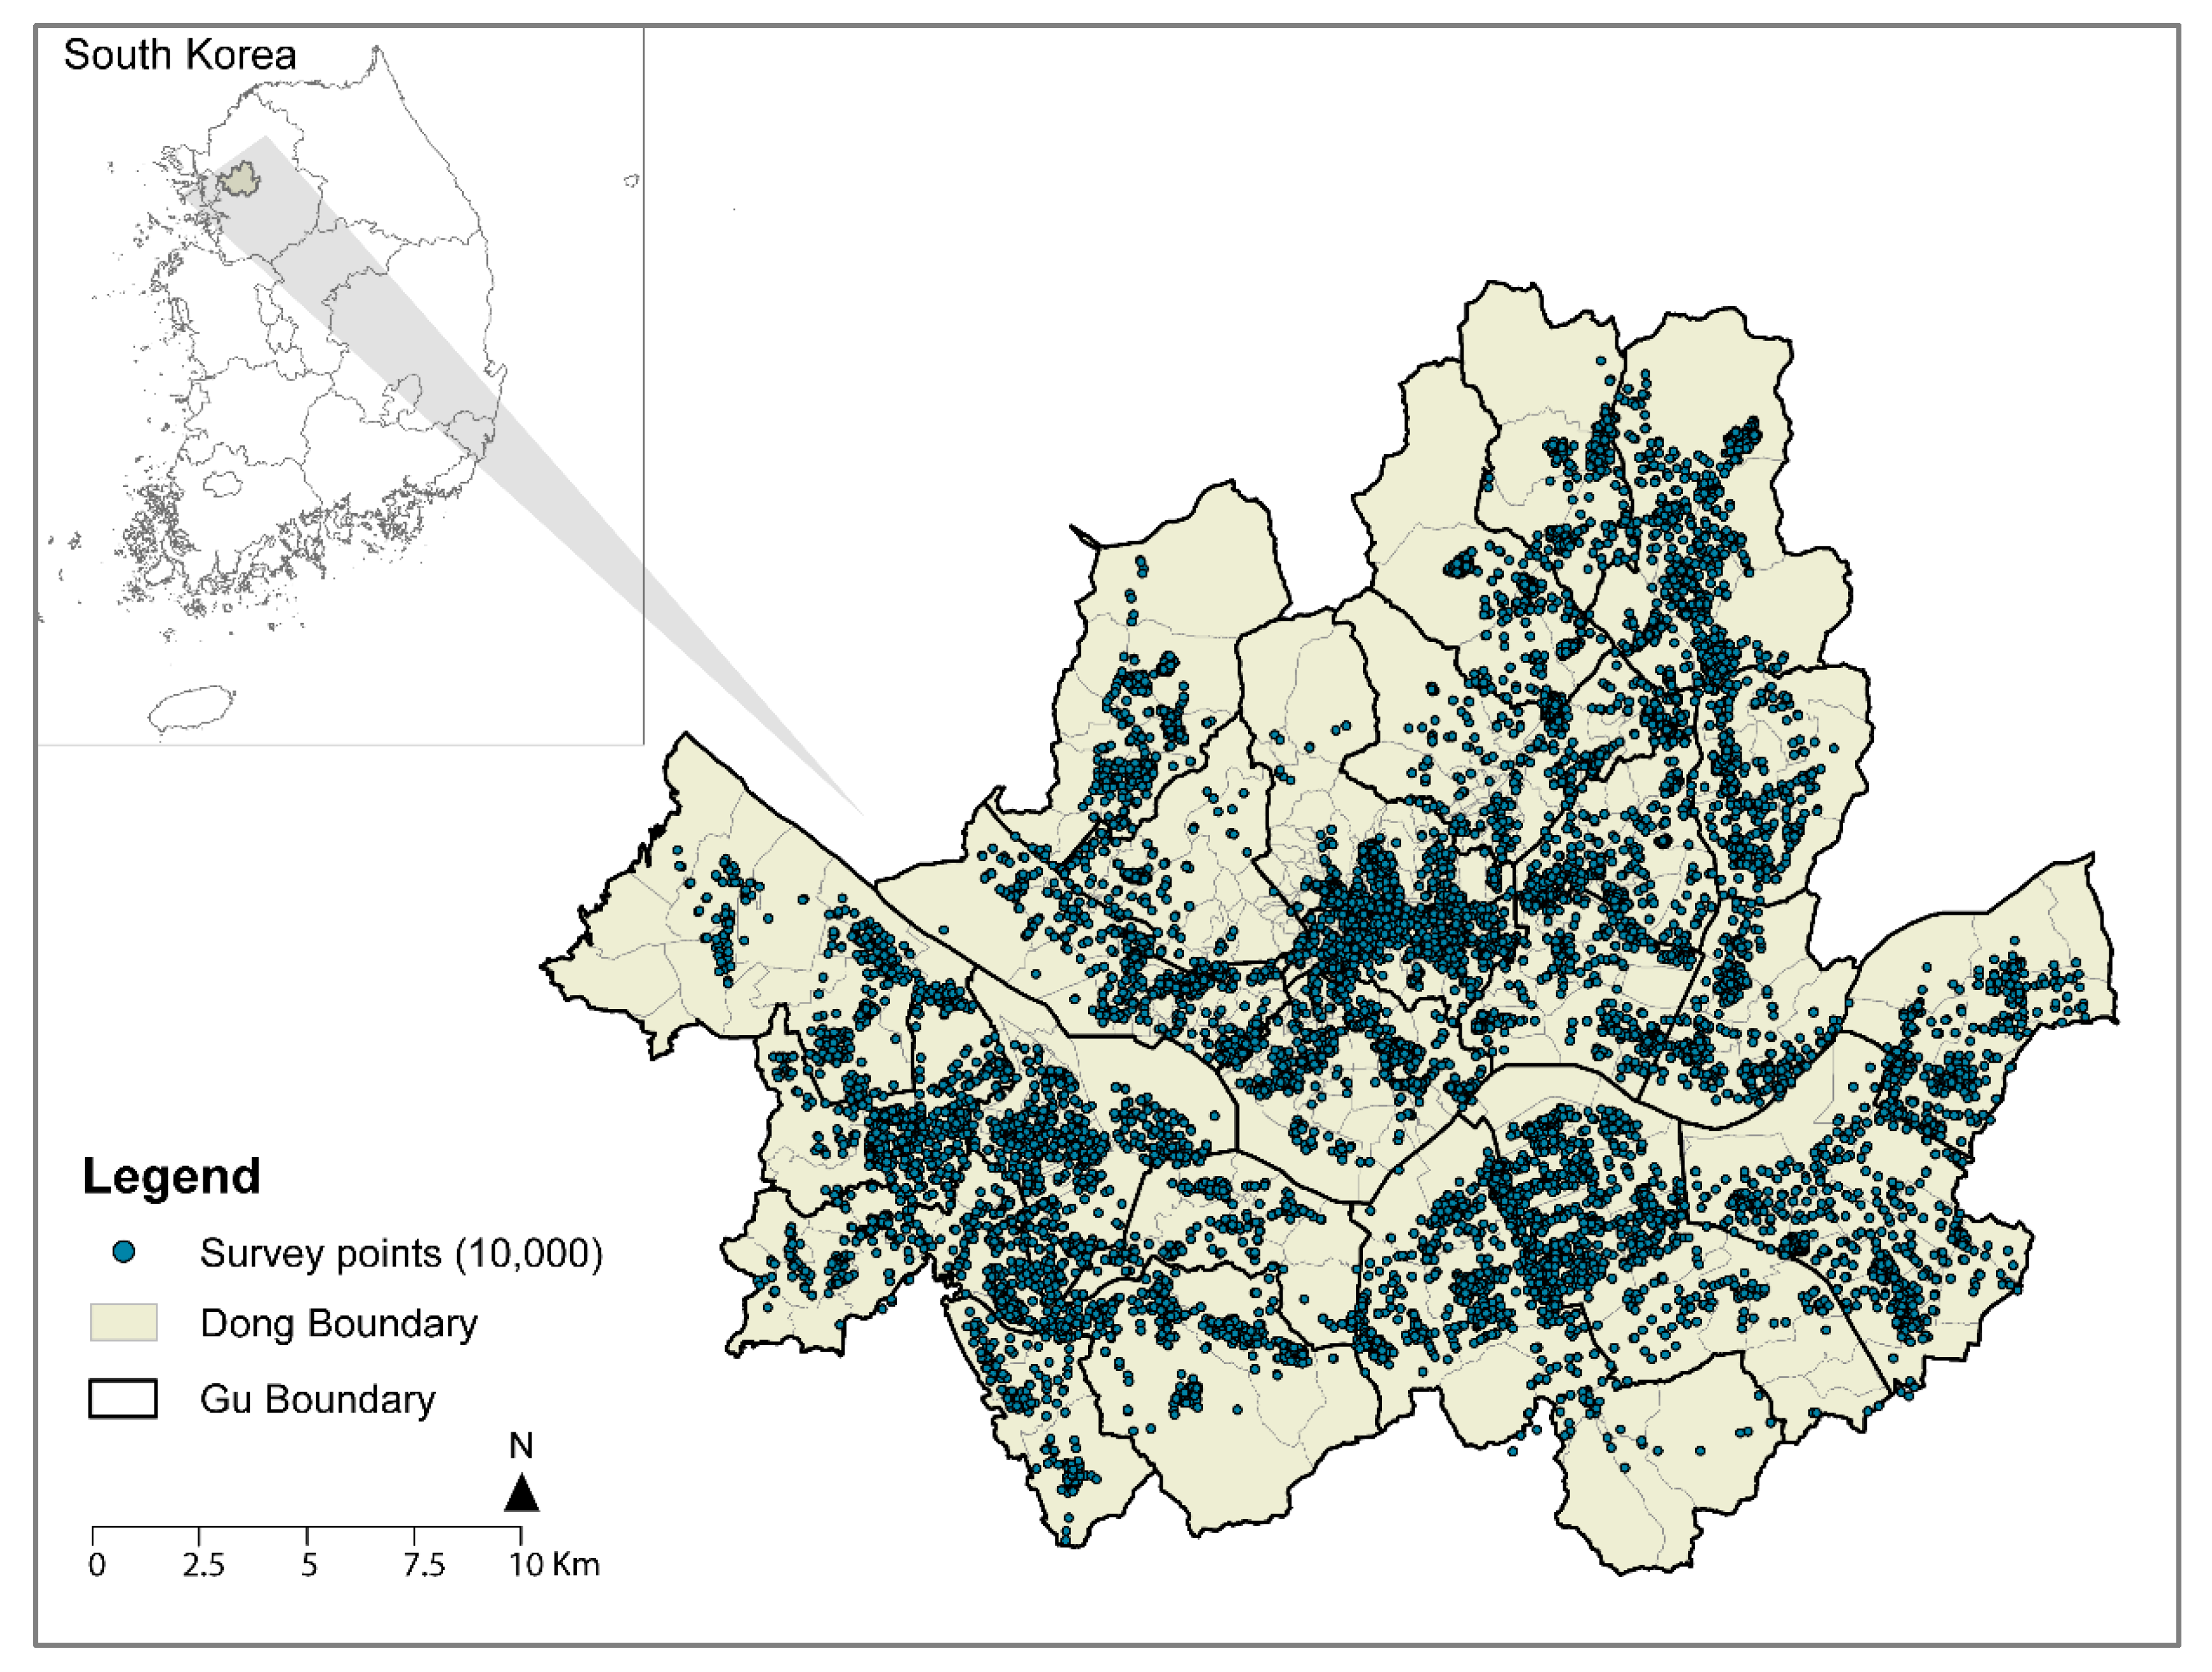
The case study area for this study was Seoul, which is an Asian megacity with well-established public transportation systems and a high development density for both residential and commercial land use. The source of data for the walking activities used in this study was the Seoul Pedestrian Flow Survey (2009) that included 10,000 locations across Seoul.
The public survey was conducted from August 2009 to November 2009 by the Seoul city government. The survey points were selected strategically based on population density, land use, and transportation systems across the city of Seoul. The raw data provide the total number of pedestrians that passed each survey point from 7:30 a.m. to 8:30 p.m. from Monday to Friday. These survey results are thus a comprehensive and unique public data source for pedestrian flow in Korea, though information is only available for 2009 and Seoul.
Figure 1 illustrates the 10,000 locations of the pedestrian flow survey in Seoul.
Table 1 shows all of the variables and their definitions. The dependent variable was the average number of pedestrians at each of the 10,000 survey points on weekdays. The independent variables included density, land use, building, street design, accessibility, and space syntax measures. Most of the independent variables were measured in a 100-m circular buffer from each survey point. The 100-m circular buffer is reasonable for examining the relationship between pedestrian volume and the adjacent built environment [
13,
36].
First, we used population density and employment density as variables of exposure to pedestrian volume. Pedestrian volume is most likely to be associated with population density or employment density, so those variables should be controlled when examining the effects of the built environment on pedestrian volume. Second, land use factors are important when explaining pedestrian volume. In this study, we considered six categories of land use density: residential, commercial, office, industrial, educational, and cultural. All of the land use density variables were taken as the net density of the floor area within the 100-m buffer of each survey point. Third, we considered the number of buildings and the mean area of all building floors within the 100-m buffer in this study. The number of buildings and the average value of the building floor area were associated with the pedestrian volume on adjacent streets. A higher average value of building floor area within the 100-m buffer implied the existence of high-rise buildings. Fourth, this study included transportation accessibility measures in terms of density and distance.
Both bus stops and subway station areas were popular destinations for pedestrians for transportation mobility. A shorter distance to a bus stop or rail station was associated with a higher volume of pedestrians. Fifth, this study considered street design features that were within a 50-m buffer of a survey point in this study. We included sidewalk width, number of lanes, slope condition, bus line, street furniture, fence, and crosswalk. For instance, a higher pedestrian volume was most likely to be associated with a wide sidewalk, flat slope, the existence of a bus line, or the existence of a crosswalk.
Finally, we tested three important space syntax variables: global integration, local integration, and control. Space syntax theory and its analytical technique have been updated with sophisticated analytical software, such as DepthMap X and ArcGIS 10, for conducting morphological analyses in architectural design and urban studies. We used both DepthMap X and ArcGIS 10 to analyze the space syntax measures and the built environment. The literature suggests that an angular analysis can be a better method for explaining pedestrian activity then a metric or topological analysis [
21,
25,
34]. Therefore, we used the segment-based angular analysis method to analyze the space syntax measures.
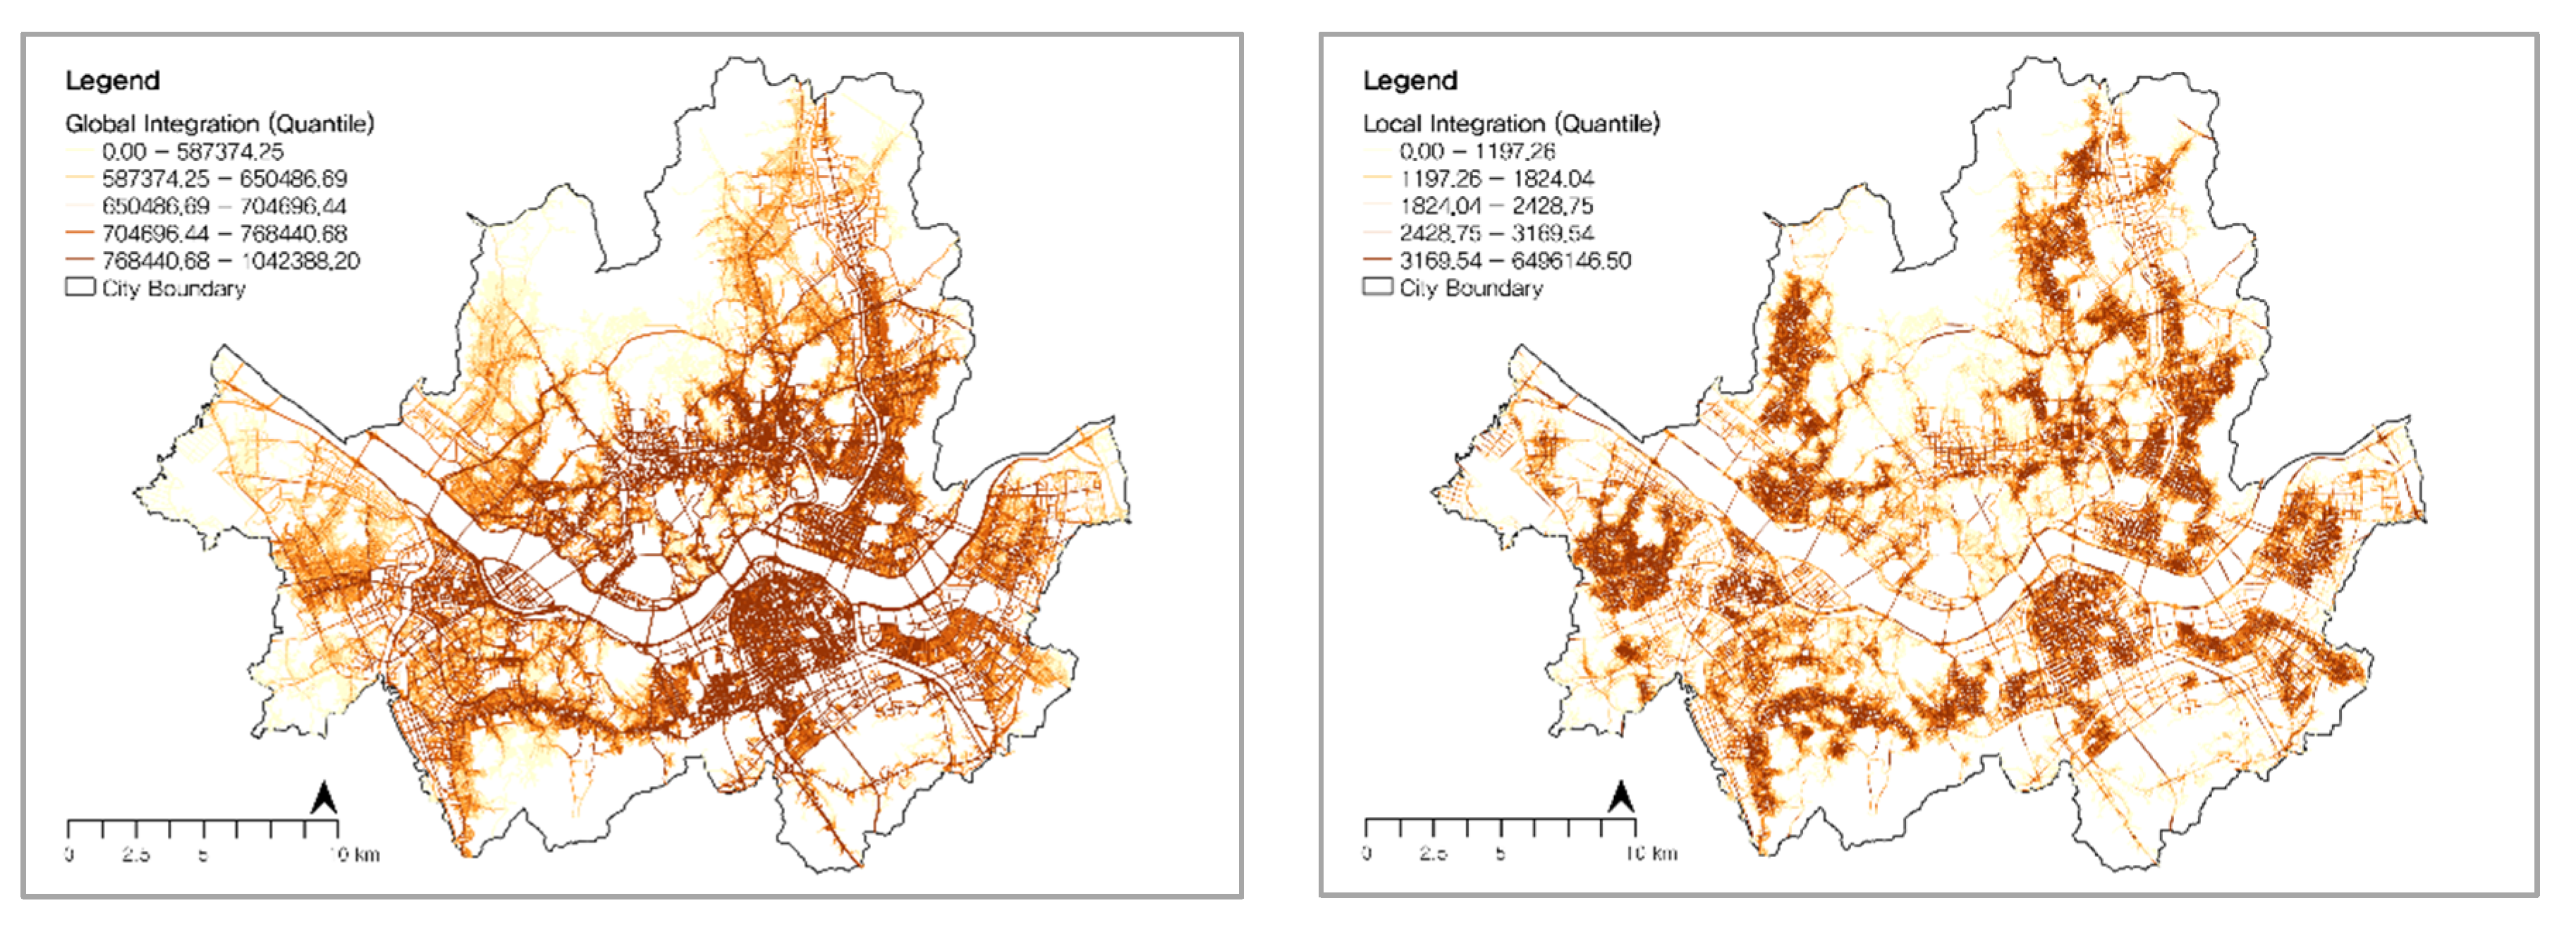
Figure 2 shows the segment-based angular analysis generated from the centerline of the transportation network in Seoul.
We eliminated a few isolated streets because they were disconnected from the whole transportation system. The left map in
Figure 2 shows the results for the global integration value, and the right map shows the results for the local integration value. The global integration measure in space syntax describes the average depth of space to all of the other spaces in the network system. A global integration value of more than 1 indicates that a road segment can be easily accessed from all other road segments. As we expected, the global integration map showed the highest values in the central and sub-center areas of Seoul. In contrast, the local integration value represents the degree of accessibility that a road segment has to adjacent segments. We used a radius of 400 m of walkable distance to calculate the local integration value and identified many local clusters with high local integration values across Seoul.
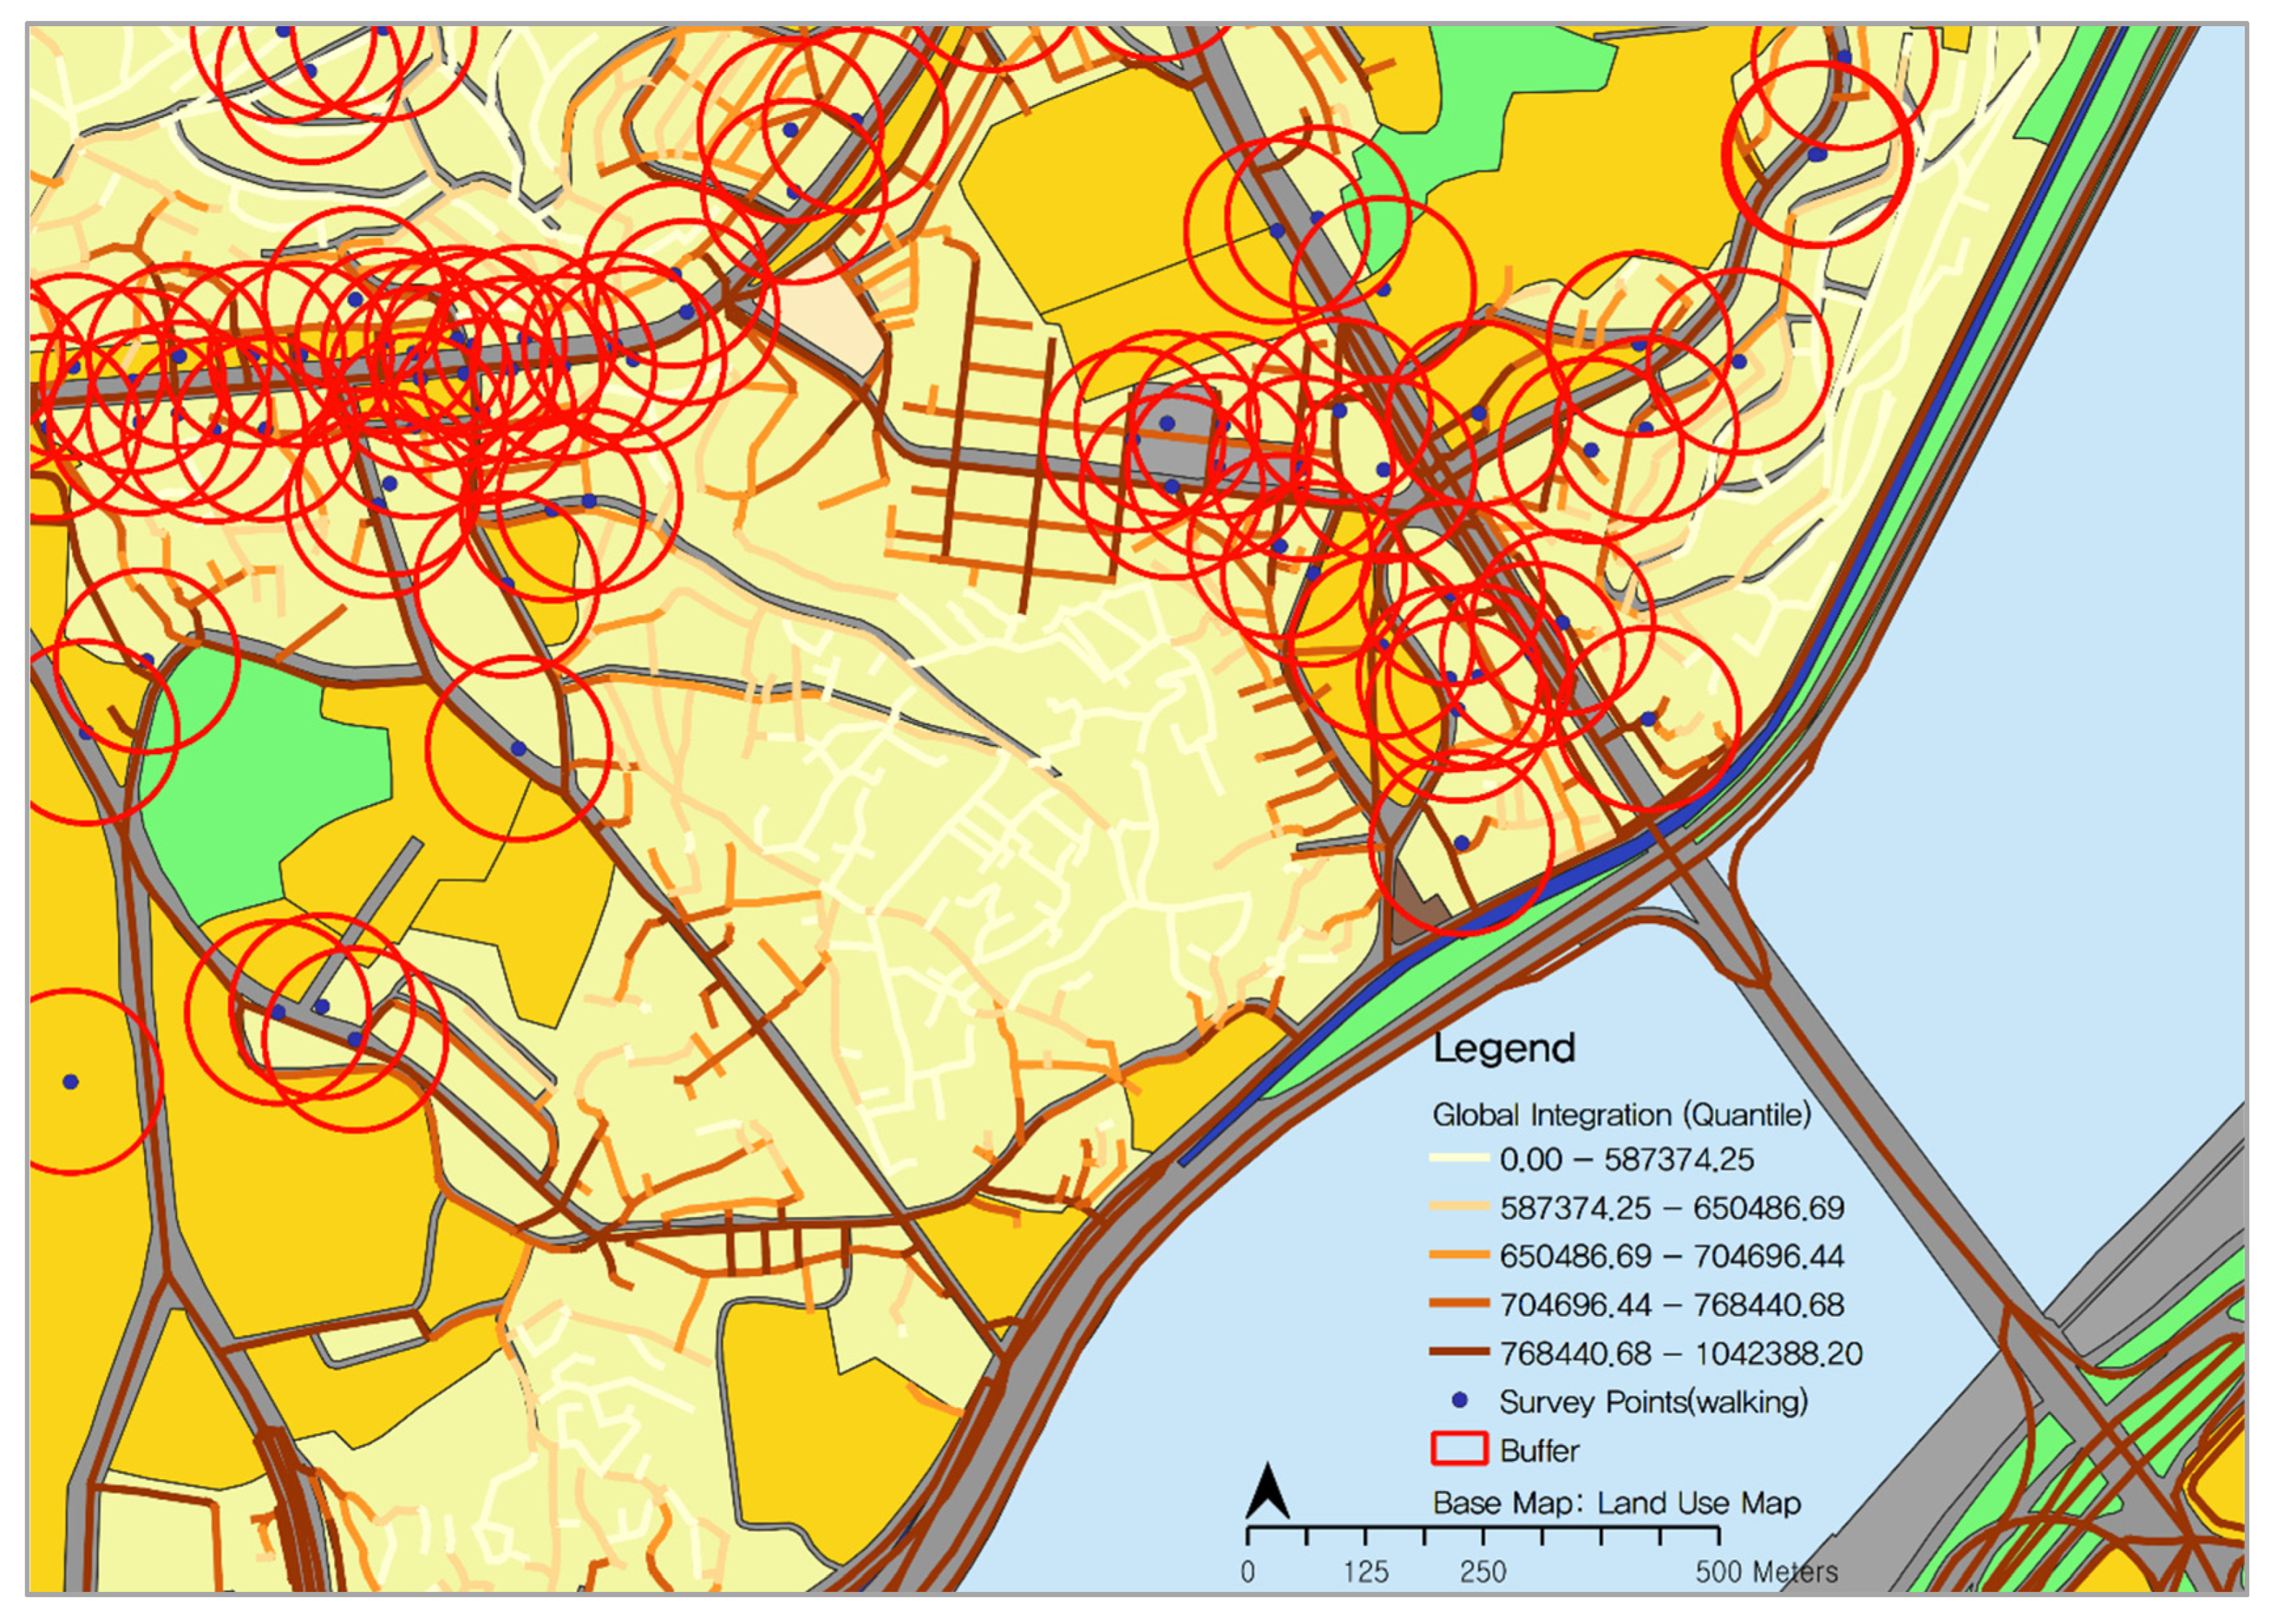
Figure 3 illustrates the calculation method for the independent variables, including the space syntax measures within the 100-m circular buffers from the survey points, with the land use information. Once we calculated the space syntax variables, we created 100-m circular buffers from the survey points and extracted both syntactic variables and built-environment variables within those buffers using the intersect method between a buffer and a road segment map with the ‘intersect’ geoprocessing tool in ArcGIS. Then, we aggregated the mean value of the space syntax measures within each buffer and joined that aggregated table to the survey point information. We also created several built-environment variables in the 100-m buffers: population density; employment density; land use; accessibility to public transportation, expressways, and parks; and street design features.
Finally, we developed four multivariate regression models to consider the characteristics of the land-use zones. First, we conducted a regression model for all survey points, regardless of their land-use zones. Then, we ran three additional regression models, one for each of the land-use zones, because the relationship between pedestrian volume and the built-environment variables in the commercial zone might differ from that in the residential zone. We used this methodological approach to identify the syntactic measures and built-environment variables that have consistently significant associations with pedestrian volume across different land zones in Seoul.
4. Analysis
Table 2 shows the descriptive analysis of the dependent variable of walking volume and the independent variables. Of the 10,000 survey points, we excluded 479 points because they had missing values or were incorrectly located on the map. As shown in
Table 2, the independent variables were density, land use, accessibility to transportation systems, building scale measures, and street design features. For the density measures, we applied the net density, excluding undevelopable lands such as parks and water bodies.
Table 3 shows a correlation analysis between the average walking volume for weekdays and the space syntax variables by land-use zone (i.e., residential, commercial, and industrial). The most consistent variables across land-use zones were employment density, commercial land use density, and transportation-related measures such as sidewalk width, number of lanes, and the existence of fences. Other variables showed different correlations with walking volume by land-use zone. Overall, commercial land use density, employment density, and bus station density in the 100-m buffer had a relatively higher correlation with walking volume than the other variables.
All of the space syntax measures showed a significant correlation with pedestrian volume in residential zones. They were not significant in commercial zones except for global integration. In addition, none of the space syntax variables except local integration were significant in industrial zones. Among the syntactic variables, the global integration variable showed a consistently positive association with pedestrian volume except in industrial zones. Local integration and the control variable showed positive associations only in the residential zone. Overall, these findings indicate that the space syntax variables affect walking activity differently in different land-use zones. The correlation data shown in
Table 3 are from a preliminary analysis examining the bivariate correlation between walking and the space syntax variables, ignoring the effects of other built-environment factors on walking activity.
Next, we used multivariate regression to analyze the built-environment factors, including the space syntax variables (
Table 4). The dependent variable was the average walking volume. We transformed that dependent variable into the logarithmic value of walking volume because the original variable had significant skewness in the data distribution. The basic model was a multivariate regression model combining the built-environment variables and space syntax measures. For the space syntax variables, we considered global and local integration and the control value, excluding connectivity and total depth due to the multicollinearity problem with the integration measures. The street design characteristics were the width of the sidewalk, number of lanes, and dummy variables for slope, fence, street furniture, and crosswalk.
As shown in
Table 4, without zone separation, most of the independent variables showed statistically significant associations with the average pedestrian volume on weekdays. The employment density variable showed consistently positive associations with pedestrian volume regardless of land-use zone. In contrast, population density showed a negative association with pedestrian volume except in model 4 (industrial zones). We attributed the negative association in residential zones to high-density apartment complexes and a car-oriented lifestyle. In addition, apartment residents’ walking activities were mainly concentrated in the peak hours of commuting times, making the streets less crowded during most of the daytime. This finding indicates that population density in a residential zone might not necessarily increase pedestrian volume on the streets. In addition, high population density had a negative association with pedestrian volume in commercial zones.
On the other hand, a land-use mix was likely to increase pedestrian volume in residential and industrial zones. Commercial density and educational-cultural land use density had positive associations with pedestrian volume in residential and industrial zones. Most of the building density variables did not show any statistical relationship with pedestrian volume. However, the average total floor area of buildings was negatively associated with pedestrian volume in residential zones. This finding was again attributed to large-scale residential buildings, such as high-rise apartment complexes, in residential zones. Pedestrian volume was likely to be lower on streets near apartment complexes than on streets in mixed-use areas.
Accessibility to the transportation network, including bus stops and rail stations, had statistically significant associations in all models, indicating that the net density of bus stops or rail stations was positively associated with pedestrian volume. This finding suggests that the number of people walking was increased near bus stops and rail stations. The other two distance variables for bus stops and rail stations also supported this finding in residential zones. In contrast, the nearest distance to expressways showed a negative relationship with pedestrian volume, indicating that pedestrian volume decreased near expressways. Great accessibility to expressways is more likely to encourage people to use an automobile rather than walk.
Most of the street design feature variables were statistically significant in model 2 (residential zones), and model 3 (commercial zones). In particular, the sidewalk width and number of driving lanes were robust independent variables for walking volume regardless of the land-use zone. Most of the other street design-related variables were statistically significant in residential zones. Whereas the bus line and street furniture variables were statistically significant in commercial zones, the fence and crosswalk variables were statistically significant in industrial zones.
Regarding the space syntax variables, global integration had a statistically significant association with pedestrian volume in all models except model 4 (industrial zone). This result confirms that global integration is a significant indicator of pedestrian volume in residential and commercial zones. In contrast, local integration was statistically significant in model 1 (all zones) and model 3 (commercial zone). The control variable did not show a statistically significant association with pedestrian volume. These findings indicate that the land-use zones significantly influenced the associations between the space syntax measures and pedestrian volume. The global integration and local integration variables were the most important syntactic measures explaining pedestrian volume in commercial zones. Global integration was also a significant variable explaining pedestrian volume in residential zones.
5. Conclusions
This study used unique public survey data about pedestrian volume at 10,000 locations in Seoul, Korea, and combined GIS-based built-environment variables with space syntax measures to examine their relationships with pedestrian volume in different land-use zones. Most of the built-environment variables, such as density, land use, buildings, accessibility, and street design measures, showed statistically significant associations with pedestrian volume in residential zones. Some of those variables were also statistically significant in commercial or industrial zones. In this study, we found that the most consistent and significant variables regardless of the land-use zone were employment density, some accessibility measures, and some street design measures. Among the space syntax variables, global integration was statistically significant in residential and commercial zones, but local integration was statistically significant only in commercial zones.
Population density had a negative association with pedestrian volume in all zones. High population density was generally associated with concentrated areas of residential use, including apartment complexes that encourage car-oriented lifestyles. In addition, the negative association between the average floor area of buildings and pedestrian volume in residential zones confirmed that high-rise and high-density apartment complexes are unlikely to increase pedestrian volume on neighborhood streets. Pedestrian volume was more likely to be high in mixed-use areas, including areas with commercial, educational, and cultural uses in residential zones. This finding indicates that land use variables are also significant indicators of pedestrian volume. However, each land-use type had a different association with pedestrian volume in different land-use zones.
Measures of accessibility to public transportation, such as bus stops or rail stations, showed a statistically significant association with walking volume. In particular, bus stop or rail station density showed a statistically significant and positive association with pedestrian volume regardless of the land-use zone. The distance variable to a bus stop or rail station also showed a significant association. For street design characteristics, the width of sidewalks and the number of driving lanes showed positive associations with walking volume regardless of land-use zones. In contrast, other street design variables showed different relationships with pedestrian volume in different land-use zones.
Our analysis indicates that the global integration space syntax variable had a statistically significant association with the average pedestrian volume. In particular, global integration showed a statistically significant and robust association with average pedestrian volume in residential and commercial zones. In contrast, local integration had a statistically significant association with pedestrian volume only in commercial zones. However, the control variable did not show any statistical significance in any of the models. These results indicate that syntactic measures have different associations with pedestrian volume in different land-use zones.
Finally, this study confirmed that employment density, some built-environment variables, and some syntactic measures (such as global and local integration) were consistent and robust factors to explain pedestrian volume, though their relationships with pedestrian volume changed in the different land-use zones. In particular, the syntactic measure of global integration is a determinant factor associated with pedestrian volume in residential and commercial zones. In contrast, local integration was a determinant factor of pedestrian volume in commercial zones. It should be noted that the effects of built-environment variables, including the syntactic measures, on pedestrian volume are different in the different land-use zones. These findings indicate that planning and public policies should take different approaches in promoting urban vitality through pedestrian volume in different land use zones.
Despite some meaningful findings and policy implications, this study has some limitations that should be addressed in future studies. The syntactic metrics calculated by the street network structure are sensitive to the case study area’s spatial scale. In other words, the relationships between syntactic measures and pedestrian volume might not be consistent in case study areas of different sizes. Also, our unit of analysis, the 100-m circular buffer, might have some limitations in representing the survey points’ built environments. Sensitivity analyses with different buffer distances would be necessary to identify the effects of the unit of analysis. Lastly, some important missing variables remain because the R-squared value did not exceed 0.39 in any of the models. Future studies of pedestrian activities should consider various syntactic metrics as well as built-environment variables.


