Identification of Key Carbon Emission Sectors and Analysis of Emission Effects in China

School of Economics and Management, Beijing University of Technology, No.100 Pingleyuan, Chaoyang District, Beijing 100124, China
*
Authors to whom correspondence should be addressed.
Sustainability 2020, 12(20), 8673; https://0-doi-org.brum.beds.ac.uk/10.3390/su12208673
Submission received: 27 August 2020
/
Revised: 14 October 2020
/
Accepted: 16 October 2020
/
Published: 19 October 2020
Abstract
:Analysis of sectors’ emission effects is crucial for identifying key emission sectors and reducing carbon. Current literature for calculating sectors’ emission effects in China ignore intermediate demand. This might introduce inaccuracy into the analyzed results. To solve this gap, this paper used an alternative input–output method to analyze sectors’ emission effects in China. Firstly, it identifies the key emission sectors and their emission effect characteristics from 2005 to 2017. Then, the reasons for the changes in these sectors’ emission effects are analyzed. Lastly, emission effects were further decomposed so that the driving relationships of emissions among these sectors can be sorted out. The results show that the overall key emission sectors were metal smelting and processing and nonmetal mineral products. The backward-emission-dominant sectors were construction, chemical products, other services (such as finance, health and education), metal products, and so on. The forward-emission-dominant sectors were production and supply of electricity and heat, transportation, storage, postal, and telecommunications services. In 2017, transportation, storage, postal, and telecommunications services’ own final demand emissions and forward emissions accounted for 41.7% and 58.3%, respectively, of this sector’s direct emissions. Moreover, from 2005 to 2017, the main sector emission paths affecting the growth of China’s emissions shifted from manufacturing and construction industries to service industries. Accordingly, strategies for emission reduction, such as substituting pollution inputs, were proposed and analyzed. The research provides an important reference for the Chinese government to adopt appropriate measures to reduce carbon.
1. Introduction
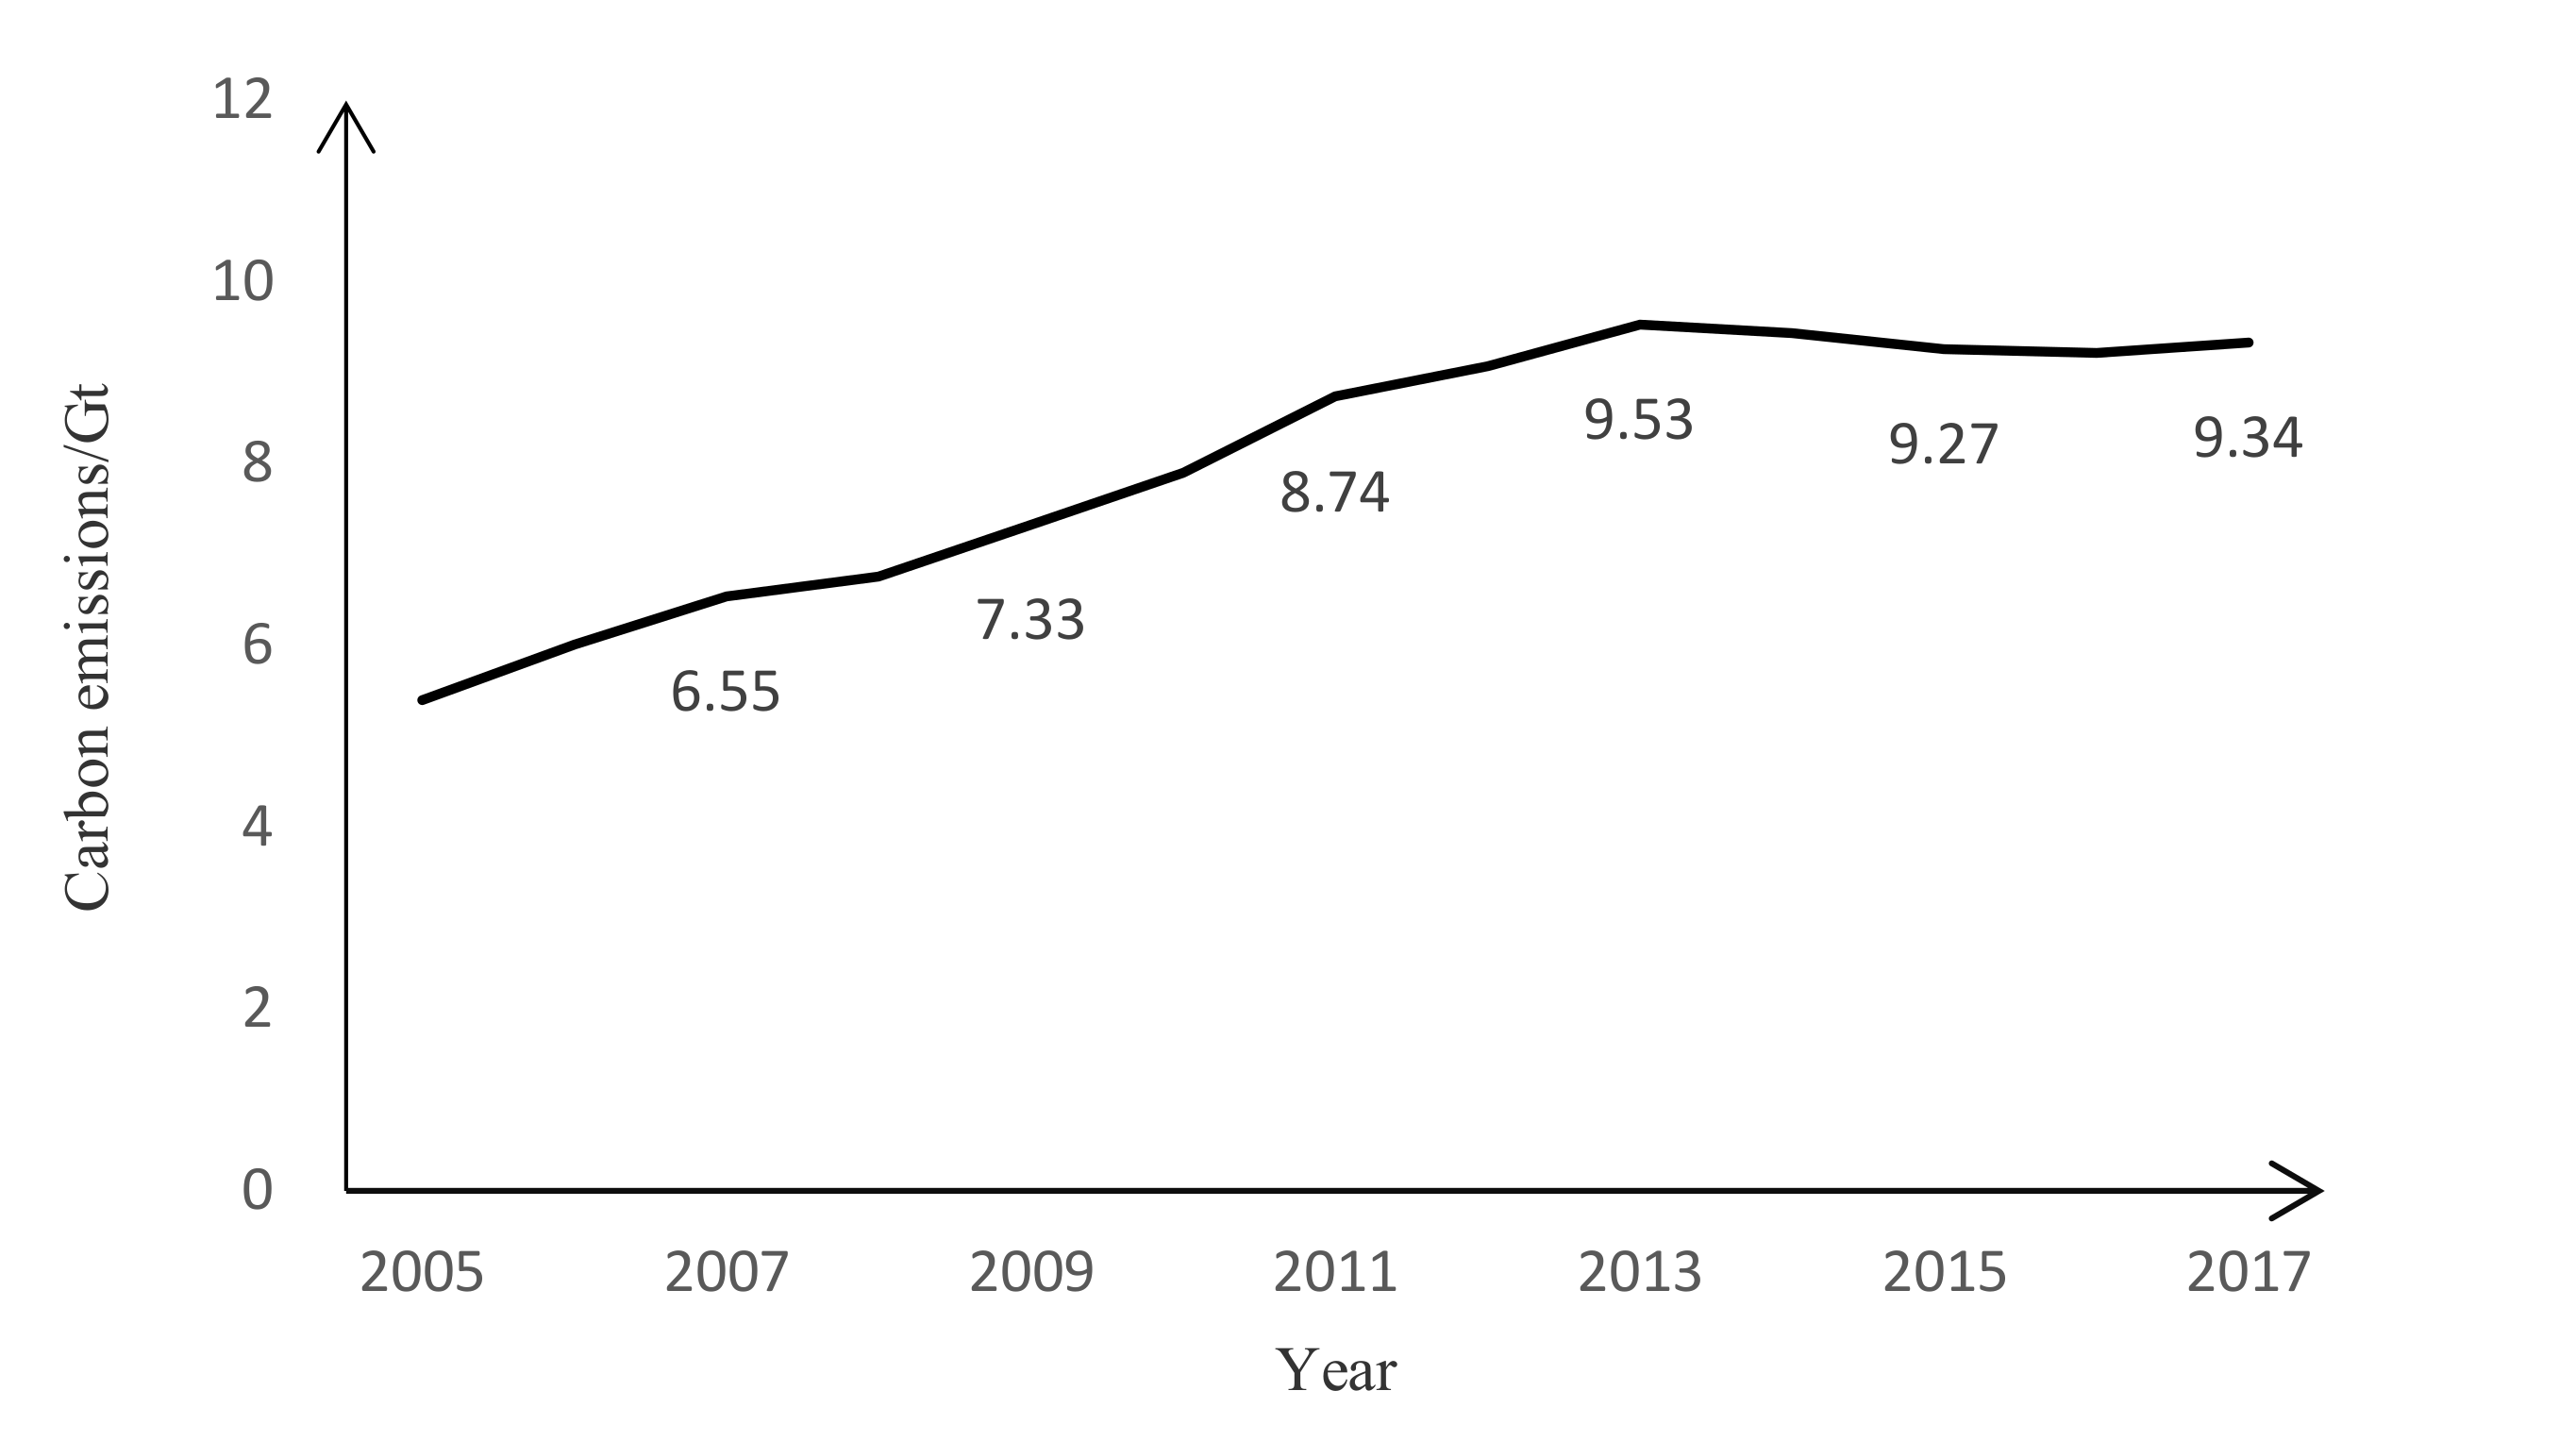
Increasing greenhouse gas emissions and global warming have become points of consensus and challenges for all countries in the world. As China’s economy booms, its energy demand grows, leading to a sharp rise in carbon emissions. China’s carbon emissions reached 5.40, 9.08, and 9.34 Gt (gigatons), respectively, in 2005, 2012, and 2017 [1,2]. Since 2008, China has become the largest carbon emitter in the world [3]. To cope with the impact of climate warming, the Chinese government promised a carbon emission target that carbon emissions will be reduced per unit of gross domestic product (GDP) by 40–45% and 60–65% by 2020 and 2030, respectively, compared with the year 2005 [4].
Achieving these reduction goals will rely on effective emission mitigations in various sectors. Industrial activities are the main factor leading to carbon emission growth, and it is more effective to implement emission reduction measures from a perspective of the whole industrial chain rather than in certain individual sectors [5]. Emission reduction measures of industrial activities mainly include technology and policy actions. However, currently, some technologies of emission reduction are difficult to use widely due to their high cost (such as Carbon Capture and Storage, etc.). Hence, carbon emission reduction policies become a focus.
One of the flexible policies to reduce emissions efficiently is an Emission Trading Scheme (ETS). The European Union has formulated the largest emission trading system (EU-ETS) in the world. The policy limits the aggregate carbon emissions by allocating a certain amount of pollution permits, namely European Union Allowances (EUAs), to each participating emitter. Emitters must surrender an EUA for each ton of carbon emitted, but they are free to buy additional EUAs or sell excess EUAs on a permit market [6]. Martin et al. (2016) summarized the findings from original research papers and showed that the EU-ETS had positive effects on emission reduction and clean innovation, while no empirical evidence showed that the EU-ETS had strong detrimental effects on economic performance [6]. Oestreich et al. (2015) showed the positive effects of EU-ETS on German stock returns [7].
In China, ETS pilots started from 2013 [8], and by the end of 2017, China’s national ETS market was launched in China’s power industry sector [9]. The establishment of China’s national ETS market would have the potential to influence carbon emissions, economic performance, and energy consumption in China [10]. Lin et al. (2020) showed that when most of the ETS revenue is used for all kinds of renewable energy sources, ETS will be the spring of renewable energy generation [11]. In the industrial system, different sectors have different production processes and influences on the emission generation. Therefore, effective identification of key carbon emission sectors and analysis of their emission effect characteristics are conducive to the implementation of technology and policy actions to different sectors.
Traditional sectoral emission effects refer to emissions associated with production only in that sector. With the deepening of research, the analysis of sectors’ emission effects has extended to the driving and driven effects [12]; in other words, one sector driving other sectors’ emissions and vice versa. Sun et al. (2010) compared the driving impact of China’s seven major sectors on the carbon emissions of the national economy and the seven major sectors’ carbon emissions driven by the development of the national economy [13]. Zhang et al. (2015) compared the driving effects of China’s 135 sectors on the carbon emissions of the national economy, and the results showed that China’s indirect carbon emissions are dominated by the coal-based electricity sector [14]. These studies lay a cornerstone for further analyzing sectors’ emission effect characteristics and corresponding emission reduction measures.
Existing research about key carbon emission sectors is mainly conducted from the demand or supply perspective, i.e., by Leontief inverse or Ghosh inverse. From the demand perspective, Leontief’s model assumes that all sectors’ emissions are directly or indirectly caused by final demand. Alcántara et al. (2003) and Piaggio et al. (2014) extended the Leontief model to compare the driving and driven effects of various sectors from the angle of demand [15,16]. Guo et al. (2018) defined the key emission sectors in China using final demand elasticity extended by Leontief’s model, and results showed the sectors of the manufacture of basic chemicals, and the construction of buildings, etc. to which attention should be paid [17]. From the supply perspective, Ghosh’s model argues that added value can be responsible for sectors’ emissions. Alcántara et al. (2006) and Othman et al. (2016) studied key emission sectors using the Ghosh model from the angle of supply [18,19]. Shen et al. (2018) identified key emission sectors in China by the Ghosh model from driving and driven perspectives and showed that the major key emission sectors included coal mining and dressing, petroleum processing and coking, etc. [12].
However, these research studies have a single perspective and ignore the driving effect of intermediate demand on sectors’ emissions [20,21]. For example, in the input–output table of 2017 of China, the final demand of mining-auxiliary activities is zero; however, this industry has output and carbon emissions. It indicates that the carbon emissions of this sector are mainly caused by intermediate demand. Alcántara et al. (2010), Qian et al. (2014), and Wen et al. (2019) modified the problem of a single perspective by combining Leontief and Ghosh models, but these methods were verbose and still did not consider the impact of intermediate demand on sector’s emissions [21,22,23]. For these reasons, Alcántara et al. (2019) developed a simplified method to calculate the emission effects of sectors based on the research of Milana (1985) [24,25]. Alcántara et al. (2019) mainly evaluate sectors’ emission effects at the static level, limiting the analysis to changes in sectors’ emission effects and the driving relationships of emissions among specific sectors [24]. These further analyses are an important basis for clarifying the reasons for the increase of key sector’s emissions and detailing the measures of sectors’ emission reduction. To solve the gap, the goal of the research is to analyze key emission sectors and their emission effect characteristics in China by an alternative input–output approach and combining the sector’s intermediate demand and final demand.
Therefore, this paper extends this alternative input–output method accordingly.
This paper firstly identifies key carbon emission sectors and their emission effect characteristics from 2005 to 2017 in China combining the sector’s intermediate demand and final demand. Secondly, the annual average increments of each sector’s emission effects are calculated to analyze the dynamic changes of emission effects. Thirdly, the driving and driven effects of these key sectors are decomposed to clear the driving relationship of emissions among key emission sectors. Finally, according to the characteristics of each sector’s emission effects, the specific measures to reduce sector emissions are put forward.
2. Materials and Methods
2.1. Calculation Method of Sector’s Emission Effects
Firstly, the basic equation of the Leontief model is shown as Equation (1):
where is the column vector of total output, is the column vector of final demand, and is the matrix of direct input coefficients—. The element in matrix represents the input of sector in a unit production of the sector . Matrix can be decomposed into Equation (2):
where is a diagonal matrix composed of the main diagonal elements of and is the rest of the elements of outside the diagonal; ; . Equation (1) can be rewritten as Equation (3):
Then
In Equation (4), the first item on the left side represents the impact of intermediate demand on different production sectors. At the same time, it is easy to know that the main diagonal elements of is zero. From a perspective of production, the economic meaning of the non-zero elements in is the output of sector driven by the unit total output of sector , and the output of sector is used for the production of sector and the consequent production of sector itself. in the second item is a diagonal matrix, and the economic meaning of the main diagonal elements of is: the output of sector driven by the unit final demand of sector ; here, the output of sector is used for this sector’s own final demand and the consequent production of sector itself.
In fact, the inverse can be extended by a power series as Equation (5):
We can find that does not contain external propagation activities between different sectors [26]. Matrix can be rewritten as Equation (6):
This own impact is now assigned to the sector to which the corresponding commodity has been sold. That is, if sector sells to sector , the unit products, to produce these products, sector needs to produce the unit products to input sector itself. The increase in production of sector further requires the unit inputs from sector . The process continues through an infinite expansion of the power series, and sector is responsible for these increases in production of that input sector itself. These assignments make the main diagonal elements of the matrix zero [24]. Similarly, in vector , this own impact is also assigned to the sector’s own final demand. These mean, through Equation (4), that all the products of sectors that input themselves are assigned to the sectors and final demand to which the corresponding products have been sold.
In this way, Equation (4) divides the production of each sector into two parts: one is caused by the production of other sectors, and the other is related to the own final demand of this sector. Thus, we can further analyze the driving sources of a sector’s emissions from intermediate demand (supply side) or final demand (demand side). From the perspective of the environment, using Equation (4), we can obtain Equation (7):
where is a diagonal matrix composed of the carbon emissions per unit output of each sector. From the left side of Equation (7), we can obtain Equations (8) and (9):
In Equation (8), is a matrix after diagonalization of the column vector of total output. The economic meaning of the representative element in is the carbon emissions of sector driven by the production of sector . Matrix reflects clearly the driving relationship of emissions between two specific production sectors on the supply side. In Equation (9), the economic meaning of the representative element in the column vector is the carbon emissions of sector driven by the own final demand of sector , which can be defined as OFDE (own final demand emissions) indicator. This is different from the Leontief model in which the final demand of sector needs to be further responsible for the increase in emissions of sector due to the need for inputs from other sectors [24]. However, the own final demand emissions (OFDEs) reflect the part of one sector’s emissions driven purely by this sector’s final demand, which shows the impact of the demand side on one sector’s emissions.
From Equation (8), we can further define BE (backward emissions) and FE (forward emissions) indicators as Equation (10)
where is the carbon emissions of other sectors driven by the production of sector , and is the carbon emissions of sector driven by the production of other sectors. The backward emissions (BEs) reflect the other sectors’ emissions that one sector’s production drives, which is similar to the driving effects. The forward emissions (FEs) reflect the part of one sector’s emissions driven by other sectors’ production (intermediate demand), which is similar to driven effects and shows the impact of the supply side on one sector’s emissions.
In fact, it can be seen that is an element in the column vector of the first term on the left side in Equation (7), and is an element in the column vector of the second term on the left side in Equation (7). These mean that Equation (7) divides one sector’s emissions into two parts, namely FEs and OFDEs. The difference between FEs and OFDEs is that FEs are this sector’s production emissions caused by the needs for the production of intermediate products, and OFDEs are this sector’s production emissions caused by the needs for the production of final products.
One key sector’s emission effect characteristic can be strongly driving other sector’s emissions or be itself driven to emit. If this sector is mainly driving other sector’s emissions, which sectors’ emissions are mainly driven by this sector’s production? Namely, this sector’s driving emission paths. If this sector is mainly driven to emit, is other sectors’ production (intermediate demand) or final demand driving this sector’s emissions? If it is other sectors’ production, which sectors’ productions are mainly driving this sector’s emissions? Namely this sector’s driven emission paths. If it is final demand, is consumption or export driving this sector’s emissions? These problems’ solutions will help to clarify the driving and driven paths of carbon emissions in the industrial system, as well as the reasons for the increase of key sectors’ emissions, and also help to detail the measures of sectors’ emission reduction.
Therefore, by comparing one key sector’s BEs and FEs, we can determine whether this sector’s emission effect characteristic is mainly driving other sector’s emissions or driven to emit, and by comparing one key sector’s FEs and OFDEs, we can determine whether this sector’s emissions are driven by the supply side (intermediate demand) or demand side (final demand). According to the driving relationship of emissions between two specific sectors in , one key sector’s BEs and FEs can be decomposed to sort out this sector’s driving and driven emission paths. According to the final demand part of the input–output table, we can further decompose one key sector’s OFDEs to analyze this sector’s source of OFDEs. These and the method used to identify key emission sectors will be presented in detail in Section 3.1 and Section 3.3.
To show the impact of each sector on the growth of carbon emissions, the variation in the sector’s emission effects is represented in the form of annual average increment as Equation (11):
where represents the beginning year, represents the end year, , and represent, respectively, the annual average increment of backward emission, forward emission, and own final demand emission effects of each sector.
2.2. Data Sources and Processing
Because the input–output table is not issued annually, in this study, input–output tables of 2005, 2007, 2010, 2012, 2015, and 2017 are used [27]. Data for carbon emissions and energy consumption are mainly from the China Emission Accounts and Datasets (CEADs) [28]. The carbon emissions of China over the years, sorted out by the datasets, are shown in Figure 1.
The classification of emission sectors differs between the input–output table and CEADs for different years; therefore, all types of emission sectors are aggregated into 27 sectors (see Table 1) according to the principle of industry combination [12,21]. At the same time, the input–output table published by China is an import-competitive input–output table, which contains the use of imported products. Accordingly, import factors in the use of intermediate products and final products in the input–output table need to be eliminated according to the assumption of a competitive import model [14,29]. After eliminating the import factors, the structural relationship in the input-output table is that total output is equal to intermediate demand plus final demand (the original data are total output = intermediate demand + final demand − import).
3. Results and Discussion
3.1. Identification of Key Carbon Emission Sectors in China
Through calculating the average values of BE, FE, and OFDE indicators of 27 sectors, the identification method of key carbon emission sectors is as follows:
- (1)
- When a sector’s BE is more than the average of BE, and FE is more than the average of FE, this sector can be called the overall key emission sector.
- (2)
- When a sector’s FE is more than the average of FE, but BE is less than the average of BE, it is called the forward-emission-dominant sector.
- (3)
- When a sector’s BE is more than the average of BE, but FE is less than the average of FE, this sector is called a backward-emission-dominant sector.
- (4)
- When OFDE is more than the average of OFDE, these sectors are called the major sectors of own final demand emissions, and the social final demand mainly causes these sectors’ emissions.
The key carbon emission sectors of China in 2017 and their emission effects are shown in Table 2.
As can be seen from Table 2, on the supply side, the overall key emission sectors of China in 2017 included metals smelting and pressing (S14) and nonmetal mineral products (S13). These two sectors accounted for 35.6% and 13.9% of all sectors’ FEs and BEs, respectively. This indicates that these two sectors had significant FEs and BEs. While these two sectors were driven to emit by other sector’s productions, these two sectors’ productions were also driving other sector’s emissions. For example, the production of construction needs nonmetal mineral products and causes the nonmetal mineral products’ production and emissions. The production of nonmetal mineral products also needs power and heat and causes the power sector’s production and emissions. However, these two sectors were not the sectors with the greatest FEs or BEs, which was related to the division from both a forward and a backward perspective [24]. If only the FEs or BEs were considered, there were some sectors that were more important from these two perspectives than these two key sectors.
The forward-emission-dominant sectors in 2017 included production and supply of electricity and heat (S22) and transportation, storage, postal, and telecommunications services (S25). The production of the two forward-emission-dominant sectors and the two overall key emission sectors required a large amount of energy consumption, so these four sectors were the main sources of carbon emissions in China. It can be seen that the direct emissions of these four sectors accounted for 87.4% of the direct emissions of all sectors in 2017. In these four sectors, production and supply of electricity and heat (S22) were the most important source of emissions, which accounts for 49.4% of all sectors’ FEs.
The backward-emission-dominant sectors were construction (S24), chemical products (S12), other services (S27), metal products (S15), electric equipment and machinery (S18), and equipment for general and special purposes (S16). The production of these sectors did not generate much carbon emission, but their production drove many emissions of many high-carbon sectors. In 2017, construction (S24) was the largest carbon emission driver of China, which accounted for 23.6% of all sectors’ BEs.
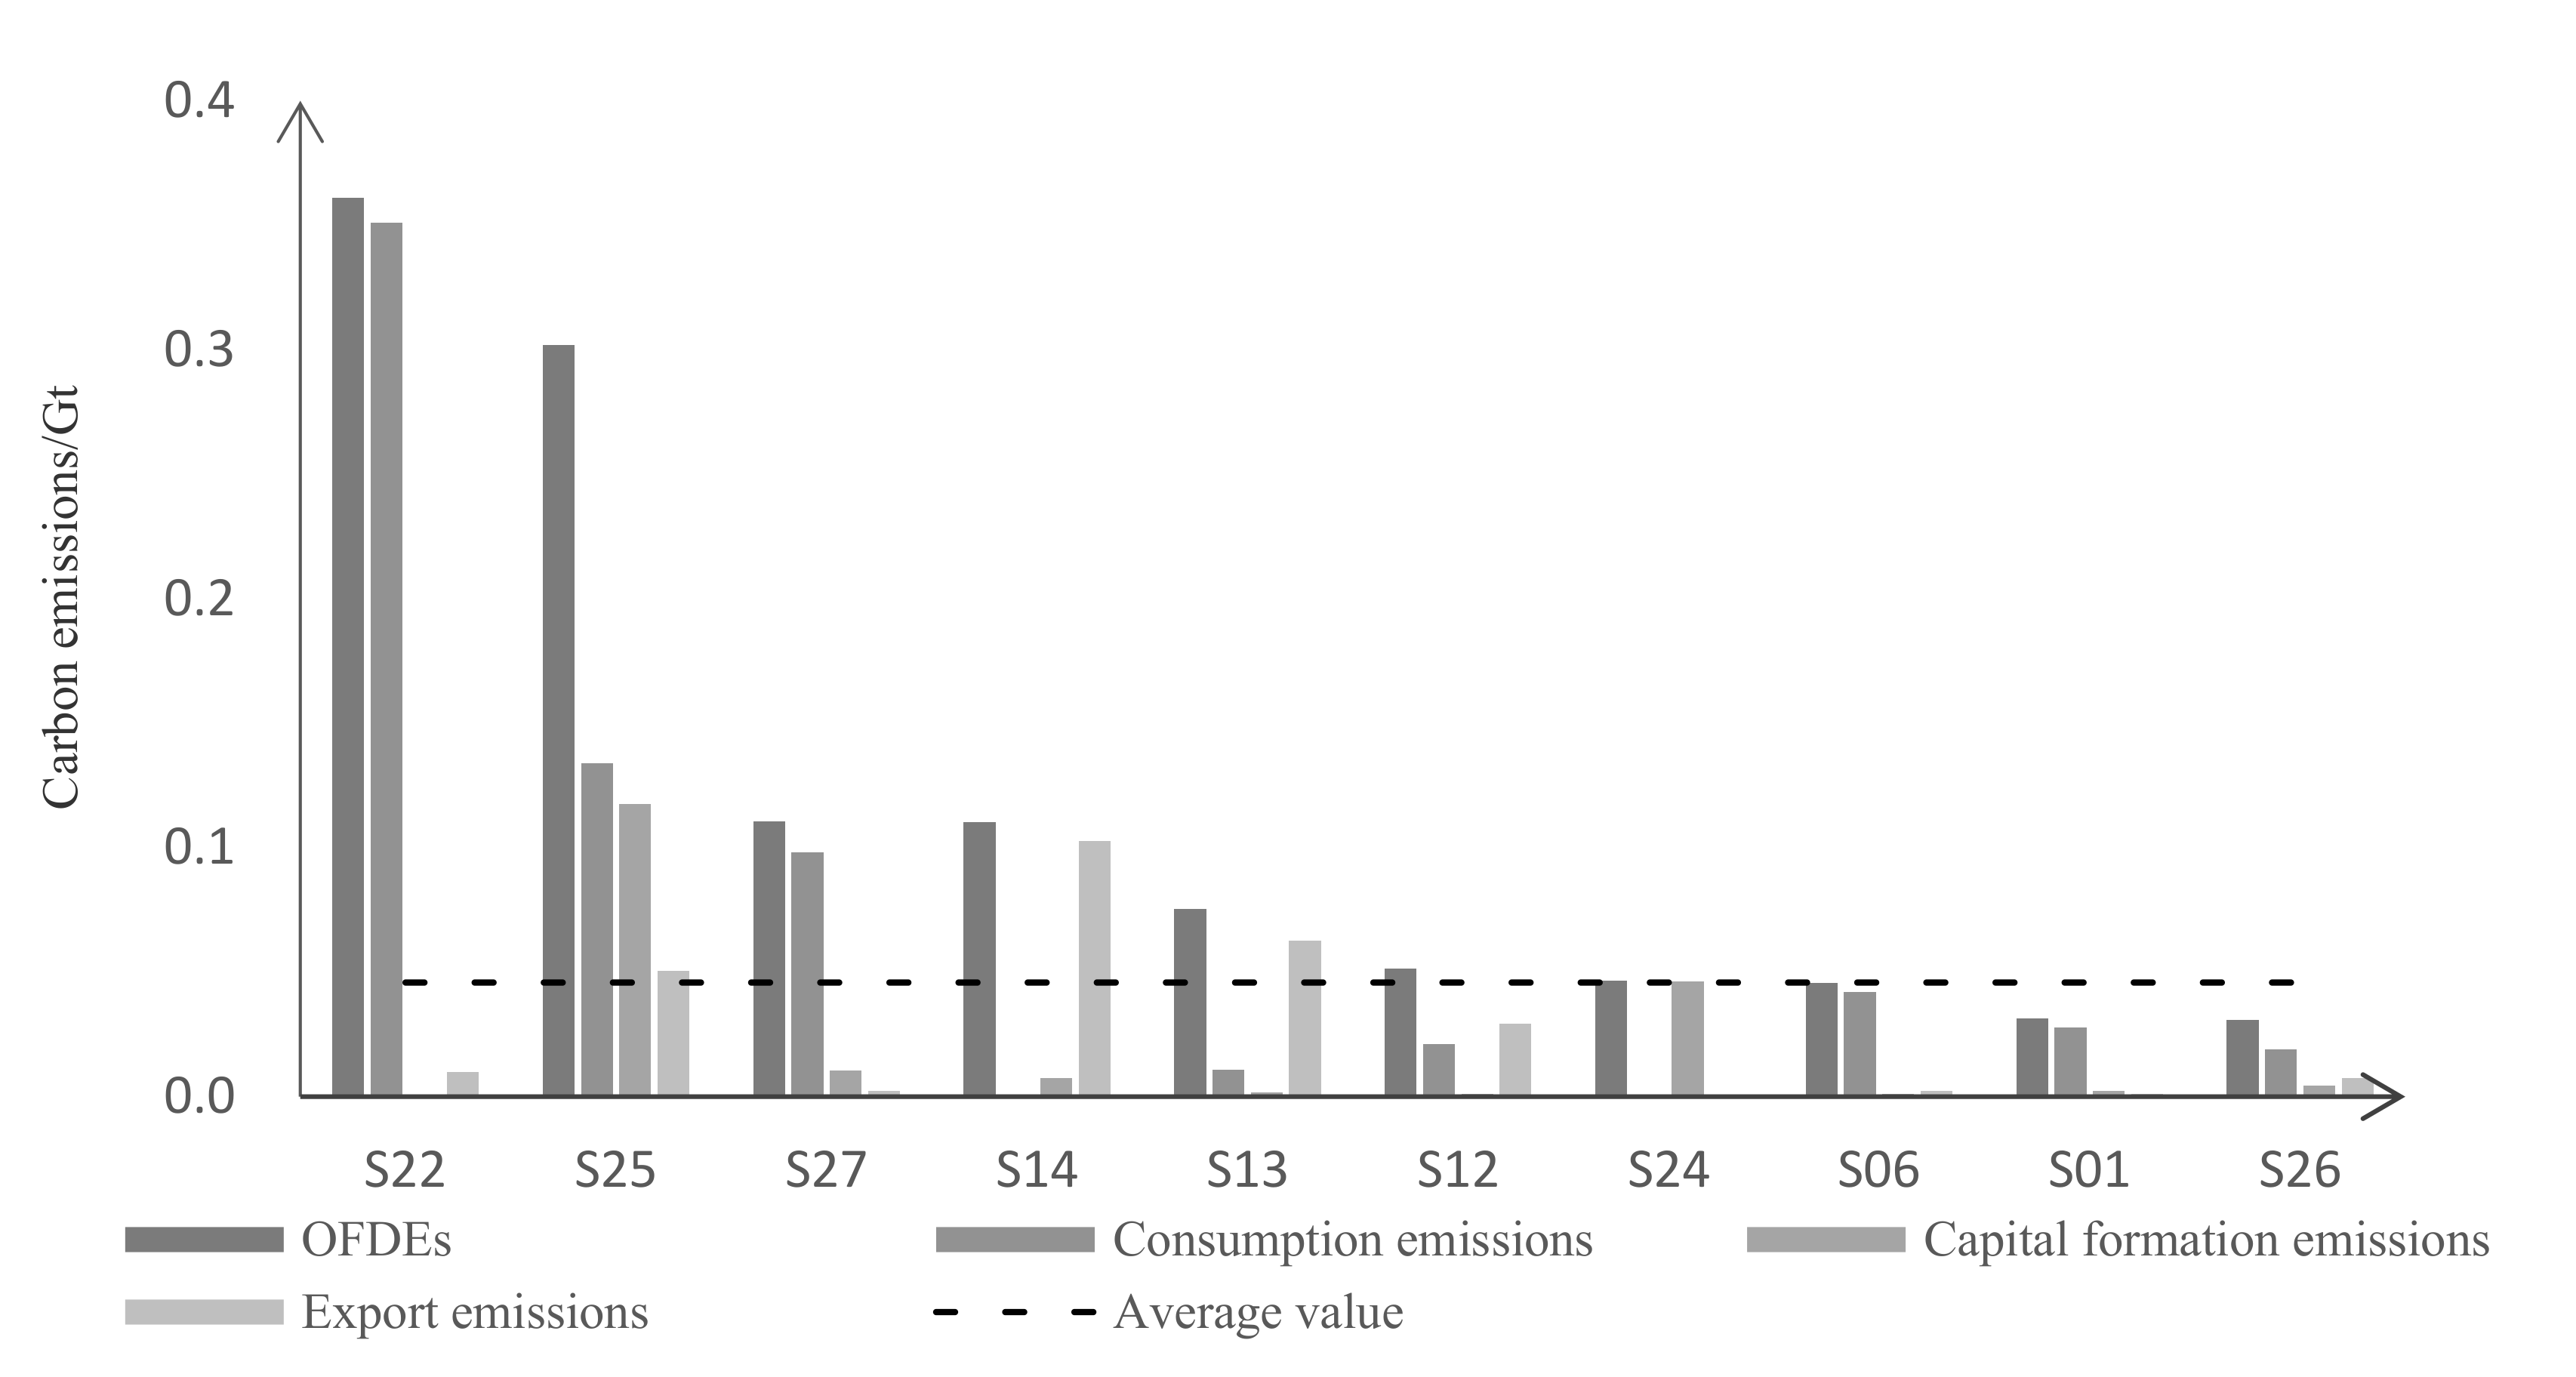
To further analyze the sources of emissions caused by the own final demand, the OFDEs can be divided into three aspects, namely consumption, capital formation, and export. This requires the decomposition column vector of final demand in Equation (9) according to the input–output table. Figure 2 shows the decomposition results and the sectors whose OFDE indicator exceeded the average value of OFDE indicators in 2017.
From Figure 2, on the demand side, there were seven major sectors of own final demand emissions in 2017. These sectors included production and supply of electricity and heat (S22), transportation, storage, postal and telecommunications services (S25), other services (S27), metals smelting and pressing (S14), nonmetal mineral products (S13), chemical products (S12) and construction (S24). In these sectors, production and supply of electricity and heat (S22) and other services (S27) have their OFDEs mainly from consumption. Metals smelting and pressing (S14) and nonmetal mineral products (S13) have their OFDEs mainly from exports. Transportation, storage, postal, and telecommunications services (S25) have their OFDEs from consumption, capital formation, and export. This means the emission reduction measures of production and supply of electricity and heat (S22) and transportation, storage, postal, and telecommunications services (S25) can be considered from the final consumption perspective.
Combined with Table 2, for the main four sources of carbon emissions, transportation, storage, postal, and telecommunications services (S25), OFDEs and FEs respectively accounted for 41.7% and 58.3% of this sector’s direct emissions in 2017. This means the emission reduction measures of this sector need to be considered from both the demand and supply perspectives. Production and supply of electricity and heat’s (S22) FEs, metals smelting and pressing’s (S14) FEs, and nonmetal mineral products’ (S13) FEs respectively accounted for 91.3%, 96.7%, and 93.5% of these respective sectors’ direct emissions in 2017. This means that compared to the demand perspective, it is effective to consider emission reduction measures for these three sectors from the supply perspective.
Table 3 shows the identification results of China’s key carbon emission sectors from 2005 to 2017. It can be seen that the status of most sectors’ emission effects remained stable, but some sectors were changeable. For example, Food and Tobacco (S06) shifted from a major sector of its own final demand emissions to other sectors in 2017, indicating a reduction in its OFDEs. To discuss the various reasons for emission effects in different sectors, the annual average increment of emission effects in different sectors and the driving relationship of emissions among different sectors can be further compared and analyzed.
3.2. Changes in Sectors’ Emission Effects
It can be found in Figure 1 that China’s carbon emissions showed different variation trends around 2012, with rapid growth from 2005 to 2012 and a fluctuating trend from 2012 to 2017. Therefore, we divide the sample period into two stages and compare the increase of every sector’s emission effects in each stage. Table 4 shows the average annual increment of every sector’s emission effects in two stages.
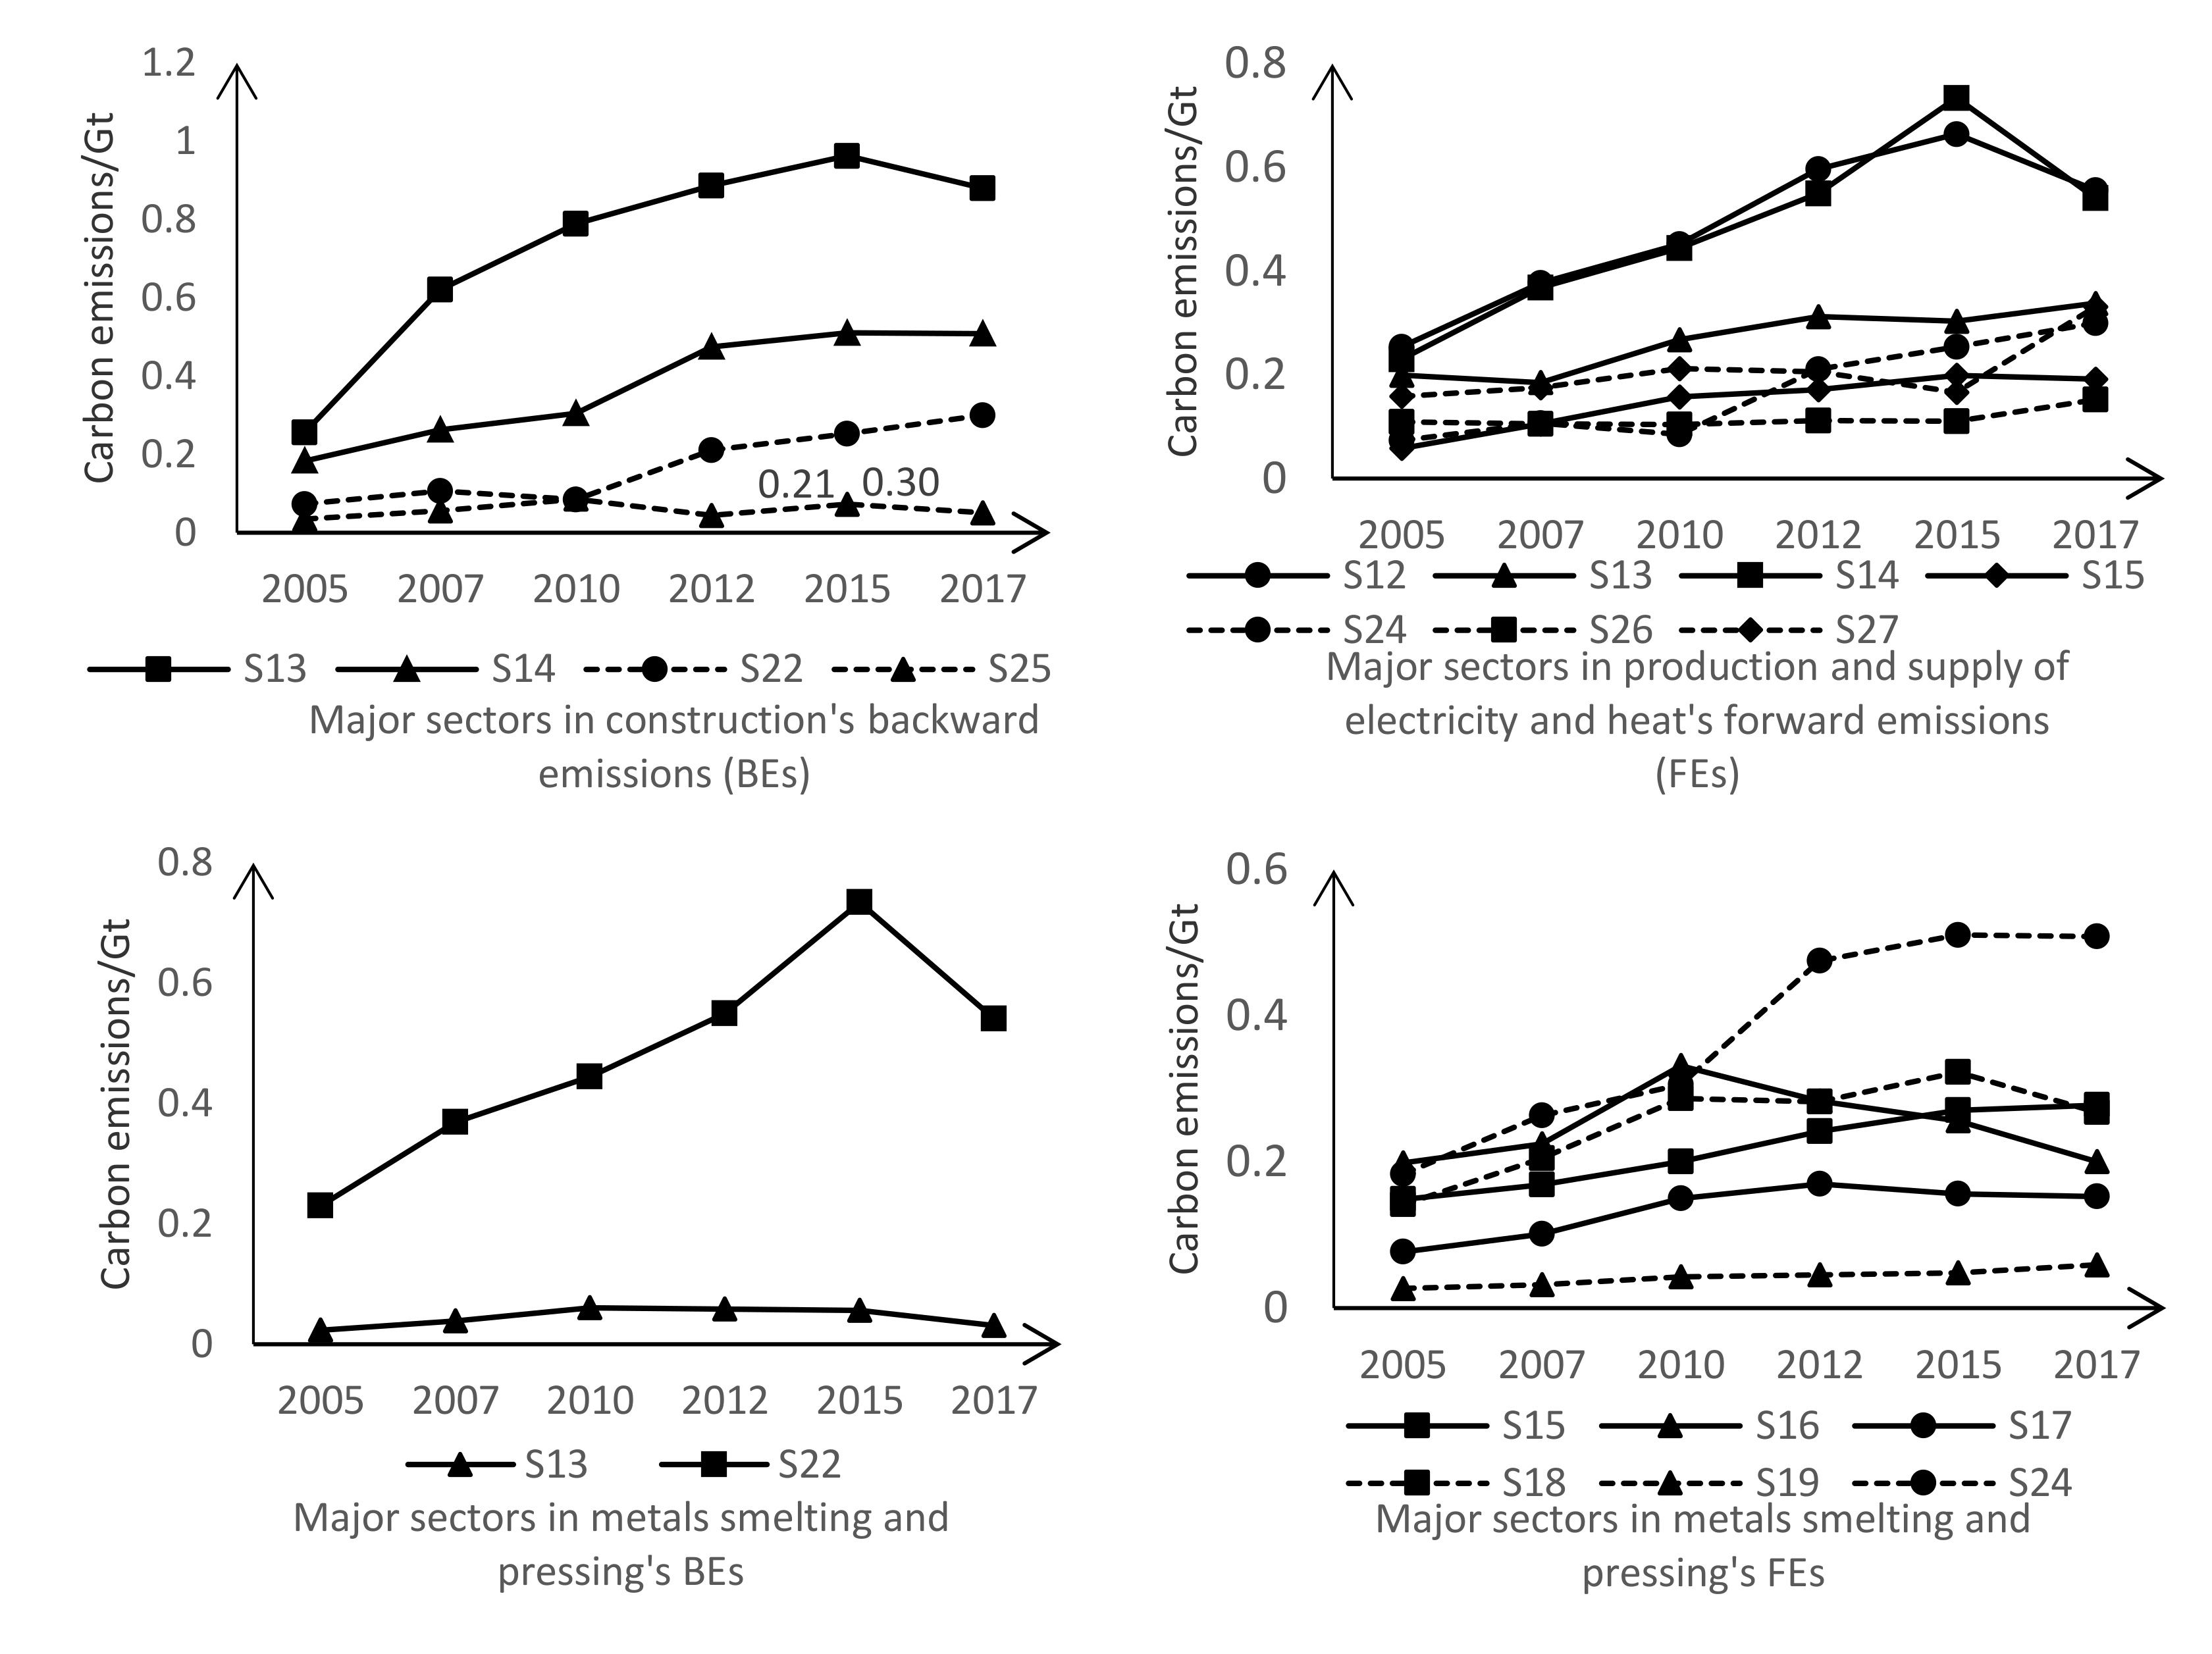
In the first stage, from 2005 to 2012, the growth of emissions in China driven by construction (S24) was the greatest. Its average annual BEs increment reached 155 million tons, followed by chemical products (S12), metals smelting and pressing (S14), and metal products (S15). This stage coincides with the rapid development period of China’s construction, chemical, and steel industries. Under the policies of accelerating infrastructure investment, stimulating real estate, and upgrading public–private partnership, the output value of the construction industry kept sharply rising. This drove a rapid emission growth of high-carbon sectors and made the construction industry the most important driving force for the growth of China’s emissions at this stage. In terms of FEs, production and supply of electricity and heat (S22) and metals smelting and pressing (S14) were the main sources of China’s carbon emission growth at this stage. Their average annual FEs increments reached 235 million tons and 110 million tons, respectively, followed by nonmetal mineral products (S13). At the same time, in terms of OFDEs, the social final demand mainly caused the continuous emission increase of production and supply of electricity and heat (S22) and transportation, storage, postal, and telecommunications services (S25). This is related to the expansion of urbanization and the improvement of residents’ consumption levels.
The second stage is from 2012 to 2017. In this stage, the incremental situation of sectors’ emission effects had a significant change. In terms of BEs, the development of other services (S27) became an important driver of emission growth, followed by construction (S24); transportation, storage, postal, and telecommunications services (S25); and wholesale, retail trade, lodging and catering services (S26). The sectors with the most significant increases in FEs were production and supply of electricity and heat (S22) and transportation, storage, postal, and telecommunications services (S25). These two sectors became the main sources of emission growth. The reason for these changes cannot be separated from the new normal of economic development, the progress of supply-side structural reform and the reduction of overcapacity and excess inventory in China. These policies have curbed the brutal growth of the property market. Bubbles and inventories in the real estate and steel industries have been squeezed continuously. The decline of small steel mills has provided the development space for high-quality steel factories, which reduces energy consumption and emissions. However, with the booming development of e-commerce, the reform of technology promotes the rapid growth of the service industry, such as in retail and catering. At the same time, the development of online and offline consumption modes and the upgrading of traffic tools mean that the OFDEs of transportation, storage, postal, and telecommunications services (S25) keep increasing.
Comparing the two stages shows that, from the perspective of increment, transportation, storage, postal, and telecommunications services (S25), wholesale, retail trade, lodging, and catering services (S26); and other services (S27) gradually become important sectors affecting the growth of emissions in China. This is a manifestation of the continuous evolution and upgrading of industrial structures in the late stage of industrialization. However, from the perspective of stock, according to the identification results of key sectors and emission effects in Table 2 and Table 3, sectors such as construction (S24), chemical products (S12), and metals smelting and pressing (S14) still have a significant impact on emissions in China.
3.3. The Driving Relationship of Emissions among Sectors
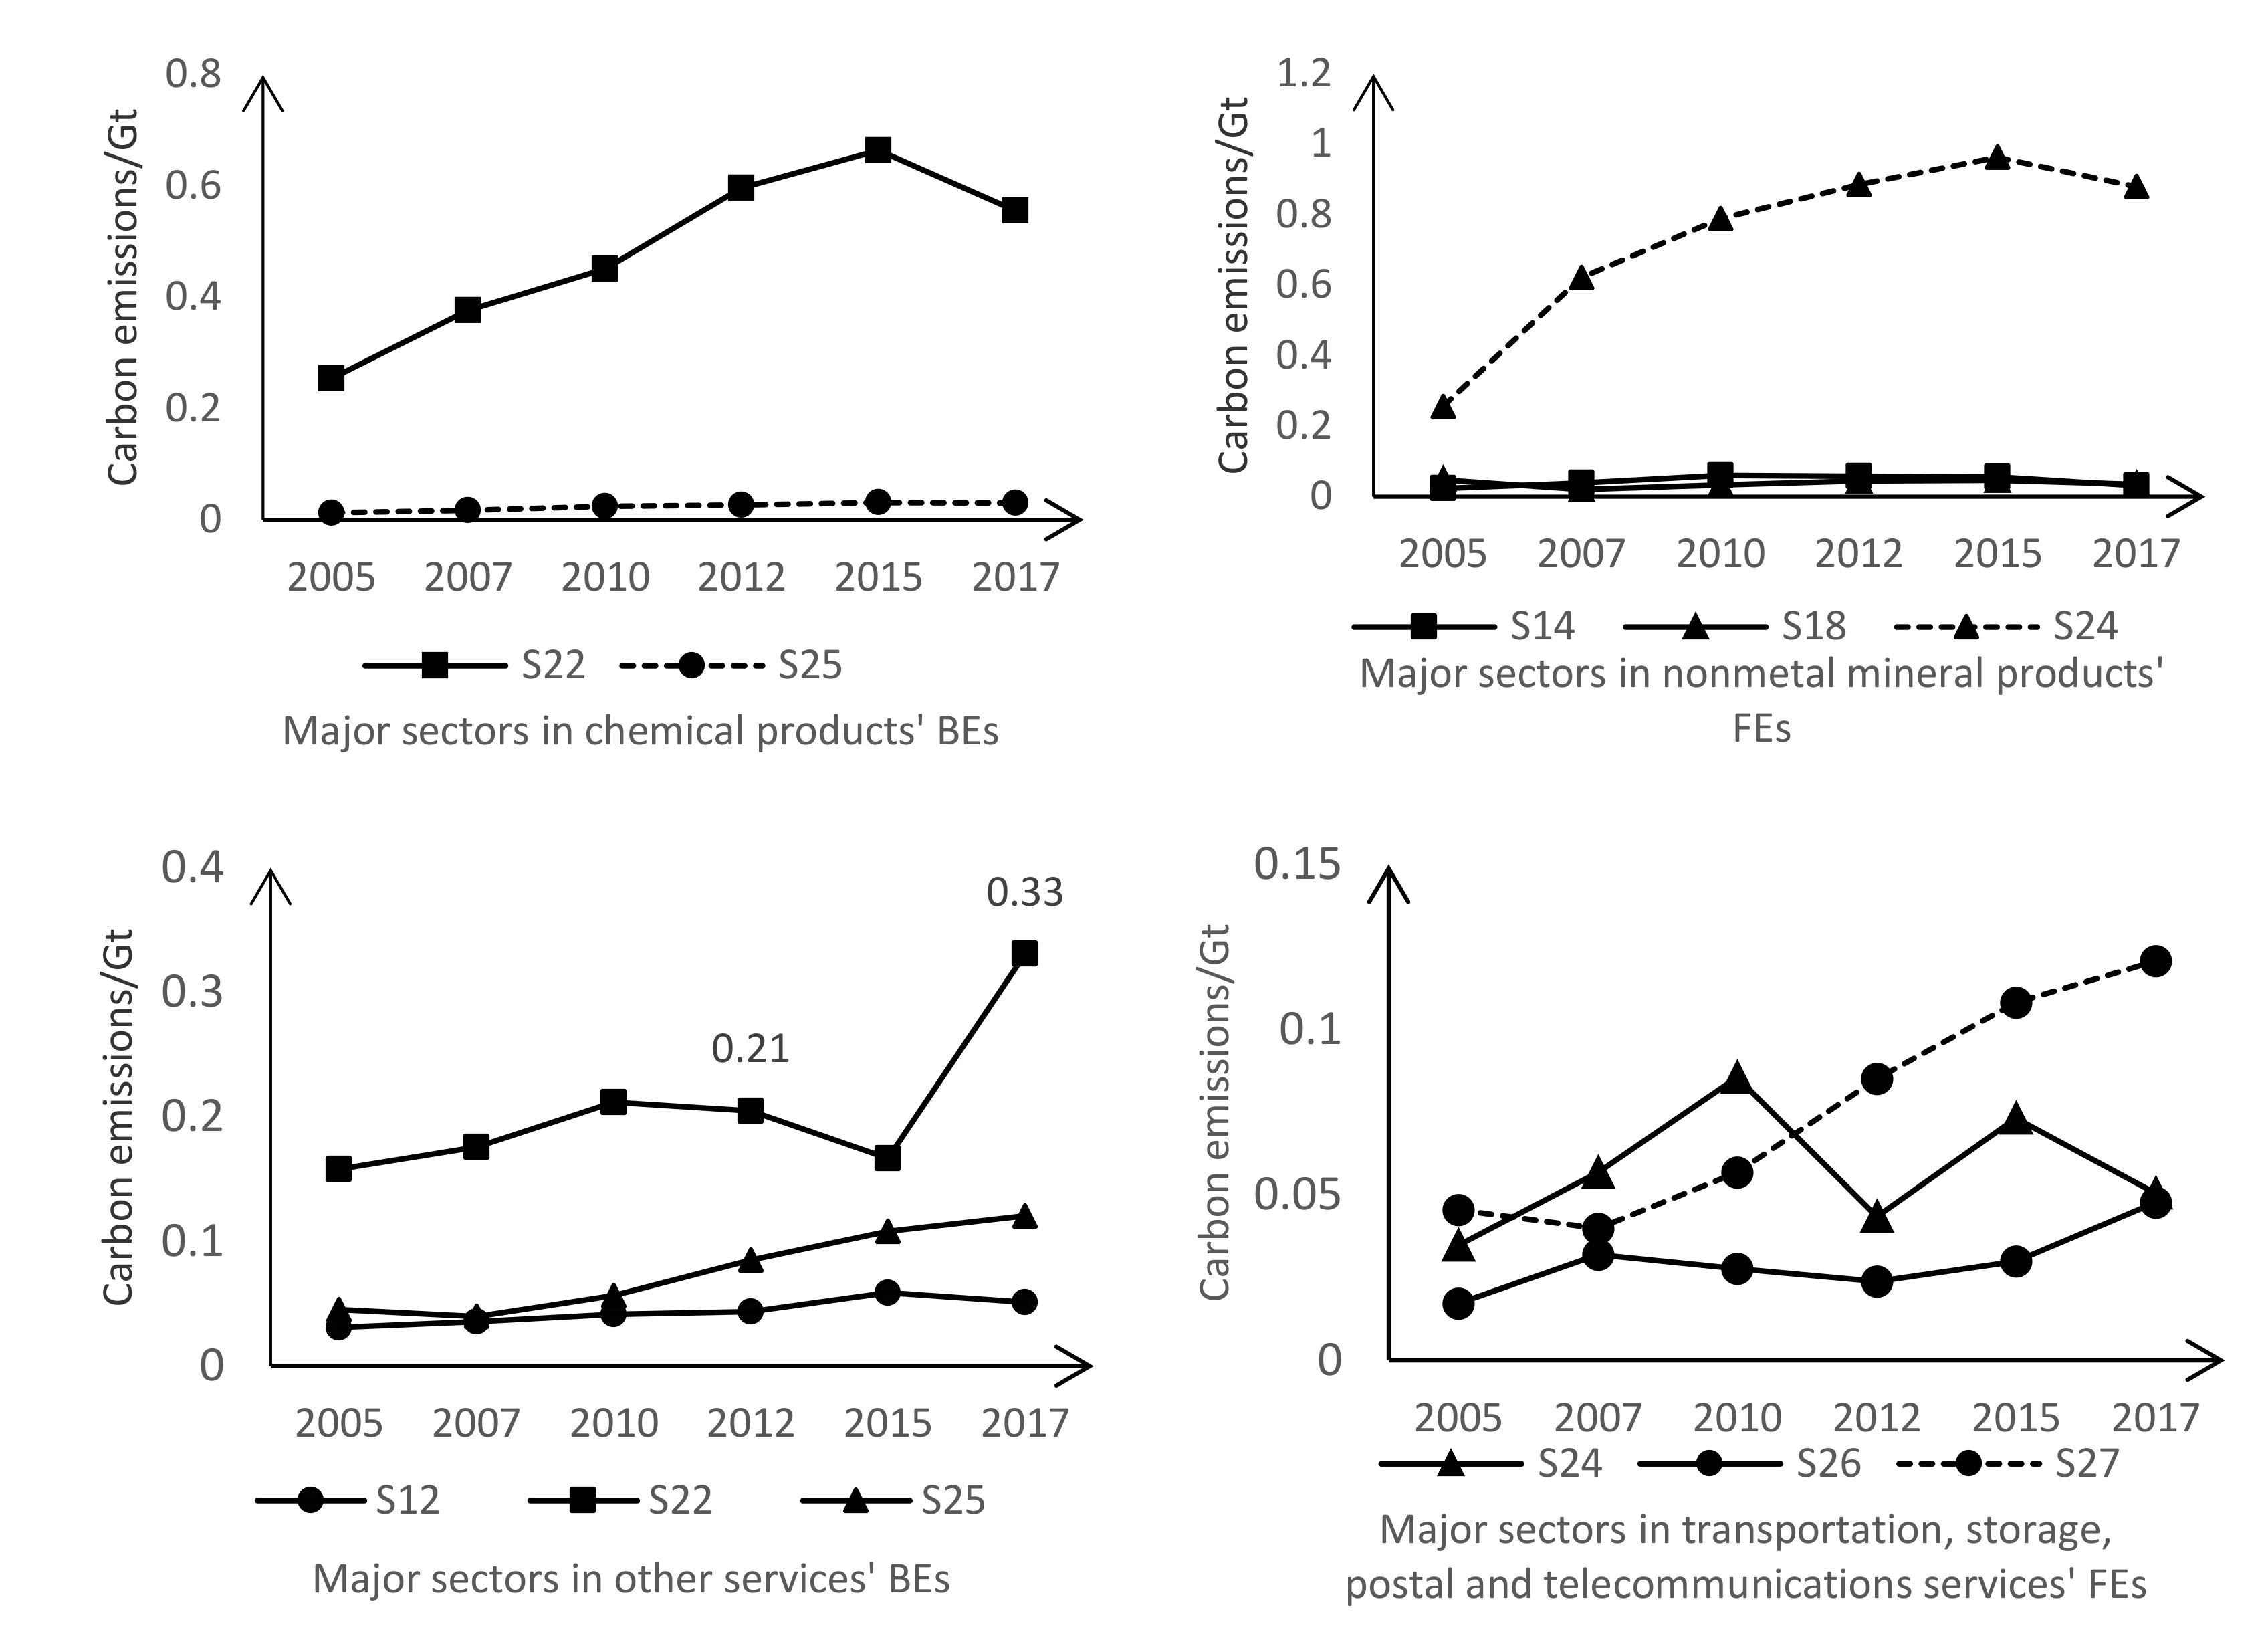
The matrix of Equation (8) can be used to decompose the forward and backward emission effects of each sector. Taking the BEs of nonmetal mineral products (S13) as an example, the column vectors corresponding to this sector in the matrix of different years can be arranged in Table 5. The data in Table 5 represent each other sectors’ emissions driven by the production of nonmetal mineral products (S13) in different years. From Table 5, we can find that the production of nonmetal mineral products (S13) mainly drives the emission growth of production and supply of electricity and heat (S22). For the FEs of a sector, the corresponding row vectors in the matrix can be similarly arranged, and the data in the corresponding table represent this sector’s carbon emissions driven by the production of each other sector. Thus, the driving relationship of emissions among some major sectors with emission effects increasing can be sorted out in the form of Figure 3.
From Figure 3, the rapid development of construction (S24) in the first stage mainly drove the emission growth of nonmetal mineral products (S13), metals smelting and pressing (S14), and production and supply of electricity and heat (S22). The emission growth of metals smelting and pressing (S14) and nonmetal mineral products (S13) was mainly caused by the development of construction (S24). The emission growth of metals smelting and pressing (S14) was also affected by the production increase of metal products (S15), equipment for general and special purposes (S16), and electric equipment and machinery (S18). The production expansion of chemical products (S12) and metals smelting and pressing (S14) mainly resulted in the emission growth of production and supply of electricity and heat (S22), and the forward emission growth of production and supply of electricity and heat (S22) was also strongly related to the production expansion of the chemical products (S12) and metals smelting and pressing (S14).
These points indicate that the rapid FEs increment of production and supply of electricity and heat (S22), metals smelting and pressing (S14), and nonmetal mineral products (S13) at the first stage was mainly caused by the production expansion of construction (S24), chemical products (S12), metal products (S15), etc. For the chemical, metal products and other manufacturing industries, their various products such as chemical fertilizers, metal components and equipment have been widely used in agriculture, service and other industries. The development of the national economy continues to push the production expansion of these manufacturing industries, and these manufacturing industries further drive the emission growth of electricity and metals smelting industries.
In the second stage, it can be found that the driving effects of construction (S24) and chemical products (S12) on other sectors’ emissions were decreasing, but the driving effects of other services (S27) on other sectors’ emissions were increasing. The steady development of other services (S27) mainly led to the emission increase of production and supply of electricity and heat (S22) and drove the emission increase of transportation, storage, postal, and telecommunications services (S25). The forward emission increase of production and supply of electricity and heat (S22) at this stage was mainly caused by the development of other services (S27), followed by construction (S24). The continuous emission growth of transportation, storage, postal, and telecommunications services (S25) was also mainly caused by the development of other services (S27). Meanwhile, the driving impact of wholesale, retail trade, lodging, and catering services (S26) on the emission growth of transportation, storage, postal, and telecommunications services (S25) was constantly strengthened.
These points indicate that the FEs increment of production and supply of electricity and heat (S22) and transportation, storage, postal, and telecommunications services (S25) during the second stage was mainly related to the development of other services (S27) and wholesale, retail trade, lodging, and catering services (S26). Other services include finance, education, and health services, whose development relies on sectors such as electricity and transport. At the same time, the expansion of online channels in retail and catering industries and the improvement of enterprise logistics systems also contribute to the emission growth of transportation.
In addition, it can be also found that the overall key emission sectors play a carbon transfer role between the forward-emission-dominant sectors and backward-emission-dominant sectors. For example, as the overall key sector, the emissions of metals smelting and pressing (S14) was mainly caused by construction (S24), metal products (S15), equipment for general and special purposes (S16), electric equipment and machinery (S18), and other backward-emission-dominant sectors. At the same time, the production of metals smelting and pressing (S14) mainly drove the emissions of forward-emission-dominant sectors such as production and supply of electricity and heat (S22).
3.4. The Impact of Major Emission Paths’ Changes On the Emissions Per GDP and Energy Mix
From the major sectors with emission effects increasing and the driving relationship of emissions among these sectors, we can find that the major sector emission paths affecting the growth of emissions in China differ between the first stage and the second stage. The major sectors driving the increasing of other sectors’ emissions shifted from construction and manufacturing industries to service industries. This structural change further led to the structural emission change from electricity and metal smelting industries to electricity and transportation industries. However, this structural change not only impacts the emission structure but also the substantial change in emissions per unit of GDP and energy mix.
Because the services and other backward-emission-dominant sectors and overall key emission sectors have the emission effect characteristic of driving other sector’s emissions, we can use the FEs per unit output of these sectors to indicate the impact of these sectors on emission per unit of GDP. From Figure 4, it can be found that the FEs per unit output of other services (S27) from 2005–2017 were far less than those of construction (S24), chemical products (S12), metal products (S15), and other manufacturing industries. Meanwhile, the carbon emissions per unit output of other services (S27) from 2005 to 2017 was also less than that of chemical products (S12), metal products (S15), and other manufacturing industries. This means that the production of service industries is cleaner than construction and manufacturing. With the increase in the contribution of service industries’ production compared to GDP and the decrease in the contribution of construction and manufacturing industries’ production compared to GDP in China, the increase in emissions does not keep pace with the increase in GDP. This would make the emissions per unit of GDP in China decrease further.
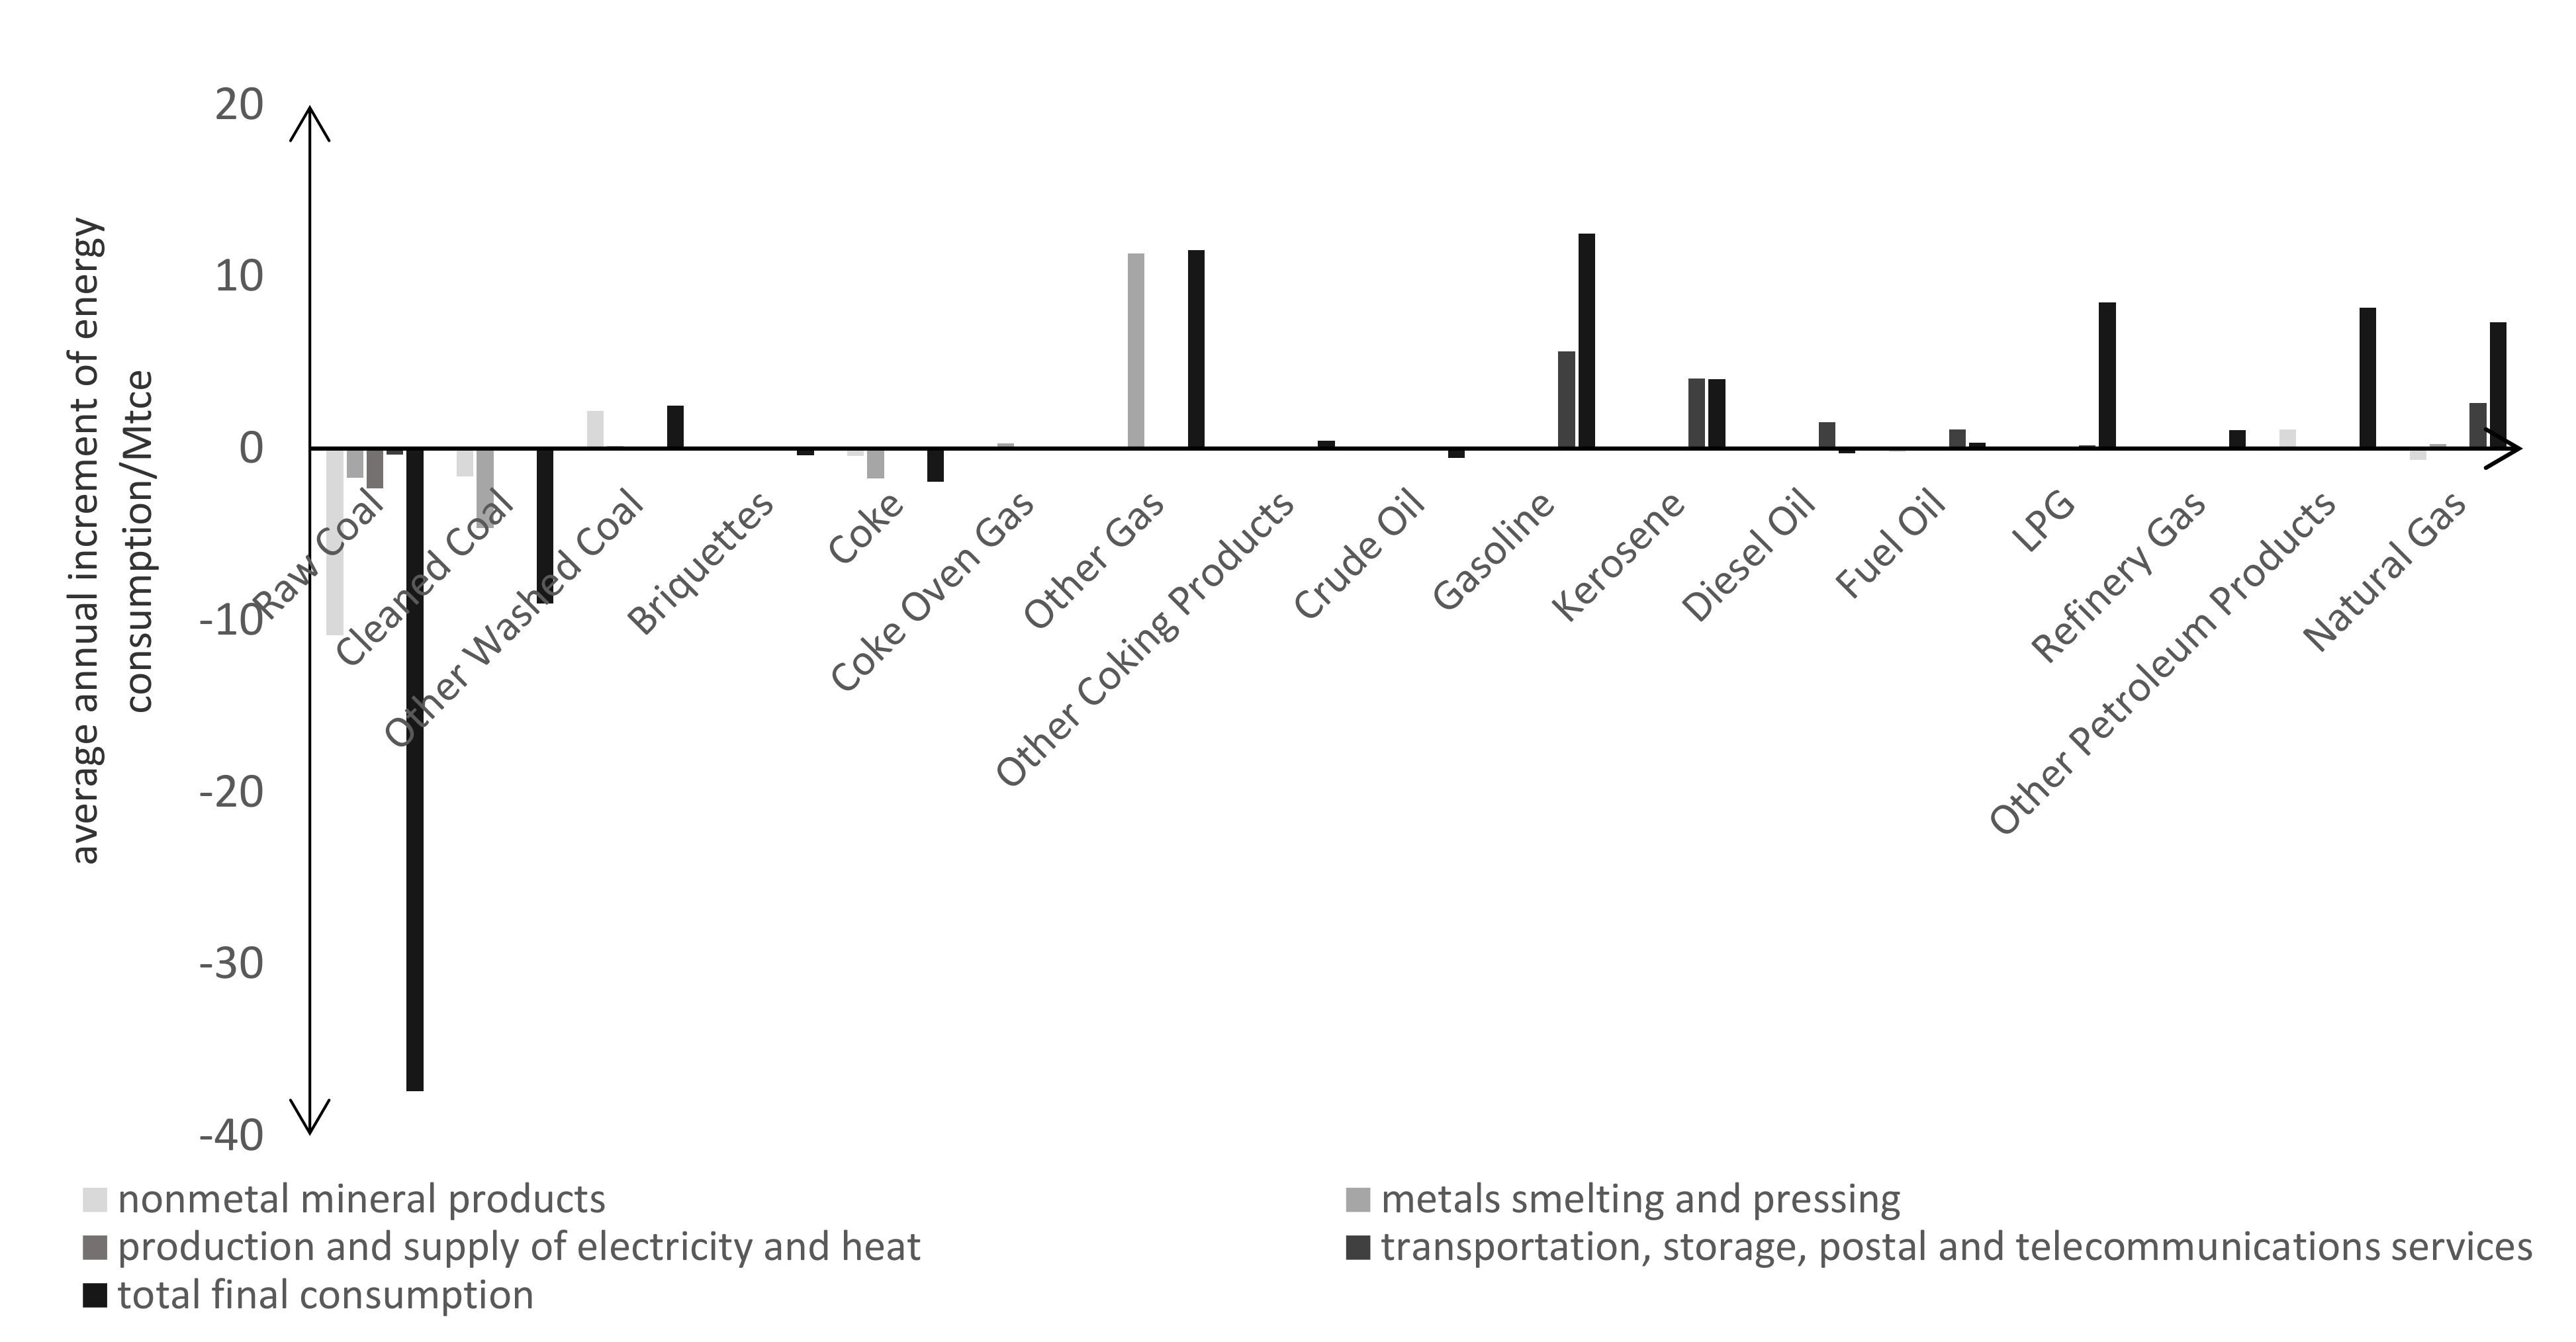
The production of forward-emission-dominant sectors and overall key emission sectors requires a large amount of energy consumption, so these sectors are the main sources of carbon emissions. Due to the differences between these sectors’ energy consumption, with their structural change, the energy consumption structure would also change. Figure 5 shows the average annual increment in the consumption of 17 types of energy in the major four emission sectors from 2012 to 2017. It can be seen that due to the emission-structural change from electricity and metal smelting industries to electricity and transportation industries, the raw coal and cleaned coal consumptions of nonmetal mineral products (S13) and metal smelting and pressing (S14) were decreasing, and the gasoline, kerosene, and the amount of natural gas consumed by transportation, storage, postal, and telecommunications services (S25) was increasing. At the same time, with the increase in renewable energy use and the decrease in coal power in recent years, the consumption of coal was further decreasing. This would reduce the proportion of coal and increase the proportion of oil and gas in the energy mix in China. In consideration of the resource situation in China, which is described as “rich coal, bits of gas, and poor oil” [30], the energy consumption structure changes would make the energy consumption rely more on renewable energies.
3.5. Policy Recommendations
For the forward-emission-dominant sectors, these sectors have a large number of forward emission components and a small number of backward emission components, which means that these sectors are mainly driven to emit. These sectors can reduce their emissions in their production process [24]. Therefore, these sectors can be involved in the framework of ETS to limit these sectors’ emissions. According to the research of Lin et al. (2020), the ETS revenue would also be redistributed to the renewable energy sources in these sectors to reduce these sectors’ emissions [11]. For example, the production and supply of electricity and heat sector can improve the generated proportion of renewable energy from the ETS revenue redistributions to reduce its emissions. The transportation, storage, postal, and telecommunications services can also develop new energy vehicle industries [31] to reduce this sector’s emissions.
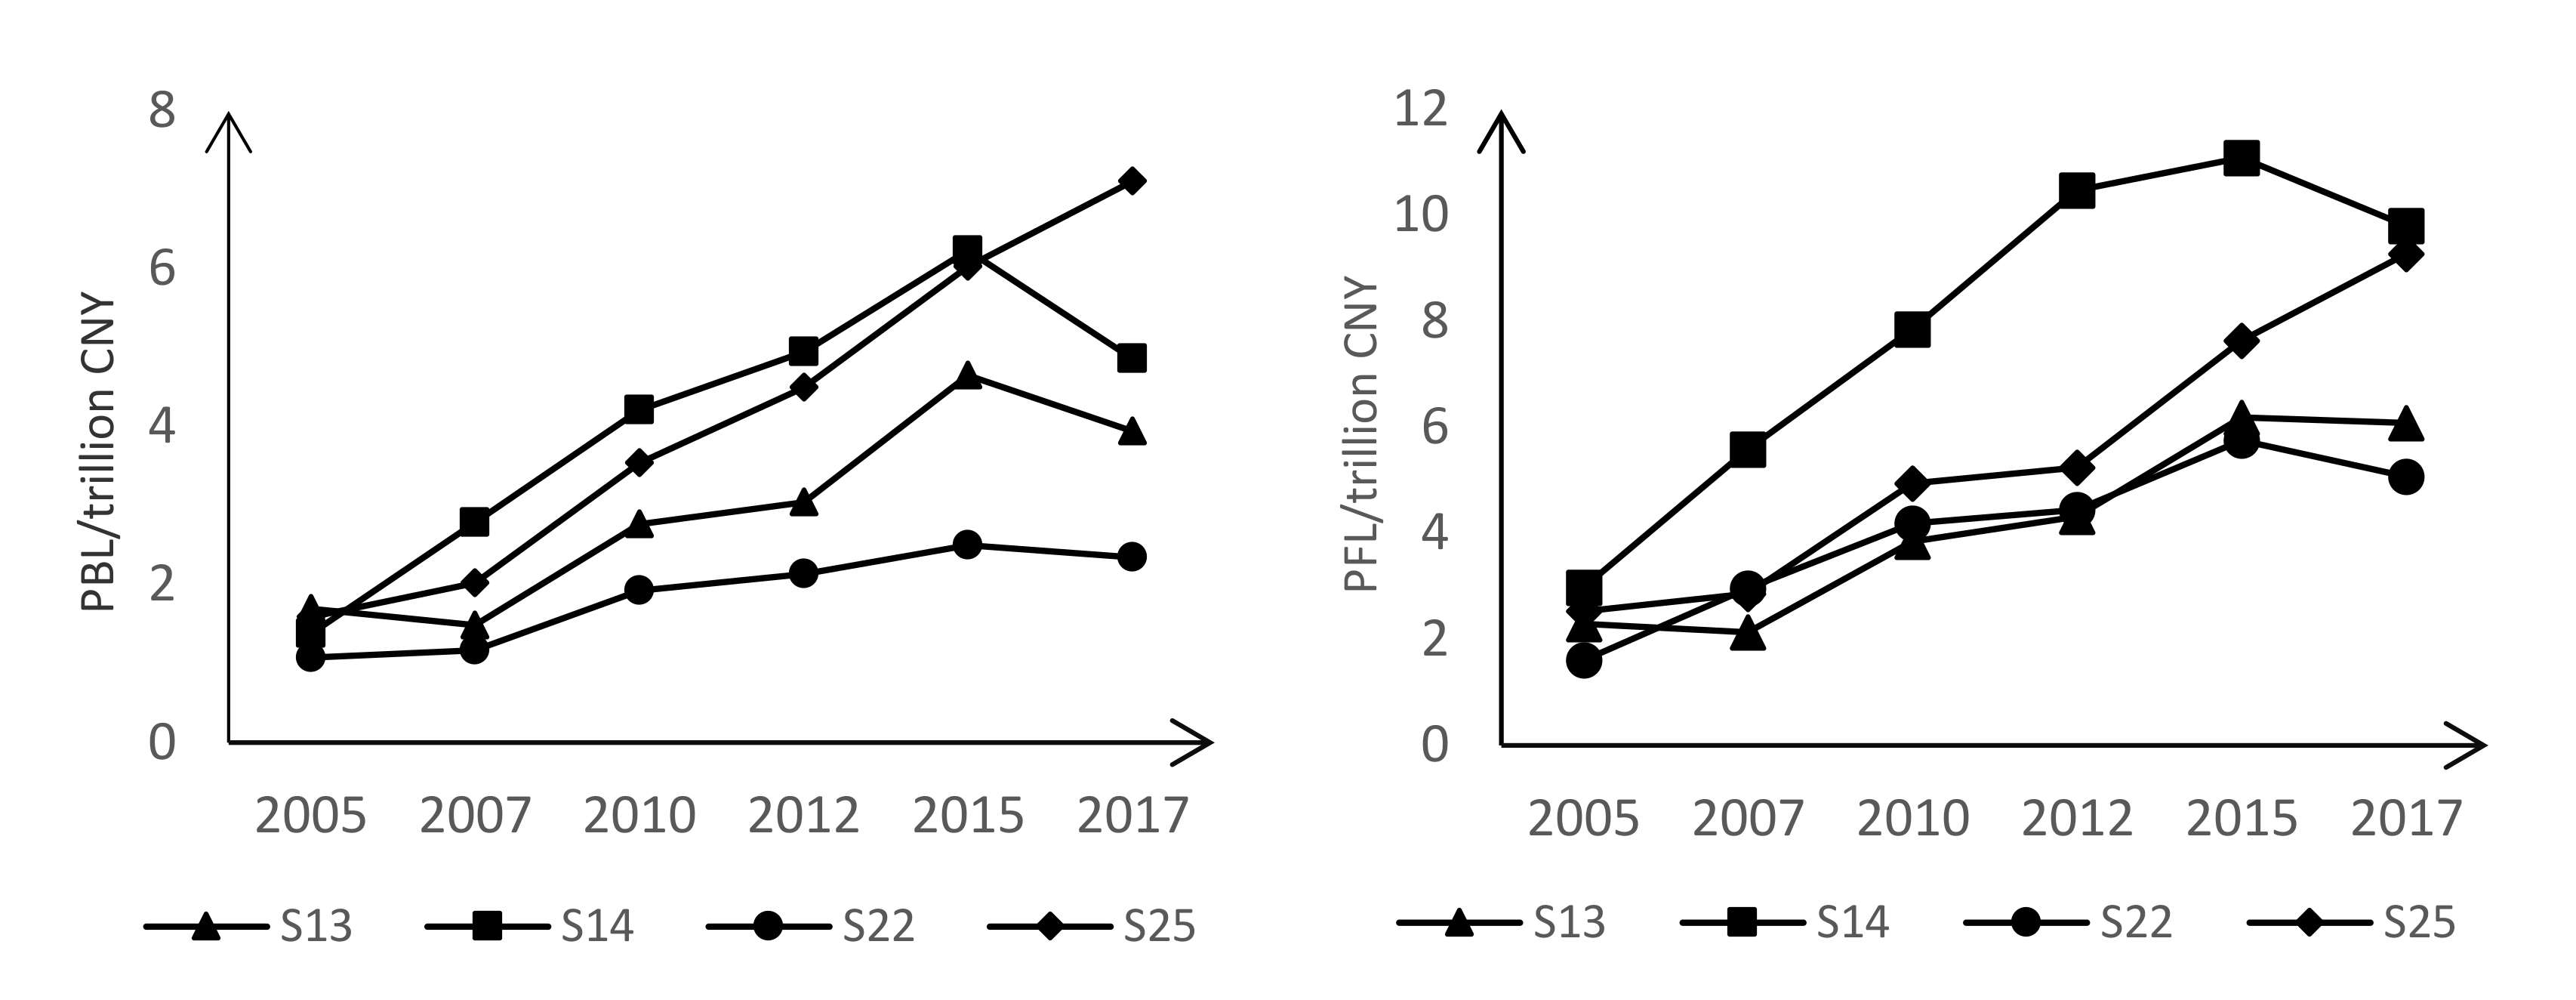
However, due to the uncertainty of innovation and the slow progress of technology, if the pressure to reduce emissions increases and direct intervention in industrial activities becomes necessary (such as the closing of factories), the economic impact of these practices on production in other sectors should be considered. Therefore, using the first item on the left side in Equation (4) and the conception of pure backward linkage (PBL) and pure forward linkage (PFL) proposed by Sonis et al. (1995) [32], we compared the economic impact of the major four sectors as emission sources on production in other sectors, which is presented in Figure 6. Combined with Table 2, it can be found that production and supply of electricity and heat (S22) had more carbon emissions and less economic impact on other sector’s production. This sector would be the right place to intervene directly.
The production of backward-emission-dominant sectors requires a large number of inputs from high-carbon sectors, so these sectors are more suitable to adopt the substitution strategies of inputs. For example, construction, combined with the driving relationship of emissions, mainly drives the carbon emissions of nonmetal mineral products and other material sectors. Therefore, the construction sector can be encouraged to use less energy-intensive building materials, such as biochar [33], to replace inputs from nonmetal mineral products and other high-emission sectors. The production of chemical products and other services mainly drives the carbon emissions of production and supply of electricity and heat, so chemical products and other services can be encouraged to use more electricity and heat from renewable energy sources.
For the overall key emission sectors, it is effective to reduce emissions by either ETS or substitution actions. In contrast, the two overall key emission sectors in China, metals smelting and pressing and nonmetal mineral products, have more forward emission components, so they are more inclined to be involved in the ETS. For the major sectors of own final demand emissions, the emission reduction measures of these sectors can be considered from the perspective of substituting final consumption products, such as encouraging the residents to use more electricity from renewable energy and new energy traffic tools. For other sectors, the substitution strategies of inputs can also be considered due to the large number of backward emission components in these sectors.
By analyzing the potential for substitution, the important polluting products that need to be substituted with substitution strategies can be further clarified. We can use the sum of one sector’s BEs, FEs, and OFDEs to represent the potential to reduce emissions by substituting products of this sector. Combined with Table 2, the potential to reduce emissions by substituting polluting products from production and supply of electricity and heat (S22) is greatest and reached 4.18 Gt in 2017, followed by metals smelting and pressing (S14) with 2.37 Gt and nonmetal mineral products (S13) with 1.61 Gt. These results indicate that in the substitution strategies, substituting polluting products from these three sectors should be paid more attention.
4. Conclusions
From both a supply and demand perspective, this paper identified key carbon emission sectors in China from 2005 to 2017 by an alternative input–output method and analyzed the increase of these sectors’ emission effects, as well as the driving relationship of emissions among these sectors.
From 2005 to 2017, the major sectors driving China’s carbon emissions included construction, chemical products, metals smelting and pressing, other services, metal products, etc. The production expansion of these sectors drove a large number of high-carbon sectors’ emissions. The main emission sources during this period were production and supply of electricity and heat; metals smelting and pressing; nonmetal mineral products; and transportation, storage, postal, and telecommunications services. All the above sectors have an important impact on the stock and increment of corresponding emission effects, and reasonable emission reduction measures for these sectors will play an important role in the reduction of emissions in China.
Society’s final demand mainly caused the emissions of seven sectors, namely production and supply of electricity and heat; transportation, storage, postal, and telecommunications services, other services; metals smelting and pressing; nonmetal mineral products; chemical products; and food and tobacco. In these sectors, transportation, storage, postal, and telecommunications services’ own final demand emissions and forward emissions accounted for 41.7% and 58.3%, respectively, of this sector’s direct emissions in 2017. Therefore, the emission reduction measures for this sector need to be considered comprehensively from the demand and the supply side. Meanwhile, the emissions of production and supply of electricity and heat, metals smelting and pressing, and nonmetal mineral products were mainly from the supply side. Therefore, compared with the demand side, it is more effective for these three sectors to consider the emission reduction measures from the supply side.
During the sample period, the major sector emission paths affecting the growth of carbon emissions in China shifted from manufacturing and construction industries to service industries. From 2005 to 2012, the rapid development of industrial sectors such as construction, chemical products, and metal products led to the rapid emission growth of metals smelting and pressing, and production and supply of electricity and heat. This made these sectors account for a considerable proportion of the backward or forward emissions. From 2012 to 2017, this trend began to change. The average annual backward emission increment of other services exceeded that of construction. Meanwhile, other services, together with wholesale, retail trade, lodging, and catering services drove the continuous emission growth of transportation, storage, postal, and telecommunications services. This means while China is paying attention to the emission reduction role of industrial sectors such as construction, chemical, metals smelting, and electricity industries, it also needs to pay attention to the emission reduction role of service industries such as wholesale and retail, transportation, etc.
This paper mainly concentrated on the impact of the supply side and demand side on sectors’ emissions. However, the linkage between the supply side and demand side and the impact of further extension of the supply chain on sectors’ emissions were not taken into account. These can be investigated in further studies. In terms of the analysis over time, the different input–output tables need consistency. Even though the input–output tables come from the same statistical source, the consistency is also difficult to satisfy completely. These might result in errors in the analysis results.
Author Contributions
Conceptualization, Y.Y. and Y.W.; methodology, Y.Y. and Y.W.; formal analysis, Y.W.; writing—original draft preparation, Y.C. and Y.W.; funding acquisition, Y.C.; writing—review and editing, F.J. All authors have read and agreed to the published version of the manuscript.
Funding
This study was supported by the National Social Science Foundation of China (Grant No. 19ZDA081) and the National Natural Science Foundation of China (Grant No. 91646201).
Acknowledgments
The authors gratefully appreciate the reviewers for their constructive comments and suggestions.
Conflicts of Interest
The authors declare no conflict of interest.
References
- Liu, Z.; Guan, D.; Wei, W.; Davis, S.J.; Ciais, P.; Bai, J.; Peng, S.; Zhang, Q.; Vogt-Schilb, A.; Marland, G.; et al. Reduced carbon emission estimates from fossil fuel combustion and cement production in China. Nature 2015, 524, 335–338. [Google Scholar] [CrossRef] [PubMed] [Green Version]
- Shan, Y.; Huang, Q.; Guan, D.; Klaus, H. China CO2 emission accounts 2016–2017. Sci. Data 2020, 7, 1–9. [Google Scholar] [CrossRef] [Green Version]
- 2050 China Energy and CO2 Emissions Research Group. 2050 China Energy and CO2 Emissions Report; Science Press: Beijing, China, 2009. [Google Scholar]
- Mu, Y.; Wang, C.; Cai, W. The economic impact of China’s INDC: Distinguishing the roles of the renewable energy quota and the carbon market. Renew. Sustain. Energy Rev. 2018, 81, 2955–2966. [Google Scholar] [CrossRef]
- Xie, X.; Shao, S.; Lin, B. Exploring the driving forces and mitigation pathways of CO2 emissions in China’s petroleum refining and coking industry: 1995–2031. Appl. Energy 2016, 184, 1004–1015. [Google Scholar] [CrossRef]
- Martin, R.; Muûls, M.; Wagner, U.J. The impact of the EU ETS on regulated firms: What is the evidence after ten years? Rev. Environ. Econ. Policy 2016, 10, 129–148. [Google Scholar] [CrossRef] [Green Version]
- Oestreich, A.M.; Tsiakas, I. Carbon emissions and stock returns: Evidence from the EU Emissions Trading Scheme. J. Bank. Financ. 2015, 58, 294–308. [Google Scholar] [CrossRef]
- Liu, Y.; Tan, X.J.; Yu, Y.; Qi, S.Z. Assessment of impacts of Hubei Pilot emission trading schemes in China—A CGE-analysis using Term CO2 model. Appl. Energy 2017, 189, 762–769. [Google Scholar] [CrossRef]
- Xian, Y.; Wang, K.; Wei, Y.-M.; Huang, Z. Would China’s power industry benefit from nationwide carbon emission permit trading? An optimization model-based ex post analysis on abatement cost savings. Appl. Energy 2019, 235, 978–986. [Google Scholar] [CrossRef] [Green Version]
- Lin, B.; Jia, Z. What are the main factors affecting carbon price in Emission Trading Scheme? A case study in China. Sci. Total Environ. 2019, 654, 525–534. [Google Scholar] [CrossRef]
- Lin, B.; Jia, Z. Is emission trading scheme an opportunity for renewable energy in China? A perspective of ETS revenue redistributions. Appl. Energy 2020, 263, 978–986. [Google Scholar] [CrossRef]
- Shen, L.; Lou, Y.; Huang, Y.; Chen, J. A driving–driven perspective on the key carbon emission sectors in China. Nat. Hazards 2018, 93, 349–371. [Google Scholar] [CrossRef]
- Sun, J.; Chen, Z.; Zhao, R.; Huang, X.; Lai, L. Research on carbon emission footprint of China based on input–output model. China Popul. Resour. Environ. 2010, 20, 28–34. (In Chinese) [Google Scholar]
- Zhang, Q.; Nakatani, J.; Moriguchi, Y. Compilation of an Embodied CO2 Emission Inventory for China Using 135-Sector Input–Output Tables. Sustainability 2015, 7, 8223–8239. [Google Scholar] [CrossRef] [Green Version]
- Alcantara, V.; Padilla, E. “Key” sectors in final energy consumption: An input–output application to the Spanish case. Energy Policy 2003, 31, 1673–1678. [Google Scholar] [CrossRef]
- Piaggio, M.; Alcantara, V.; Padilla, E. Greenhouse gas emissions and economic structure in Uruguay. Econ. Syst. Res. 2014, 26, 155–176. [Google Scholar] [CrossRef]
- Guo, J.; Zhang, J.; Zhang, K.-B. The key sectors for energy conservation and carbon emissions reduction in China: Evidence from the input–output method. J. Clean. Prod. 2018, 179, 180–190. [Google Scholar] [CrossRef]
- Alcántara, V.; Padilla, E. An input–output analysis of the “key” sectors in CO2 emissions from a production perspective: An application to the Spanish economy. Work. Pap. 2006, 1, 1–21. [Google Scholar]
- Othman, J.; Jafari, Y. Identification of the key sectors that produce CO2 emissions in Malaysia: Application of input–output analysis. Carbon Manag. 2016, 7, 1–28. [Google Scholar] [CrossRef]
- Heimler, A. Linkages and Vertical Integration in the Chinese Economy. Rev. Econ. Stat. 1991, 73, 261–267. [Google Scholar] [CrossRef]
- Wen, W.; Wang, Q. Identification of key sectors and key provinces at the view of CO2 reduction and economic growth in China: Linkage analyses based on the MRIO model. Ecol. Indic. 2019, 96, 1–15. [Google Scholar] [CrossRef]
- Alcantara, V.; Del Río, P.; Hernández, F. Structural analysis of electricity consumption by productive sectors. The Spanish case. Energy 2010, 35, 2088–2098. [Google Scholar] [CrossRef]
- Qian, M.; Lu, Z.; Wang, J. Analysis of carbon propagation effects of industrial sectors. China Popul. Resour. Environ. 2014, 24, 82–88. (In Chinese) [Google Scholar]
- Alcántara, V.; Padilla, E. Key sectors in greenhouse gas emissions in Spain: An alternative input–output analysis. J. Ind. Ecol. 2019. [Google Scholar] [CrossRef]
- Milana, C. Direct and indirect requirements for gross output in input–output analysis. Metroeconomica 1985, 37, 283–292. [Google Scholar] [CrossRef]
- Miyazawa, K. Internal and external matrix multipliers in the input–output model. Hitotsubashi J. Econ. 1966, 7, 38–55. [Google Scholar]
- National Bureau of Statistics of China (NBS). China Statistical Yearbook. Available online: https://www.stats.gov.cn/english/Statisticaldata/AnnualData/ (accessed on 3 May 2020).
- China Emission Accounts and Datasets (CEADs). Available online: http://www.ceads.net/data/ (accessed on 13 June 2020).
- Hu, Q. Input Output Analysis; Tsinghua University Press: Beijing, China, 2019; p. 42. [Google Scholar]
- Yang, Q.; Zhang, L.; Zou, S.; Zhang, J. Intertemporal optimization of the coal production capacity in China in terms of uncertain demand, economy, environment, and energy security. Energy Policy 2020, 139, 1–12. [Google Scholar] [CrossRef]
- Zuo, W.; Li, Y.; Wang, Y. Research on the optimization of new energy vehicle industry research and development subsidy about generic technology based on the three-way decisions. J. Clean. Prod. 2019, 212, 46–55. [Google Scholar] [CrossRef]
- Sonis, M.; Guilhoto, J.J.M.; Hewings, G.J.; Martins, E.B. Linkages, key sectors, and structural change: Some new perspectives. Dev. Econ. 1995, 33, 243–246. [Google Scholar] [CrossRef]
- Liu, R.; Xiao, H.; Guan, S.; Zhang, J.; Yao, D. Technology and method for applying biochar in building materials to evidently improve the carbon capture ability. J. Clean. Prod. 2020, 273, 1–15. [Google Scholar] [CrossRef]
Figure 1.
Carbon emissions of China from 2005 to 2017.

Figure 2.
The emissions to satisfy the own final demand in 2017 and the decomposition results of each sector’s own final demand emission effects.
Figure 2.
The emissions to satisfy the own final demand in 2017 and the decomposition results of each sector’s own final demand emission effects.

Figure 3.
The driving relationship of emissions among sectors.


Figure 4.
Forward emissions (FEs) per unit output and carbon emissions per unit output of the backward-emission-dominant sectors and overall key emission sectors from 2005–2017.
Figure 4.
Forward emissions (FEs) per unit output and carbon emissions per unit output of the backward-emission-dominant sectors and overall key emission sectors from 2005–2017.

Figure 5.
The average annual increment in the consumption of 17 types of energy from 2012–2017.

Figure 6.
The economic impact of the major four emission sectors on production in other sectors from 2005–2017.
Figure 6.
The economic impact of the major four emission sectors on production in other sectors from 2005–2017.


Table 1.
Aggregated emission sectors.
| Symbol | Sector | Symbol | Sector |
|---|---|---|---|
| S01 | farming, forestry, animal husbandry, fishery, and water conservancy | S15 | metal products |
| S02 | coal mining and dressing | S16 | equipment for general and special purposes |
| S03 | petroleum and natural gas extraction | S17 | transportation equipment |
| S04 | metals mining and dressing | S18 | electric equipment and machinery |
| S05 | nonmetal and other minerals mining and dressing | S19 | electronic and telecommunications equipment |
| S06 | food and tobacco | S20 | instruments, meters, cultural, and office machinery |
| S07 | textile industry | S21 | craft and other manufacturing industry |
| S08 | garments, leather, furs, and related products | S22 | production and supply of electricity and heat |
| S09 | timber processing and furniture manufacturing | S23 | production and supply of gas and water |
| S10 | printing, and cultural, educational, and sports articles | S24 | construction |
| S11 | petroleum processing and coking | S25 | transportation, storage, postal, and telecommunications services |
| S12 | chemical products | S26 | wholesale, retail trade, lodging, and catering services |
| S13 | nonmetal mineral products | S27 | other services |
| S14 | metals smelting and pressing | □ |
Table 2.
The key sectors of China’s carbon emissions in 2017 and their emission effects (Unit Gt).
| □ | □ | BEs | PCT | FEs | PCT | OFDEs | PCT | Direct Emissions | PCT |
|---|---|---|---|---|---|---|---|---|---|
| Overall key emission sectors | □ | □ | □ | □ | □ | □ | □ | □ | |
| S14 | Metals smelting and pressing | 0.63 | 8.3% | 1.63 | 21.3% | 0.11 | 8.9% | 1.74 | 19.5% |
| S13 | Nonmetal mineral products | 0.43 | 5.6% | 1.10 | 14.3% | 0.08 | 6.1% | 1.17 | 13.2% |
| □ | Total | 1.06 | 13.9% | 2.73 | 35.6% | 0.19 | 15.0% | 2.91 | 32.7% |
| Forward-emission-dominant sectors | □ | □ | □ | □ | □ | □ | □ | □ | |
| S22 | Production and supply of electricity and heat | 0.04 | 0.6% | 3.78 | 49.4% | 0.36 | 29.2% | 4.14 | 46.6% |
| S25 | Transportation, storage, postal and telecommunications services | 0.25 | 3.2% | 0.42 | 5.5% | 0.30 | 24.4% | 0.72 | 8.1% |
| Total | 0.29 | 3.8% | 4.20 | 54.9% | 0.66 | 53.6% | 4.86 | 54.7% | |
| Backward-emission-dominant sectors | □ | □ | □ | □ | □ | □ | □ | □ | |
| S24 | Construction | 1.81 | 23.6% | 0.00 | 0.0% | 0.05 | 3.8% | 0.05 | 0.5% |
| S12 | Chemical products | 0.69 | 9.0% | 0.21 | 2.7% | 0.05 | 4.2% | 0.26 | 2.9% |
| S27 | Other services | 0.56 | 7.4% | 0.06 | 0.8% | 0.11 | 8.9% | 0.17 | 1.9% |
| S15 | Metal products | 0.50 | 6.5% | 0.01 | 0.1% | 0.00 | 0.2% | 0.01 | 0.1% |
| S18 | Electric equipment and machinery | 0.40 | 5.3% | 0.00 | 0.0% | 0.00 | 0.1% | 0.00 | 0.0% |
| S16 | Equipment for general and special purposes | 0.37 | 4.8% | 0.01 | 0.1% | 0.02 | 1.3% | 0.03 | 0.3% |
| Total | 4.33 | 56.5% | 0.29 | 3.7% | 0.23 | 18.5% | 0.53 | 5.8% | |
| Other sectors | □ | □ | □ | □ | □ | □ | □ | □ | |
| □ | Other sectors | 1.98 | 25.9% | 0.44 | 5.8% | 0.16 | 12.9% | 0.60 | 6.8% |
Table 3.
The key sectors of China’s carbon emissions in different years.
| Year | 2005 | 2007 | 2010 | 2012 | 2015 | 2017 |
|---|---|---|---|---|---|---|
| Sector | □ | □ | □ | □ | □ | □ |
| S01 | ⬜ | ⬜ | ⬜ | ⬜ | ⬜ | ⬜ |
| S02 | ⬜ | ⬜ | ⬜ | ⬜ | ⬜ | ⬜ |
| S03 | ⬜ | ⬜ | ⬜ | ⬜ | ⬜ | ⬜ |
| S04 | ⬜ | ⬜ | ⬜ | ⬜ | ⬜ | ⬜ |
| S05 | ⬜ | ⬜ | ⬜ | ⬜ | ⬜ | ⬜ |
| S06 | ⬜◯ | ⬜◯ | ⬜◯ | ⬜◯ | ⬜◯ | ⬜ |
| S07 | ⬜ | ⬜ | ⬜ | ⬜ | ⬜ | ⬜ |
| S08 | ⬜ | ⬜ | ⬜ | ⬜ | ⬜ | ⬜ |
| S09 | ⬜ | ⬜ | ⬜ | ⬜ | ⬜ | ⬜ |
| S10 | ⬜ | ⬜ | ⬜ | ⬜ | ⬜ | ⬜ |
| S11 | ⬜ | ⬜ | ⬜ | ⬜ | ⬜ | ⬜ |
| S12 | ▲◯ | ⬤◯ | ▲◯ | ▲◯ | ▲◯ | ▲◯ |
| S13 | ⬤◯ | ⬤◯ | ⬤◯ | ⬤◯ | ⬤◯ | ⬤◯ |
| S14 | ⬤◯ | ⬤◯ | ⬤◯ | ⬤◯ | ⬤◯ | ⬤◯ |
| S15 | ▲ | ▲ | ▲ | ▲ | ▲ | ▲ |
| S16 | ▲ | ▲ | ▲ | ▲ | ▲ | ▲ |
| S17 | ⬜ | ⬜ | ▲ | ▲ | ⬜ | ⬜ |
| S18 | ▲ | ▲ | ▲ | ▲ | ▲ | ▲ |
| S19 | ▲ | ⬜ | ⬜ | ⬜ | ⬜ | ⬜ |
| S20 | ⬜ | ⬜ | ⬜ | ⬜ | ⬜ | ⬜ |
| S21 | ⬜ | ⬜ | ⬜ | ⬜ | ⬜ | ⬜ |
| S22 | ⯆◯ | ⯆◯ | ⯆◯ | ⯆◯ | ⯆◯ | ⯆◯ |
| S23 | ⬜ | ⬜ | ⬜ | ⬜ | ⬜ | ⬜ |
| S24 | ▲ | ▲ | ▲ | ▲ | ▲ | ▲◯ |
| S25 | ⯆◯ | ⯆◯ | ⯆◯ | ⯆◯ | ⯆◯ | ⯆◯ |
| S26 | ▲ | ⬜ | ⬜ | ⬜ | ⬜ | ⬜ |
| S27 | ▲◯ | ▲◯ | ▲◯ | ▲◯ | ▲◯ | ▲◯ |
Classification status: ⬤ Overall key emission sector; ⯆ Forward-emission-dominant sector; ▲ Backward-emission-dominant sector; ◯ Major sector of own final demand emissions (OFDEs); ⬜ Other sector.
Table 4.
The average annual increment of sectors’ emission effects in two periods (Unit Mt).
| Year | 2005–2012 | 2012–2017 | ||||
|---|---|---|---|---|---|---|
| Effect Type | BEs | FEs | OFDEs | BEs | FEs | OFDEs |
| Sector | ||||||
| S01 | 7.59 | 1.38 | 0.30 | −2.37 | 3.13 | 0.27 |
| S02 | −1.21 | 8.15 | 0.66 | −7.43 | −11.04 | −0.42 |
| S03 | 1.34 | 2.94 | 0.07 | −9.51 | −0.57 | −0.06 |
| S04 | 14.07 | 1.33 | −0.22 | −10.45 | −1.80 | −0.01 |
| S05 | 4.66 | 0.13 | 0.00 | 1.29 | −1.54 | 0.00 |
| S06 | 10.77 | 2.06 | 1.13 | 5.85 | −2.86 | −2.76 |
| S07 | 4.37 | 0.51 | −1.65 | −3.29 | −2.70 | −1.05 |
| S08 | 1.84 | 0.13 | 0.08 | −0.42 | −0.19 | −0.99 |
| S09 | 4.07 | −0.03 | 0.33 | 0.69 | −0.80 | −0.79 |
| S10 | 9.43 | −4.07 | −0.55 | 0.56 | −2.40 | −1.65 |
| S11 | 11.72 | 7.57 | 1.21 | −7.21 | −1.46 | 0.60 |
| S12 | 56.02 | 12.74 | 3.37 | −9.23 | −6.02 | −1.40 |
| S13 | 14.73 | 73.16 | 0.42 | 5.71 | −12.33 | −5.37 |
| S14 | 56.43 | 109.75 | 4.55 | −12.89 | −4.61 | 1.92 |
| S15 | 31.18 | 0.79 | 0.08 | 10.83 | −1.11 | −0.54 |
| S16 | 20.33 | −0.11 | 1.00 | −22.88 | −0.94 | −3.13 |
| S17 | 20.36 | −0.17 | 1.29 | −3.87 | −0.36 | −1.98 |
| S18 | 27.13 | 0.03 | 0.13 | −5.96 | −0.54 | −0.62 |
| S19 | 1.09 | 0.05 | −0.05 | 8.36 | −0.01 | −0.11 |
| S20 | −0.98 | −0.54 | −1.55 | 0.89 | −0.06 | −0.06 |
| S21 | −0.14 | 0.26 | −0.11 | 0.47 | −0.30 | −0.01 |
| S22 | 1.64 | 234.92 | 18.63 | −5.76 | 52.70 | 3.35 |
| S23 | 1.68 | −0.52 | −0.14 | 1.52 | −0.10 | −0.14 |
| S24 | 154.74 | −0.13 | 1.36 | 27.28 | −0.15 | 1.87 |
| S25 | 4.71 | 13.69 | 17.41 | 14.83 | 14.83 | 14.56 |
| S26 | −1.44 | 1.53 | 1.73 | 12.91 | 1.77 | −1.12 |
| S27 | 13.39 | 3.96 | 4.03 | 31.10 | 0.47 | 2.04 |
Table 5.
Each other sectors’ emissions driven by the production of nonmetal mineral products (Unit Gt).
Table 5.
Each other sectors’ emissions driven by the production of nonmetal mineral products (Unit Gt).
| Year | 2005 | 2007 | 2010 | 2012 | 2015 | 2017 |
|---|---|---|---|---|---|---|
| Sector | ||||||
| S01 | 0.00 | 0.00 | 0.00 | 0.00 | 0.00 | 0.00 |
| S02 | 0.01 | 0.01 | 0.02 | 0.01 | 0.01 | 0.01 |
| S03 | 0.00 | 0.00 | 0.00 | 0.00 | 0.00 | 0.00 |
| S04 | 0.00 | 0.00 | 0.00 | 0.00 | 0.00 | 0.00 |
| S05 | 0.01 | 0.01 | 0.01 | 0.01 | 0.01 | 0.01 |
| S06 | 0.00 | 0.00 | 0.00 | 0.00 | 0.00 | 0.00 |
| S07 | 0.00 | 0.00 | 0.00 | 0.00 | 0.00 | 0.00 |
| S08 | 0.00 | 0.00 | 0.00 | 0.00 | 0.00 | 0.00 |
| S09 | 0.00 | 0.00 | 0.00 | 0.00 | 0.00 | 0.00 |
| S10 | 0.00 | 0.00 | 0.00 | 0.00 | 0.00 | 0.00 |
| S11 | 0.00 | 0.00 | 0.01 | 0.01 | 0.01 | 0.01 |
| S12 | 0.03 | 0.01 | 0.01 | 0.01 | 0.02 | 0.01 |
| S13 | 0.00 | 0.00 | 0.00 | 0.00 | 0.00 | 0.00 |
| S14 | 0.02 | 0.01 | 0.03 | 0.02 | 0.03 | 0.04 |
| S15 | 0.00 | 0.00 | 0.00 | 0.00 | 0.00 | 0.00 |
| S16 | 0.00 | 0.00 | 0.00 | 0.00 | 0.00 | 0.00 |
| S17 | 0.00 | 0.00 | 0.00 | 0.00 | 0.00 | 0.00 |
| S18 | 0.00 | 0.00 | 0.00 | 0.00 | 0.00 | 0.00 |
| S19 | 0.00 | 0.00 | 0.00 | 0.00 | 0.00 | 0.00 |
| S20 | 0.00 | 0.00 | 0.00 | 0.00 | 0.00 | 0.00 |
| S21 | 0.00 | 0.00 | 0.00 | 0.00 | 0.00 | 0.00 |
| S22 | 0.20 | 0.18 | 0.27 | 0.31 | 0.30 | 0.34 |
| S23 | 0.00 | 0.00 | 0.00 | 0.00 | 0.00 | 0.00 |
| S24 | 0.00 | 0.00 | 0.00 | 0.00 | 0.00 | 0.00 |
| S25 | 0.02 | 0.01 | 0.01 | 0.01 | 0.02 | 0.01 |
| S26 | 0.00 | 0.00 | 0.00 | 0.00 | 0.00 | 0.00 |
| S27 | 0.00 | 0.00 | 0.00 | 0.00 | 0.00 | 0.00 |
Publisher’s Note: MDPI stays neutral with regard to jurisdictional claims in published maps and institutional affiliations. |
© 2020 by the authors. Licensee MDPI, Basel, Switzerland. This article is an open access article distributed under the terms and conditions of the Creative Commons Attribution (CC BY) license (http://creativecommons.org/licenses/by/4.0/).
Share and Cite
MDPI and ACS Style
Yuan, Y.; Wang, Y.; Chi, Y.; Jin, F. Identification of Key Carbon Emission Sectors and Analysis of Emission Effects in China. Sustainability 2020, 12, 8673. https://0-doi-org.brum.beds.ac.uk/10.3390/su12208673
AMA Style
Yuan Y, Wang Y, Chi Y, Jin F. Identification of Key Carbon Emission Sectors and Analysis of Emission Effects in China. Sustainability. 2020; 12(20):8673. https://0-doi-org.brum.beds.ac.uk/10.3390/su12208673
Chicago/Turabian StyleYuan, Yongke, Yixing Wang, Yuanying Chi, and Feng Jin. 2020. "Identification of Key Carbon Emission Sectors and Analysis of Emission Effects in China" Sustainability 12, no. 20: 8673. https://0-doi-org.brum.beds.ac.uk/10.3390/su12208673
Note that from the first issue of 2016, this journal uses article numbers instead of page numbers. See further details here.