Article

Can Material and Energy Be Saved by Differentiating Water Quality Targets in the Water Purification Process?

1
Department of Civil and Environmental Engineering, Ritsumeikan University, Shiga 525-8577, Japan
2
Circular Economy Research Institute, Tongji University, Shanghai 200092, China
*
Author to whom correspondence should be addressed.
Sustainability 2020, 12(20), 8730; https://0-doi-org.brum.beds.ac.uk/10.3390/su12208730
Submission received: 10 September 2020 / Revised: 5 October 2020 / Accepted: 15 October 2020 / Published: 21 October 2020
(This article belongs to the Section Resources and Sustainable Utilization)

Abstract

:
The current organization of water supply systems demands drinking standards for all the households’ usage of water. Few dual water systems, i.e., systems in which the quality of the water supplied is differentiated by types of use, exist but are mainly circumscribed to developing countries. Besides, bath and showers are so far considered as a potable use of water despite only drinking and cooking activities requiring the high-quality standards of potable water. The present work demonstrates how the principles of dual water systems can be incorporated into the sustainable concept of product-service system (PSS) using a dual water system of a municipal water supply treatment plant in France as a case study. The PSS is based on the water quality, and the bathing activity of households is considered with a dedicated standard for the first time. Two systems are considered, S1 and S2, supplied with the same raw water quality and treated with drinking (S1) bathing standards (S2). The quality parameters considered are total organic carbon (TOC) and turbidity (T) and the potential savings related to costs, material, and energy consumptions are assessed using EVALEAU as a process modeling tool. The treatment lines consisted of powdered activated carbon (PAC) addition, coagulation, flocculation, settling, and rapid sand filtration. Results show that material consumption can be reduced by 41% mainly through the decrease in chemical consumption associated with the change of requirement for the TOC parameter. On the opposite, energy consumption was found dependent on the water of volume treated rather than its quality leading to only marginal savings. The cost was decreased by 37% as a result of the reduction of the chemicals consumed.

1. Introduction

Decoupling environmental impacts from human activities is one of the important targets for achieving sustainable development. As underlined by Kanda and Nakagami [1], the linkage between wealth and environmental impact is complex combining policies related to production (cleaner production, resource productivity) and consumption (service intensity and sufficiency). Though the literature on production and consumption indicators is abundant [2,3,4,5], the combination of the two approaches seems to be the appanage of product-service systems (PSS). Product service systems can be defined as a mix of tangible products and intangible services designed and combined so that they are jointly capable of fulfilling final customer needs [6]. The sustainability effect of PSS is hypothesized from an aligned incentive between producers and customers on reducing the need for production compared to traditional business models in which producers’ benefits are directly dependent on the amounts produced [7]. Though environmental benefits have been observed, they are not automatic [8] or are difficult to assess because of the intangible part of the PSS [9]. Besides, the implementation of PSS in the economy is still rare, making it difficult to assess its efficiency for decoupling policies [10].
Product service systems focus on the service provided to the consumer. In the field of water supply, the main service is the quality of the water supplied. Indeed, the water quality is of core importance as 88% of the 1.8 million annual deaths due to diarrheal diseases are attributable to unsafe water supply, sanitation, and hygiene [11]. Besides, the absence of a safe water supply can severely impede economic development and the associated reduction of poverty. Consequently, access to drinkable water has been recognized as a core target of the millennium development goals [12]. The quality standard of drinking water is established by the World Health Organization [13] and declined at national levels as drinking water norms. The present research focuses on turbidity (T) measured in Nephelometric Turbidity units (NTU) and total organic carbon (TOC) as physical quality parameters. Turbidity standards exist in 85 countries and vary between 0.3 to 25 NTU with a median value of 5 NTU [14]. In developed countries such as Japan and France, where large municipal supplies are common, the standard is in the lower range and equals 2 NTU [15,16]. In practice, however, the water supplied in France has a turbidity of 0.1 NTU [17] following the WHO recommendations of 0.2 NTU or less for large municipal supplies [13]. The standard values for TOC are 3 mg/L in Japan [16] and 2 mg/L in France [15]. In practice, French water suppliers use the value of 1.3 mg/L [17].
The difference in quality between the extracted water and the quality standards demands the use of treatment processes. These processes consume energy, materials, and financial resources. The municipal water system indeed accounts for approximately 3–4 percent of direct energy use in the United States and represents as much as 30–40 percent of the total energy used by many local authorities [18]. Typical energy efficiency values for conventional treatment processes are 0.05–0.15 kWh/m3 but it reaches as much as 5.5–8.0 kWh/m3 for desalination processes [19]. The energy consumption for distribution process is 0.10 kWh/m3 in Sweden [20], 0.03–0.58 kWh/m3 in Germany, and 0.18–0.32 kWh/m3 in California [21]. Material consumption is also large combining materials used during the treatment processes (ozone, chlorine, coagulants, sand, etc.) and those related to the treatment plant and distribution infrastructures such as tanks and pipelines.
All the usages of water by households do not, however, require the drinking standards. Usages such as toilet flushing, bath or showers, laundry, cooking, gardening, and house cleaning indeed require lower quality water so that a reduction in the energy and material consumption associated with water treatment could be achieved. Water systems with differentiated water quality targets have been denominated as dual water systems in the literature. Barker et al. [22] showed the reuse of treated wastewater effluent for non-potable purposes in North Carolina could consume less energy than when using the potable network. Rainwater harvesting potential was investigated in Malaysia [23] and Vietnam [24] whereas the deterioration of source water quality in China [25] made a dual water distribution system both more economical and practical than the conventional system. For developed countries, the investigation of dual water systems is important in the context of aging infrastructure as a possibility for improving the efficiency of the current centralized municipal water system [26]. For developing countries, the poor quality and the absence of maintenance of the distribution system have often led to water leakages and poor water quality. The delivery of bottled water for potable use and non-potable water by pipelines has been proposed [27] as a solution but at the cost of the high energy consumption associated with the production of bottled water, 316–370 kWh/m3 [28].
Another issue of dual water systems is the determination of the share of the household water consumption associated with non-potable purposes. The amount of water consumed varies indeed among developed countries from 130 L/capita/day in Hamburg, Germany to 350 L/capita/day in Winnipeg, Canada and is associated with different usages [29]. These differences are due to cultural differences, e.g., washing cars at home instead of at a car-washing facility, and technical differences such as those related to flushing technologies. The potable use of water concerns the cooking activity, which represents 15–25% of the household water consumption in developed countries [29]. Dual water systems studied in the literature are nonetheless stricter considering bath and showers as part of the potable use. This is understandable as most countries have only bathing regulations related to recreational activities. In this context, it may be safer for health authorities to qualify as non-potable the activities for which the water does not enter into contact with the human body. This safety net has, however, consequences on the interest of developing dual water systems since the water consumption associated with bath accounts for as much as 25–40% of household water consumption [29]. In Japan, however, due to the ancestral culture of public baths, a bathing regulation exists and recommends a water quality of 2 NTU for turbidity and of 2 mg/L for TOC [30]. The consequence of considering bathing activities as a non-potable usage on cost, material, and the energy consumption is investigated in the present research. In this regard, our analysis of the literature on dual water systems revealed that material, energy, and cost savings are rarely investigated simultaneously and that dual water systems have so far not been integrated into the broader concept of product-service systems. This may be explained by the technical difficulties of linking water quality targets to cost, material, and energy consumption of treatment processes. Such an integrated model does not exist yet in Japan for example, but recent developments such as the EVALEAU model used in the present study propose process modeling life cycle assessment models to analyze the characteristics of treatment processes based on the delivered water quality [31,32]. The EVALEAU model deals with the municipal water supply in France where Euzen and Levi [
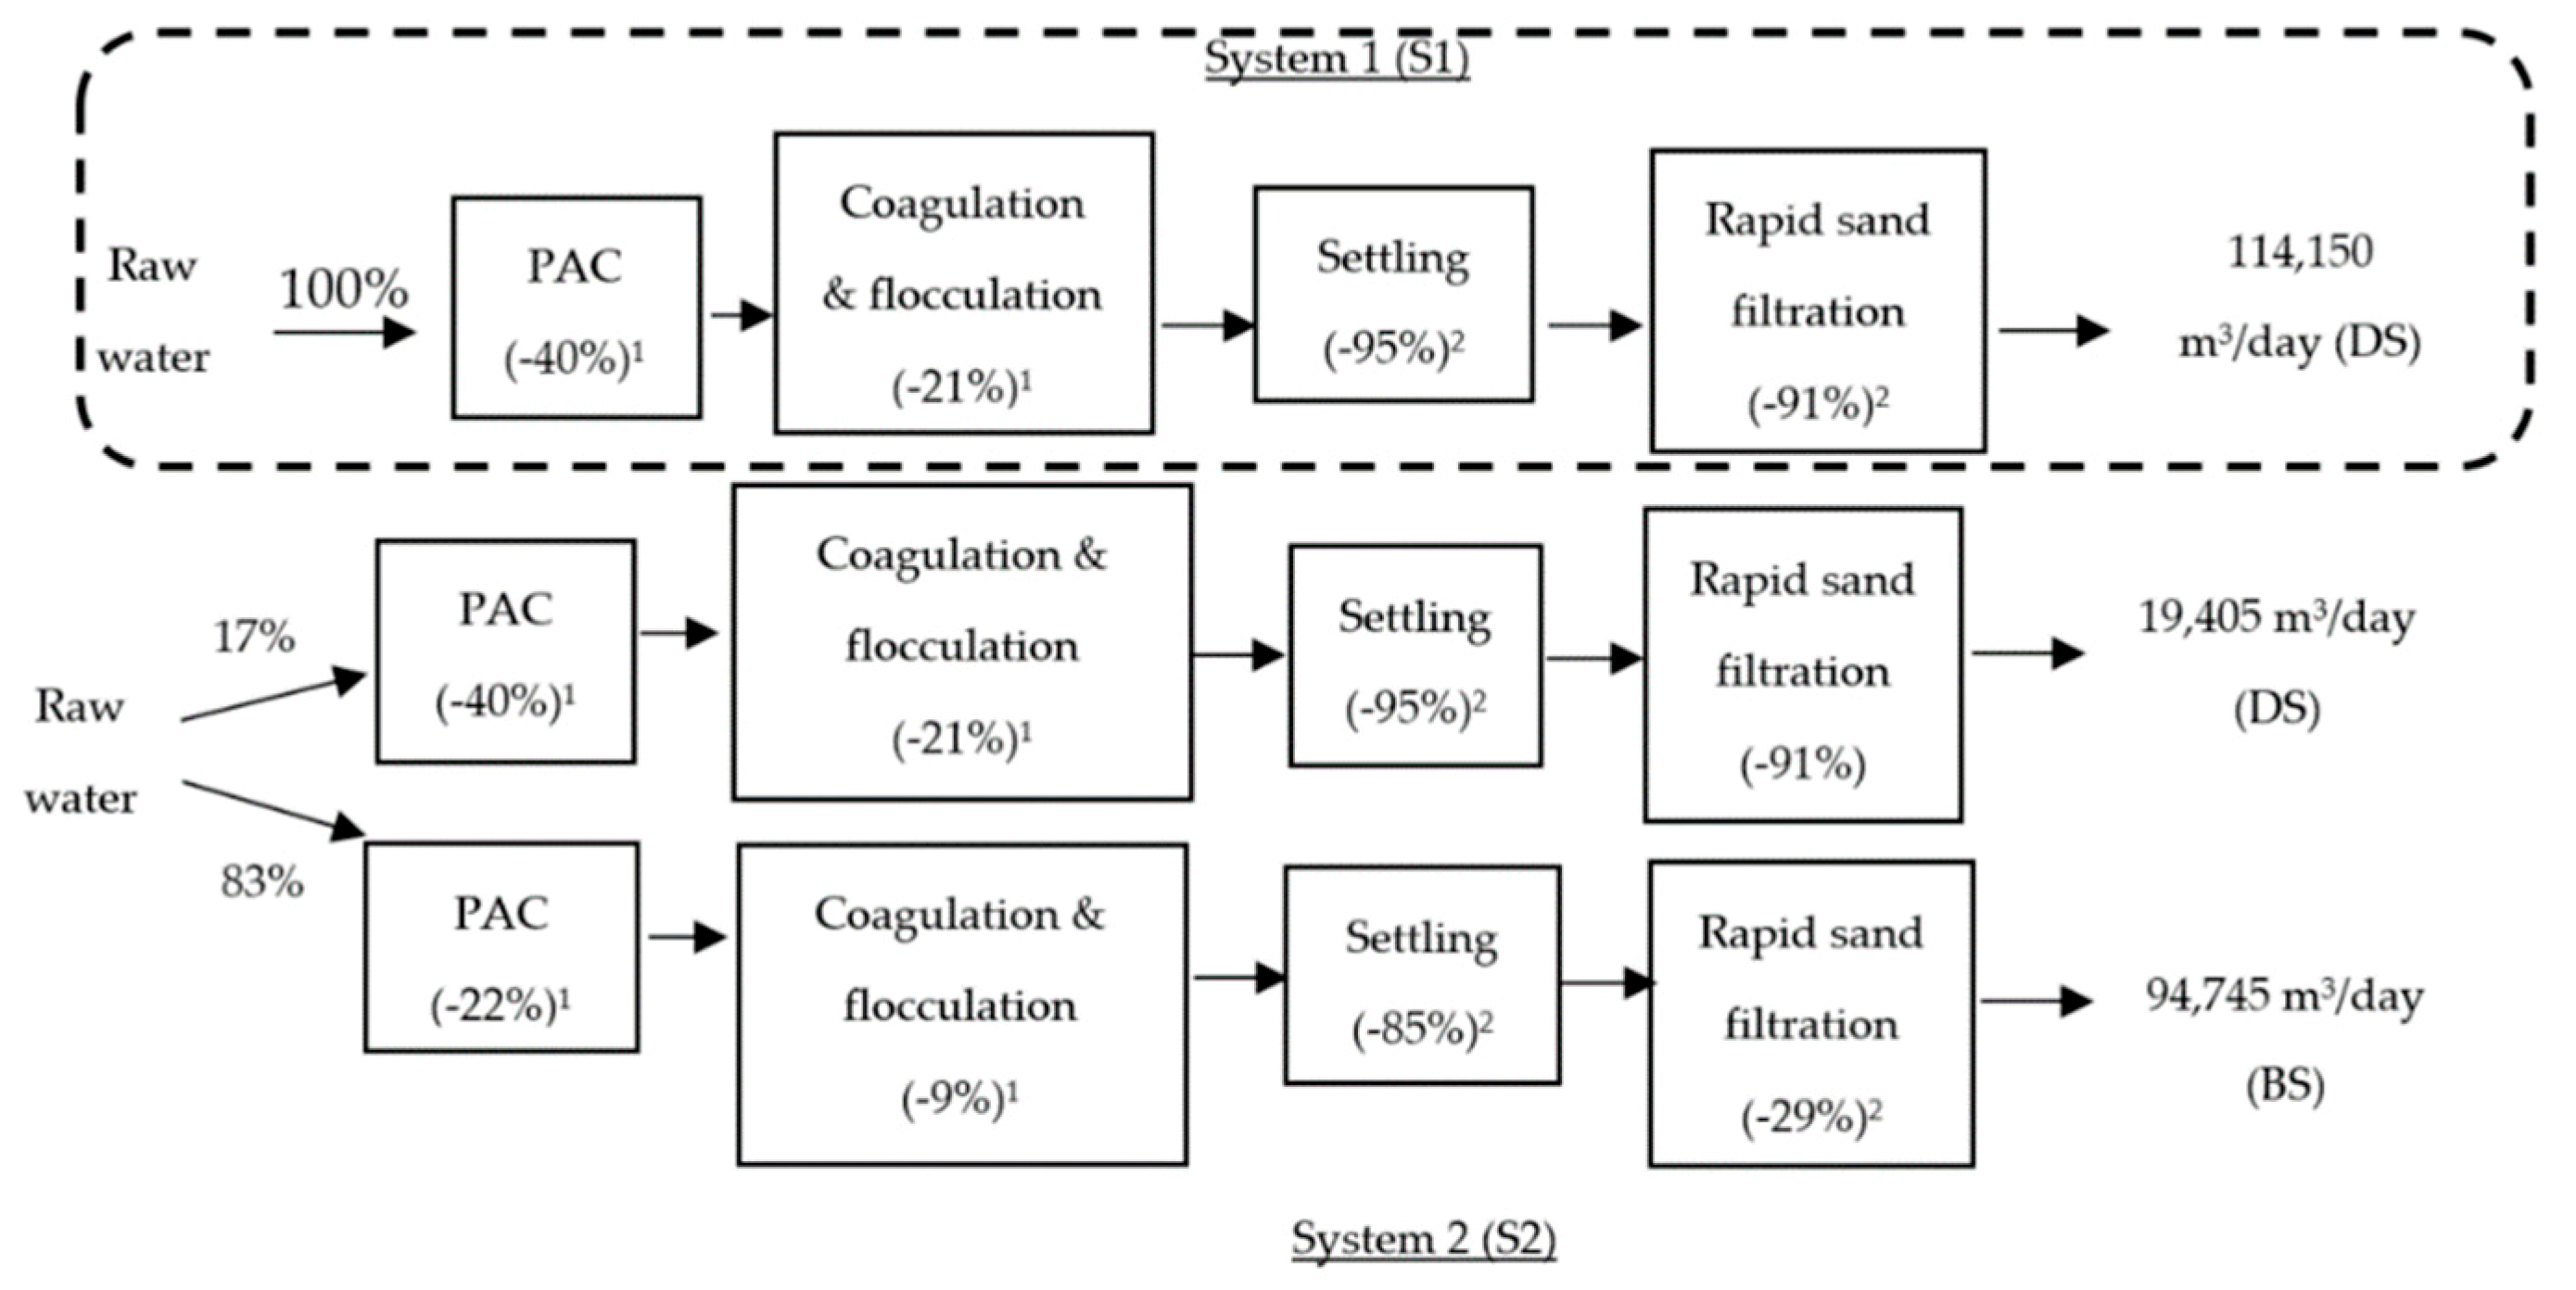
33] estimated that 17% and 39% of household water were consumed for cooking and bathing activities, respectively. The application of the Japanese bathing standard on this framework means that as much as 83% of the water supplied to French households could be considered as non-potable.
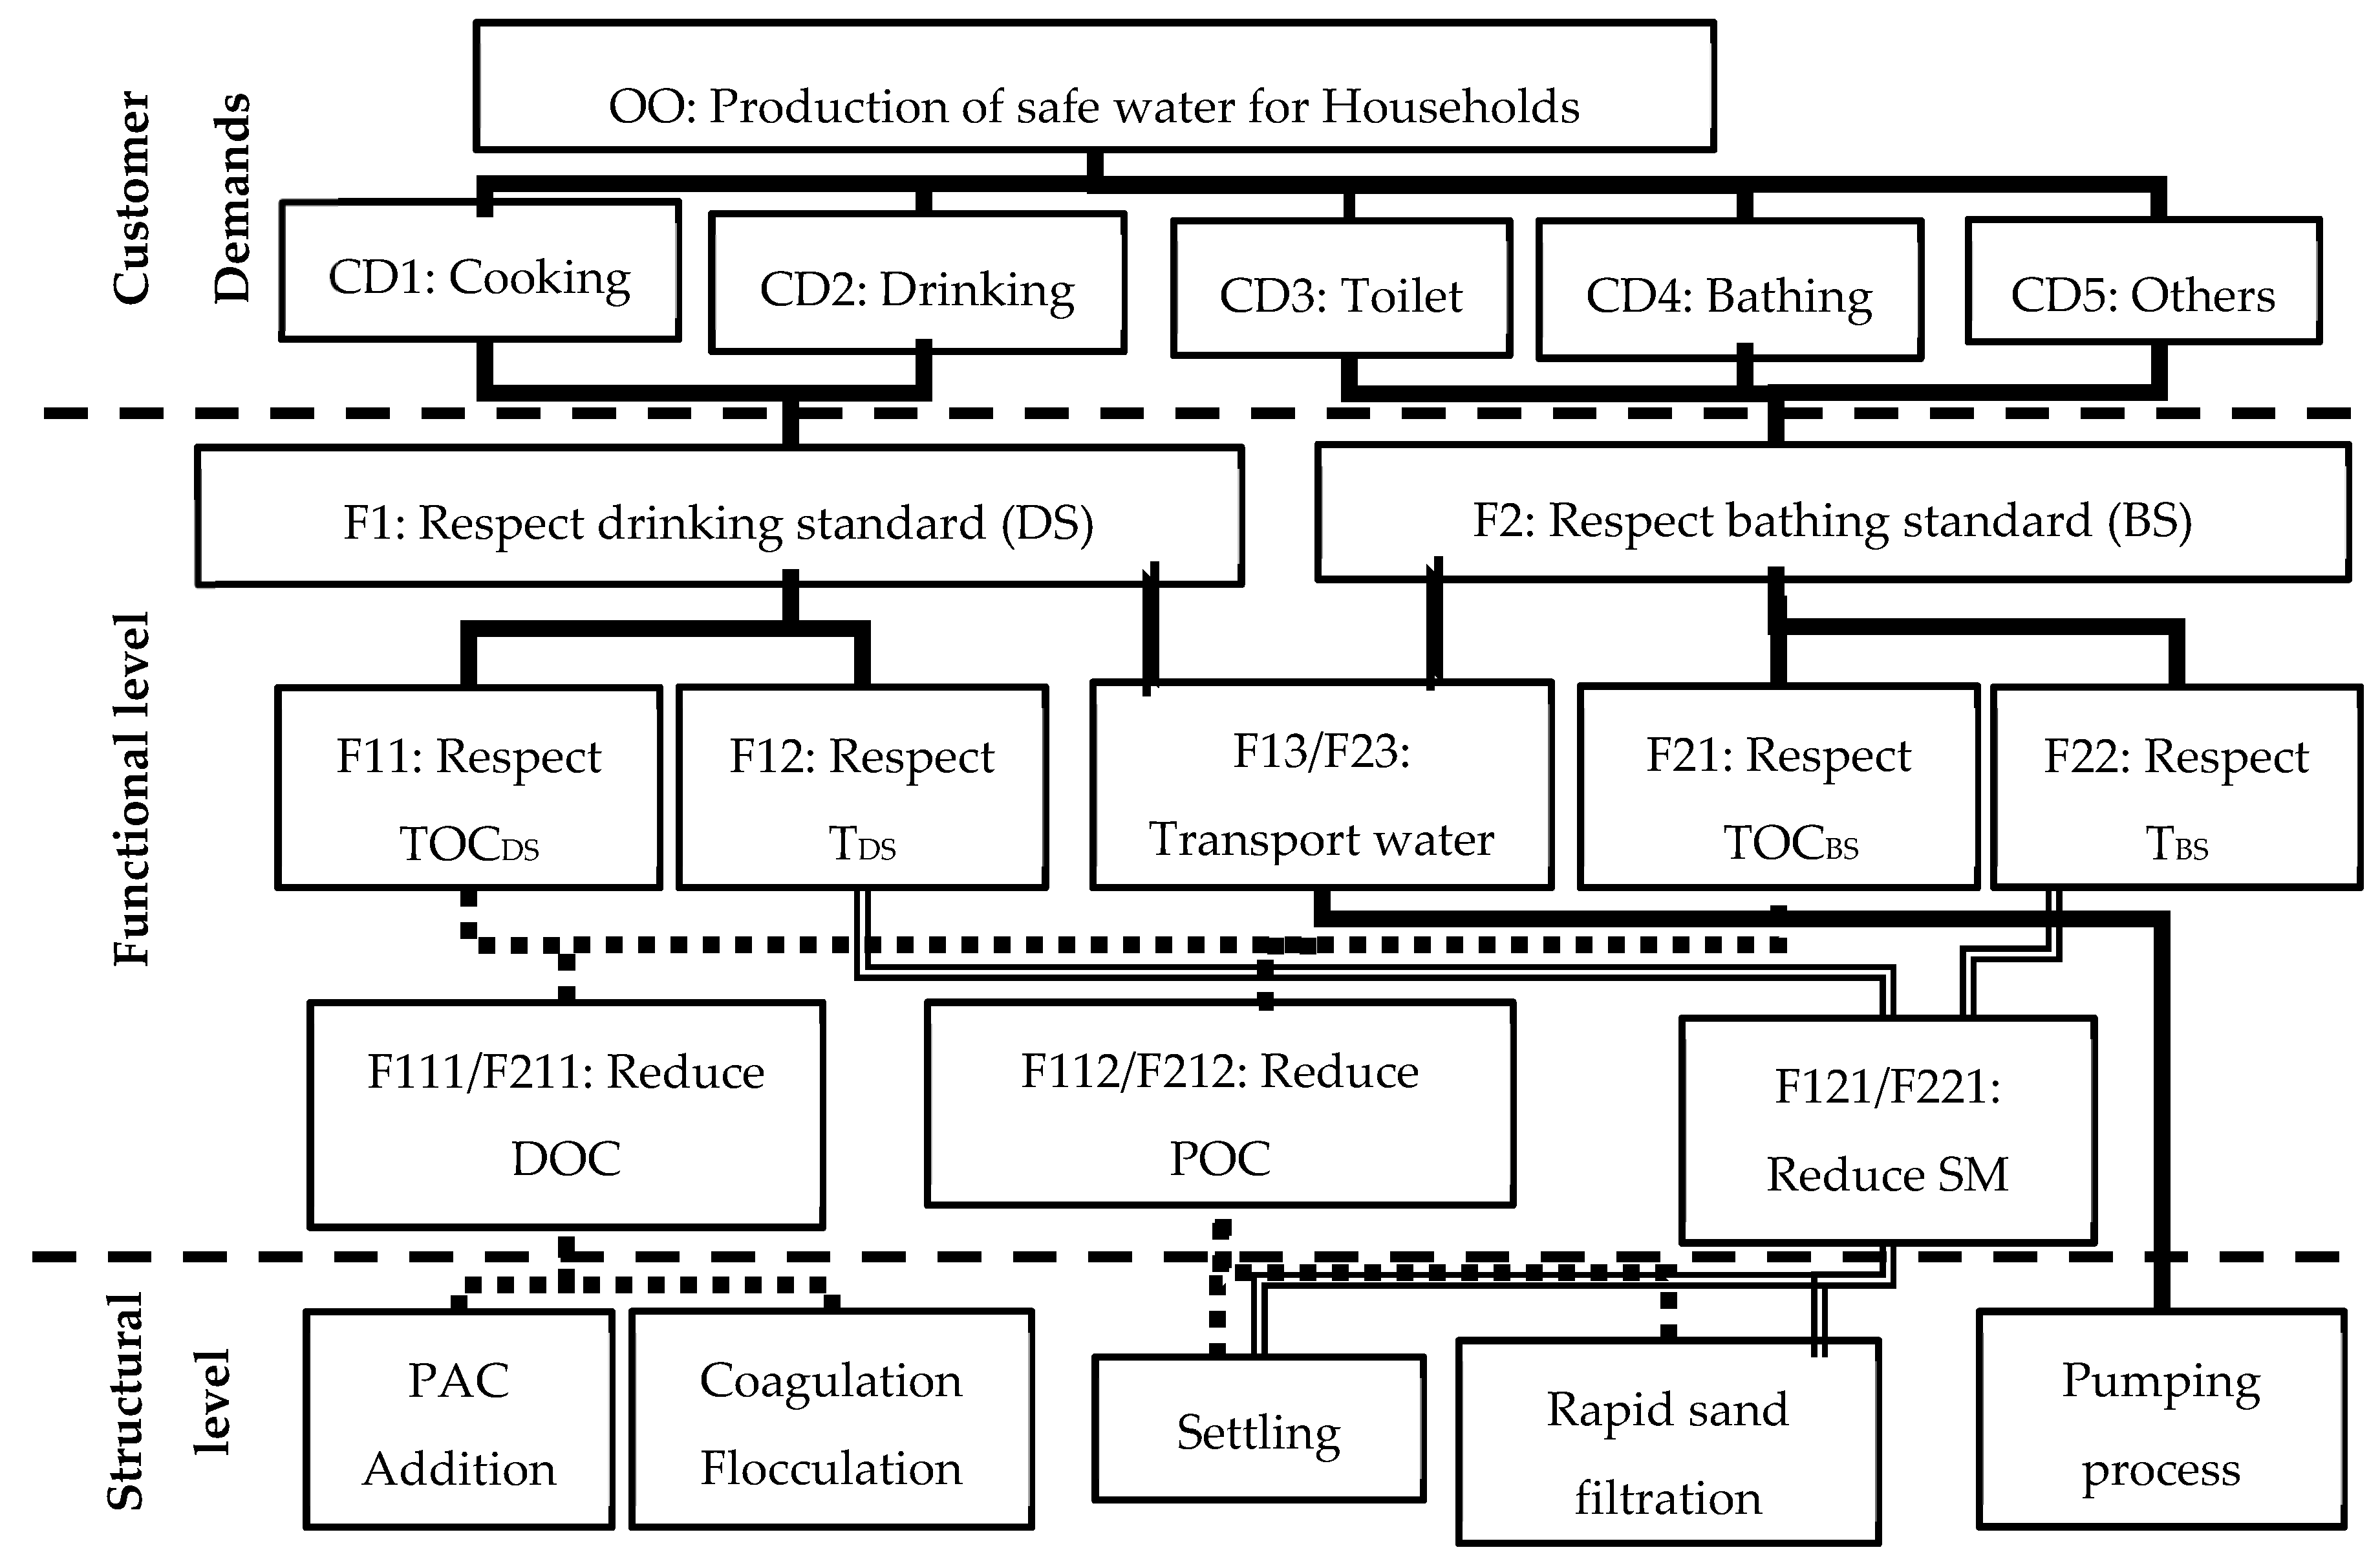
The present research has several objectives. First, dual water systems are incorporated into the broader concept of product-service system using water quality as the service indicator and the functional hierarchy model. Second, bathing activities are, to our knowledge, investigated for the first time with lower quality standard requirements than drinking standard. Third, contrary to most researches on dual water systems that are focused on the use of reclaimed water [22,23] and the comparison of the energy efficiency between dual and conventional systems, the present work assesses simultaneously the material, energy, and cost savings induced by the differentiation of water quality by usage. The integrated model EVALEAU is applied to a conventional treatment system of French municipal water supply as an illustration of how material, cost, and energy can be saved when degrading the water quality requirements. Three steps are considered:
(1)
The description of the water quality framework, the treatment line, and the important input parameters retained for our case study.
(2)
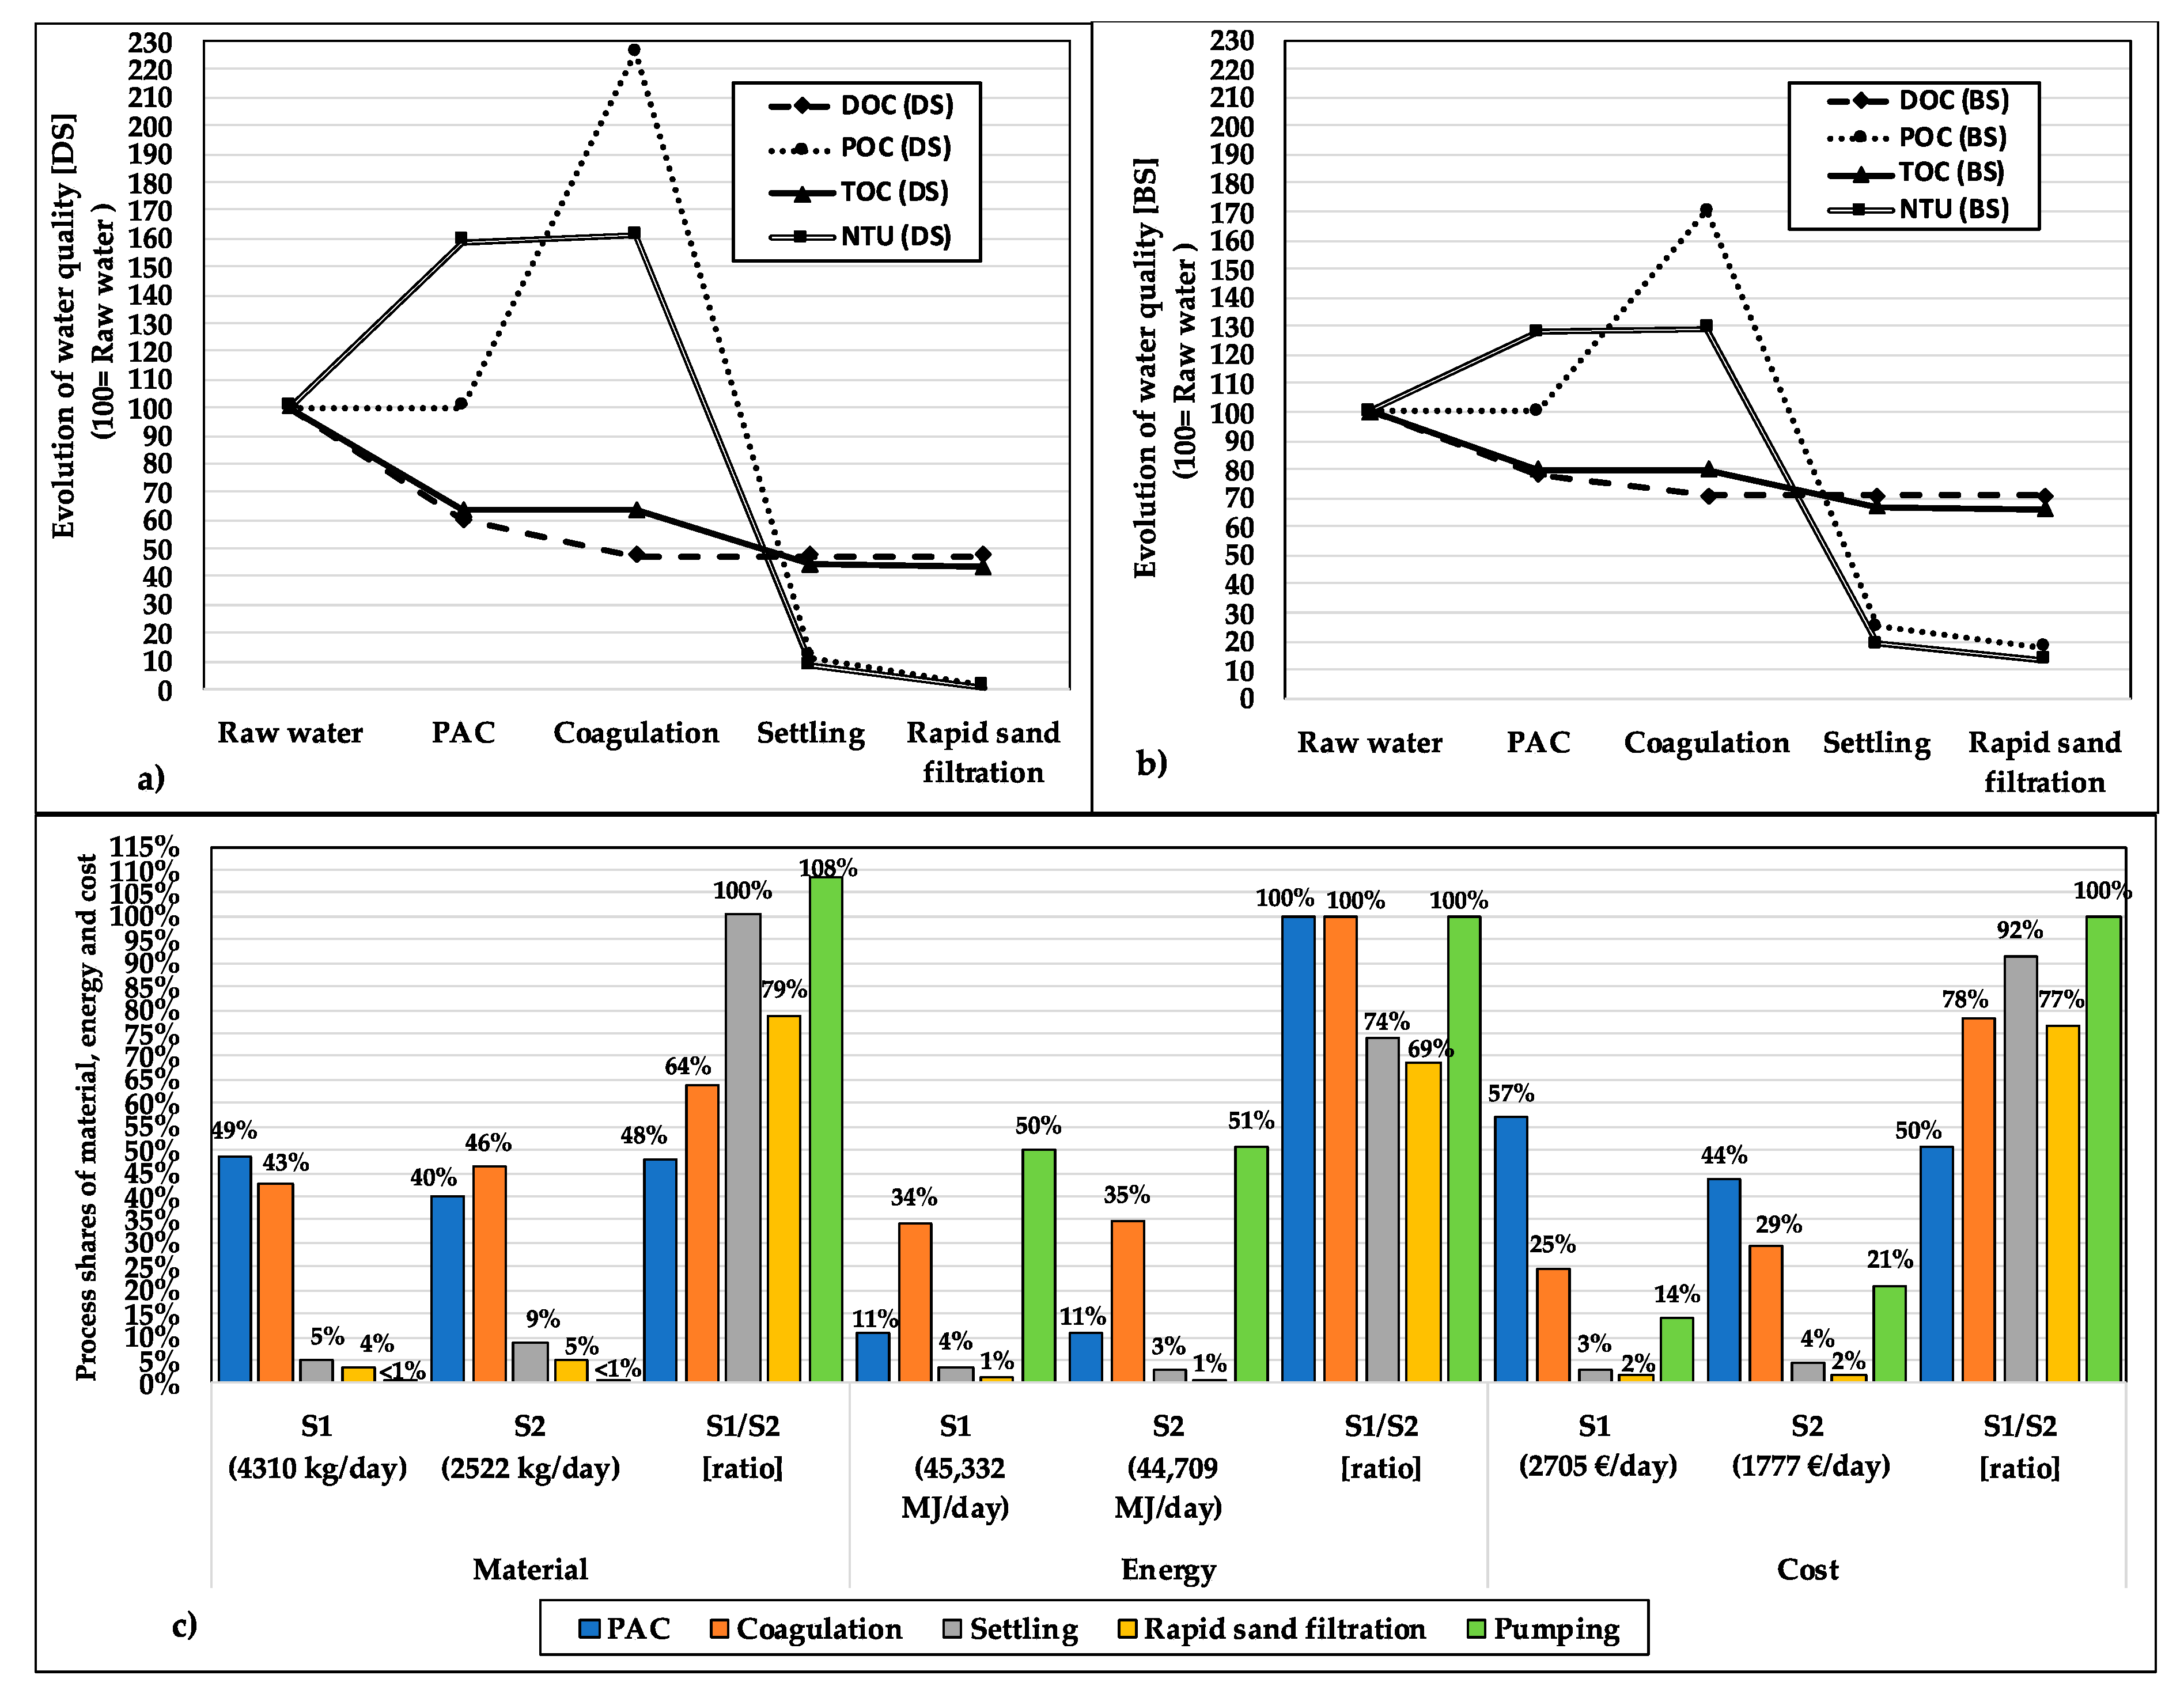
The detailed analysis of the material and energy savings obtained by the differentiation of water quality targets.
(3)
A thorough discussion of the implications of the observed savings for the future of water supply.

2. Material and Methods

2.1. The Water Quality Framework

Two types of requirements are necessary to conduct our study:
(1)
A quality framework differentiating quality norms between potable and non-potable activities.
(2)
A modeling framework linking the costs, material, and energy consumption of treatment processes to the water quality objectives.
The modeling issue was solved by using the integrated process modeling model EVALEAU [31]. The model considers many treatment processes used in water treatment plant: Powdered activated carbon (PAC) addition, coagulation, flocculation, media filtration, disinfection, neutralization, and sludge treatment. A mathematical model linking the quality parameters of the input and output water to the material and energy consumption is built for each process [32]. The quality parameters considered in the model are physical, chemical, and biological. However, according to the model, the main quality parameters governing the design of the treatment processes are physical: Total organic carbon (TOC) and turbidity (T). These two parameters were therefore used to frame our differentiated quality framework.
As stated in the introduction, the present paper considers bath and showers as a non-potable use of water by households. Figure 1 shows how the functional hierarchy modeling (FHM) used in the characterization of product-service systems [34] was applied to link the water quality requirement (demand level) to the treatment processes (structural level). The functional requirement is set to drinking standard (F1) for cooking and drinking activities and bathing standard (F2) for other uses of water. The drinking standards are those of French suppliers: 1.3 mg/L for TOC (F11) and 0.1 NTU (F12) for turbidity [17]. As explained in the introduction, the bathing standards are based on Japanese regulations: 2 mg/L for TOC (F21) and 2 NTU for turbidity (F22) [30]. TOC is the sum of particulate organic matter (POC) and dissolved organic matter (DOC) whereas turbidity (T) is related to the concentration of suspended matter in water (SM). The respect of standards is thus conditioned to the capacity of the water treatment system to reduce the concentration of DOC (F111/F211), POC (F112/F212), and suspended matters (F121/F221). These reductions are operated at the structural level of the FHM as shown in Figure 1 and are dependent on the treatment processes considered.

2.2. The Studied Treatment Line

The drinking water treatment line considered is based on an EVALEAU case study situated in the region of Paris, France. The raw water quality input is 3 mg/L for TOC and 15 NTU for turbidity and is characteristic of the Seine River [32]. The treatment line is constituted of PAC addition, coagulation, flocculation, settling, and rapid sand filtration processes as shown in Figure 2. Each treatment process has its main reduction objective, DOC removal for the powdered activated carbon (PAC) addition, coagulation, and flocculation processes; and SM removal for the settling and rapid sand filtration processes. The value retained for the ratio between organic matter and organic carbon is 2 gSM/gPOC [32]. The initial concentration ratio of POC: DOC is 10% and the SM: NTU relationship is 2.068 g/(m3.NTU) [32]. The transport of water between the processes is ensured by pumps and is identified as the pumping process in Table 1 and Table 2 of the result section. The amount of water treated is 114,150 m3/day.
DOC could be removed through the coagulation and flocculation processes alone but it would require huge amounts of coagulants and flocculants. The advantage of adding powdered active carbon is indeed its high efficiency in the removal of DOC. Due to the higher cost of PAC, the trade-off that keeps the operation cost minimal consists of removing 40% of the DOC content of the raw water by the PAC addition process and 21% of the DOC content of the water exited the PAC addition process by the coagulation and flocculation process [32]. It should also be noted that PAC is a particulate and that coagulation turns a share of DOC into POC. Therefore, the concentration of suspended matter, hence the turbidity, is higher after the coagulation and flocculation process than in the raw water. As a result, the SM removal objectives set for settling and rapid sand filtration processes are high, 95% and 91%. For the treatment line delivering the water respecting the bathing standard (BS), the same processes are considered but with different removal objectives as shown in Figure 2. PAC addition was kept to optimize operation costs. Regarding turbidity treatment processes, the rapid sand filtration processes removal objective was set to 29% to optimize the amount of filter media (sand) used.
The materials considered in the analysis are chemicals (coagulant, flocculant), sand, cast iron pipes, and concrete for tanks. Besides, the produced sludge amount occurring during the settling process was accounted for though not included in the total material consumption. The energy consumptions related to pumping concerned the injection of chemicals, the circulation of the backwash water in the rapid sand filtration process, the evacuation of sludge during the settling process, and the transportation of water between the processes were considered. The mixing of chemicals with water (stirring), the air compressing, and the scraping of sludge were also considered. The calculation processes of the energy, chemical, and sand consumption can be found in [32] and the associated parameters used in the study are reported in Appendix A. The details of the estimation of the material consumption related to the infrastructure are presented in Appendix B.

2.3. Cost Analysis

The material and energy consumption were translated into costs by multiplying the amounts of materials and energy with the unitary costs of each item. Chemical and electricity costs were taken from the EVALEAU study [32]: 700 €/ton (PAC), 220 €/ton (aluminum sulfate [coagulant]), 2200 €/ton (flocculant), and 0.0591 €/kWh (electricity). Cast iron price was taken from a US trading site [35]: 800 $/ton or 680 €/ton considering an average exchange rate of 1.18 $/€. The concrete and sand prices were taken from the life cycle Inventory Database for Environmental Analysis version 2.1.3 (hereafter “IDEA2”) developed by the National Institute of Advanced Industrial Science and Technology, and Environmental Management Association for Industry (JEMAI), Tokyo, Japan [36]. The prices of pre-stressed concrete products and silica sand considered respectively as the concrete used for water tanks and the filter media in our analysis were reported as 33,411 JPY/ton and 2906 JPY/ton, i.e., 268 €/ton and 22.5 €/ton considering an average exchange rate of 124 JPY/€.

3. Results

3.1. Evolution of the Water Quality, Costs, and the Consumption of Materials and Energy

The evolution of the water quality is presented in Figure 3a for the drinking standard (DS) and in Figure 3b for the bathing standard (BS). PAC and coagulation processes have the objective of diminishing dissolved organic carbon (DOC) but have different impacts on the water quality parameters. PAC is a particulate matter so that its addition increases the suspended matter (SM) concentration. As a result, turbidity increased by 59% from 15 NTU to19.2 NTU during the PAC addition in S1 and by 28% in S2. The coagulation and flocculation process transform the distribution of the concentrations of dissolved organic carbon (DOC) and particulate organic carbon (TOC). During this process, TOC remains constant while POC concentration increases by 126% in S1 and 70% in S2. DOC concentration diminishes to reach 47% in S1 and 71% in S2 of the initial DOC concentration of the water entering the treatment plant (raw water). Settling and rapid sand filtration processes diminish POC and SM concentrations but do not affect DOC concentration. In the end, the remaining shares of TOC and turbidity are 43% and 0.7% for drinking standard, and 66% and 13% for bathing standard, following the treatment objectives presented in Figure 1.
The structure of the cost and material and energy consumption is presented in Figure 3c. Material consumption is dominated by PAC and coagulation processes as they totalize 91% and 86% of the material consumption of S1 and S2. For energy consumption, coagulation and pumping are the main contributing processes accounting for 84% and 86% in S1 and S2. PAC represents as much as 57% of the cost in S1 and 44% in S2. This relates to the high cost of PAC but as mentioned in Section 2.2, there is a cost trade-off between PAC and coagulant consumption. Settling and rapid sand filtration represent a minor share of the cost and the material and energy consumption in both systems. The degradation of the water quality in S2 impact greatly the material consumption of PAC and coagulation processes and to a lesser extent the rapid sand filtration process. This is understandable as the consumption of chemicals and sand directly relates to water quality. On the opposite, the degradation of water quality has a small impact on the energy consumption of PAC, coagulation, and water pumping processes. The energy consumption of rapid sand filtration and settling processes in S2 nonetheless represents 74% and 69% of the related energy consumption in S1. Cost is mainly driven by material consumption since the 26% reduction in the energy consumption of the settling process only translates into an 8% reduction in cost against 22% for the 57% reduction in the material consumption of the coagulation process. S2 outperforms S1 on all the criteria for all processes except pumping. Indeed, the doubling of the treatment line results in an 8% increase in material consumption despite the downsizing of pipes. The next sections detail further the structure of the cost, material, and energy consumption.

3.2. Decomposition of Material Consumption

The decomposition of material and energy consumption at the process level is presented in Table 1. The differentiation of water quality in S2 results in 41% material savings compared to S1. It corresponds to 1788 kg/day saved of which 98% are related to chemical consumption. On the other hand, material consumptions associated with the sand, pipeline, and water tanks are only reduced by 20%, 10%, and 4%. The savings associated with the differentiation of water quality thus primarily concern materials directly influencing the water quality (chemicals, sand).
Chemical consumption in S1 and S2 amounts to 3764 and 2008 kg/day, respectively. Fifty-five percent and 49% are consumed during PAC addition, the remaining share being mainly consumed during coagulation/flocculation. Sand is only consumed during rapid sand filtration for which the 20% decrease observed in S2 leads to a reduction of the size of filters and a 21% decrease of the associated tank material consumption. For all other processes, as the tank volume is designed based on the water volume, the material consumption is similar for S1 and S2. Pipeline material consumption decreases by 11%, 5%, and 15% for coagulation/flocculation, settling, and rapid sand filtration processes, respectively. These decreases are respectively linked to the diminution of chemical consumption, the amount of sludge produced, and the diminution of water and air flows used during the backwash of filters. The amount of sludge produced indeed diminishes by 27% when shifting from S1 to S2. However, the pipeline material consumption linked to the transport of water increases by 8% from 1.71 kg/day to 1.85 kg/day because of the doubling of the number of pipelines in S2. The material consumption associated with the infrastructure (tank, pipes) thus diminishes when related to materials directly connected to water quality (chemicals, sludge, sand) but is either insensitive or increases when related to the volume of water treated. In conclusion, PAC addition and coagulation/flocculation are the processes with the highest reduction in material consumption. As these processes are ruled by DOC removal objectives (see Figure 1), this implies that TOC is the important water quality parameter controlling material consumption.

3.3. Decomposition of Energy Consumption

The shift from system 1 to system 2 leads to a small energy saving of 1.4%. Most of it comes from the 26% energy saved for sludge scraping and pumping. The rest comes from air compressing (−33%) and the backwash process (−11%). Following Table 1, one can also notice the energy use associated with the injection of chemicals during the coagulation/flocculation process is 3.3 times more important in S2 than in S1. This is only due to our particular design of the injection process since the number of injections per hour in S2 is set to 12 and only 10 in S1. The effect of this design choice is nonetheless small given that chemical injection represents only 0.1% and 0.5% of total energy consumption in S1 and S2, respectively. Overall, as 99% of energy consumption is related to the stirring and pumping processes for which no substantial difference is found between S1 and S2, the difference in energy consumption between S1 and S2 is almost negligible. Energy consumption is thus mainly dependent on the volume of water treated rather than the quality pursued. Still, the shift from S1 to S2 results in an energy consumption reduction of 26% and 31%for settling and rapid sand filtration processes. These processes are ruled by the SM reduction objective (see Figure 1), this implies that turbidity is the important water quality parameter controlling the energy consumption of these processes.

3.4. Decomposition of COST

The decomposition of cost at the process level is presented in Table 2.
The costs in S1 and S2 amount to 2705 €/day and 1777 €/day. The differentiation of water quality is thus associated with a 34% cost reduction. Of the 928 €/day saved, 82% are associated with the diminution in PAC consumption and 16% with the diminution of the use of coagulants and flocculants. The relatively high unitary costs of chemicals and the high decrease in their consumption explain such contribution. Indeed, settling and rapid sand filtration processes only account for 4% and 2% of the water treatment costs in S1 and S2 whereas PAC addition and coagulation processes cover 81% of the cost in S1 and 73% in S2. The impact of the TOC removal objective on costs is thus more important than the turbidity removal objective.

4. Discussion

4.1. The Validation and Limits of the Model

4.1.1. Model Validation

The case study and model used was adapted from the EVALEAU model and case study. Our model was thus validated by comparing our results for S1 to those of the EVALEAU case study. A good correspondence was found since both the EVALEAU study and our results accounted for an energy consumption associated with the pumping process of 55 Wh/m3. Similarly, PAC and coagulant consumptions were 18.2 g/m3 and 14.7 g/m3 compared to, respectively, 18.6 g/m3 and 16.3 g/m3 in the EVALEAU study [32]. On the other hand, the material and energy consumptions related to infrastructure were absent from the EVALEAU model. Our calculation of materials for tanks and pipelines are nonetheless soundly based on engineering data and models used daily by waterworks companies (see Appendix A and Appendix B). Regarding energy consumption, our results showed that infrastructure represents 12% of the total energy consumption in S1, a value close to those estimated by LCA (Life Cycle Assessment) studies found in the literature [37]. In conclusion, our results are consistent with the values found in the literature, hence validating the model.

4.1.2. Model Limits

Four limits to our model may restrain the conclusions that can be drawn from our results. First, our case study is a simulation based on the EVALEAU model with a simplified treatment line and not confirmed by a field study. The EVALEAU model used as a reference was however confirmed with a field study. Nonetheless, future studies should include a more complex pattern of quality parameters and treatment lines including for example chlorination or ozonation processes. Second, only direct energy and material consumptions were considered. The energy and materials required for the production of chemicals and the construction of infrastructure are not taken into account. Our study is indeed not an LCA study and could therefore be improved in the future by adding the effects of background processes. Nonetheless, the LCA study using EVALEAU and conducted by Merry et al. [31] showed that chemical production was the most energy consumptive background process, especially PAC production. Therefore, as our study demonstrated that differentiating water quality leads to an important decrease in chemical consumption, especially PAC consumption, taking an LCA approach may not only confirm the observed decrease in material consumption, but also lead to a substantial decrease in the energy consumption associated with PAC production.
A third limit is that we did not model the sludge treatment process. As shifting to S2 diminishes the quantity of sludge produced by 27%, further material, and energy savings may also occur during this process. Nonetheless, as the SM content of the water produced in S2 is higher than in S1, it may be argued that a corresponding supplementary amount of sludge will have to be treated in wastewater plants after the water is used by households.
Finally, the main limit is linked to our system boundary as the distribution system is missing in our analysis. As shown in the introduction, there is indeed a wide range of energy and material consumptions for the distribution process depending on the distribution type (pipelines, trucks) and the length and topology of the distribution network. In Table 1, material consumption associated with pipelines for the transportation of water only accounts, respectively, for 0.04% and 0.07% of the total material consumption of S1 and S2. Therefore, the 8% increase in pipeline materials of S2 appears negligible at the level of the water treatment plant. However, the associated network length remains low compared to the expected length of distribution. Indeed, with a linear consumption index for Paris of 65 m3/km/day in 2018 [38], the expected length of the distribution network amounts to 1774 km (114,500/65), a pipeline length considerably larger than the one observed at the plant level in the study. In conclusion, future studies should complete our analysis by including the distribution system in the comparison of S1 and S2.

4.2. The Implication for the Future of Water Systems

According to our results, differentiating water quality targets in the water purification process leads to important material savings but only marginal energy savings. The material savings are linked to the use of chemicals to reduce TOC and in particular DOC. On the opposite, energy savings are dependent on the volume of water treated and partly on the turbidity reduction target. Differentiating water quality targets is expected to be an efficient material savings strategy for water systems dependent on a high level of chemical consumption, which is the case, for example, for water systems in which raw water has a high TOC content or/and high DOC: POC ratio. Similarly, as the material consumption of the “transport water” process increases from S1 to S2, water systems with a small distribution network are expected to better conserve the advantages of differentiating water quality targets than those with a long distribution network. This raises the issue of centralization and decentralization in water systems. The current referential design of the water system in developed countries is indeed centralized because of the expected economies of scale related to the infrastructure. However, with the differentiation of water quality targets, several decentralized systems may be considered. For example, all water may be treated with the bathing standard in a centralized treatment plant before being sent to decentralized treatment plants in which the cooking and drinking shares are treated according to the drinking standard. This way, the doubling of the pipeline infrastructure only occurs between the decentralized treatment plant and the customers’ houses.
Finally, other treatment processes than those studied here may be more material and energy-consuming such as the ozonation and desalination processes. The advantages of differentiating water quality may thus be even larger for these processes. Similarly, this paper extends the framework of usual dual water systems by considering using non-drinking norms for bathing activities and usual raw water quality rather than degraded ones such as in rainwater harvesting or reclaimed water system.
In conclusion, our study demonstrated missed opportunities in materials savings within current water systems due to the absence of a functional approach to households’ water consumption. This calls for full integration of the water supply and water waste management systems through a functional approach to the water quality. Indeed, as the water infrastructure represents huge investment characterized by high inertia, the opportunity to develop new environmentally efficient water systems should not be missed, especially at the renewal of the aging water infrastructure. It is notably the case of France in which up to 45% of its distribution network is considered close to its end of life for a value of 38.5 billion euros [39].

5. Conclusions

The present study demonstrates how the differentiation of water quality by usage, which is the core concept of dual water systems, could be incorporated in the broader concept of product-service systems. Results indicate the restriction of potable water quality to cooking activities leads to important savings in the material consumption of water purification processes but no energy savings. Therefore, the differentiation of water quality can be an interesting perspective for the design of future water supply systems and the associated product-service systems. For this purpose, integrated models linking water quality parameters to material and energy consumption are necessary. In particular, as revealed by the present research, the focus should be made on distinguishing the model parameters dependent on the water quality pursued from those related to the quantity of water treated. Only the former ones can translate into material and energy savings when shifting the current water systems to dual ones. Finally, the savings stated in the present paper need to be confirmed at the level of the municipal water cycle including other types of treatment processes, the distribution process, and the background processes such as the production of coagulants and PAC. Similarly, the sewerage management system should also be included to assess water reclamation scenarios and develop circular flows between the supply and sewerage water systems. An environmentally efficient future of water systems will indeed most probably rely on a sounded integration of these different elements.

Author Contributions

Conceptualization, S.M.R.D. and S.H.; funding acquisition, S.M.R.D. and S.H.; methodology, S.M.R.D., T.S., T.W., and S.H.; supervision, S.H.; validation, S.M.R.D., T.S., T.W., and S.H.; writing—original draft, S.M.R.D.; writing—review and editing, S.M.R.D., T.S., T.W., and S.H. All authors have read and agreed to the published version of the manuscript.

Funding

This research was funded by the Japanese Society Promotion for Science (JSPS) postdoctoral short-term fellowship program, grant number PE13560.

Acknowledgments

The authors thank the three anonymous reviewers for their comments and suggestions that help to improve the focus and readability of the paper.

Conflicts of Interest

The authors declare no conflict of interest

Appendix A. Input Parameters to the Treatment Processes

Appendix A.1. Operation Related Input Parameters

Processes need some input parameters related to their operation management such as the hydraulic residence time, i.e., the average time water stays in the tank. These parameters are reported in Table A1. Please note that in all the following tables, “Reference” refers to the data reported in the EVALEAU model case study [32] and system 2 values to a weighted average of systems 2-B and 2-D based on the water volume. The model follows strictly the recommended value of the reference EVALEAU model setting for example the stirring efficiency for all processes to 70%.
Table A1. Operation related input parameters.
ReferenceSystem 1System 2-DSystem 2-BSystem 2
PAC addition process
Mixing duration time (min)0.50.50.50.50.5
Velocity gradient (s−1)700700700700700
Hydraulic residence time (min)55555
Coagulation and flocculation process
Initial DOCns (%)-58%58%48%49%
Coagulation contact time (min)33333
Coag. mixing duration (min)11111
Floc. Pt.1 Velocity gradient (s−1)550550550550550
Floc. Pt.2 Velocity gradient (s−1)6060606060
Settling process
Pumping cycle duration (min)180180180180180
Pumping phase duration (min)2020202020
Hydraulic residence time (min)6060606060
Surface Hydraulic Charge (m3/(m2.h))1010101010
Sludge scraping energy (kWh/m3)6.79 × 10−46.79 × 10−46.79 × 10−46.79 × 10−46.79 × 10⁻⁴
Rapid sand filtration process
Backwash duration–phase 1 (min)33333
Backwash duration–phase 2 (min)88888
Backwash duration–phase 3 (min)55555
Backwash air flow-phase 1 (m3/h)24002400231217661859
Backwash air flow-phase 2 (m3/h)24002400231217661859
Backwash water-phase 2 (m3/h)260260250191201
Backwash water-phase 3 (m3/h)800800771589620
Filtration nominal speed (m/h)3.53.53.53.53.5

Appendix A.2. Water Quality Related Input Parameters

The second type of input parameters concern the water quality and are reported in Table A2. These parameters principally concern the hypothesis concerning the removal by each process. It follows the EVALEAU reported value for the drinking standard treatment line but has been adapted for the bathing standard treatment line. Besides, the non-polar (np), humic acid (ha), and non-sorbable (ns) shares of dissolved organic carbon (DOC), necessary for the coagulation model are reported in Table A2.
Table A2. Water-quality-related input parameters.
ReferenceSystem 1System 2-DSystem 2-BSystem 2
PAC addition process
DOC removal (DOC_R)40%40%40%22%25%
Water temperature (°C)2020202020
Coagulation and flocculation process
DOC removal (DOC_R)20%21%21%9%10%
Initial DOCnp (%)29%29%29%27%28%
Initial DOCha (%)25%25%25%29%29%
Initial DOCns (%)46%46%46%43%44%
Humic acid Pka4.34.34.34.34.3
Water pH66666
Settling process
SM removal (SM_R)95%95%95%85%87%
Sludge concentration (g/L)2020202020
Dry matter sludge density (kg/m3)17001700170017001700
Rapid sand filtration process
SM removal (SM_R)83%91%91%29%34%

Appendix A.3. Infrastructure Related Input Parameters

The third type of parameter concerns the tanks and the pumping process. They are reported in Table A3. The lifetime of the infrastructure (pipes, tanks) is set to 30 years or 10,950 days. The tanks are made of concrete for a density of 2500 kg/m3. The intake pipe, i.e., the one transporting the water throughout processes, has a diameter of 1000 mm for system 1, and 1000 and 400 mm for systems 2D and 2B, respectively. For the sand filtration process, the water is divided into different intake pipes to the different filters. Regardless of the system studied, these intake pipes diameter were set to 250 mm meaning the number of filters is different for each system. The minimum speed of the fluid in pipes is set to 0.6 m/s following the EVALEAU model. The pipe absolute roughness is 4.8 mm. When entering the plant, water must be carried onto the PAC process, and the associated pipeline length is 10 m for a height difference of 5 m. For other processes reported in Table A3, the pipeline length and height difference are the same.
Table A3. Infrastructure-related input parameters.
ReferenceSystem 1System 2-DSystem 2-BSystem 2
PAC addition process
Intake pipeline length (mm)33333
Tank height (m)33333
Coagulation and flocculation process
Intake pipeline length (mm)33333
Coagulant Injection per hour-10121212
Intake pumping from abstract pipeline length (mm)-10101010
Coagulant Diameter (mm)-80305044
Coagulant pipeline length (m)33333
Flocculant Injection per hour-1111
Flocculant Diameter (mm)-30152019
Flocculant pipeline length (m)33333
Floc. Pt.1 Tank height (m)33333
Settling process
Intake pipeline length (mm)44444
Sludge pipe diameter (mm)-1100450800719
Sludge pipe length (m)44444
Single tank surface10010084104100.8
Tank height (m)1010101010
Rapid sand filtration process
Intake pipeline length (mm)44444
Backwash water P-2 diameter (mm)-150150125139
Backwash water P-2 length (m)1.151.151.151.151.15
Backwash water P-2 speed (m/s)-1.020.981.081.03
Backwash water P-3 diameter (mm)-250250200228
Backwash water P-3 length (m)1.151.151.151.151.15
Backwash air P-1 diameter (mm)-450450400428
Backwash air P-1 length (m)1.151.151.151.151.15
Backwash air P-1 speed (m/s)-1.051.010.981.00
Backwash air P-2 diameter (mm)-450450400428
Backwash air P-2 length (m)1.151.151.151.151.15
Recirculation pipe length (m)1010101010
Backwash water P-2 diameter (mm)-150150125139
Backwash water P-2 length (m)1.151.151.151.151.15
Backwash water P-3 diameter (mm)-250250200228
Backwash water P-3 length (m)1.151.151.151.151.15
Filter surface (m2)4040404040
Sand density (kg/m3)26002600260026002600
Sand annual replacing rate (%)0.5%0.5%0.5%0.5%0.5%
Sand apparent density (kg/m3)14601460146014601460

Appendix B. Input Parameters to the Treatment Processes

Appendix B.1. Pipelines

The amount of materials embodied in the pipelines is the product of the material intensity with the pipeline length. The material intensity is taken from [40] and reproduced in Table A4. The material used is cast iron. The material intensity can be approximate with a correlation ratio R2 = 0.9998 with the equation 0.0002*D2 + 0.1455*D in which D is the pipeline diameter expressed in millimeters (mm). This equation is used to determine the material intensity for pipelines the diameter of which is below 60 mm or over 1000 mm.
Table A4. Evolution of material intensity with pipe diameter.
Diameter (mm)Material Intensity (kg/m)Diameter (mm)Material Intensity (kg/m)
6011.540095.5
8015450113
10018.5500131
12523600170
15027.5700217.2
20037800266
25048900318
300611000376.4
35080.5--

Appendix B.2. Tank Materials

The calculation of the material consumption associated with tanks follows the same principles as the calculation for pipelines. This means that we determine a material intensity indicator linking the tank material to the water volume contained in the tank. Contrary to the pipeline materials, there is no catalog that would provide such material intensity indicator. We thus review the examples of a tank calculator [41] and a catalog [40] to determine a trend of this indicator for concrete tank (material density of concrete: 2500 kg/m3).
As shown in Figure A1, a linear trend was found. This shows the absence of a scale economy and a direct dependency of the material consumption to the volume fluctuation. The average material intensity was thus set to 242 kg/m3 as shown in Figure A1.
Figure A1. The material intensity indicator for tanks.
Sustainability 12 08730 g0a1

References

  1. Kanda, Y.; Nakagami, Y. What Is Product-Service-Systems (PSS)? Institute of Global Environmental Strategies: Kanagawa, Japan, 2006. [Google Scholar]
  2. Kang, D.; Lee, D.H. Energy and environment efficiency of industry and its productivity effect. J. Clean. Prod. 2016, 135, 184–193. [Google Scholar] [CrossRef]
  3. Shao, J.; Taisch, M.; Mier, M.O. Influencing factors to facilitate sustainable consumption: From the experts’ viewpoints. J. Clean. Prod. 2017, 142, 203–216. [Google Scholar] [CrossRef]
  4. Bundgaard, A.M.; Mosgaard, M.A.; Remmen, A. From energy efficiency towards resource efficiency within the Ecodesign Directive. J. Clean. Prod. 2017, 144, 358–374. [Google Scholar] [CrossRef]
  5. Caiado, R.G.G.; de Freitas Dias, R.; Mattos, L.V.; Quelhas, O.L.G.; Leal Filho, W. Towards sustainable development through the perspective of eco-efficiency—A systematic literature review. J. Clean. Prod. 2017, 165, 890–904. [Google Scholar] [CrossRef]
  6. Tukker, A. Product services for a resource-efficient and circular economy—A review. J. Clean. Prod. 2015, 97, 76–91. [Google Scholar] [CrossRef]
  7. Mont, O.K. Clarifying the concept of product-service system. J. Clean. Prod. 2002, 10, 237–245. [Google Scholar] [CrossRef]
  8. Corvellec, H.; Stål, H.I. Evidencing the waste effect of Product-Service Systems (PSSs). J. Clean. Prod. 2017, 145, 14–24. [Google Scholar] [CrossRef] [Green Version]
  9. Kjaer, L.L.; Pagoropoulos, A.; Schmidt, J.H.; McAloone, T.C. Challenges when evaluating Product/Service-Systems through Life Cycle Assessment. J. Clean. Prod. 2016, 120, 95–104. [Google Scholar] [CrossRef] [Green Version]
  10. Catulli, M.; Cook, M.; Potter, S. Consuming use orientated product-service systems: A consumer culture theory perspective. J. Clean. Prod. 2017, 141, 1186–1193. [Google Scholar] [CrossRef]
  11. WHO. Facts and Figures: Water, Sanitation, and Hygiene Links to Health [Online]. Available online: https://www.who.int/water_sanitation_health/publications/facts2004/en/ (accessed on 2 August 2020).
  12. UN. The Millennium Development Goals Report; United Nations: New York, NY, USA, 2015; Available online: https://www.undp.org/content/undp/en/home/librarypage/mdg/the-millennium-development-goals-report-2015.html (accessed on 2 August 2020).
  13. WHO. Guidelines for Drinking-Water Quality. Available online: https://www.who.int/water_sanitation_health/publications/drinking-water-quality-guidelines-4-including-1st-addendum/en/ (accessed on 2 August 2020).
  14. WHO. A Global Overview of National Regulations and Standards for Drinking-Water Quality. Available online: https://apps.who.int/iris/bitstream/handle/10665/272345/9789241513760-eng.pdf?ua=1 (accessed on 31 August 2020).
  15. Arrêté du 11 Janvier 2007 Relatif aux Limites et Références de Qualité des Eaux Brutes et des Eaux Destinées à la Consommation Humaine Mentionnées aux Articles R. 1321-2, R. 1321-3, R. 1321-7 et R. 1321-38 du Code de la Santé Publique. Available online: https://www.legifrance.gouv.fr/loda/id/JORFTEXT000000465574/2020-10-16/ (accessed on 31 August 2020). (In French)
  16. Ministry of Health, Labour and Welfare (MHLW). Drinking Water Quality Standards in Japan. Available online: https://www.mhlw.go.jp/english/policy/health/water_supply/dl/4a.pdf (accessed on 31 August 2020).
  17. Centre International de Recherche Sur l’Eau et l’Environnement (CIRSEE). Pratique Recommandée—Clarification. Internal document. Direction technique de la recherche (Lyonnaise des Eaux Suez Environnement); CIRSEE: Le Vésinet, France, 1999. (In French) [Google Scholar]
  18. EPA. Water & Energy Efficiency. The United States Environmental Protection Agency. Available online: https://www.epa.gov/sustainable-water-infrastructure/water-and-energy-efficiency-utilities-and-home (accessed on 2 August 2020).
  19. Vince, F.; Aoustin, E.; Bréanta, P.; Marechal, F. LCA tool for the environmental evaluation of potable water production. Desalination 2008, 220, 37–56. [Google Scholar] [CrossRef]
  20. Olsson, G. Water and Energy: Threats and Opportunities; IWA Publishing: London, UK, 2015. [Google Scholar]
  21. Meda, A.; Lensch, D.; Schaum, C.; Cornel, P.; Lazarova, V.; Choo, K.H. Energy and water: Relations and recovery potential. In Water-Energy Interactions of Water Reuse; Lazarova, V., Choo, K.H., Cornel, P., Eds.; IWA Publishing: London, UK, 2012; pp. 21–35. [Google Scholar]
  22. Barker, Z.A.; Stillwell, A.S.; Berglund, E.Z. Scenario analysis of energy and water trade-offs in the expansion of a dual water system. J. Water Resour. Plan. Manag. 2016, 142. [Google Scholar] [CrossRef]
  23. Rahmat, S.N.; Al-Gheethi, A.A.S.; Ayob, S.; Shahli, F.M. Development of dual water supply rooftop rainwater harvesting and groundwater systems. SN Appl. Sci. 2020, 2. [Google Scholar] [CrossRef] [Green Version]
  24. Nguyen, D.C.; Han, M.Y. Design of dual water supply system using rainwater and groundwater at arsenic contaminated area in Vietnam. J. Water Supply Res. Technol. 2014, 63, 578–585. [Google Scholar] [CrossRef]
  25. Yang, C.; Shen, Z.; Chen, H.; Zeng, G.; Zhong, Y. Dual water distribution systems in China. In Proceedings of the 8th Annual Water Distribution Systems Analysis Symposium, Cincinnati, OH, USA, 27–30 August 2006. [Google Scholar]
  26. Rogers, P.D.; Grigg, N.S. Trends in dual water systems. J. Water Reuse Desalin. 2015, 5, 132–141. [Google Scholar] [CrossRef] [Green Version]
  27. Shimizu, T.; Nishida, T.; Murakami, S.; Yamada, K. Feasibility study on the introduction of hybrid system for water supply from the viewpoints of water utilities’finance and residents’ expense in developing countries. J. Jpn. Soc. Civ. Eng. 2013, 69, 65–72. [Google Scholar]
  28. State of Oregon Department of Environmental Quality. Life Cycle Assessment of Drinking Water Systems: Bottle Water, Tap water, and Home/Office Delivery Water; Land Quality Division: Portland, OR, USA, 2009. [Google Scholar]
  29. Otaki, Y.; Otaki, M.; Aramaki, T.; Sakura, O. Residential Water Demand Analysis by Household. Available online: https://www.researchgate.net/profile/Osamu_Sakura/publication/267829017_Residential_water_demand_analysis_by_household_activities/links/547327970cf2d67fc035e3c8/Residential-water-demand-analysis-by-household-activities.pdf (accessed on 31 August 2020).
  30. Ministry of Health, Labour and Welfare. Guidelines for Water Quality Standards in the Public Bath; Ministry of Health, Labor and Welfare: Chiyoda, Tokyo, Japan, 2015.
  31. Méry, Y.M.; Tiruta-Barna, L.; Benetto, E.; Baudin, I. An integrated “process modeling—life cycle assessment” tool for the assessment and design of water treatment processes. Int. J. Life Cycle Assess. 2013, 18, 1062–1070. [Google Scholar] [CrossRef]
  32. Méry, Y.M. Development of An Integrated Tool for Process Modelling and Life Cycle Assessment—Ecodesign of Process Plants and Application to Drinking Water Treatment. Ph.D. Thesis, Université de Toulouse, Toulouse, France, 2012. [Google Scholar]
  33. Euzen, A. Consommer. In Tout Savoir sur L’eau du Robinet; Euzen, A., Levi, Y., Eds.; CNRS Editions: Paris, France, 2013; pp. 44–47. [Google Scholar]
  34. Van Ostaeyen, J.; Van Horenbeek, A.; Pintelon, L.; Duflou, J.R. A refined typology of product-service systems based on functional hierarchy modeling. J. Clean. Prod. 2013, 51, 261–276. [Google Scholar] [CrossRef]
  35. Alibaba.com. Water Supply Price Cast Iron Pipe. Available online: https://www.alibaba.com/product-detail/API-5L-B-China-trade-assurance_60715647921.html?spm=a2700.galleryofferlist.0.0.4a70477ew9x6OQ (accessed on 2 August 2020).
  36. National Institute of Advanced Industrial Science and Technology (AIST). Safety and Scientific Research Department and Society and LCA Research Group, and Japan Environmental Management Association for Industry (JEMAI); IDEA version 2.1.3; National Institute of Advanced Industrial Science and Technology: Tokyo, Japan, 2017.
  37. Igos, E.; Dalle, A.; Tiruta-Barna, L.; Benetto, E.; Baudin, I.; Mery, Y. Life Cycle Assessment of water treatment: What is the contribution of infrastructure and operation at the unit process level? J. Clean. Prod. 2014, 65, 424–431. [Google Scholar] [CrossRef]
  38. SISPEA. Téléchargement des données de l’observatoire Système d’Informations sur les Services Publics d’Eau et d’Assainissement. 2018. Available online: http://www.services.eaufrance.fr/donnees/telechargement (accessed on 2 August 2020).
  39. Cador, J.M. Le Patrimoine en Canalisations d’AEP en France—Bilan des Huit Enquêtes Départementales et Estimation Nationale; Ministère de l’Aménagement du Territoire et de l’Environnement: Caen, France, 2002.
  40. SIMC. Fourniture de Matériel pour l’Adduction d’eau et l’Assainissement; Société Industrielle de Matériaux et Charbons: Manosque, France, 2011. [Google Scholar]
  41. Oasis Design. Water Tank Calculator, Research Notes on Effect of Tank Materials on Water Quality. Available online: http://oasisdesign.net/water/storage/extras/ (accessed on 2 August 2020).
Figure 1. The functional mapping of the household water production system.
Sustainability 12 08730 g001
Figure 2. The treatment lines and the amounts of water treated in systems 1 and 2. 1 Dissolved organic carbon (DOC) removal objective of the process 2 SM removal objective of the process.
Sustainability 12 08730 g002
Figure 3. Evolution of the water quality parameters through the treatment line for (a) drinking standard and (b) bathing standard. (c) Decomposition by process of cost, material, and energy consumption in S1 and S2.
Sustainability 12 08730 g003
Table 1. Decomposition of material and energy consumption by processes.
PAC AdditionCoagulation & FlocculationSettlingRapid Sand FiltrationPumping ProcessTotal Ex. Sludge
MaterialChemicals (kg/day)S1208016850003764
S298810200002008
Sand & sludge (kg/day)S100543044044
S200398435035
Pipe (kg/day)S100.00540.296.741.718.75
S200.00480.285.751.857.89
Tank (kg/day)S1171492211070493
S217149221840471
Total (kg/day)S1209718342211571.714310
S2100611692221241.852522
EnergyPumping (MJ/day)S100.06516185622,69624,370
S202.1511935022,70223,947
Stirring (MJ/day)S1480115,60100020,402
S2479815,59100020,389
Sludge scraping (MJ/day)S1000.66000.66
S2000.49000.49
Air compressing (MJ/day)S10005590559
S20003720372
Total (MJ/day)S1480115,601161961522,69645,332
S2479815,593119642222,70244,709
Table 2. Cost comparison of the two systems.
PAC AdditionCoagulation & FlocculationSettlingRapid Sand FiltrationPumping ProcessTotal Ex. Sludge
MaterialChemicals (€/day)S114563710001827
S2692224000916
Sand & sludge (€/day)S10001.001.0
S20000.800.8
Pipe (€/day)S100.00040.204.61.25.9
S200.00030.193.91.35.4
Tank (€/day)S14.43857270127
S24.43857220121
Total (€/day)S1146040957331.21961
S269626357261.31043
EnergyPumping (€/day)S100.0011270.9373400
S200.0353200.8373393
Stirring(€/day)S179256000335
S279256000335
Sludge scraping (€/day)S1000.0108000.0108
S2000.0080000.0080
Air compressing (€/day)S10009.209.2
S20006.106.1
Total (€/day)S1792562710.1373744
S279256206.9373734
TOTAL (€/day)S1153966584433742705
S277551977333741777
Publisher’s Note: MDPI stays neutral with regard to jurisdictional claims in published maps and institutional affiliations.

