Parameters Affecting Noise Emitted by Ships Moving in Port Areas
by
 , and
, and
Marco Nastasi
1, 
Luca Fredianelli
1 ,
,
Marco Bernardini
2,
Luca Teti
3,
Francesco Fidecaro
1 and
Gaetano Licitra
4,* 1
Physics Department, University of Pisa, Largo Bruno Pontecorvo 3, 56127 Pisa, Italy
2
CNR-INM Section of Acoustics and Sensors O.M. Corbino, via del Fosso del Cavaliere 100, 00133 Rome, Italy
3
iPOOL S.r.l., via Cocchi 7, 56121 Pisa, Italy
4
Environmental Protection Agency of Tuscany Region, Pisa Department, 56127 Pisa, Italy
*
Author to whom correspondence should be addressed.
Sustainability 2020, 12(20), 8742; https://0-doi-org.brum.beds.ac.uk/10.3390/su12208742
Submission received: 3 September 2020
/
Revised: 9 October 2020
/
Accepted: 12 October 2020
/
Published: 21 October 2020
(This article belongs to the Special Issue City and Port: Waterfront Integration for Sustainability)
Abstract
:Only recently has noise been considered in the assessment of the sustainability of port infrastructures, after decades of unawareness. INTERREG Maritime projects unveiled problems that have been neglected so far, such as the lack of proper regulation and noise exposure assessments for citizens. While it is true that a port area includes a huge variety of possible noise sources, very few of them have been characterized from an acoustical point of view. INTERREG projects have boosted research in the field, and previous studies have dealt with noise produced by moving ships in ports. The present work starts from a previous measurement campaign used to obtain broadband and 1/3-octave-band noise emissions of moving ships, and it aims to explain their uncertainties. More than a month’s worth of continuous acoustic measurements and video recordings were deeply analyzed in order to obtain an input database that is as precise as possible. A multiple regression analysis was performed in order to understand the influence that parameters such as minimum distance, speed, and draught have on ships’ noise emissions, which were calculated using pass-by measurements, with a special focus on ferries. The minimum distance of each ship’s passage from the microphone was measured using a video recording with an innovative methodology, providing results with 3 m of uncertainty. Knowing which parameter is more influential would help in planning proper measurements for monitoring or for drafting correct guidelines. Draught was determined to be uninfluential in ferries’ noise emissions, while the minimum distance and speed relations were estimated and accounted for in the calculation of a refined sound power level. From a spectrum point of view, the frequencies from 500 Hz to 2.5 kHz were determined to be those that contributed the most to the noise produced by the transit of a ship, and they vary with speed. With the studied corrections, different ferry models resulted in similar noise emissions. The standard deviation of noise emitted was reduced by 0.5 dB (A), and the average was also improved by positioning the ships’ flow at the correct average minimum distance. Furthermore, the right placement of a source is also important in the acoustic mapping phase for a correct evaluation of the propagation of noise at a distance. The use of more precise input data is important for improving the output of acoustic propagation models during the assessment of port noise in the surrounding areas.
1. Introduction
Since ancient times, maritime transport has been among the most important means of transportation and shipping. With the advent of flights, faster ways to move people were introduced, but maritime traffic plays a key role in commerce even nowadays. Even if sea travel can seem old-fashioned in the popular imagination, the amount of goods that a container ship can carry has no equals, making this a slower but cheaper service than a freight plane; moreover, the transportation of fossil fuels would be impossible by other means. Thus, it is not by chance that almost no country does not use maritime transport in its trade with the rest of the world [1].
According to the United Nations’ review on maritime transport [2], 2018 saw almost 12 billion tons loaded by container ships, bulk carriers, oil tankers, and dry cargo ships in international maritime trade. These numbers represent an increase of 2.7% of traffic, slightly lower than the 4.1% obtained in 2017. Together with tensions between the United States and China as well as other geopolitical aspects, environmental concerns are the factors that the United Nations has recognized as responsible for this reduction of the growth rate.
Considering that public transportation with ferries or tourist cruises is part of maritime traffic too, there are implications of bigger port sizes, more ship movements, and inhabited areas that are closer to industrial and operative port areas. Citizens’ complaints about noise have already been reported in port areas of Dublin [3] and Athens [4], as well as in La Spezia and Nice [5].
Protests have risen because noise pollution is one of the most important environmental impacts, leading to a variety of health effects when the exposure is prolonged [6]. Sleep disturbance [7], annoyance [8,9], learning impairment [10,11], hypertension [12], and cardiovascular and respiratory diseases [13,14] are the most frequent and important consequences.
Well aware of these noise-induced health risks, as early as 2002, the European Union passed the European Noise Directive 2002/49/EC (END) [15], requiring member states to produce strategic noise maps and action plans for the main roads, railways, airports, and urban centers every five years. Thus, the END resulted in an encouragement for the scientific community to study noise emissions, map their impact on the territory, and then mitigate the impact [16,17,18,19,20].
Port noise has been overlooked by the END, with a consequent marginalization of works and studies dealing with it. In fact, very few projects or studies [21,22,23,24,25,26,27] have been carried out on the characterization of port sources, acoustic mapping or action plans, and, last but not least, the assessment of citizens’ exposure to port noise. In addition to the lack of studies, the port environment is complex and does not make it easy to perform measurements. The size of the area, the large number of sources that are often overlapping, and the difficulty of accessing areas for safety reasons are just some of the problems for studies of this type. Moreover, the different types of sources are many, and they need their own and specific characterization in order to provide detailed inputs for the noise mapping phase.
Currently, it can be said that the study of ship noise is in its infancy, and it is important to follow what recent studies have shown. Ships emit noise differently if they are moving or not. While measuring stationary ships may look easy, the object dimensions and the multitude of different generation mechanisms have led some authors [28,29,30,31,32,33] and the Neptunes project [34] to propose different measuring methods for ships’ noise while at berth. A new boost to research has been provided by the INTERREG Maritime program Italy–France 2014–2020, including several projects aiming at filling the gap in knowledge regarding port noise while pinpointing the best practices in terms of long-term sustainability in the area of the north Tyrrhenian sea [35,36]. Moving ships have been even less studied than ships at quay, probably because it is expected that their routes are far from inhabited areas. Particularly in canal cities [37,38], or in the more common situation of port areas, ship noise can reach living places. While moving cruise ships have modern and silent machinery [39], other types of large sea-going vessels have been reported to have significant emissions by Fredianelli et al. [40].
In the previous study of Fredianelli et al. [40], the sound power levels and 1/3-octave-band sound power spectrum for roll-on/roll-off (RORO), container ships, oil tankers, chemical tankers, and ferries were computed on the basis of long-term pass-by measurements. In addition to the aforementioned difficulties of measuring noise in port environments, a certain degree of variability of the source must also be taken into account, since even the same source can produce different noise levels based on several conditions. For these reasons, the results presented in [40] were affected by high uncertainties.
The present work aims at explaining the uncertainties associated with the estimated sound power level of large sea-going vessels in motion and how this emission varies with source–receiver distance, as well as the ship’s speed and draught. Pass-by measurements and video recordings have been analyzed in order to exclude transits disturbed by other simultaneous noise sources. While draught data were directly provided by the ShipInfo’s telematic system portal and the ship’s speed was easily calculated from the video, a novel method was applied for calculating the minimum ship-to-microphone distance (d) from the recordings.
The analysis was carried out separately for different ships in order to reduce the uncertainty caused by mixing different vessels together. Then, a comparison among the three ships was reported in order to evaluate noise emissions of different ships of the same category.
A multiple regression analysis was applied to the dataset of three different ferries in order to evaluate correlations among the independent variables. The effects of draught, minimum distance of the passage from the microphone, and ship speed on sound emitted were analyzed.
An in-depth analysis will concern frequency bands that correlate the most with a ship pass-by. Finally, a new sound power level and 1/3-octave spectrum will be reported for the ferry category, which was computed with the Expert Industry Toolbox of SoundPLAN vers. 8.1 applied to the average A-weighted sound pressure level (LAeq) of each measured transit. The noise emission of a moving ship was implemented in the noise model as a line source, as is the practice for road and railway traffic. The results improve the quality of the inputs usable in acoustic propagation models for the noise mapping and the evaluation of citizens’ exposure. Furthermore, knowing the most influential parameter on ship noise would be useful to port authorities to eventually apply restriction policies as mitigation actions or to manufacturers for possible future improvements for a quieter maritime environment.
2. Materials and Methods
A class I sound level meter compliant with IEC 61672-1 recommendations [41] and a weather mast were placed at the entrance of the industrial port of Livorno, Italy from 24 May 2018 to 5 September 2018. The instrumentation was installed 1 m from the water’s edge, with the microphone in free field and at 4 m height. A 90 mm foam windscreen was used in order to prevent wind-induced noise on the microphone. The time-history of the noise level was acquired using a 100 ms time base, and periods with wind speed exceeding 5 m/s were removed in postprocessing according to common measurement practice, as well as periods with rainfall. Events occurring when the Beaufort scale was higher than 3 were also removed from the analysis [42]. LAeq-valid ship transits were defined by 10 dB(A) around their peak. For each transit, LAeq, the sound exposure level (SEL), and the linear spectrum were calculated.
The estimation of the SEL and LAeq indicators was derived from the ISO/CD 11819-1 [43], which describes a method for road noise evaluation using roadside noise measurements, and is known as the Statistical Pass-By method (SPB). The SPB method relies on a great number of measurements performed on the actual vehicle fleet in normal road traffic conditions and with no particular constraints, except for constant speed on the road surveyed.
Unlike the SPB method, which is designed for road traffic monitoring, acquisitions were not performed using the fast acquisition channel, since an acoustic event related to naval transit has a much longer duration than the passage of a car. Thus, in order to properly adapt the measurement protocol to ship noise measurements, the maximum A-weighted level was not recorded, following an approach similar to the modified SPB standard [44]. The SEL was then calculated according to ISO 1996-2 [45], which defines a pass-by event as the part of the signal in which the sound pressure level is between the max and the max—10 dB(A).
The measurement position was chosen in order to prioritize proximity to the only way of accessing the industrial port while keeping safety and protection of the equipment in mind. Thus, the microphone registered movements of ships like tugboats, pilot boats, ferries, container ships, ROROs, lift-ons/lift-offs, and chemical and oil tankers.
The background noise of the area is mainly generated by the sea or wind, as the closest road has low traffic, is internal, and is mainly used by trucks at low speeds. Given the nature of the analysis, considering only noise emitted by ships’ transits, no overall noise levels were computed and considered, but ships’ transits occurring while truck noise events were present were neglected, thus reducing the possibility of contamination of the dataset.
The ship identification was performed using the port authority’s surveillance camera, which provided three different views of the canal. The visual information provided by the cameras was also used to estimate their speed. In order to further ensure the correct identification of ships, a cross-analysis of videos and the telematic system portal ShipInfo’s information was also performed. This information yielded timings that referred to the vessels’ arrival and departure at the pier, and not to their time of transit along the canal. In fact, delays of up to 40 min between visual data and the timestamps provided by ShipInfo were found.
Since ferries have scheduled timetables, the analysis performed in this work considered only their transit. Ferries were also chosen for their acoustic homogeneity compared to the other categories and represent about the 10% of the total transits, although ROROs are the most common ship category present in the port. However, narrowing down the analysis to a single category has the significant advantage of enabling analyses on each single vessel, thus further reducing uncertainties due to differences in noise emissions between different ships belonging to the same category. Indeed, sound emitted by different vessels depends on, among other factors, the specific number of sources, their relative positions on the ship, and their maintenance. Part of the variance of data regarding noise within a category of ships is certainly caused by intrinsic differences present in the ships that belong to the group. An estimate of this variance was provided in a previous work [40].
Only three different ferries pass through the canal and were considered in the present work: the Cruise Olbia (41% of the total ferry pass-bys), the Cruise Bonaria (41%), and the Zeus Palace (18%).
Tugboats do not usually drag ferries; consequently, they were not included in the ferry sound power levels.
The data acquisition and analysis led to the creation of a database built from sound level measurements, video recordings, and ShipInfo’s information. Each row of the database corresponds to a ferry passage, and the rows include data concerning distance (d) from the ship to the microphone, ship speed, draught, LAeq, SEL, linear spectrum, ship dimensions and name, date and time of the passage, and type of movement (departure or arrival).
The ship’s distance (d) represents the distance between the microphone and the ship’s route, and is calculated using the minimum distance between a point and the route line.
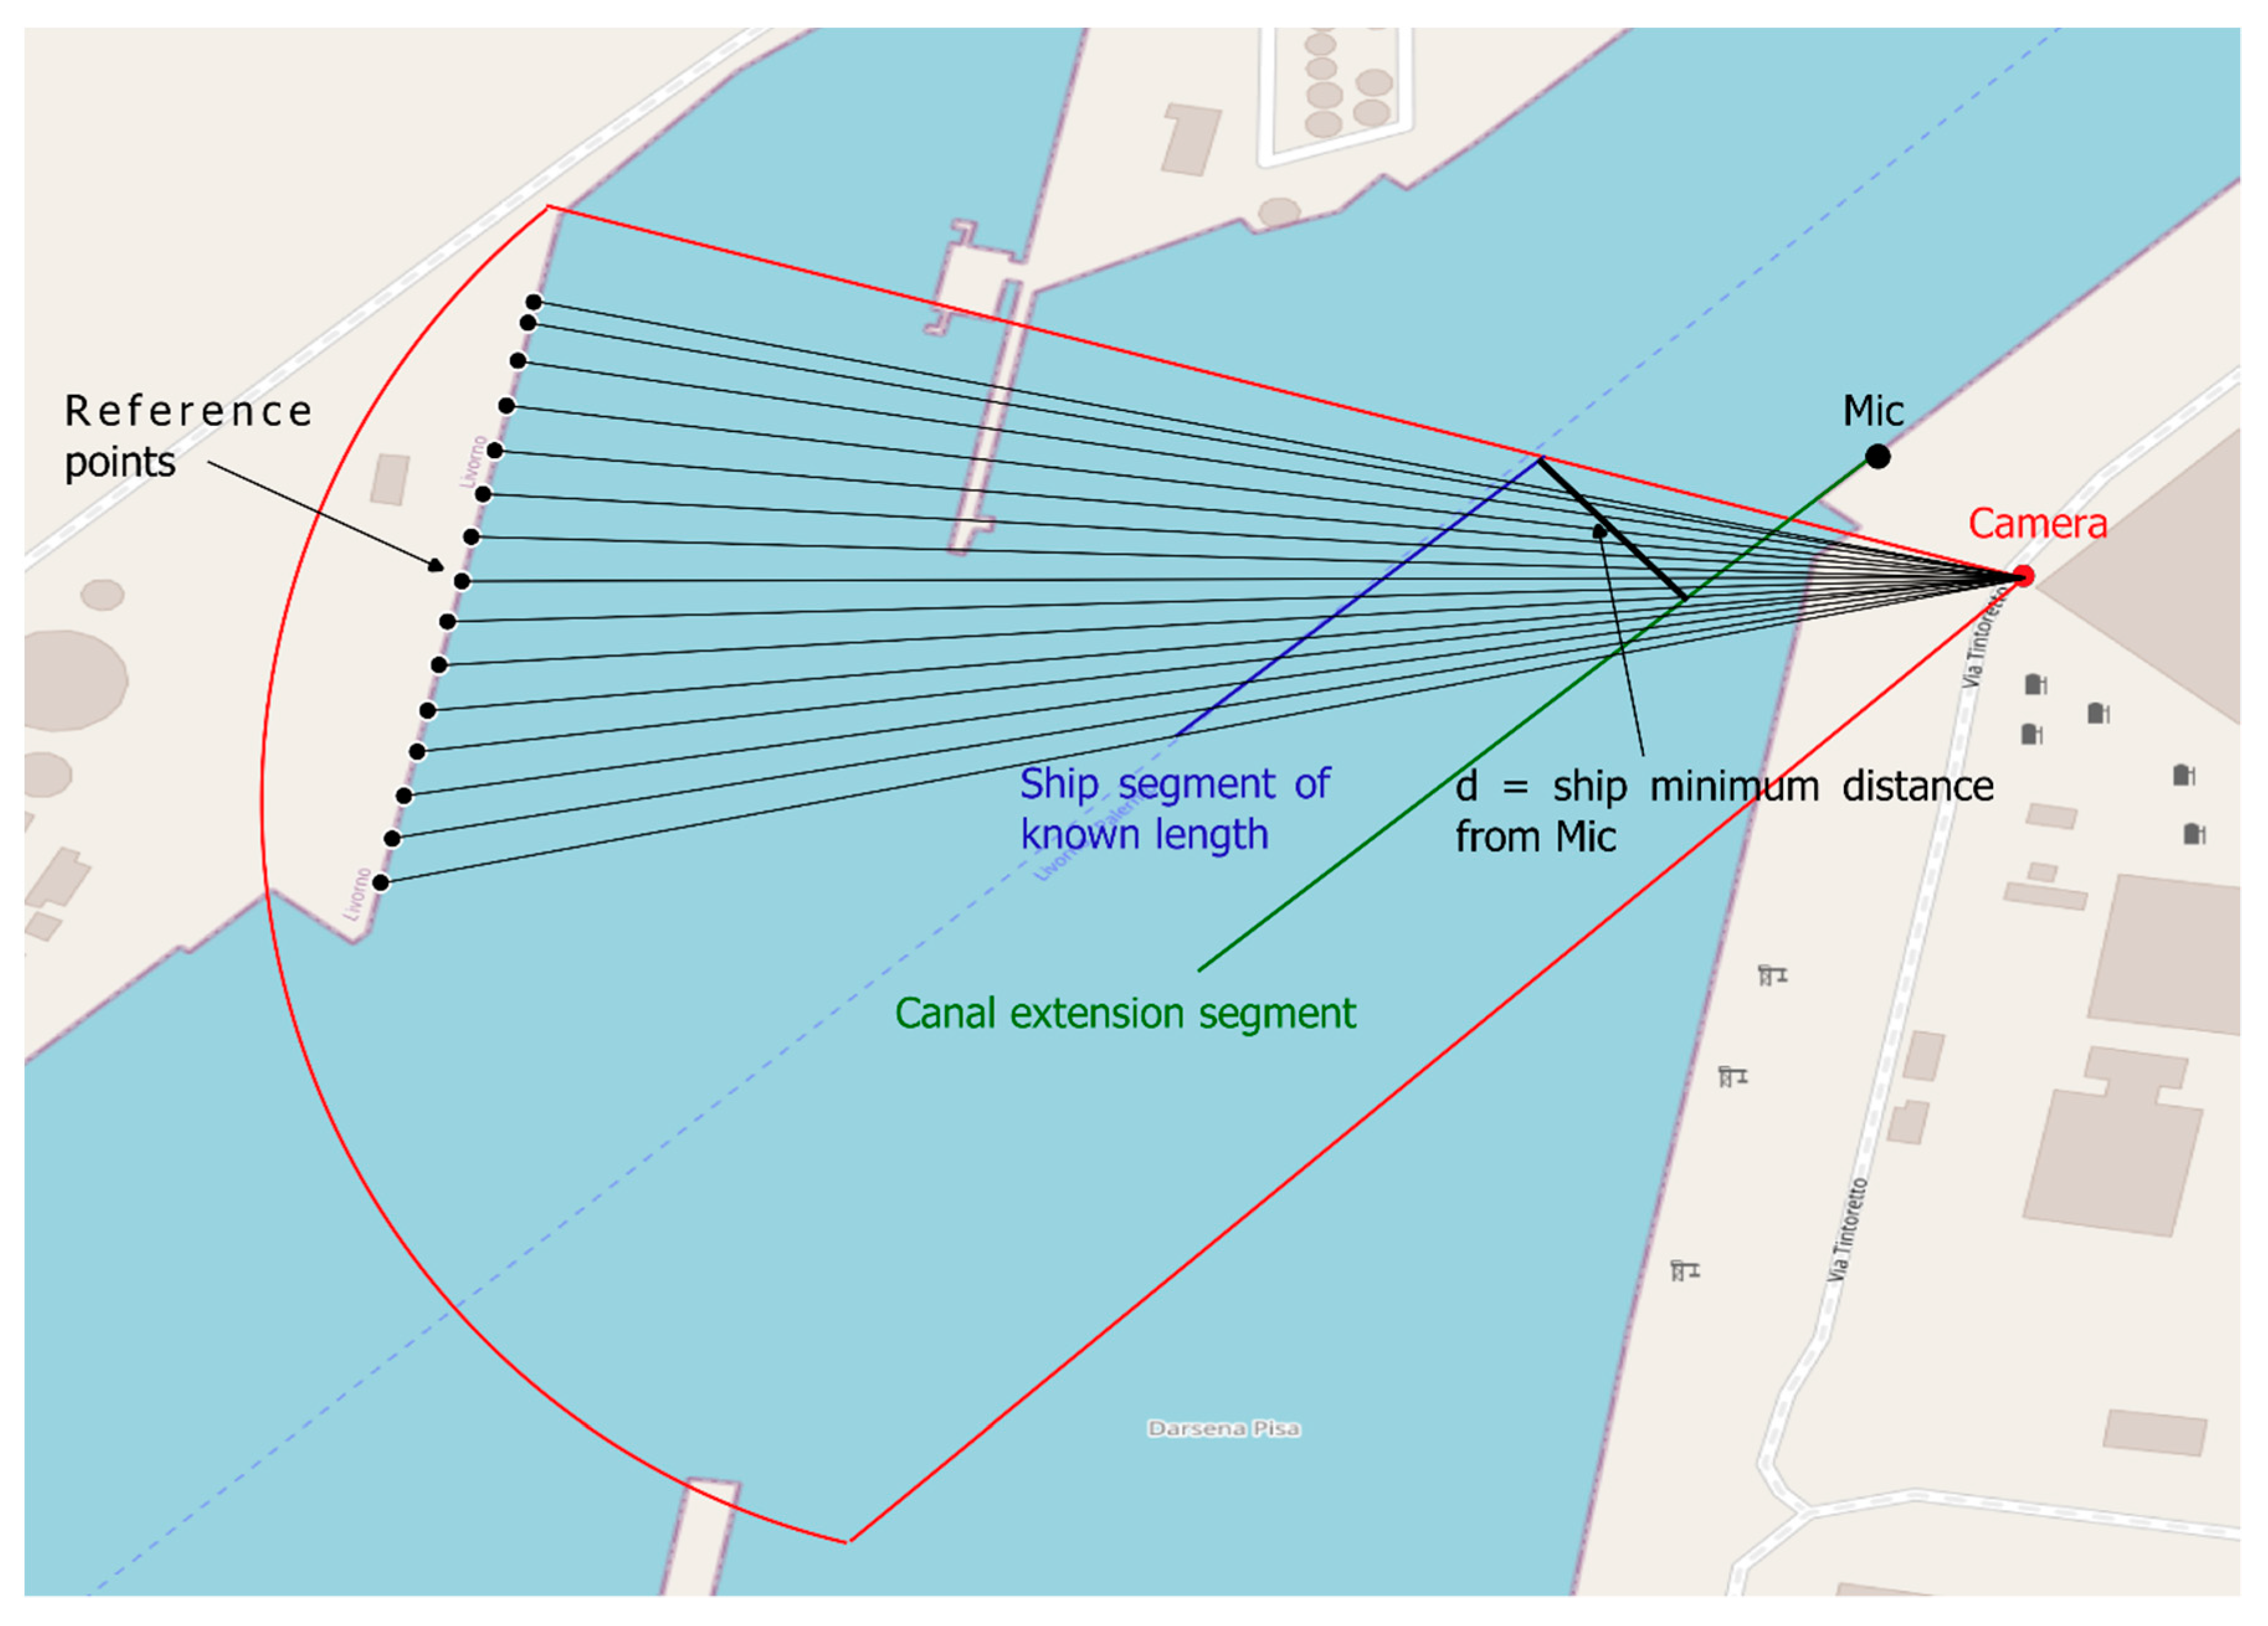
Ship speed was calculated from the video recordings; interestingly, even if the port regulation fixes the passing speed limit in the port to 5 knots, the resulting span for ferries ranges from 4.8 to 9.3 kn (2.5–4.8 m/s). This results in a non-negligible increase and variability of data if compared to the speed limit, which was assumed to be ubiquitously respected in the previous work [40]. On the contrary, evaluating the distance between ships passing by and the microphone is a difficult and cumbersome task. Indeed, distance measures are possible by using a laser meter. This, however, proved to be instrumentally impossible and, moreover, would have required the presence of an operator during the entire long-lasting noise measurement campaign. The best alternative would be to acquire the automatic identification system (AIS) data of each vessel, but this operation requires a high monetary cost that was not sustainable at the time of the acquisitions, as the funds were used to acquire ShipInfo’s data. Consequently, a method for calculating the transit distance was developed using surveillance videos, which provided reliable results with an uncertainty of ±3 m.
The method developed here is based on the following steps, which were carried out for each pass-by:
- Ground references were found within the view of the video surveillance images;
- Ground reference points were then reported on a Geographic Information System (GIS), thus identifying their geographical coordinates;
- Projection lines between the reference points and the camera were drawn;
- A screenshot was captured when the monitored ship was in correspondence with the two reference points on the ground.
- Since the length of the ships were known from factory details, the simple geometric considerations summarized in Figure 1 allowed the calculation of the distance between the ship transit line and the microphone under the assumption that the ship (blue in Figure 1) remained parallel to the canal border segment (green in Figure 1) during its transit.
Both ship speed and distance from the microphone were measured through the recordings, and thus, in this work, video data were essential for pass-by evaluations. Unfortunately, video acquisitions do not cover the whole three months of noise measurements, but are limited from 10 July to 8 August 2018. The pass-by database was limited accordingly. Despite this limitation, compared to the previous work [40], a greater number of transits were included. During this period, ferry transits covered up to 15% of the total transits.
In order to study the effects that the parameters studied had on the noise emissions of moving ships, a multiple regression analysis was carried out on the database.
Multiple regression is an analysis that examines the effects of multiple independent variables (predictors) on the value of a dependent variable (outcome). A coefficient for each predictor is calculated, as well as its statistical significance, in order to estimate its effect on the outcome while other predictors are held constant.
Once the variability brought about by having different ships in the same category was established by separating all of the analyses on single vessels, the predictors chosen for the linear regression were speed, ship–microphone distance, and ship draught. The multivariate analysis was then carried out considering variables after subtracting their mean values (e.g., distance considered = distance − average distance). This procedure ensured that the intercept of the linear regressions provided an estimate of sound pressure levels of a pass-by characterized by average values of the variables considered.
A preliminary analysis was carried out on the entire data set, bearing in mind a possible dependence between sound pressure level and distance. The subsequent analysis involved a distance correction by reporting all transits with the average distance of the passages. In this way, it was possible to study the effect of speed and draught on the transit levels.
An in-depth analysis was conducted for the 1/3-octave bands with the aim of researching the dependence of the same parameters on the predominant emission bands. Such an analysis may be useful to highlight the presence of specific sound sources and their relative relevance for ship noise monitoring and control.
Finally, the corrected average sound pressure level of the ferry category was calculated by applying the obtained corrections, and sound power levels were estimated.
It is customary to study road traffic noise and railway traffic noise by using line source approximation; likewise, the noise emission of a moving ship is better represented by a line source. Thus, all the sound power levels computed in the present work were aimed at providing input data for a linear emitting source in an acoustic propagation model. For this reason, based on the approach followed in [40], the ferry pass-by sound power level (LW/m) considered in the paper is a linear density power level expressed in dB(A), not to be confused with the sound power level of the moving ship.
As a final remark, the uncertainty of the data resulted to be less than what was obtained in [40].
3. Results
As the data set contained different transits compared to the previous work [40], the first step included a calculation of ferries’ pass-by sound power levels (LW/m), thus allowing the quantification of the improvements brought about by the present work in reducing uncertainties.
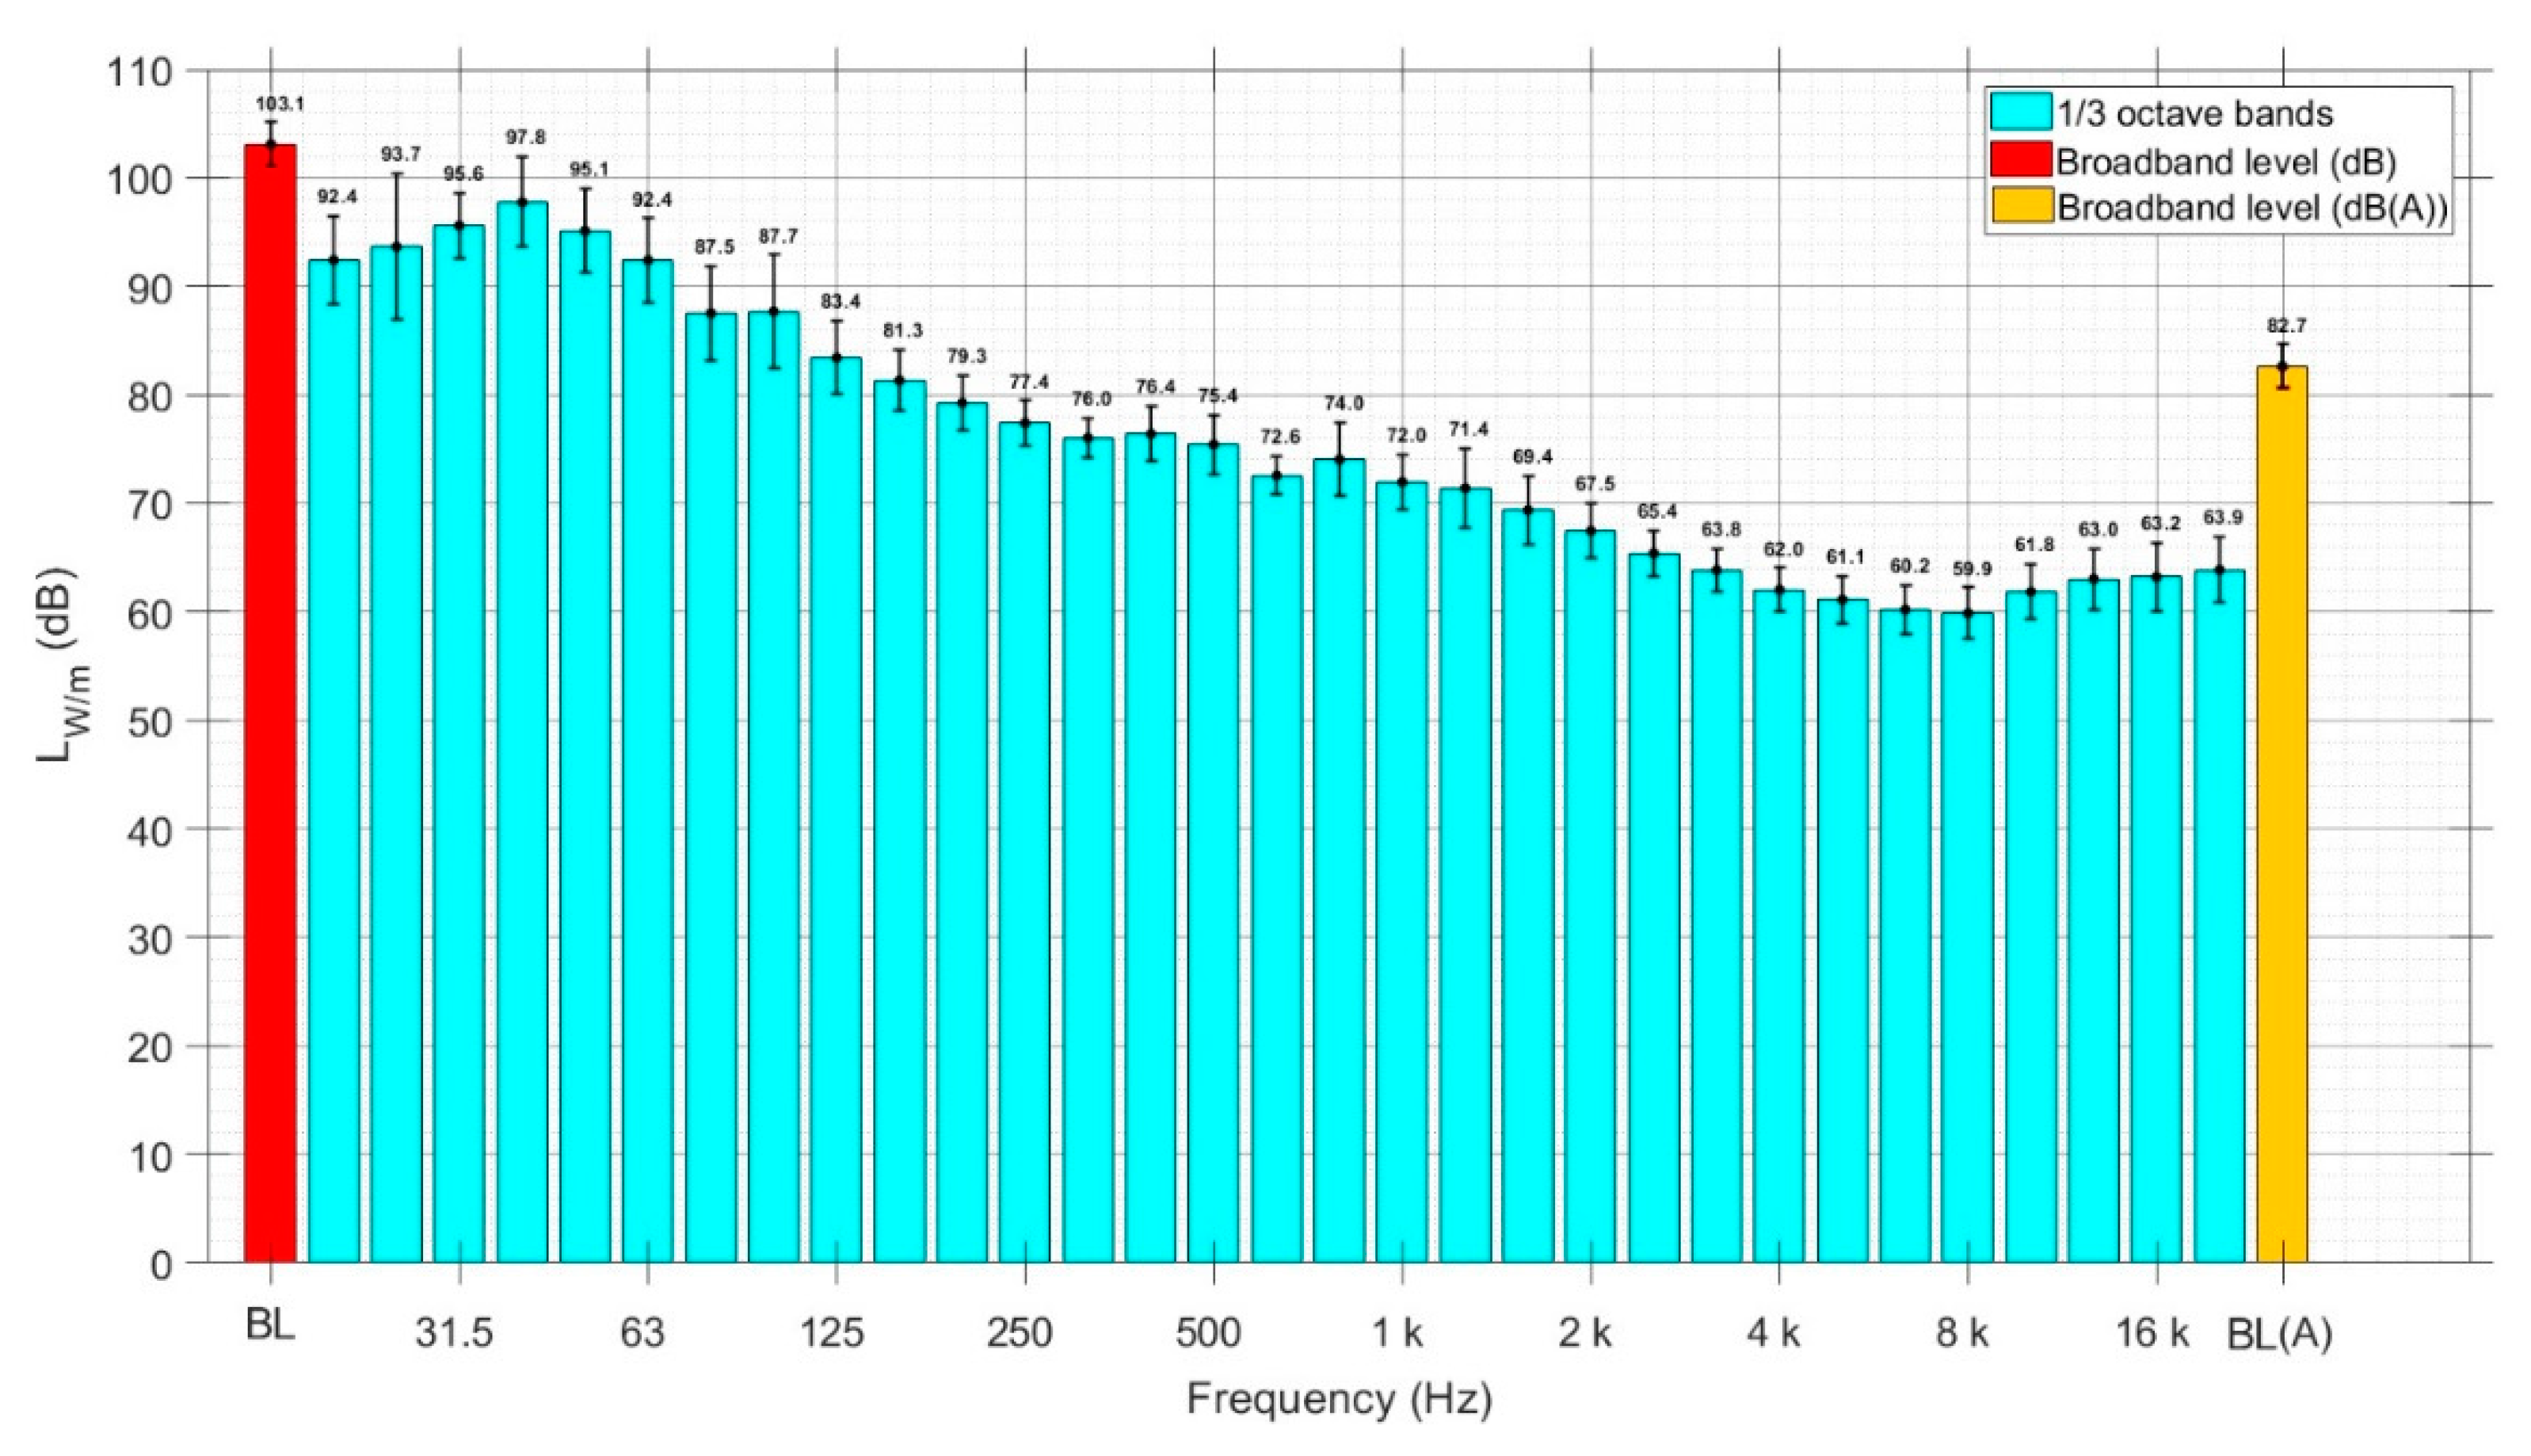
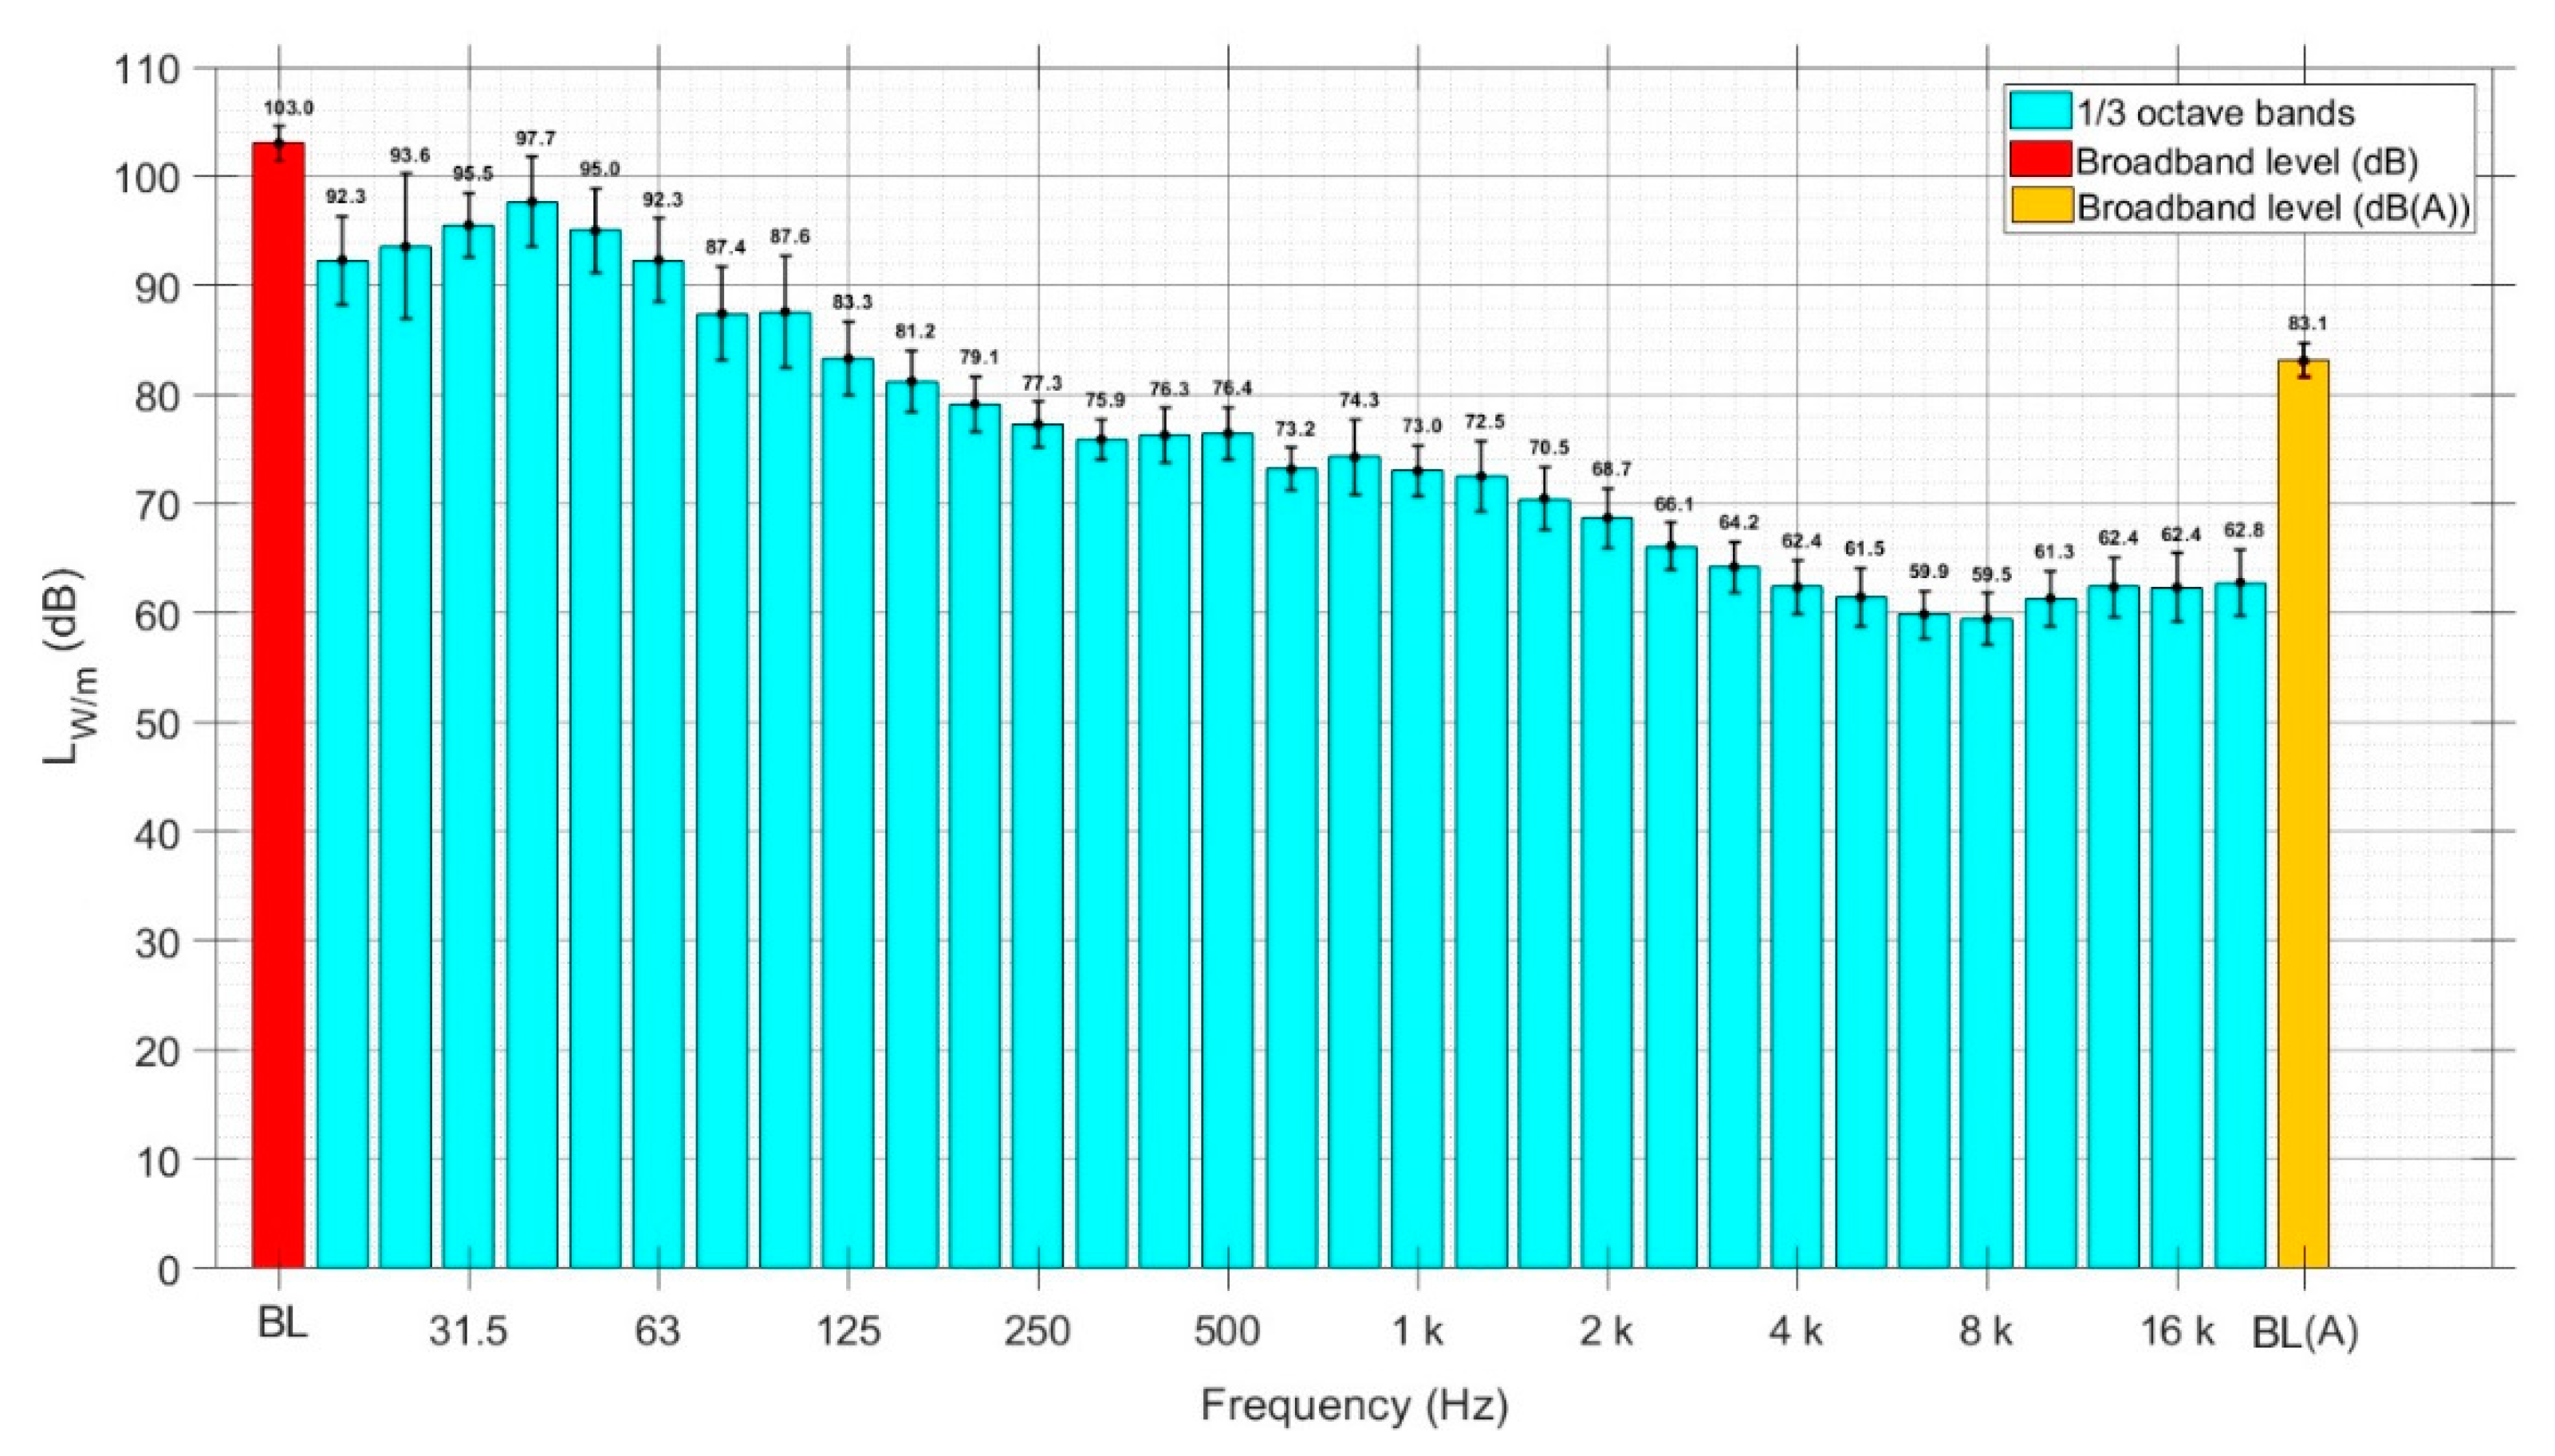
LW/m was calculated with the Expert Industry Toolbox of SoundPLAN vers. 8.1, which was applied to the average LAeq of each measured transit. In this process, a 3D representation of the examination area was implemented within the model. The naval source was modeled as an emission line, and the measurement point was added into the scenario. The software uses ray tracing and is thus able to return the sound power level of the source starting from one or more measurement points with known sound pressure levels. Following this approach, Figure 2 reports the LW/m calculated with all ferries passing 53.5 m from the microphone. The measured distances range from 40 ± 3 to 74 ± 3 m.
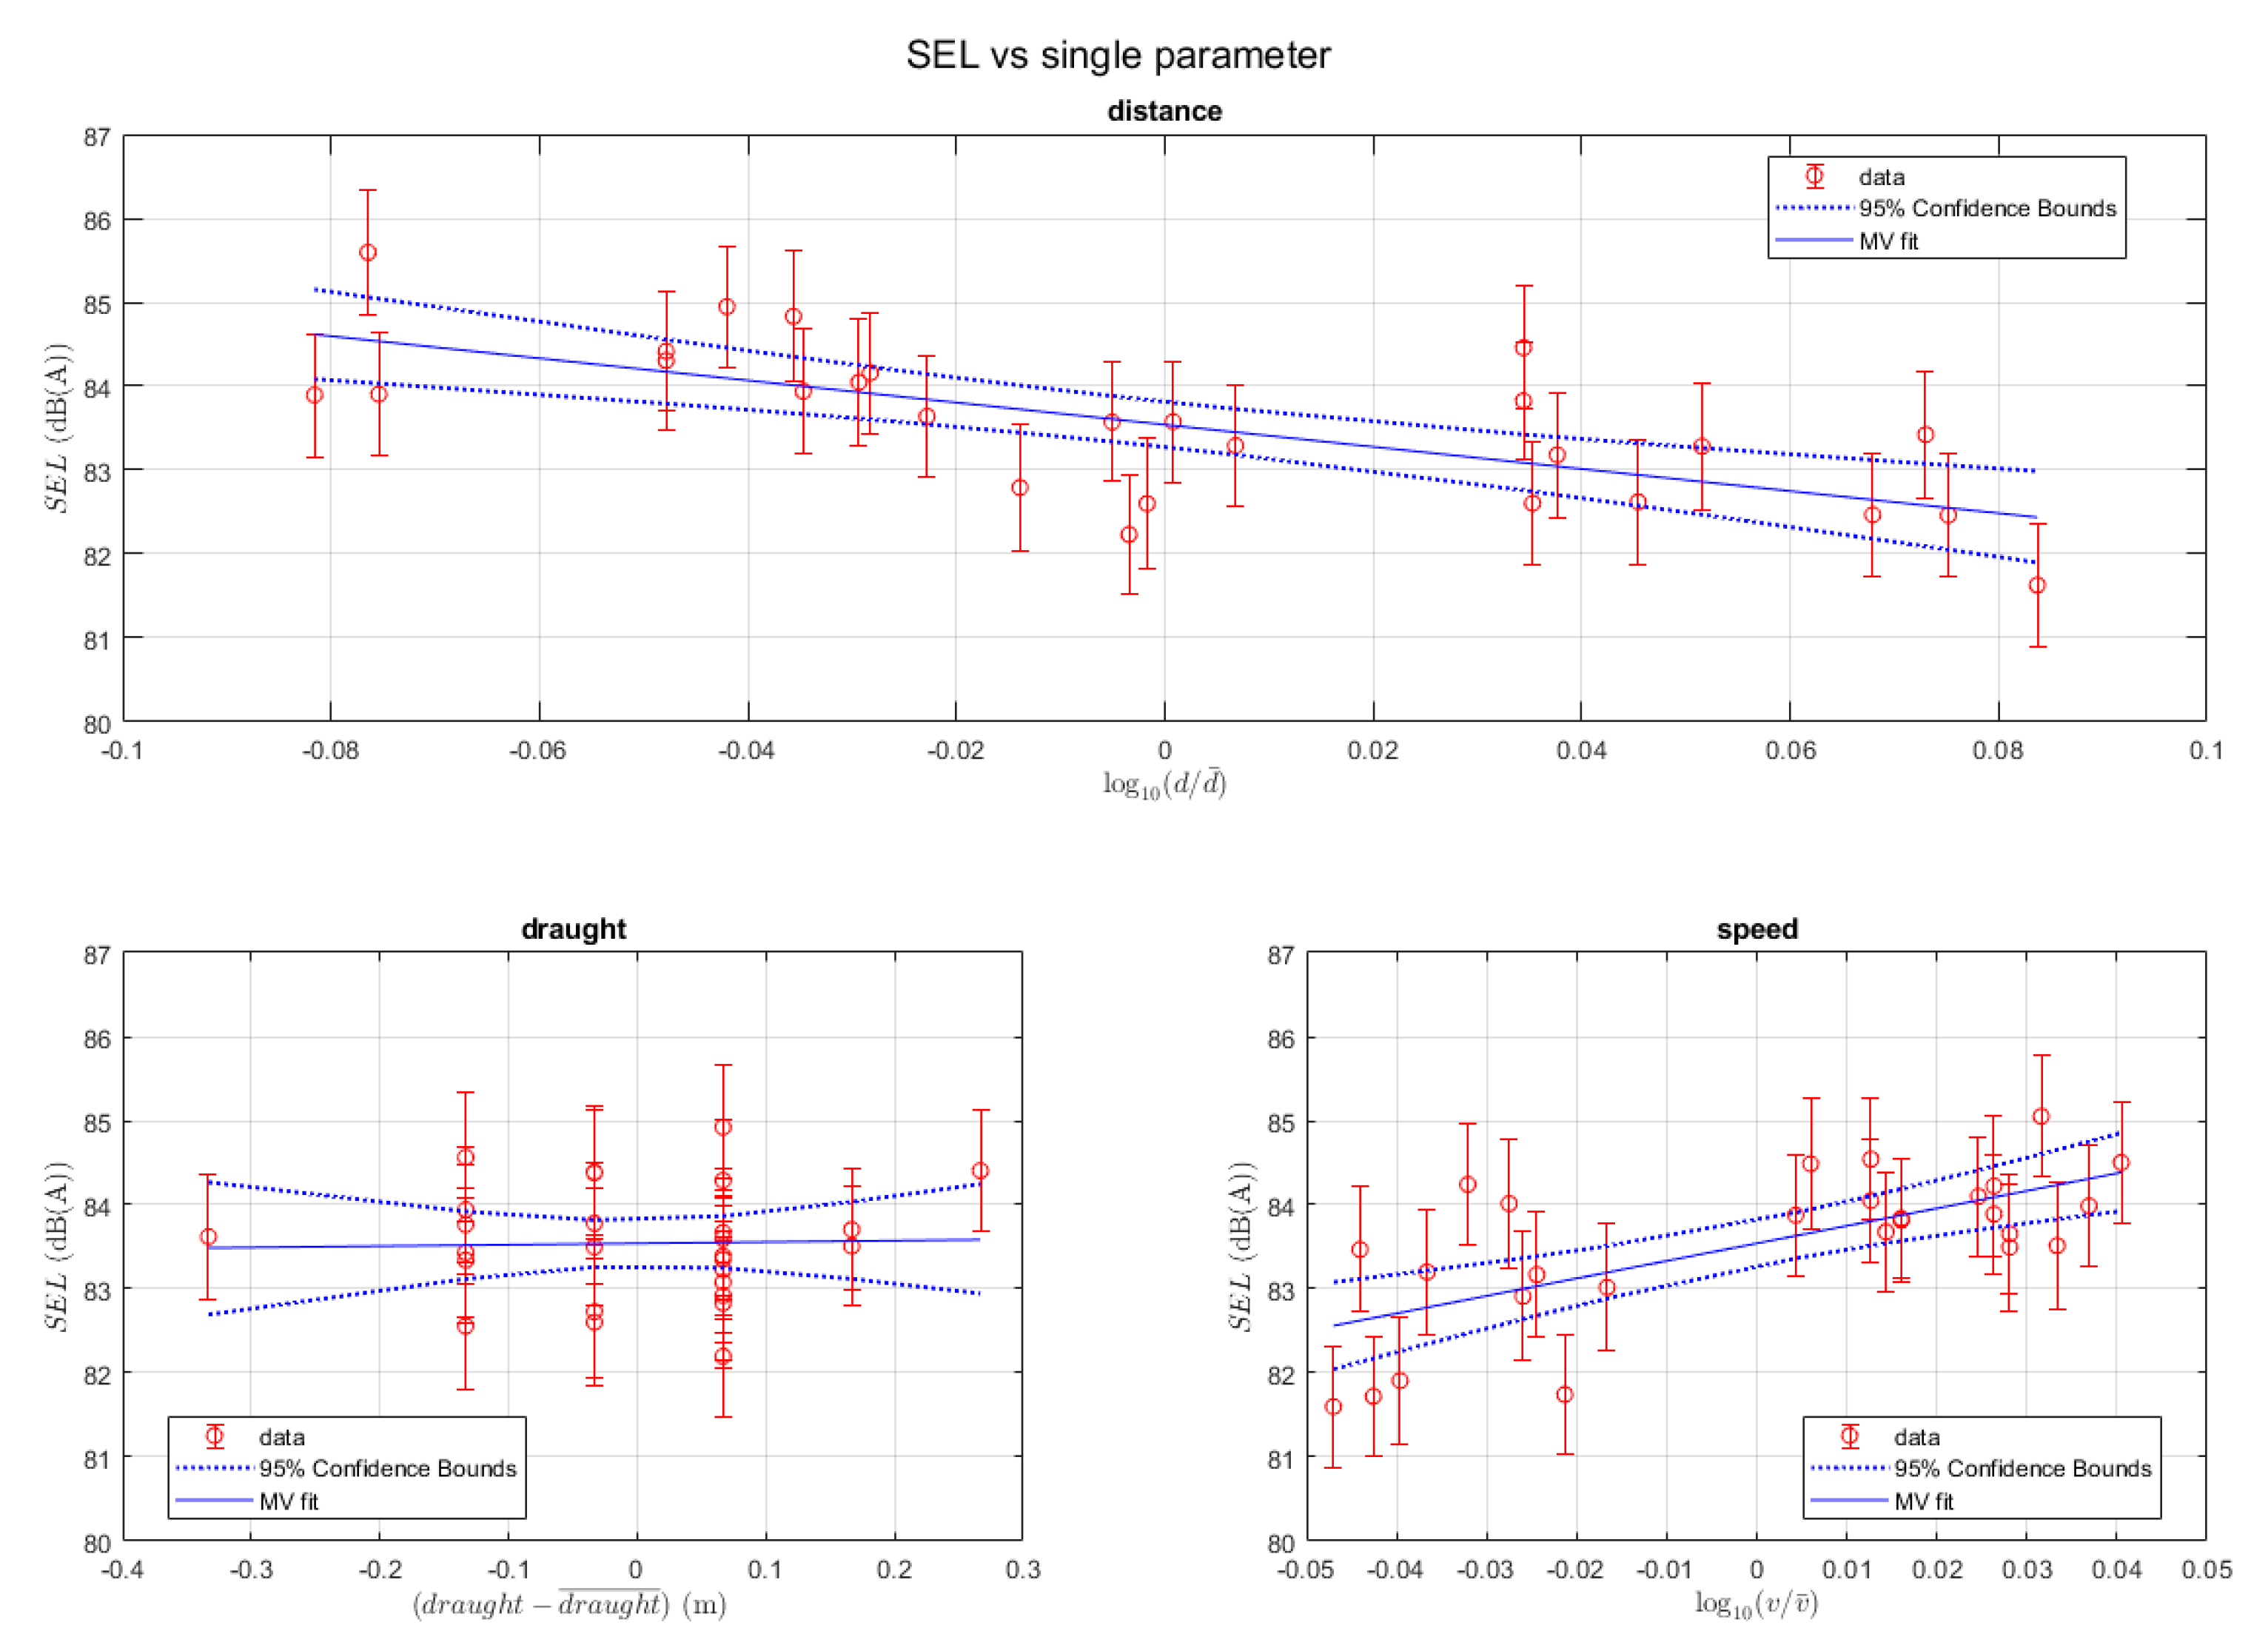
A first multivariate linear regression including all three parameters (speed, distance, draught) was applied separately to each vessel’s data set. Figure 3 shows the results obtained for the Cruise Olbia, which was chosen as an illustrative example.
The variables’ significance was assessed with the t-statistic, whose function is to reject the null hypothesis (H0) or accept the alternative hypothesis (H1) within the significance level α = 5%. The t-statistic was used for each coefficient to test the null hypothesis (H0)—that the corresponding coefficient is zero—against the alternative hypothesis (H1)—that it is different from zero—given the other predictors in the model.
Table 1 shows the results of the fit with the standard error and the statistical parameters necessary for the evaluation of significance through the t-test.
Since the draught has a p-value well over the threshold typically chosen in statistical analysis (i.e., 0.05), draught is non-significant for the model. Thus, the analysis proceeded considering dmin and speed, which instead showed small p-values.
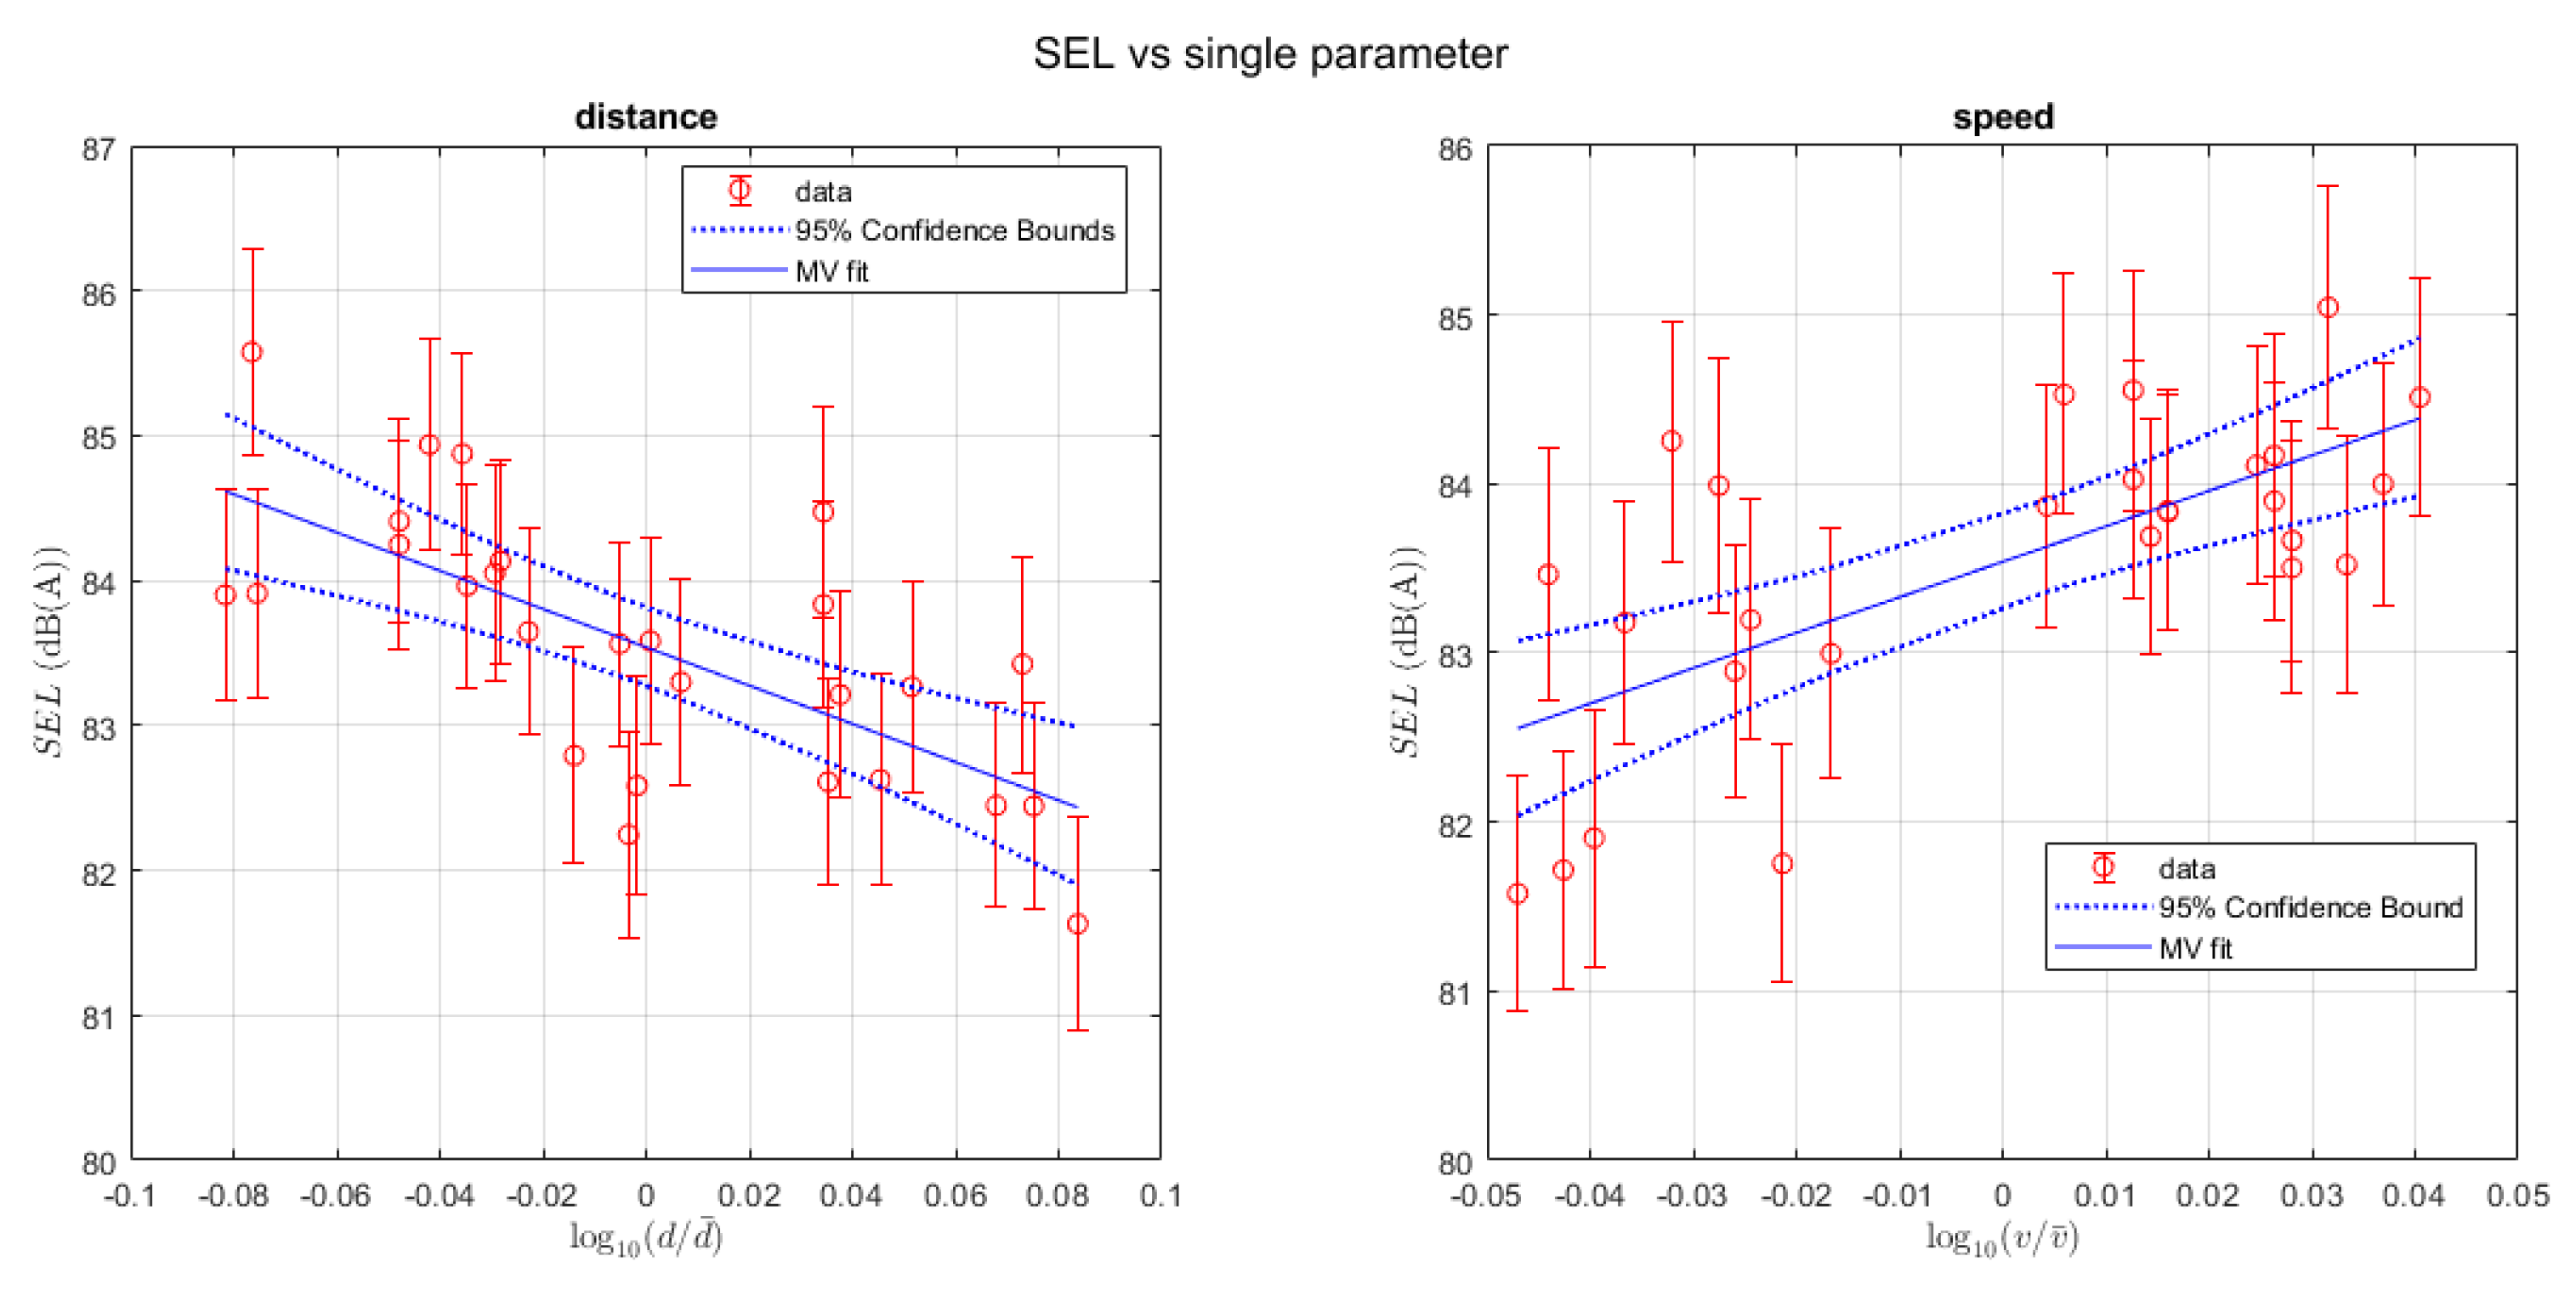
The results and the statistical parameters of the analysis carried out without the draught are represented in Figure 4 and reported in Table 2.
In this case, the p-value of the two variables remains well below 0.05. The estimated coefficients in Table 2 are comparable to those obtained in Table 1 for speed, distance, and intercept, since they are widely within the standard errors, confirming again the non-significance of draught in SEL estimation.
By inverting the relationship obtained with the fit on the SEL–distance graph of Figure 4, Equation (1) was obtained:
L* is the noise level corrected at the desired reference distance from the original noise level L measured at a distance d. Equation (1) can be used to calculate the SEL of a transit at a distance d.
This distance correction was applied to all measured transits in order to bring them to a reference distance, for which the Zeus Palace’s average distance was chosen: = 47.1 m. This particular value was chosen, since this ferry showed very low variability in the transit distance.
This procedure allowed the exclusion of the influence of distance on sound pressure levels; therefore, the only dependence of noise levels is on speed. Equation (2) shows the dependence on speed of ferries’ noise. The reference speed was arbitrarily chosen as the Zeus Palace’s average speed ( 3.9 m/s) for reasons of consistency:
The same multivariate analysis procedure previously described was then applied to each single 1/3-octave band of the spectrum of each single pass-by in order to explore possible dependencies of 1/3-octave-band noise levels on speed. The R2 indicator was used as a yardstick, i.e., bands with R2 lower than that obtained for the broadband fit were excluded. The result was that the frequencies from 500 Hz to 2.5 kHz were those that are most correlated and are useful in characterizing the set of sources contributing to the noise produced by the transit of a ship. The other bands showed no dependence on speed and are excluded from Figure 5, which shows the SEL as a function of speed. A top view of the three-dimensional diagram is also shown to improve readability. SEL increases with speed for all the bands shown, in accordance with the trends found by the multivariate analysis and with the broadband trend.
With the noise data of each transit corrected for distance, the LW was calculated again, with all ships virtually passing at the same distance. The corrected spectrum is reported in Figure 6.
In order to provide an indication of the disturbance that a ferry transit may represent, the loudness was estimated. In the present work, the loudness was calculated considering the sound pressure level used to calculate the results in Figure 6. Following the method of Stevens in accordance with ISO 532:1975 [46], a loudness equal to 13.1 sones was obtained on the basis of the loudness values for each 1/3-octave band; this was calculated using the isophonic curves according to ISO 226:2003 [47] and is valid in free field.
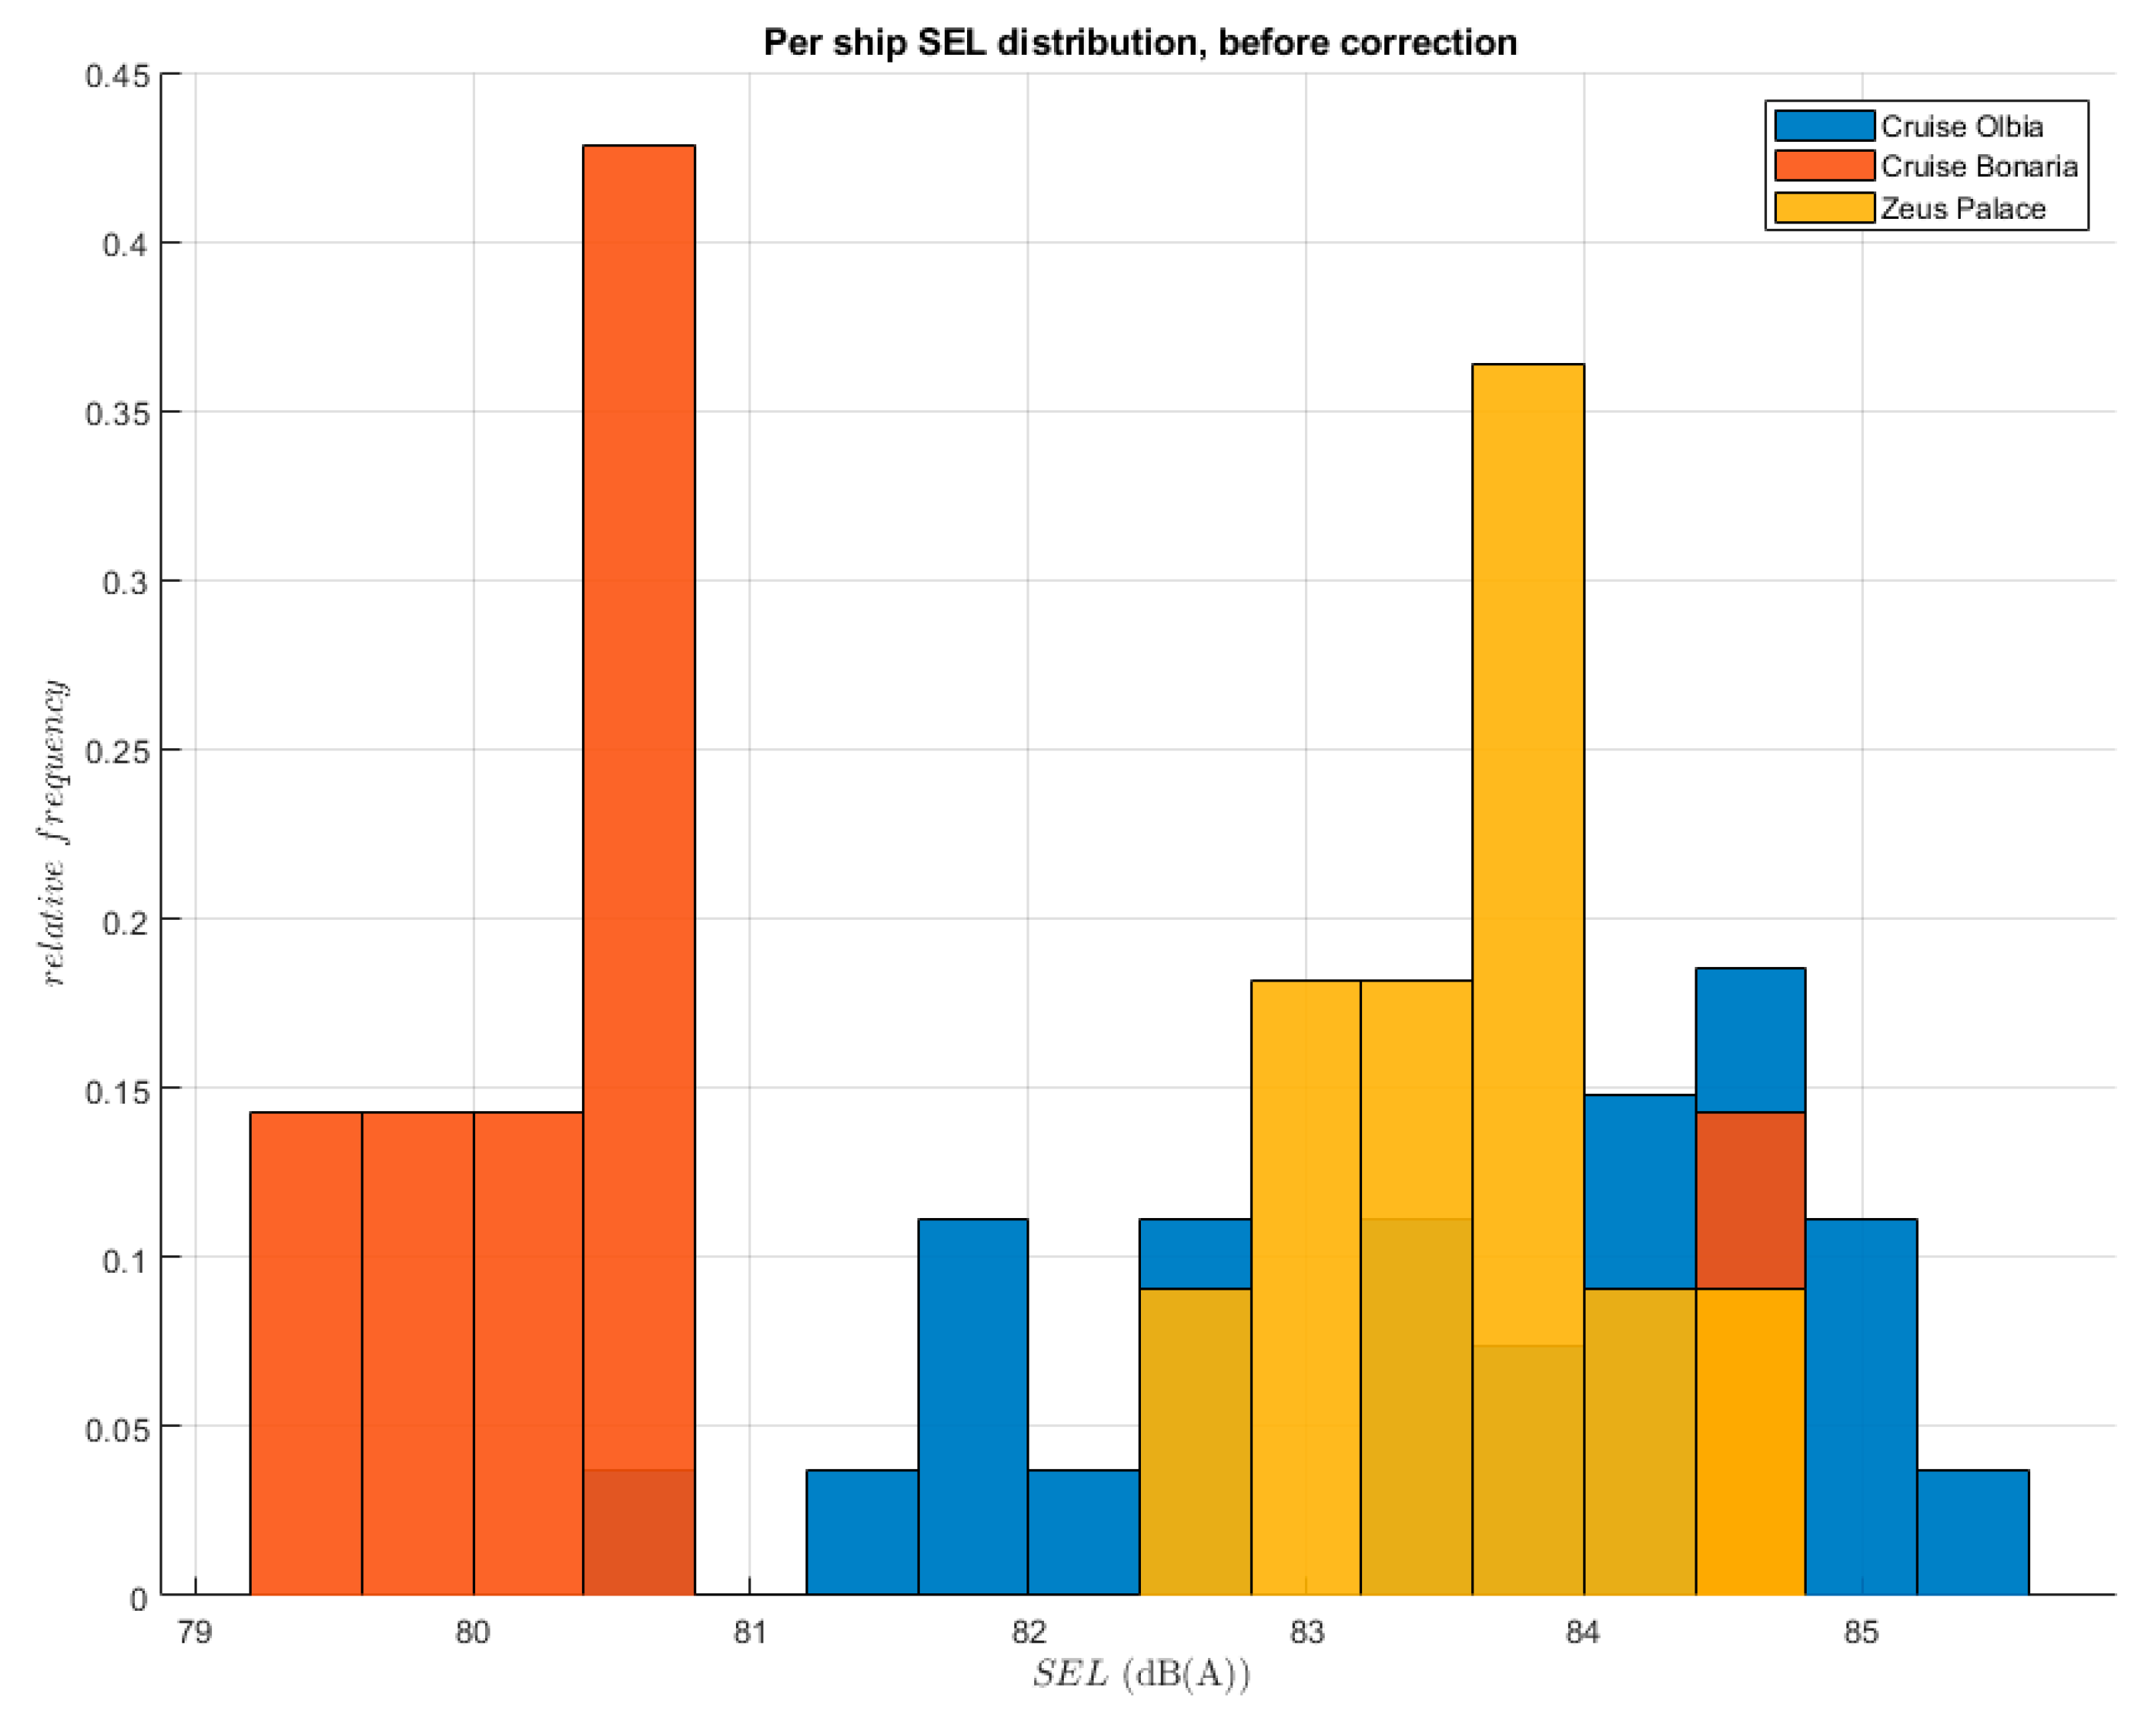
Lastly, an investigation of the effect of individual ships’ models on the total category value was performed. Figure 7 shows the raw SEL distributions of transits for each vessel. The Cruise Olbia and Zeus Palace showed similar averages, while the Cruise Bonaria had a lower mean value. This fact could explain the high standard deviation of noise emissions calculated for ferries in the previous article [40].
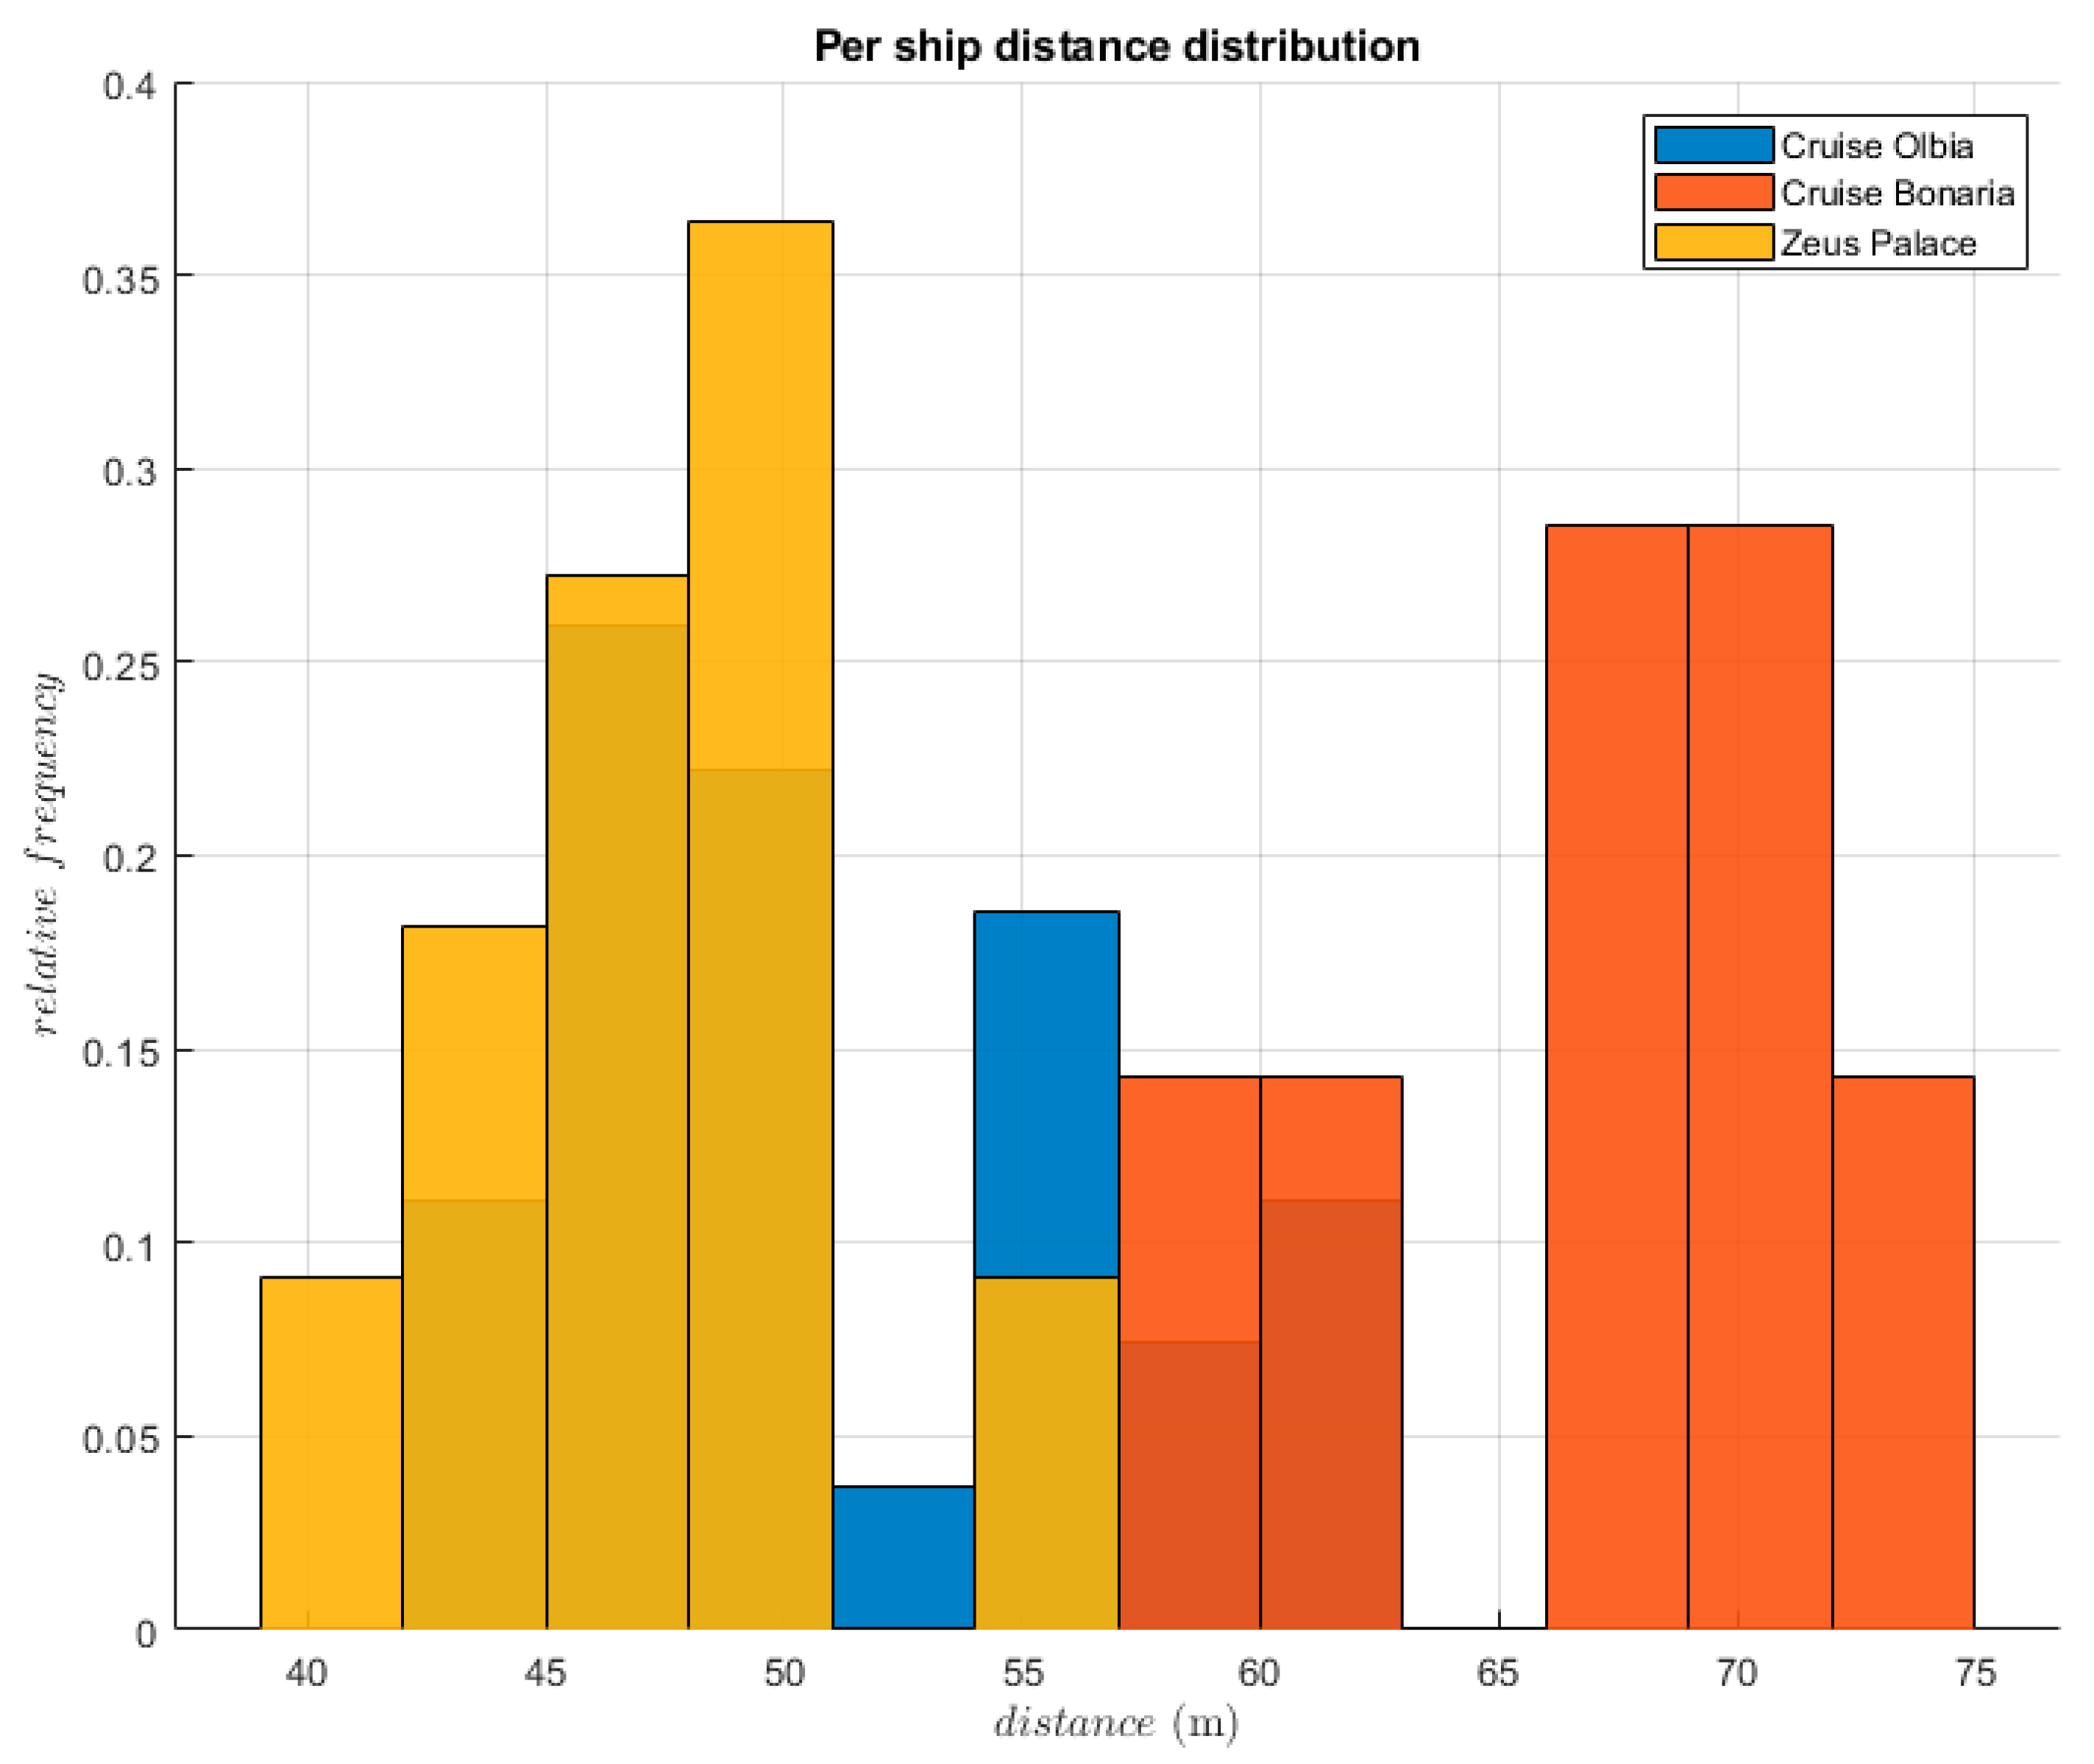
The lower average value of the Cruise Bonaria is due to its higher average transit distance from the microphone, as is visible in the distance distribution for each vessel in Figure 8.
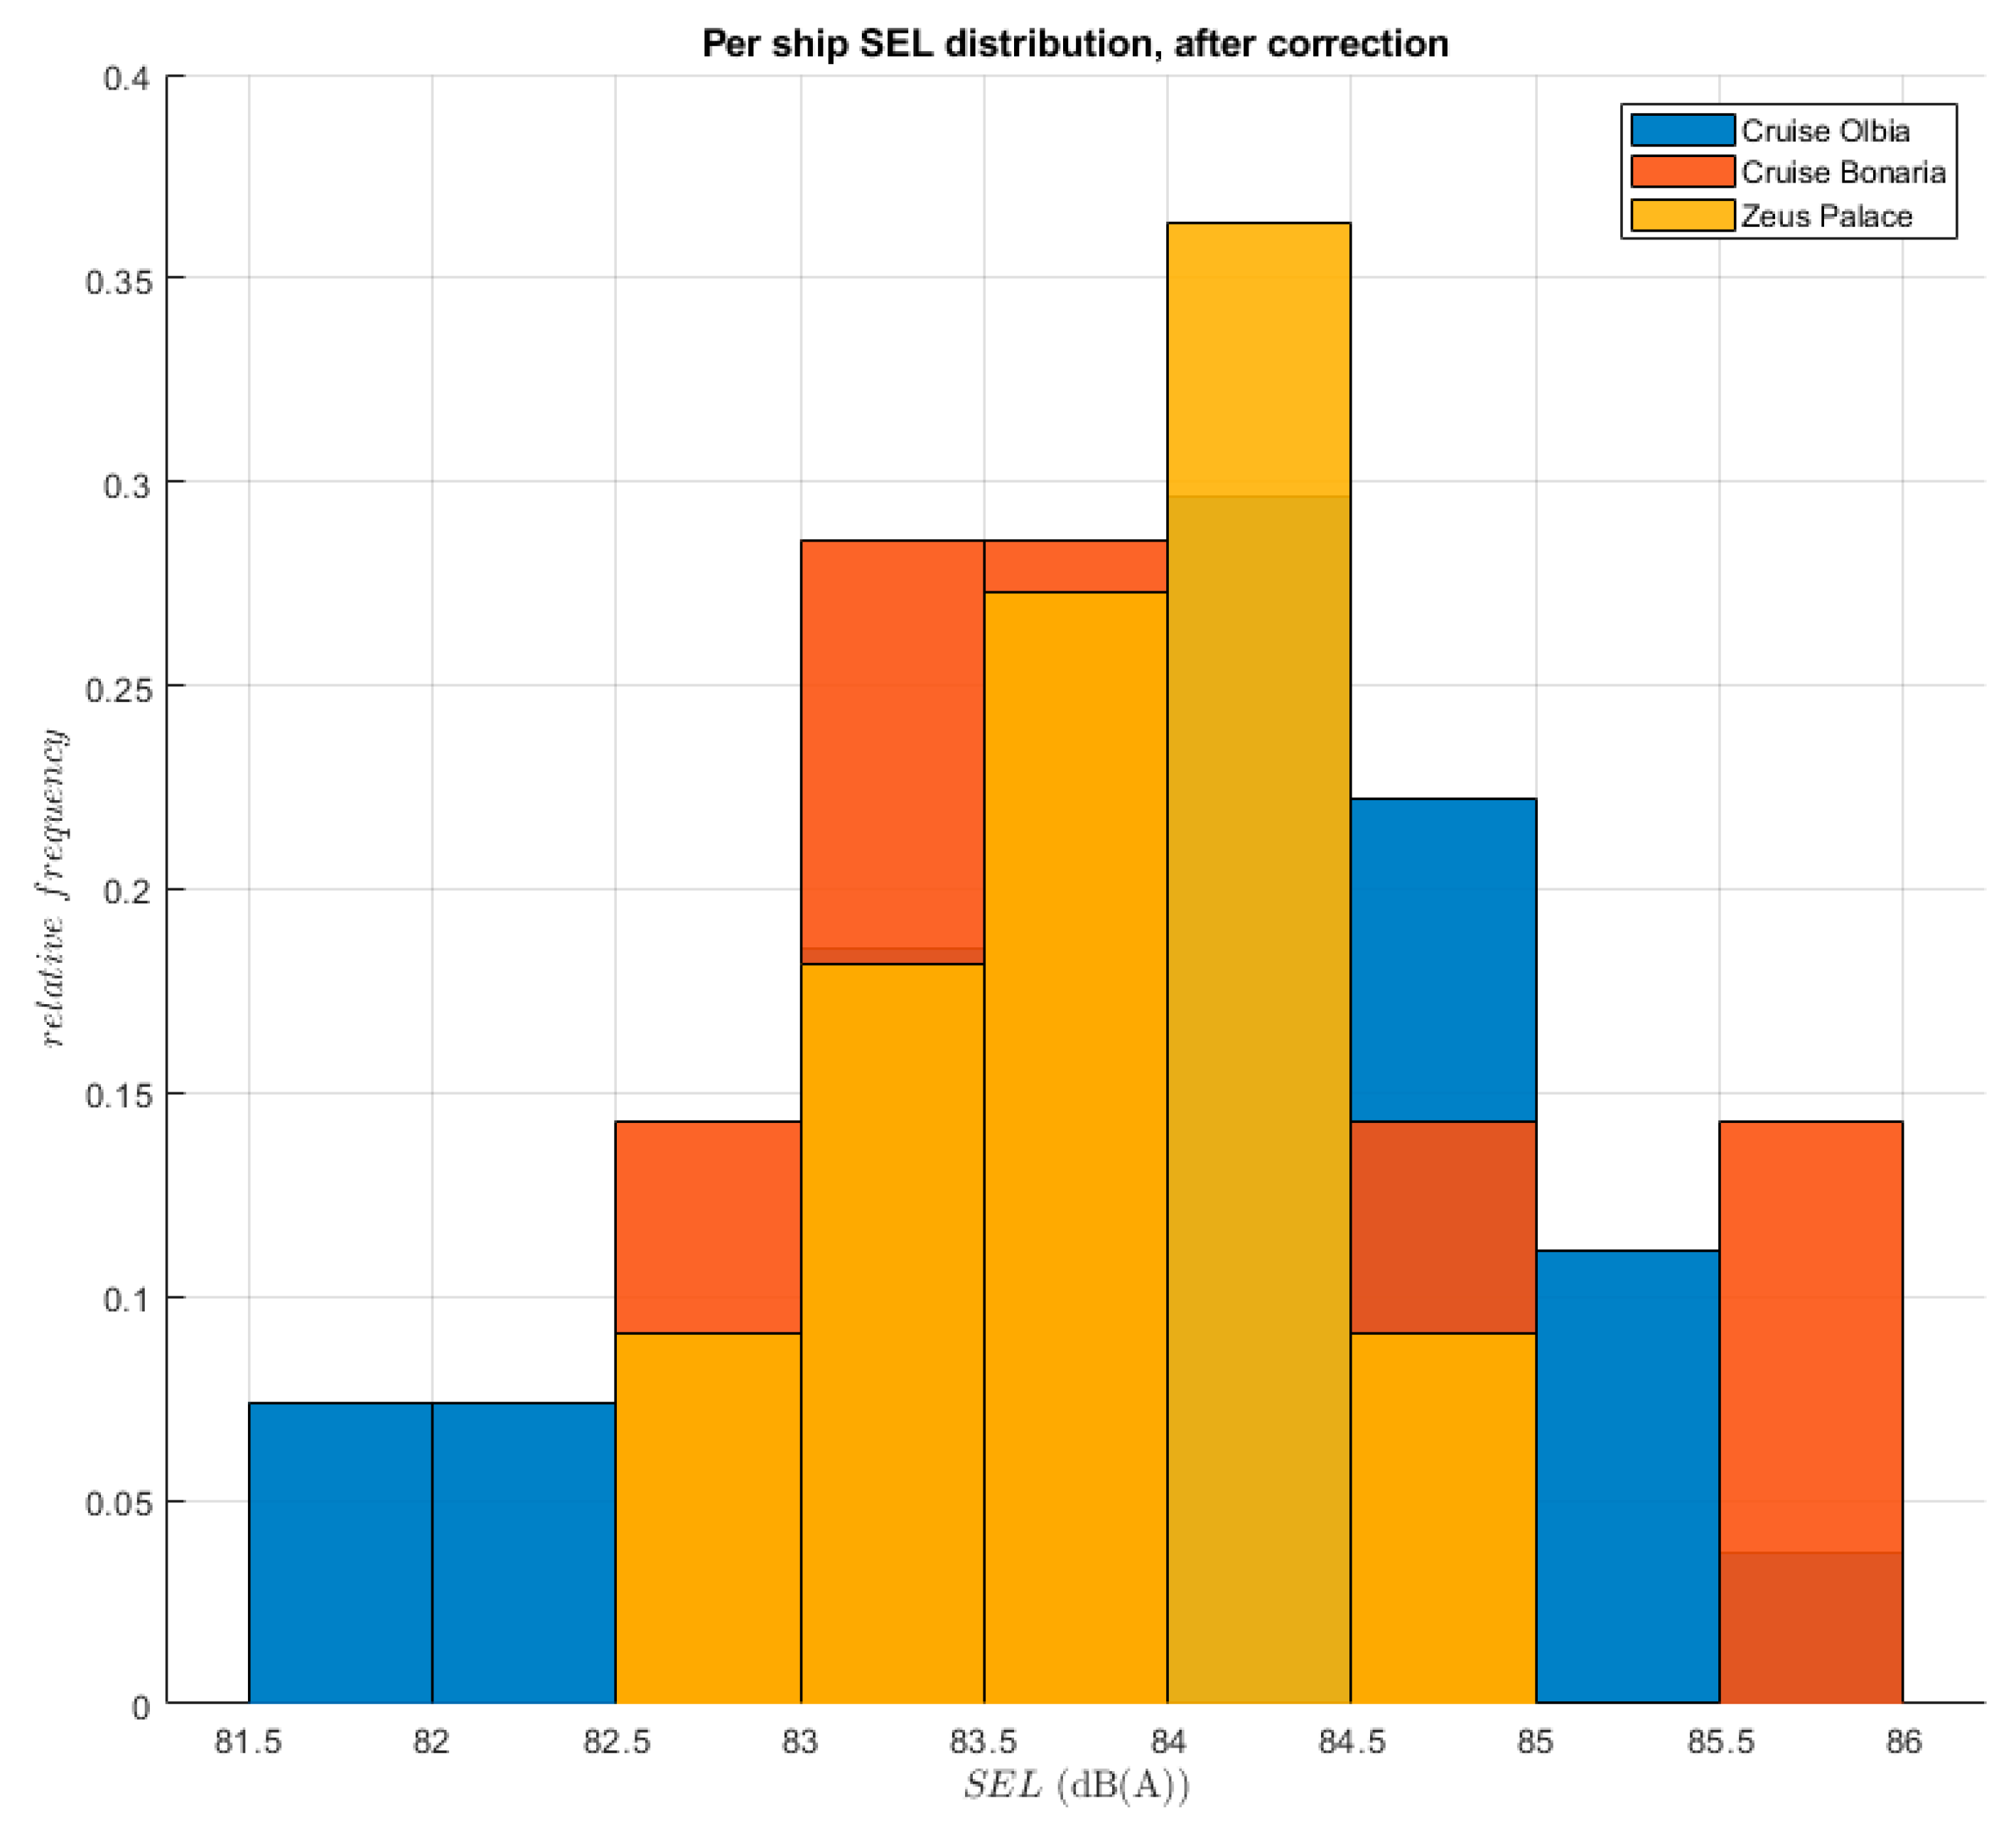
Figure 9 shows the same analysis reported in Figure 7, but taking into account distance correction. The distributions of the three different ships are almost overlapping. A more quantitative evaluation, shown in Table 3, shows the mean values and standard deviations of the SEL of the three vessels before and after correction.
The three vessels’ SEL averages are very similar after distance correction, resulting in a noticeable reduction of the total standard deviation. This is also due to the reduction of the individual standard deviation of the three ships.
In terms of the reconstructed LW, a summary of the old (Figure 2) and new (Figure 6) values for the ferry categories are shown in Table 4. The broadband sound power shows a 0.5 dB reduction of standard deviation, going from 2.0 at 1.5 dB, as well as a better estimate of the average.
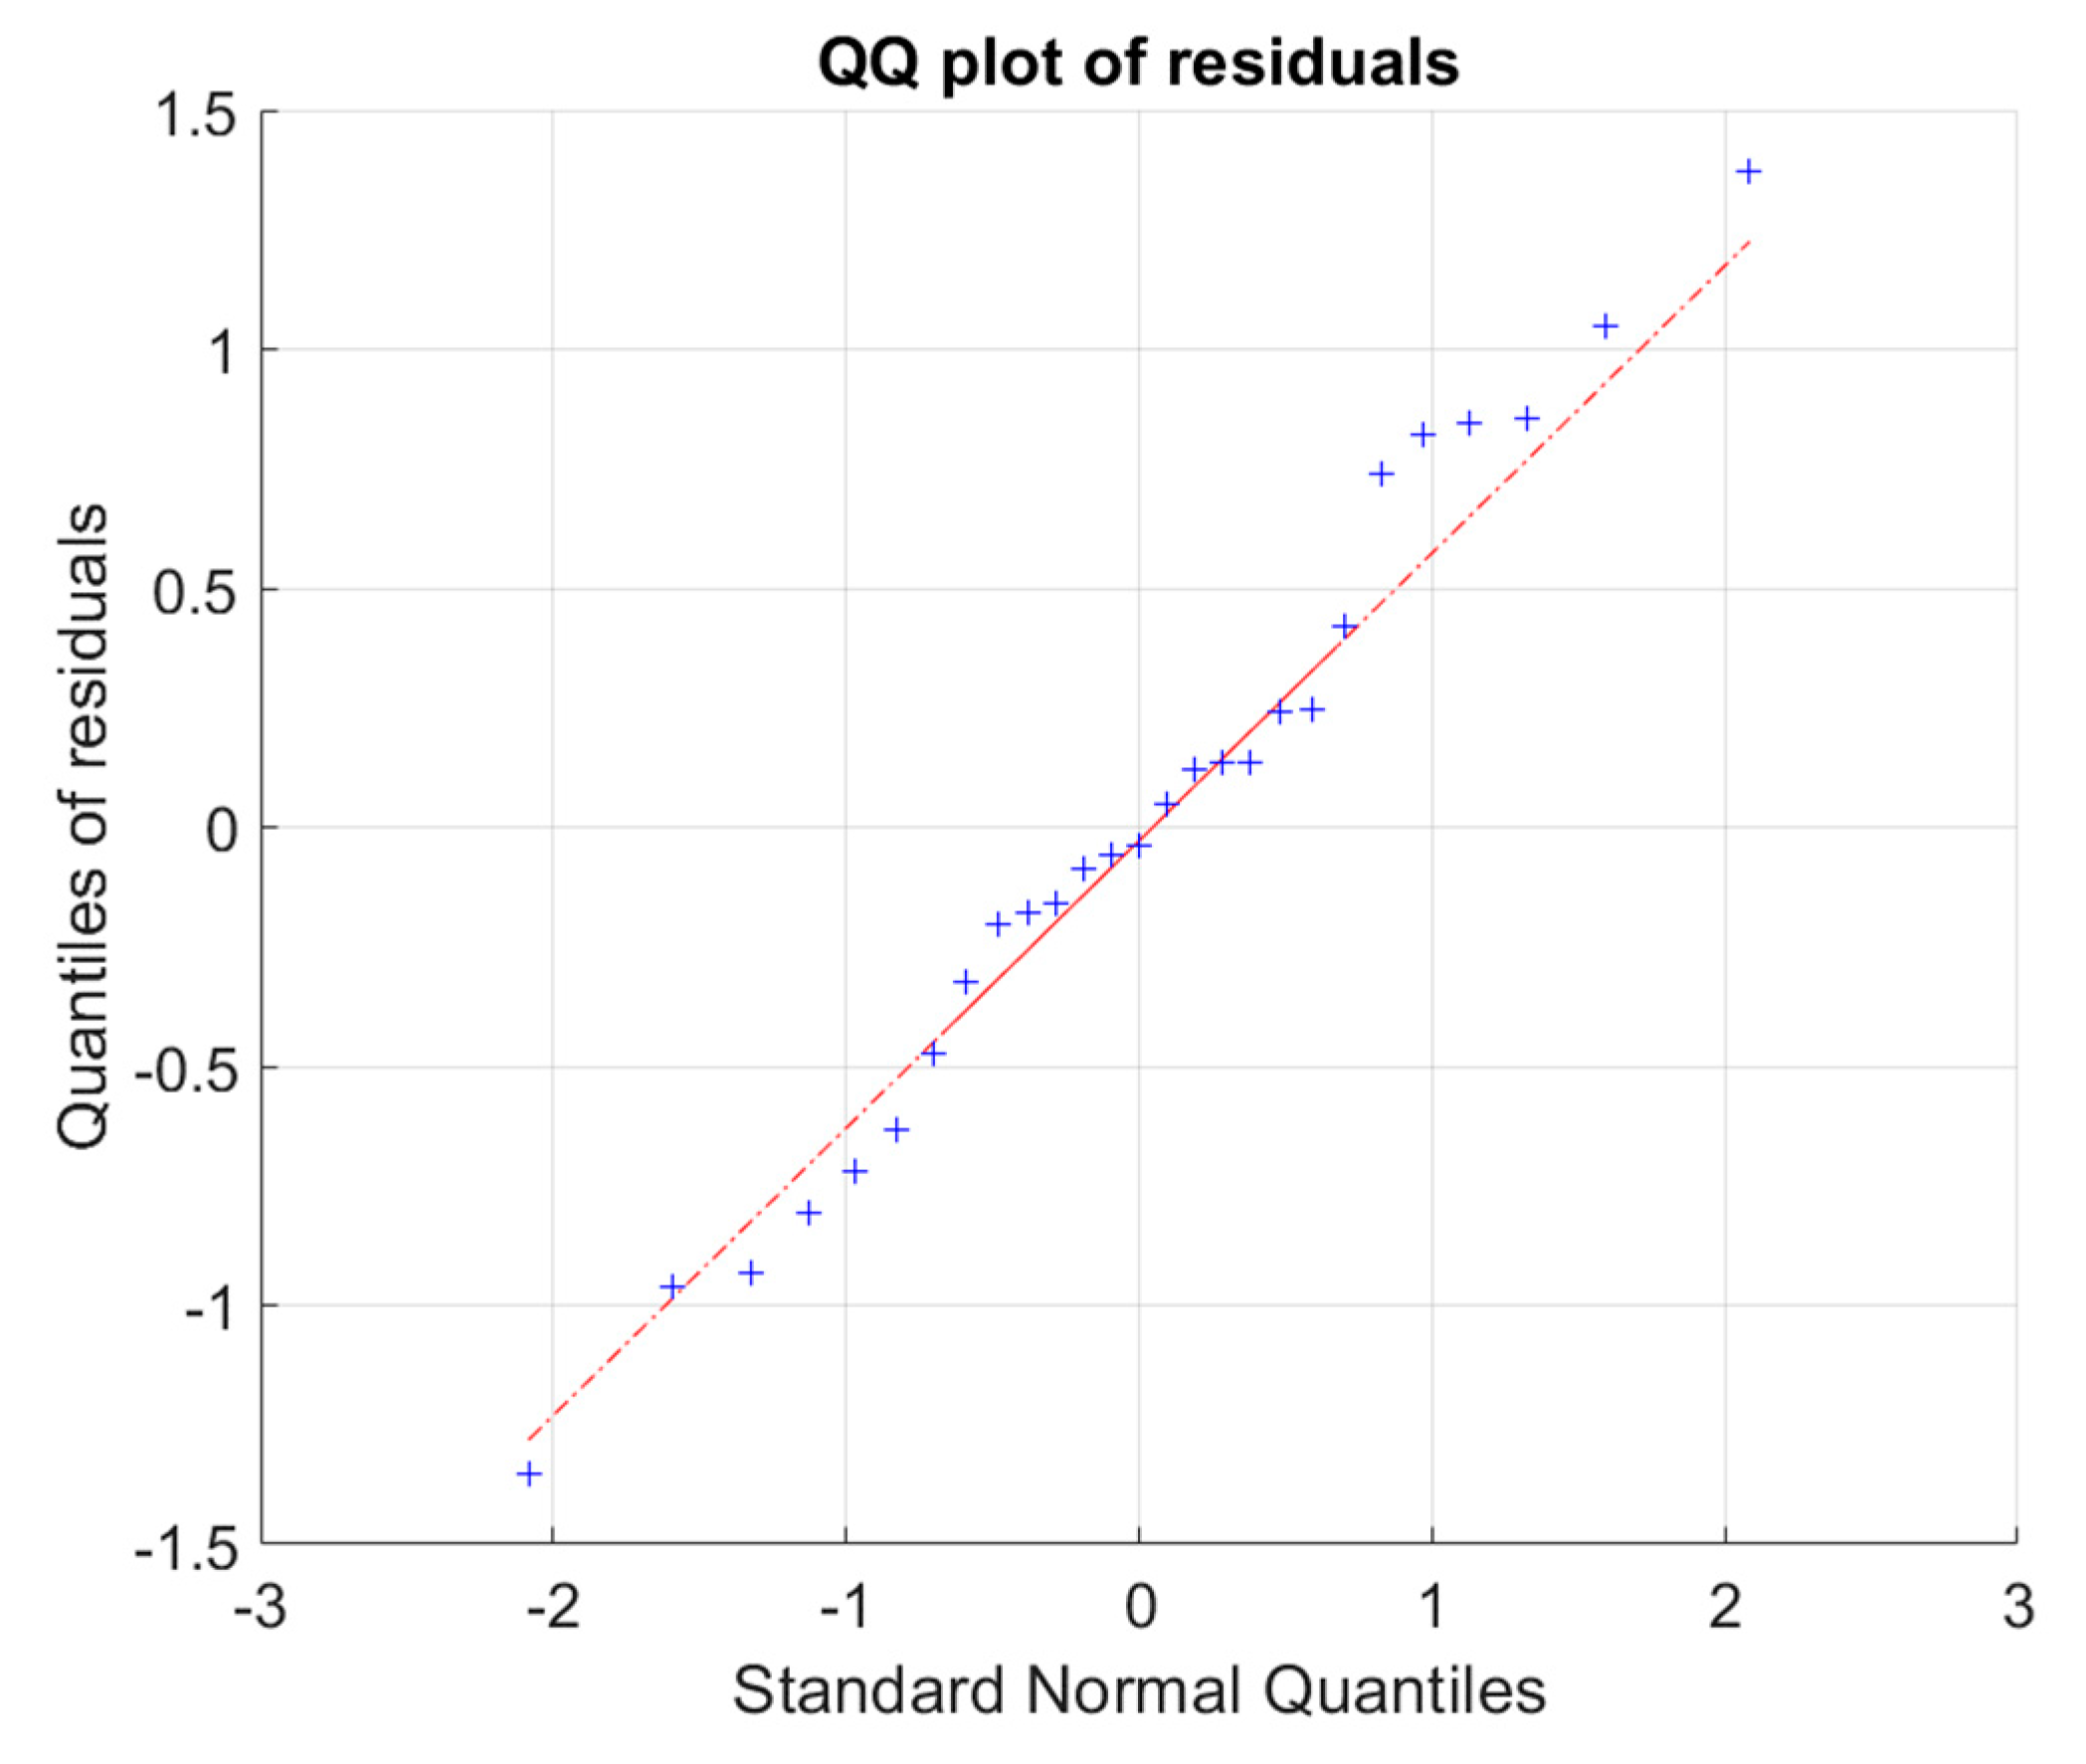
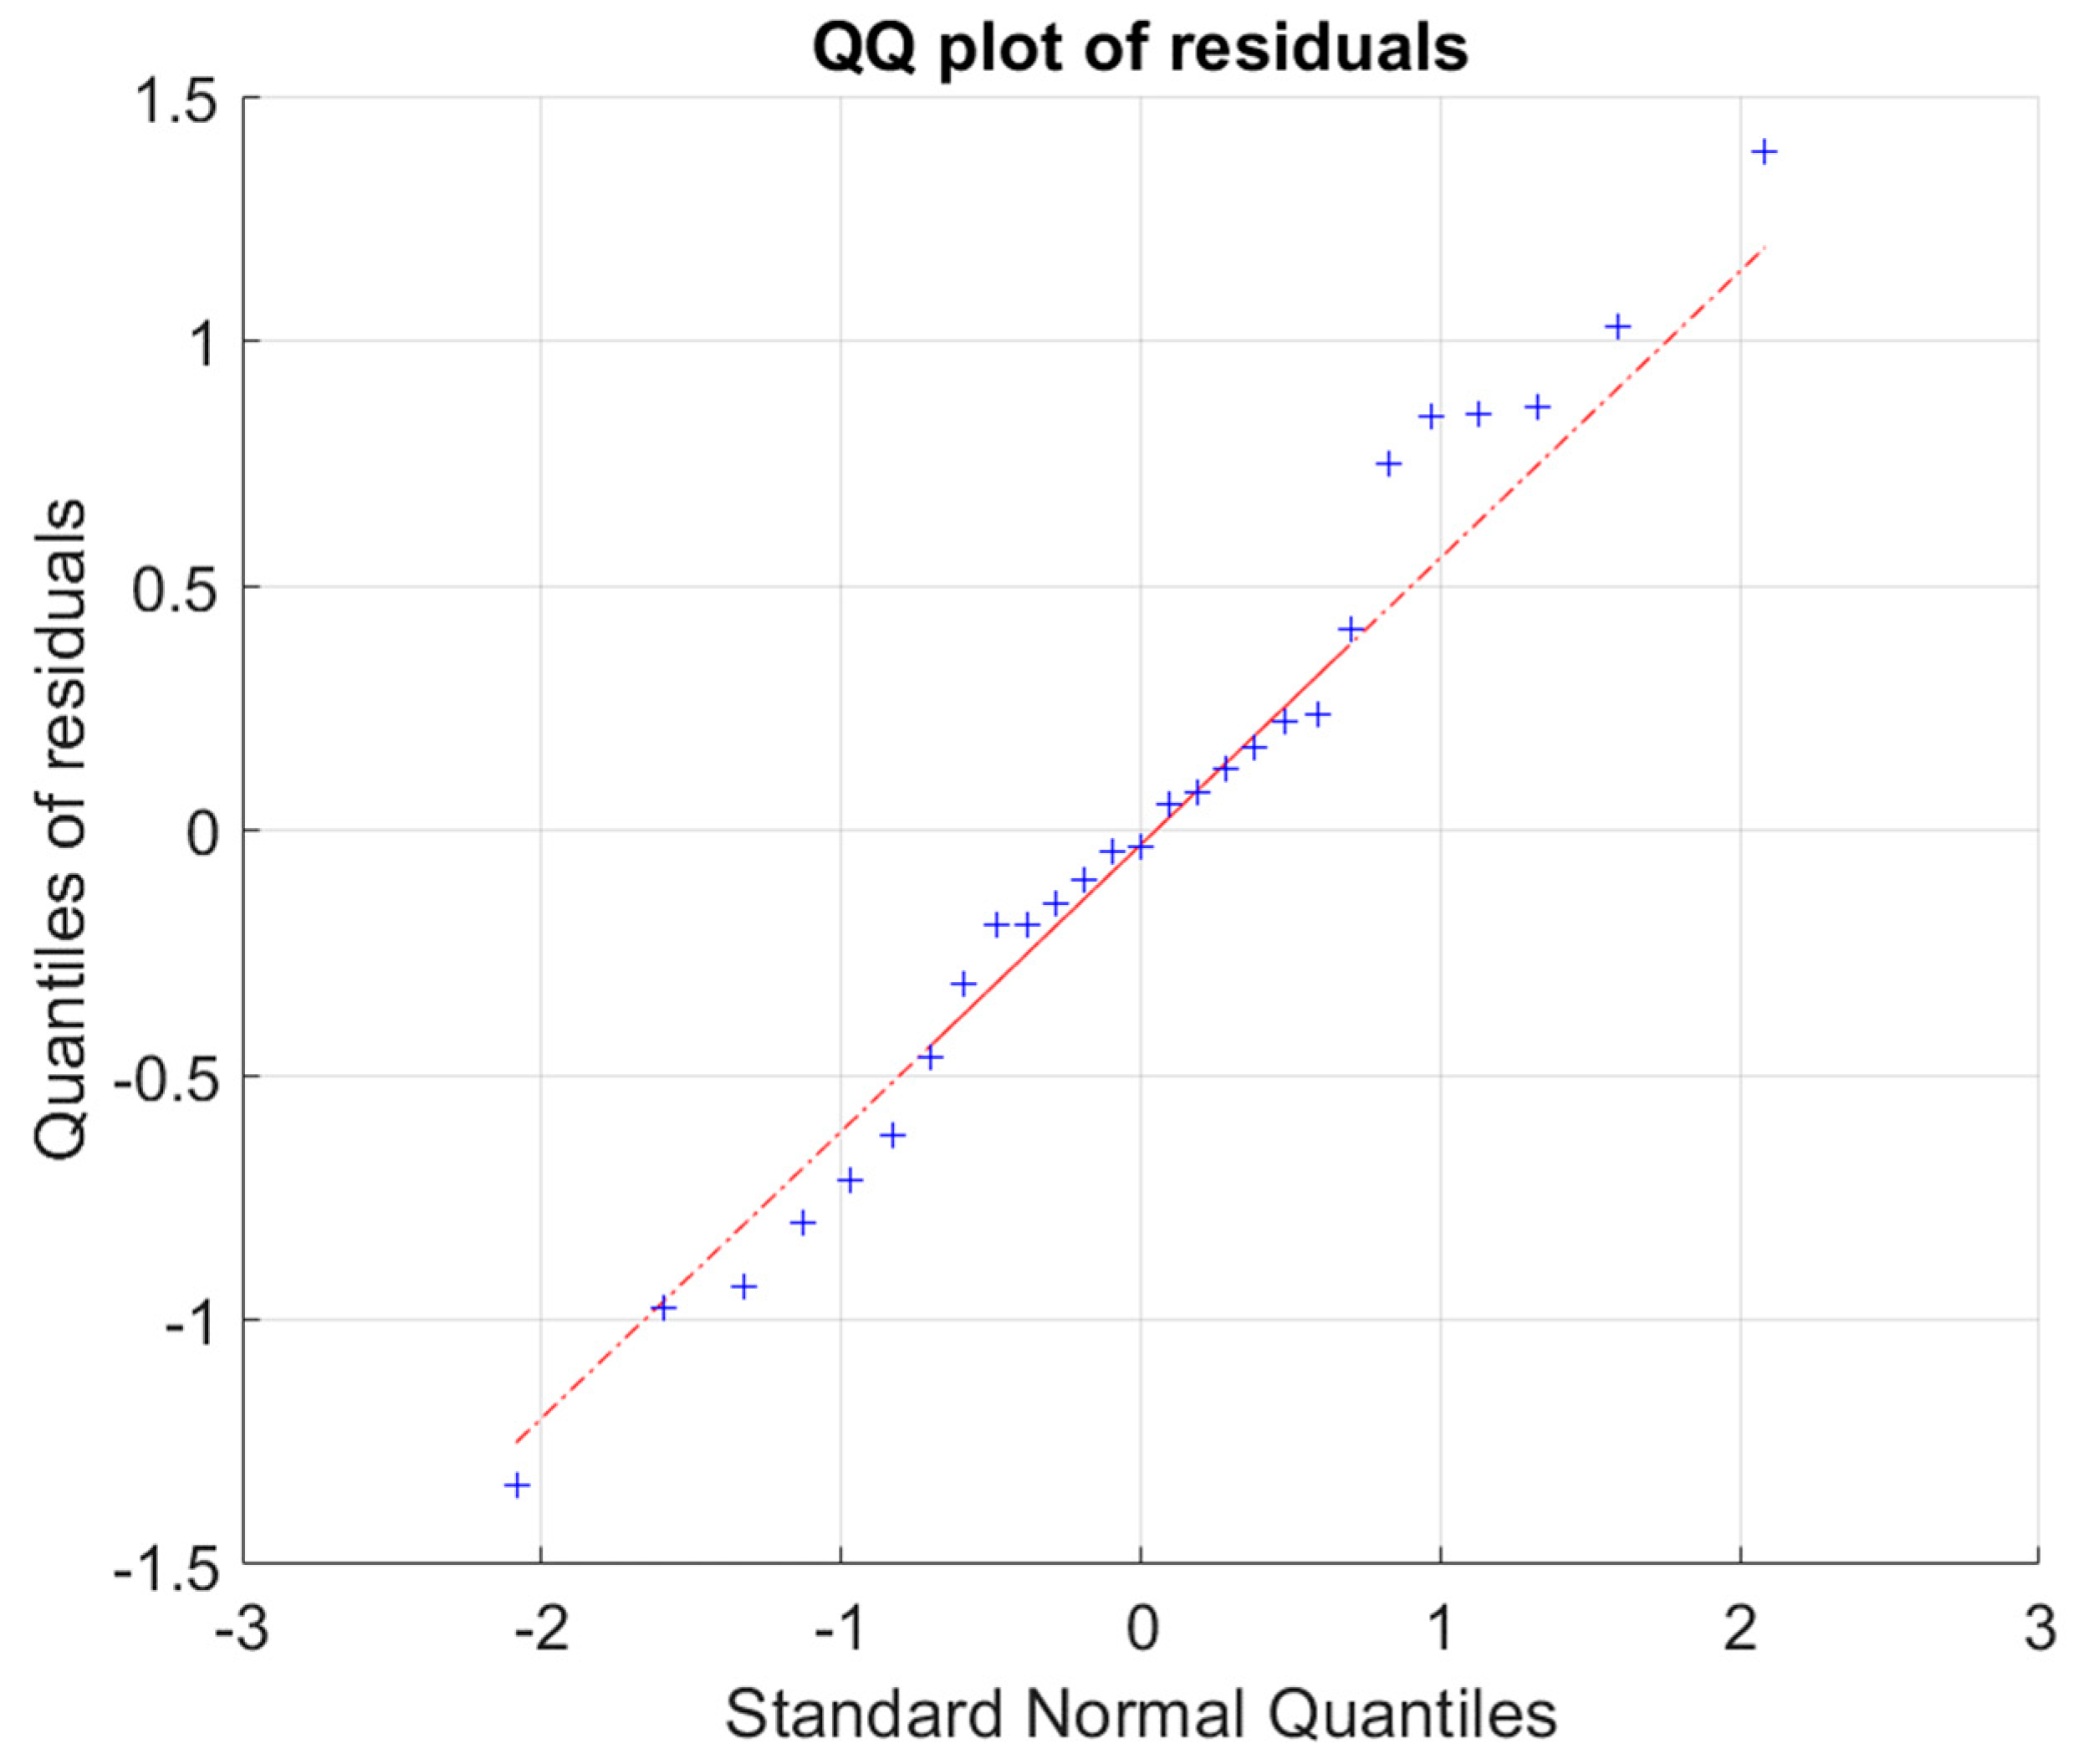
The residuals used for t-testing are normal. The normality of the distribution of residuals was checked using the Shapiro–Wilk test. The Shapiro–Wilk p-value obtained for the first regression (i.e., including the draught of ships) was 0.8816, while the Shapiro–Wilk p-value for the second regression, which excluded draught, was 0.9056. Since the p-values are greater than 0.05, then the null hypothesis (that the residuals come from a normally distributed population) cannot be rejected at 95% of confidence interval. In order to further check the normality of residuals, QQ plots were also used. In both cases, the plots produce an approximately straight line, suggesting that the residuals follow a normal distribution, as reported in Figure 10 and Figure 11.
4. Discussion and Conclusions
Moving ships have been studied as noise sources only in the most recent years, in which more attention to port noise has grown. Indeed, residential areas around ports may suffer from unwanted noise. A proper evaluation of citizens’ exposure requires a detailed noise mapping program with a thorough description of the inputs. In this respect, broadband and one-third-octave-band sound power levels of different ship categories were characterized in a previous work [40].
The present paper started by building a database derived from a month’s worth of continuous sound level measurements along the quay of the industrial port canal of the city of Livorno, Italy, combined with video recordings and information from the telematic system portal ShipInfo. Video recordings were used to calculate the ships’ speeds and the distance of their transits from the microphone. The values of LAeq, SEL, Lmax, linear spectrum, and draught of each transit were measured to complete the set of available data.
Even though individual transits of the same ship typically produce comparable noise levels, the present work aimed at minimizing the uncertainties associated with ferries’ noise emissions while investigating the effects of draught, speed, and distance.
A multiple regression analysis was applied to a data set of three different ferries in order to evaluate correlations among the independent variables.
The first significant outcome is that the ship draught is not a relevant parameter for noise assessment. This result was verified for draught ranges between 6.2 and 7.2 m and was derived using ships moving at port speeds. Draught could, however, still be an influencing parameter for larger ships, such as container ships; a future work will investigate them and study the effect of draught on noise levels again.
On the other hand, transit distance and ship speed influence the measured noise levels. The former does not directly affect the sound power of a ship, but influences noise measured at the receiving point due to the geometrical attenuation.
For this reason, a linear regression was carried out to correct the influence of distance on noise level, and thus provided an estimation of the sound power level.
Using distance-corrected data and excluding draught from the analysis, the dependence of the noise produced on the ships’ speed was derived. This relationship was empirically verified only for the measured speeds (4.8 to 9.3 kn, 2.5–4.8 m/s), which, however, are usual speeds in a port environment. Certainly, further studies would be needed for movements in open sea, but their interest would also be inferior as far as assessing noise pollution in anthropized environments, since human settlements would be more distant. Unlike the distance correction, the obtained speed relation could hide dependencies on neglected parameters, which would certainly require specific and more in-depth studies.
For example, the inputs available in this paper do not permit one to discern if a change in speed corresponds to changes in engine thrust or acceleration. However, the information obtained can be important in the planning and management phase of the port environment, as well as in requests for input for acoustic mapping. In fact, the study carried out here confirms that the exact knowledge of the average speed of ships can lead to a more precise noise modeling. This will also align ship noise standards to the same requirements of road and rail noise mapping, which demand the flow and speed of vehicles. The present work shows that not having the average speed data as an input in port noise mapping will result in a maximum variation of the level not greater than ±1 dB(A) compared to the average value. A future development of this work will concern boats, which usually show a wider speed range. These vessels are, in fact, neglected, but their contribution to overall noise can be significant in touristic ports.
The Cruise Olbia and Zeus Palace showed a similar emission average compared to the Cruise Bonaria, which showed a lower average. This could suggest that the variability of the ferry category is due to the different sound power levels of the different ship models included in the same category; this could be one of the causes of the higher variance found in the previous work [40]. In this study, the analyses were carried out individually on the three different ferry models and not on the category as a whole. Distance data showed that the Cruise Bonaria usually passed farther away from the microphone; however, the recorded noise levels were pretty similar to the others.
The distance correction allowed the calculation of the sound power with an improved accuracy compared to the previous work [40]; the LW of ferries in the port of Livorno was estimated to be 83.1 ± 1.5 dB(A), while the previous work estimated a sound power level of 82.7 ± 2.0 dB(A). Not only was the standard deviation of noise emitted reduced by 0.5 dB (A) compared to the previous work [40], but the ships’ flow was also positioned at the correct average distance, thus also improving the estimation of the average noise emission. Furthermore, the right placement of a source is also important in the acoustic mapping phase for a correct evaluation of the propagation of noise at a distance. However, the lack of information on the height of the sources remains, whose contribution was estimated to add an uncertainty of about 3 m to the geometric distance (2% of the average transit distance). This value falls within the uncertainty of the distance estimate, and is thus not a determining factor in the reconstruction of the source’s sound power in this work, but it could become more important in the propagation of noise levels at a distance, especially when high obstacles are present.
Frequencies from 500 Hz to 2.5 kHz showed the highest correlation with the ship speed, while the other bands did not show relevant dependence on speed, as they tended to remain constant for each passage. Indeed, sources such as cooling fans are not expected to vary with ship speed, and they could represent a significant contribution at very high frequencies (>2.5 kHz). Low frequencies (<500 Hz), on the other hand, could be induced by structural noise emitted through the ship’s hull, and no speed dependency is expected.
This work is a starting point for further analysis to be carried out in the future, especially taking into account other techniques, such as the beam-forming method and the use of an acoustic camera that can reach low frequency ranges. If properly combined with noise measurements performed with class I sound level meters, these measurements could provide invaluable help in detecting, locating, and characterizing the sources of a ship in a more detailed way.
Author Contributions
Conceptualization, L.F.; methodology, L.F. and G.L.; investigation, L.F., M.N. and M.B.; resources, L.F., M.N. and M.B.; formal analysis, M.N., M.B. and L.T.; data curation, M.N. and M.B.; validation, L.T.; writing—original draft preparation, L.F.; writing—review and editing, L.T., G.L. and F.F.; supervision, G.L. and F.F.; project administration, F.F. and G.L.; funding acquisition, G.L. and F.F. All authors have read and agreed to the published version of the manuscript.
Funding
This work was supported by the funding from the European Union’s INTERREG IT-FR “Maritime” Program (RUMBLE: G36H17000000007, MON ACUMEN: B52H17000770003).
Acknowledgments
The authors thank the Port Authority of Livorno for allowing the measurements and for the video recordings. The authors also thank Alessandro Del Pizzo and Sandra Hill for their linguistic support and proofreading of the article.
Conflicts of Interest
The authors declare no conflict of interest.
References
- Naletina, D.; Perkov, E. The economic importance of maritime shipping with special reference on Croatia. Economic and Social Development. In Proceedings of the 19th International Scientific Conference on Economic and Social Development, Melbourne, Australia, 9–10 February 2017; p. 248. [Google Scholar]
- United Nations. Review of Maritime Transport-2019; United Nations Conf. Trade Develop: New York, NY, USA, 2019. [Google Scholar]
- Murphy, E.; King, E.A. An assessment of residential exposure to environmental noise at a shipping port. Environ. Int. 2014, 63, 207–215. [Google Scholar] [CrossRef] [PubMed] [Green Version]
- Paschalidou, A.K.; Kassomenos, P.; Chonianaki, F. Strategic Noise Maps and Action Plans for the reduction of population exposure in a Mediterranean port city. Sci. Total Environ. 2019, 654, 144–153. [Google Scholar] [CrossRef]
- Licitra, G.; Bolognese, M.; Palazzuoli, D.; Fredianelli, L.; Fidecaro, F. Port noise impact and citizens’ complaints evaluation in RUMBLE and MON ACUMEN INTERREG projects. In Proceedings of the 26th International Congress on Sound and Vibration, Montreal, QC, Canada, 7–11 July 2019. [Google Scholar]
- Guski, R.; Schreckenberg, D.; Schuemer, R. WHO environmental noise guidelines for the European region: A systematic review on environmental noise and annoyance. Int. J. Environ. Res. Public Health 2017, 14, 1539. [Google Scholar] [CrossRef] [PubMed] [Green Version]
- Beutel, M.E.; Brähler, E.; Ernst, M.; Klein, E.; Reiner, I.; Wiltink, J.; Hahad, O. Noise annoyance predicts symptoms of depression, anxiety and sleep disturbance 5 years later. Findings from the Gutenberg Health Study. Eur. J. Public Health 2020, 30, 516–521. [Google Scholar] [CrossRef] [PubMed]
- Lechner, C.; Schnaiter, D.; Bose-O’Reilly, S. Combined Effects of Aircraft, Rail, and Road Traffic Noise on Total Noise Annoyance—A Cross-Sectional Study in Innsbruck. Int. J. Environ. Res. Public Health 2019, 16, 3504. [Google Scholar] [CrossRef] [Green Version]
- Licitra, G.; Fredianelli, L.; Petri, D.; Vigotti, M.A. Annoyance evaluation due to overall railway noise and vibration in Pisa urban areas. Sci. Total Environ. 2016, 568, 1315–1325. [Google Scholar] [CrossRef] [PubMed]
- Erickson, L.C.; Newman, R.S. Influences of background noise on infants and children. Curr. Dir. Psychol. Sci. 2017, 26, 451–457. [Google Scholar] [CrossRef] [PubMed]
- Minichilli, F.; Gorini, F.; Ascari, E.; Bianchi, F.; Coi, A.; Fredianelli, L.; Cori, L. Annoyance judgment and measurements of environmental noise: A focus on Italian secondary schools. Int. J. Environ. Res. Public Health 2018, 15, 208. [Google Scholar] [CrossRef] [Green Version]
- Steven, S.; Frenis, K.; Kroeller-Schoen, S.; Kalinovic, S.; Helmstaedter, J.; Kvandova, M.; Munzel, T.; Oelze, M.; Daiber, A. P4478 Noise pollution exacerbates the development of arterial hypertension via additive oxidative stress and impairment of NO signaling. Eur. Heart J. 2019, 40, 745–873. [Google Scholar] [CrossRef]
- van Kamp, I.; Simon, S.; Notley, H.; Baliatsas, C.; van Kempen, E. Evidence Relating to Environmental Noise Exposure and Annoyance, Sleep Disturbance, Cardio-Vascular and Metabolic Health Outcomes in the Context of IGCB (N): A Scoping Review of New Evidence. Int. J. Environ. Res. Public Health 2020, 17, 3016. [Google Scholar] [CrossRef]
- Recio, A.; Linares, C.; Banegas, J.R.; Díaz, J. Road traffic noise effects on cardiovascular, respiratory, and metabolic health: An integrative model of biological mechanisms. Environ. Res. 2016, 146, 359–370. [Google Scholar] [CrossRef]
- Directive, E.U. Directive 2002/49/EC of the European parliament and the Council of 25 June 2002 relating to the assessment and management of environmental noise. Off. J. Eur. Communities L 2002, 189, 2002. [Google Scholar]
- Oltean-Dumbrava, C.; Watts, G.; Miah, A. Towards a more sustainable surface transport infrastructure: A case study of applying multi criteria analysis techniques to assess the sustainability of transport noise reducing devices. J. Clean. Prod. 2016, 112, 2922–2934. [Google Scholar] [CrossRef]
- Kaewunruen, S.; Martin, V. Life cycle assessment of railway ground-Borne noise and vibration mitigation methods using geosynthetics, metamaterials and ground improvement. Sustainability 2018, 10, 3753. [Google Scholar] [CrossRef] [Green Version]
- Tian, Y.; Wan, L.; Ye, B.; Yin, R.; Xing, D. Optimization Method for Reducing the Air Pollutant Emission and Aviation Noise of Arrival in Terminal Area. Sustainability 2019, 11, 4715. [Google Scholar] [CrossRef] [Green Version]
- Danihelová, A.; Němec, M.; Gergeľ, T.; Gejdoš, M.; Gordanová, J.; Sčensný, P. Usage of Recycled Technical Textiles as Thermal Insulation and an Acoustic Absorber. Sustainability 2019, 11, 2968. [Google Scholar] [CrossRef] [Green Version]
- Praticò, F.G.; Fedele, R.; Vizzari, D. Significance and reliability of absorption spectra of quiet pavements. Constr. Build. Mater. 2017, 140, 274–281. [Google Scholar] [CrossRef]
- Herramienta Automática de Diagnóstico Ambiental (Automatic Tool for Environmental Diagnosis), LIFE02 ENV/E/000274; Environment-LIFE: Brussels, Belgium, 2005.
- Eco.Port Project (cod. 41). EU Co-Financed Project through the European Regional Development Fund (ERDF) in the Framework of the Adriatic New Neighbourhood Program INTER-REG/CARDS-PHARE 2000–2006. Available online: https://www.port.venice.it/it/progetto-eco-port.html (accessed on 1 July 2020). (In Italian).
- NoMEPorts 2008. Noise Management in European Ports, LIFE05 ENV/NL/000018, Good Practice Guide on Port Area Noise Mapping and Management. Technical Annex; Environment-LIFE: Brussels, Belgium, 2008. [Google Scholar]
- SIMPYC 2008. Sistema de Integración Medioambiental de Puertos y Ciudades (Environmental integration for ports and cities), LIFE04 ENV/ES/000216; Environment-LIFE: Brussels, Belgium, 2008.
- EcoPorts 2011. EcoPorts Project, Information Exchange and Impact Assessment for Enhanced Environmental-Conscious Operations in European Ports and Terminals, FP5. Available online: http://cordis.europa.eu/project/rcn/87079_en.html (accessed on 1 July 2020).
- Schenone, C.; Pittaluga, I.; Borelli, D.; Kamali, W.; El Moghrabi, Y. The impact of environmental noise generated from ports: Outcome of MESP project. Noise Mapp. 2016, 3. [Google Scholar] [CrossRef] [Green Version]
- Alsina-Pagès, R.M.; Socor, J.C.; Bergadà, P. The impact of man-made noise on the passenger transport stations of Port of Barcelona. In INTER-NOISE and NOISE-CON Congress and Conference Proceedings; Institute of Noise Control Engineering: Reston, VA, USA, 2019; Volume 259, No. 3, pp. 6912–6922. [Google Scholar]
- Santander, A.; Aspuru, I.; Fernandez, P. OPS Master Plan for Spanish Ports Project. Study of potential acoustic benefits of on-Shore power supply at berth. In Proceedings of the Euronoise 2018, Heraklion-Crete, Greece, 27–31 May 2018. [Google Scholar]
- Badino, A.; Borelli, D.; Gaggero, T.; Rizzuto, E.; Schenone, C. Acoustical impact of the ship source. In Proceedings of the 21st International Congress on Sound and Vibration, Beijing, China, 13–17 July 2014; pp. 13–17. [Google Scholar]
- Badino, A.; Borelli, D.; Gaggero, T.; Rizzuto, E.; Schenone, C. Airborne noise emissions from ships: Experimental characterization of the source and propagation over land. Appl. Acoust. 2016, 104, 158–171. [Google Scholar] [CrossRef]
- Badino, A.; Borelli, D.; Gaggero, T.; Rizzuto, E.; Schenone, C. Noise emitted from ships: Impact inside and outside the vessels. Procedia Soc. Behav. Sci. 2012, 48, 868–879. [Google Scholar] [CrossRef] [Green Version]
- Witte, J. Noise from moored ships. In INTER-NOISE and NOISE-CON Congress and Conference Proceedings; Institute of Noise Control Engineering: Reston, VA, USA, 2010; Volume 2010, pp. 3202–3211. [Google Scholar]
- Di Bella, A.; Tombolato, A.; Cordeddu, S.; Zanotto, E.; Barbieri, M. In situ characterization and noise mapping of ships moored in the Port of Venice. J. Acoust. Soc. Am. 2008, 123, 3262. [Google Scholar] [CrossRef]
- Neptunes Project. Available online: https://www.neptunes.pro/ (accessed on 1 July 2020).
- Schenone, C.; Borelli, D.; Pallavidino, E.; Yousseu, A.; Gaggero, T.; Waffo, E. The Port Noise Analysis and Control in Interreg Italy-France Maritime Programme. In INTER-NOISE and NOISE-CON Congress and Conference Proceedings; Institute of Noise Control Engineering: Reston, VA, USA, 2019; Volume 259, No. 4, pp. 5781–5792. [Google Scholar]
- Bolognese, M.; Fidecaro, F.; Palazzuoli, D.; Licitra, G. Port noise and complaints in the north tyrrhenian sea and framework for remediation. Environments 2020, 7, 17. [Google Scholar] [CrossRef] [Green Version]
- Bernardini, M.; Fredianelli, L.; Fidecaro, F.; Gagliardi, P.; Nastasi, M.; Licitra, G. Noise Assessment of Small Vessels for Action Planning in Canal Cities. Environments 2019, 6, 31. [Google Scholar] [CrossRef] [Green Version]
- Di Bella, A.; Fausti, P.; Francesca, R.; Tombolato, A. Measurement methods for the assessment of noise impact of large vessels. In Proceedings of the 23rd International Congress on Sound & Vibration, Athens, Greece, 10–14 July 2016; pp. 1–7. [Google Scholar]
- Fausti, P.; Santoni, A.; Martello, N.Z.; Guerra, M.C.; Di Bella, A. Evaluation of airborne noise due to navigation and manoeuvring of large vessels. In Proceedings of the 24th International Congress on Sound and Vibration, London, UK, 23–27 July 2017. [Google Scholar]
- Fredianelli, L.; Nastasi, M.; Bernardini, M.; Fidecaro, F.; Licitra, G. Pass-by characterization of noise emitted by different categories of seagoing ships in ports. Sustainability 2020, 12, 1740. [Google Scholar] [CrossRef] [Green Version]
- IEC 61672-1:2013. Electroacoustics–Sound Level Meters–Specifications; IEC: Geneva, Switzerland, 2013. [Google Scholar]
- Borelli, D.; Gaggero, T.; Rizzuto, E.; Schenone, C. Holistic control of ship noise emissions. Noise Mapp. 2016, 3, 107–119. [Google Scholar] [CrossRef]
- ISO/CD 11819-1. Acoustics–Measurement of the Influence of Road Surfaces on Traffic Noise–Part 1: Statistical Pass-By method; ISO: Geneva, Switzerland, 1997. [Google Scholar]
- Licitra, G.; Cerchiai, M.; Teti, L.; Ascari, E.; Bianco, F.; Chetoni, M. Performance assessment of low-noise road surfaces in the Leopoldo project: Comparison and validation of different measurement methods. Coatings 2015, 5, 3–25. [Google Scholar] [CrossRef]
- ISO 1996-2:2010. Acoustics—Description, Measurement and Assessment of Environmental Noise—Part 2: Determination of Environmental Noise Levels; ISO: Geneva, Switzerland, 2010. [Google Scholar]
- ISO 532:1975. Acoustics–Method for Calculating Loudness Level; ISO: Geneva, Switzerland, 1975. [Google Scholar]
- ISO 226:2003. Acoustics–Normal Equal-Loudness-Level Contours; ISO: Geneva, Switzerland, 2003. [Google Scholar]
Figure 1.
Example of a Geographical Information System (GIS) image in the calculation of the mic–ship distance from a video.
Figure 1.
Example of a Geographical Information System (GIS) image in the calculation of the mic–ship distance from a video.

Figure 2.
LW/m and 1/3-octave-band sound power spectrum of ferries, together with uncertainties.

Figure 3.
Multivariate regression of the Cruise Olbia ferry’s pass-by sound exposure level (SEL) with the speed, distance, and draught parameters and with 95% prediction bounds on fit.
Figure 3.
Multivariate regression of the Cruise Olbia ferry’s pass-by sound exposure level (SEL) with the speed, distance, and draught parameters and with 95% prediction bounds on fit.

Figure 4.
Multivariate regression of the Cruise Olbia ferry’s pass-by SEL with the speed and distance parameters and with 95% prediction bounds on fit.
Figure 4.
Multivariate regression of the Cruise Olbia ferry’s pass-by SEL with the speed and distance parameters and with 95% prediction bounds on fit.

Figure 5.
Spectrum variation with ship speed.

Figure 6.
Updated LW/m and 1/3-octave-band sound power spectrum of ferries, together with uncertainties.
Figure 6.
Updated LW/m and 1/3-octave-band sound power spectrum of ferries, together with uncertainties.

Figure 7.
Distribution of the SEL values of transits divided by vessel with raw values.

Figure 8.
Distribution of the transit distance from the microphone by vessel.

Figure 9.
Distribution of the SEL of transits according to vessel with post-correction data.

Figure 10.
QQ plot of the residual considering draught.

Figure 11.
QQ plot of the residual not considering draught.


Table 1.
Results of the fit considering distance, speed, and draught parameters, together with relative errors and statistical parameters.
Table 1.
Results of the fit considering distance, speed, and draught parameters, together with relative errors and statistical parameters.
| Estimate | Standard Error | t Stat | p-Value | |
|---|---|---|---|---|
| Intercept | 83.54 dB(A) | 0.15 dB(A) | 572.0 | 2.91 × 10−49 |
| Distance coefficient | −13.18 dB(A) | 3.51 dB(A) | −3.760 | 0.00102 |
| Speed coefficient | 20.83 dB(A) | 6.03 dB(A) | 3.455 | 0.002153 |
| Draught coefficient | 0.16 dB(A)/m | 1.25 dB(A)/m | 0.129 | 0.898118 |
Table 2.
Results of the fit considering the distance and speed parameters, together with relative errors and statistical parameters.
Table 2.
Results of the fit considering the distance and speed parameters, together with relative errors and statistical parameters.
| Estimate | Standard Error | t Stat | p-Value | |
|---|---|---|---|---|
| Intercept | 83.54 dB(A) | 0.15 dB(A) | 573.0 | 3.70 × 10−51 |
| Distance coefficient | −13.21 dB(A) | 3.48 dB(A) | −3.791 | 0.000893 |
| Speed coefficient | 20.97 dB(A) | 5.78 dB(A) | 3.626 | 0.001347 |
Table 3.
Mean and standard deviation of the SEL values of transits according to vessel with pre- and post-correction data.
Table 3.
Mean and standard deviation of the SEL values of transits according to vessel with pre- and post-correction data.
| SEL Pre-Correction | ||||
| Cruise Olbia (dB(A)) | Cruise Bonaria (dB(A)) | Zeus Palace (dB(A)) | All ferries (dB(A)) | |
| mean | 83.5 | 80.8 | 83.6 | 83.1 |
| std | 1.3 | 1.7 | 0.6 | 1.6 |
| SEL Post-Correction | ||||
| Cruise Olbia (dB(A)) | Cruise Bonaria (dB(A)) | Zeus Palace (dB(A)) | All ferries (dB(A)) | |
| mean | 83.9 | 83.9 | 83.6 | 83.9 |
| std | 1.0 | 1.1 | 0.6 | 0.9 |
Table 4.
Mean and standard deviation of the LW of ferries with pre- and post-correction data.
| LW Ferries | ||
|---|---|---|
| Ferries PRE (dB(A)) | Ferries POST (dB(A)) | |
| mean | 82.7 | 83.1 |
| std | 2.0 | 1.5 |
Publisher’s Note: MDPI stays neutral with regard to jurisdictional claims in published maps and institutional affiliations. |
© 2020 by the authors. Licensee MDPI, Basel, Switzerland. This article is an open access article distributed under the terms and conditions of the Creative Commons Attribution (CC BY) license (http://creativecommons.org/licenses/by/4.0/).
Share and Cite
MDPI and ACS Style
Nastasi, M.; Fredianelli, L.; Bernardini, M.; Teti, L.; Fidecaro, F.; Licitra, G. Parameters Affecting Noise Emitted by Ships Moving in Port Areas. Sustainability 2020, 12, 8742. https://0-doi-org.brum.beds.ac.uk/10.3390/su12208742
AMA Style
Nastasi M, Fredianelli L, Bernardini M, Teti L, Fidecaro F, Licitra G. Parameters Affecting Noise Emitted by Ships Moving in Port Areas. Sustainability. 2020; 12(20):8742. https://0-doi-org.brum.beds.ac.uk/10.3390/su12208742
Chicago/Turabian StyleNastasi, Marco, Luca Fredianelli, Marco Bernardini, Luca Teti, Francesco Fidecaro, and Gaetano Licitra. 2020. "Parameters Affecting Noise Emitted by Ships Moving in Port Areas" Sustainability 12, no. 20: 8742. https://0-doi-org.brum.beds.ac.uk/10.3390/su12208742
Note that from the first issue of 2016, this journal uses article numbers instead of page numbers. See further details here.