The Impact of COVID-19 Pandemic on the Resilience of Sustainable Mobility in Sicily

 ,
,  ,
,  , ,
, , 
Abstract
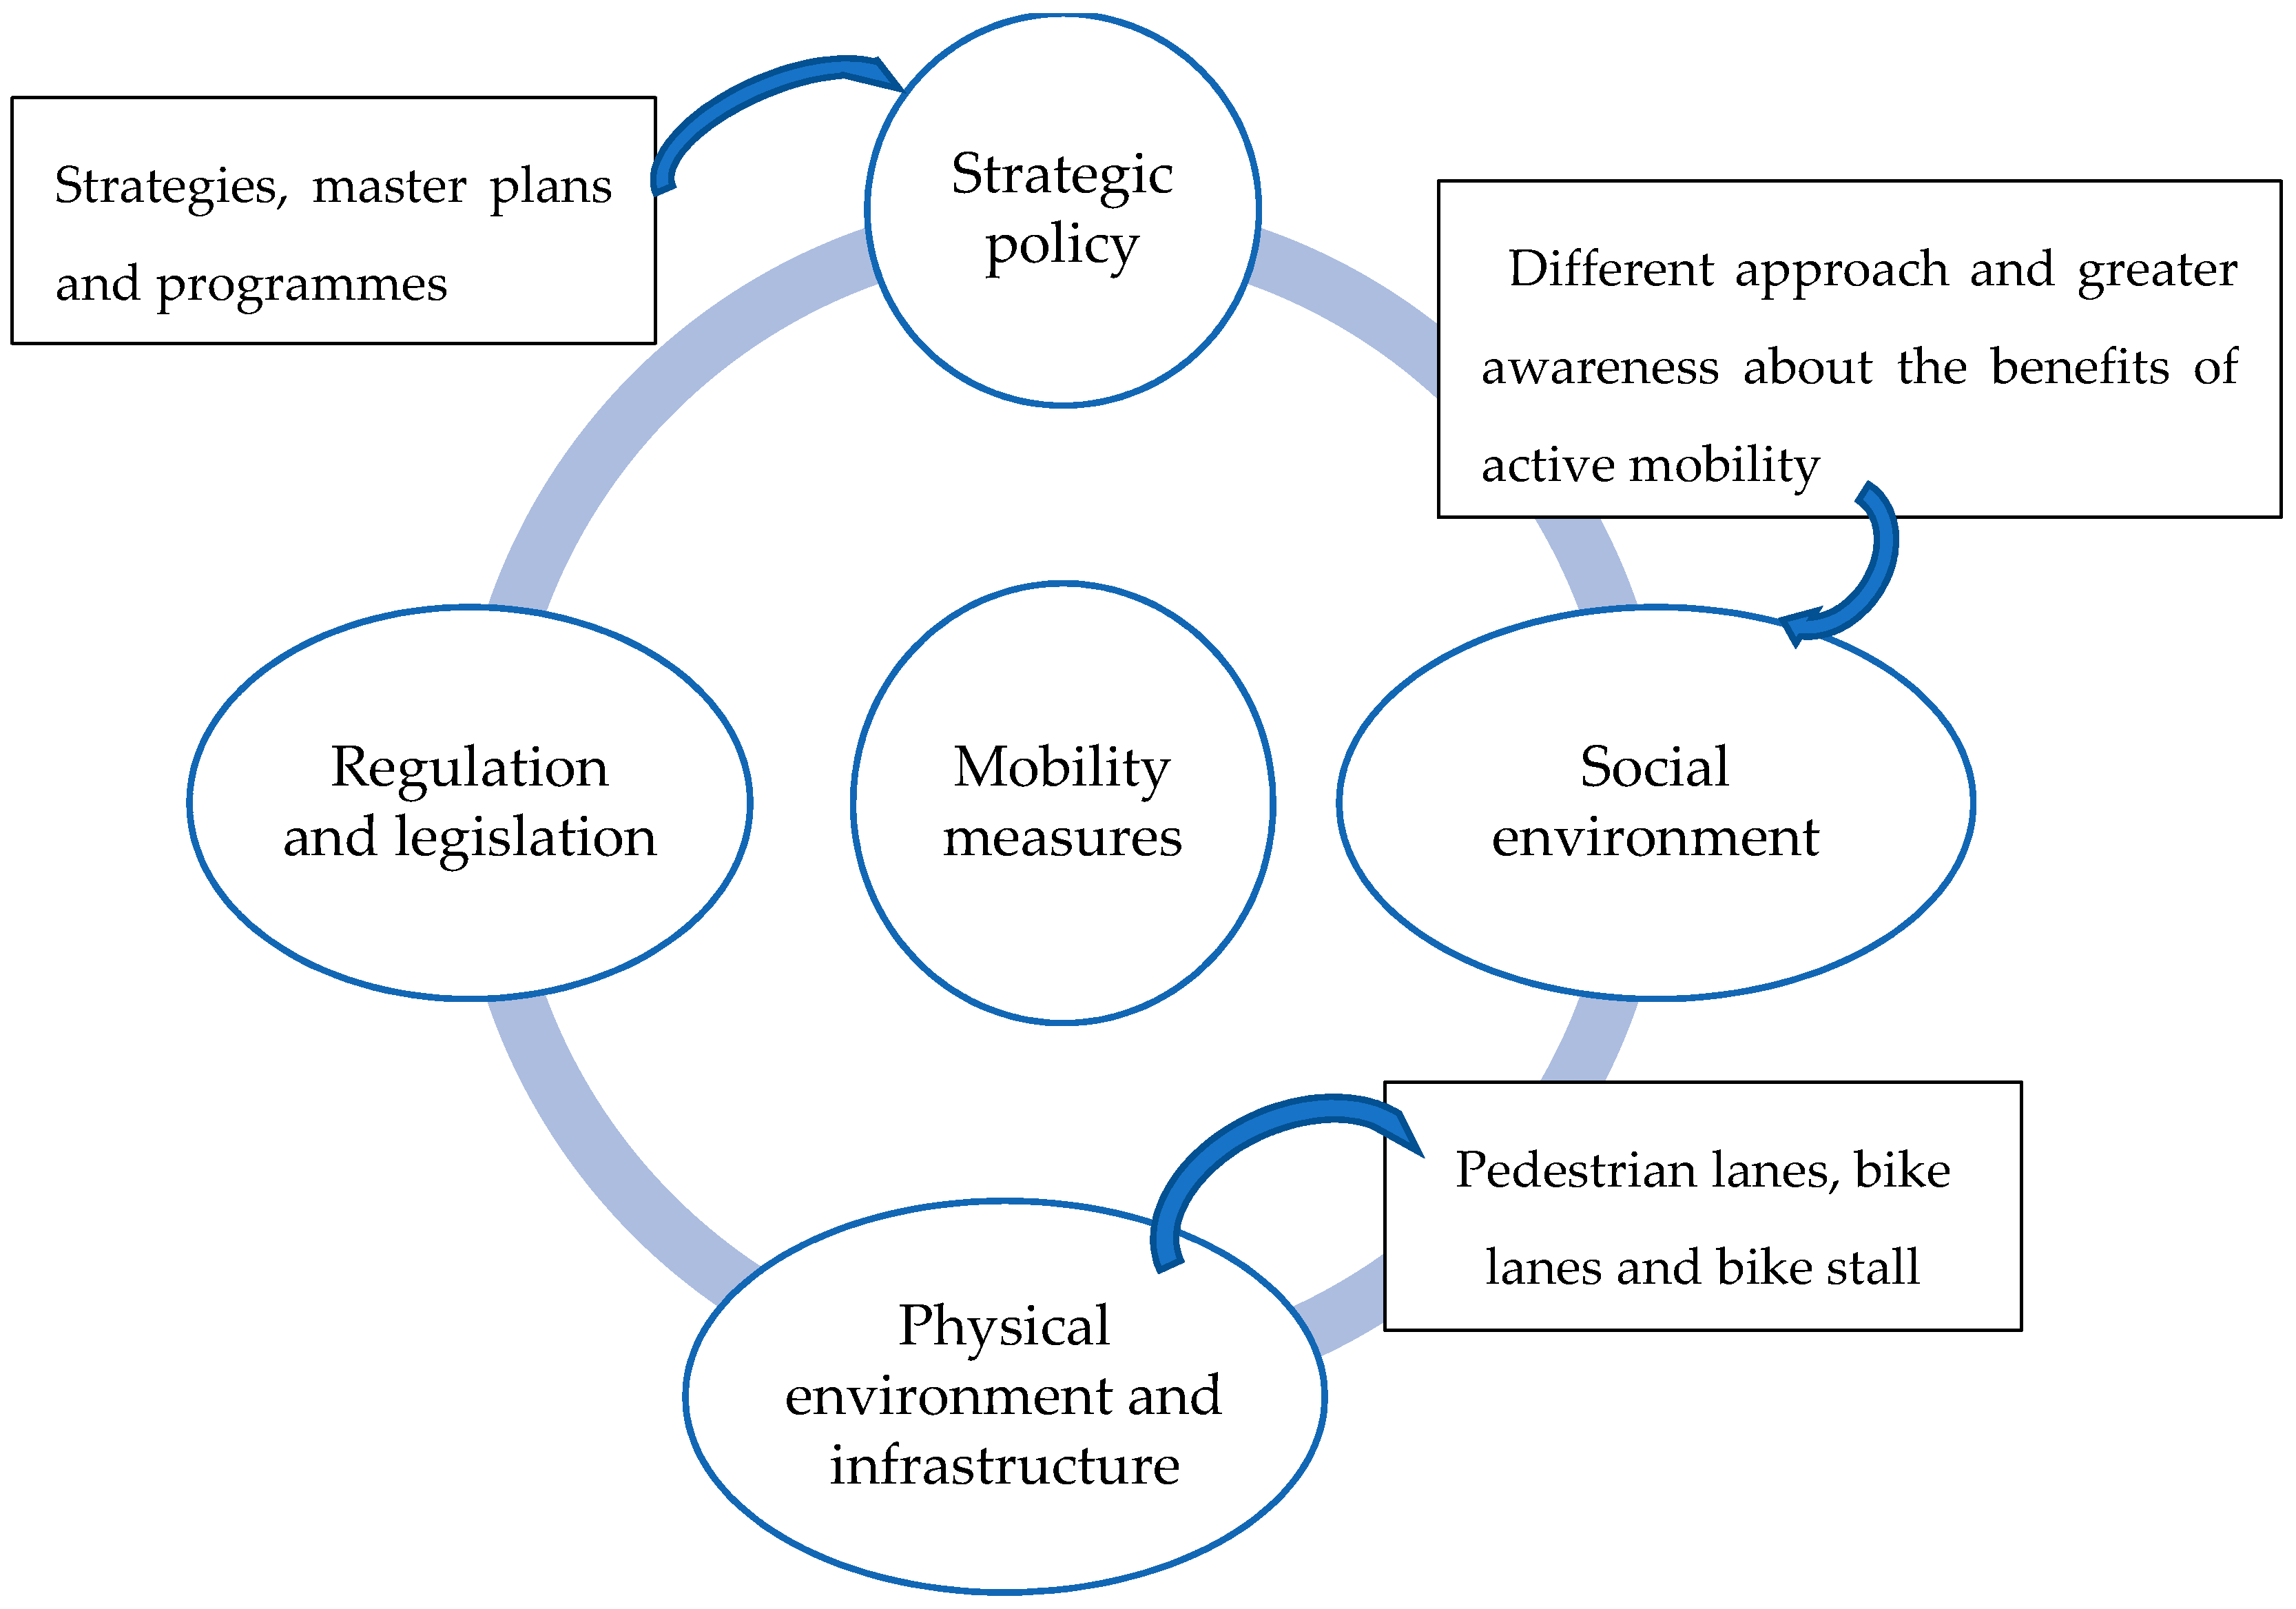
:1. Introduction
2. The State-of-the-Art Review
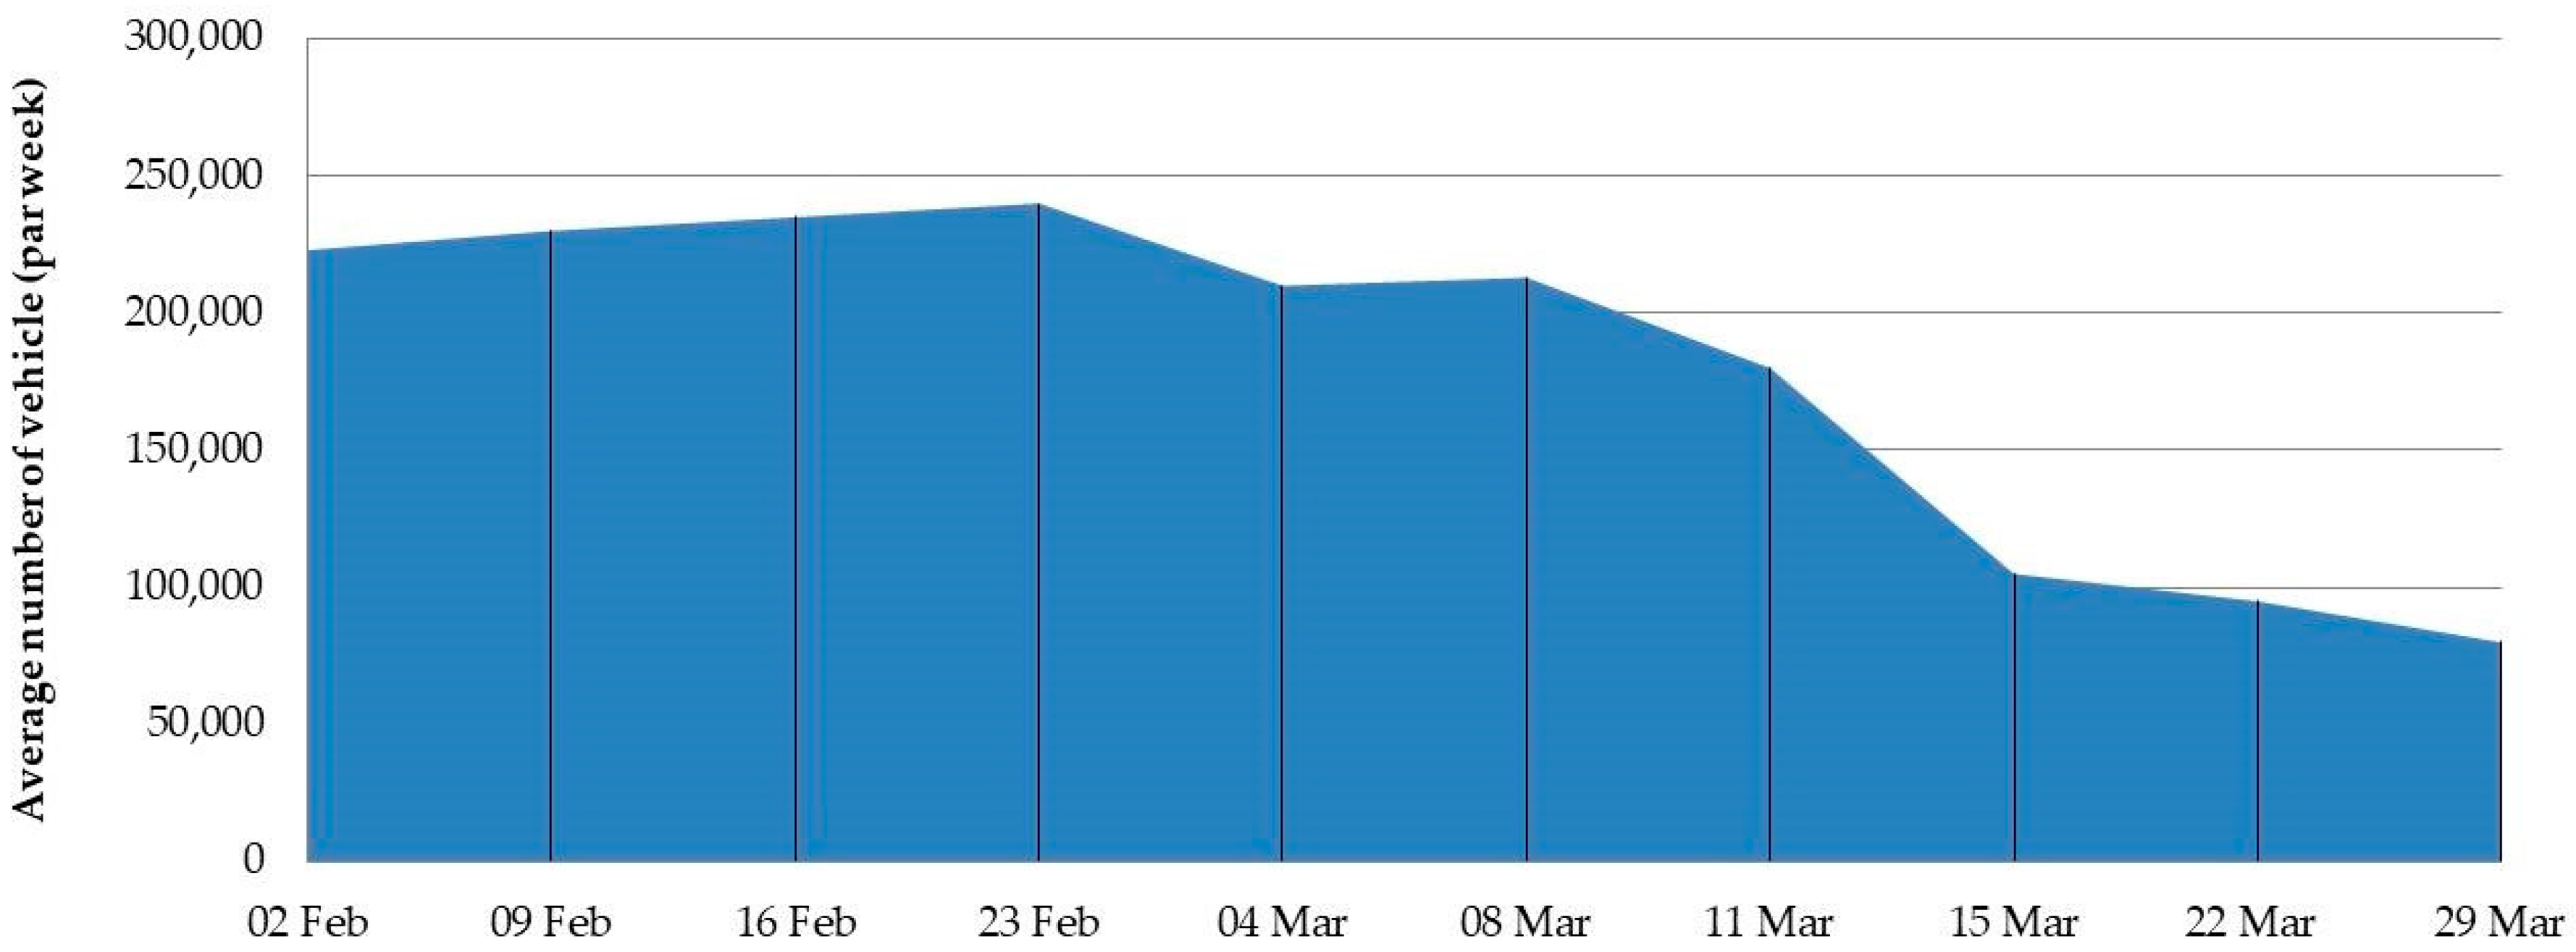
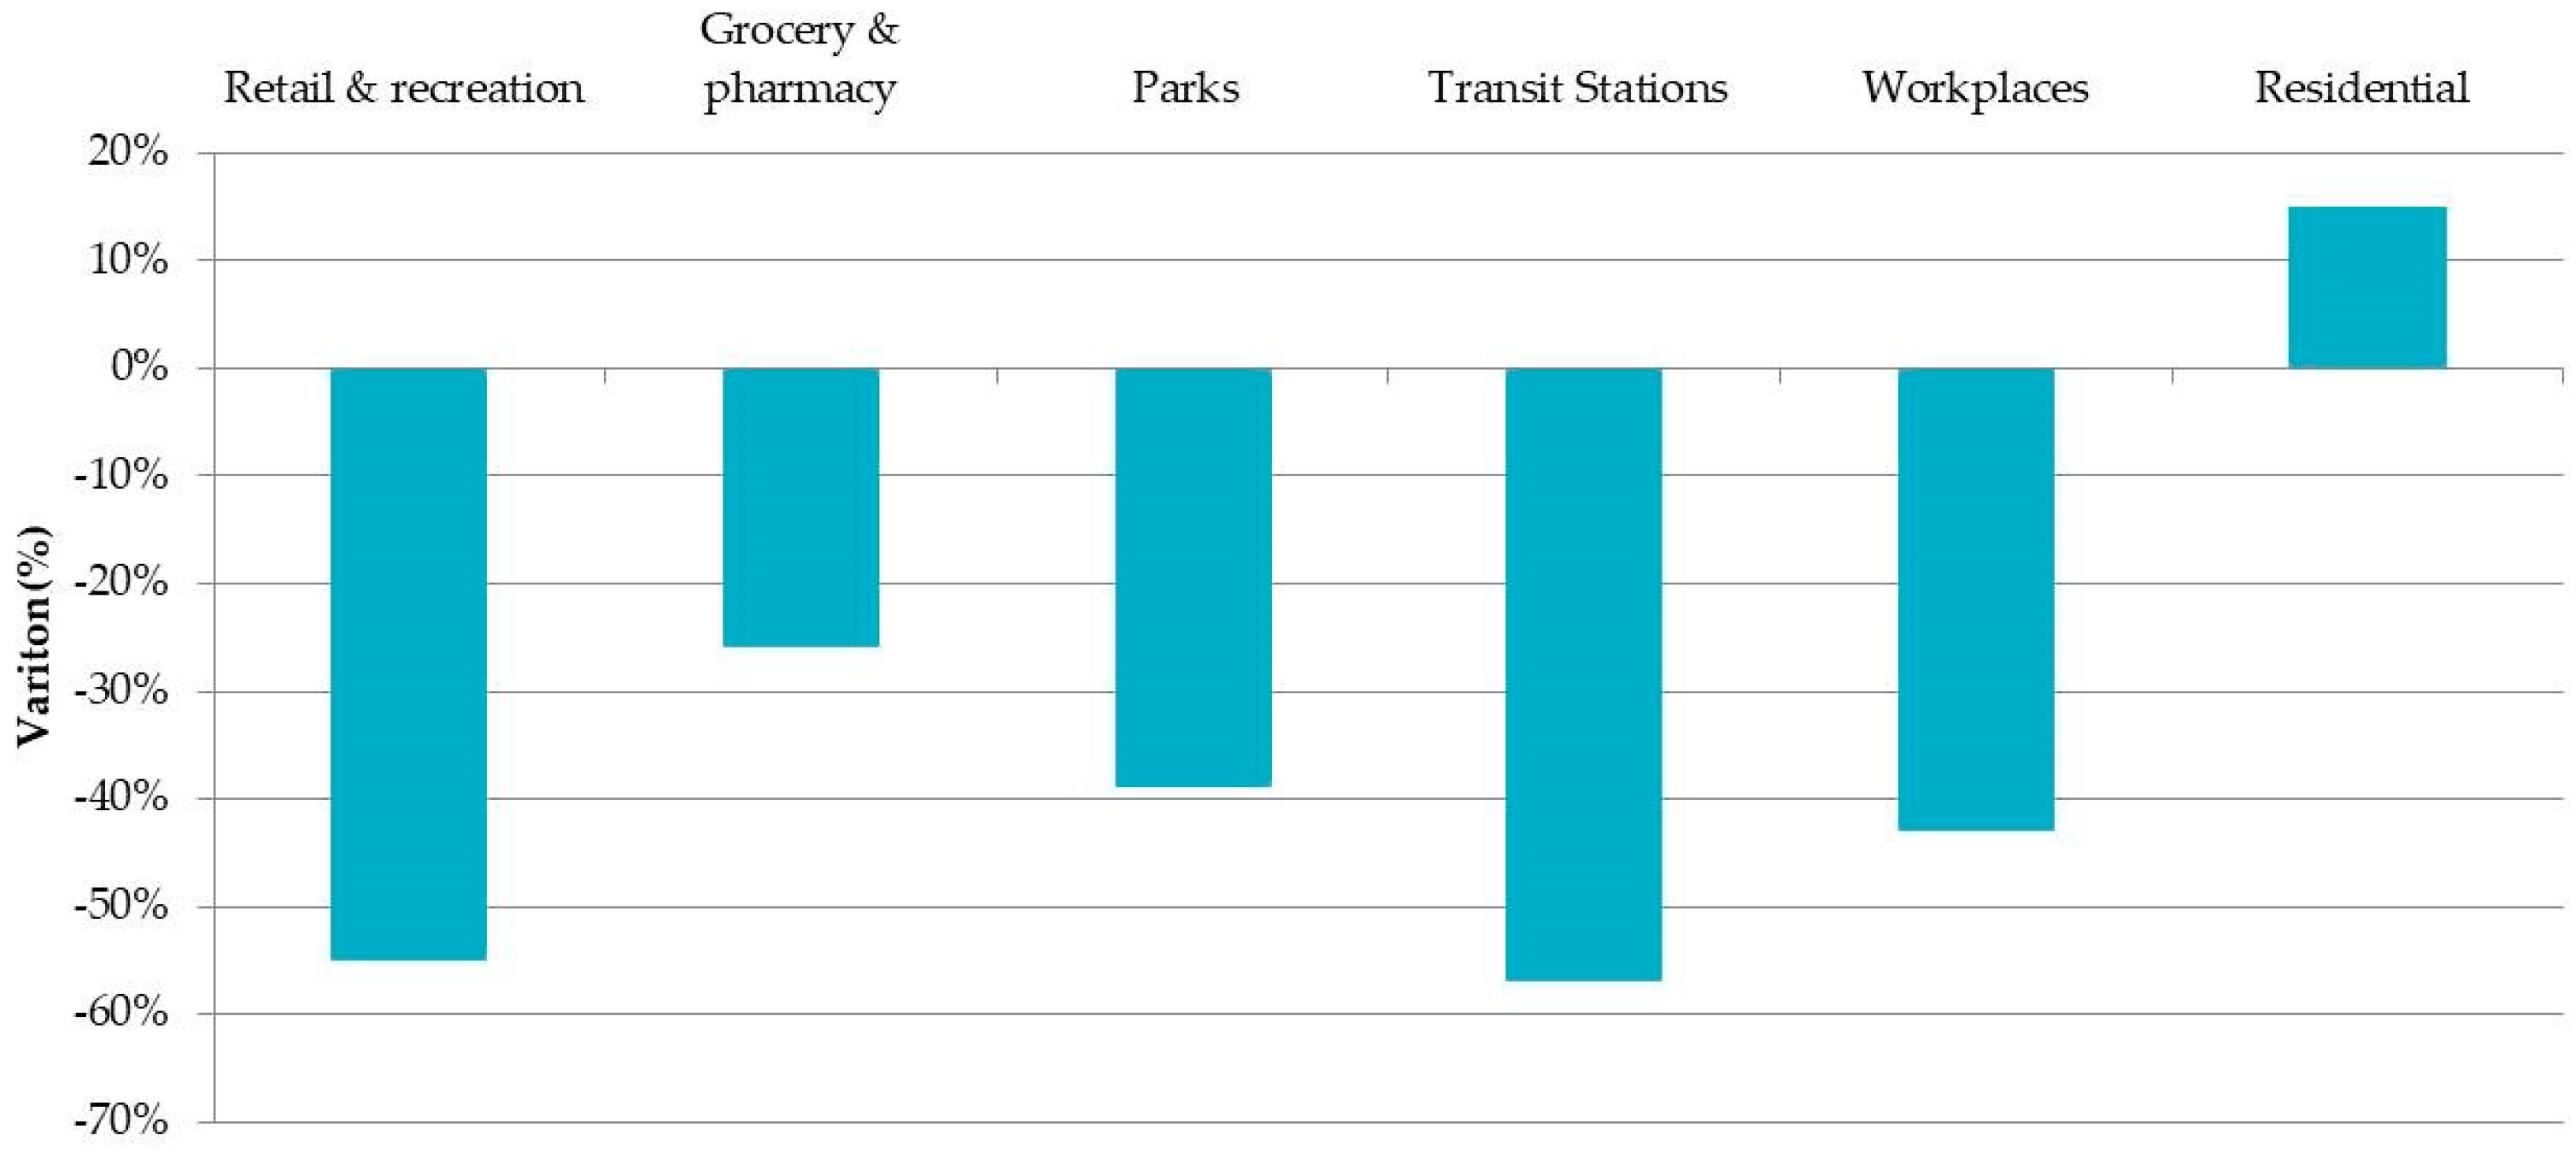
2.1. COVID-19 Impact on Italian Mobility
- 23 February 2020 first death in Codogno (small town of Lombardy),
- 8 March 2020 Italy is declared an “orange zone” (with middle-high risk),
- 10 March 2020 Italy is declared in the “red zone” (with maximum risk),
- 22 March 2020 closures of all non-essential [47].
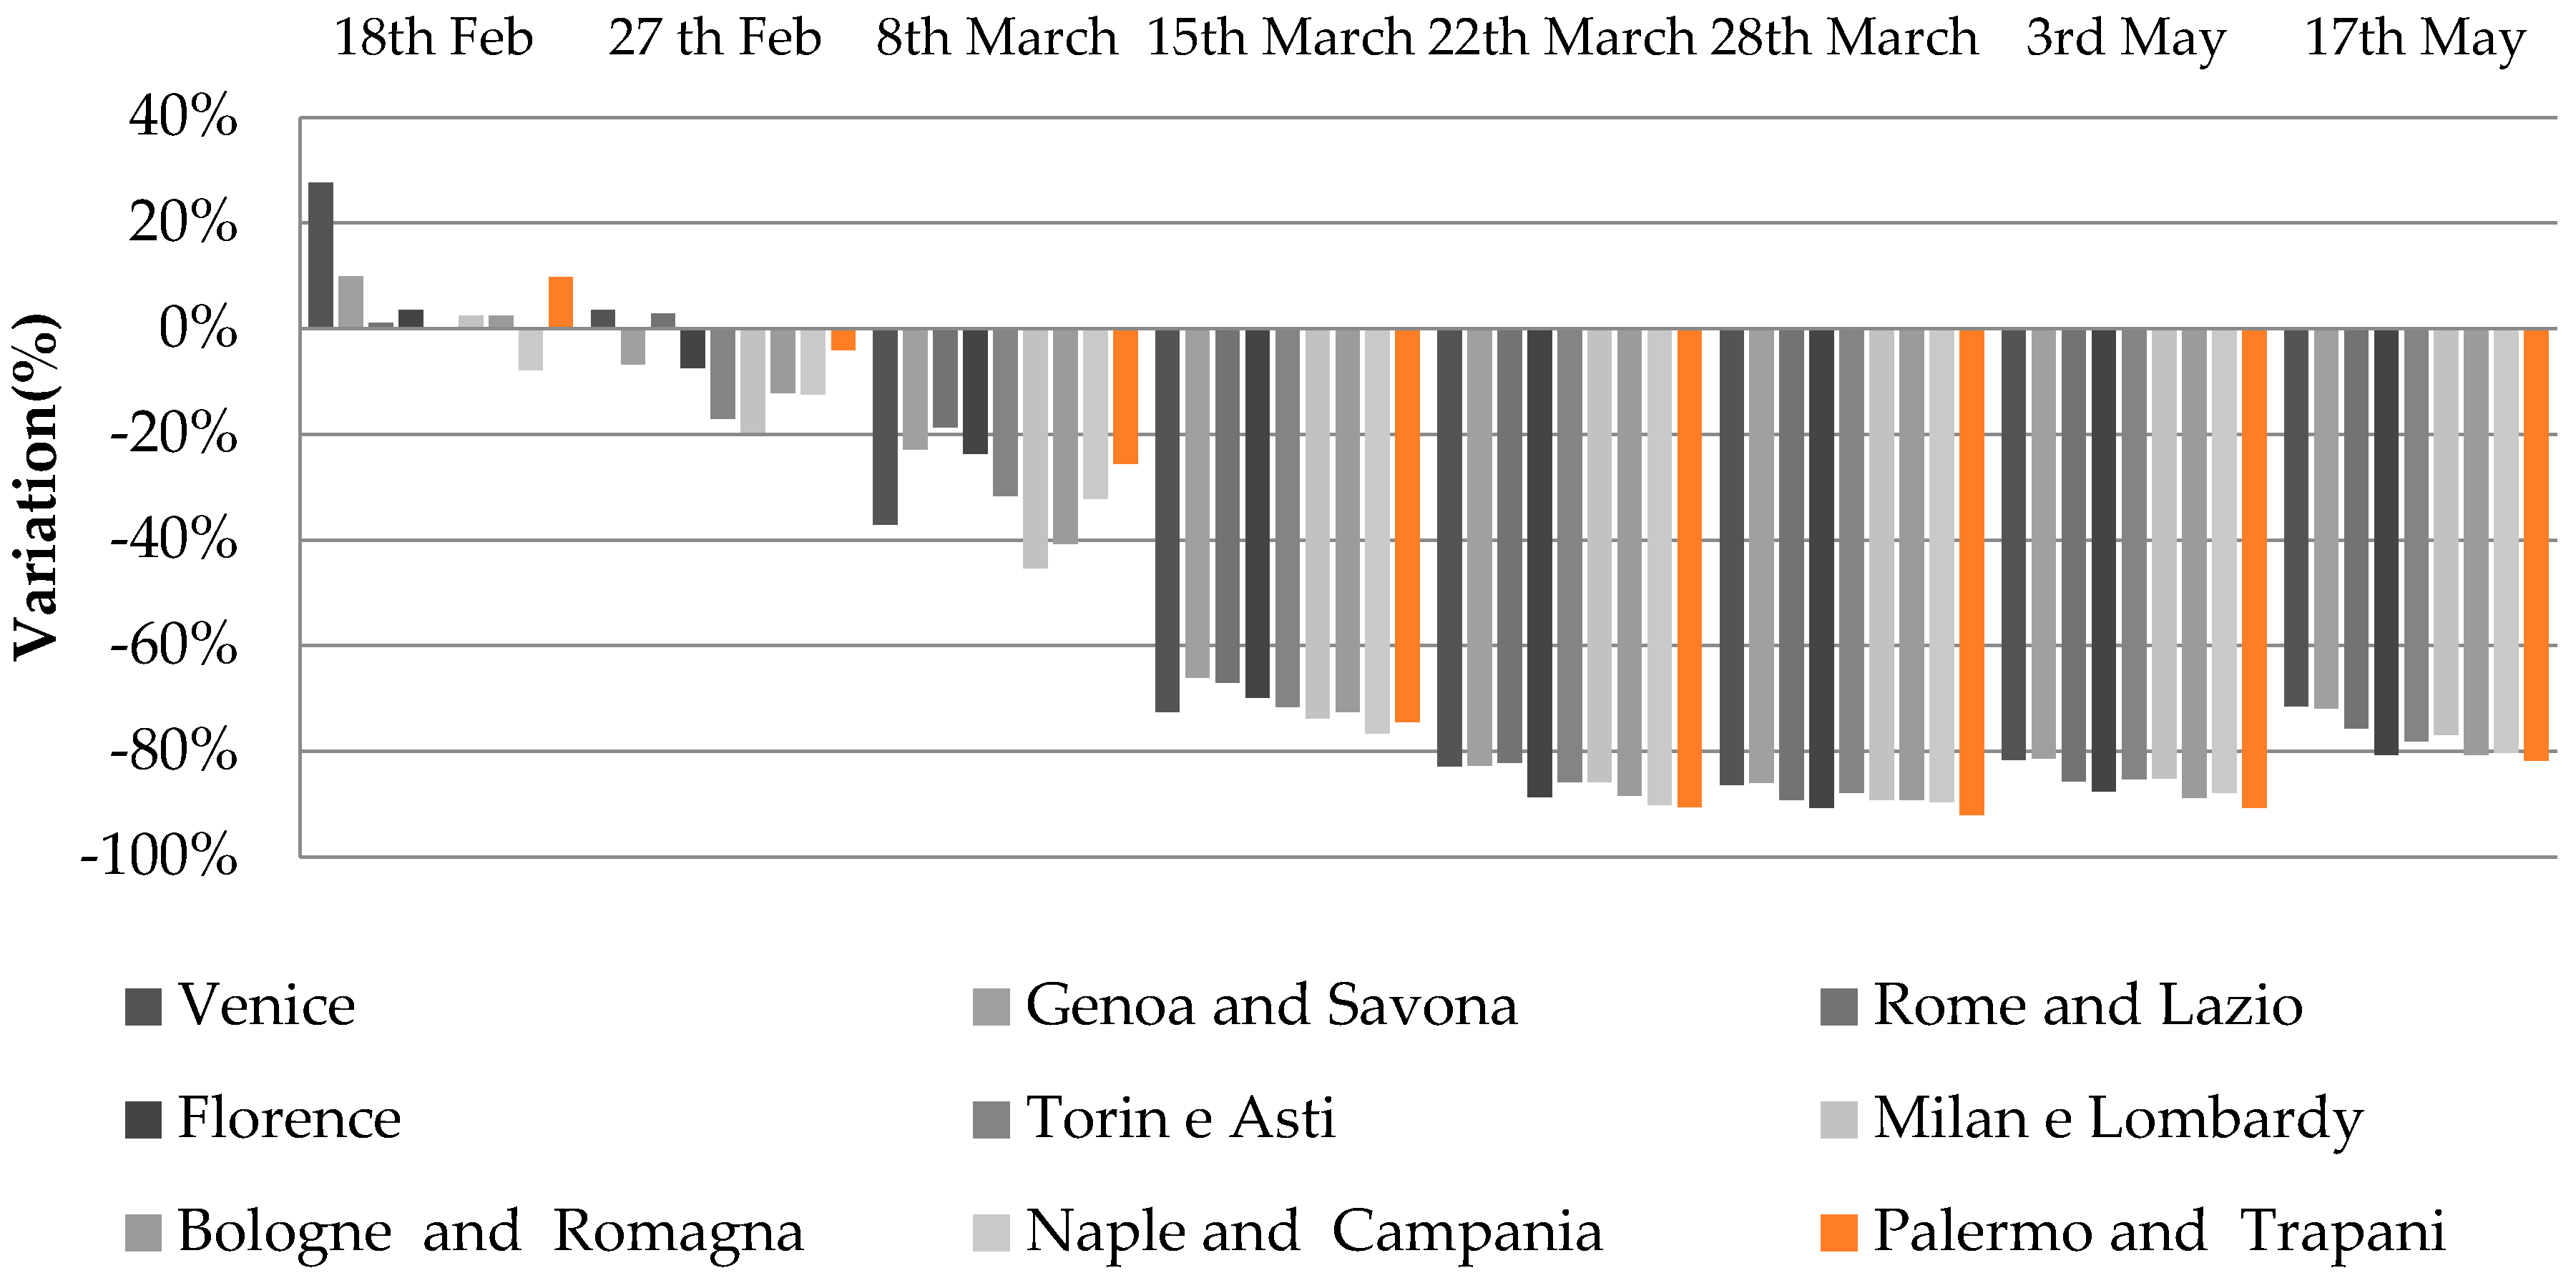
2.2. COVID-19 Impact on Sicily Mobility
3. Materials and Methods
- n: the sample size
- N: the population size of the Palermo, Catania, Enna, and Syracuse Provinces
- z: the z-statistic for a level of confidence
- p: the expected population proportion
- ε: the margin of error
- N = 2,895,735 [67]
- z = 1.96 (since a = 5%)
- p = 0.5
- ε = 0.0566
- Section 1: socio-demographic data namely gender, age groups, profession, and possession of driving license and car.
- Section 2: walking habits before and after COVID-19 which investigated the movement habits (frequency and motivation) and the necessary post-pandemic equipment.
- Section 3: public transportation habits before and after COVID-19.
- Section 4: feelings and perceptions onboard public and private vehicles which allowed to acquire data on the state of anxiety, fear, and stress of post-pandemic people during travel activities, also assessing the propensity for alternative modes of transportation and alternative working methods such as prolongation of remote working times.
4. Results
4.1. Descriptive Statistics
4.2. Correlation Matrix
4.3. Walking Shift Frequency Estimation by Ordinal Regression Model
4.4. Cycling Shift Frequency Estimation by Ordinal Regression Model
5. Interpretations
5.1. Interpretation of Walking Shift Frequency Model
5.2. Interpretation of Cycling Shift Frequency Model
6. Discussion and Conclusions
- Females were found to be 1.5 times more likely to reduce their walking frequency post lockdown.
- Respondents who stated that they completely disagreed, were neutral, or agreed, respectively, with the growing diffusion of the anxiety sensation caused by the use of public transport post lockdown were found to be 8.9, 2.0, and 1.7 times more likely to raise their walking shift frequency post lockdown.
- Respondents—non-users of public transportation for leisure activities before the pandemic—were found to be 4.7 times more likely to reduce their cycling frequency post lockdown compared to the respondents who used public transportation more than three times a day.
- Respondents—convinced of increased use of micromobility post lockdown—were found to be 2.8 times more likely to raise their cycling frequency compared to the respondents that were not convinced.
- Respondents—supporters of remote work—were found to be 4.2 times more likely to raise their bicycling frequency compared to the neutral respondents regarding remote work.
7. Limitations and Recommendations for Future Studies
Author Contributions
Funding
Acknowledgments
Conflicts of Interest
References
- Tian, H.; Liu, Y.; Li, Y.; Wu, C.H.; Chen, B.; Kraemer, M.U.; Wang, B. An investigation of transmission control measures during the first 50 days of the COVID-19 epidemic in China. Science 2020, 368, 638–642. [Google Scholar] [CrossRef] [PubMed] [Green Version]
- De Vos, J. The effect of COVID-19 and subsequent social distancing on travel behaviour. Transp. Res. Interdiscip. Perspect. 2020, 5, 100121. [Google Scholar] [CrossRef]
- Abdi, M. Coronavirus disease 2019 (COVID-19) outbreak in Iran: Actions and problems. Infect. Control Hosp. Epidemiol. 2020, 41, 754–755. [Google Scholar] [CrossRef] [Green Version]
- Lee, H.; Park, S.J.; Lee, G.R.; Kim, J.E.; Lee, J.H.; Jung, Y.; Nam, E.W. The Relationship between the COVID-19 Prevalence Trend and Transportation Trend in South Korea. Int. J. Infect. Dis. 2020, 96, 399–407. [Google Scholar] [CrossRef] [PubMed]
- Wey, A.; Champneys, A.; Dyson, R.J.; Alwan, N.A.; Barker, M. The benefits of peer transparency in safe workplace operation post pandemic lockdown. arXiv 2020, arXiv:2007.03283. [Google Scholar] [CrossRef]
- Giritli Nygren, K.; Olofsson, A. Managing the Covid-19 pandemic through individual responsibility: The consequences of a world risk society and enhanced ethopolitics. J. Risk Res. 2020, 1–5. [Google Scholar] [CrossRef] [Green Version]
- Meena, S. Impact of novel Coronavirus (COVID-19) pandemic on travel pattern: A case study of India. Indian J. Sci. Technol. 2020, 13, 2491–2501. [Google Scholar] [CrossRef]
- Beck, M.J.; Hensher, D.A. Insights into the impact of COVID-19 on household travel and activities in Australia-The early days under restrictions. Transp. Policy 2020, 96, 76–93. [Google Scholar] [CrossRef]
- Pawar, D.S.; Yadav, A.K.; Akolekar, N.; Velaga, N.R. Impact of Physical Distancing due to Novel Coronavirus (SARS-CoV-2) on Daily Travel for Work during Transition to Lockdown. Transp. Res. Interdiscip. Perspect. 2020, 7, 100203. [Google Scholar] [CrossRef]
- Hu, R. COVID-19, smart work, and collaborative space: A crisis-opportunity perspective. J. Urban Manag. 2020. [Google Scholar] [CrossRef]
- Madapur, B.; Madangopal, S.; Chandrashekar, M.N. Micro-Mobility Infrastructure for Redefining Urban Mobility. Eur. J. Eng. Sci. Technol. 2020, 3, 71–85. [Google Scholar] [CrossRef] [Green Version]
- Campisi, T.; Acampa, G.; Marino, G.; Tesoriere, G. Cycling Master Plans in Italy: The I-BIM Feasibility Tool for Cost and Safety Assessments. Sustainability 2020, 12, 4723. [Google Scholar] [CrossRef]
- Campisi, T.; Torrisi, V.; Ignaccolo, M.; Inturri, G.; Tesoriere, G. University propensity assessment to car sharing services using mixed survey data: The Italian case study of Enna city. Transp. Res. Procedia 2020, 47, 433–440. [Google Scholar] [CrossRef]
- Suman, H.K.; Agarwal, A.; Bolia, N.B. Public Transport Operations after Lockdown: How to Make It Happen? Trans. Indian Natl. Acad. Eng. 2020, 5, 149–156. [Google Scholar] [CrossRef]
- Kraus, S.; Koch, N. Effect of pop-up bike lanes on cycling in European cities. arXiv 2020, arXiv:2008.05883. [Google Scholar]
- Covid-19-and-Need-Pop-Walking-and-Cycling-Facilities. Available online: https://trl.co.uk/news/news/covid-19-and-need-pop-walking-and-cycling-facilities (accessed on 19 May 2020).
- Campisi, T.; Akgün, N.; Ticali, D.; Tesoriere, G. Exploring Public Opinion on Personal Mobility Vehicle Use: A Case Study in Palermo, Italy. Sustainability 2020, 12, 5460. [Google Scholar] [CrossRef]
- Barbarossa, L. The Post Pandemic City: Challenges and Opportunities for a Non-Motorized Urban Environment. An Overview of Italian Cases. Sustainability 2020, 12, 7172. [Google Scholar] [CrossRef]
- Schwedhelm, A.; Li, W.; Harms, L.; Adriazola-Steil, C. Biking Provides a Critical Lifeline during the Coronavirus Crisis. Available online: https://www.wri.org/blog/2020/04/coronavirus-biking-critical-in-cities (accessed on 14 May 2020).
- Hu, W. A Surge in Biking to Avoid Crowded Trains in N.Y.C. Available online: https://www.nytimes.com/2020/03/14/nyregion/coronavirus-nyc-bike-commute.html (accessed on 14 May 2020).
- Rubin, O.; Nikolaeva, A.; Nello-Deakin, S.; te Brömmelstroet, M. What Can We Learn from the COVID-19 Pandemic about How People Experience Working from Home and Commuting? 2020. Available online: https://urbanstudies.uva.nl/content/blog-series/covid-19-pandemic-working-from-home-and-commuting.html?origin=RkIy9bW8Q4G0e%2FaGMRg%2FOA&cb (accessed on 14 May 2020).
- City Bike Season to Start in Helsinki Earlier than Last Year. Available online: https://www.hel.fi/uutiset/en/helsinki/city-bike-season-to-start (accessed on 14 May 2020).
- Ross, A.G.; Crowe, S.M.; Tyndall, M.W. Planning for the Next Global Pandemic. Int. J. Infect. Dis. 2015, 38, 89–94. [Google Scholar] [CrossRef] [Green Version]
- Kissler, S.M.; Tedijanto, C.; Goldstein, E.; Grad, Y.H.; Lipsitch, M. Projecting the transmission dynamics of SARS-CoV-2 through the postpandemic period. Science 2020, 368, 860–868. [Google Scholar] [CrossRef]
- Castañeda-Babarro, A.; Arbillaga-Etxarri, A.; Gutiérrez-Santamaria, B.; Coca, A. Impact of COVID-19 Confinement on the Time and Intensity of Physical Activity in the Spanish Population. Res. Sq. 2020, 1–14. [Google Scholar] [CrossRef]
- Lopez-Carreiro, I.; Monzon, A. Evaluating sustainability and innovation of mobility patterns in Spanish cities. Analysis by size and urban typology. Sustain. Cities Soc. 2018, 38, 684–696. [Google Scholar] [CrossRef]
- De Souza, J.V.R.; De Mello, A.M.; Marx, R. When is an innovative urban mobility business model sustainable? A literature review and analysis. Sustainability 2019, 11, 1761. [Google Scholar] [CrossRef] [Green Version]
- Scotini, R.; Skinner, I.; Racioppi, F.; Fusé, V.; Bertucci, J.D.O.; Tsutsumi, R. Supporting active mobility and green jobs through the promotion of cycling. Int. J. Environ. Res. Public Health 2017, 14, 1603. [Google Scholar] [CrossRef] [Green Version]
- Stead, D. Institutional aspects of integrating transport, environment and health policies. Transp. Policy 2008, 15, 139–148. [Google Scholar] [CrossRef]
- Cornacchia, G.; Rossetti, G.; Pappalardo, L. Modelling Human Mobility considering Spatial, Temporal and Social Dimensions. arXiv 2020, arXiv:2007.02371. Available online: https://arxiv.org/abs/2007.02371 (accessed on 20 October 2020).
- Connolly, C.; Keil, R.; Ali, S.H. Extended urbanisation and the spatialities of infectious disease: Demographic change, infrastructure and governance. Urban Stud. 2020. [Google Scholar] [CrossRef]
- Murray-Tuite, P.M. A comparison of transportation network resilience under simulated system optimum and user equilibrium conditions. In Proceedings of the 2006 Winter Simulation Conference, Monterey, CA, USA, 3–6 December 2006; pp. 1398–1405. [Google Scholar] [CrossRef] [Green Version]
- Tamvakis, P.; Xenidis, Y. Resilience in transportation systems. Procedia-Soc. Behav. Sci. 2012, 48, 3441–3450. [Google Scholar] [CrossRef] [Green Version]
- Beiler, M.O.; McNeil, S.; Ames, D.; Gayley, R. Identifying resiliency performance measures for megaregional planning: Case study of the transportation corridor between Boston, Massachusetts, and Washington, DC. Transp. Res. Rec. 2013, 2397, 153–160. [Google Scholar] [CrossRef]
- Philips, I. The Potential Role of Walking and Cycling to Increase Resilience of Transport Systems to Future External Shocks: Creating an Indicator of Who Could Get to Work by Walking and Cycling If There Was no Fuel for Motorised Transport. Ph.D. Thesis, University of Leeds, Leeds, UK, 2014. [Google Scholar]
- Bhavathrathan, B.K.; Patil, G.R. Quantifying resilience using a unique critical cost on road networks subject to recurring capacity disruptions. Transp. A Transp. Sci. 2015, 11, 836–855. [Google Scholar] [CrossRef]
- Boulange, C.; Gunn, L.; Giles-Corti, B.; Mavoa, S.; Pettit, C.; Badland, H. Examining associations between urban design attributes and transport mode choice for walking, cycling, public transport and private motor vehicle trips. J. Transp. Health 2017, 6, 155–166. [Google Scholar] [CrossRef]
- Ganin, A.A.; Kitsak, M.; Marchese, D.; Keisler, J.M.; Seager, T.; Linkov, I. Resilience and efficiency in transportation networks. Sci. Adv. 2017, 3, e1701079. [Google Scholar] [CrossRef] [Green Version]
- Wan, C.; Yang, Z.; Zhang, D.; Yan, X.; Fan, S. Resilience in transportation systems: A systematic review and future directions. Transp. Rev. 2018, 38, 479–498. [Google Scholar] [CrossRef]
- Zhou, Y.; Wang, J.; Yang, H. Resilience of transportation systems: Concepts and comprehensive review. IEEE Trans. Intell. Transp. Syst. 2019, 20, 4262–4276. [Google Scholar] [CrossRef]
- Ahmed, S.; Dey, K. Resilience modeling concepts in transportation systems: A comprehensive review based on mode, and modeling techniques. J. Infrastruct. Preserv. Resil. 2020, 1, 1–20. [Google Scholar] [CrossRef]
- Moraci, F.; Errigo, M.F.; Fazia, C.; Campisi, T.; Castelli, F. Cities under Pressure: Strategies and Tools to Face Climate Change and Pandemic. Sustainability 2020, 12, 7743. [Google Scholar] [CrossRef]
- Rodrigue, J.-P. The Geography of Transport Systems, 5th ed.; Routledge: London, UK, 2020. [Google Scholar]
- Ma, H.; Chiu, Y.; Tian, X.; Zhang, J.; Guo, Q. Safety or Travel: Which Is More Important? The Impact of Disaster Events on Tourism. Sustainability 2020, 12, 3038. [Google Scholar] [CrossRef] [Green Version]
- Maps Show How Coronavirus Lockdowns Emptied Our Cities. Available online: https://www.abc.net.au/news/2020-04-05/maps-show-how-coronavirus-lockdowns-emptied-our-cities/12121524?nw=0 (accessed on 14 May 2020).
- Pepe, E.; Bajardi, P.; Gauvin, L.; Privitera, F.; Lake, B.; Cattuto, C.; Tizzoni, M. COVID-19 outbreak response: A first assessment of mobility changes in Italy following national lockdown. medRxiv 2020. [Google Scholar] [CrossRef] [Green Version]
- Coronavirus-Quante-Auto-Circolano-Durante-la-Quarantena-Targa-Telematics. Available online: https://www.youtrend.it/2020/04/08/coronavirus-quante-auto-circolano-durante-la-quarantena-targa-telematics/ (accessed on 14 May 2020).
- Murgante, B.; Borruso, G.; Balletto, G.; Castiglia, P.; Dettori, M. Why Italy First? Health, Geographical and Planning aspects of the Covid-19 outbreak. Sustainability 2020, 12, 5064. [Google Scholar] [CrossRef]
- Moslem, S.; Campisi, T.; Szmelter-Jarosz, A.; Duleba, S.; Nahiduzzaman, K.M.; Tesoriere, G. Best-Worst Method for Modelling Mobility Choice after COVID-19: Evidence from Italy. Sustainability 2020, 12, 6824. [Google Scholar] [CrossRef]
- Honey-Roses, J.; Anguelovski, I.; Bohigas, J.; Chireh, V.; Daher, C.; Konijnendijk, C.; Oscilowicz, E. The Impact of COVID-19 on Public Space: A Review of the Emerging Questions; OSF Preprints: Charlottesville, VA, USA, 2020. [Google Scholar] [CrossRef]
- Torrisi, V.; Ignaccolo, M.; Inturri, G. Innovative Transport Systems to Promote Sustainable Mobility: Developing the Model Architecture of a Traffic Control and Supervisor System. In International Conference on Computational; Springer: Cham, Switzerland, 2018. [Google Scholar] [CrossRef]
- Canale, A.; Tesoriere, G.; Campisi, T. The MAAS development as a mobility solution based on the individual needs of transport users. In AIP Conference Proceedings; AIP Publishing LLC.: New York, NY, USA, 2019; Volume 2186, p. 160005. [Google Scholar] [CrossRef]
- Acampa, G.; Cabillo, I.C.; Marino, G. Representación del dibujo frente a simulación de los sistemas BIM. Oportunidad o Amenaza Para la Arquit. 2019. [Google Scholar] [CrossRef] [Green Version]
- Schwanen, T. Beyond instrument: Smartphone app and sustainable mobility. Eur. J. Transp. Infrastruct. Res. 2015. Available online: https://ora.ox.ac.uk/objects/uuid:17da3bb2-1588-48bb-82e6-7cddebfadaaf (accessed on 20 October 2020).
- Mangiaracina, R.; Perego, A.; Salvadori, G.; Tumino, A. A comprehensive view of intelligent transport systems for urban smart mobility. Int. J. Logist. Res. Appl. 2017, 20, 39–52. [Google Scholar] [CrossRef]
- Lasry, A.; Kidder, D.; Hast, M.; Poovey, J.; Sunshine, G.; Zviedrite, N.; Ethier, K.A. Timing of Cmmunity Mitigation and Changes in Reported COVID-19 and Community Mobility-four US Metropolitan Areas, February 26–-April 1, 2020; CDC: Atlanta, GA, USA, 2020. [Google Scholar] [CrossRef] [Green Version]
- Moovitapp. Available online: www.moovitapp.com (accessed on 15 May 2020).
- Richardson, A.J.; Ampt, E.S.; Meyburg, A.H. Survey Methods for Transport Planning; Eucalyptus Press: Melbourne, Australia, 1995; p. 314. [Google Scholar]
- Nella Mobilitá Post-Lockdown la Propria Auto e’ il Mezzo piu’ Sicuro. Available online: http://www.igiornalidisicilia.it/sicilia/?p=56680 (accessed on 15 July 2020).
- Newman, A.O. COVID, CITIES and CLIMATE: Historical precedents and potential transitions for the new economy. Urban Sci. 2020, 4, 32. [Google Scholar] [CrossRef]
- Grosvenor, T. Qualitative Research in the Transport Sector (No. E-C008). In Proceedings of the International Conference on Transport Survey Quality and Innovation, 2000. Available online: https://www.semanticscholar.org/paper/QUALITATIVE-RESEARCH-IN-THE-TRANSPORT-SECTOR-Grosvenor/8b9b107cf9209ea631d811455f9331cf14ea7cff (accessed on 20 October 2020).
- Beirão, G.; Cabral, J.S. Understanding attitudes towards public transport and private car: A qualitative study. Transp. Policy 2007, 14, 478–489. [Google Scholar] [CrossRef]
- Sign in—Google Accounts—Google Surveys. Available online: https://surveys.google.com/warm-welcome?dest=%2Fyour-surveys%3Fcategory%3Dexample (accessed on 15 May 2020).
- World Health Organization. Rational Use of Personal Protective Equipment (PPE) for Coronavirus Disease (COVID-19): Interim Guidance, 19 March 2020 (No. WHO/2019-nCoV/IPC PPE_use/2020.2); World Health Organization: Geneva, Switzerland, 2020. [Google Scholar]
- Daniel, B.; Mohamad Nor, S.; Rohani, M.; Prasetijo, J.; Aman, M.; Ambak, K. Pedestrian Footpath Level of Service (FOOT-LOS) Model for Johor Bahru. In MATEC Web of Conferences; EDP Sciences: Les Ulis, France, 2016; Volume 47, p. 3006. [Google Scholar] [CrossRef] [Green Version]
- Naing, L.; Winn, T.; Rusli, B.N. Practical Issues in Calculating the Sample Size for Prevalence Studies. Arch. Orofac. Sci. 2006, 1, 9–14. [Google Scholar]
- Sicilia/Sicily (Italy): Provinces, Major—City Population. Available online: https://www.citypopulation.de/en/italy/cities/sicilia/ (accessed on 15 May 2020).
- Akgün, N.; Dissanayake, D.; Thorpe, N.; Bell, M. Cyclist casualty severity at roundabouts-To what extent do the geometric characteristics of roundabouts play a part? J. Saf. Res. 2018, 67, 83–91. [Google Scholar] [CrossRef] [PubMed]
- Nikiforiadis, A.; Basbas, S. Can pedestrians and cyclists share the same space? The case of a city with low cycling levels and experience. Sustain. Cities Soc. 2019, 46, 101453. [Google Scholar] [CrossRef]
- Lazou, O.; Sakellariou, A.; Basbas, S.; Paschalidis, E.; Politis, I. Assessment of LOS at pedestrian streets and qualitative factors. A pedestrians’ perception approach. In Proceedings of the 7th International Congress on Transportation Research, Athens, Greece, 14–15 April 2015. [Google Scholar]
- Biehl, A.; Ermagun, A.; Stathopoulos, A. Modelling determinants of walking and cycling adoption: A stage-of-change perspective. Transp. Res. Part F Traffic Psychol. Behav. 2018, 58, 452–470. [Google Scholar] [CrossRef]
- Yatskiv, I.; Spiridovska, N. Application of ordinal regression model to analyze service quality of Riga coach terminal. Transport 2013, 28, 25–30. [Google Scholar] [CrossRef]
- Mukaka, M.M. Statistics corner: A guide to appropriate use of correlation coefficient in medical research. Malawi Med. J. 2012, 24, 69–71. [Google Scholar]
- Angelici, M.; Profeta, P. Smart-Working: Work Flexibility without Constraints. Available online: https://papers.ssrn.com/sol3/papers.cfm?abstract_id=3556304 (accessed on 15 May 2020).
- Li, A.; Zhao, P.; He, H.; Axhausen, K.W. Understanding the variations of micro-mobility behavior before and during COVID-19 pandemic period. Arb. Verk. Raumplan. 2020, 1547. [Google Scholar] [CrossRef]
- Norušis, M. IBM SPSS Statistics 19 Advanced Statistical Procedures Companion; Prentice Hall: Upper Saddle River, NJ, USA.
- Campisi, T.; Deluka-Tibljaš, A.; Tesoriere, G.; Canale, A.; Rencelj, M.; Šurdonja, S. Cycling traffic at turbo roundabouts: Some considerations related to cyclist mobility and safety. Transp. Res. Procedia 2020, 45, 627–634. [Google Scholar] [CrossRef]
- Almagro, M.; Orane-Hutchinson, A. The differential impact of COVID-19 across demographic groups: Evidence from NYC. Differ. Impact COVID-19 Demogr. Groups Evid. NYC (10 April 2020) 2020. [Google Scholar] [CrossRef]
- Kamruzzaman, M.; De Vos, J.; Currie, G.; Giles-Corti, B.; Turrell, G. Spatial biases in residential mobility: Implications for travel behaviour research. Travel Behav. Soc. 2020, 18, 15–28. [Google Scholar] [CrossRef]
- Bakogiannis, E.; Kyriakidis, C.; Siti, M.; Floropoulou, E. Reconsidering Sustainable Mobility Patterns in Cultural Route Planning: Andreas Syngrou Avenue, Greece. Heritage 2019, 2, 104. [Google Scholar] [CrossRef] [Green Version]
- Bonaccorsi, G.; Pierri, F.; Cinelli, M.; Flori, A.; Galeazzi, A.; Porcelli, F.; Pammolli, F. Economic and social consequences of human mobility restrictions under COVID-19. Proc. Natl. Acad. Sci. USA 2020, 117, 15530–15535. [Google Scholar] [CrossRef]
- Merkert, R.; Bushell, J.; Beck, M.J. Collaboration as a service (CaaS) to fully integrate public transportation-Lessons from long distance travel to reimagine mobility as a service. Transp. Res. Part A Policy Pract. 2020, 131, 267–282. [Google Scholar] [CrossRef]
- Beecroft, M.; Cottrill, C.D.; Farrington, J.H.; Nelson, J.D.; Niewiadomski, P. From infrastructure to digital networks: Accessibility and connectivity in transport geography research at Aberdeen. Scott. Geogr. J. 2019, 135, 343–355. [Google Scholar] [CrossRef]
- Gössling, S. Integrating e-scooters in urban transportation: Problems, policies, and the prospect of system change. Transp. Res. Part D Transp. Environ. 2020, 79, 102230. [Google Scholar] [CrossRef]
- Pangbourne, K.; Stead, D.; Mladenović, M.; Milakis, D. The case of mobility as a service: A critical reflection on challenges for urban transport and mobility governance. Gov. Smart Mobil. Transit. 2018, 33–48. [Google Scholar] [CrossRef]
- Wong, Y.Z.; Hensher, D.A.; Mulley, C. Mobility as a service (MaaS): Charting a future context. Transp. Res. Part A Policy Pract. 2020, 131, 5–19. [Google Scholar] [CrossRef]
- Hubert, M.; Corijn, E.; Neuwels, J.; Hardy, M.; Vermeulen, S.; Vaesen, J. From pedestrian area to urban project: Assets and challenges for the centre of Brussels. BSI synopsis. Bruss. Stud. 2017. [Google Scholar] [CrossRef] [Green Version]
- Rabl, A.; De Nazelle, A. Benefits of shift from car to active transport. Transp. Policy 2012, 19, 121–131. [Google Scholar] [CrossRef]
- Amoroso, S.; Castelluccio, F.; Maritano, L. Indicators for sustainable pedestrian mobility. In Urban Transport XVIII: Urban Transport and the Environment in the 21st Century; WIT Press: Southampton, UK, 2012; Volume 18, p. 173. [Google Scholar] [CrossRef] [Green Version]
- Roe, J.; Aspinall, P. The restorative benefits of walking in urban and rural settings in adults with good and poor mental health. Health Place 2011, 17, 103–113. [Google Scholar] [CrossRef] [PubMed]
- Alreck, P.; Settle, R. Survey Research Handbook, 3rd ed.; McGraw Hill: New York, NY, USA, 2004. [Google Scholar]


| Period | Author | Research Details |
|---|---|---|
| 2006 | [31] | Transportation resilience analysis considering 10 variables such as redundancy, diversity, and efficiency |
| 2012 | [32] | Analysis of the critical factor that decreases transportation resilience |
| 2013 | [33] | Analysis of robustness, redundancy, resourcefulness, and rapidity |
| 2014 | [34] | The potential of walking and cycling to increase resilience in case of fuel shocks |
| 2015 | [35] | A measure of maximum agitation a system can take in before getting displaced from one state to another |
| 2017 | [36] | Analysis of the resilience of transport through the evaluation of the score of housing diversity, gross population density, and proximity to supermarkets. |
| 2017 | [37] | The study of resilience related to the selection of road projects and investment opportunities related to disasters and other disruptions |
| 2018 | [38] | A systematic review of transportation resilience with an emphasis on its definitions, characteristics, and research methods applied in different transportation systems/contexts. |
| 2019 | [39] | The review of metrics and mathematical models used to measure resilience and the strategies used to enhance resilience |
| 2020 | [40] | Resilience measurement parameters (modeling based on the mode of transportation and modeling based on the mathematical technique used to quantify resilience) |
| 2020 | [41] | Analysis of the problem through a double modeling based on the mode of transport and the mathematical technique used to quantify the resilience |
| 2020 | [42] | Research on the problems and stresses of the contemporary city, mainly due to natural and health factors, related to climate change and pandemic COVID-19 with reference to the responses in terms of resilience of infrastructure and territory |
| Distance | Transportation Modes | Transportation Solution |
|---|---|---|
| <3 km | pedestrian mobility—walking | free and widen the sidewalks |
| 3–10 km | micromobility (e-bike, hoverboard, mono-wheel) | to set up an urban emergency mobility network |
| >10 km | car + bike + micromobilitytrain + bike + micromobility | promoting shared mobility and intermodal solutions |
| motorcycle | increase the stalls for motorcycles (reducing those for cars) |
| Variable | Description | Values |
|---|---|---|
| Sociodemographic | Gender | Male Female |
| Age group | 18–25, 26–40, 41–55, 56–70, >70 | |
| City of Residence (City and/or Province) | Residence location (Catania, Palermo, Enna, Caltanissetta, Messina, Ragusa, Other) | |
| Car ownership | Yes and I drive; Yes but I don’t drive it; No, I have not a driving license | |
| Travel habits trend after lockdown | Walking shift | Judgment scale (Yes, increasing; No, I think that it does not change; Yes, decreasing) |
| Cycling shift | ||
| Micromobility increasing use | Likert scale (from 1 = Completely disagree to 5 = Totally agree) | |
| Public transport (PT) habits trend | PT use considering leisure activities before COVID-19 lockdown frequency | Frequency scale (>3 times/day, 2–3 times/day, 1 time/day, several times/week, never) |
| PT use considering leisure activities after COVID-19 lockdown frequency | ||
| Needs and perceptions after lockdown | Need for remote working | Likert scale (from 1 = Completely disagree to 5 = Totally agree) |
| Stress perception | ||
| Anxiety perception |
| Code | Description | Measure | Values | Frequency (%) |
|---|---|---|---|---|
| Gender | Gender of participant | Nominal | 0: Male | 44.5% (192) |
| 1: Female | 55.5% (239) | |||
| PT frequency leisure | Participant’s frequency of travelling from home to leisure using public transport before COVID-19 spread | Ordinal | 0: >3 times/day | 3.7% (16) |
| 1: 2–3 times/day | 0.7% (3) | |||
| 2: 1 time/day | 38.7% (167) | |||
| 3: Several times/week | 36.0% (155) | |||
| 4: Never | 20.9% (90) | |||
| Micromobility use | Perception of more micromobility vehicles (scooters, hoverboards) use after lockdown | Ordinal | 1: Completely disagree | 6.5% (28) |
| 2: Disagree | 23.0% (99) | |||
| 3: Neutral | 26.9% (116) | |||
| 4: Agree | 27.6% (119) | |||
| 5: Totally agree | 16.0% (69) | |||
| Remote work | Perception of the need for remote work to remain | Ordinal | 1: Completely disagree | 0.5% (2) |
| 2: Disagree | 0.7% (3) | |||
| 3: Neutral | 4.6% (20) | |||
| 4: Agree | 5.6% (24) | |||
| 5: Totally agree | 88.6% (382) | |||
| Stress diffusion | Perception of the stress feelings diffused by public transport after lockdown | Ordinal | 1: Completely disagree | 0.23% (1) |
| 2: Disagree | 2.32% (10) | |||
| 3: Neutral | 18.33% (79) | |||
| 4: Agree | 37.59% (162) | |||
| 5: Totally agree | 41.53% (179) | |||
| Anxiety diffusion | Perception of the anxiety feelings diffused by public transport after lockdown | Ordinal | 1: Completely disagree | 1.6% (7) |
| 2: Disagree | 6.3% (27) | |||
| 3: Neutral | 18.3% (79) | |||
| 4: Agree | 29.5% (127) | |||
| 5: Totally agree | 44.3% (191) | |||
| Walking shift | Perception of walking shift frequency after the lockdown | Ordinal | 0: Yes, increasing | 40.6% (175) |
| 1: No, I think that it does not change | 16.7% (72) | |||
| 2: Yes, decreasing | 42.7% (184) | |||
| Cycling shift | Perception of cycling shift frequency after the lockdown | Ordinal | 0: Yes, increasing | 61.25% (264) |
| 1: No, I think that it does not change | 26.00% (112) | |||
| 2: Yes, decreasing | 12.75% (55) |
| 1 | 2 | 3 | 4 | 5 | 6 | 7 | 8 | ||
|---|---|---|---|---|---|---|---|---|---|
| 1 | Gender | 1 | |||||||
| 2 | PT frequency leisure | 0.073 | 1 | ||||||
| 3 | Micromobility use | −0.038 | 0.021 | 1 | |||||
| 4 | Remote work | −0.017 | −0.181 ** | 0.038 | 1 | ||||
| 5 | Stress diffusion | 0.002 | −0.065 | −0.015 | 0.266 ** | 1 | |||
| 6 | Anxiety diffusion | −0.053 | −0.051 | 0.030 | 0.165 ** | 0.085 | 1 | ||
| 7 | Walking shift | 0.113 * | −0.047 | −0.007 | 0.125 ** | 0.165 ** | −0.110 * | 1 | |
| 8 | Cycling shift | −0.045 | −0.127 ** | 0.067 | 0.111 * | 0.070 | 0.001 | −0.001 | 1 |
| Estimate | Std. Error | Wald | df 2 | Sig. | 95% Confidence Interval | |||
|---|---|---|---|---|---|---|---|---|
| Lower Bound | Upper Bound | |||||||
| Threshold | walking shift = 0 | −0.590 | 0.201 | 8.624 | 1 | 0.003 | −0.983 | −0.196 |
| = 1 | 0.138 | 0.199 | 0.480 | 1 | 0.488 | −0.252 | 0.527 | |
| Location | gender = male | −0.384 | 0.189 | 4.144 | 1 | 0.042 | −0.754 | −0.014 |
| = female 1 | 0 | 0 | ||||||
| stress diffusion = 1 | −21.359 | 0.000 | 1 | −21.359 | −21.359 | |||
| = 2 | −0.194 | 0.638 | 0.093 | 1 | 0.761 | −1.445 | 1.056 | |
| = 3 | −1.154 | 0.271 | 18.199 | 1 | 0.000 | −1.685 | −0.624 | |
| = 4 | −0.308 | 0.208 | 2.183 | 1 | 0.140 | −0.716 | 0.101 | |
| = 5 1 | 0 | 0 | ||||||
| anxiety diffusion = 1 | 2.186 | 1.144 | 3.656 | 1 | 0.056 | −0.055 | 4.428 | |
| = 2 | 0.222 | 0.397 | 0.314 | 1 | 0.575 | −0.556 | 1.001 | |
| = 3 | 0.671 | 0.260 | 6.647 | 1 | 0.010 | 0.161 | 1.182 | |
| = 4 | 0.535 | 0.221 | 5.879 | 1 | 0.015 | 0.103 | 0.968 | |
| = 5 1 | 0 | 0 | ||||||
| Link function: Logit | ||||||||
| Model Fitting Information | ||||
| Model | −2 Log-Likelihood | Chi-Square | df | Sig. |
| Intercept Only | 223.846 | |||
| Final | 185.785 | 38.061 | 9 | 0.000 |
| Goodness-of-Fit | ||||
| Chi-Square | df 1 | Sig. | ||
| Pearson | 72.413 | 61 | 0.150 | |
| Deviance | 72.027 | 61 | 0.158 | |
| Pseudo R-Square | ||||
| Cox and Snell | 0.085 | |||
| Nagelkerke | 0.097 | |||
| McFadden | 0.043 | |||
| Test of Parallel Lines | ||||
| Model | −2 Log-Likelihood | Chi-Square | df | Sig. |
| Null Hypothesis | 185.785 | |||
| General | 176.911 | 8.875 | 9 | 0.449 |
| Predicted | Observed | |||
|---|---|---|---|---|
| Yes, Increasing | No, I Think that It Does not Change | Yes, Decreasing | Total | |
| Yes Increasing | 103 | 31 | 60 | 194 |
| Yes Decreasing | 72 | 41 | 124 | 237 |
| Total | 175 | 72 | 184 | 431 |
| Initial Values | Final Values |
|---|---|
| Completely disagree | Yes, decreasing |
| Disagree | |
| Neutral | No, I think that it does not change |
| Agree | Yes, increasing |
| Totally agree |
| Estimate | Std. Error | Wald | df 2 | Sig. | 95% Confidence Interval | |||
|---|---|---|---|---|---|---|---|---|
| Lower Bound | Upper Bound | |||||||
| Threshold | cycling shift = 0 | 1.016 | 0.348 | 8.538 | 1 | 0.003 | 0.334 | 1.697 |
| = 1 | 2.593 | 0.371 | 48.928 | 1 | 0.000 | 1.867 | 3.320 | |
| Location | PT frequency leisure = 0 | −1.551 | 0.805 | 3.714 | 1 | 0.054 | −3.128 | 0.026 |
| = 1 | −0.919 | 1.353 | 0.461 | 1 | 0.497 | −3.570 | 1.732 | |
| = 2 | −0.313 | 0.278 | 1.266 | 1 | 0.261 | −0.858 | 0.232 | |
| = 3 | 0.375 | 0.270 | 1.934 | 1 | 0.164 | −0.154 | 0.904 | |
| = 4 1 | 0 | 0 | ||||||
| micromobility use = 1 | 0.350 | 0.493 | 0.503 | 1 | 0.478 | −0.616 | 1.316 | |
| = 2 | 1.034 | 0.338 | 9.374 | 1 | 0.002 | 0.372 | 1.696 | |
| = 3 | 0.511 | 0.332 | 2.378 | 1 | 0.123 | −0.139 | 1.161 | |
| = 4 | 0.388 | 0.332 | 1.360 | 1 | 0.243 | −0.264 | 1.039 | |
| = 5 1 | 0 | 0 | ||||||
| remote working = 1 | −18.754 | 0.000 | 1 | −18.754 | −18.754 | |||
| = 2 | 0.653 | 1.163 | 0.315 | 1 | 0.574 | −1.626 | 2.932 | |
| = 3 | 1.441 | 0.457 | 9.943 | 1 | 0.002 | 0.545 | 2.337 | |
| = 4 | 0.243 | 0.422 | 0.331 | 1 | 0.565 | −0.585 | 1.071 | |
| = 5 1 | 0 | 0 | ||||||
| Link function: Logit | ||||||||
| Model Fitting Information | ||||
| Model | −2 Log-Likelihood | Chi-Square | df | Sig. |
| Intercept Only | 222.466 | |||
| Final | 181.283 | 41.183 | 12 | 0.000 |
| Goodness-of-Fit | ||||
| Chi-Square | df | Sig. | ||
| Pearson | 82.903 | 74 | 0.224 | |
| Deviance | 82.485 | 74 | 0.234 | |
| Pseudo R-Square | ||||
| Cox and Snell | 0.091 | |||
| Nagelkerke | 0.109 | |||
| McFadden | 0.052 | |||
| Test of Parallel Lines | ||||
| Model | −2 Log-Likelihood | Chi-Square | df | Sig. |
| Null Hypothesis | 181.283 | |||
| General | 170.918 | 10.365 | 12 | 0.584 |
| Predicted | Observed | |||
|---|---|---|---|---|
| Yes, Increasing | No, I Think That It Does Not Change | Yes, Decreasing | Total | |
| Yes, Increasing | 258 | 108 | 45 | 411 |
| No, I Think that it Does not Change | 2 | 0 | 2 | 4 |
| Yes, Decreasing | 4 | 4 | 8 | 16 |
| Total | 264 | 112 | 55 | 431 |
| Variables | Intervals | Odds Ratios |
|---|---|---|
| Gender | Male Female (Reference category) | 1.468 |
| Stress diffusion | Neutral Totally agree (Reference category) | 3.171 |
| Anxiety diffusion | Completely disagree Totally agree (Reference category) | 8.900 |
| Neutral Totally agree (Reference category) | 1.956 | |
| Agree Totally agree (Reference category) | 1.707 |
| Variables | Intervals | Odds Ratios |
|---|---|---|
| PT frequency leisure | >3 times/day Never (Reference category) | 4.716 |
| Micromobility use | Disagree Totally agree (Reference category) | 2.812 |
| Remote working | Neutral Totally agree (Reference category) | 4.225 |
Publisher’s Note: MDPI stays neutral with regard to jurisdictional claims in published maps and institutional affiliations. |
© 2020 by the authors. Licensee MDPI, Basel, Switzerland. This article is an open access article distributed under the terms and conditions of the Creative Commons Attribution (CC BY) license (http://creativecommons.org/licenses/by/4.0/).
Share and Cite
Campisi, T.; Basbas, S.; Skoufas, A.; Akgün, N.; Ticali, D.; Tesoriere, G. The Impact of COVID-19 Pandemic on the Resilience of Sustainable Mobility in Sicily. Sustainability 2020, 12, 8829. https://0-doi-org.brum.beds.ac.uk/10.3390/su12218829
Campisi T, Basbas S, Skoufas A, Akgün N, Ticali D, Tesoriere G. The Impact of COVID-19 Pandemic on the Resilience of Sustainable Mobility in Sicily. Sustainability. 2020; 12(21):8829. https://0-doi-org.brum.beds.ac.uk/10.3390/su12218829
Chicago/Turabian StyleCampisi, Tiziana, Socrates Basbas, Anastasios Skoufas, Nurten Akgün, Dario Ticali, and Giovanni Tesoriere. 2020. "The Impact of COVID-19 Pandemic on the Resilience of Sustainable Mobility in Sicily" Sustainability 12, no. 21: 8829. https://0-doi-org.brum.beds.ac.uk/10.3390/su12218829