Changes in Air Quality during the First-Level Response to the Covid-19 Pandemic in Shanghai Municipality, China


Abstract
:1. Introduction
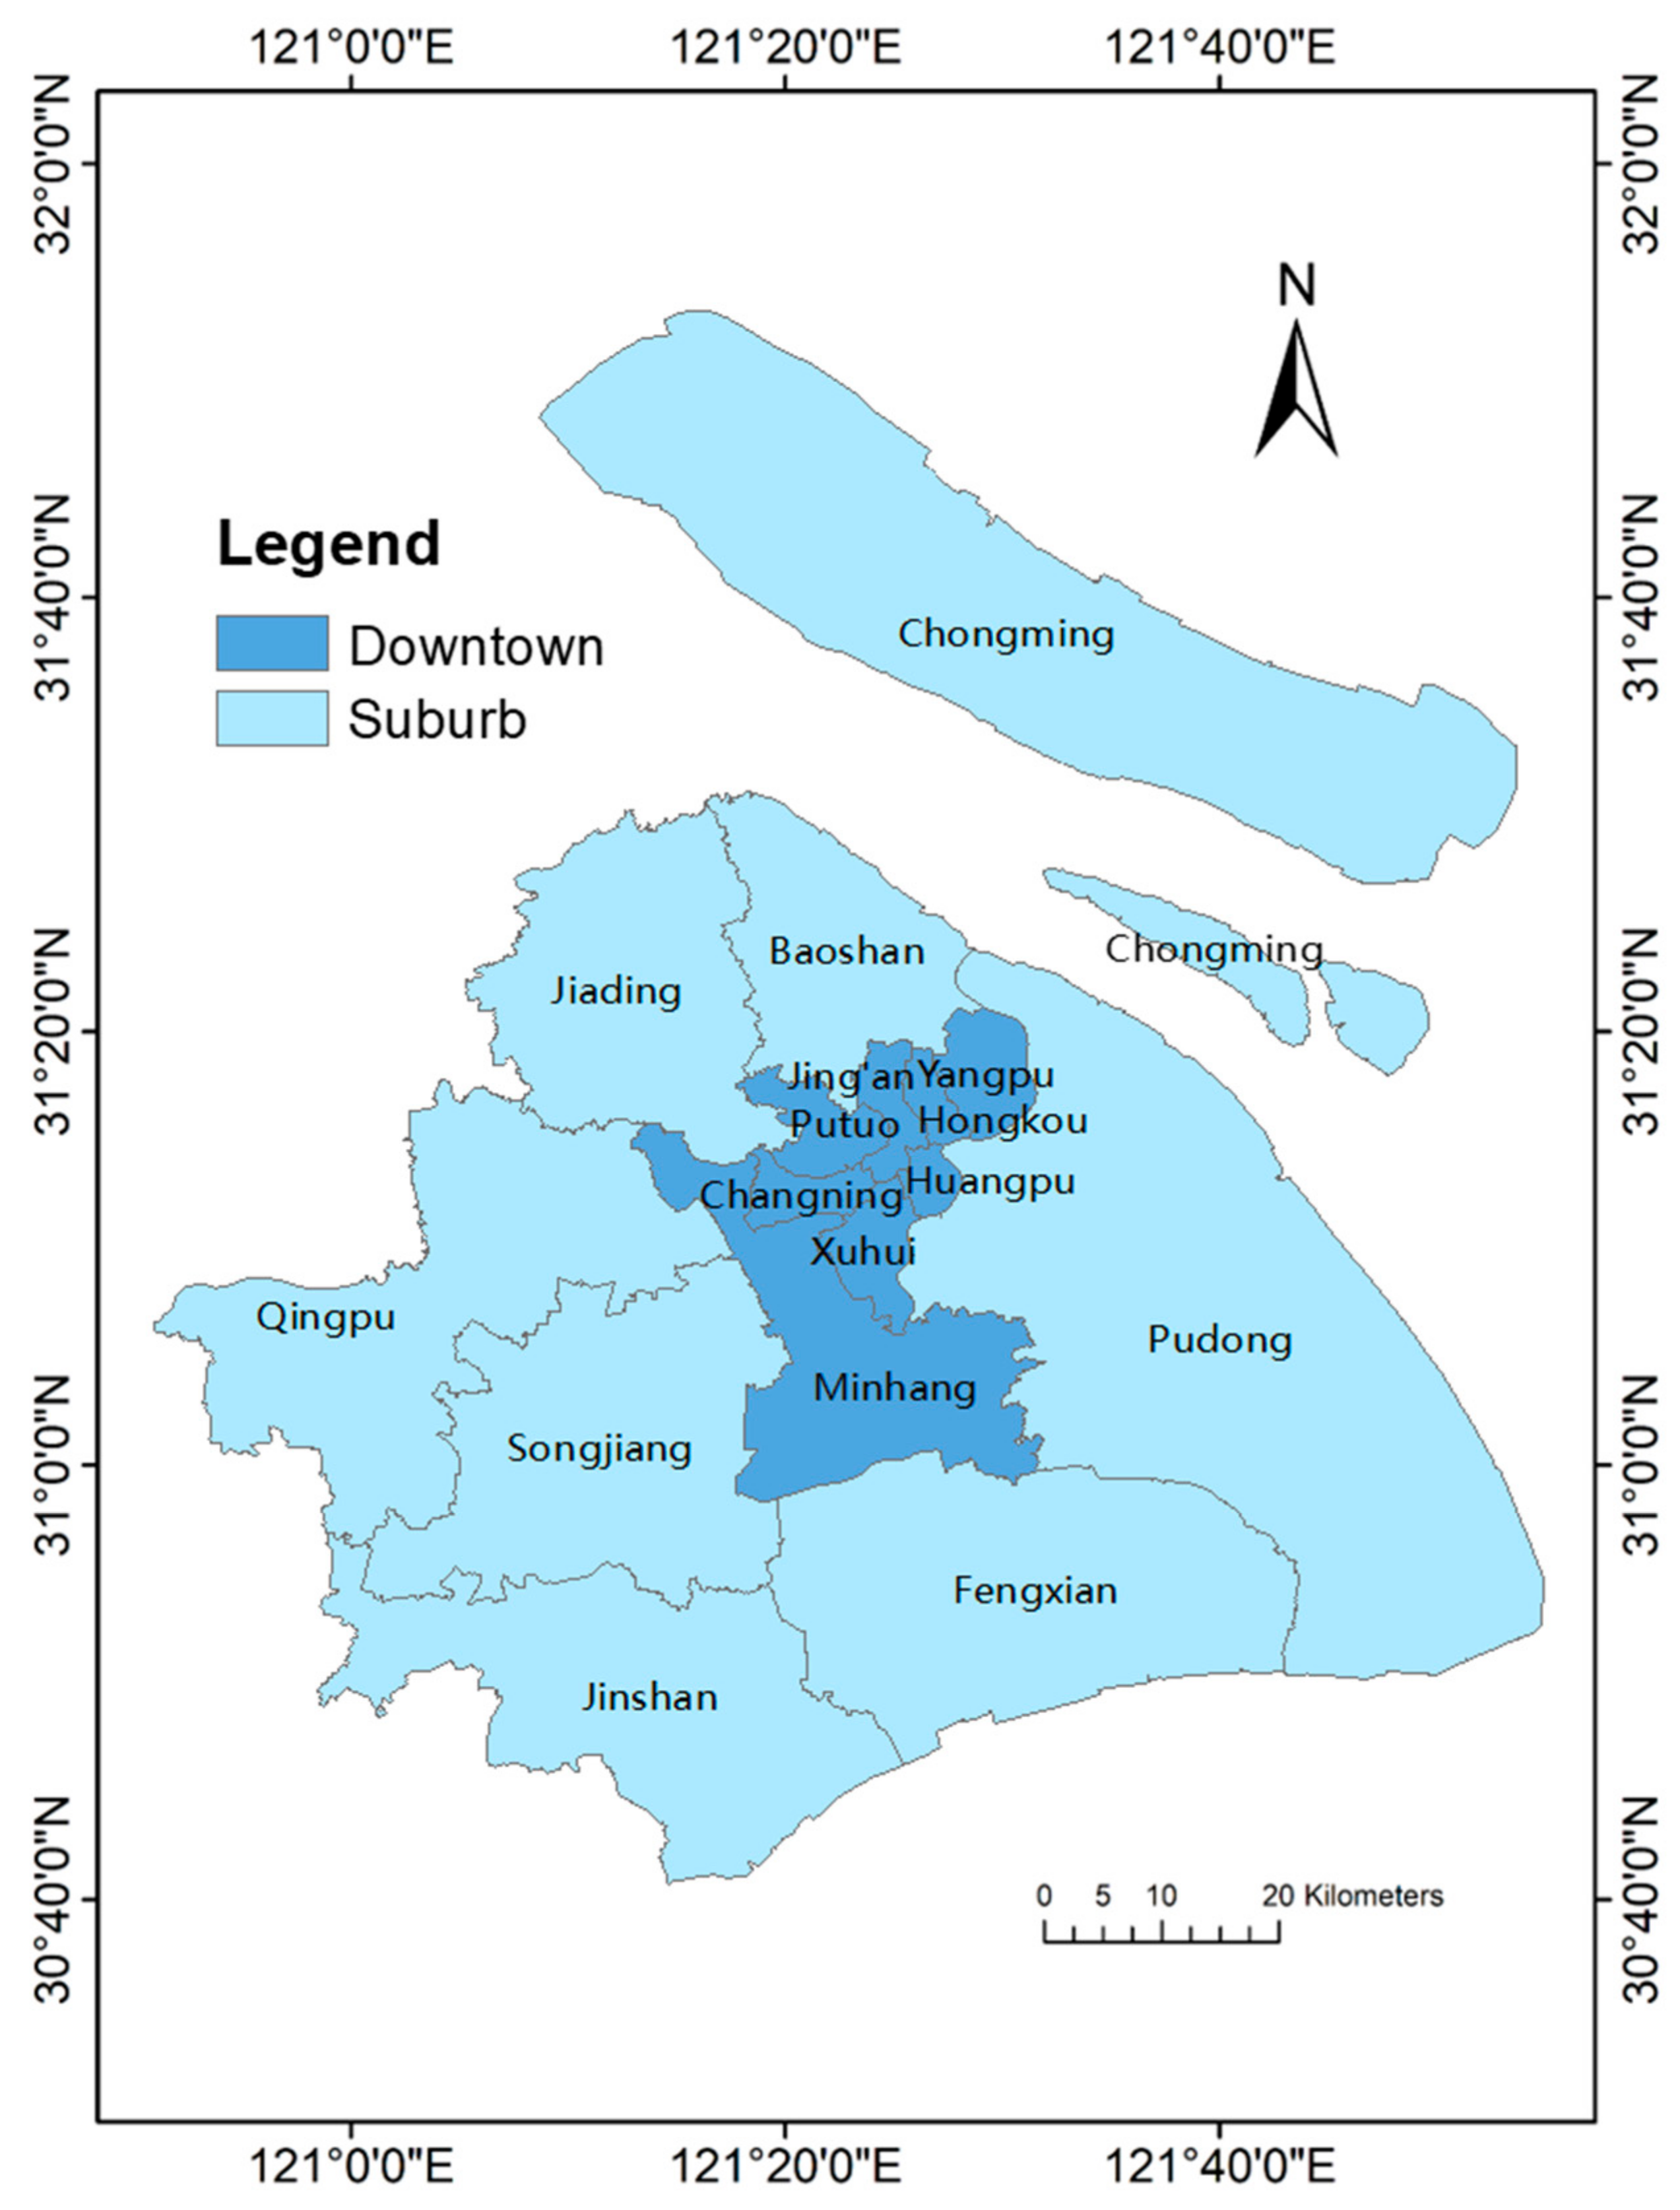
2. Study Area
3. Methods
3.1. Selection of Air Quality Indicators
3.2. Data Collection
3.3. Data Processing and Comparison
4. Results
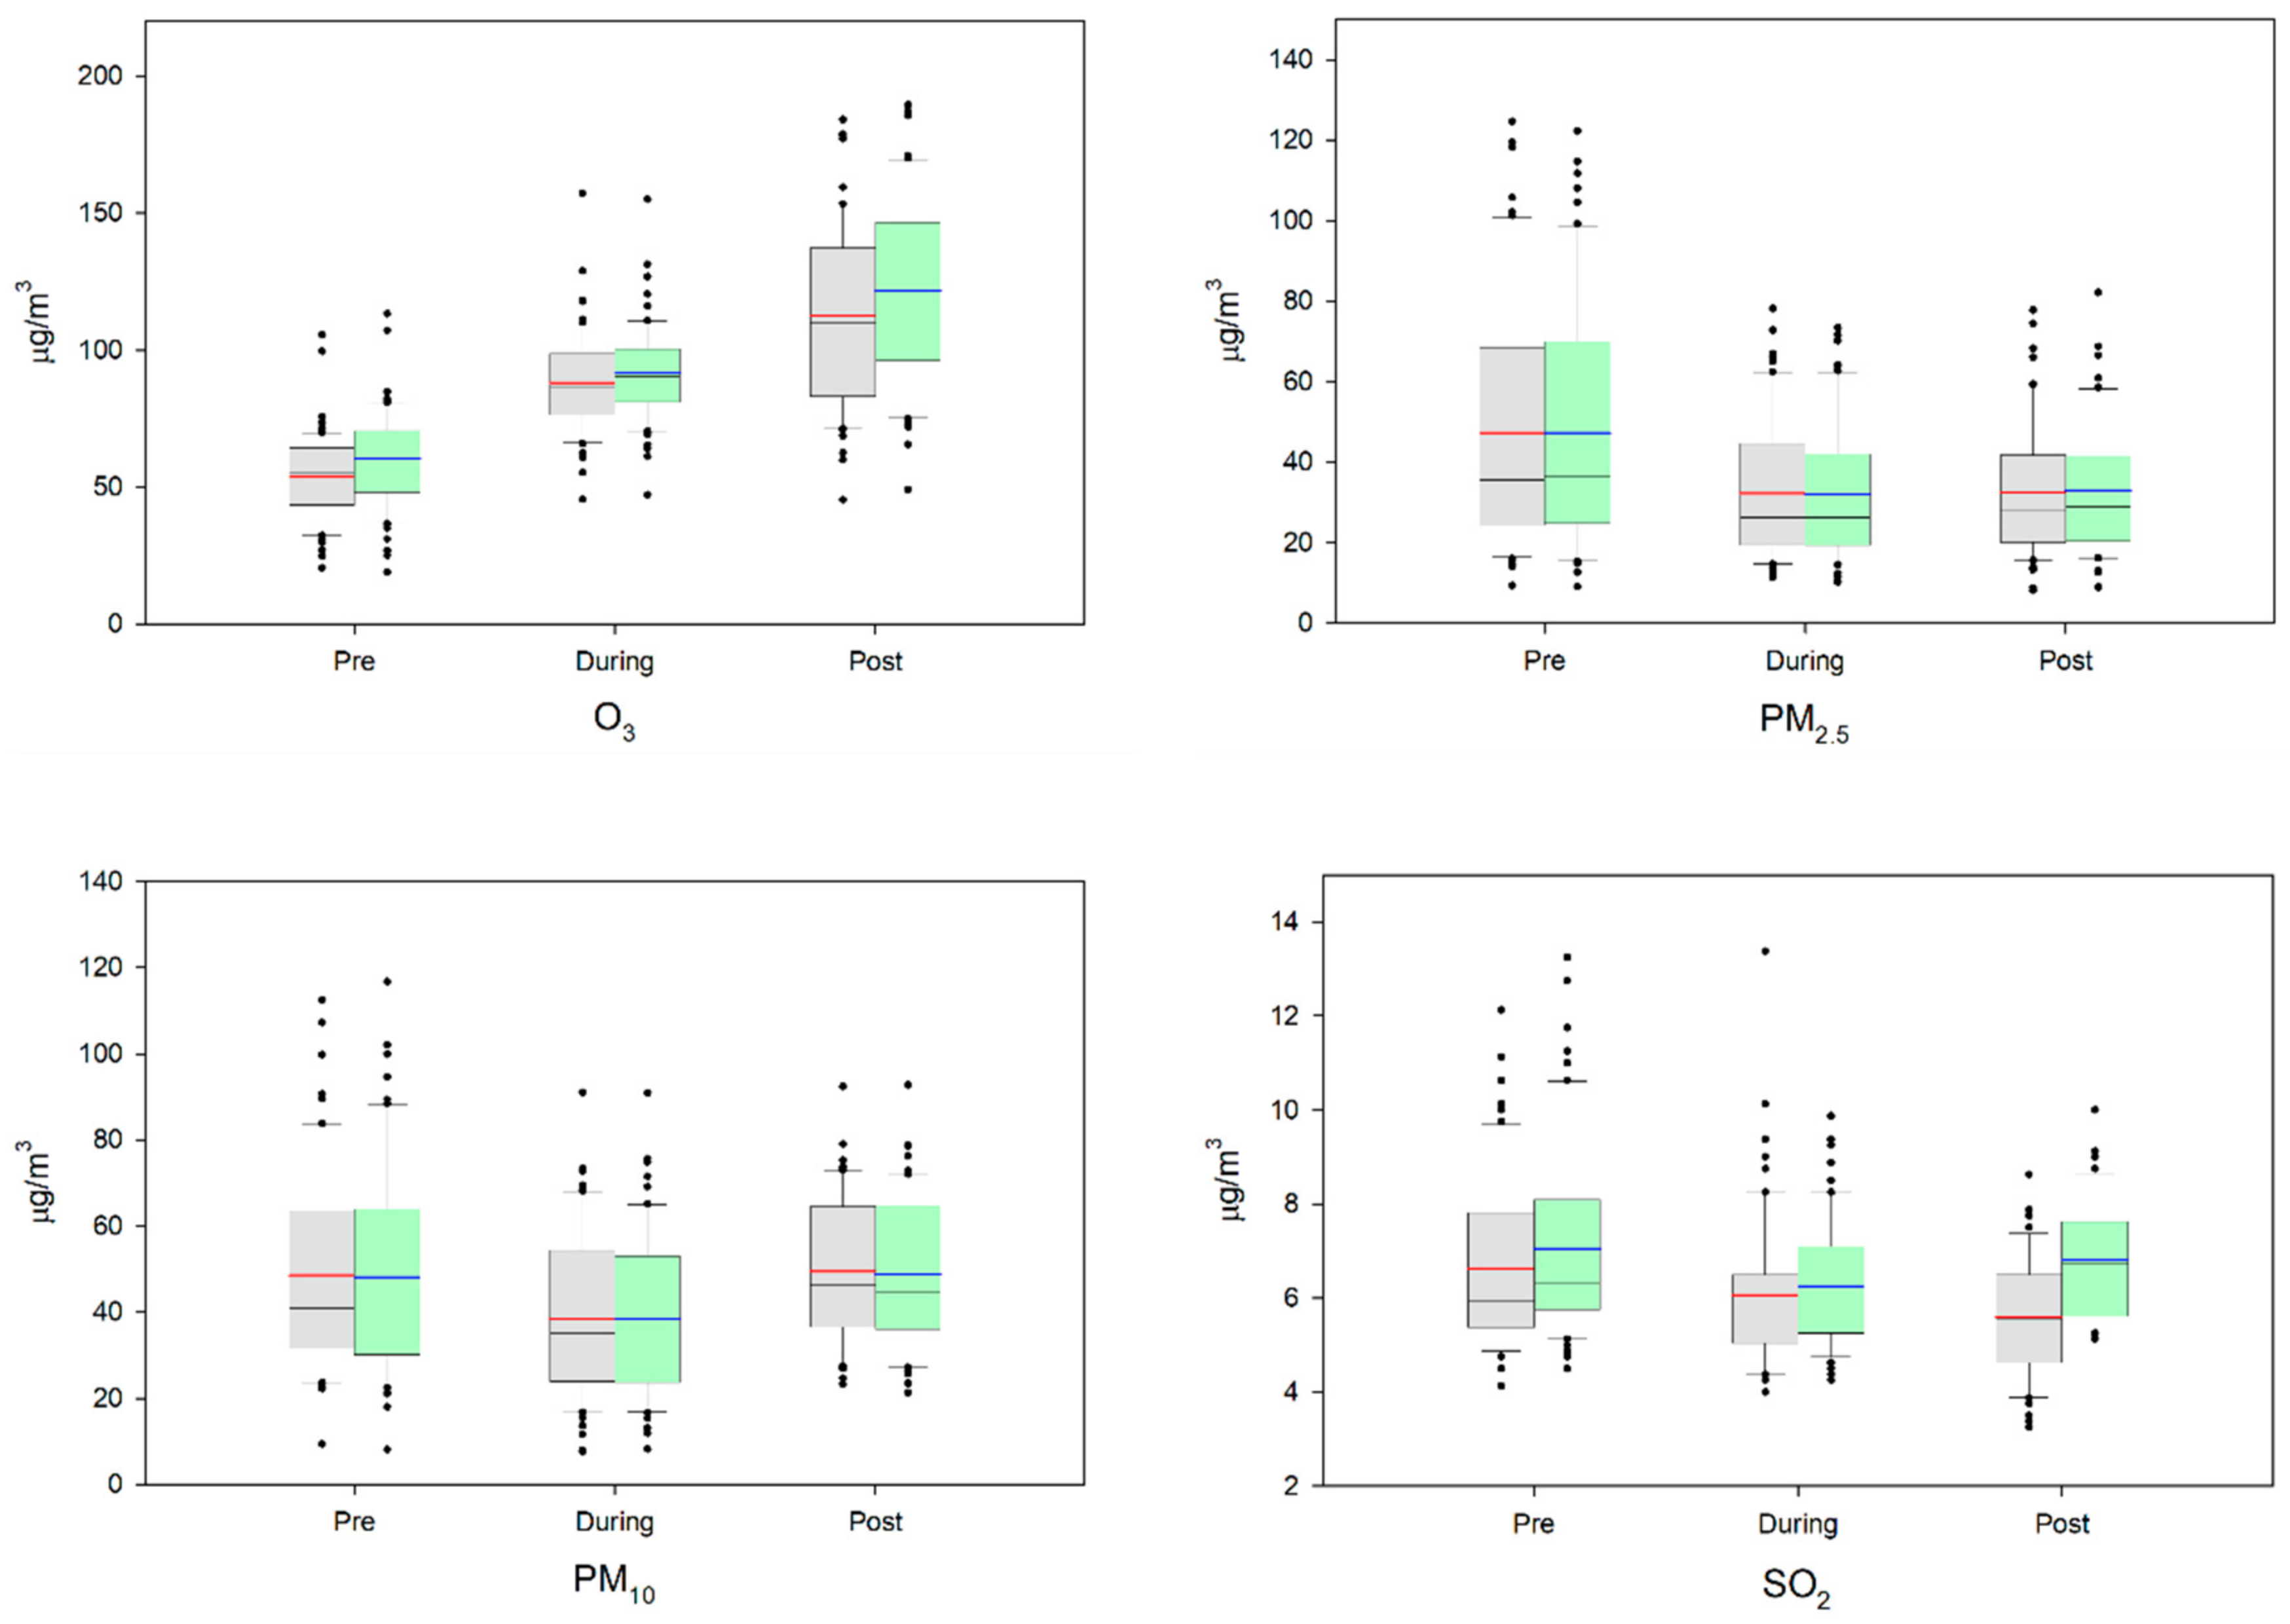
4.1. Differences in Pollutant Concentrations in the Pre-, During-, and Post-FLR Periods
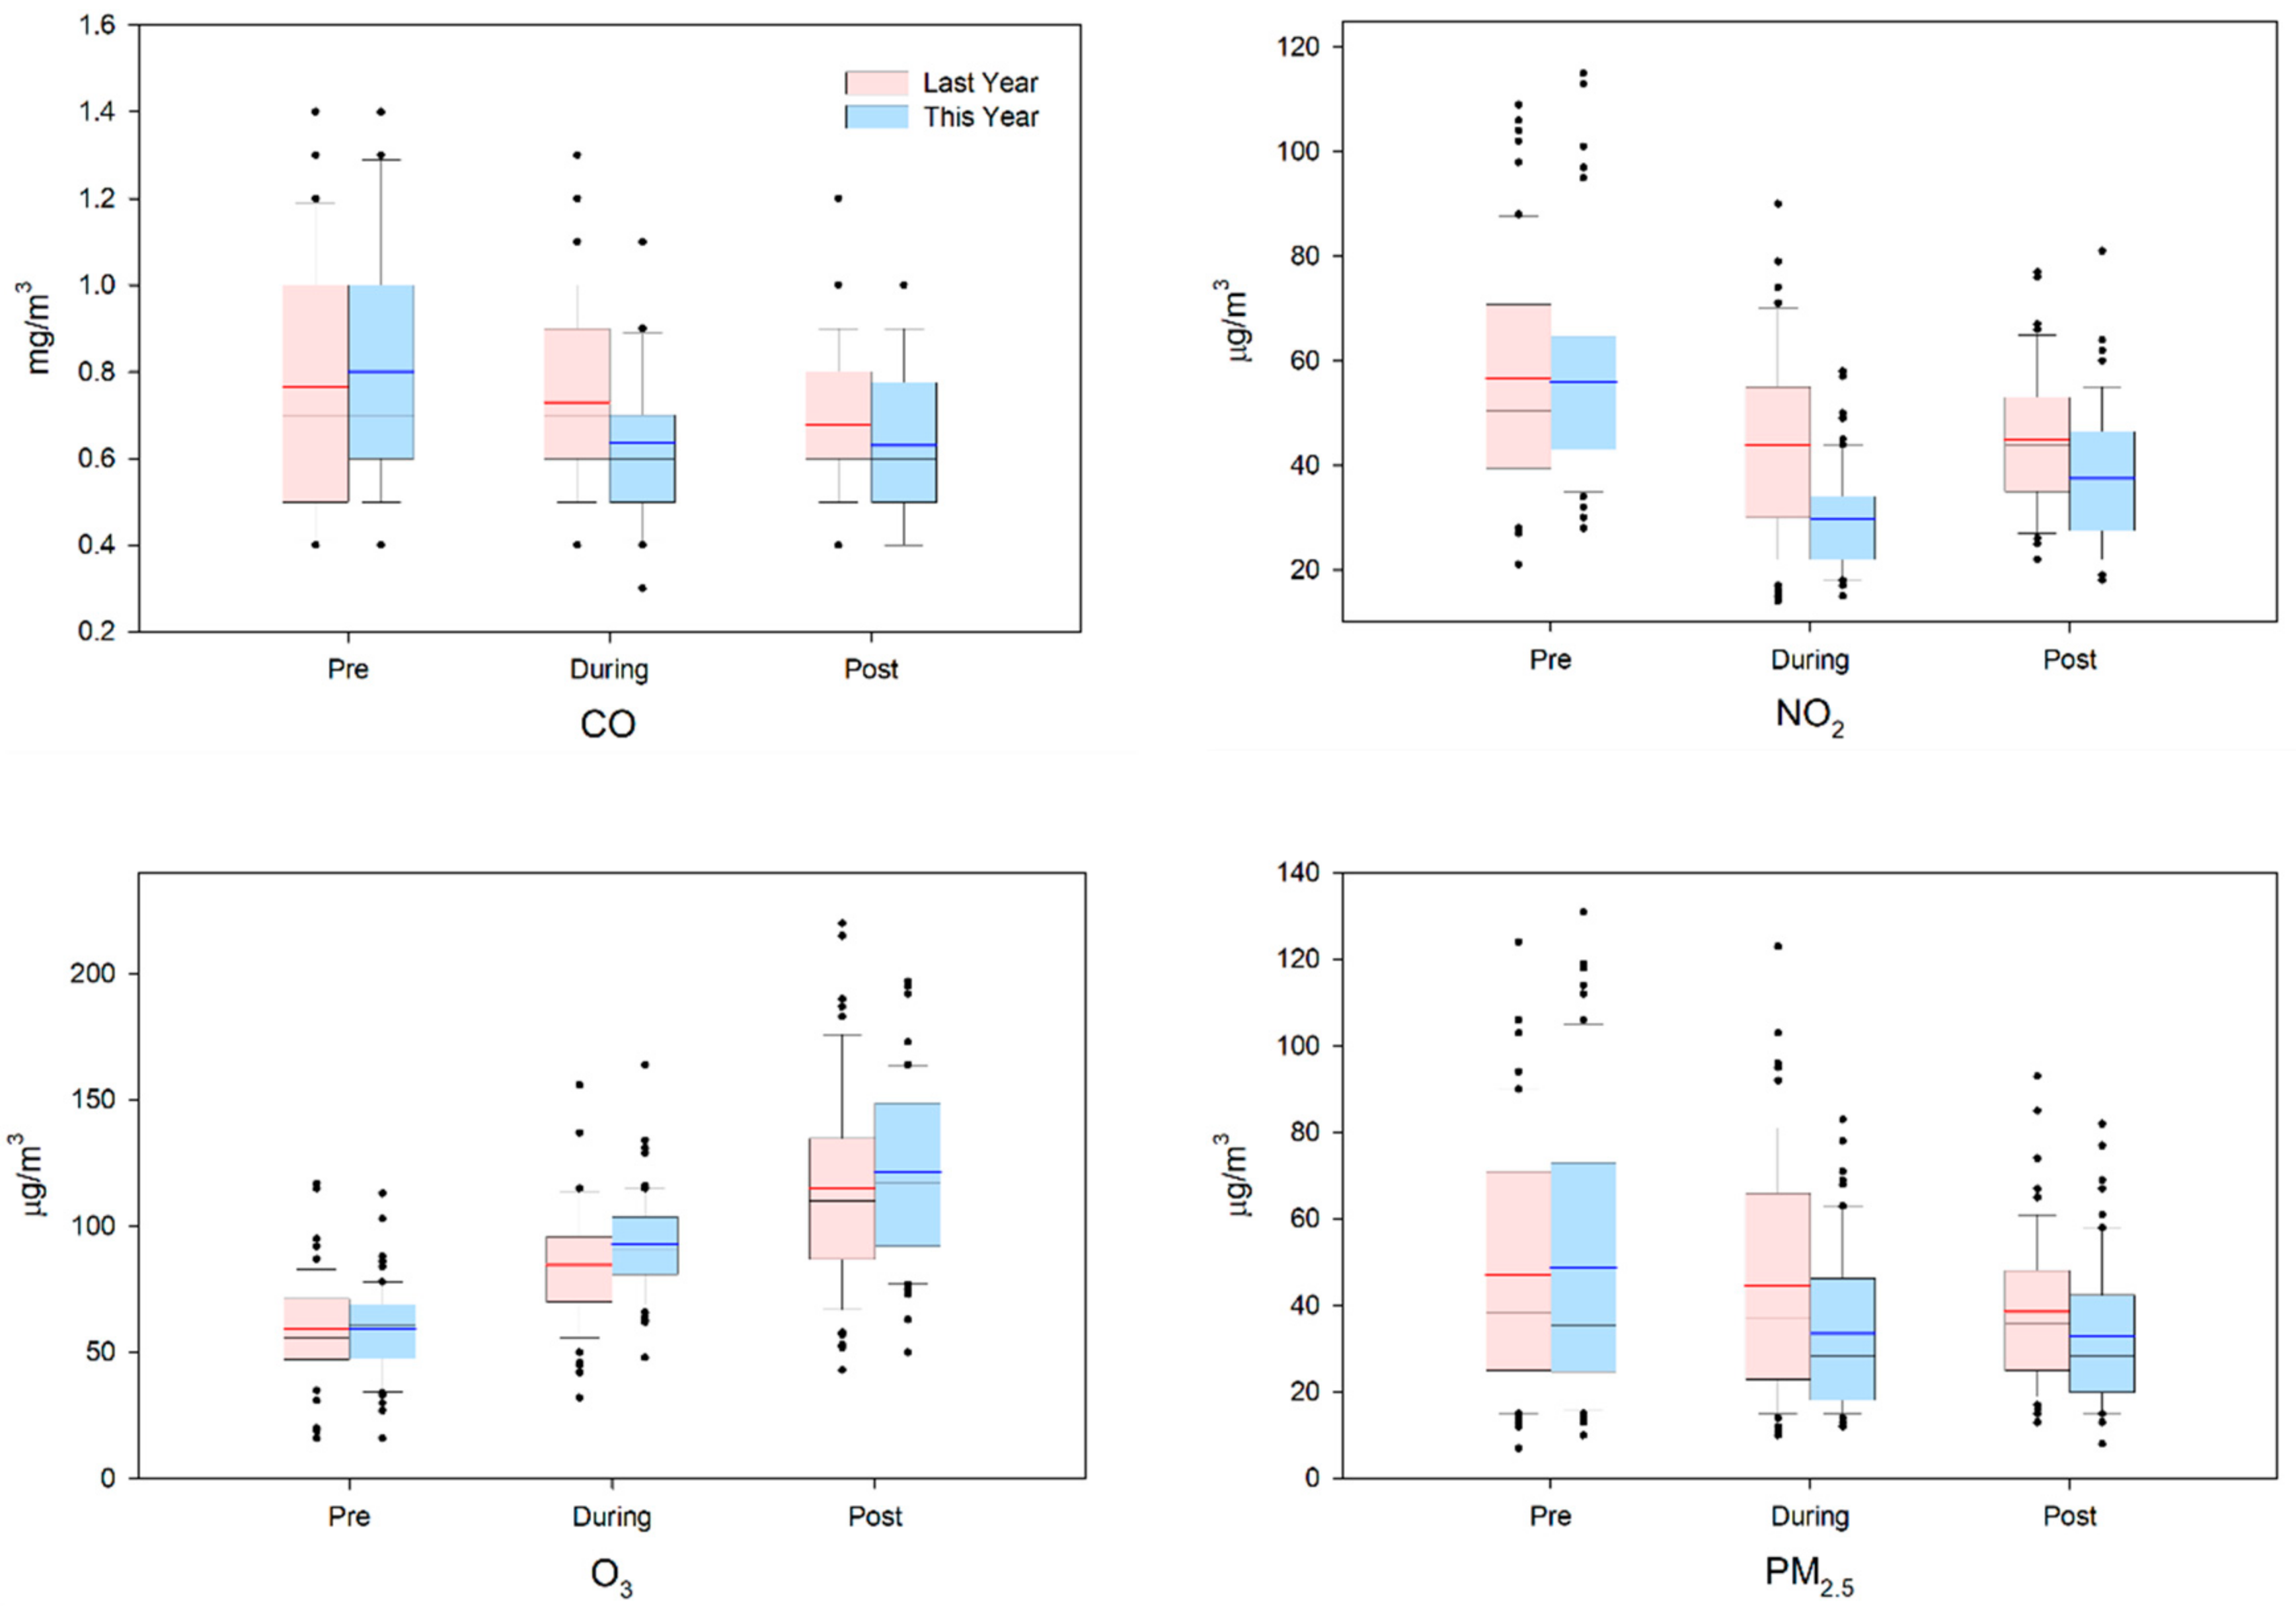
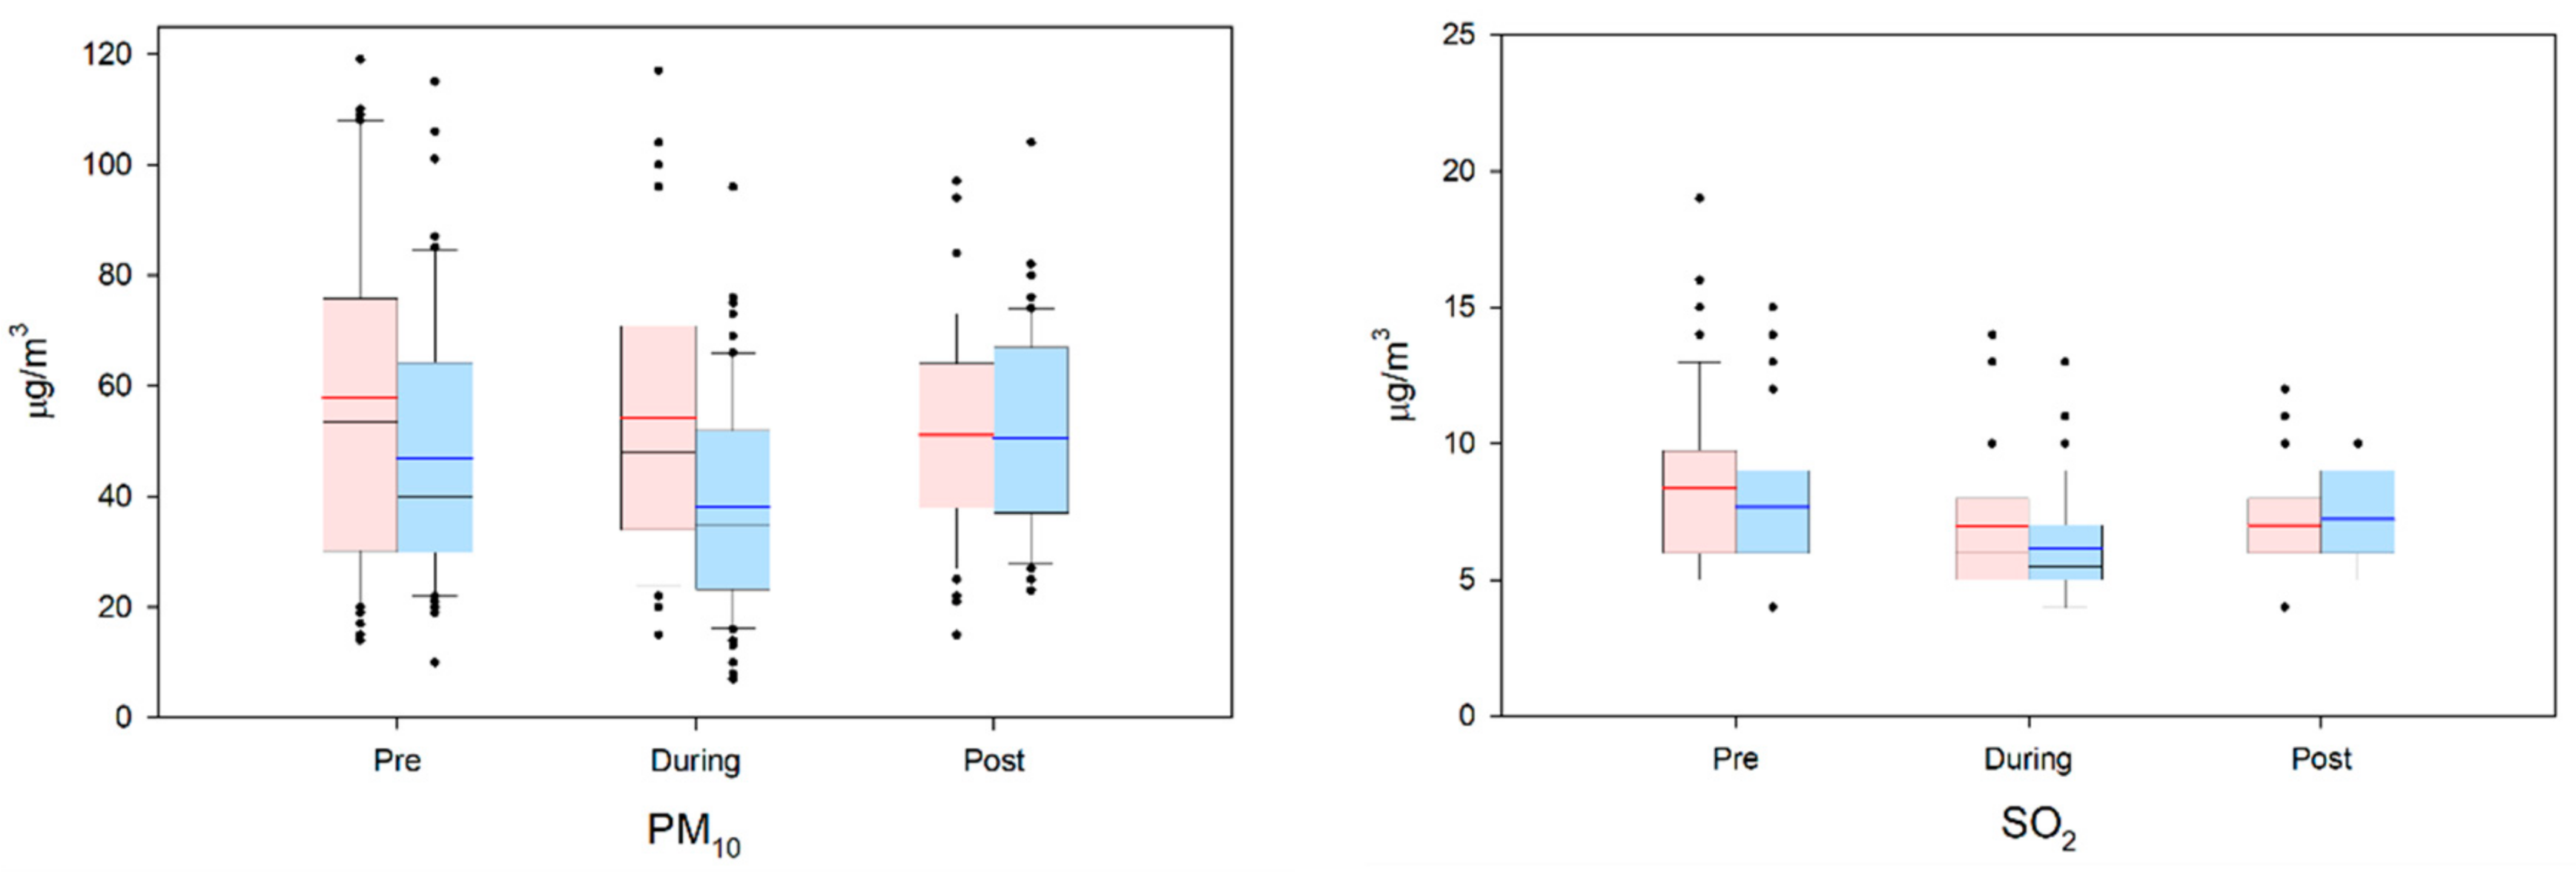
4.2. Differences Compared with Previous Year
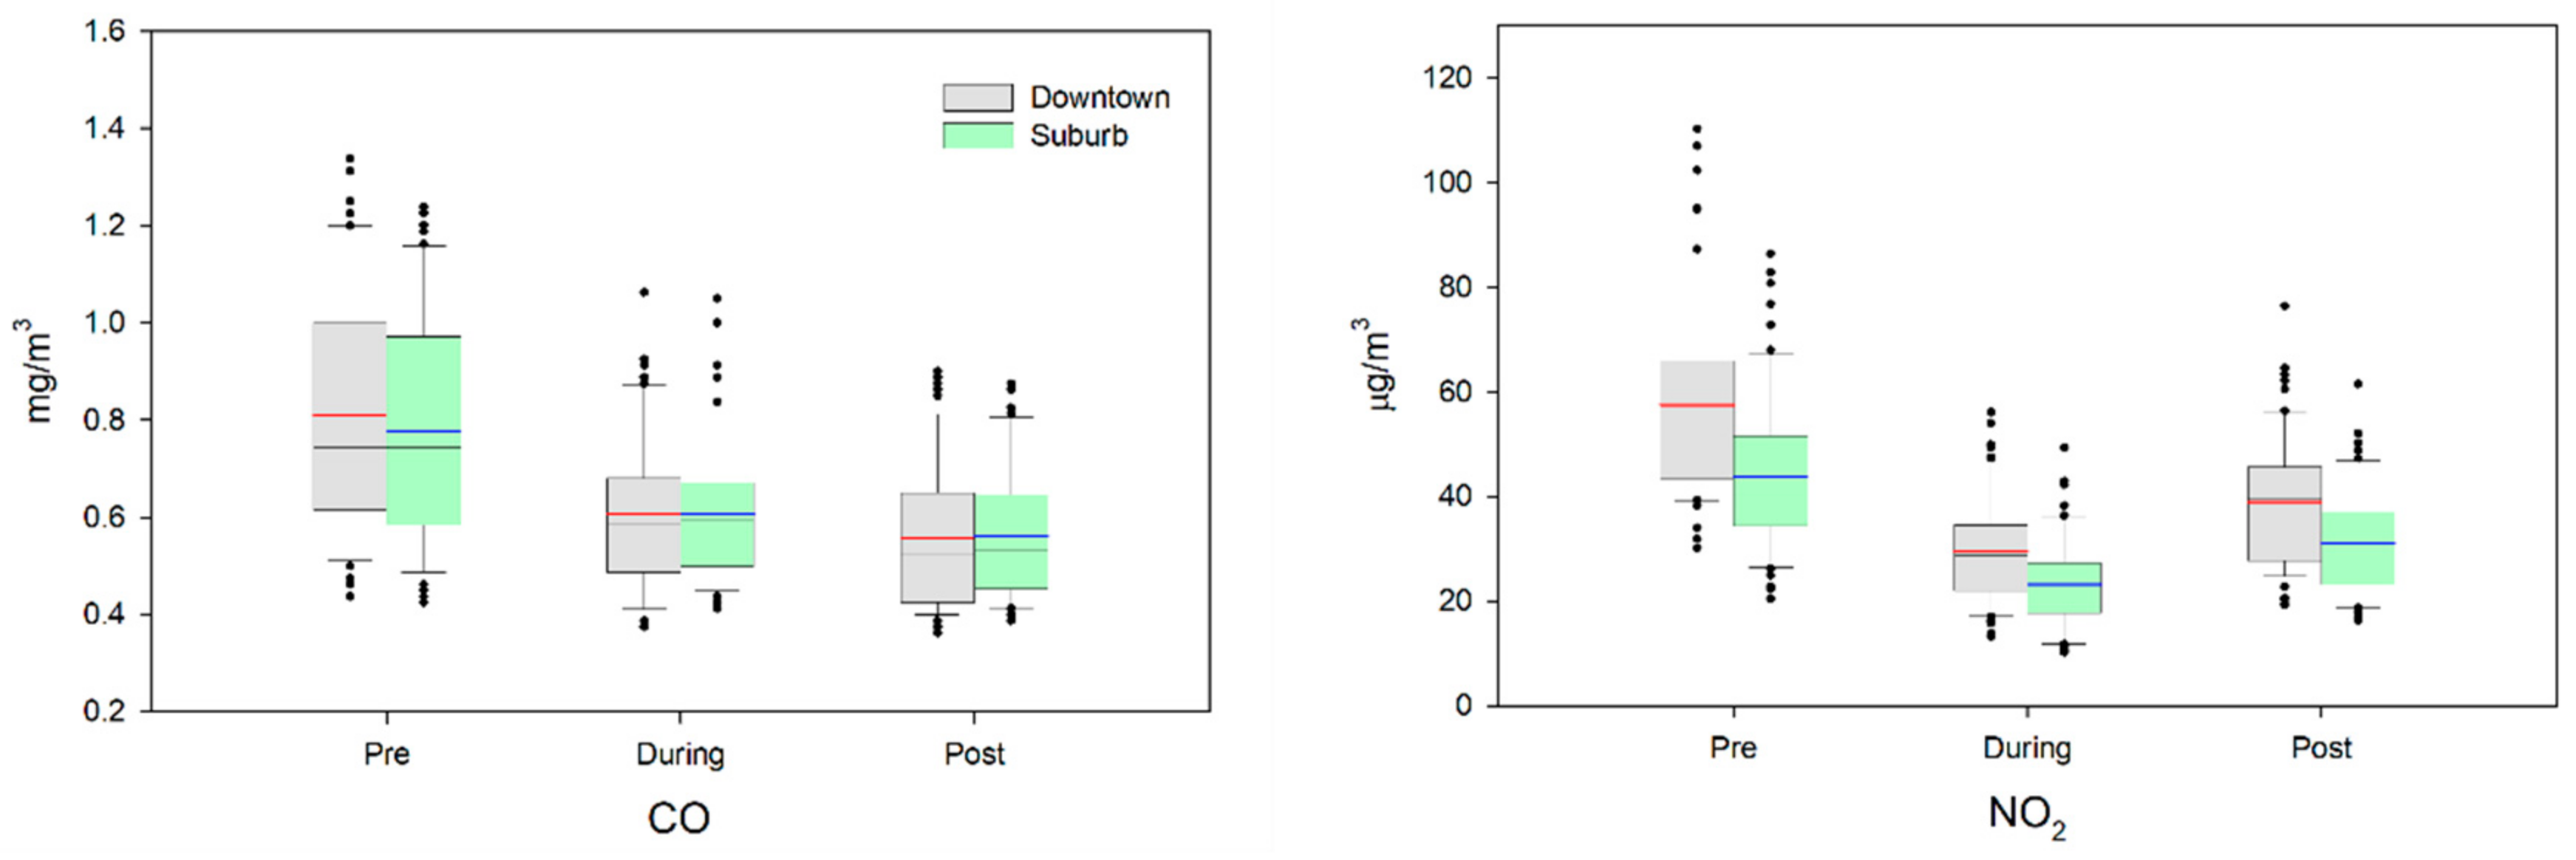
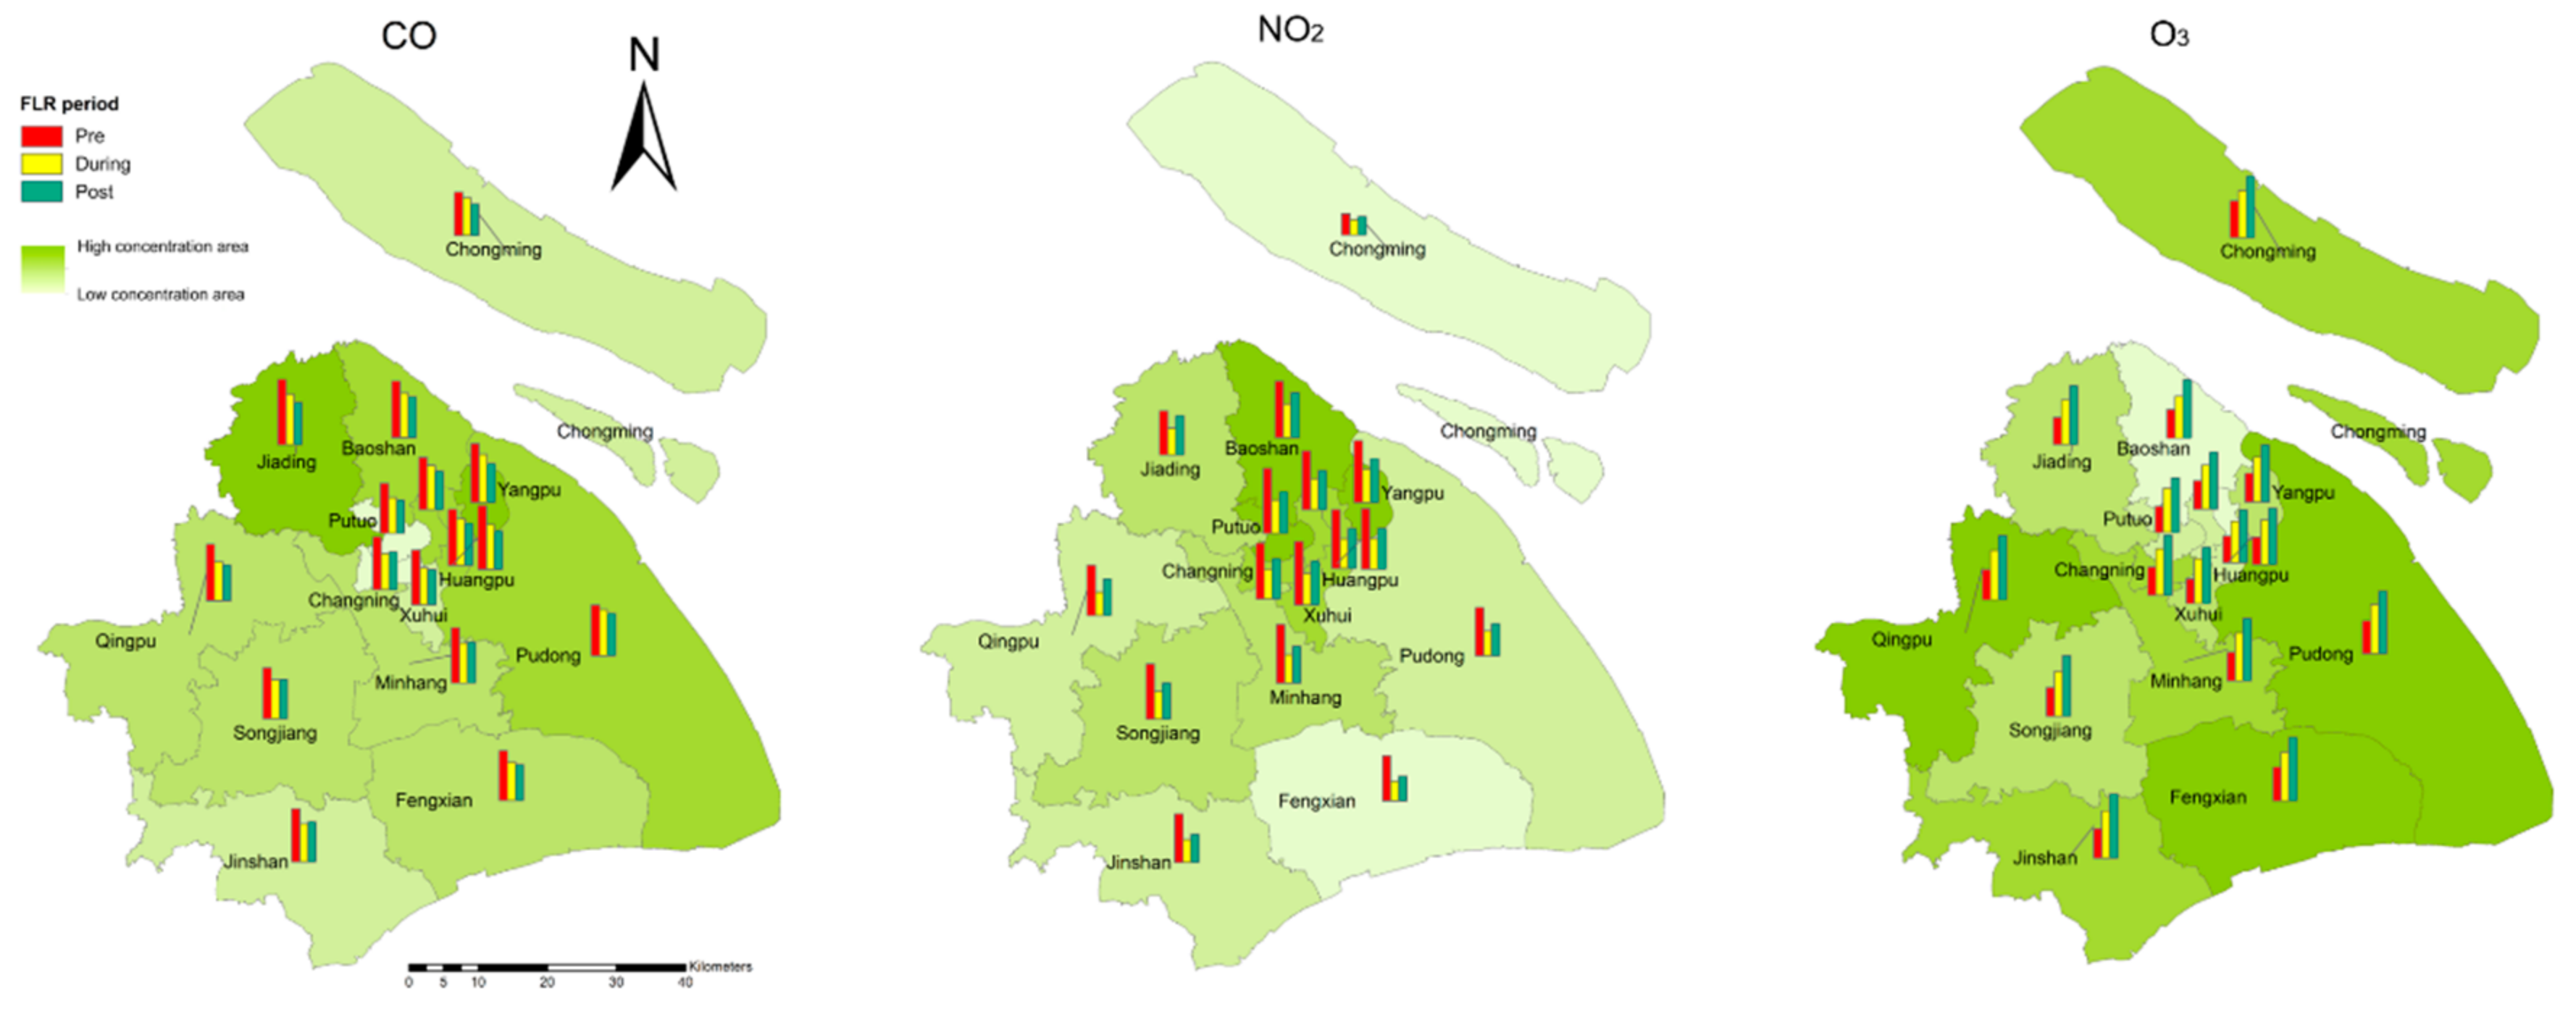
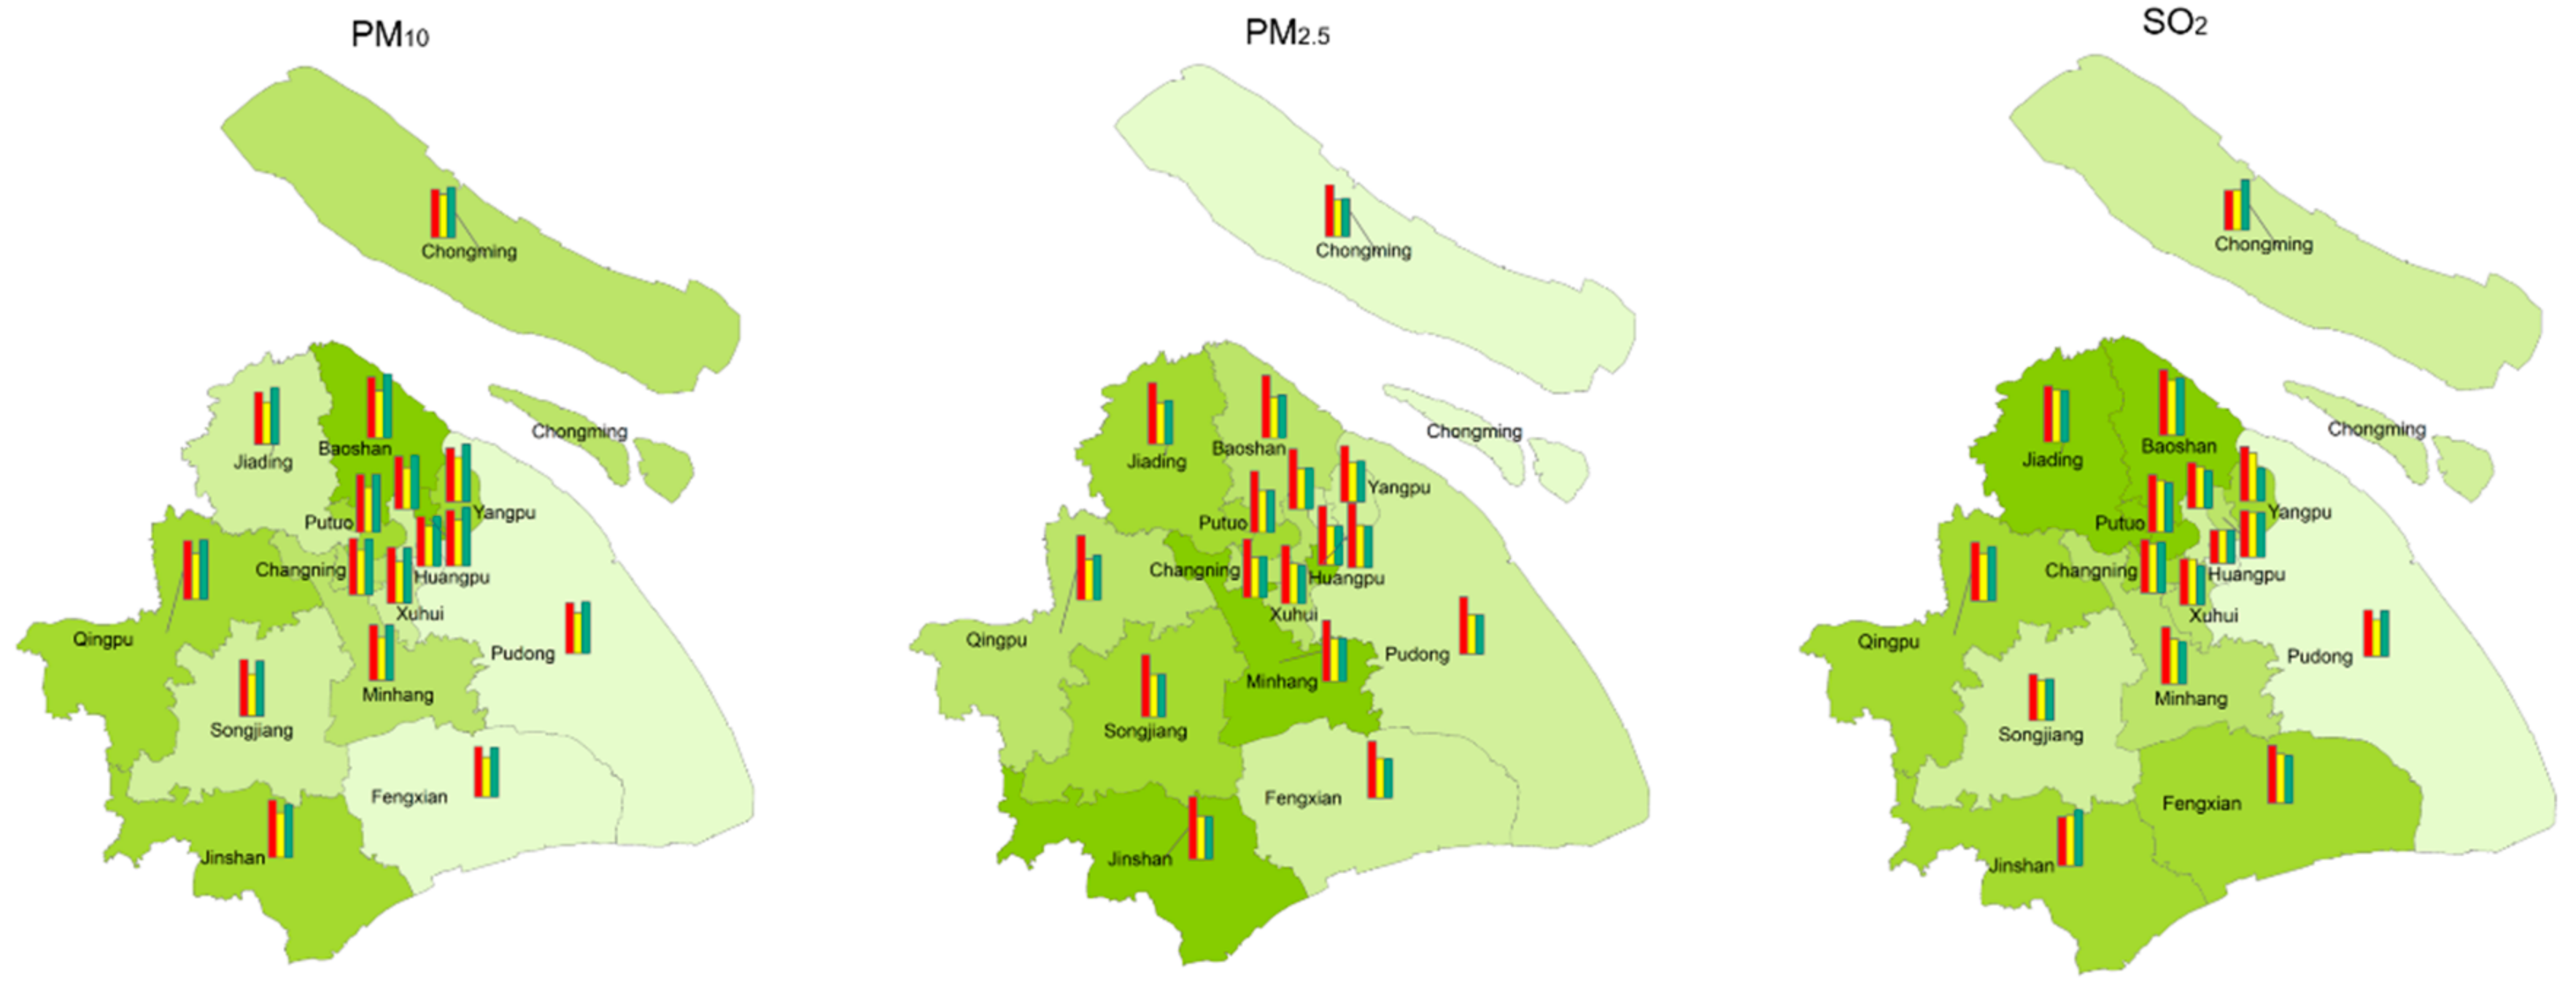
4.3. Differences between Downtown and Suburbs
5. Discussion
5.1. Variation and Driving Factors
5.2. Management Implications
5.3. Strengths and Limitations
6. Conclusions
Supplementary Materials
Author Contributions
Funding
Conflicts of Interest
References
- Li, J.; Fang, W.; Wang, T.; Qureshi, S.; Alatalo, J.M.; Bai, Y. Correlations between Socioeconomic Drivers and Indicators of Urban Expansion: Evidence from the Heavily Urbanised Shanghai Metropolitan Area, China. Sustainability 2017, 9, 1199. [Google Scholar] [CrossRef] [Green Version]
- Mahato, S.; Pal, S.; Ghosh, K.G. Effect of lockdown amid COVID-19 pandemic on air quality of the megacity Delhi, India. Sci. Total. Environ. 2020, 730, 139086. [Google Scholar] [CrossRef] [PubMed]
- Franco, J.F.; Gidhagen, L.; Morales, R.; Behrentz, E. Towards a better understanding of urban air quality management capabilities in Latin America. Environ. Sci. Policy 2019, 102, 43–53. [Google Scholar] [CrossRef]
- Zhou, Z.; Chen, Y.; Song, P.; Ding, T. China’s urban air quality evaluation with streaming data: A DEA window analysis. Sci. Total Environ. 2020, 727, 138213. [Google Scholar] [CrossRef]
- Goyal, P. Present scenario of air quality in Delhi: A case study of CNG implementation. Atmos. Environ. 2003, 37, 5423–5431. [Google Scholar] [CrossRef]
- Gulia, S.; Mittal, A.; Khare, M. Quantitative evaluation of source interventions for urban air quality improvement—A case study of Delhi city. Atmos. Pollut. Res. 2018, 9, 577–583. [Google Scholar] [CrossRef]
- Kerimray, A.; Baimatova, N.; Ibragimova, O.P.; Bukenov, B.; Kenessov, B.; Plotitsyn, P.; Karaca, F. Assessing air quality changes in large cities during COVID-19 lockdowns: The impacts of traffic-free urban conditions in Almaty, Kazakhstan. Sci. Total. Environ. 2020, 730, 139179. [Google Scholar] [CrossRef]
- Collivignarelli, M.C.; Abbà, A.; Bertanza, G.; Pedrazzani, R.; Ricciardi, P.; Miino, M.C. Lockdown for CoViD-2019 in Milan: What are the effects on air quality? Sci. Total. Environ. 2020, 732, 139280. [Google Scholar] [CrossRef]
- Wang, Q.; Su, M. A preliminary assessment of the impact of COVID-19 on environment—A case study of China. Sci. Total. Environ. 2020, 728, 138915. [Google Scholar] [CrossRef]
- Tobías, A.; Carnerero, C.; Reche, C.; Massagué, J.; Via, M.; Minguillón, M.C.; Alastuey, A.; Querol, X. Changes in air quality during the lockdown in Barcelona (Spain) one month into the SARS-CoV-2 epidemic. Sci. Total. Environ. 2020, 726, 138540. [Google Scholar] [CrossRef]
- Statistical Bulletin of Shanghai Municipality on National Economic and Social Development (SBS). Shanghai Bureau of Statistics. 2019. Available online: http://tjj.sh.gov.cn (accessed on 9 March 2020).
- Chen, J.; Jiang, B.; Bai, Y.; Xu, X.; Alatalo, J.M. Quantifying ecosystem services supply and demand shortfalls and mismatches for management optimisation. Sci. Total. Environ. 2019, 650, 1426–1439. [Google Scholar] [CrossRef]
- Shanghai Ecological and Environmental Bulletin (SEEB). Shanghai Municipal Bureau of Ecology and Environment. 2019. Available online: https://sthj.sh.gov.cn (accessed on 4 June 2020).
- Ambient Air Quality Standards. Ministry of Ecology and Environment of the People’s Republic of China. 2012. Available online: http://www.mee.gov.cn (accessed on 1 January 2016).
- Leogrande, S.; Alessandrini, E.R.; Stafoggia, M.; Morabito, A.; Nocioni, A.; Ancona, C.; Bisceglia, L.; Mataloni, F.; Giua, R.; Mincuzzi, A.; et al. Industrial air pollution and mortality in the Taranto area, Southern Italy: A difference-in-differences approach. Environ. Int. 2019, 132, 105030. [Google Scholar] [CrossRef]
- Cheung, C.W.; He, G.; Pan, Y. Mitigating the air pollution effect? The remarkable decline in the pollution-mortality relationship in Hong Kong. J. Environ. Econ. Manag. 2020, 101, 102316. [Google Scholar] [CrossRef]
- Nakada, L.Y.K.; Urban, R.C. COVID-19 pandemic: Impacts on the air quality during the partial lockdown in São Paulo state, Brazil. Sci. Total. Environ. 2020, 730, 139087. [Google Scholar] [CrossRef] [PubMed]
- Abdullah, S.; Abu Mansor, A.; Napi, N.N.L.M.; Mansor, W.N.W.; Ahmed, A.N.; Ismail, M.; Ramly, Z.T.A. Air quality status during 2020 Malaysia Movement Control Order (MCO) due to 2019 novel coronavirus (2019-nCoV) pandemic. Sci. Total. Environ. 2020, 729, 139022. [Google Scholar] [CrossRef]
- Wang, Y.; Yuan, Y.; Wang, Q.; Liu, C.; Zhi, Q.; Cao, J. Changes in air quality related to the control of coronavirus in China: Implications for traffic and industrial emissions. Sci. Total. Environ. 2020, 731, 139133. [Google Scholar] [CrossRef] [PubMed]
- Zheng, W. Taiyuan city environment variation characteristics of ozone concentration in the air. Mod. Chem. Res. 2016, 10, 63–64. [Google Scholar]
- Zhang, Q.; Zheng, Y.; Tong, D.; Shao, M.; Wang, S.; Zhang, Y.; Xu, X.; Wang, J.; He, H.; Liu, W.; et al. Drivers of improved PM2.5 air quality in China from 2013 to 2017. Proc. Natl. Acad. Sci. USA 2019, 116, 24463–24469. [Google Scholar] [CrossRef] [Green Version]
- China State Council. Air Pollution Prevention and Control Action Plan (ACP); China State Council: Beijing, China, 2013; Volume 9, p. 10.
- Bai, Y.; Wong, C.P.; Jiang, B.; Hughes, A.C.; Wang, M.; Wang, Q. Developing China’s Ecological Redline Policy using ecosystem services assessments for land use planning. Nat. Commun. 2018, 9, 1–13. [Google Scholar] [CrossRef] [Green Version]
- Schanes, K.; Giljum, S.; Hertwich, E. Low carbon lifestyles: A framework to structure consumption strategies and options to reduce carbon footprints. J. Clean. Prod. 2016, 139, 1033–1043. [Google Scholar] [CrossRef] [Green Version]
- Liu, X.-J.; Xia, S.-Y.; Yang, Y.; Wu, J.-F.; Zhou, Y.-N.; Ren, Y.-W. Spatiotemporal dynamics and impacts of socioeconomic and natural conditions on PM2.5 in the Yangtze River Economic Belt. Environ. Pollut. 2020, 263, 114569. [Google Scholar] [CrossRef] [PubMed]
- Yang, H.; Tao, W.; Liu, Y.; Qiu, M.; Liu, J.; Jiang, K.; Yi, K.; Xiao, Y.; Tao, S. The contribution of the Beijing, Tianjin and Hebei region’s iron and steel industry to local air pollution in winter. Environ. Pollut. 2019, 245, 1095–1106. [Google Scholar] [CrossRef] [PubMed]
- Wang, P.; Chen, K.; Zhu, S.; Wang, P.; Zhang, H. Severe air pollution events not avoided by reduced anthropogenic activities during COVID-19 outbreak. Resour. Conserv. Recycl. 2020, 158, 104814. [Google Scholar] [CrossRef] [PubMed]


| Pre-During | During-Post | Pre-Post | |
|---|---|---|---|
| CO | −3.602 ** | −0.07 | −3.495 ** |
| NO2 | −6.373 ** | −3.247 ** | −5.035 ** |
| O3 | −6.593 ** | −4.741 ** | −6.729 ** |
| PM2.5 | −3.082 ** | −0.321 | −2.880 ** |
| PM10 | −2.227 * | −3.560 ** | −1.03 |
| SO2 | −3.291 ** | −3.231 ** | −0.5 |
| Pre-FLR | During-FLR | Post-FLR | |
|---|---|---|---|
| CO | −0.926 | −2.479 * | −1.196 |
| NO2 | −0.159 | −4.500 ** | −2.567 * |
| O3 | −0.25 | −2.597 ** | −1.309 |
| PM2.5 | −0.419 | −2.323 * | −1.111 |
| PM10 | −1.71 | −3.775 ** | −0.396 |
| SO2 | −1.239 | −2.527 * | −0.674 |
| Pre-FLR | During-FLR | Post-FLR | |
|---|---|---|---|
| CO | −4.676 ** | −0.291 | −1.311 |
| NO2 | −6.736 ** | −6.737 ** | −6.736 ** |
| O3 | −6.475 ** | −5.923 ** | −6.652 ** |
| PM2.5 | −0.294 | −1.538 | −2.998 ** |
| PM10 | −1.174 | −0.974 | −2.188 * |
| SO2 | −5.193 ** | −2.955 ** | −6.729 ** |
Publisher’s Note: MDPI stays neutral with regard to jurisdictional claims in published maps and institutional affiliations. |
© 2020 by the authors. Licensee MDPI, Basel, Switzerland. This article is an open access article distributed under the terms and conditions of the Creative Commons Attribution (CC BY) license (http://creativecommons.org/licenses/by/4.0/).
Share and Cite
Bai, Y.; Zhou, Y.; Alatalo, J.M.; Hughes, A.C. Changes in Air Quality during the First-Level Response to the Covid-19 Pandemic in Shanghai Municipality, China. Sustainability 2020, 12, 8887. https://0-doi-org.brum.beds.ac.uk/10.3390/su12218887
Bai Y, Zhou Y, Alatalo JM, Hughes AC. Changes in Air Quality during the First-Level Response to the Covid-19 Pandemic in Shanghai Municipality, China. Sustainability. 2020; 12(21):8887. https://0-doi-org.brum.beds.ac.uk/10.3390/su12218887
Chicago/Turabian StyleBai, Yang, Yi Zhou, Juha M. Alatalo, and Alice C. Hughes. 2020. "Changes in Air Quality during the First-Level Response to the Covid-19 Pandemic in Shanghai Municipality, China" Sustainability 12, no. 21: 8887. https://0-doi-org.brum.beds.ac.uk/10.3390/su12218887