Article

Social Safety of Society for Developing Countries to Meet Sustainable Development Standards: Indicators, Level, Strategic Benchmarks (with Calculations Based on the Case Study of Ukraine)

by
Yurii Kharazishvili
1,
Aleksy Kwilinski
2,3,*,
Olena Grishnova
4 and
Henryk Dzwigol
2,3,5
1
Department of Regulatory Policy and Entrepreneurship Development, Institute of Industrial Economics, The National Academy of Sciences of Ukraine, 2 Maria Kapnist Street, 03057 Kyiv, Ukraine
2
The London Academy of Science and Business, 3rd Floor, 120 Baker Street, London W1U 6TU, UK
3
Department of Marketing, Sumy State University, 2 Rymskogo Street, 40007 Sumy, Ukraine
4
Department of Enterprise Economics, Taras Shevchenko National University of Kyiv, 60 Volodymyrska Street, 01033 Kyiv, Ukraine
5
Department of Management and Logistics, Faculty of Organization and Management, Silesian University of Technology, 26-28 Roosevelt Street, 41-800 Zabrze, Poland
*
Author to whom correspondence should be addressed.
Sustainability 2020, 12(21), 8953; https://0-doi-org.brum.beds.ac.uk/10.3390/su12218953
Submission received: 7 September 2020 / Revised: 22 October 2020 / Accepted: 26 October 2020 / Published: 28 October 2020
(This article belongs to the Section Sustainable Management)

Abstract

:
The paper is devoted to identifying the level of social safety of society, taking into account the indicators of shadow economy, and developing its strategic scenarios as a component of sustainable development of Ukraine by 2030. The authors used the modern methods of normalisation, threshold vector determination, and dynamic weight coefficients in order to identify the level of social safety of society. The authors developed the structure and a list of indicators considering three components of social safety: The standard of living, the demographic component, and the quality of life. This method allows determining the list and severity of threats, comparing the dynamics of integral indices with integral thresholds in one scale, identifying the state of security, and defining strategic goals and strategies. The suggested approach is universal and can be used by any country, region, economic activity, or business to develop evidence-based medium-to-long-term sustainable development scenarios.

1. Introduction

The social and employment sphere or, to be more precise, a person with his/her urgent needs, interests, and values is the foremost driving force, the goal and criterion of economic development, and the success of economic and social reforms. Therefore, social safety of society is not only a matter of human development, the political stability of society, and the affirmation of national interests; it is also an issue of the foundation of all aforementioned fields, i.e., economic growth.
The term “social safety of society”, as it is understood by our team of researchers, usually has two interpretations: Traditional (no threats, safe existence, and development of society) and alternative (no threat for authorities and the state from the society). We shall assume that providing security for the society automatically ensures the overall security for the state; thus, own citizens are not a threat to the national security. Hence, we will view social safety of society from the traditional point of view that considers the state of the social sphere which ensures: (1) A decent standard of living for the population (material level and social components—the standard of living); (2) protection of the key vital reproductive processes, regardless of the impact of real and potential, internal and external threats (demographic component); (3) an opportunity to receive quality education and the fact that there are no threats to human health and life (the quality of life as such).
From this perspective, it makes one wonder: What is the current state of social safety of society in the country? Do the level and quality of life of the population, as well as demographic development of Ukraine, meet the modern requirements? What are the scientifically sound or evidence-based strategic benchmarks of social safety of society in the context of sustainable development?
The literature review of the world’s scientific sources is very complicated as different scientific schools use different terms for what we call social safety of society. There are also certain issues with translation from different languages into English. Therefore, within the framework of our terminological (categorical) review we inquired deeply in such concepts as social security, societal security, societal safety, social safety, and social safety of society. In the following paragraphs, we shall summarise the noted categories of the definitions we have reviewed.
The vast majority of scientific papers interprets social security as “the general problems affecting all social security benefits, e.g., their scope as regards persons, risks and the level of benefits, the administrative machinery and the financial considerations, <…> the role of the state in social security provision” [1]. A great number of other authors, such as Barkai [2], Batty and Orton [3], Marini et al. [4], and Luttmer and Samwick [5], also demonstrate the same understanding of the concept.
It is very common to use the social safety category in the phrase “social safety net”, which has got virtually the same meaning as the aforementioned social security category [6,7,8].
At the same time, some scholars, like Dixon [9], also use the category “social welfare”, while others, like Moffitt [10], prefer “welfare system” in order to define the same range of matters.
We believe that in order to avoid terminological issues we should use the term “social security system” for a set of phenomena and actions that ensure the welfare of different categories of the population via allowances, benefits, privileges, and other government payments, as well as expenses of employers [11,12].
Høyland [13] in his paper called “Exploring and Modelling the Societal Safety and Societal Security Concepts—A Systematic Review, Empirical Study and Key Implications” has done a lot for understanding the categories of societal safety and societal security. This research ‘explores and models the concepts of societal safety and societal security in tandem, with the aim to understand how the concepts are composed, related, and can be reconciled’.
Societal safety is a concept developed in Norway at the beginning of 2000s. It could be defined as ‘the society’s ability to maintain critical social functions, to protect the life and health of the citizens and to meet the citizens’ basic requirements in a variety of stress situations.’ It aims to be a systematic approach for understanding, mitigating, and responding to social problems such as extraordinary stresses and losses, interferences in complex and mutually dependent systems, or a lack of trust in vital social institutions… Societal safety has interfaces with other safety-related areas such as national security, sustainable development, human security, and incident management (handling isolated accidents, common illness, and ordinary criminal acts). Societal safety is, however, a sensitive political issue containing dilemmas and value choices that are hardly possible to perceive or solve as pure scientific problems [14]. The research by Kawata [15] shows the same understanding of a societal safety concept, whereas Lægreid and Rykkja [16] use societal security category in the same sense.
In recent years, there has been an active study of the issues related to the social safety and sustainable development [17,18,19,20,21,22,23,24,25,26,27,28,29,30,31,32,33,34,35,36,37,38,39,40,41,42,43,44,45,46,47,48].
Having studied the world’s scientific achievements in this field, we came to the conclusion that from a theoretical perspective the complex systemic phenomenon that is the subject of research in this article, and the definition of which we provide in this paper, should be called social safety of society.
The “Research Methods” section below gives an overview of the sources that formed the methodological basis for identifying the levels of social safety of society.
The vast majority of the research papers on social safety is devoted to analysing and discussing the framework of categories and concepts [17,18,19,20,21,22,23,24,25,26,27,28,29,30,31,32,33,34,35,36,37,38,39,40,41,42,43,44,45,46,47,48], while disregarding the quantitative assessment of the level of social safety, without which strategic planning is impossible. Most of the time, in well-known publications, there is a lack of a systematic approach to the problem of social safety. We believe that the study of social safety requires tackling two major issues, namely (1) identifying the current state and (2) elaborating a scientifically based strategy with quantitative assessments. The methods for solving such problems are available within the research themes of economic security and sustainable development.
It is worth mentioning that the multifactorial and multi-criteria nature of the concept of social (economic, environmental) safety determines possible approaches to its assessment by methods of economic cybernetics. One of these is an integral assessment method, which includes addressing the following issues: The form of the integral index, normalisation of indicators, and weight coefficients. Furthermore, the integral assessment of the level of safety (social, economic, environmental) a priori implies comparison with permissible threshold values, which predetermines the solution of another problem: Defining the boundaries of the system’s safe existence, i.e., the vector of threshold values.
The bulk of research done usually applies the method of integral estimation with additive convolution (linear form) in order to identify the current state. For instance, in order to obtain estimates of a composite index (additive convolution), E. C. Hazell [49] uses a weighted linear combination (WLC) approach, normalisation by reference (maximum) values, determination of the weights of each indicator based on their perceived importance in the context of decision making, and combining them into a final composite score for each particular area based on their performance.
For example, T. Petrova [50] builds a sub-index as the arithmetic mean of three sub-indices for each interval; that is, she uses the additive form of the integral index with constant and equal weight coefficients.
At the same time, D. Pamučar [51] makes a good overview of subjective and objective methods for determining the weight coefficients. He also offers one of the subjective approaches, where the main role belongs to a specific expert who determines the preference according to his/her rational judgment. Even bearing in mind that, according to the author, the proposed method reduces the subjectivity of decision-making, this aspect is still present.
D. Migilinskas [52] gives an overview of the methods for normalising indicators (eight methods); however, unfortunately, there is no detailed analysis of their advantages and disadvantages.
There is also another distinctive publication, which summarizes the vast majority of modern approaches to integral assessment. It is the research paper by I. Gryshova [53], which is remarkable by the following features:
-
The indicators are normalised according to the reference values;
-
The integral index is defined as the geometric mean with equal and constant weight coefficients;
-
The selection of the best EU member state is carried out according to the maximum values of the integral index based on a clustering method without comparison with the threshold values of these indices, which does not make it possible to adequately identify either the state of safety or the level of sustainable development;
-
Dependencies between individual indicators and the integral index are determined by the regression equation for a known period without determining the predictive ability of the resulting models (the proximity of R2 to 1 and the acceptability of other criteria does not mean such an ability at all);
-
The authors use the method of additive convolution for aggregation of sub-indicators;
-
The paper does not disclose quantitative meaning of a balanced economic growth;
-
The study does not specify what quantitative criterion is used to measure sustainability;
-
The definition of threats is not formalised, which leads to a subjective judgment;
-
Issues of strategic planning are not considered or predicted at all; the question then is: Why did the researchers form regression equations?
The use of additive convolution is surely not an error (it is rather a matter of preference); however, at zero or low values of some indicators it is susceptible to a high level of the integral index. The multiplicative (nonlinear) form of the integral index is believed to be more preferable. Apart from that, the weights are assumed to be equal for all indicators, which does not correspond to reality, or, in other cases, they are assigned by experts. The noted approach introduces a significant share of subjectivism and does not exclude fundamental errors. Hence, there is a clear demand for formalised methods to substantiate weighting factors.
On top of that, the constancy of the weighting factors is another disadvantage. Furthermore, significant changes in the political and foreign economic situation lead, after some time, to radical changes in empirical estimates of econometric relationships. This, in its turn, causes changes in weights. Therefore, there exists a requirement for methods to substantiate dynamic weighting factors. Normalisation methods also require improvement.
The normalisation method based on reference (maximum) values is the simplest and the most widespread one. However, if for stimulants (boosters) the normalisation is carried out in a linear form ( x i / k ), for destimulators (inhibitors) it will be in a nonlinear form ( k / x i , i.e., the equation of hyperbola), which results in “suppression” of the dynamics of the normalised indicator. Therefore, there will be the distortion of the integral index.
Another common normalisation method is the one based on dispersion range, where the denominators of the normalisation equations contain the values ( x max x min ) . If the minimum values of the indicators are equal to zero or simply approach it, their normalised dynamics practically on a certain scale reproduces the original dynamics of the indicator. Nonetheless, in case the minimum value of the indicator deviates significantly from zero, the dynamics of the normalised indicator correspondingly deviates more and more from reflecting the dynamics of the output indicator. Then, instead of showing the dynamics of the original indicator, it will show the dynamics of changes within its range, which is obviously not the same. This also leads to the distortions of the integral index. Whereas forced equalisation x min = 0 in the normalisation equations leads to a modified normalisation method that eliminates the disadvantages of the previously mentioned methods.
We would like to emphasise that the formulation of integral indices without comparison with integral threshold values is completely meaningless, since it only shows its decrease or increase in certain periods and can lead to the conclusion about the integral index maximisation, which shall be erroneous from the standpoint of applied systems theory.
There is a need to underline that the situation with strategizing is even worse. Some researchers try to predict the dynamics of integral indices using polynomials or regression, emptying the essence of such multidimensional concepts as sustainable development or safety. Thereby they are discrediting economic and mathematical modelling. The lack of comparison of integrated indices with integrated thresholds does not make it possible to adequately identify the current state of social safety, to suggest a criterion for sustainable development, or to formalise the definition of the list of the most important threats based on the magnitude of their deviation. Moreover, it excludes the stage of goal-setting and strategic planning; in other words, it is unpromising.
A distinctive feature of the anticipated research methodology is the complete absence of subjectivity, formalisation, and theoretical substantiation of all stages, which significantly increases the reliability of the results obtained. Decisions concerning the actual choice what methods to use in order to solve similar problems remains with a researcher.
All of the aforementioned prerequisites lead to conducting this study.
Since this study examines issues of social safety and sustainable development for developing economies, Ukraine proves to be a representative example of such an economy. The proposed study may spark the interest of the international scientific community due to the fact that a bipolar world led by superpowers requires certain effective solutions for the countries in the border area of this juxtaposition to pass the bifurcation point in their economic development. Furthermore, the sustainability of economic development in Western Europe directly depends on the pace and level of economic development of Central and Eastern Europe. Hence, it can be assumed that the relevance of the issue considered in this paper does not require additional justification. Therewithal, the research methodology suggested in the article can be used “at its core” to conduct similar research across any country, region, or economic activity.
The study is informed by the applied systems theory, management theory, and economic cybernetics. The ‘Alpha’ macro-model of general economic equilibrium used to calculate some of the indicators is based on the Keynesian perspective (with the focus on aggregate demand), the classical aggregate supply theory in the context of the Keynesian perspective (the price level affects the economic activity), and the monetarist money market theory.
The overall objective of the research is to identify the level of social safety of the society, taking into account the indicators of the shadow economy and to develop strategic scenarios of social safety of the society in Ukraine from the standpoint of sustainable development for the period up to 2030.
Due to the fact that a study of distinct social safety objects has been already conducted [54,55,56], this article explores a more complex object within the “system-subsystem” hierarchy. To be precise, the research object is social safety as a system—a whole, which is something more than a simple sum of the individual subsystems’ properties: The standard of living, the quality of life, and a demographic component. Within the framework of this system, the impact or weight of the individual components is determined by the new methodology [57], which has the aforesaid scientific novelty elements. Thus, solving the problem of identifying social safety as a system, setting the goals, generating the anticipated development path (trajectory), and solving the inverse problem while taking into account the constraints (vector of system thresholds) makes it possible to synthesize the required values of subsystems and their indicators in order to achieve the goals set by sequential decomposition of integral indices. This automatically determines the role and importance of each subsystem for a given perspective, which could not be foreseen in the study of individual subsystems.
Scientific novelty of the research. We developed a system of indicators of social safety of society, taking into account the indicators of the shadow economy, without which the evaluation would be inadequate. For the first time, the paper substantiates the definition of the vector of thresholds (boundaries of safe existence) for indicators of social safety of society using the general macroeconomic equilibrium model and the t-test technique through constructing probability density functions, calculating statistical characteristics (mathematical expectation, root-mean-square deviation, and asymmetry coefficient). Furthermore, the study also used the tables of values from Student’s t-distribution and formalised description of the vector of thresholds based on representative types of probability distribution (normal, lognormal, exponential ones) bearing in mind international experience. The research expanded the concept of “homeostatic plateau” to define the threshold vector and suggested the criterion for sustainable development as a mark of achieving an average of the homeostatic plateau. According to the modern methodology of integral assessment, the paper determined the dynamics of integral indices of social safety of society in general and of its components in particular, using the multiplicative form of integral index, the modified method of normalisation, and dynamic weighting coefficients in comparison with integral thresholds. This approach allows for identifying the state of social safety of society and determining the list and impact of the most important threats. The research provides evidence-based strategic scenarios for sustainable development of social safety of society by solving the inverse problem of decomposition of integral indices and set goals using the methods of adaptive control from management theory for the period up to 2030.

2. Materials and Methods

The research uses the body of statistical indicators from national [58,59,60] and international sources [61,62,63,64,65,66,67], which characterize the level of components of social safety of society in recent years. The main countries, whose data were used to determine the threshold vector, include the following: France, the United Kingdom, Sweden, Finland, Spain, Denmark, the Russian Federation, Slovakia, Poland, Czech Republic, Italy, Portugal, Germany, Canada, Luxembourg, the Netherlands, Norway, Austria, Ireland, the US, and China (in different combinations for different indicators).
For particular indicators, our research team selected the countries that have the best values for specific relevant indicators and can provide a promising model for Ukraine. It has definitely been desirable, but, unfortunately, not always possible to choose the same list of countries and the same period for all indicators. The definition of the threshold vector is similar to the construction of a hypothetical country with the highest level of social safety of society across all indicators. The relevant data for threshold values were selected mostly for the period of 2015–2016; however, sometimes the research used the Eurostat 2015–2020 forecast data.
The dynamics of the vast majority of social indicators for Ukraine was determined according to official data of the State Statistics Service of Ukraine. For some indices, such as the shadow economy indicators, the dynamics and thresholds were determined using the ‘social justice’ method as a component of the general macroeconomic equilibrium model [57] (pp. 104–128).
The broad-spectrum macroeconomic model [68] (pp. 81–177) is used to calculate safety indicators that are not calculated by official statistics bodies, as well as to substantiate some threshold values by modelling crisis situations. Given that the official data of the State Statistics Service of Ukraine regarding the size of the shadow economy are inadequate to reality (17–18% of official GDP), and some data on this topic are not published at all, we have developed our own method of estimating the shadow economic activity. The developed method is universal and can be applied to any country, region, or type of economic activity and allows calculating the following indicators: (1) The volume of shadow GDP, which can be added to the official GDP, (2) the volume of official GDP created by shadow wages, shadow employment, shadow intermediate consumption, shadow capital loading, and shadow energy consumption.
Justification of the boundaries of the safe existence of a dynamic system is the most important stage of safe development. Without knowing the boundaries of safe existence, it is impossible to protect the vital interests of security objects. That is why for each indicator it is necessary to determine the threshold vector: Lower and upper critical, lower and upper threshold, and lower and upper optimal values (Figure 1).
A pair of optimal values determines the homeostatic plateau, within which there are the best operating conditions of the system and negative feedback. The optimal range of changes in indicators will correspond to the “efficient frontier” in the economy; the threshold range is basically the “crisis frontier”, whereas the critical range is the “critical frontier”.
The concept of “homeostatic plateau” was first proposed by Van Gigch [69] in applied systems theory, which included the plateau itself and the destruction of the system on both sides. The concept of “homeostatic plateau” has been further developed in the research work [57] (p. 67), which differs by adding a range of thresholds and critical values with a neutral feedback area and explaining the transition from one area to another as an exponential change in the feedback relationship. Moreover, the change of the type of inverse connection does not occur immediately at the intersection of the sphere. First, the existing type of connection decreases exponentially, and then another type of connection increases, likewise exponentially.
We determined the dynamics of the vast majority of social indicators for Ukraine according to official data of the State Statistics Service of Ukraine. For some of them we used a macromodel. It was the first stage of the study.
In order to calculate the vector of threshold values of indicators, we formed a sample of similar data from economically developed countries for recent years. Among a number of methods for determining the vector of threshold values, there are several methods that seem to be the most adequate ones. Particularly, those include the methods of macroeconomic models as they meaningfully reflect the effects of destabilizing factors on the conditions of a particular country in the current period of time; the methods of functional dependencies (macro/microeconomic analytical or statistical equations; Akhiezer-Goltz concept; information theory; “golden section”); and stochastic methods (t-test, etc.). Given the absence of macromodels, the “t-test” method is the most accessible one, which works well even for a small sample (≥ 20).
The main purpose of the threshold vector is to identify the level of social safety of society, as well as to define strategic goals for further development and to apply the method of elaborating the strategy of social safety of society from the standpoint of sustainable development.
Furthermore, the average optimal value of the indicators will be considered the relevant criteria for achieving sustainable development. The threshold vector has to be revised in about 3–5 years. In the future, it is advisable to use dynamic thresholds in the same way as scientific world does it for dynamic weights in integrated estimation [57] (pp. 66–71).
The research consists of three stages, the main one being modelling. In the course of conducting this study, we used the following methods: Statistical characteristics of variations and distributions to analyse the specific features of the social indicators’ distribution and to assess the degree of approximation of this process’s structural characteristics in Ukraine against the European analogues by determining the threshold vector; methods of interconnection analysis to calculate elasticity coefficients and to assess the impact of indicators of social safety of society on the integral index based on the data of Ukraine and other European countries.
In the first stage, we formed the indicators’ dynamics and determined the boundaries of safe existence with the use of strategic benchmarking through the construction of probability density functions and the calculation of statistical characteristics of mathematical expectation, root mean square deviation, and an asymmetry coefficient in order to calculate the vector of threshold values of each indicator. From the whole variety of types of probability density functions, we distinguished those with the most distinctive and closest distribution law: Normal, lognormal, and exponential, for which our research team proposed equations for calculating the threshold vector [57] (pp. 66–72) (Table 1), where μ is the average value, σ is mean square deviation, and t is taken from the Student’s t-distribution tables [70].
In the second stage, there was an integral convolution of indicators and thresholds [71] (p. 113) that foresees using
  • The multiplicative form of the integral index:
I t = i = 1 n z i , t a i ; a i = 1 ; a i 0 ,
where I is the integral index; z is a normalised indicator; a is the weighting factor;
  • The modified method of rationing:
S : z i = x i k n o r m , D : z i = k n o r m x i k n o r m , k n o r m > x max ,
where x is the value of the indicator; knorm is the normalisation factor (for stimulants or boosters it is equal to the maximum value from a number of indicators and thresholds; for the dissimulators or inhibitors it should be greater than the maximum value from the same series by 5–10%).
The procedure of normalizing indicators and their threshold values is a compulsory step in calculating the integrated index, as different indicators have different dimensions. Moreover, they can be multidirectional, i.e., there are indicators, which increase is desirable—stimulants (S), or boosters, but there are also indicators, which decrease is desirable—destimulators (D), or inhibitors. The normalizing procedure, firstly, transforms indicators of different dimensions into dimensionless quantities within the range [0, 1], and secondly, allows the comparison of multidirectional indicators. After normalisation, the dynamics of the normalized indicators must accurately reflect the dynamics of the output indicators;
  • The method of dynamic weights, which includes the application of the principal component analysis together with the method of “sliding matrix” that consists of sequentially shifting the matrix of the minimum required size over a certain period and determining the weighting coefficients over a given period by the method of principal component analysis. Besides, the minimum required size of the matrix is determined by the condition of equality between the number of indicators (the number of principal components) and the number of positive eigenvalues of this matrix, i.e.,
C i × D i = ( d 1 c 11 + d 2 c 12 + ... + d j c 1 j d 1 c 21 + d 2 c 22 + ... + d j c 2 j d 1 c j 1 + d 2 c j 2 + ... + d j c j j ) = ( w 1 w 2 w j ) , a i = w i w i ,
where C is the matrix of absolute values of factor loadings; D is a vector matrix of variances.
After that, our research team calculated the elasticity coefficients in order to identify the integral weight of the influence of individual indicators on the integral index:
E = Δ y Δ x x y
where x is any indicator of social safety of society; y is an integral indicator of social safety of society; Δ x is the addition (increment) to the corresponding indicator; Δ y is the addition (increment) to the integral index.
In the third stage, the problem of strategizing is solved, i.e., strategic planning of future development based on the principle that “the future is determined by the trajectory that one takes into the future” [57] (pp. 83–89) instead of the classical forecasting principle “the past determines the future”. It is rather obvious that the classical methods of forecasting are inappropriate here. First, forecasting gives continuation of existing trends for the future, and second, forecasting always contains a certain error. Third, it is necessary to know how the sustainable development or safety components and indicators need to change in order to achieve the desired state of development. There is a definite need for other approaches. The approach suggested in the article is a case in point.
Therefore, after determining the dynamics of the integrated index and integrated thresholds, it is necessary to set target values of the integrated index for the future and to predict the trajectory of future development. Consequently, we know the value of the integral index in each period of time. The task is to decompose the integral index, in other words, the synthesis of the necessary values of the components and their indicators to find the integral index within the specified limits.
The solution of such an (inverse) problem for each sustainable development component, when its required value is known (or given), allows taking into account the sensitivity of components or indicators, weights, and adaptive control methods [72] from management theory in order to determine the required values of components and their indicators during the forecast period in each year (Figure 2).
Hence, the task of regulating the components of the integrated index and their indicators is to determine such values in the aggregate in order to ensure that the values of the integrated indicator are within the range of specified (threshold/optimal) values. Unquestionably, the mechanism for adjusting the parameters of the model uses methods based, in particular, on the gradient of the error function. The main principle of the adjustment mechanism is to minimize the quadratic function of error and its derivatives. At the same time, it is assumed that all functions are continuous and at least twice differentiated.
Defining the structure and boundaries of safe existence. In line with our understanding of social safety of society, we distinguish the following basic components in its system: The standard of living (material/financial means for life) [54]; a demographic component (security of the demographic and reproductive processes) [55], and a social component of the quality of life (possibilities of preserving health, obtaining education, having safe life) [56].
  • Material/Financial Means (the Standard of Living):
    1.1
    A share of labour use (a ratio of optimal labour demand to its supply) (S);
    1.2
    A share of salaries/wages in product output (S);
    1.3
    A share of official GDP generated by shadow wages, % of GDP, (D);
    1.4
    A shadow employment rate in total employment, % (D);
    1.5
    A rate of education spending to output, % (S);
    1.6
    A rate of healthcare spending to output, % (S);
    1.7
    Average wage to living wage ratio (S);
    1.8
    A share of wages in the structure of income of the population, % (S);
    1.9
    A rate of retirement expenditure to output, % (S);
    1.10
    A rate of deficit of the Pension Fund of Ukraine to output, % (D).
  • A Demographic Component:
    2.1
    Life expectancy at birth, years (S);
    2.2
    A depopulation ratio (a ratio of deaths to the number of births), (D);
    2.3
    A total mortality rate (deaths per 1000 resident population), (D);
    2.4
    An infant mortality rate (deaths of those aged under 1 year per 1000 live births), (D);
    2.5
    A total fertility rate (children per a woman of reproductive age) (S);
    2.6
    A demographic burden of the disabled population (retirement age) to the working age population (the effective number of taxpayers), % (D);
    2.7
    A net population reproduction rate per a woman (S).
  • A Social Component of the Quality of Life:
    3.1
    A poverty rate (percentage of population below the poverty line), % (D);
    3.2
    Population morbidity (the number of first registered cases of diseases), per 100,000 population (D);
    3.3
    The number of doctors of all majors per 10,000 population (S);
    3.4
    The number of nursing staff per 10,000 population (S);
    3.5
    Enrolment rates in pre-primary education or primary schools, children aged 3 to 5, % (S);
    3.6
    Enrolment rates in secondary education, % (S);
    3.7
    Enrolment rates in tertiary education, students per 10,000 population (S);
    3.8
    A crime rate, cases per 100,000 population (D).
The defined structure of social safety of society includes 25 indicators, the list of which is not dogmatic and may vary depending on the objectives and depth of the study. They can be expanded by adding some indicators describing social justice as a feature of the life quality [73], ICT infrastructure development [74], migration caused by a low well-being level [75], etc.
Therefore, the main task of ensuring sustainable development is not to maximise the level of the integral index, but to ensure that it is within optimal values, i.e., within the “homeostatic plateau”.

3. Results

With the available statistics with regard to the indicators of economically developed countries, we calculated the vectors of the threshold values of indicators of social safety of society in Ukraine from the standpoint of sustainable development while using the equations we had previously developed, the t-test technique, and the modelling method (Table 2) [54,55,56].
Identification of the safety level. As a result of performing integral convolutions for indicators and their thresholds, we obtain the dynamics of integral indexes in comparison with integral thresholds. This also allows for identifying the current state of sustainable development, i.e., determining the state of developmental safety: If below the lower threshold, it is a critical state or so-called “red” area; if between the lower optimum and the lower threshold, it is a state of crisis or “orange” area; if between the lower and upper optimum values, it is the desired state with the best system conditions or a “green” security area.
Determining threshold values of specific indicators and integral values is quite closely related to the notion of dynamic stability of the economic system and its individual components, or to the mechanism of homeostasis. Without such a comparison, we will have the dynamics of integral indices of sustainable development, which will determine only their increase/decrease in separate periods, which can lead to the erroneous conclusions about the maximisation of the integral index. Thus, the determination of integral indices of the economic system and their comparison with the integral threshold values transfers the concept of “development” into the concept of “security” [57] (p. 26).
Hence, by means of the selected integral estimation approach, we obtain the dynamics of integral indices of social safety of society in comparison with the integral threshold values (Figure 3).
Along with the calculations, the standard of living and the demographic component are in the critical (red) area, whereas the quality of life is in the state of crisis and it is approaching the critical area. Overall, Ukraine’s social safety of society has never risen above the lower threshold throughout all years of its independence, i.e., it is constantly in a critical area, which causes low social standards and increases the outflow of professional workforce in search of decent living and working conditions.
Therefore, ‘… using the obtained dynamics of integral indices of sustainable development components and integral thresholds in order to calculate the deviations of integral indices from their average optimal values’, can be considered criteria for achieving sustainable development’ [57] (p. 44) (Figure 4).
Hence, we can state that such components of social safety of society as the “standards of living” and the “demographic component” are lagging behind the sustainable development criteria most of all. The strategic objective of sustainable development of social safety of society is to zero out these deviations until 2030. Balancing disproportion and zeroing out deviations from the sustainable development criterion will ensure balanced sustainable development.
The list of major threats can be determined based on the deviation from the sustainable development criterion, according to which 19 out of 25 indicators pose a threat to Ukraine’s social safety of society. Furthermore, the most important of these include the following 10 indicators: (1) The level of healthcare spending; (2) the level of GDP generated by shadow wages; (3) a demographic burden of the disabled (retired) population to the working age population; (4) the share of the population below the poverty line whose equivalent incomes are below the actual subsistence rate; (5) the rate of retirement expenditure; (6) population morbidity; (7) overall mortality rate; (8) depopulation rate; (9) infant mortality; (10) the level of shadow employment.
“Therefore, it is extremely important to change the dynamics of these indicators from negative to positive, and this will be the best and (essentially) impartial indicator of the social effectiveness of the reforms underway. It is crucial to change social policy radically at the legislative level through the redistribution of income between labour and capital” [56] (p. 168). In 2018, the distribution of income in Ukraine is as follows: Labour has 18.5%, while capital has 81.5%. In economically developed countries, it is quite different [57] (p. 111): Labour −26–32%, capital −74–68%. Consequently, we suggested preserving the average wage in the output typical for the EU member states, i.e., labour −29%, capital −71%.
In order to determine the severity of threats, or more precisely, their impact, there is a need to calculate the elasticity coefficients of each component and indicators. These coefficients explain the measure of the impact of the individual components and indicators on the level of sustainable development (see equation 4: What will be the change in percentage for the initial value y when the input value x changes by 1%). This information is compulsory to develop priority impact activities.
Among the components of social safety of society, the “standard of living” has the biggest impact (0.4272), while the “demographic component” (0.2857) and the “quality of life” (0.2838) demonstrate approximately the same level of impact. In a meaningful sense, this leads to a fairly logical conclusion: Both the demographic situation and the quality of life will definitely depend on the standard of living. The most influential indicators in the relevant components are the following: The level of official GDP generated by shadow wages; total mortality rate; population morbidity.
Substantiation of Strategic Development Scenarios. The main purpose of the threshold vector is to identify the level of security, to determine the goals for further development, and to apply the methodology of sustainable development from a security perspective. A strategic vision for sustainable development involves, first, establishing the distance to it, the distance that involves social, economic, and environmental components. That is, it is advisable to determine the starting point for each sustainable development component, on which the strategic vision depends, and then to apply theoretical approaches to substantiate the strategic benchmarks for achieving sustainable development [57] (p. 8). Hence, having obtained the dynamics of the integral index of sustainable development, we will define the strategic goals that determine the strategic scenarios of sustainable development (Figure 5).
Therefore, Figure 3 demonstrates the following development scenarios:
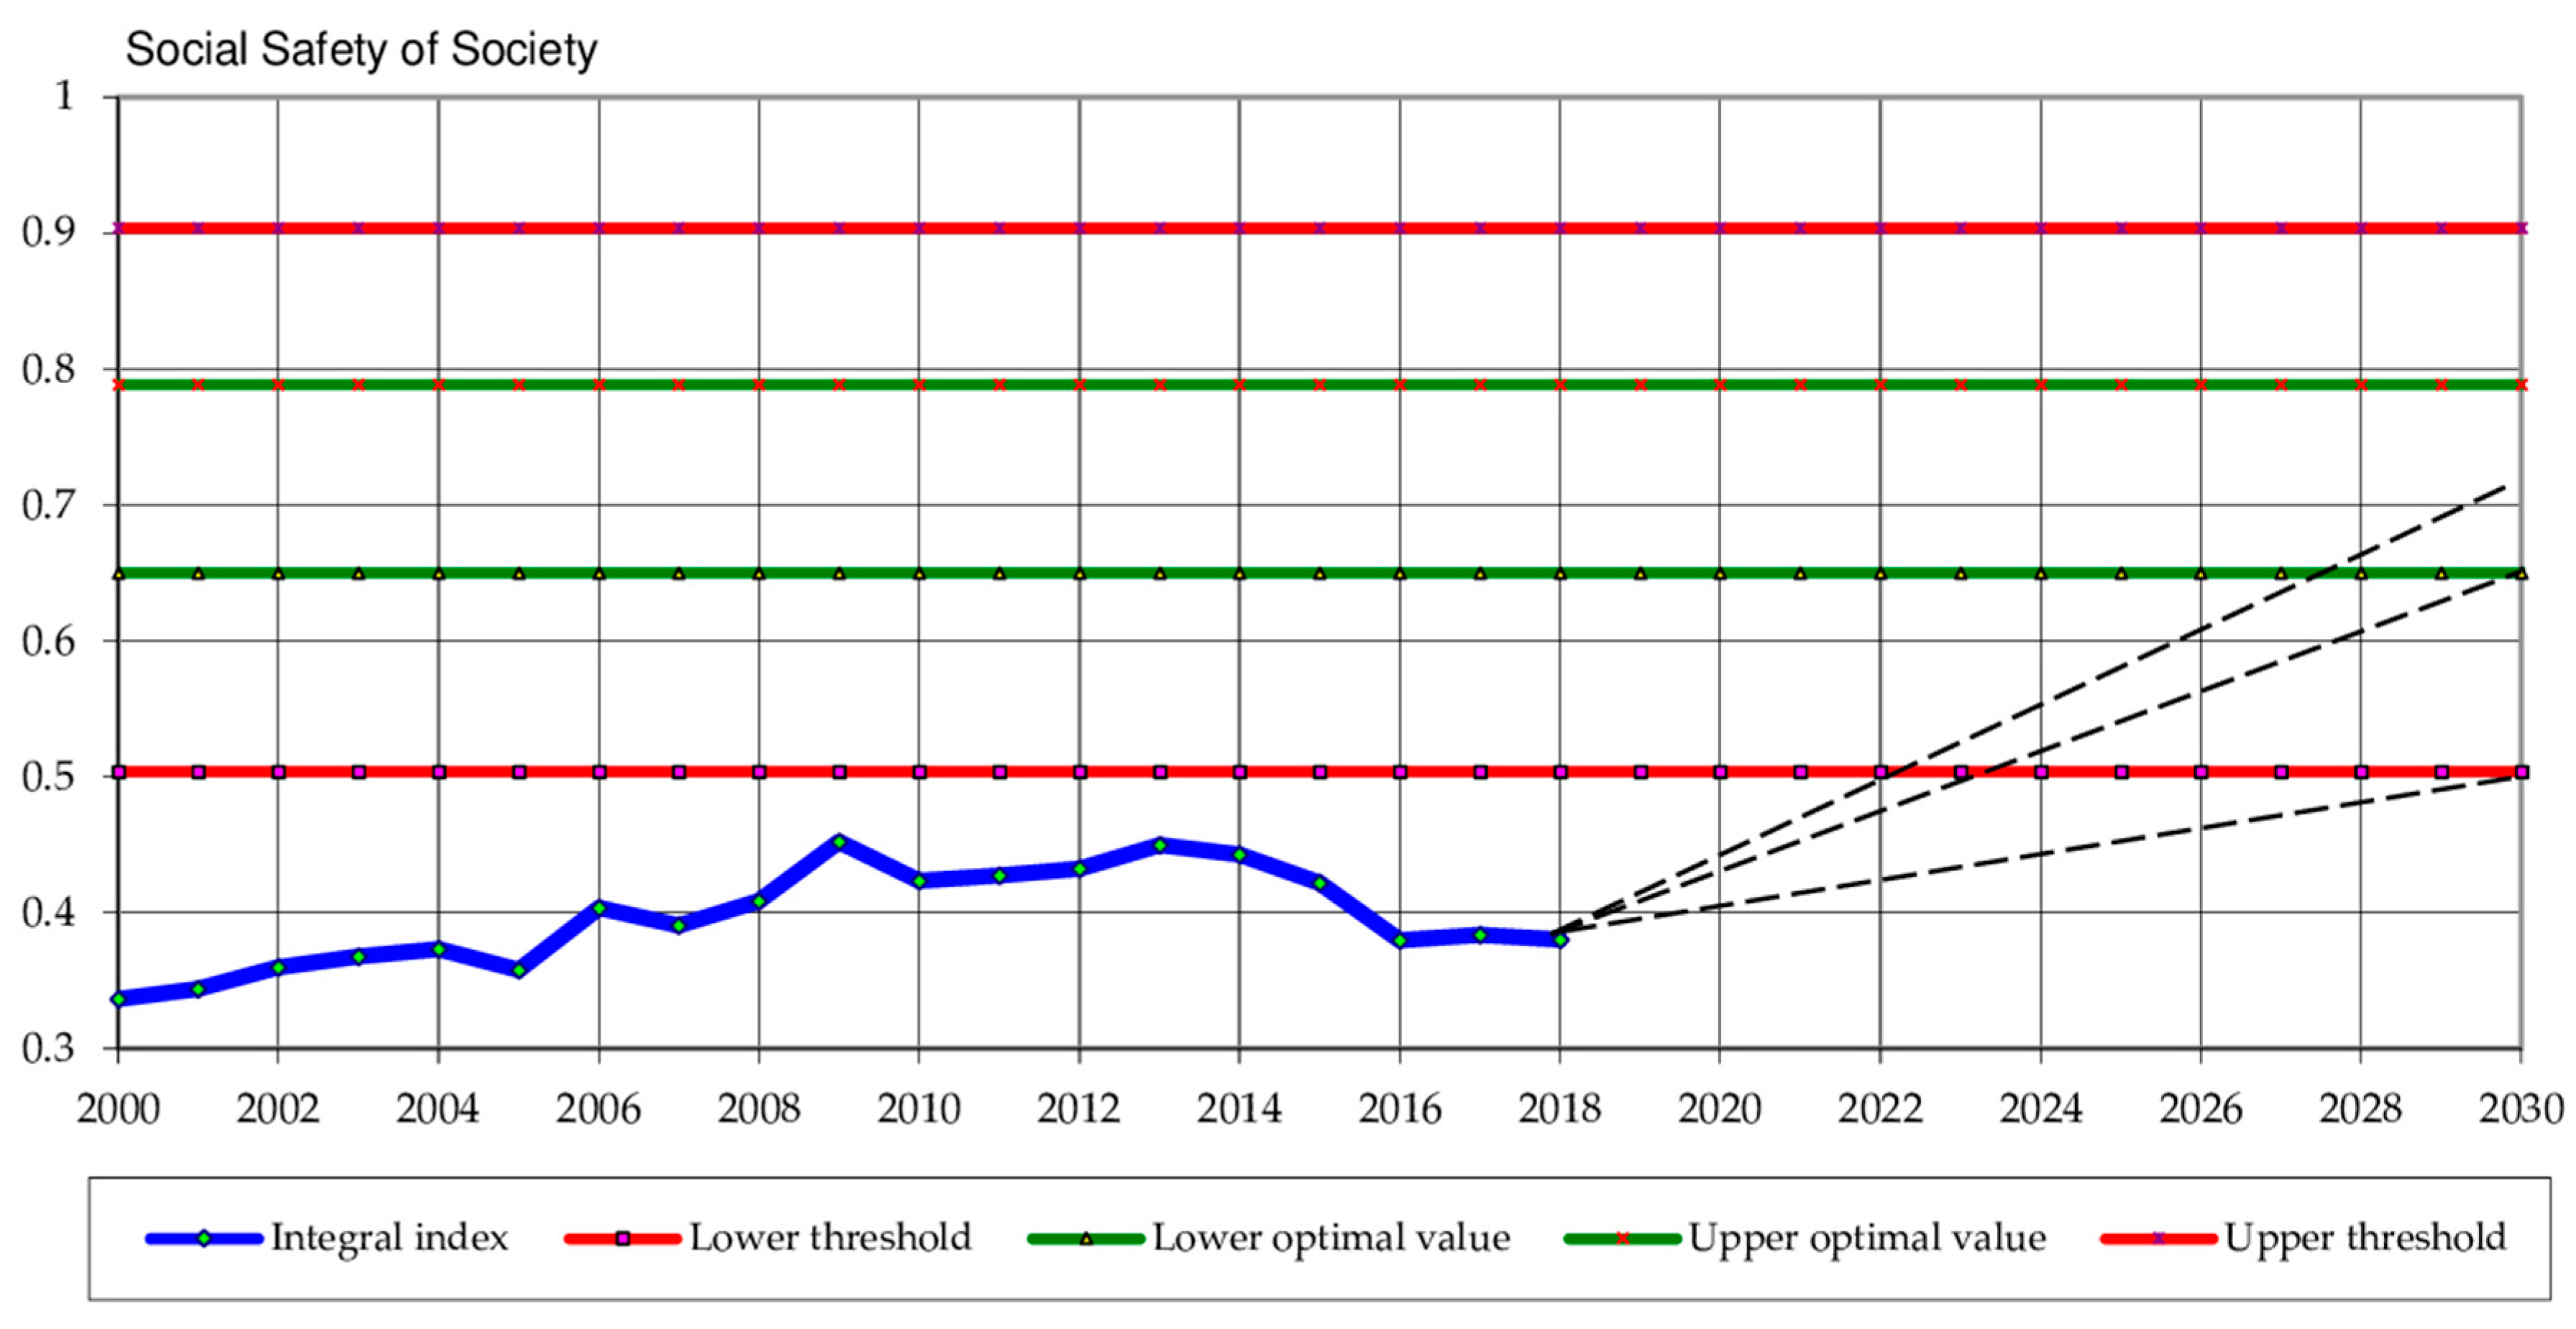
  • Realistic: Reaching the lower threshold.
  • Optimistic: Reaching the level of the lower optimal value (entering the optimal area).
  • Sustainable development: Achieving a full-fledged level of sustainable development, i.e., the average between the lower and upper optimal threshold vector values (a sustainable development criterion).
We use the method of strategizing [57] (pp. 83–89), which lies in the sequential decomposition of the integral index to synthesise the necessary values of indicators that allow achieving the development goal set.
We have implemented the comprehensive scheme of adaptive control system (Figure 2) in programming language “C++” as a standard “Strategy” procedure with short feedback cycle (without the macro-model). Its implementation is based on the optimal gradient method [76] with the choice of the optimal optimisation step according to the Newton-Raphson method. The inclusion of a block limiting possible values of adjustable indicators in the feedback cycle reduces this task to a class of mathematical programming problems: Nonlinear parametric optimisation. This algorithm can be used for a variety of tasks. After applying this procedure, we obtain the strategic values of the sustainable development components of social safety of society up to 2030 (Table 3).
It is also possible to obtain strategic values by the indicators of each particular component. As a result of performing the applicable calculations and applying the normalisation equations in reverse order, we obtain the strategic values of indicators in natural (physical) units of measurement for the components of social safety of society with regard to a given perspective (Table 4).
Strategic values of the indicators of social safety of society and its components, determined by the sensitivity of the impact of each individual component and each indicator on the integral index, is a key benchmark or, so to say, a guideline for medium or long-term strategic planning. We used the relevant equations for calculating the indicators of each component of social safety of society and, in the long run, we obtained the evidence-based strategic benchmarks of the main macro-indicators for different sustainable development scenarios (Table 5).

4. Discussion

Monitoring indicators of the actual status of social safety of society with the use of strategic benchmarks will ensure objective determination of the level and trajectory or trends of social safety of society and, accordingly, the effectiveness of the management policy. The indicators reveal the outcomes of development regulation that can be controlled through monitoring the sustainable development strategy implementation and evaluating the government policy.
It is quite evident that the suggested identification and strategy approach has undeniable advantages over the classical forecasting approaches, i.e., the “the past determines the future” versus expert estimates of weights that do not exclude fundamental errors. The well-known approaches to the classical forecasting of the dynamics of integral indices using polynomials or regression equations discredit economic and mathematical modelling in general and obscure the complexity of such a multidimensional concept as sustainable development or safety. It is rather obvious that the classical methods of forecasting are inappropriate here. First, forecasting gives continuation of existing trends for the future, and second, forecasting always contains a certain error. Third, we need to know how the sustainable development or safety components and indicators need to change in order to achieve the desired state of development. There is a definite need for other approaches; such approaches as the one suggested in the article.

5. Conclusions

We define social safety of society as the state of the social sphere, which ensures the decent standard of living for the population, the protection of the key vital reproductive processes, regardless of the impact of real and potential, internal and external threats (a demographic component), and an opportunity to receive quality education and the fact that there are no threats to human health and life (the quality of life). Provision of social safety of society is a criterion for the effectiveness of social and economic policy, a condition for human development and economic growth. We developed a list of indicators of components of social safety of society, taking into account the shadow employment and shadow wages, without which the assessment would be inadequate. The paper also scientifically justified and provided evidence regarding the vectors of the threshold values of indicators of social safety of society, taking into account the achievements of the economically developed EU member states, which made it possible to identify the current state of social safety of society both quantitatively and qualitatively from the standpoint of sustainable development.
We identified the current state of social safety of society according to the modern methodology of integral assessment. The dynamics of the integral index determined acknowledged its critical state throughout all years of the independence of Ukraine, which poses a threat to the national security.
Our research highlights the disproportionate development of the components of social safety of society and indicators, as well as identifies a list of the most important threats, according to which 19 out of 25 indicators are in the critical area and pose a threat to Ukraine’s social safety of society. Among the components of social safety of society, the standard of living and the demographic component pose the greatest threat.
The research confirmed that the “standard of living” is the most influential factor in regulating social safety of society; moreover, both the demographic component and the quality of life depend on it. The most influential indicators in the relevant components are the following: The level of official GDP generated by shadow wages; total mortality rate; and population morbidity.
The determination of integral indices and their comparison with the integral threshold values transfer the concept of “development” into the concept of “security”, whose optimal level is defined as the average value of a “homeostatic plateau” (criterion for achieving sustainable development), within which there is a negative feedback and the best conditions for the system.
Identifying the level of social safety of society from the standpoint of sustainable development and determining the boundaries of safe existence allows for setting strategic medium or long-term goals. It also lets us make the synthesis of desired values of components and indicators that ensure the achievement of strategic goals by sequential decomposition of integral indices via solving the inverse problem with the help of adaptive control methods from the management theory. According to the defined methodology, we have developed three strategic scenarios of social safety of society for sustainable development of Ukraine up to 2030, which are as follows:
-
Realistic scenario: Reaching the lower threshold (transition from “red” to “orange” security area), which requires an annual growth rate of real GDP equal to 4.5%;
-
Optimistic scenario: Reaching the level of the lower optimal value (transition from ”orange” to the beginning of “green” security area), which requires an annual growth rate of real GDP equal to 7.5%;
-
Sustainable development scenario: Reaching an optimum value of the integral index, all components, and indicators (secured in the green security area), which requires an annual growth rate of real GDP equal to 12.5%.
Implementation of certain development scenarios of social safety of society as a basis for sustainable development of Ukraine is possible under the conditions of institutional macroeconomic policy measures, namely: De-shadowing of the economy and raising social standards of living up to the level of economically developed countries.
Comparing the actual status of the indicators with the strategic benchmarks identified in the paper will ensure objective evaluation of the level and trajectory or trends of social safety of society from the standpoint of the country’s sustainable development and, accordingly, the effectiveness of the management policy.
There is solved the problem of strategizing, i.e., strategic planning of future development based on the principle that “the future is determined by the trajectory that one takes into the future” instead of the classical forecasting principle “the past determines the future”.
A distinctive feature of the anticipated research methodology is the complete absence of subjectivity, formalisation, and theoretical substantiation of all stages, which significantly increases the reliability of the results obtained.
The suggested approach to identifying and developing evidence-based strategic sustainable development scenarios from a safety standpoint is universal and can be applied to specific national safety fields of any country, economic area, region or type of economic activity and company (business) in strategic planning for medium-to-long-term perspective.

Author Contributions

Conceptualization, Y.K., A.K., O.G., and H.D.; methodology, Y.K., A.K., O.G., and H.D.; software, Y.K., A.K., and O.G.; validation, Y.K., A.K., O.G., and H.D.; formal analysis, Y.K., A.K., O.G., and H.D.; investigation, Y.K., A.K., O.G., and H.D.; resources, Y.K., A.K., O.G., and H.D.; data curation, Y.K., A.K., O.G., and H.D.; writing—original draft preparation, Y.K., A.K., O.G., and H.D.; writing—review and editing, Y.K., A.K., O.G., and H.D.; visualization, Y.K., A.K., O.G., and H.D.; supervision, Y.K., A.K., O.G., and H.D.; project administration, Y.K., A.K., O.G., and H.D.; funding acquisition, Y.K., A.K., O.G., and H.D. All authors have read and agreed to the published version of the manuscript.

Funding

This research received no external funding.

Acknowledgments

The authors thank the anonymous reviewers for their valuable comments for the revised version of this paper.

Conflicts of Interest

The authors declare no conflict of interest.

References

  1. George, V. Social Security: Beveridge and After; Routledge: Abingdon-on-Thames, UK, 2018. [Google Scholar]
  2. Barkai, H. The Evolution of Israel’s Social Security System: Structure, Time Pattern and Macroeconomic Impact; Routledge: Abingdon-on-Thames, UK, 2020. [Google Scholar]
  3. Batty, S.; Orton, M. An agenda for fixing the social security/welfare benefits system. J. Poverty Soc. Justice 2018, 26, 291–295. [Google Scholar] [CrossRef] [Green Version]
  4. Marini, M.; Chokani, N.; Abhari, R.S. Agent-based model analysis of impact of immigration on switzerland’s social security. J. Int. Migr. Integr. 2018, 20, 787–808. [Google Scholar] [CrossRef]
  5. Luttmer, E.F.P.; Samwick, A.A. The welfare cost of perceived policy uncertainty: Evidence from social security. Am. Econ. Rev. 2018, 108, 275–307. [Google Scholar] [CrossRef] [Green Version]
  6. Low, H.; Meghir, C.; Pistaferri, L.; Voena, A. Marriage, Labour Supply and the Dynamics of the Social Safety Net; Working Paper 24356; National Bureau of Economic Research: Cambridge, MA, USA, 2018. [Google Scholar] [CrossRef]
  7. Moffitt, R.A.; Pauley, G. Trends in the Distribution of Social Safety Net Support after the Great Recession; Stanford Center on Poverty and Inequality, Stanford University: Stanford, CA, USA, 2018; pp. 1–12. [Google Scholar]
  8. Loprest, P.; Nightingale, D. The Nature of Work and the Social Safety Net; Urban Institute: Washington, DC, USA, 2018. [Google Scholar]
  9. Dixon, J. (Ed.) Social Welfare in Africa; Routledge: Abingdon-on-Thames, UK, 2017. [Google Scholar]
  10. Moffitt, R.A. The deserving poor, the family, and the U.S. welfare system. Demography 2015, 52, 729–749. [Google Scholar] [CrossRef] [Green Version]
  11. Watts, R. Running on empty: Australia’s neoliberal social security system, 1988–2015. In Basic Income in Australia and New Zealand Perspectives from the Neoliberal Frontier; Mays, J., Marston, G., Tomlinson, J., Eds.; Palgrave Macmillan: Basingstoke/Hampshire, UK, 2016; pp. 69–91. [Google Scholar]
  12. Wang, L. Fertility and unemployment in a social security system. Econ. Lett. 2015, 133, 19–23. [Google Scholar] [CrossRef]
  13. Høyland, S.A. Exploring and modeling the societal safety and societal security concepts—A systematic review, empirical study and key implications. Saf. Sci. 2018, 110, 7–22. [Google Scholar] [CrossRef]
  14. Olsen, O.E.; Kruke, B.I.; Hovden, J. Societal safety: Concept, borders and dilemmas. J. Contingencies Crisis Manag. 2007, 15, 69–79. [Google Scholar] [CrossRef]
  15. Kawata, Y. For deepening of societal safety sciences. In Trust Science of Societal Safety Trust (Interdisciplinary Perspectives); Abe, S., Ozawa, M., Kawata, Y., Eds.; Springer: Singapore, 2019; Volume 2, pp. 217–224. [Google Scholar] [CrossRef] [Green Version]
  16. Lægreid, P.; Rykkja, L.H. Societal Security and Crisis Management: Governance Capacity and Legitimacy; Palgrave Macmillan: Cham, Switzerland, 2019. [Google Scholar]
  17. Alam, A.; Khatun, W.; Khanam, M.; Ara, G.; Bokshi, A.; Li, M.; Dibley, M.J. In the past, the seeds I planted, often didn’t grow. A mixed-methods feasibility assessment of integrating agriculture and nutrition behaviour change interventions with cash transfers in rural Bangladesh. Int. J. Env. Res. Public Health 2020, 17, 4153. [Google Scholar] [CrossRef]
  18. Bilan, Y.; Vasylieva, T.; Lyulyov, O.; Pimonenko, T. EU Vector of Ukraine development: Linking between macroeconomic stability and social progress. Int. J. Bus. Soc. 2019, 20, 433–450. [Google Scholar]
  19. Bilan, Y.; Raišienė, A.G.; Vasilyeva, T.; Lyulyov, O.; Pimonenko, T. Public governance efficiency and macroeconomic stability: Examining convergence of social and political determinants. Public Policy Adm. 2019, 18, 241–255. [Google Scholar] [CrossRef]
  20. Dalevska, N.; Khobta, V.; Kwilinski, A.; Kravchenko, S. A model for estimating social and economic indicators of sustainable development. Entrep. Sustain. Issues 2019, 6, 1839–1860. [Google Scholar] [CrossRef]
  21. Dzwigol, H.; Dzwigol-Barosz, M.; Miskiewicz, R.; Kwilinski, A. Manager competency assessment model in the conditions of industry 4.0. Entrep. Sustain. Issues 2020, 7, 2630–2644. [Google Scholar] [CrossRef]
  22. Kondratenko, V.; Okopnyk, O.; Ziganto, L.; Kwilinski, A. Innovation development of public administration: Management and legislation features. Mark. Manag. Innov. 2020, 1, 87–94. [Google Scholar] [CrossRef]
  23. Kravchenko, S. Simulation of the national innovation systems development: A transnational and coevolution approach. Virtual Econ. 2019, 2, 41–54. [Google Scholar] [CrossRef]
  24. Kuzior, A.; Kwilinski, A.; Tkachenko, V. Sustainable development of organizations based on the combinatorial model of artificial intelligence. Entrep. Sustain. Issues 2019, 7, 1353–1376. [Google Scholar] [CrossRef]
  25. Kuzior, A.; Kuzior, P. The quadruple helix model as a smart city design principle. Virtual Econ. 2020, 3, 39–57. [Google Scholar] [CrossRef]
  26. Kwilinski, A.; Tkachenko, V.; Kuzior, A. Transparent cognitive technologies to ensure sustainable society development. J. Secur. Sustain. Issues 2019, 9, 561–5706. [Google Scholar] [CrossRef]
  27. Kwilinski, A.; Pajak, K.; Halachenko, O.; Vasylchak, S.; Pushak, Y.; Kuzior, P. Marketing tools for improving enterprise performance in the context of social and economic security of the state: Innovative approaches to assessment. Mark. Manag. Innov. 2019, 4, 172–181. [Google Scholar] [CrossRef]
  28. Kwilinski, A.; Vyshnevskyi, O.; Dzwigol, H. Digitalization of the EU economies and people at risk of poverty or social exclusion. J. Risk Financ. Manag. 2020, 13, 142. [Google Scholar] [CrossRef]
  29. Lyulyov, O.; Shvindina, H. Stabilization pentagon model: Application in the management at macro- and micro-levels. Probl. Perspect. Manag. 2017, 15, 42–52. [Google Scholar] [CrossRef]
  30. Okewu, E.; Misra, S.; Okewu, J.; Damaševičius, R.; Maskeliūnas, R. An intelligent advisory system to support managerial decisions for a social safety net. Adm. Sci. 2019, 9, 55. [Google Scholar] [CrossRef] [Green Version]
  31. Padash, A.; Ghatari, A.R. Toward an innovative green strategic formulation methodology: Empowerment of corporate social, health, safety and environment. J. Clean. Prod. 2020, 261, 121075. [Google Scholar] [CrossRef]
  32. Radieva, M.; Kolomiiets, V. Factors of human capital modernization in the context of institutionalization of information economy. Virtual Econ. 2019, 2, 26–45. [Google Scholar] [CrossRef] [Green Version]
  33. Ruijsbroek, A.; Droomers, M.; Groenewegen, P.P.; Hardyns, W.; Stronks, K. Social safety, self-rated general health and physical activity: Changes in area crime, area safety feelings and the role of social cohesion. Health Place 2015, 31, 39–45. [Google Scholar] [CrossRef]
  34. Ruiz-Frutos, C.; Pinos-Mora, P.; Ortega-Moreno, M.; Gómez-Salgado, J. Do companies that claim to be socially responsible adequately manage occupational safety and health? Saf. Sci. 2019, 114, 114–121. [Google Scholar] [CrossRef]
  35. Tkachenko, V.; Kwilinski, A.; Korystin, O.; Svyrydiuk, N.; Tkachenko, I. Assessment of information technologies influence on financial security of economy. J. Secur. Sustain. 2019, 8, 375–385. [Google Scholar] [CrossRef]
  36. Trushkina, N.; Abazov, R.; Rynkevych, N.; Bakhautdinova, G. Digital transformation of organizational culture under conditions of the information economy. Virtual Econ. 2020, 3, 7–38. [Google Scholar] [CrossRef]
  37. Vasylieva, T.; Lyeonov, S.; Lyulyov, O.; Kyrychenko, K. Macroeconomic stability and its impact on the economic growth of the country. Montenegrin J. Econ. 2018, 14, 159–170. [Google Scholar] [CrossRef]
  38. Wang, L.; Zhang, P.; Ma, L.; Cong, X.; Skibniewski, M.J. Developing a corporate social responsibility framework for sustainable construction using partial least squares structural equation modeling. Technol. Econ. Dev. Econ. 2020, 26, 186–212. [Google Scholar] [CrossRef]
  39. Wu, X.; Chong, H.-Y.; Wang, G.; Li, S. The influence of social capitalism on construction safety behaviors: An exploratory megaproject case study. Sustainability 2018, 10, 3098. [Google Scholar] [CrossRef] [Green Version]
  40. Yevdokimov, Y.; Melnyk, L.; Lyulyov, O.; Panchenko, O.; Kubatko, V. Economic freedom and democracy: Determinant factors in increasing macroeconomic stability. Probl. Perspect. Manag. 2018, 16, 279–290. [Google Scholar] [CrossRef] [Green Version]
  41. Zhang, J.; Zhai, H.; Meng, X.; Wang, W.; Zhou, L. Influence of social safety capital on safety citizenship behavior: The mediation of autonomous safety motivation. Int. J. Env. Res. Public Health 2020, 17, 866. [Google Scholar] [CrossRef] [Green Version]
  42. Kwilinski, A.; Dielini, M.; Mazuryk, O.; Filippov, V.; Kitseliuk, V. System constructs for the investment security of a country. J. Secur. Sustain. Issues 2020, 10, 345–358. [Google Scholar] [CrossRef]
  43. Czyżewski, B.; Matuszczak, A.; Miskiewicz, R. Public goods versus the farm price-cost squeeze: Shaping the sustainability of the EU’s common agricultural policy. Technol. Econ. Dev. Econ. 2019, 25, 82–102. [Google Scholar] [CrossRef] [Green Version]
  44. Chygryn, O.; Bilan, Y.; Kwilinski, A. Stakeholders of green competitiveness: Innovative approaches for creating communicative system. Mark. Manag. Innov. 2020, 3, 356–368. [Google Scholar] [CrossRef]
  45. Dementyev, V.V.; Kwilinski, A. Institutional component of production costs. J. Inst. Stud. 2020, 12, 100–116. [Google Scholar] [CrossRef]
  46. Miskiewicz, R. The importance of knowledge transfer on the energy market. Polityka Energ. 2018, 21, 49–62. [Google Scholar] [CrossRef]
  47. Pająk, K.; Kvilinskyi, O.; Fasiecka, O.; Miskiewicz, R. Energy security in regional policy in Wielkopolska region of Poland. Econ. Environ. 2017, 2, 122–138. [Google Scholar]
  48. Prokopenko, O.; Slatvinskyi, M.; Biloshkurska, N.; Biloshkurskyi, M.; Omelyanenko, V. Methodology of national investment and innovation security analytics. Probl. Perspect. Manag. 2019, 17, 380–394. [Google Scholar] [CrossRef] [Green Version]
  49. Hazell, E.C. Disaggregating ecosystem benefits: An integrated environmental-deprivation index. Sustainability 2020, 12, 7589. [Google Scholar] [CrossRef]
  50. Petrova, T.; Grunin, A.; Shakhbazyan, A. integral index of traffic planning: Case-study of moscow city’s transportation system. Sustainability 2020, 12, 7395. [Google Scholar] [CrossRef]
  51. Pamučar, D.; Stević, Ž.; Sremac, S. A new model for determining weight coefficients of criteria in MCDM models: Full consistency method (FUCOM). Symmetry 2018, 10, 393. [Google Scholar] [CrossRef] [Green Version]
  52. Migilinskas, D.; Ustinovichius, L. Normalisation in the selection of construction alternatives. Int. J. Manag. Decis. Mak. 2007, 8, 623–639. [Google Scholar] [CrossRef]
  53. Gryshova, I.; Kyzym, M.; Hubarieva, I.; Khaustova, V.; Livinskyi, A.; Koroshenko, M. Assessment of the EU and Ukraine economic security and its influence on their sustainable economic development. Sustainability 2020, 12, 7692. [Google Scholar] [CrossRef]
  54. Kharazishvili, Y.; Grishnova, O.; Kamińska, B. Standards of living in Ukraine, Georgia, and Poland: Identification and strategic planning. Virtual Econ. 2019, 2, 7–36. [Google Scholar] [CrossRef] [Green Version]
  55. Grishnova, O.; Kharazishvili, Y. Demographic security of the population of Ukraine: Indicators, level, threats. Demogr. Soc. Policy 2019, 2, 65–80. [Google Scholar] [CrossRef]
  56. Kharazishvili, Y.; Grishnova, O. Quality of life in the system of social security of Ukraine: Indicators, level, threats. Econ. Ukr. 2018, 11–12, 157–171. Available online: http://nbuv.gov.ua/UJRN/EkUk_2018_11-12_13 (accessed on 6 June 2020).
  57. Kharazishvili, Y.M. Systemic Security of Sustainable Development: Assessment Tools, Reserves and Strategic Implementation Scenarios; Monograph; Institute of Industrial Economics, National Academy of Sciences of Ukraine: Kyiv, Ukraine, 2019; 304p.
  58. State Statistics Service of Ukraine. Available online: https://ukrstat.org/en/operativ/oper_new_e.html (accessed on 6 June 2020).
  59. Ptoukha Institute for Demography and Social Studies of the National Academy of Sciences of Ukraine. Available online: https://www.idss.org.ua/index_en (accessed on 6 June 2020).
  60. Ministry of Social Policy of Ukraine. Available online: https://www.msp.gov.ua/en/ (accessed on 6 June 2020).
  61. Ferreira, F.; Sancher-Paramo, C.A. A Richer Array of International Poverty Lines. Available online: https://blogs.worldbank.org/developmenttalk/richer-array-international-poverty-lines (accessed on 6 June 2020).
  62. Eurostat. Available online: https://ec.europa.eu/eurostat/web/population-demography-migration-projections/data (accessed on 6 June 2020).
  63. Eurostat. Available online: http://ec.europa.eu/eurostat/documents/2995521/8314163/3-16102017-BP-EN.pdf/d31fadc6-a284-47f3-ae1c-8212a581b0c1 (accessed on 6 June 2020).
  64. United Nations. Available online: http://data.un.org/ (accessed on 6 June 2020).
  65. Global Health Data Exchange. Available online: http://ghdx.healthdata.org/gbd-2016 (accessed on 6 June 2020).
  66. Central Intelligence Agency. Available online: https://www.cia.gov/library/publications/the-world-factbook/rankorder/2066rank.html (accessed on 6 June 2020).
  67. Eurostat. Available online: http://ec.europa.eu/eurostat/statistics-explained/index.php/People_at_risk_of_poverty_or_social_exclusion (accessed on 6 June 2020).
  68. Sukhorukov, A.I.; Kharazishvili, Y.M. Modelling and Forecasting of Socio-Economic Development of Regions of Ukraine; Monograph; NISD: Kyiv, Ukraine, 2012; 368p. [Google Scholar]
  69. Van Gigch, J. Applied General Systems Theory; Harper & Row: London, UK, 1978. [Google Scholar]
  70. Turner, J.C. Modern Applied Mathematics: Probability, Statistics, Operational Research; Van Nostrand Reinhold: New York, NY, USA, 1972. [Google Scholar]
  71. Kharazishvili, Y.; Lyashenko, V.; Zaloznova, Y.; Kvilinskyi, O. Impact of infrastructure component on socioeconomic approach to modernization of the region. Eur. Coop. 2016, 8, 108–119. [Google Scholar]
  72. Leondes, C.T.; Aoki, M. Modern Control. Systems Theory; McGraw-Hill: New York, NY, USA, 1965. [Google Scholar]
  73. Mishchuk, H.; Samoliuk, N.; Bilan, Y. Measuring social justice in the light of effectiveness of public distributive policy. Adm. Public Manag. Rev. 2019, 32, 63–76. [Google Scholar] [CrossRef]
  74. Bilan, Y.; Mishchuk, H.; Samoliuk, N.; Grishnova, O. ICT and economic growth: Links and possibilities of engaging. Intellect. Econ. 2019, 13. [Google Scholar] [CrossRef]
  75. Mishchuk, H.; Grishnova, O. Empirical study of the comfort of living and working environment—Ukraine and Europe: Comparative assessment. J. Int. Stud. 2015, 8, 67–80. [Google Scholar] [CrossRef]
  76. Bekey, G.A.; Karplus, W.J. Hybrid Computation; John Wiley & Sons: New York, NY, USA, 1968. [Google Scholar]
Figure 1. Homeostatic plateau of a dynamical system.
Sustainability 12 08953 g001
Figure 2. Generalised flow chart of adaptive control system with a reference model.
Sustainability 12 08953 g002
Figure 3. Dynamics of integral indexes: (a) Standards of living; (b) demographic component; (c) quality of life; (d) social safety of society.
Sustainability 12 08953 g003
Figure 4. Imbalances of components of social safety of society in Ukraine from the standpoint of sustainable development.
Sustainability 12 08953 g004
Figure 5. Dynamics of integral index and strategic goals of social safety of society.
Sustainability 12 08953 g005
Table 1. Formalised threshold vector values *.
Type of Indicator Probability Density FunctionLower ThresholdLower Optimal ValueUpper Optimal ValueUpper Threshold
Normal μ t × σ μ σ μ + σ μ + t × σ
Lognormal μ t × σ k a s μ σ k a s μ + σ μ + t × σ
Exponential μ σ k a s μ μ + σ μ + t × σ
Note: * For critical values, instead of t we use ± 3 σ or more for short samples.
Table 2. The vector of thresholds of indicators of social safety of society in Ukraine from the standpoint of sustainable development (for de-stimulators the order of threshold values changes backwards).
IndicatorsLower ThresholdLower Optimal ValueUpper Optimal ValueUpper ThresholdNormalisation FactorUkraine
2018
The standard of living
1. A share of labour use (a ratio of optimal labour demand to its supply) (S)0.80.90.981.01.00.7508
2. A share of salaries/wages in output (S)0.20.260.320.3820.3820.1746
3. A share of official GDP generated by shadow wages, % of GDP, (D)158535037.16
4. A shadow employment rate in total employment, % (D)20151073725.31
5. A rate of education spending to output, % (S)2.52.83.9661.6713
6. A rate of healthcare spending to output, % (S)44.96.37.47.40.9656
7. An average wage to living wage ratio (S)34678.55.043
8. A share of wages in the structure of income of the population, % (S)405060707037.64
9. A rate of retirement expenditure to output, % (S)581011114.3673
10. A rate of deficit of the Pension Fund of Ukraine to output, % (D)1.510.50.254.31.857
A demographic component
1. Life expectancy at birth, years (S)7678.481.283.68572.17
2. A depopulation ratio (a ratio of deaths to the number of births), (D)1.11.050.950.92.11.69
3. The total mortality rate (deaths per 1000 resident population), (D)9.18.16.84.71713.35
4. An infant mortality rate (deaths of those aged under 1 year per 1000 live births), (D)5.534.43.342.6137.81
5. The total fertility rate (children per a woman of reproductive age) (S)1.4831.6341.8342.162.21.3
6. A demographic burden of the disabled population (retirement age) to the working age population (the effective number of contributors), % (D)834726.618.3110102.55
7. The net population reproduction rate per a woman (S)0.6620.7560.9151.1881.250.617
The quality of life
1. A poverty rate (the percentage of population below the poverty line), % (D)22.519.515.512.36555.8
2. Population morbidity (the number of first registered cases of diseases), per 100,000 population (D)60,00050,00030,00020,00075,00067,698
3. The number of doctors of all majors per 10,000 population (S)354050606044.2
4. The number of nursing staff per 10,000 population (S)708810013513584.92
5. Enrolment rates in pre-primary education or primary schools, children aged 3 to 5, % (S)708090959555
6. Enrolment rates in secondary education, % (S)90979910010098.45
7. Enrolment rates in tertiary education, students per 10,000 population (S)220300450600600363
8. A crime rate, cases per 100,000 population (D)600030001500100065001540
Table 3. Strategic values of indicators and components of social safety of society in particular scenarios.
Components of Social Safety of Society20192020202120222024202620282030
Realistic scenario
Social safety of society0.38310.39380.40450.41520.43660.45790.47930.5039
Standard of living0.37070.38390.39710.41030.43660.46290.48900.5191
Demographic component0.33840.34810.35780.36760.38710.40680.42650.4493
Quality of life0.45600.46320.47040.47770.49260.50770.52300.5410
Optimistic scenario
Social safety of society0.39900.42190.44470.46760.51330.55900.60480.6500
Standard of living0.39040.41850.44660.47470.53050.58610.64140.6959
Demographic component0.35280.37370.39460.41570.45790.50030.54290.5850
Quality of life0.46670.48230.49830.51460.54790.58220.61710.6523
Sustainable development
Social safety of society0.40380.43240.46110.48970.54700.60430.66150.7193
Standard of living0.39600.43080.46560.50040.57000.63950.70910.7790
Demographic component0.35690.38340.40990.43630.48930.54230.59520.6495
Quality of life0.47240.49380.51510.53640.57910.62180.66450.7071
Table 4. Strategic values of the indicators for components of social safety of society at the end of 2030.
Components and IndicatorsRealistic ScenarioOptimistic ScenarioSustainable Development
The standard of living
1. A share of labour use (a ratio of optimal labour demand to its supply) (S)0.79110.8740.916
2. A share of salaries/wages in output (S)0.20800.2690.298
3. A share of official GDP generated by shadow wages, % of GDP, (D)30.139719.41314.788
4. A shadow employment rate in total employment, % (D)22.157614.27410.865
5. A rate of education spending to output, % (S)2.46863.7204.265
6. A rate of healthcare spending to output, % (S) 2.55544.5325.344
7. An average wage to living wage ratio (S)5.62706.7557.305
8. A share of wages in the structure of income of the population, % (S)41.035347.74151.069
9. A rate of retirement expenditure to output, % (S) 5.47077.4048.292
10. A rate of deficit of the Pension Fund of Ukraine to output, % (D)1.60671.1180.877
The demographic component
1. Life expectancy at birth, years (S)74.07278.88684.854
2. A depopulation ratio (ratio of deaths to number of births), (D) 1.5111.1760.853
3. Total mortality rate (deaths per 1000 resident population), (D)12.0599.5527.083
4. Infant mortality rate (deaths of those aged under 1 year per 1000 live births), (D)7.4106.4545.351
5. Total fertility rate (children per woman of reproductive age) (S)1.3701.5421.746
6. A demographic burden of the disabled population (retirement age) to the working age population (the effective number of contributors), % (D)90.16972.35156.859
7. A net population reproduction rate per a woman (S)0.6650.7780.909
The quality of life
1. A poverty rate (the percentage of population below the poverty line), % (D)50.0540.2434.76
2. Population morbidity (the number of the first registered cases of diseases), per 100,000 population (D)59,544.547,381.240,879.8
3. The number of doctors of all majors per 10,000 population (S)45.5248.8351.22
4. The number of nursing staff per 10,000 population (S)88.3796.9102.94
5. Enrolment rates in pre-primary education or primary schools, children aged 3 to 5 year old, % (S)55.8758.1159.75
6. Enrolment rates in secondary education, % (S)100.12100.0100.0
7. Enrolment rates in tertiary education, students per 10,000 population (S)378.91418.15445.8
8. A crime rate, cases per 100,000 population (D)1409.941081.82999.97
Table 5. Key benchmarks of major macro-indicators of social safety of society according to strategic sustainable development scenarios for Ukraine at the end of 2030.
Indicator2018Realistic ScenarioOptimistic ScenarioSustainable Development
GDP (nominal), billion UAH3558.724,834.633,905.656,148.7
An average real GDP growth rate, %3.3%4.5%7.5%12.5%
Nominal wages, UAH/month8865.070,089.1112,039.1195,847.0
Spending on education, billion UAH135.01253.52578.64895.9
Spending on healthcare, UAH billion78.01297.53141.76134.4
Living wage, UAH/month1745.012,456.016,586.426,808.2
Minimum wage, UAH/month3723.035,044.656,019.597,923.5
An average monthly pension, UAH2479.219,071.035,237.765,362.2
A poverty rate, %55.850.040.234.7
A replacement rate (a ratio of average pension to average wages)0.27970.27210.31450.3337
A demographic burden2.50.90.720.56
Official GDP created by shadow wages, %37.530.119.414.8
Publisher’s Note: MDPI stays neutral with regard to jurisdictional claims in published maps and institutional affiliations.

