Estimation of Equivalence Scale and Assessment of Its Impact on Poverty Measurement in Bangladesh


1
Finance Division, Ministry of Finance, 1000 Dhaka, Bangladesh
2
Department of Economics, Daegu University, Gyeongsan-si 38453, Korea
3
Department of Economics, Gachon University, 1342 Seongnamdaero, Sujeong-gu, Seongnam-si 13120, Korea
*
Author to whom correspondence should be addressed.
Sustainability 2020, 12(21), 9081; https://0-doi-org.brum.beds.ac.uk/10.3390/su12219081
Submission received: 17 August 2020
/
Revised: 21 October 2020
/
Accepted: 27 October 2020
/
Published: 31 October 2020
(This article belongs to the Section Economic and Business Aspects of Sustainability)
Abstract
:Anti-poverty policies for sustainable development require efficient targeting, for which appropriate poverty lines play a crucial role. In Bangladesh, official poverty lines are estimated with the implicit assumption that there are no economies of scale in household consumption with respect to household size or composition, which raises the question of the accuracy and reliability of the measurement of poverty line. We test the existence of economies of scale, estimate their size, and assess the impact of applying equivalence scale to poverty measurement, using the 2010 Household Income and Expenditure Survey data of Bangladesh. The results confirm the existence of economies of scale in household consumption. Following the model developed by Kakwani and Son, the overall index of economies of scale in household consumption is estimated around 0.85. Modified poverty lines show that under official poverty lines, the probability of being poor is high with respect to household size. The result implies that the poverty head-count ratio(HCR) for households with large number of members might be overestimated in Bangladesh, and that there may be an incentive for low income families to enlarge family size to avail of anti-poverty public transfers.
1. Introduction
This paper examines the poverty line that most anti-poverty policies are based on. We focus on the impact of economies of scale in household consumptions on the poverty line, which is captured by ‘equivalence scale’. We test the existence of economies of scale, estimate their size, and assess the impact of applying equivalence scale to poverty measurement, using the 2010 Household Income and Expenditure Survey data of Bangladesh.
As is well known, poverty is one of the major obstacles for sustainable development. It induces economic and political instability and also is harmful for human capital accumulation for economic growth (Taking this into consideration, the UNDP(United Nations Development Programme) has listed “No Poverty” at the top of its Sustainable Development Goals(SDSs) in 2015. See the web-site of UNDP (https://www.undp.org/content/undp/en/home/sustainable-development-goals.html)). To reduce poverty, public policies including anti-poverty public transfers are necessary (There have been debates regarding so-called ‘pro-poor policies’. See Kakwani et al. [1] and Ravallion [2]. Though Kakwani et al. [1] and Ravallion [2] have different views regarding anti-poverty development policies, they agree on the need for anti-poverty public transfers). To achieve the policy goal efficiently, correct targeting of public transfers is important, especially in developing countries where the budget for anti-poverty policies is limited. Exact targeting, as claimed by Besley and Kanbur [3], has become the most effective remedy for alleviating poverty. For such targeting, poverty lines play a crucial role.
In setting poverty lines, economies of scale in household consumptions have been one of the most important issues. In some countries such as Bangladesh, the official poverty lines are estimated with the implicit assumption that there are no economies of scale in household consumptions with respect to household size or composition. This assumption implies that the living expenditure of a two-member household is exactly twice that of a single-member household. However, household size and composition are critical factors in determining household welfare in the presence of economies of scale in household consumption (Lazear and Michael [4] showed that a two-adult household in the USA can save up to 31–35 percent of total expenditure in comparison to a single-adult family at the same per capita income level. Heshmati et al. [5] show that male-headed households have a 2∼4 percent lower consumption level than female-headed households, but this relative affluence of female-headed households changes drastically if allowing for household size-related economies of scale. These studies imply the importance of applying equivalence scale while assessing a household’s economic status). The ignorance of economies of scale in estimating official poverty lines raises the question of the accuracy and reliability of the measurement of poverty lines and may lead to misleading conclusions about poverty ratio and anti-poverty policies. In general, under the poverty line without considering economies of scale, the poverty ratio of households with a large number of members is overestimated, which can lead to the mistake of classifying them as poor. Biased poverty measurement may misguide policy makers to allocate limited resources in the wrong direction, resulting in failure to achieve the objectives of anti-poverty policies.
To adjust the poverty lines in view of economies of scale, the concept of equivalence scale has been introduced. The equivalence scale is measured as the ratio of a household of a given size or composition’s cost of living to that of a reference household, usually a single-adult household, assuming both households maintain the same level of utility. It helps us compare the well-being of households of different sizes, or, more generally, with different demographic profiles (Pollak and Wales [6]). The equivalence scales are now widely accepted in real policy processes. Many OECD publications comparing income inequality and poverty across countries have used equivalence scales. The OECD [7] used an equivalence scale called the Oxford Scale, which assigns a value of 1 to the household head, 0.7 to each additional adult, and 0.5 to each child. Recently, the OECD [8] used a simple equivalence scale that divided household income by the square root of household size (The OECD simple equivalence scale is frequently used because of its simplicity. For example, Park and Heshmati [9], who analyze the effect of labor market characteristics on women’s poverty in Korea, use the OECD simple equivalence scale).
In academia, there have been various studies to estimate the equivalence scale using households expenditure data of various countries. From the perspective of methodologies, there are two main approaches: Engel’s approach and Barten’s approach. Engel’s approach, based on the presumption that the food share of the total budget is a good indicator of the welfare of any household (Engel [10]), is simple and easy to apply. However, this approach has a weak point in that it does not consider the substitution effects between commodities. Barten’s approach, introduced by Barten [11], solves this problem by incorporating the household’s utility maximization problem into the model. Kakwani and Son [12] (Kakwani-Son hereafter) developed Barten’s approach, where they propose a method to estimate the equivalence scale without price information. This method, however, has a problem of under-identification, and as a result, an additional assumption that a certain good in households’ consumption basket is pure private good (These methods are explained in detail in Section 2).
Empirical works to estimate the equivalence scale, mostly using Engel’s approach, show that the results vary across countries. For developed countries, Daley et al. [13] estimate equivalence scales for eight countries including Canada, France, Israel, Poland, South Africa, Switzerland, Taiwan, and the United States with data ranging from 1999 to 2012 and they find considerable variations in economies of scale across countries. Their results suggest that measuring the equivalence scales for each country is an important issue in implementing anti-poverty policies. Furthermore, there might be significant differences in equivalence scales between a developed and a developing country, because consumption and production patterns within households would be different between them. For example, using Sri Lanka data, Jayasinghe et al. [14,15] show that domestic technology in developing countries affects economies of scale, which would not be observed in developed country. This implies that independent empirical works are needed for developing countries.
In estimating equivalence scales for developing countries, Kakwani-Son’s method appears good method, because, most of the cases, either high quality data on market prices of goods and services consumed by the households are not available or the actual prices might be far from the market prices. Surprisingly, empirical works based on Kakwani-Son’s method are very rare in developing countries. One of such works are carried out by Mok et al. [16] (Another study using Kakwani and Son’s model is Karbasi and Mohammadzadeh [17]. They assume, similar to Kakwani and Son [12] and Mok et al. [16], that the medicine good is a pure private good. While their results are similar to ours, we cannot access the paper’s results because detailed empirical results including standard errors are not reported). They apply Kakwani-Son’s model to household expenditure survey data of Malaysia. However, parts of their results are somewhat puzzling. Firstly, the paper reports that the aggregate index of equivalence scale is not significant; the index is significant only for the sample of lowest 5% income group. Secondly, the result shows that the transportation expenditure exhibits diseconomies of scale, which is not intuitive. The reason behind the puzzling result might be due to their assumption of medical service being a private good in Malaysia (Indeed, Mok et al. [16] pointed out that the assumption of healthcare expenditure being purely private good might be a problem, stating “This paper questions the applicability of the assumption of the unity index of economies of scale for healthcare expenditure as proposed by Kakwani-Son when the income elasticity of medical goods is high and the budget share for the good is low”, in their conclusion).
In this paper, we apply the Kakwani-Son’s method to the 2010 Household Income and Expenditure Survey (HIES) in Bangladesh. In doing so, we tackle the problem what Mok et al. [16] face. After a close investigation of consumption patterns of Bangladesh households and of the definition/boundary of variables in the survey data, we find that medical service is not a pure private good in Bangladesh. Conversely, transportation service seems very close to the pure private good. Based on the assumption that transportation is a pure private good, we test the existence of economies of scale in household consumption, estimate the size of equivalence scale, and assess the impact of applying equivalence scale to poverty measurement in Bangladesh.
Our study contributes to existing research in that we apply Kakwani-Son’s method with modified assumption to household data in a developing country. Bangladesh still is one of the least developing countries (LDCs) in the world with low GDP per capita and minimum purchasing power (Poverty head-count ratio at national poverty line is 31.5% in 2010 and 24.3% in 2016. According to Worldbank [18], shares of the population who consume less than 3.20$ a day (2011 ppp) are 60.4% in 2010 and 52.9% in 2016). Furthermore, in Bangladesh, the economies of scale are not considered for the official poverty line. Thus, the study using Bangladesh household survey data would provide the opportunity to assess the impact on poverty measurement with the estimated equivalence scale and to draw out policy implications.
There are several recent studies dealing with equivalence scales. Hasan [19] estimates the equivalence of scale using the same Bangladesh survey data as we use, but the paper follows Engel’s approach. Mok et al. [20] propose alternative poverty lines for Malaysia based on the estimated result of economies of scale. However, their estimation is based on food and non-food distinction, which is different from ours. Dudel et al. [21] compare various econometric methods to estimate the equivalence scale based on Engel’s approach using German survey data. Erus [22] examines the impact of considering economies scales on poverty levels in Turkey. Regier et al. [23] test the sensitivity of per capita expenditures to several methods of per adult equivalent expenditures to control for economies of scale and household composition in northern Ghana, show that the per capita expenditure is highly sensitive to the use of equivalence scales. Erus [22] and Regier et al. [23] show the importance of equivalence of scale in measuring poverty lines, but they do not estimate equivalence scales. To our knowledge, except Mok et al. [16] and Karbasi and Mohammadzadeh [17], our study is unique in applying Kakwani-Son’s method to the data of developing countries.
The rest of the paper is organized as follows. Section 2 briefly reviews the methodologies for the estimation of equivalence scales, and presents theoretical background developed by Kakwani and Son [12]. Section 3 describes the data and the empirical model. Section 4 presents main results and their implications. Concluding remarks are provided in Section 5.
2. Methodologies
2.1. Equivalence Scale Estimation Methods: Engel’s and Barten’s Approach
Engel’s approach is based on the presumption that the food share of the total budget is a good indicator of the welfare of any household (Engel [10]). The equivalence scale in this approach is measured by the ratio of the incomes of two different sized households that have the same food share of their total budget. Engel’s method has been used by the US Census Bureau to measure poverty ratio. Many studies developed the method of measuring equivalence scale in a similar way to Engel.
Engel’s approach is intuitive and easy to apply, and thus, is widely used even in recent studies. However, it has a weak point in that it does not consider the substitution effects between commodities. The studies following Engel’s approach such as Lanjouw and Ravallion [24] assume that all commodities provide the identical degree of economies of scale, but this assumption rules out the substitution effects, as pointed out by Kakwani and Son [12].
Barten’s approach, introduced by Barten [11], solves this problem by incorporating the household’s utility maximization problem into the model. Barten’s model is based on the assumption that household consumption can be divided into private and public goods. A household with n-members distributes its total expenditure for the consumption of two goods and maximizes its total utility. In estimating the model, Barten [11] uses food and housing expenditure as plausible proxies for private and public goods. Since then, many studies such as Deaton and Paxson [25], Gan and Vernon [26], and Logan [27] have estimated the equivalence scales by changing the definition of private and public goods based on Barten’s model.
Barten’s approach is further developed by Kakwani and Son [12]. They pointed point out that the estimation of economies of scale based on Barten’s model requires data on prices of goods and services households actually pay for. However, household surveys usually do not have data on market prices. Alternatively, researchers may use market prices instead of actual prices, but the market prices are not good proxies for actual prices as well. They also pointed out that the economies of scale differ not only across commodities but also across households.
On Barten’s theoretical foundation, they propose a model that incorporates substitute effects without the need of price information. One problem in the estimation of Kakwani and Son’s model is the under-identification problem. To resolve this problem, they need additional assumption that there is a pure private good in the basket of household consumptions. They assume that the medical and health-care service is the private good when they estimate the equivalence scale using Australian household survey data. The Kakwani-Son’s model is formally presented in the following subsection.
2.2. Kakwani-Son’s Model: Theoretical Background
Based on the household utility function of Barten [11], the Marshallian and Hicksian demand functions are derived as follow:
where is the quantity consumed for the th good, , and is the household composition parameter. Letting r () be a demographic category and be the number of persons in category r, the household size is and can be written as a function of ’s.
Differentiating the Hicksian demand function (2) with respect to , the utility compensated elasticity can be found:
where is the elasticity of with respect to and is the utility compensated price elasticity of th good with respect to the price of th good. Now, the following index denotes the index of economies of scale for the th good, where
The index becomes one if there is no economies of scale, and less than one if there are economies of scale.
The overall index of economies of scale is, using Euler’s theorem,
where is the budget share for th good. From Cournot’s condition implying for all j, we have
Because we can only observe Marshallian demand, we need to convert the index to a function of Marshallian demand parameters. From the Slutsky equation,
where is the Marshallian price elasticity of the th good with respect to the price of the th good and is the income elasticity. The overall index of economies of scale is then:
Price information is needed to calculate the elasticity under this equation. However, it is possible to determine the scale index without price information with the help of Marshallian elasticity. By defining , we obtain:
Now, Equation (8) can be written as:
The Equation (10) is the main equation based on which we estimate the overall and individual good’s economies of scale, and respectively. Here, and are to be estimated using household expenditure survey data. However, because is the sum of all , we need additional assumption to calculate the overall index of economies of scale. Following previous studies ([12,16]), we further assume that a certain good is purely private and its Marshallian demand elasticity is exactly one (There are alternative assumptions for the estimation. We may assume that all ’s are identical, leading to . Or, we can assume that two goods provide the same amount of economies of scale, in which case . See Kakwani and Son [12]).
3. Data and Estimation Method
3.1. Data and Descriptive Statistics
This study uses nationally representative micro data of the 2010 HIES in Bangladesh. This survey covered 12,240 households (out of 33.03 million households in the country) consisting of 7840 rural households and 4400 urban households. The survey covered 55,580 people (out of the total population of 148.49 million). A two-stage-stratified random sampling technique was used. The whole country was divided into 1000 Primary Sampling Units (PSUs) comprised of 640 rural and 360 urban PSUs and each PSU consisted of 200 households. A total of 612 PSUs were drawn in the first stage. These PSUs were selected from 16 different strata (6 rural, 6 urban, and 4 SMA strata). In the second stage, 20 households were selected from each of the PSUs. The survey collected detailed information on income, household expenditure, characteristics, composition, and the community as a whole. The survey was completed over a one-year period (1 February 2010 to 31 January 2011) to capture the seasonality and variation of income, expenditure, and consumption patterns. Given the aforementioned supervision and control, the quality of the data is high.
Table 1 reports the variables of interest with the mean, standard deviation, minimum, and maximum values. The monthly average total expenditure, non-food, and food expenditure are Tk 11,018.09, Tk 5141, and Tk 5871, respectively. There are on average 4.49 members per household, ranging from 17 to only one person per household. There are on average 1.3 earners per household, ranging from six to some households with no earners at all. The average age of the household head is 46 years and they have an average of only four years of education. Almost 88 percent of household heads are Muslim and almost 86 per cent of households are headed by males. Of the demographic compositions, there is an average of 0.27 boys under five years per household, while this figure is 0.26 for girls. The number of both males and females over 61 years old is only 0.14 per household. The largest population group is those aged 16–60 years. Children aged between 6–10 years account for the second largest population group (0.30 children) per household.
Table 2 presents the average share of consumption in aggregate expenditure from the lowest to the highest level of per capita expenditure (PCE). Among the expenditures, almost 60 percent of total expenditures (59.34%) are on food, followed by spending on different types of utilities (9.08%), shelter (7.39%), clothing (5.67%), and transportation (5.24%). Moreover, food expenditure alone represents almost 90 percent of food and shelter, while only food and clothing account for 65 percent of aggregate expenditure.
In line with Engel’s theory, the share of food expenditure gradually reduces with the increase in households’ purchasing power. While the share of food expenditure is 67.06 per cent in the lowest quartile of PCE, it is below 50 percent (47.47%) in the richest quartile. The same expenditure on clothing and different utilities follows the same pattern. On the other hand, expenditure on education, health, transportation, shelter, and miscellaneous expenditure show the opposite pattern. That is, the share of expenditure on these items gradually increase with the increase in PCE. For example, expenditure on education and health in the first quartile is only 2.18 percent and 2.99 percent of total expenditure, respectively, while the share increases to 6.48 percent and 4.58 percent of total expenditure in the richest quartile. Expenditure for developing human resources such as education expenditure of the highest quartile is almost three times that of the lowest expenditure group. Richer people spend more on human resources development (education, health, etc.), and poor people spend most of their income for survival.
3.2. Empirical Model and Estimation Strategy
Using HIES 2010 data, consumptions are categorized into eight different types to estimate the household size economies of scale. The eight major consumptions in Bangladesh are food, clothing, education, health, transportation, shelter, other utilities, and miscellaneous expenditures. Food expenditure includes both food made at home and meals away from the home. Food is the prime consumption expenditure, which covers almost 60 percent of all expenditures. In calculating transportation expenditure, only public transportation is considered. Other types of transportation such for education and treatment are excluded because transportation costs for these expenditures are part of education and treatment expenditure. Health expenditure includes treatment expenditure and recreation expenditure. Moreover, to check whether economies of scale differ among various income groups, separate economies of scale are also calculated for four income groups. For this purpose, the entire population was divided into four income groups.
Kakwani-Son’s proposed model [12] is used to estimate economies of scale in Bangladesh. Following their approach, Working-Leser Model developed by Working [28] and Leser [29] is used to compute Marshallian demand as follows:
Here, is the budget share of expenditure on the th good of total expenditure, n is household size, X is the total expenditure, is the constant, and indicates error terms. is the ratio of household members to various groups according to various ages and sex within the household. The coefficients , and are to be estimated.
With the estimated coefficients, the income elasticity () with respect to the th goods and Marshallian elasticity () of demand for th goods with respect to different age and sex population groups in the household are estimated by applying Equations (12) and (13) as follow:
Here, is the income elasticity of the th commodity; and is the Marshallian elasticity of demand for the th commodity with respect to . The elasticity of demand for the th commodity is calculated as with the condition of .
In estimating Equation (11) using a seemingly unrelated regression (SUR) model (Household consumption categories correlate with each other and each consumption equation is associated with error terms within other equation. The SUR model introduced by Zellner [30] is appropriate for solving the equation system with these characteristics), the simultaneous equation system allows us to estimate up to seven equations. The last equation is estimated by applying the condition of . The standard deviation of estimated indices of economies of scale is estimated by linear combination of the coefficients of Marshallian demands instead of the bootstrap method used by Kakwani and Son [12].
Kakwani and Son [12] postulate that some expenditures are assumed to be purely private in nature. They assumed medical and health care to be purely private in the Australian case. However, in failing to reject the null hypothesis that overall index of economies of scale differs significantly from one, Mok et al. [16] questioned the validity of assuming medical expenditure to be a purely private good in the case of Malaysia, though the authors still use the assumption of medical and health care being purely private in the empirical model.
In this paper, transportation expenditure is assumed to be a purely private good in the Bangladesh case. This is because the transportation sector is almost entirely run by the private sector and there is no public subsidy in transportation. Moreover, only general-purpose transportation is considered in calculating transportation expenditure. Transportation for education and treatment are included in education and treatment expenditure, not in transportation. On the other hand, medical expenditure is not a purely private good because public hospitals provide highly subsidized medical treatment and there is no health insurance system in Bangladesh.
4. Main Results and Discussion
4.1. Estimated Economies of Scale in Bangladesh
Table 3 summarizes the overall index of economies of scale () estimated by the Kakwani–Son’s model under the assumption that this varies across households and consumptions (From the estimation results, we can obtain the Marshallian demand elasticities and income elasticities. However, given the purpose of this study, we only focus on the estimated results of economies of scale). In the aggregate sample, the overall index of economies of scale is estimated to be 0.85, which confirms the existence of these in Bangladesh. The indices of first, second, third, and fourth quartile income groups are 0.85, 0.83, 0.85, and 0.83, respectively.
After computing overall index of economies of scale, it is essential to check its statistical significance. The null hypothesis is that the index of economies of scale is exactly one. Therefore, the t-statistic of should be computed to test the hypothesis of whether the index of economies of scale significantly differs from one. The t-value is in the aggregate sample is 9.146, which is statistically highly significant. Therefore, the null hypothesis that household the index of economies of scale does not significantly differ from one is rejected. Similarly, the t-values of overall index of economies of scale of the first to fourth quartile income groups are 3.75, 5.23, 5.35, and 4.37 respectively, indicating that the overall indices of economies of scale in all four quarters are statistically different from one. The result differs from Mok et al. [16] where the overall index of economies of scale over all income levels is not significant.
According to the results, the estimated overall index of economies of scale indicates that households with one more member can save up to 15 percent of their total expenditure without compromising their standard of living. The size of the economies of scale remained almost the same in every income group. This indicates that there is a great similarity in the pattern of savings from consumptions among different income groups in Bangladesh.
Among eight different consumption items, all but education have their own economies of scale. The findings have similarities with Kakwani-Son’s estimations using Australian data [12]. Utility and shelter represent the lowest economies of scale meaning higher saving by sharing these public goods among household members. The individual index of economies of scale of shelter in the aggregate sample is 0.734, which indicates households with one more member could save 27 percent of their expenditure on shelter. As expected, people in lower income groups could save more on shelter than their richer counterparts. The index of economies of scale of shelter is only 0.40 in the first quartile while it is 0.82 in the fourth quartile, which implies that poor people save around 60 percent by sharing accommodation, but rich people can save only 18 percent. On the other hand, poor people could save only 12 percent on their food expenditure from sharing while the richer people could save almost double. Overall, saving from sharing food is around 16 percent in Bangladesh. There are almost no economies of scale regarding expenditure on clothing, that is, clothing is a private good in Bangladesh. Since the economies of scale indices of education are greater than one in all specifications, education has diseconomies of scale. Therefore, education is a privately consumed good in Bangladesh, which increases as more people opt for it.
The result shows that the overall economies of scale index does not vary much in different income groups. However, the economies of scale index for each commodity is different across income groups. The food expenditure shows the highest economies of scale in the poorest income group, while the lowest ones in the richest income group. To the contrary, the expenditure on health care exhibits increasing economies of scale in income, and the expenditure on shelter shows very low equivalence scales in the poorest income group, and then non-monotone from second to fourth quartile. This result is notable in comparison with that of Jayasinghe et al. [31]. Applying Engel’s approach and using Sri Lanka data, they show that the equivalence scales are not base-independent. In other word, the equivalence scale index increases with the increase of income level of households. Their results are inconsistent with ours because the overall economies of scale are not monotone in income level. This implies that the distribution of equivalence scales in income groups may depend on non-identical consumption patterns of each economy.
4.2. Comparison with Previous Studies
The size of overall economies of scale in Bangladesh is higher than that of Australia estimated by Kakwani and Son [12]—only 0.66 in the aggregate sample-, but very close to that of Malaysia in estimated by Mok et al. [16]—0.93 in the aggregate sample. Surprisingly, the indices of economies of scale for food expenditure in Bangladesh, Australia, and Malaysia are almost the same (0.84, 0.80, and 0.89, respectively), though their food shares in total expenditure differ a lot (0.60, 0.20 and 0.34 respectively). This implies that as food constitutes the largest share a household in Bangladesh can save more from food than a household in Australian despite their similar indices for food.
Housing expenditure accounts for 7 percent of total expenditure in Bangladesh and 13 percent of total expenditure in Australia, but Australia has a smaller index for housing than Bangladesh. This implies that a household in Australia can save more by sharing living space than a household in Bangladesh. This is quite rationale because housing in a developed country such as Australia is not only more expensive but also constitutes a bigger share than that in a developing country such as Bangladesh. The economies of scale in Australia and Bangladesh differ because of different weights of each individual consumption type to the total household expenditure. Moreover, there are differences in the level of development, market structure, and living standards between Australia and Bangladesh, which depend on their respective development stage.
4.3. Assessment of Impact of Household Size Economies on Poverty
Since the estimated index of economies of scale is statistically significant and theoretically logical, we now use the estimated index to assess the impact of the scale on poverty measurement. Table 4 shows the equivalence scale calculated by applying the estimated economies of scale to the existing scale. The elasticity of the existing official equivalence scale is 1.00 while that of the newly estimated equivalence scale is 0.85, which indicates that with a given per capita income, larger households can improve their standard of living more than a single-member household by reallocating expenditure. According to Gibson [32], the equivalence scale of 0.85 implies that a 10-member household needs to spend only $0.708 per person per day to achieve the same standard of living as a single-member household spending $1 per person per day.
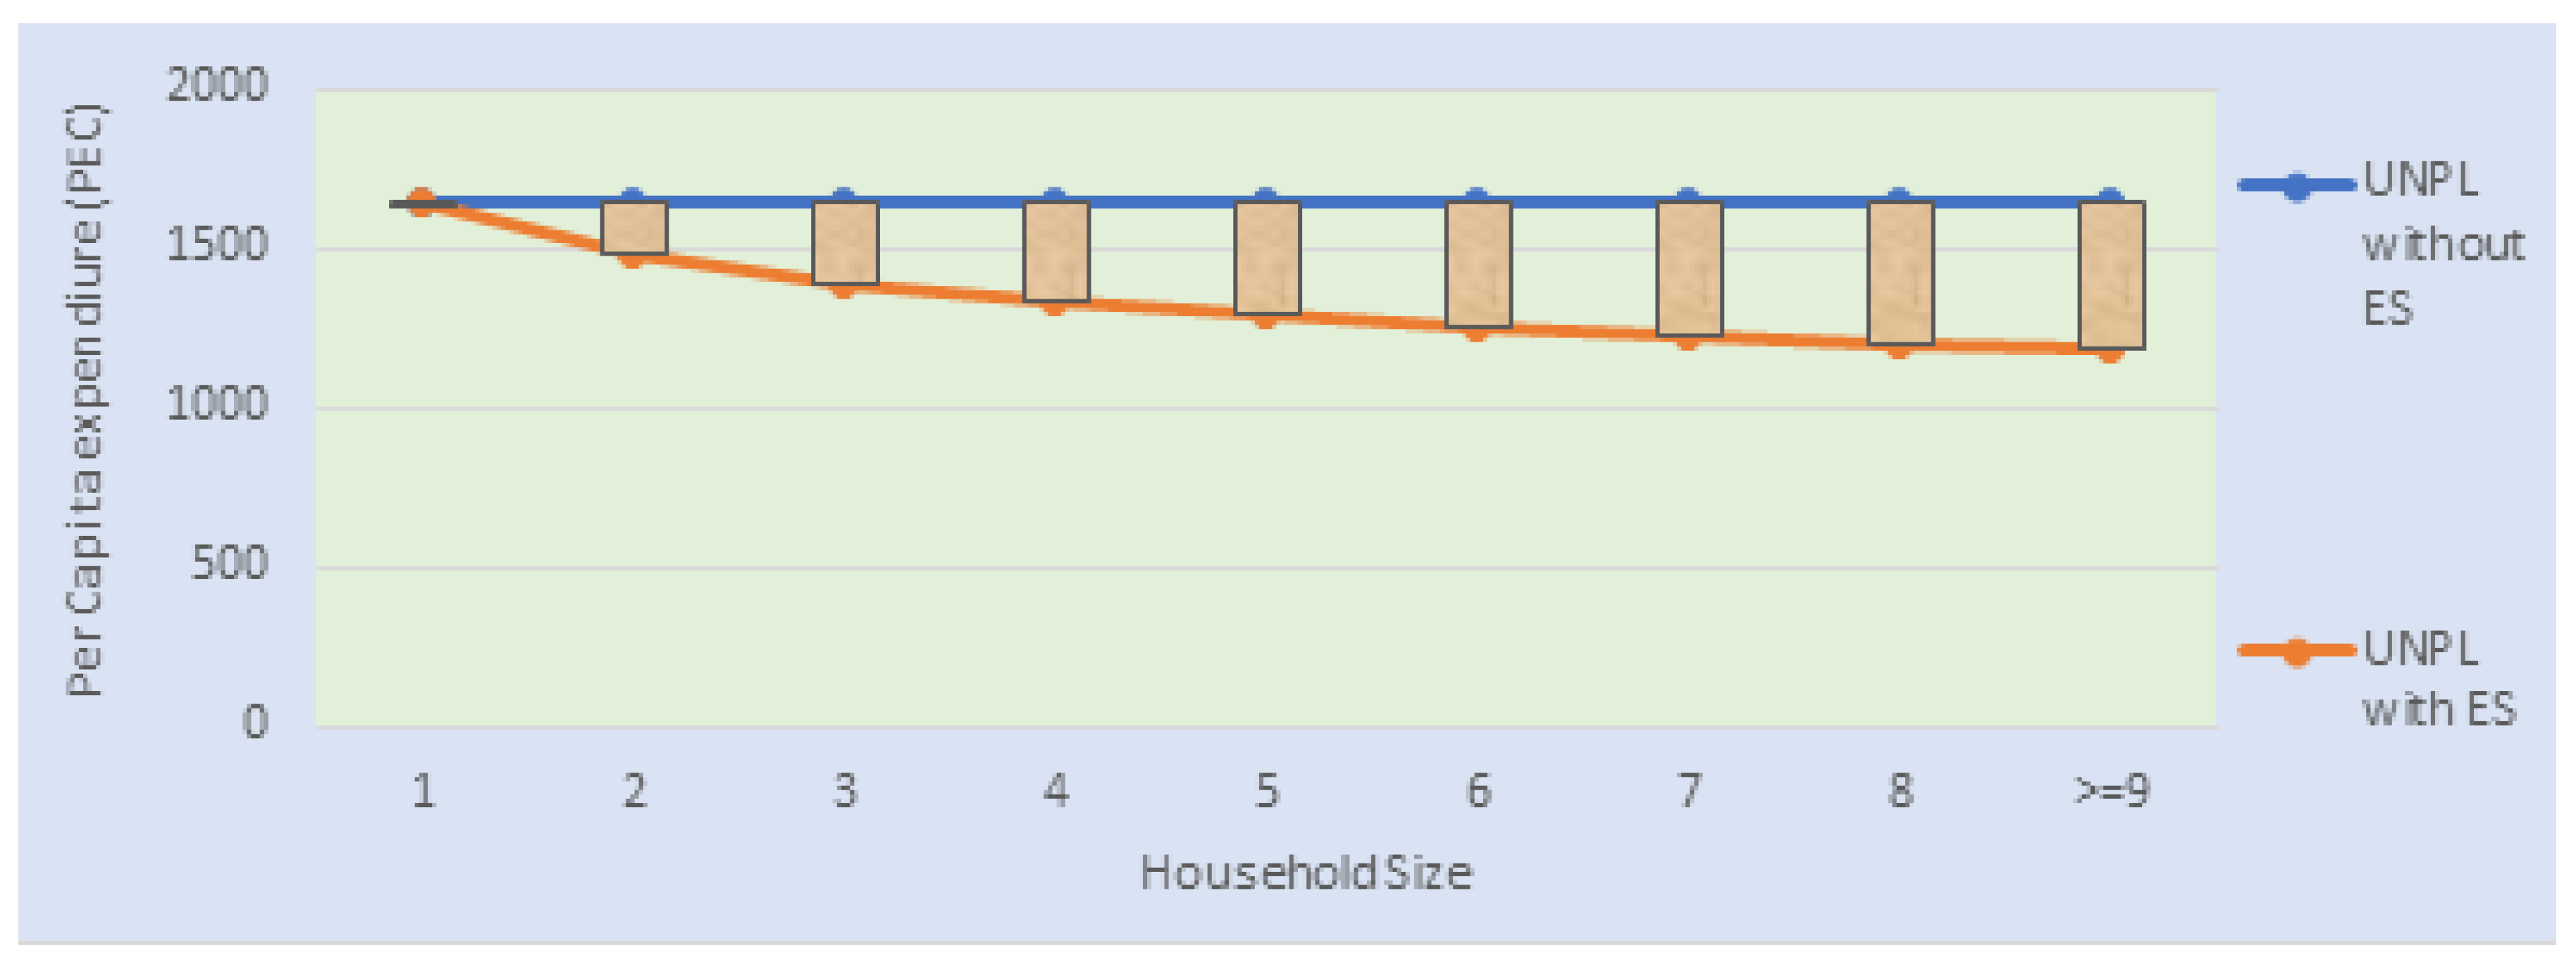
In estimating official poverty lines in Bangladesh, household economies of scale are ignored as we assume it does do not exist. Therefore, poverty lines are constant irrespective of household size. However, the average official poverty lines (upper) modified by the estimated equivalence scale decrease monotonically with the increase of household size (Figure 1).
Table 5 shows the impact of newly estimated equivalence scale on the poverty headcount ratio (HCR). The official poverty rate in Bangladesh is 31.5 percent but this falls to 14.22 percent if the modified poverty lines are used to calculate the poverty rate. By household size, almost 44 percent of households with more than seven members are poor under poverty lines without equivalence scale, while only 18.61 percent of such households are poor under poverty lines with equivalence scale. With the modification, the poverty ratio among households with more than five members falls to less than half. These results imply that some large households cannot be classified as poor if economies of scale are considered.
5. Concluding Remarks
This study tests and measures economies of scale in Bangladesh using the methodology of Kakwani and Son [12] with the modified assumption on the pure private good and household survey data of Bangladesh. According to the results, overall index of economies of scale is 0.85 in the aggregate sample. We conclude that economies of scale exist and are significant in household consumption in Bangladesh. Our analysis shows that due to the differences in composition of household consumptions and consumption patterns between developing and developed country, we need a modified assumption to estimate the economies of scale for developing countries.
The application of the estimated economies of scale in poverty measurement shows that poverty ratios that do not consider equivalence scale are overestimated for large households. Alternatively, some households may be identified as poor due to a higher number of family members, but they may not be truly poor. This leads to the hypothesis that there might be a high incentive for low income families to enlarge family size to be identified as poor just to avail of various anti-poverty public transfers, the test of which we leave for future research.
The findings provide important implications regarding the issues of determining targets of the government’s poverty reduction policies. According to the result, the official poverty rate under the official poverty line is more than twice the estimated poverty rate with equivalence scales. This suggests that there is a need to introduce the concept of an equivalence scales into the government’s official poverty rate measurement. However, there are some considerations when using this study in terms of policy. Although the World Bank’s recommendation is $1.5 to $2.00 per person per day, official poverty lines are very low in Bangladesh at less than $1 per person per day. Therefore, before applying equivalence scale, proper attention must be paid to standardize the minimum poverty threshold, otherwise it may provide misleading information regarding the true picture of poverty. In interpreting the results, it should also be noted that HIES data are collected using both diary keeping and recall method, which may cause measurement error as noted by Gibson [32].
Author Contributions
Conceptualization, M.M.R., S.-H.J. and K.-S.Y.; methodology, M.M.R., S.-H.J. and K.-S.Y.; software, M.M.R., and S.-H.J.; validation, S.-H.J. and K.-S.Y.; formal analysis, M.M.R. and S.-H.J.; investigation, M.M.R., S.-H.J., and K.-S.Y.; resources, M.M.R.; data curation, M.M.R.; writing—original draft preparation, M.M.R.; writing—review and editing, K.-S.Y.; visualization, K.-S.Y.; supervision, S.-H.J. and K.-S.Y. All authors have read and agreed to the published version of the manuscript.
Funding
This research received no external funding.
Acknowledgments
Authors greatly appreciate J. Hwang and S. Park at the Daegu University for his advice on econometric methodologies and technical supports.
Conflicts of Interest
The authors declare no conflict of interest.
References
- Kakwani, N.; Khandker, S.; Son, H.H.; Qureshi, S.K.; Arif, G.M. Pro-Poor Growth: Concepts and Measurements with Country Case Studies [with Comments]. Pak. Dev. Rev. 2003, 42, 417–444. [Google Scholar] [CrossRef] [Green Version]
- Ravallion, M. Pro-poor growth: A primer. In World Bank Policy Research Working Paper; No. WPS3242; World Bank: Washington, DC, USA, 2004; Available online: https://openknowledge.worldbank.org/handle/10986/14116 (accessed on 31 October 2020).
- Besley, T.; Kanbur, R. The Principles of Targeting. In World Bank Pre Working Paper No. 385; World Bank: Washington, DC, USA, 1990. [Google Scholar]
- Lazear, E.; Michael, R. Family Size and the Distribution of Per Capita Income. Am. Econ. Rev. 1980, 70, 91–107. [Google Scholar]
- Heshmati, A.; Maasoumi, E.; Wan, G. An Analysis of the Determinants of Household Consumption Expenditure and Poverty in India. Economies 2019, 7, 96. [Google Scholar] [CrossRef] [Green Version]
- Pollak, R.A.; Wales, T.J. Welfare Comparisons and Equivalence Scales. Am. Econ. Rev. 1979, 69, 216–221. [Google Scholar]
- OECD. The OECD List of Social Indicators; OECD: Paris, France, 1982.
- OECD. Divided We Stand-Why Inequality Keeps Rising; OECD: Paris, France, 2011.
- Park, Y.; Heshmati, A. The Effects of Labor Market Characteristics on Women’s Poverty in Korea. Economies 2019, 7, 110. [Google Scholar] [CrossRef] [Green Version]
- Engel, E. Die Lebenkosten belgischer arbeiter-familien fruher und jetzt. Int. Stat. Inst. Bull. 1895, 9, 1–74. [Google Scholar]
- Barten, A.P. Family composition, prices, and expenditure patterns. In Econometric Analysis for National Economic Planning; Hart, P.E., Mills, G., Whitaker, J.K., Eds.; Butterworths: London, UK, 1964. [Google Scholar]
- Kakwani, N.; Son, H.H. Economies of Scale in Household Consumption: With Application to Australia. Aust. Econ. Pap. 2005, 44, 134–148. [Google Scholar] [CrossRef]
- Daley, A.; Garner, T.I.; Phipps, S.; Sierminska, E. Differences across Place and Time in Household Expenditure Patterns: Implications for the Estimation of Equivalence Scales; Luxembourg Institute of Socio-Economic Research(LISER) Working Paper Series 2020-06. 2020. Available online: https://papers.ssrn.com/sol3/papers.cfm?abstract_id=3622246 (accessed on 31 October 2020).
- Jayasinghe, M.; Chai, A.; Ratnasiri, S.; Smith, C. The power of the vegetable patch: How home-grown food helps large rural households achieve economies of scale & escape. Food Policy 2017, 73, 62–74. [Google Scholar]
- Jayasinghe, M.; Ratnasiri, S.; Smith, C.; Chai, A. Domestic technology, consumption economies of scale and poverty: Evidence from Sri Lanka. Appl. Econ. 2018, 50, 62–74. [Google Scholar] [CrossRef] [Green Version]
- Mok, T.P.; Maclean, G.; Dalziel, P. Houshold Size Economies: Malaysian Evidence. Econ. Anal. Policy 2011, 41, 203–223. [Google Scholar] [CrossRef]
- Karbasi, A.; Mohammadzadeh, S.H. Estimating Household Expenditure Economies of Scale in Iran. In Proceedings of the 30th International Conference of Agricultural Economists, Vancouver, BC, Canada, 28 July–2 August 2018. [Google Scholar]
- World Bank. World Development Indicators 2020. Available online: https://databank.worldbank.org (accessed on 9 May 2020).
- Hasan, S.A. Engel curves and Equivalence Scales for Bangladesh. J. Asia Pac. Econ. 2016, 24, 301–315. [Google Scholar] [CrossRef]
- Mok, T.P.; Maclean, G.; Dalziel, P. Alternative Poverty Lines for Malaysia. Asian Econ. J. 2013, 27, 85–104. [Google Scholar] [CrossRef]
- Dudel, C.; Garbuszus, J.M.; Schmied, J. Assessing differences in household needs: A comparison of approaches for the estimation of equivalence scales using German expenditure data. Empir. Econ. 2020. [Google Scholar] [CrossRef] [Green Version]
- Erus, B. Equivalence scales and the change in poverty levels across time: Turkish case. Middle East Dev. J. 2020, 12, 24–34. [Google Scholar] [CrossRef]
- Regier, G.; Zereyesus, Y.A.; Dalton, T.J.; Amanor-Boadu, V. Do Adult Equivalence Scales Matter in Poverty Estimates? A Northern Ghana Case Study and Simulation. J. Int. Dev. 2019, 31, 80–100. [Google Scholar] [CrossRef]
- Lanjouw, P.; Ravallion, M. Poverty and Household size. Econ. J. 1995, 105, 1415–1434. [Google Scholar] [CrossRef]
- Deaton, A.; Paxson, C. Economies of Scale, Household Size and the Demand for Food. J. Political Econ. 1998, 106, 897–930. [Google Scholar] [CrossRef]
- Gan, L.; Vernon, V. Testing the Barten Model of Economies of Scale in Household Consumption: Toward Resolving a Paradox of Deaton and Paxson. J. Political Econ. 2003, 111, 1361–1377. [Google Scholar] [CrossRef]
- Logan, T.D. Economies of Scale in the Household: Puzzles and Patterns from the American Past. Econ. Inq. 2011, 49, 1008–1028. [Google Scholar] [CrossRef] [Green Version]
- Working, H. Statistical Laws of Family Expenditure. J. Am. Stat. Assoc. 1943, 38, 43–56. [Google Scholar] [CrossRef]
- Leser, C.E. Forms of Engel Function. Econometrica 1963, 31, 694–703. [Google Scholar] [CrossRef]
- Zellner, A. An Efficient Method of Estimating Seemingly Unrelated Regressions and Tests for Aggregation Bias. J. Am. Stat. Assoc. 1962, 57, 348–368. [Google Scholar] [CrossRef]
- Jayasinghe, M.S.; Smith, C.; Chai, A.; Ratnasiri, S. The implications of income dependent equivalence scales for measuring poverty in Sri Lanka. Int. J. Soc. Econ. 2016, 43, 1300–1314. [Google Scholar] [CrossRef]
- Gibson, J. Why Does the Engel Method Work? Food Demand, Economies of Size and Household Survey Methods. Oxf. Bull. Econ. Stat. 2002, 64, 341–359. [Google Scholar] [CrossRef] [Green Version]
Figure 1.
Comparison of upper national poverty line (UNPL) with and without equivalence scale (ES).


Table 1.
Summary statistics for variables of interest.
| Variable | Description | Mean | St. dev. | Min | Max |
|---|---|---|---|---|---|
| aggre-exp | Monthly total expenditure (TK) | 11,018.09 | 9730.53 | 530.57 | 213,882.30 |
| aggre-nfd | Monthly non-food expenditure (Tk) | 5141.70 | 7279.96 | 0 | 175,843.3 |
| aggre-fd | Monthly food expenditure (Tk) | 5871.12 | 3659.32 | 156.42 | 58,943.57 |
| no-hh | Household Size | 4.49 | 1.86 | 1 | 17 |
| no-earner | No. of earners in a household | 1.305 | 0.8103 | 0 | 6 |
| age-head | Age of household head | 45.73 | 13.902 | 14 | 122 |
| edu-head | Education of head (years) | 3.9630 | 4.9935 | 0 | 18 |
| sex-head | Dummy (1 if household head is male) | 0.8609 | 0.3460 | 0 | 1 |
| relig-head | Dummy (1 if Muslim) | 0.8844 | 0.3196 | 0 | 1 |
| rural | Dummy (1 if rural) | 0.7317 | 0.4430 | 0 | 1 |
| no m05 | No. of males with age of 0–5 years. | 0.2777 | 0.5167 | 0 | 4 |
| no m610 | No. of males with age of 6–10 years. | 0.3085 | 0.5471 | 0 | 4 |
| no m1115 | No. of males with age of 11–15 years. | 0.2665 | 0.5114 | 0 | 4 |
| no m1660 | No. of males with age of 16–60 years. | 1.2279 | 0.8297 | 0 | 7 |
| no m61 | No. of males with age over 61 years. | 0.1467 | 0.3552 | 0 | 2 |
| no fm05 | No. of females with age of 0–5 years. | 0.2606 | 0.5061 | 0 | 5 |
| no fm610 | No. of females with age of 6–10 years. | 0.2955 | 0.539 | 0 | 4 |
| no fm1115 | No. of females with age of 11–15 years. | 0.2462 | 0.4914 | 0 | 4 |
| no fm1660 | No. of females with age of 16–60 years. | 1.3269 | 0.6972 | 0 | 6 |
| no fm61 | No. of females with age over 61 years. | 0.1388 | 0.3487 | 0 | 2 |
Note: Consumption expenditures are measured in Bangladeshi local currency unit Taka. All means are weighted average calculated using population weights given in the survey.
Table 2.
Consumption composition (percent): aggregate and by quartile.
| Variable | Aggregate | 1st Quartile | 2nd Quartile | 3rd Quartile | 4th Quartile |
|---|---|---|---|---|---|
| Share of food | 59.34 | 67.06 | 63.37 | 59.26 | 47.47 |
| Share of clothing | 5.67 | 6.13 | 6.01 | 5.66 | 4.87 |
| Share of education | 3.95 | 2.18 | 2.95 | 4.22 | 6.48 |
| Share of health | 3.73 | 2.99 | 3.52 | 3.85 | 4.58 |
| Share of transportation | 5.24 | 3.63 | 4.55 | 5.64 | 7.15 |
| Share of shelter | 7.39 | 4.38 | 5.68 | 7.1 | 12.47 |
| Share of utility | 9.08 | 10.47 | 9.64 | 8.79 | 7.39 |
| Share of miscellaneous | 5.57 | 3.13 | 4.24 | 5.43 | 9.55 |
| Share of food and clothing | 65.01 | 73.19 | 69.38 | 64.93 | 52.34 |
| Share of food in food and shelter | 88.86 | 93.79 | 91.85 | 89.52 | 80.13 |
Note: Consumption expenditures are measured in Bangladeshi local currency unit Taka.
Table 3.
Estimated economies of scale indices ().
| Variable | Whole Sample | 1st Quartile | 2nd Quartile | 3rd Quartile | 4th Quartile |
|---|---|---|---|---|---|
| Share of food | 0.843 *** | 0.88 *** | 0.805 *** | 0.815 *** | 0.767 *** |
| (0.0045) | (0.0074) | (0.0081) | (0.0089) | (0.0126) | |
| Share of clothing | 0.958 *** | 0.96 *** | 0.938 *** | 0.937 *** | 0.870 *** |
| (0.0122) | (0.0275) | (0.0249) | (0.0227) | (0.0256) | |
| Share of education | 1.36 *** | 1.45 *** | 1.56 *** | 1.469 *** | 1.423 *** |
| (0.0350) | (0.0839) | (0.0749) | (0.0632) | (0.0587) | |
| Share of health | 0.784 *** | 0.732 *** | 0.797 *** | 0.819 *** | 0.838 *** |
| (0.0339) | (0.0624) | (0.0634) | (0.0621) | (0.0726) | |
| Share of transportation | 1.00 | 1.00 | 1.00 | 1.00 | 1.00 |
| (-) | (-) | (-) | (-) | (-) | |
| Share of shelter | 0.734 *** | 0.409 *** | 0.887 *** | 0.783 *** | 0.826 *** |
| (0.0262) | (0.0527) | (0.0502) | (0.0471) | (0.0454) | |
| Share of utility | 0.55 *** | 0.52 *** | 0.579** | 0.59 *** | 0.552 *** |
| (0.0105) | (0.0186) | (0.0207) | (0.0208) | (0.0275) | |
| Share of miscellaneous | 0.963 *** | 1.073 *** | 0.998 *** | 1.127 *** | 0.878 ** |
| (0.0294) | (0.0487) | (0.0526) | (0.0520) | (0.0529) | |
| Overall economies of | 0.85 | 0.851 | 0.834 | 0.852 | 0.830 |
| scale index () | (0.0164) | (0.04006) | (0.0317) | (0.0284) | (0.0389) |
Note: The coefficients of variables are calculated using the SUR model without weight. **, and *** indicate significance at the 5%, and 1% level, respectively. The standard errors of are in parenthesis and computed using the post-estimation command “LINCOM” in “STATA”.
Table 4.
Calculation of equivalence scale.
| Household Size | 1 | 2 | 3 | 4 | 5 | 6 | 7 | 8 | 9 | 10 | Elasticity |
|---|---|---|---|---|---|---|---|---|---|---|---|
| Existing scale | 1 | 2 | 3 | 4 | 5 | 6 | 7 | 8 | 9 | 10 | 1.00 |
| Estimated scale | 1.00 | 1.80 | 2.54 | 3.25 | 3.93 | 4.59 | 5.23 | 5.86 | 6.47 | 7.08 | 0.85 |
Note: Equivalence scale is calculated using the aggregate sample.
Table 5.
Poverty headcount ratio (HCR).
| Household Size | Overall | 1 | 2 | 3 | 4 | 5 | 6 | 7 | 8 | ≥9 |
|---|---|---|---|---|---|---|---|---|---|---|
| HCR without Scale | 0.32 | 0.19 | 0.15 | 0.21 | 0.28 | 0.33 | 0.39 | 0.44 | 0.46 | 0.33 |
| HCR with Scale = 0.85 | 0.14 | 0.19 | 0.10 | 0.11 | 0.13 | 0.16 | 0.17 | 0.18 | 0.19 | 0.09 |
Publisher’s Note: MDPI stays neutral with regard to jurisdictional claims in published maps and institutional affiliations. |
© 2020 by the authors. Licensee MDPI, Basel, Switzerland. This article is an open access article distributed under the terms and conditions of the Creative Commons Attribution (CC BY) license (http://creativecommons.org/licenses/by/4.0/).
Share and Cite
MDPI and ACS Style
Rahman, M.M.; Jeon, S.-H.; Yoon, K.-S. Estimation of Equivalence Scale and Assessment of Its Impact on Poverty Measurement in Bangladesh. Sustainability 2020, 12, 9081. https://0-doi-org.brum.beds.ac.uk/10.3390/su12219081
AMA Style
Rahman MM, Jeon S-H, Yoon K-S. Estimation of Equivalence Scale and Assessment of Its Impact on Poverty Measurement in Bangladesh. Sustainability. 2020; 12(21):9081. https://0-doi-org.brum.beds.ac.uk/10.3390/su12219081
Chicago/Turabian StyleRahman, Md. Matiur, Seung-Hoon Jeon, and Kyoung-Soo Yoon. 2020. "Estimation of Equivalence Scale and Assessment of Its Impact on Poverty Measurement in Bangladesh" Sustainability 12, no. 21: 9081. https://0-doi-org.brum.beds.ac.uk/10.3390/su12219081
Note that from the first issue of 2016, this journal uses article numbers instead of page numbers. See further details here.