A Macro Perspective on the Relationship between Farm Size and Agrochemicals Use in China


1
National School of Agricultural Institution and Development, South China Agricultural University, Guangzhou, Guangdong 510642, China
2
Department of Chemistry and Environmental Science, New Jersey Institute of Technology, Newark, NJ 07102, USA
3
Division of Environment and Production Technology, International Food Policy Research Institute, Washington, DC 20005, USA
4
Department of Statistics, Columbia University, New York, NY 10027, USA
*
Author to whom correspondence should be addressed.
Sustainability 2020, 12(21), 9299; https://0-doi-org.brum.beds.ac.uk/10.3390/su12219299
Submission received: 13 October 2020
/
Revised: 2 November 2020
/
Accepted: 3 November 2020
/
Published: 9 November 2020
(This article belongs to the Section Sustainable Agriculture)
Abstract
:Agrochemicals are overused in China. One strategy to reduce agrochemical use is to increase farm size because of the potential effect of economy of scale. Existing studies at a micro scale present mixed and often conflicting results on the relationship between agrochemical use and farm size. This study aimed to assess that relationship from a macro perspective using an aggregated panel dataset in 30 provinces in China from 2009 to 2016. The empirical results confirm the existence of both economy and diseconomy of scale effects on agrochemical use in China. The agrochemical application rates decreased as the proportion of farms between 0.667 and 2 ha increased. The diseconomy of scale existed when significantly larger farms, such as the farms larger than 3.34 ha, continued to emerge. Given the fact that 78.6% of farms are under 0.667 ha in China, our results suggest that the reduction strategy based on only expanding farm size might achieve some initial success in reducing agrochemical use, but the effect would fade away and be reversed as significantly large farms continue to emerge. These results have significant policy implications as China is proactively developing and implementing various policies and strategies to modernize its agriculture toward achieving its sustainability goals.
1. Introduction
China is the largest agrochemical user in the world. In 2018, China used 26.1%, 19.4%, and 27.8% of the global nitrogen, phosphate, and potassium fertilizers, respectively, and 43% of the total global pesticides (http://www.fao.org/faostat). Although agrochemical use is essential to maintain high grain productivity and ensure food security in China [1,2,3,4], it is generally realized that agrochemicals have been overused in China [1,4,5,6,7,8]. The Ministry of Ecology Environment of China estimated that the utilization rate was only 37.8% for fertilizers and 38.8% for pesticides in rice, corn, and wheat production in 2017 [9]. Previous research reported °, 64, and 17% of pesticide overuse for rice, cotton, and maize production in China, respectively [10]. Agrochemical overuse wastes resources, increases agricultural production costs, and causes agricultural pollution [11]. Excessive fertilizer degrades soil and causes land compaction and soil acidification [12]. Fertilizer overuse also causes eutrophication of surface waters and nitrate pollution of groundwater in China [13]. Pesticide overuse in China has also been related to environmental pollution [8,14], food safety [15], and human health risk [2,16,17]. There is an urgent need to develop and implement effective strategies to reduce agrochemical use in China [7,13,18].
Agrochemical use and use efficiency in China have been subject to extensive research. There are significant variabilities in agrochemical use and use efficiency across different regions due to great spatial variations in biophysical conditions such as climate, soil and topography in China and agrochemical use should adapt to these specific conditions [3,4,19,20]. Agrichemical use is also crop-specific and a significant amount of research is dedicated to improving agrochemical use efficiency of specific crops [1,8,10]. Research found that cash crops such as fruits and vegetables generally used more agrochemicals than grain crops such as maize, wheat, and rice [8,21,22]. With the economy in China growing, the planting structure is undergoing substantial changes: more farmlands are switched from grain production to cash crop production, which has contributed to the increase in agrochemical use [23]. Studies have also suggested that fertilizer overuse and fertilizer use efficiency varied significantly among farmers across China [4,22,24], which implies significant room for improvement in agrochemical use. Research suggested that farmer education and training on agrochemical use has helped reduce both fertilizer and pesticide use [7,25,26]. Climate change has significant impacts on crop yields and farm income [27]. Studies were also dedicated to understanding the root-causes of agrochemical overuse in China [1,28]. The fertilizer overuse in China was the result of the artificially low fertilizer prices caused by the agricultural support policies in conjunction with massive subsidy programs to the fertilizer industry to ensure food security [1]. A recent study found that many direct and indirect agricultural support policies significantly contributed to the increased use of fertilizers in China with a few exceptions and called for agricultural support policies using “green box” measures to reduce agrochemical use and increase agricultural sustainability in China [29].
Agricultural production in China is dominated by smallholder farms because of the Household Contract Responsibility System (HCRS), which allocates the use rights of collectively owned farmland to rural households based on long-term contracts between households and local village collectives [30]. According to the China Rural Statistics Yearbook, the per capita arable land area in rural China was only 0.234 hectares (ha) in 2017. One way to reduce agrochemical use is to increase farm size because of the potential effect of economy of scale [6,7,31]. A study based on the China Agricultural Census in 2006 observed the economy of scale effect between farm size and fertilizer use in China and suggested that the fertilizer use reduction and efficiency improvement can be achieved by increasing the farm size [6]. The same strategy was echoed by a recent study, which argued that increasing large-scale farms could reduce agrochemical uses for two main reasons. First, it is more cost-effective for large-scale farms to adopt modern agricultural technology and management. Second, large-scale farm operators are the self-selected individuals who generally possess better agricultural knowledge and skills [7]. Other empirical studies also suggested a negative correlation between farm size and the level of agrochemical use in China [22,31,32].
However, the economy of scale of farm size on agrochemical use is not universally observed in China. Some empirical studies dismissed the significant correlation between farm size and agrochemical use [33]. Other empirical studies even suggested a diseconomy of scale, i.e., a positive relationship between farm size and agrochemical use [29,34,35]. The diseconomy of scale on agrochemical use was attributed to the short-term profit motive of farmers, planting structure change, farmers’ willingness to increase agricultural inputs, capital intensive farming operation, and farmers’ inability to efficiently use agrochemicals on large farms [34,36,37,38]. Moreover, most farmers who operate those large farms were evolved from smallholder farmers, and their knowledge and skills were inadequate to operate large scale farms, which results in low efficiency in agrochemical use [38]. Furthermore, one study suggested a U-shaped relationship between the farm size and the intensity of agrochemical use, i.e., agricultural chemicals use intensity decreased first, became flat, and then increased as the farm size increased [12].
In general, these empirical assessments present mixed results on the relationship between farm size and agrochemical use in China. Such mixed results might be attributed to a sample selection bias as these studies were based on surveys at an individual farm level. The samples being used might be limited to certain geographic regions and/or certain types of farming operations. Local biophysical conditions such as soil and climate, and socioeconomic factors such as availability of agricultural services and agrochemical prices, could affect farmers’ decision on agrochemical use [2,39]. The average farm sizes in those empirical studies were generally small and less than 1 ha, and therefore their findings regarding the economies of scale effect on agrochemical use might not represent the whole spectrum of farms in China. Particularly, they might not capture the effect on agrochemical use due to the changes in planting structures experienced by large-scale farms [40,41].
The objective of this study is to assess the relationship between farm size and agrochemical use using aggregated provincial data at a macro scale. The aggregated panel dataset contained the annual information on agrochemical uses, farms, and farmers in 30 provinces in China from 2009 to 2016, which was compiled from several national statistical databases, including China Statistical Yearbooks, China Population and Employment Statistics Yearbooks, China Rural Statistical Yearbooks compiled and published by the National Bureau of Statistics of China, and the Statistical Database on Rural Operations and Management distributed by the Ministry of Agriculture of China. The use of aggregated provincial data that contains all farms in China eliminates the sample selection bias embedded in other empirical studies as discussed above. There is no other study that has attempted to study the relationship between farm size and agrochemical use from a macro perspective using the aggregated provincial data in China.
2. Methods
A linear fixed-effect model was applied to a panel data from 30 provinces in China during the 2009–2016 period. Following Greene (2000) and Wooldridge (2010) [42,43], the model was specified as follows:
where the dependent variable yit is the agrochemical use intensity in Province i at Year t, the vector Xit represents the independent variables on farm size in Province i at Year t, the vector Zit are the control variables in Province i at Year t, and are the vectors of the regression coefficients, and εit the error term. The fixed-effect model was estimated by calculating the ordinary least square (OLS) estimate with cross-time demeaning variables [43,44,45]. More specifically, the estimation was implemented by applying the fixed-effect model estimate function PanelOLS in statsmodels.linearmodles package Version 4.17 under the Python 3.7.6 environment [46].
The robustness of the model was validated using a bootstrap method, a powerful nonparametric statistical tool [47,48,49]. The bootstrap method has become increasingly popular in economics [50], and medical research [51], where observations are noisy, and modeling results might be sensitive to a few outliers. The bootstrap method uses resampling data and tests the sensitivity of modeling results without additional assumptions. We took 10,000 iterations in the bootstrap analysis. In each iteration, we resampled the observations uniformly with replacements. Each bootstrap data set had the same size as the original data. We fitted the fixed-effect model on the bootstrap data and estimated the coefficients. The 10,000 estimates of the coefficients from the fitted models were used to form a “bootstrapped” distribution of the coefficient and assess its significance and robustness.
The dependent variable for this study was specified as agrochemical application rates in kilograms per hectare (kg/ha) derived from the data on agrochemical uses and sowing area in the China Statistical Yearbooks between 2009 and 2016. This study considered two categories of agrochemical uses: chemical fertilizers and pesticides. The chemical fertilizer and pesticide application rates were calculated by dividing the total amount of annual chemical fertilizer and pesticide use by the sowing area in each province, respectively.
Most micro-scale studies used per capita farmland to represent farm size [7,38]. This study included two types of independent variables on fam size at a macro scale. The first one was the farm size measured by average arable land per rural household in each province each year. While the data on the total number of rural households was extracted from the Statistical Database on Rural Operations and Management, the data on the total arable lands were from the China Statistical Yearbooks. The second one was the farm composition with different farm sizes in each province extracted from the Statistical Database on Rural Operations and Management. The database contained the total number of rural households and the number of households in five different categories of farm size, namely, below 10, 10–30, 30–50, 50–100, and over 100 mu in each province each year from 2009 to 2016. The unit, mu, is the unit for measuring the land area in China, and one mu is equivalent to 0.0667 ha. The Statistical Database on Rural Operations and Management reported the number of farms with arable land less than 10, 10–30, 30–50, 50–100, 100–200 and above 200 mu. This study combined the last two categories into one since the numbers of farms with arable land of 100–200 mu and above 200 mu was small. The farm composition variables were specified as the percentages of farms in the five farm size categories, i.e., the total number of households in each of the five farm size categories divided by the total number of farm households in each province each year.
The control variables included rural labor migration, farmers’ education, planting structure, and farm household income. Under the current Household Registration System called Hukou in China, the rural residents may migrate to live and work in cities, but still maintain their use rights to farmland in their rural village collectives. Such labor out-migration from rural China results in an increase in agrochemical use [7,52]. The Statistical Database on Rural Operations and Management recorded the total numbers of three types of households with varying degrees of rural labor migration. Type 1 are the households whose primary income comes from farming with supplementary income from non-farm employment. Type 2 are the households that operate farms but derive income primarily from non-farm employment. Type 3 are the households that no longer operate farms and are employed in non-farm-related occupations. The control variables on rural labor migration were the percentages of these three types of households among the total number of rural households.
Agrochemical overuse is attributed to farmers’ lack of understanding of the detrimental effects of those chemicals [7,53,54,55], and of scientific knowledge on appropriate use of agrochemicals [2], which are closely tied to farmers’ education. Thus, this study also included the control variables on farmers’ education level. The control variables on education were the percentages of farmers with primary school, junior high school, senior high school, and some college education in each province per year, which were derived from the China Population and Employment Statistics Yearbook. Planting structure influences the use of agrochemicals [40], and was specified as the percentage of arable land planted with grains, vegetables, or fruits. Studies also show that agrochemical overuse is related to farmers’ income [7,56]. Therefore, this study included a control variable on farmers’ income, which was specified as the average disposable per capita income of rural households. The data on both disposable per capita income and planting structure were all derived from the China Rural Statistical Yearbook. Consider the significant efforts being taken by the Chinese government to reduce agrochemical use in recent years, which might have a systematic impact on agrochemical use in China. This study also included control variables on years using dummy variables.
3. Results
The descriptive statistics for each variable were presented in Table 1. The average fertilizer application rate in China was 365.12 kg/ha but varied significantly by province across different years, ranging from 150.99 kg/ha to 637.55 kg/ha. The average pesticide application rate in China was 12.42 kg/ha ranging from 1.96 kg/ha to 56.32 kg/ha. The average farm size in China was 0.43 ha, and 92.49% of farms were less than 2 ha (30 mu). The farms greater than 6.67 ha (100 mu) accounted for only 2.38% of farms in China. Off-farm employment is widespread in China. Among rural households, 35.11% generated some of their disposable income from non-farm employment. In terms of education, 91.18% of farmers in China had some level of education, which were mostly at primary (35.67%) and junior high (43.83%) school levels. The majority (65%) of farms in China were on grain production. The average rural disposable income in China was $1300 (9224 RMB Yuan) per capita.
3.1. Effects on Chemical Fertilizer Use
Table 2 presents the effects of farm size on the chemical fertilizer application estimated by six fixed-effect models. All six models included the dependent variable, i.e., the natural log of average fertilizer application rate, the independent variable on farm size, and the control variables including dummy variables on years, natural log of the disposable per capita income, labor migration, farmers’ education, and planting structure. Models 1–5 included one additional independent variable on farm composition, which was the percentage of farms under each of five different types of operation scales among all farms. Model 6 included all these farm composition variables except the percentage of farms less than 0.667 ha (10 mu) to avoid the collinearity.
The coefficients of farm size were negative in Models 1–5 and positive in Model 6, but were statistically insignificant, which implies no clearly observable scale effect on fertilizer use from a macro perspective. However, there were some interesting observations on the coefficients of farm composition variables. The coefficient of p_under_10 in Model 1 was small and negative, but insignificant. The coefficient of p_10–30 in Model 2 was negative and significant with p < 0.01. The average chemical fertilizer application rate would decrease by 1.29% as the percentage of farms with a farm size of 0.667–2 ha (10–30 mu) increased by 1%. That result signifies a potential effect of economy of scale on chemical fertilizer application.
However, the economy of scale effect on fertilizer application did not last as larger farms emerged. The coefficient of p_30–50 in Model 3 was small, positive, and also statistically insignificant, which indicates that the average fertilizer application rate might not be affected as the percentage of farms of 2–3.34 ha (i.e., 30–50 mu) increases. The positive and statistically significant coefficient of p_50–100 in Model 4 indicates a diseconomy of scale effect on fertilizer application. The fertilizer application rate would increase by 4.84% for an 1% increase in the percentage of farms of 3.34–6.67 ha (i.e., 50–100 mu). Similarly, the diseconomy of scale effect did not last as larger farms continued to emerge. As demonstrated by the results from Model 5, the effect was positive but small and statistically insignificant as the percentage of farms greater than 6.67 ha (100 mu) increased.
Model 6 confirmed all of the findings based on Models 1–5 discussed above with a few twists. First, the coefficient of p_30–50 became negative and statistically significant at p-value < 0.05. A 1% increase in the percentage of farms of 2–3.4 ha (30–50 mu) could result in an 1.68% reduction in fertilizer application rate. This result indicates that the economy of scale effect of farm size on fertilizer application could continue at that specific scale of farm size. Second, although the coefficients p_50–100 in both Models 5 and 6 were positive and significant at p-value < 0.05, the co-efficient in Model 6 was larger than in Model 5. This further confirms the diseconomy of scale effect on fertilizer application when the percentage of these large farms increased. Third, Model 6 had the highest R2 value among the six models, which indicates that Model 6 was the best fit model.
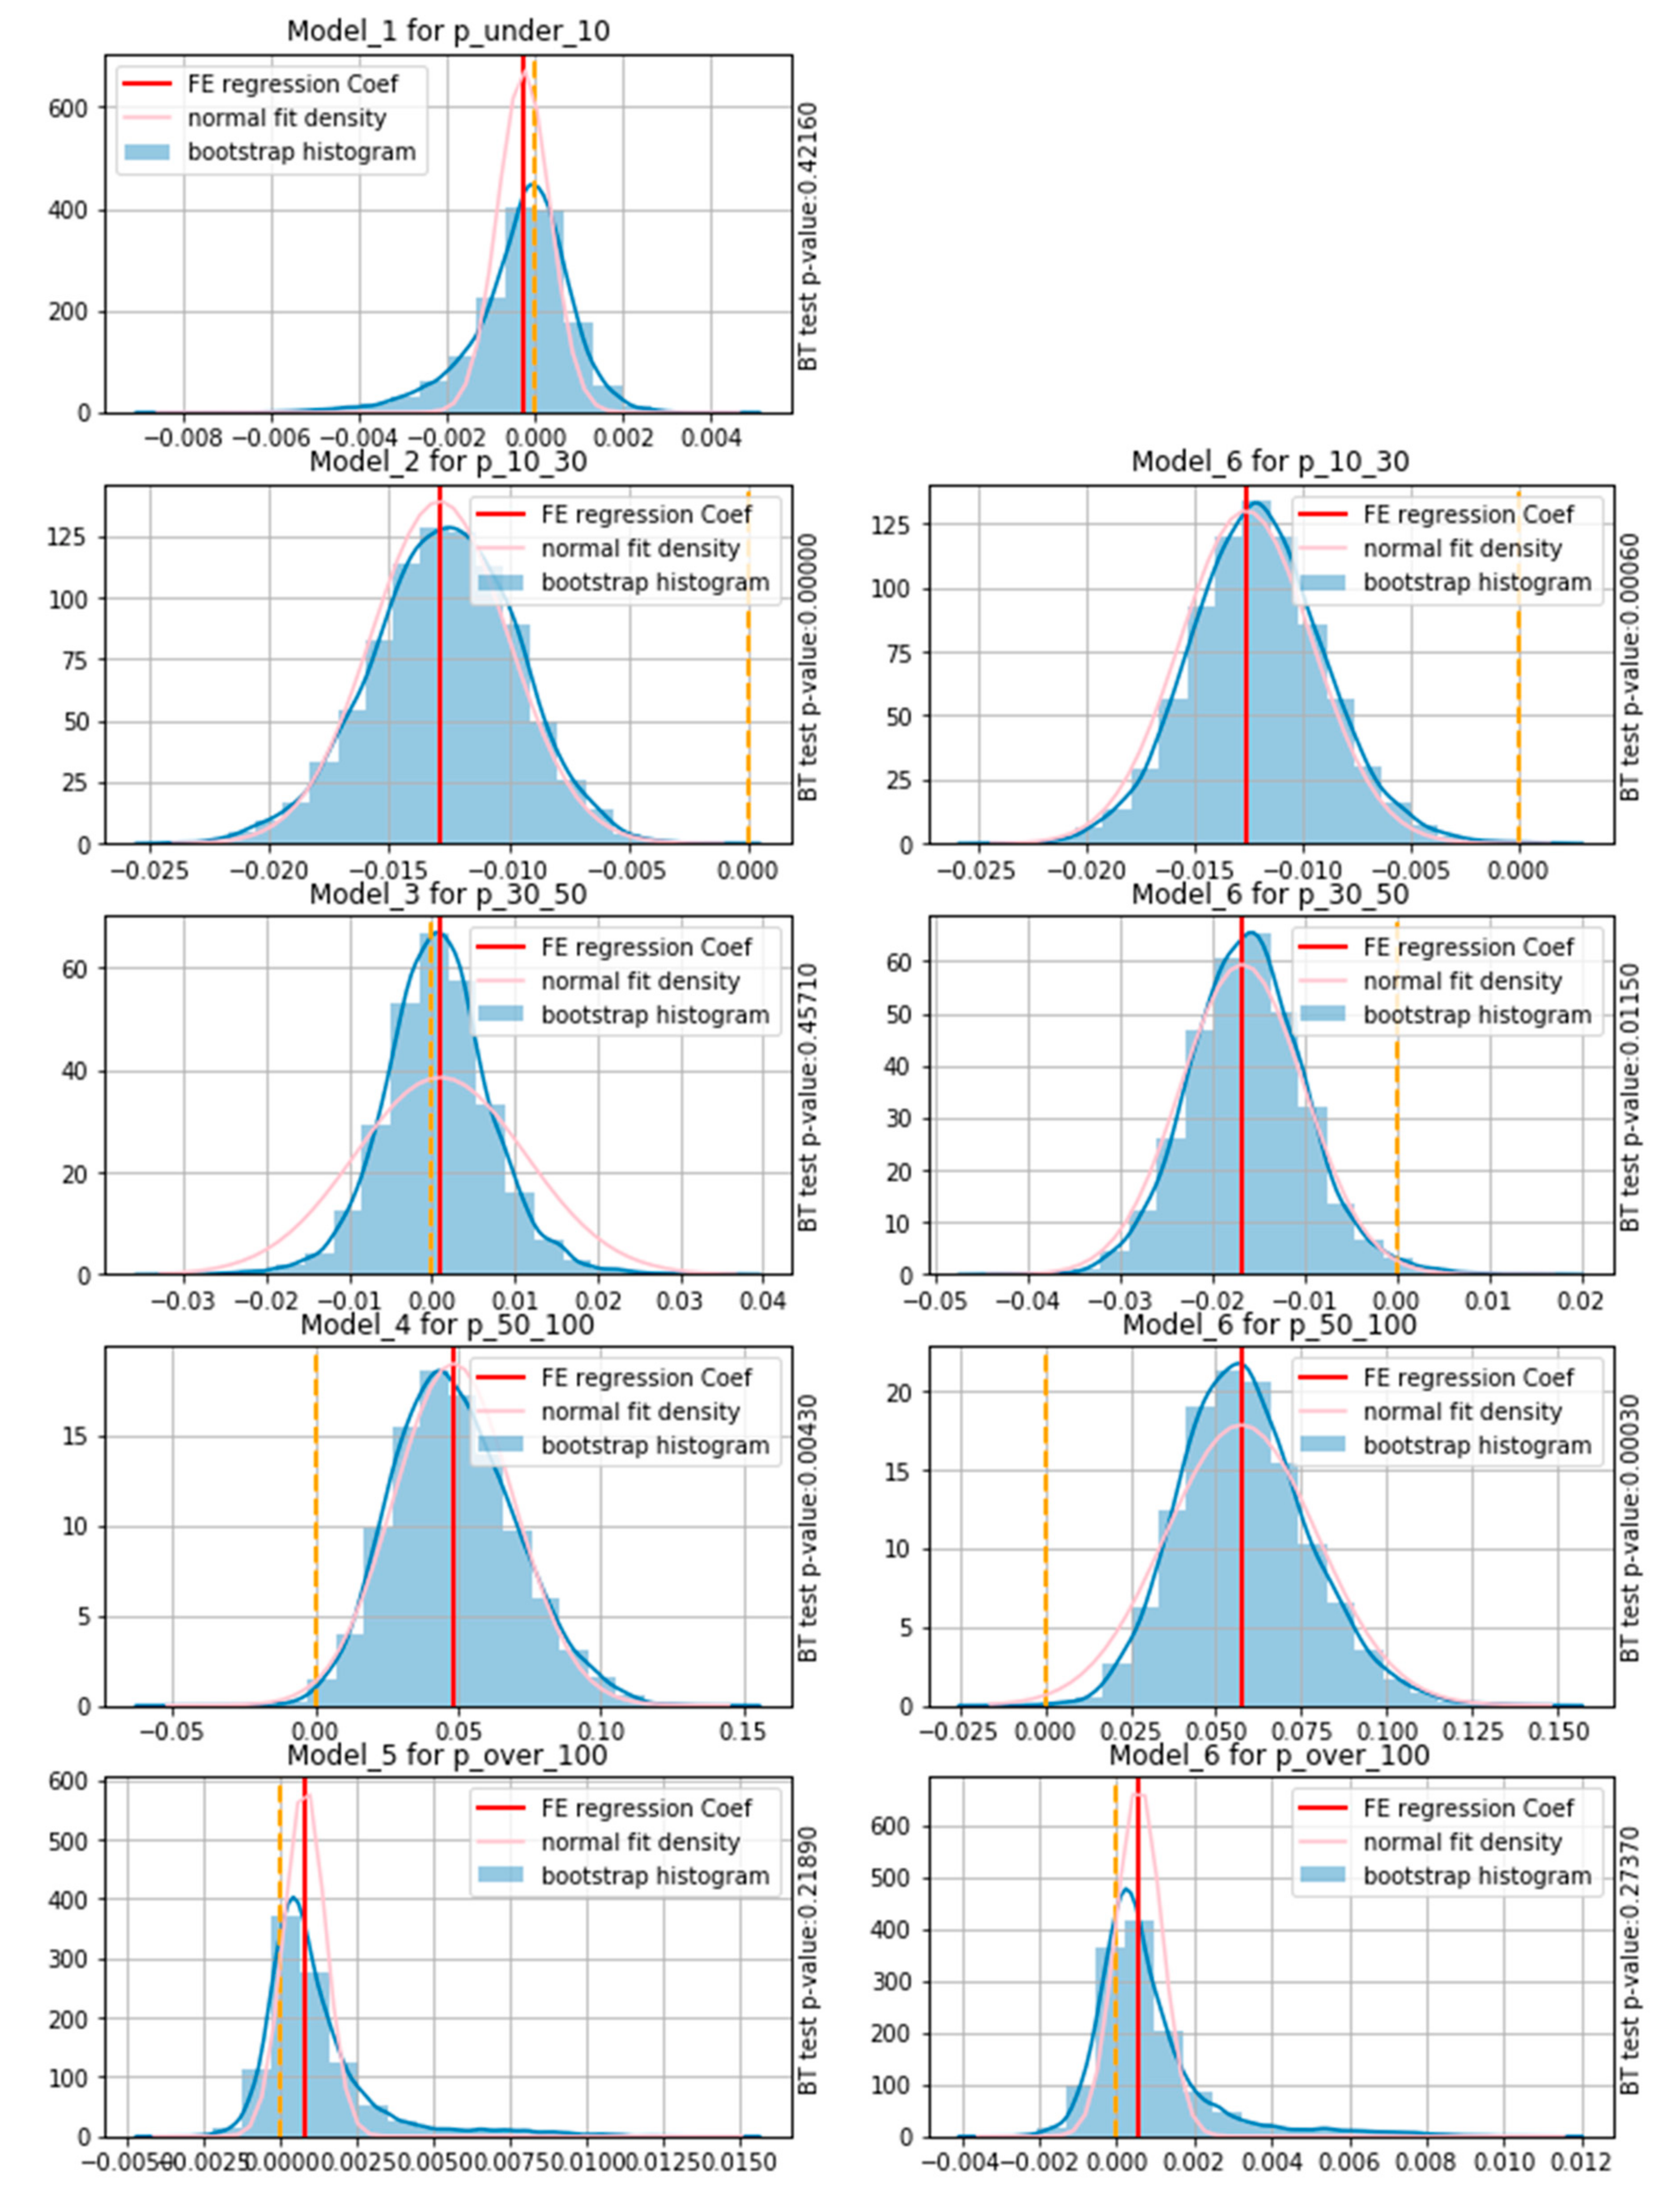
Figure 1 compares the histogram of the bootstrap coefficients of those farm composition variables with the derived normal distribution of the coefficients via central limitation theory and resulting p-values for testing the statistical significance of the coefficients in Models 1–6. The bootstrap analysis confirmed that the results presented above are robust. First, the histogram of the bootstrap coefficients followed a normal distribution pattern around the coefficients of the farm composition variables discussed above. Second, the p-values for significance testing whether the bootstrap coefficients were different from zero were consistent with the p-values reported in Table 2.
3.2. Effects on Pesticide Use
Table 3 presented the effects of farm size on pesticide application using Models 7–12. The specifications for Models 7–12 were similar to Models 1–6, except the dependent variable for Models 7–12 was the natural log of the pesticide application rate. The coefficients of farm size were negative but also statistically insignificant for Models 7–12, which indicates the economy of scale effect on pesticide use was not observable based on the aggregated data at the provincial level.
The coefficient of p_under_10 in Model 7 was small, negative, but statistically insignificant. The coefficient of p_10–30 in Model 8 was negative and statistically significant at p-value < 0.01, which indicates an economy of scale effect on pesticide use. More specifically, an 1% increase in the proportion of farms of 0.67–2 ha (10–30 mu) would decrease the pesticide application rate by 2.15%. This result was similar to the result of Model 2 for chemical fertilizer application. However, such an economy of scale effect on pesticide use would disappear when larger farms continued to emerge. The coefficient of p_30–50 in Model 9 was small but positive and statistically insignificant. The coefficient of p_50–100 in Model 10 was positive and statistically significant at p-value < 0.10, which indicates a diseconomy of scale of farm size on pesticide application. An 1% increase in the percentage of farms of 3.34–6.67 ha (i.e., 50–100 mu) could result in a 5.75% increase in the pesticide application rate. However, the diseconomy of scale effect was not observed for farms greater than 6.67 ha as the coefficient of the p_over_100 in Model 11 was small and positive, but statistically insignificant. The results of Model 12 confirmed all observations made in Model 7–11. Similar to Model 6, Model 12 was the best fit model for assessing the impacts on pesticide use with the highest R2 value.
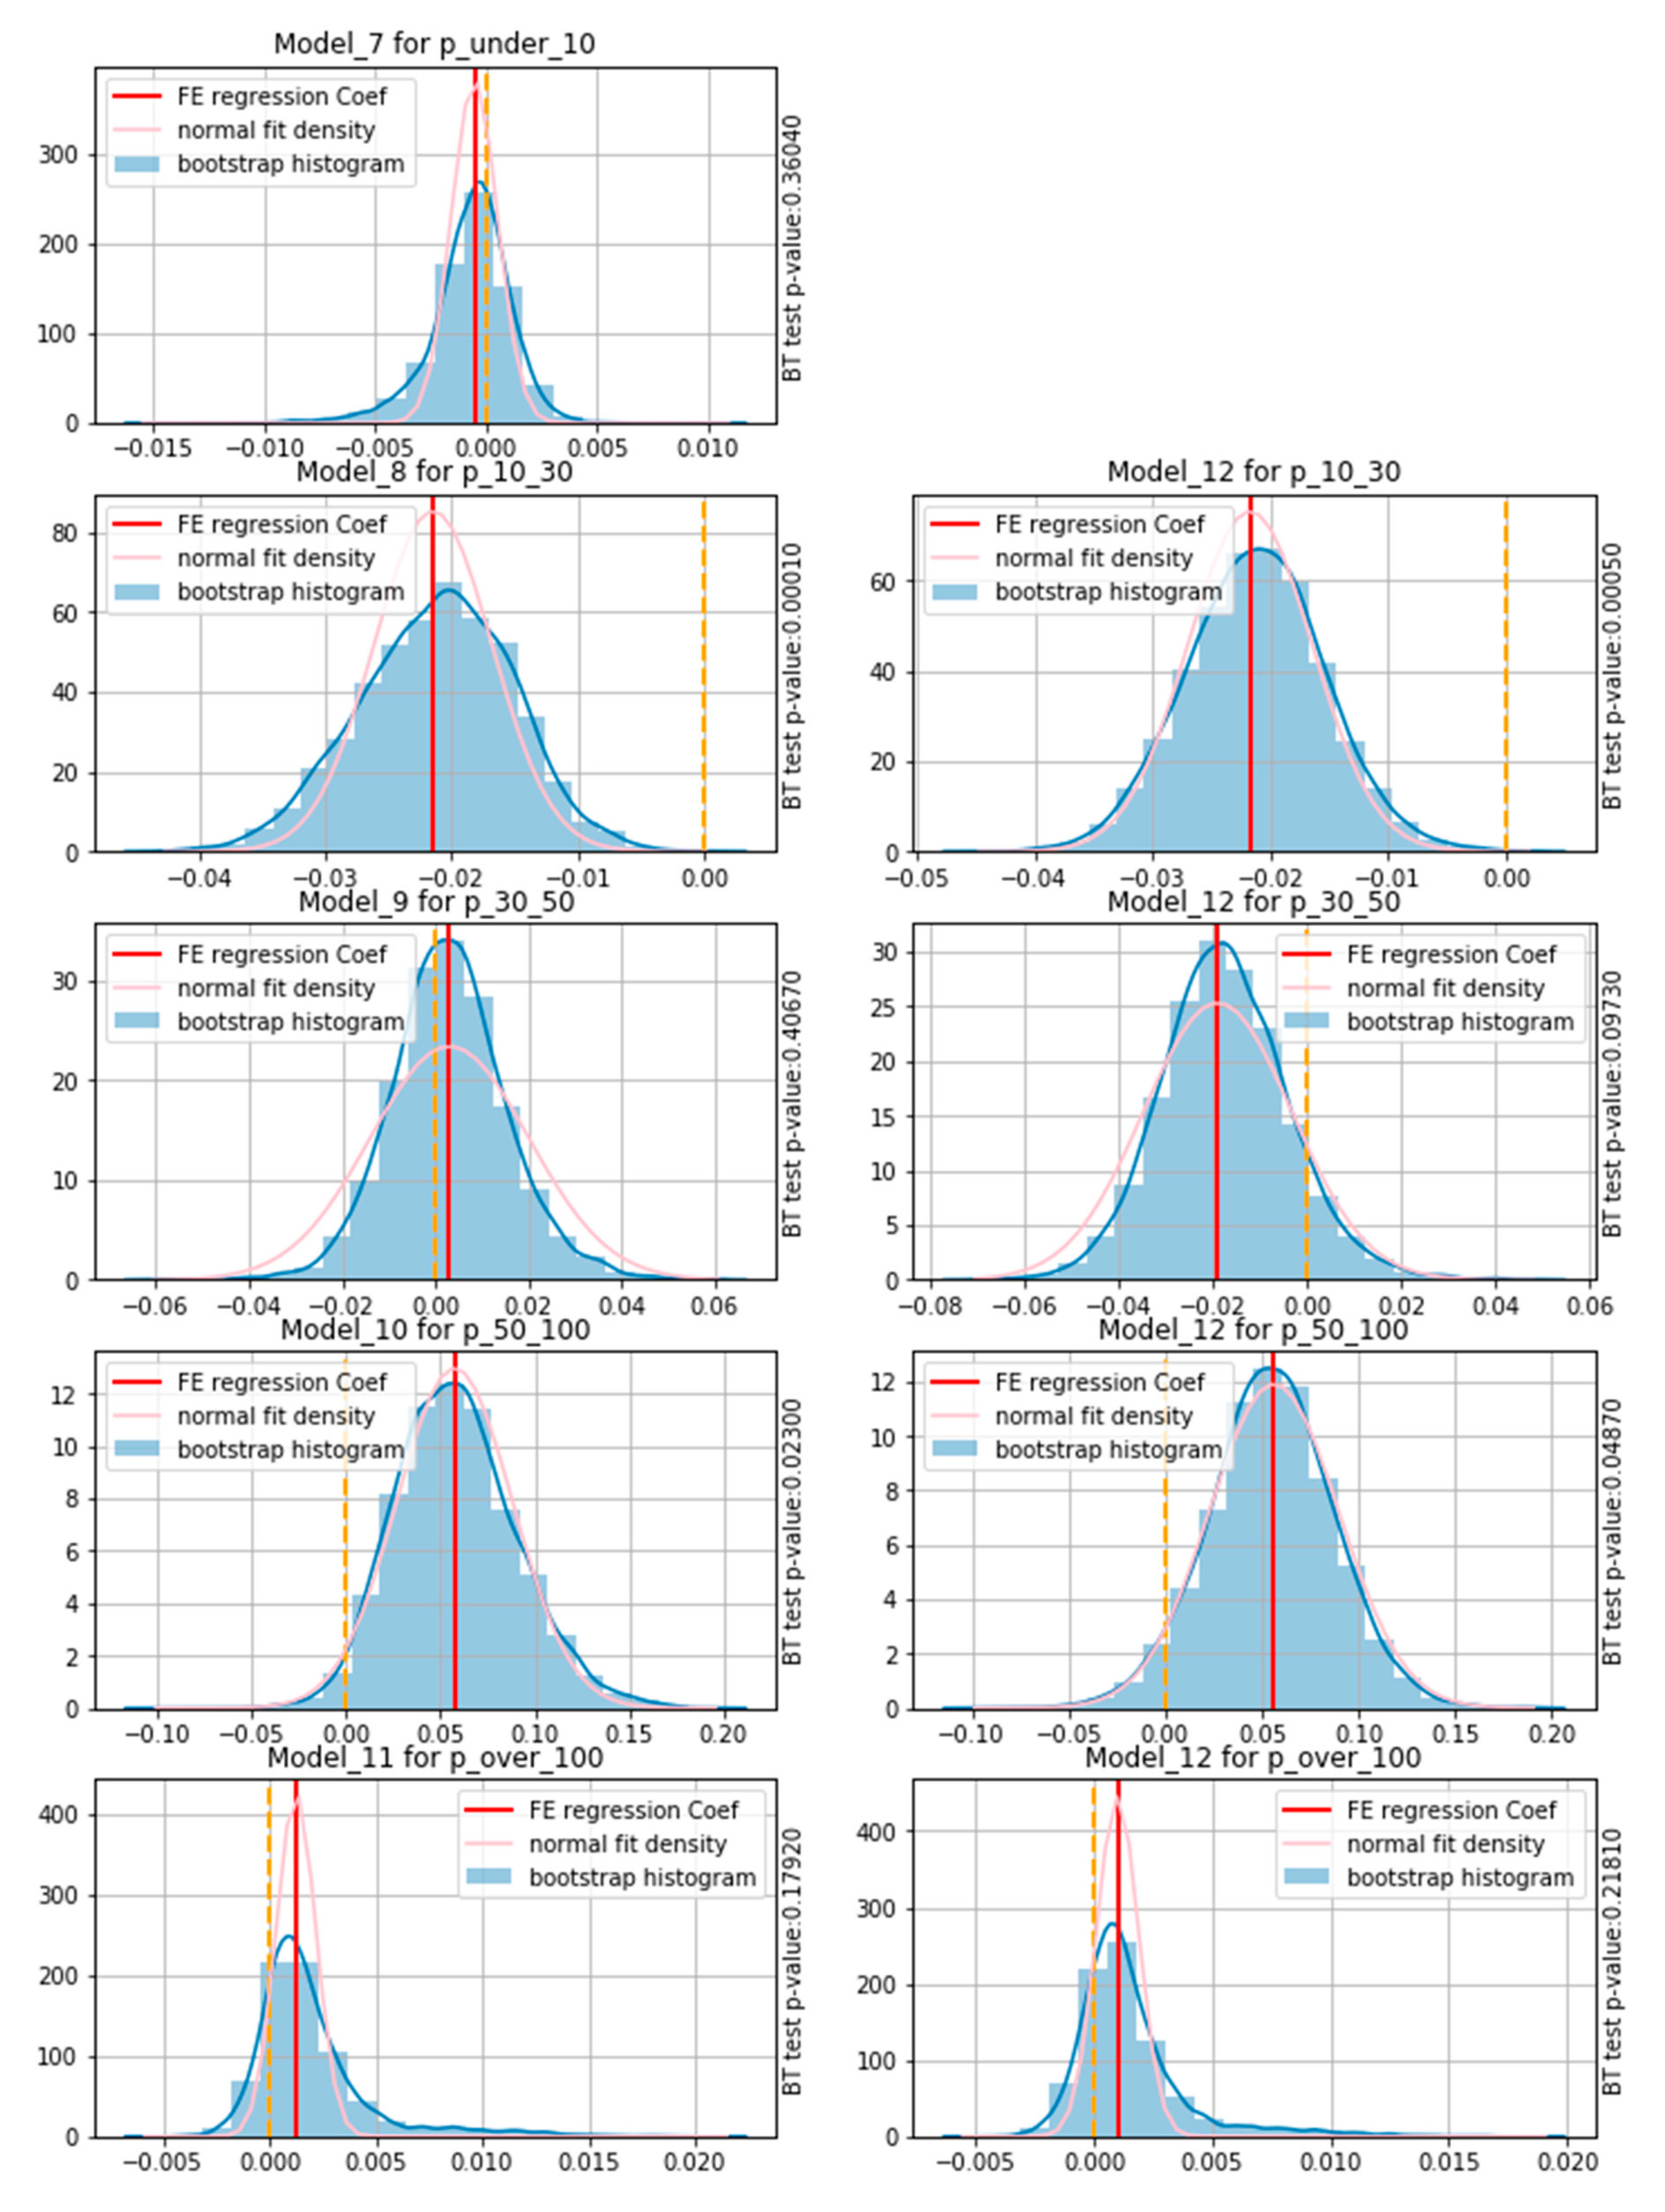
The results from the bootstrap analysis presented in Figure 2 confirm that these coefficients in Models 7–12 discussed above were robust. Furthermore, the t-test from the bootstrap analysis indicated the coefficients of p_30–50 and p_50–100 in Model 12 could be statistically significant at p < 10 and p < 5, respectively.
3.3. Effects of Control Variables
The modeling results showed that rural labor migration had multi-layered effects on agrochemical application. The percentage of Household Type I had insignificant impacts on both fertilizer and pesticide application rates. This result is expected as these households derive their income primarily from agriculture, and their impacts on agrochemical use were already captured by the modeling results discussed above. The percentage of Household Type II had positive and significant impacts on fertilizer application, but insignificant impacts on pesticide application. The positive and significant impacts on fertilizer use are consistent with others’ observations at the micro scale in the literature since Type II households derive their income primarily from non-agricultural employment and substitute labor shortages by increasing chemical fertilizer use [7,52]. The percentage of Household Type III had negative but significant impacts on both fertilizer and pesticide applications. Recall Type III households derive their income entirely from non-agricultural employment. A higher percentage of Type III households implies more large-scale farms as those households would transfer their lands to other farmers. As demonstrated above, there were economy of scale effects on both fertilizer and pesticide applications as the percentage of middle-sized farms, specifically farms of 0.67–2 ha (10–30 mu) and even of 2–3.34 ha (30–50 mu), increased.
The modeling results showed that farmers’ education levels had limited impacts on fertilizer application in China while other studies reported mixed results [12,57,58]. Most coefficients of the percentages of farmers with different education levels across Models 1–6 were statistically insignificant except the coefficients for the percentage of farmers with some college in Models 1, 3, 5, and 6; and for the percentages of farmers with primary school in Models 2 and 6, which were positive, but only significant at p < 0.1 (Table 2). These results imply that the impacts of fertilizer use on agricultural production might have been well understood by farmers across different education levels. Therefore, the education levels have less impact on farmers’ decisions on fertilizer. The positive and significant impacts of farmers with some college might be due to the fact that those farmers might simply operate the over-sized large farms, which were experiencing diseconomy of scale on fertilizer application as observed above. The farmers with some college might also choose to grow cash crops that generate higher returns but require higher agrochemical usage. However, the impacts on pesticide application rate seemed to be positive across different education levels. The significant impacts for farmers with primary and junior high school education just confirm the findings by other studies: the lack of knowledge on the impacts of agrochemical use contributes to the increase in chemical use [54,55], as the knowledge on pesticide use is more sophisticated than on fertilizer use. Similar to the positive impacts observed on fertilizer application rate, the positive and significant coefficients for the percentage of farmers with some college education might be due to the fact those highly educated farmers tended to operate large-scale farms of cash crops such as fruits and vegetables, which require higher usage of pesticides.
The impacts of planting structure on agrochemical use are consistent with the existing findings [40,58]. The increase in the proportion of arable lands in grain production tended to lower both chemical fertilizer and pesticide application rates as indicated by the negative coefficients of p_grain with a significance at p < 0.01 or 0.05 for Models 1–11. On the other hand, the large proportion of arable lands in fruit production would increase both chemical fertilizer and pesticide application rates, which was indicated by the positive coefficients of p_fruit with a significance at p < 0.1 for Models 2–4 and 7–11. The impacts of the proportion of arable lands in vegetable production on agrochemical uses were not statistically significant.
There were a few other interesting observations. First, the coefficients for all dummy variables on years were statistically insignificant across all models, although the coefficient value was increasing yearly from 2010 to 2015, reached its peak in 2015, and then became lower in 2016. These results indicate that the tremendous efforts from the central government are helpful but not effective in reducing agrochemical uses. Second, the disposable per capita income among rural households seemed to have no impact on agrochemical use as the relevant coefficients were negative but statistically insignificant across all models.
4. Discussions
Farm size has profound impacts on farm performance and farmers’ behaviors toward the adoption of various innovative farming practices and technologies [59,60,61,62]. The knowledge of the relationship between agrochemical use and farm size is critical to the development and implementation of the agrochemical use reduction strategies and policies in China. However, the findings from the existing literature are mixed and often conflicting. While most empirical studies observed the economy of scale effect on agrochemical use, some found diseconomy of scale effect on agrochemical use and even dismissed the relationship between farm size and agrochemical use altogether. Our results using the provincial data at a macro scale confirmed the complexity of such relationships. Therefore, the results from empirical assessments based on specific sample farm survey data at a micro scale cannot be simply extrapolated to describe the relationship in other regions and/or at a macro scale.
The economy of scale effect on agrochemical use would be ideal. The decreases in agrochemical application rates in many developed countries such as the U.S. and western European countries could be partially attributed to the increase in farm size in those countries due to the economy of scale [63,64,65]. The HCRS and Hukou systems have distorted the allocation of rural labor across the different sectors and farmland across rural households in China [7]. By eliminating these two distortions, the average farm size in China would increase to 4.1 ha, and fertilizer and pesticide use and fertilizer loss would fall by 28%, 45%, and 50%, respectively [7]. However, our assessment found the existence of the diseconomy of scale effect on agrochemical use in China. The diseconomy of scale occurred only when larger farms such as the farms larger than 3.34 ha (50 mu) continued to emerge. Furthermore, other researchers also observed a similar relationship between farm size and agrochemical use in China [29,36,37,38]. Such findings are inconveniently contrary to the economy of scale effect, as observed by other notable studies [6,7]. The differences might be due to the different data being used. Ju et al. [6] used the aggregated macro data from the Second China Agricultural Census in 2006 and compared fertilizer use between traditional smaller farms and collective farms. However, the nature and structure of large farms have changed substantially since then. Moreover, Ju et al. [6] only analyzed the agrochemical use of wheat, rice and corn. They did not analyze the farms which produce cash crops (e.g., sugar, vegetables and fruits) which have relatively large agrochemical consumption. Wu et al. [7] used the 2015 China Rural Household Panel Survey, which included 20,000 rural households. Despite being nationally representative, the households in that survey primarily produced staple crops such as wheat, rice, corn, soybean, and peanut. That survey did not include farms that primarily produced sugar, vegetables, and fruits and therefore tended to apply more fertilizer. Xin et al. [23] have shown that large-scale farms are more likely to product cash crops than small-scale farms. Our macro analyses were based on the aggregated provincial data from 2009 to 2016 that included all farms that conducted all kinds of farm operations and therefore our results were more balanced without the explicit biases mentioned above.
The positive correlation between an increase in agrochemical application rate and an increase in farm size is not unique in China. Similar relationships were observed in other developing countries such as Thailand [66], Ethiopia [67], Kenya [68], and Bangladesh [69]. Despite the similarity in terms of the diseconomy of scale effect on agrochemical uses in both China and other developing countries, the underlying rationales may be different. First, the farm size in China is smaller than in many developing countries such as Ethiopia, Ghana, Niger, Cambodia, and Nicaragua, according to the Smallholders Data Portrait database maintained by FAO. Second, China is the largest agrochemical producer in the world. According to FAO, China produced 26.55% of the total fertilizer in the world in 2019. While more intensive agrochemical use by large farms in these developing countries was attributed to farmers’ ability to acquire and use agricultural chemicals and willingness to take risks [66,67,68,69], the underlying reasons for more intensive agrochemical use by large farms in China might be very different as agrochemicals are readily available to all farmers. Previous studies suggested various plausible reasons including the short-term profit motive of farmers [35], planting structure change [41], and farmers’ willingness and ability to use more agricultural inputs [70]. Third and most importantly, the diseconomy of scale on agrochemical use among large farms might be related to the distortions in labor and farmland allocation by the HCRC and Hukou systems, two powerful institutional policies unique to China [7]. Because of the Hukou system, rural residents are reluctant to give up the use right to their allocated farmlands even after they have migrated to cities in China. As such, most large farms formed through the transfer of the use right are based on short-term land contracts between the large farms and the migrated residents [38]. A rural land survey from 17 provinces in China showed that only 52.6% of farmers negotiated the lease duration in a lease contract for receiving the use right of farmland, and only 15.9% of farmers received the use right of land with a lease duration greater than ten years [71]. Short-term land lease contracts discourage long-term farmland investments and encourage short-term farm operation behaviors that result in a significant reduction in organic fertilizer application and an increase in agrochemical use in China [38,72]. As such, many large farms formed under the current institutional structure tended to be fruit, vegetable, and other cash crop farms [73], whose agrochemical application rates were higher than most grain crop farms.
The existence of the diseconomy of scale effect on agrochemical use among the larger farms is extremely troubling to the agricultural policy-makers. In the past decade, China has been implementing various programs and policies such as farmland consolidation programs to form larger farms to improve agricultural productivity and to reduce agrochemical use. Our results suggest those programs might have had some initial success but have entered into the bottleneck where the diseconomy of scale effect occurs and therefore do not provide a straight path to achieve the ideal outcomes related to the reduction in agrochemical uses. The institutional restrictions under the current HCRC and Hukou systems cause instability in the land rental markets, through which large farms obtain land use rights. The unstable land market leads to widespread short-term land lease contracts, making it difficult to achieve the economy of scale effect in reducing agrochemical use [38]. Therefore, the future rural policy reform on the HCRC and Hukou systems themselves are needed to facilitate the flows of rural resources and labor to break down the bottleneck and achieve the economy of scale effect on agrochemical uses as envisioned by others [6,7].
The public agricultural extension and education programs had been successful in supporting farmers in their farm operations [74,75]. One alternative way in China is to establish and strengthen the agricultural extension and education services available to farmers to improve agricultural productivity while reducing agrochemical uses. The specific training of farmers through agricultural extension and education programs is proven to be very effective in reducing agrochemical use without decreasing crop yield [76,77]. The examples include the Science and Technology Backyard platform [5], the Integrated Soil-crop System Management program [25], and the Soil Testing and Fertilizer Recommendation Project [26]. While China has been active in encouraging the formation of large farms, little guidance was provided to support the operation of large farms. As such, many large farms are left alone in dealing with many operational and technical issues in their operations, which prompt them to maximize their short-term profits by over-applying agrochemicals. Our results indicate that there is an urgent need to implement such programs to support the growth and development of large farms in China, including reducing agrochemical use and improving efficiency. Another alternative is to nurture the development of the agricultural service industry in agrochemical use in China [78]. As a service entity, an agricultural service firm can achieve the economy of scale and reduce agrochemical use by serving a large number of farms [79,80].
5. Conclusions
Agrochemical overuse in China has been generally recognized. One potential mitigating strategy is to increase farm size in order to achieve a reduction in agrochemical use. This study examined the relationship between farm size and agrochemical use from a macro perspective using a panel dataset aggregated for 30 provinces in China from 2009 to 2016 and found no universal economy of scale on agrochemical use in China. Given the fact that 78.6% of farms are under 0.667 ha in China, any increase in slightly larger farms such as the farms that are greater than 0.667 but less than 2 ha would reduce agrochemical use. However, the potential economy of scale effect would not last when larger farms continued to emerge. The study found that the agrochemical application rates would increase when the percentage of large farms, especially the farms greater than 3.34 ha but less than 6.67 ha, increased, implying a diseconomy of scale.
Many empirical studies aimed to understand the relationship between farm size and agrochemical use in China using sample farm surveys at a micro scale and reported mixed and often conflicting results that were most likely dictated by the samples being used. Our empirical assessment using the aggregated data at a macro scale provided an additional perspective to understand this complicated relationship. Our results confirmed the existence of both economy and diseconomy of scale effects on agrochemical use in China. We further identified where those effects would take place.
Our results suggest that the strategy based on increasing farm size alone might achieve some initial success in reducing agrochemical use, but the effect could fade away and be reversed as significantly large farms continue to emerge. A plausible explanation for such a bottleneck situation is that HCRC and Hukou systems define the fabric of rural society in China, and large farms formed under those two institutional policies tend to focus on short-term profit maximization, which leads to an increase in agrochemical use. These results have significant policy implications as China is developing and implementing various policies and strategies to modernize its agriculture. In the long-term, reforms on HCRC and Hukou systems should be carried out to eliminate their negative impacts on agricultural development. In the short term, some alternative measures can be implemented to overcome the bottleneck and achieve a reduction in agrochemical use. These alternative measures may include (1) developing technical assistance programs and agricultural extension programs that train and educate farmers, especially farmers who operate large scale farms, to properly use the agrochemicals and guide them to adopt the production methods that use less agrochemicals with minimal impacts on net profits, (2) nurturing the development of agricultural service industry, in which the professionally trained individuals would conduct agrochemical applications for farmers through business contracts, and (3) strengthening the legal procedure of the farmland use right transfer and protecting the use rights of farmlands to encourage large farms to make long-term investments and reduce agrochemical use.
Despite these interesting results, the study has its limitations especially related to the data being used and leaves room for improvement. The study used a panel dataset in 30 provinces in China during the 2009–2016 period, which resulted in limited observations. Research can be further developed by expanding the observations to include data from recent years and/or collect data at a county level to test the robustness of the results. Research can also be conducted by combining the data at both micro and macro scales to test the robustness of the results. Future research can explore these ideas.
Author Contributions
Conceptualization, L.X.; methodology, L.X., Z.Q., L.Y. and Y.K.; formal analysis, L.X. and Z.Q.; data curation, L.X.; writing—original draft preparation, L.X. and Z.Q.; writing—review and editing, L.X., Z.Q., L.Y. and Y.K.; supervision, L.X. All authors have read and agreed to the published version of the manuscript.
Funding
The first author acknowledges the partial funding support from the Philosophy and Social Science Foundation of Guangdong Province (Grant No: GD19CYJ15).
Acknowledgments
The authors are grateful to the reviewers and the editor for their extensive and constructive review comments, which helped improve the quality of this paper.
Conflicts of Interest
The authors declare no conflict of interest.
References
- Li, Y.; Zhang, W.; Ma, L.; Huang, G.; Oenema, O.; Zhang, F.; Dou, Z. An analysis of China’s fertilizer policies: Impacts on the industry, food security, and the environment. J. Environ. Qual. 2013, 42, 972–981. [Google Scholar] [CrossRef] [PubMed]
- Zhang, C.; Hu, R.; Shi, G.; Jin, Y.; Mark, G.R.; Huang, X. Overuse or underuse? An observation of pesticide use in China. Sci. Total Environ. 538, 1–6. [CrossRef] [PubMed]
- Wang, Y.; Yang, J.; Zhang, R.; Jia, Z. Synthesis of climate, soil factors, and nitrogen management practices affecting the responses of wheat productivity and nitrogen use efficiency to nitrogen fertilizer in China. Sustainability 2018, 10, 3533. [Google Scholar] [CrossRef] [Green Version]
- Xu, X.; He, P.; Pampolino, M.F.; Qiu, S.; Zhao, S.; Zhou, W. Spatial variation of yield response and fertilizer requirements on regional scale for irrigated rice in China. Sci. Rep. 2019, 9, 3589. [Google Scholar] [CrossRef] [PubMed] [Green Version]
- Zhang, W.; Cao, G.; Li, X.; Zhang, H.; Wang, C.; Liu, Q.; Chen, X.; Cui, Z.; Shen, J.; Jiang, R.; et al. Closing yield gaps in China by empowering smallholder farmers. Nature 2016, 537, 671–674. [Google Scholar] [CrossRef]
- Ju, X.; Gu, B.; Wu, Y.; Galloway, J.N. Reducing China’s fertilizer use by increasing farm size. Glob. Environ. Chang. 2016, 41, 26–32. [Google Scholar] [CrossRef]
- Wu, Y.; Xi, X.; Tang, X.; Luo, D.; Gu, B.; Lam, S.K.; Vitousek, P.M.; Chen, D. Policy distortions, farm size, and the overuse of agricultural chemicals in China. Proc. Natl. Acad. Sci. USA 2018, 115, 7010–7015. [Google Scholar] [CrossRef] [PubMed] [Green Version]
- Chen, Y.; Hu, S.; Guo, Z.; Cui, T.; Zhang, L.; Lu, C.; Yu, Y.; Luo, Z.; Fu, H.; Jin, Y. Effect of balanced nutrient fertilizer: A case study in Pinggu District, Beijing, China. Sci. Total Environ. 2021, 754, 142069. [Google Scholar] [CrossRef]
- Ministry of Ecology Environment of China. Bulletin of the State of Ecological Environment in China; Special Report; Ministry of Ecology Environment of China: Beijing, China, 2019. (In Chinese)
- Zhang, C.; Shi, G.; Shen, J.; Hu, R. Productivity effect and overuse of pesticide in crop production in China. J. Integr. Agric. 2015, 14, 1903–1910. [Google Scholar] [CrossRef]
- Fischer, G.; Winiwarter, W.; Ermolieva, T.; Cao, G.-Y.; Qui, H.; Klimont, Z.; Wiberg, D.; Wagnera, F. Integrated modeling framework for assessment and mitigation of nitrogen pollution from agriculture: Concept and case study for China. Agric. Ecosyst. Environ. 2010, 136, 116–124. [Google Scholar] [CrossRef]
- Zhu, P.; Su, M.; Yan, J. Impact of farmland scale and stability on fertilizer input: Taking rice production of four counties of Jiangsu province as an example. J. Nanjing Agric. Univ. (Soc. Sci. Ed.), 2017; 17, 85–94. (In Chinese) [Google Scholar]
- Zhang, J.; Zhang, J.; Wu, F. The influencing factors of fertilizer input in grain production: Based on the Durbin model. Econ. Geogr. 2018, 38, 174–182. (In Chinese) [Google Scholar]
- Hao, G.; Yang, G. Pest control: Risks of biochemical pesticides. Science 2013, 342, 799. [Google Scholar] [CrossRef] [PubMed]
- Wang, Y.; Zhu, Y. Heuristic bias, cognitive and farmer’s unsafe pesticide purchasing decisions: A case study of apple growers. J. Agrotech. Econ. 2012, 7, 48–55. (In Chinese) [Google Scholar]
- Crissman, C.C.; Cole, D.C.; Carpio, F. Pesticide use and farmworker health in Ecuadorian potato production. Am. J. Agric. Econ. 1994, 76, 593–597. [Google Scholar] [CrossRef]
- Zhang, C.; Sun, Y.; Hu, R.; Huang, J.; Huang, X.; Li, Y.; Yin, Y.; Chen, Z. A comparison of the effects of agricultural pesticide uses on peripheral nerve conduction in China. Sci. Rep. 2018, 8, 9621. [Google Scholar] [CrossRef]
- Pan, D.; He, M.; Kong, F. Risk attitude, risk perception, and farmers’ pesticide application behavior in China: A moderation and mediation model. J. Clean. Prod. 2020, 276, 124241. [Google Scholar] [CrossRef]
- Guo, S.; Zhu, H.; Dang, T.; Wu, J.; Liu, W.; Hao, M.; Li, Y.; Syers, J.K. Winter wheat grain yield associated with precipitation distribution under long-term nitrogen fertilization in the Semiarid Loess Plateau in China. Geoderma 2012, 189–190, 442–450. [Google Scholar] [CrossRef]
- Wu, L.; Jiang, Y.; Zhao, F.; He, X.; Liu, H.; Yu, K. Increased organic fertilizer application and reduced chemical fertilizer application affect the soil properties and bacterial communities of grape rhizosphere soil. Sci. Rep. 2020, 10, 9568. [Google Scholar] [CrossRef] [PubMed]
- Gao, J.; Peng, C.; Shi, Q. Study on the high chemical fertilizer consumption and fertilization behavior of small rural household in China: Discovery from 1995-2016 national fixed-point survey data. Manag. World 2019, 35, 120–132. (In Chinese) [Google Scholar]
- Bai, X.; Wang, Y.; Huo, X.; Salim, R.; Bloch, H.; Zhang, H. Assessing fertilizer use efficiency and its determinants for apple production in China. Ecol. Indic. 2019, 104, 268–278. [Google Scholar] [CrossRef]
- Xin, L.; Li, X.; Tan, M. Temporal and regional variations of China’s fertilizer consumption by crops during 1998–2008. J. Geogr. Sci. 2012, 22, 643–652. [Google Scholar] [CrossRef]
- Li, S.; Lei, Y.; Zhang, Y.; Liu, J.; Shi, X.; Jia, H.; Wang, C.; Chen, F.; Chu, Q. Rational trade-offs between yield increase and fertilizer inputs are essential for sustainable intensification: A case study in wheat-maize cropping systems in China. Sci. Total Environ. 2019, 679, 328–336. [Google Scholar] [CrossRef]
- Cui, Z.; Zhang, H.; Chen, X.; Zhang, C.; Ma, W.; Huang, C.; Zhang, W.; Mi, G.; Miao, Y.; Li, X.; et al. Pursuing sustainable productivity with millions of smallholder farmers. Nature 2018, 555, 363–366. [Google Scholar] [CrossRef]
- Wang, P.; Zhang, W.; Li, M.; Han, Y. Does fertilizer education program increase the technical efficiency of chemical fertilizer use? Evidence from wheat production in China. Sustainability 2019, 11, 543. [Google Scholar] [CrossRef] [Green Version]
- Qiu, Z.; Prato, T. Economic feasibility of adapting crop enterprises to future climate change: A case study of flexible scheduling and irrigation for representative farms in Flathead Valley, Montana, USA. Mitig Adapt Strat. Glob Chang. 2012, 17, 223–242. [Google Scholar] [CrossRef]
- Tang, L.; Zhou, J.; Bobojonov, I.; Zhang, Y.; Glauben, T. Induce or reduce? The crowding-in effects of farmers’ perceptions of climate risk on chemical use in China. Clim. Risk Manag. 2018, 20, 27–37. [Google Scholar] [CrossRef]
- Wu, Y.; Wang, E.; Miao, C. Fertilizer use in China: The role of agricultural support policies. Sustainability 2019, 11, 4391. [Google Scholar] [CrossRef] [Green Version]
- Ye, J. Land transfer and the pursuit of agricultural modernization in China. J. Agrar. Chang. 2015, 15, 314–337. [Google Scholar] [CrossRef]
- Cai, Y.; Du, Z. An analysis of ecological consciousness of family production behavior and its influencing factors: An empirical test based on survey data of family farms in China. Chin. Rural Econ. 2016, 12, 33–45. (In Chinese) [Google Scholar]
- Sun, Y.; Hu, R.; Zhang, C. Does the adoption of complex fertilizers contribute to fertilizer overuse? Evidence from rice production in China. J. Clean. Prod. 2019, 219, 677–685. [Google Scholar] [CrossRef]
- Huang, J.; Huang, Z.; Jia, X.; Hu, R.; Xiang, C. Long-term reduction of nitrogen fertilizer use through knowledge training in rice production in China. Agric. Syst. 2015, 135, 105–111. [Google Scholar] [CrossRef]
- Yang, G.; Jin, Y. Comparison of the impacts of farmland transfer on rural households’ inputs in farmland: Based on the empirical study of Jianghan plain and Taihu lake plain. China Popul. Resour. Environ. 2010, 20, 164–168. (In Chinese) [Google Scholar]
- Ji, Y.; Zhang, H.; Lu, W.; Liu, H. Differentiation, incomplete information and farmer’s excessive application of fertilizer. J. Agrotech. Econ. 2016, 2, 14–22. (In Chinese) [Google Scholar]
- Manjunatha, A.V.; Anik, A.R.; Speelman, S.; Nuppenau, E.A. Impact of land fragmentation, farm size, land ownership and crop diversity on profit and efficiency of irrigated farms in India. Land Use Policy 2013, 31, 397–405. [Google Scholar] [CrossRef]
- Wang, X.; Chen, Y.; Sui, P.; Yan, P.; Yang, X.; Gao, W. Preliminary analysis on economic and environmental consequences of grain production on different farm sizes in North China Plain. Agric. Syst. 2017, 153, 181–189. [Google Scholar] [CrossRef]
- Hu, L.; Zhang, X.; Zhou, Y. Farm size and fertilizer sustainable use: An empirical study in Jiangsu, China. J. Integr. Agric. 2019, 18, 2898–2909. [Google Scholar] [CrossRef]
- Shi, C.; Zhu, J.; Luan, J. Analysis on the efficiency and the influencing factors of wheat chemical fertilizer input in China: Positive study based on 15 major wheat-farming provinces in China. J. Agrotech. Econ. 2015, 11, 69–78. (In Chinese) [Google Scholar]
- Luan, J.; Qiu, H.; Jing, Y.; Liao, S.; Han, W. Decomposition of factors contributed to the increase of china’s chemical fertilizer use and projections for future fertilizer use in China. J. Nat. Resour. 2013, 28, 1869–1878. (In Chinese) [Google Scholar]
- Zhang, Z.; Du, Z. Would land transfer results non-grain oriented? Evidence from 1740 family farms in China. Econ. Perspect. 2015, 9, 63–69. (In Chinese) [Google Scholar]
- Greene, W.H. Econometric Analysis; Prentice Hall: Upper Saddle River, NJ, USA, 2000. [Google Scholar]
- Wooldridge, J.M. Econometric Analysis of Cross Section and Panel Data; MIT Press: Cambridge, MA, USA, 2010. [Google Scholar]
- Baltagi, B. Econometric Analysis of Panel Data; John Wiley & Sons: New York, NY, USA, 2008. [Google Scholar]
- Wooldridge, J.M. Introductory Econometrics: A Modern Approach; South-Western College Pub.: New York, NY, USA, 2012. [Google Scholar]
- Seabold, S.; Perktold, J. Statsmodels: Econometric and statistical modeling with python. In Proceedings of the 9th Python in Science Conference, Austin, TX, USA, 28–30 June 2010. [Google Scholar]
- Efron, B. The Jackknife, the Bootstrap, and Other Resampling Plans; SIAM Publications: Philadelphia, PA, USA, 1982. [Google Scholar]
- Efron, B. Better bootstrap confidence intervals. J. Am. Stat. Assoc. 1987, 82, 171–185. [Google Scholar] [CrossRef]
- Davison, A.C.; Hinkley, D.V. Bootstrap Methods and Their Application; Cambridge University Press: Cambridge, UK, 1997. [Google Scholar]
- Horowitz, J.L. The bootstrap. Handb. Econom. 2001, 5, 3159–3228. [Google Scholar]
- Carpenter, J.; Bithell, J. Bootstrap confidence intervals: When, which, what? A practical guide for medical statisticians. Stat. Med. 2000, 19, 1141–1164. [Google Scholar] [CrossRef]
- Ebenstein, A.; Zhang, J.; McMillan, M.; Chen, K. Chemical Fertilizer and Migration in China; NBER Working Paper; National Bureau of Economic Research: Cambridge, MA, USA, 2011. [Google Scholar]
- Jacquet, F.; Butault, J.P.; Guichard, L. An economic analysis of the possibility of reducing pesticides in French field crops. Ecol. Econ. 2011, 70, 1638–1648. [Google Scholar] [CrossRef] [Green Version]
- Khan, M.; Damalas, C.A. Farmers’ knowledge about common pests and pesticide safety in conventional cotton production in Pakistan. Crop Prot. 2015, 77, 45–51. [Google Scholar] [CrossRef]
- Emmanuel, D.; Owusu-Sekyere, E.; Owusu, V.; Jordaan, H. Impact of agricultural extension service on adoption of chemical fertilizer: Implications for rice productivity and development in Ghana. NJAS Wagening. J. Life Sci. 2016, 79, 41–49. [Google Scholar] [CrossRef]
- Zhang, C.; Sun, Y.; Sun, S.; Hu, R. Does the urban-rural gap increase agricultural chemical input? Chin. Rural Econ. 2019, 1, 96–111. (In Chinese) [Google Scholar]
- Xiang, C.; Jia, X.; Huang, J.; Hu, R.; Zhang, F.; Cui, Z. Impact of agricultural technology training on farmers’ nitrogen fertilizer application behavior: Based on the empirical study of maize production in Shouguang city, Shandong province. J. Agrotech. Econ. 2012, 9, 4–10. (In Chinese) [Google Scholar]
- Zhang, W.; Ji, Y.; Ma, J.; Wang, Y.; Ma, W.; Zhang, F. Driving forces of fertilizer consumption in China (Ⅱ planting structure). Resour. Sci. 2008, 30, 31–36. (In Chinese) [Google Scholar]
- Feder, G.; O’Mara, G.T. Farm size and the diffusion of green revolution technology. Econ. Dev. Cult. Chang. 1981, 30, 59–76. [Google Scholar] [CrossRef]
- Bojnec, S.; Latruffe, L. Farm size, agricultural subsidies and farm performance in Slovenia. Land Use Policy 2013, 32, 207–217. [Google Scholar] [CrossRef]
- Gailhard, I.U.; Bojnec, S. Sustainable participation behaviour in agri-environmental measures. J. Clean. Prod. 2016, 138, 47–58. [Google Scholar] [CrossRef]
- Lu, H.; Zhang, P.; Hu, H.; Xie, H.; Yu, Z.; Chen, S. Effect of the grain-growing purpose and farm size on the ability of stable land property rights to encourage farmers to apply organic fertilizers. J. Environ. Manag. 2019, 251, 109621. [Google Scholar] [CrossRef]
- Anderson, M.A.; Cairns, L.E.; Heady, E.O.; Baum, E.L. An Appraisal of Factors Affecting the Acceptance and Use of Fertilizer in Iowa, 1953; Special Report; Iowa Agricultural and Home Economics Experiment Station: Ames, IA, USA, 1956. [Google Scholar]
- Ottoson, H.W.; Epp, A.W. Size of farm and farming efficiency in northeastern Nebraska. J. Farm Econ. 1956, 38, 803–812. [Google Scholar] [CrossRef]
- Feder, G. Farm size, risk aversion and the adoption of new technology under uncertainty. Oxf. Econ. Pap. 1980, 32, 263–283. [Google Scholar] [CrossRef]
- Jamison, D.T.; Lau, L.J. Farmer Education and Farm Efficiency; The Johns Hopkins University Press: Baltimore, MD, USA, 1982. [Google Scholar]
- Demeke, M.; Kelly, V.A.; Jayne, T.S.; Said, A.; Le, V.J.; Chen, H. Agricultural Market Performance and Determinants of Fertilizer Use in Ethiopia; Grain Market Research Project Working Paper; Michigan State University: East Lansing, MI, USA, 1998. [Google Scholar]
- Olwande, J.; Sikei, G.; Mathenge, M. Agricultural Technology Adoption: A Panel Analysis of Smallholder Farmers’ Fertilizer Use in Kenya; Working Paper; University of California: Los Angeles, CA, USA, 2009. [Google Scholar]
- Rahman, S. Jointness in farmers’ decision to apply pesticides in multiple crops and its determinants at the farm level in Bangladesh. Int. J. Pest Manag. 2016, 62, 149–157. [Google Scholar] [CrossRef] [Green Version]
- Xu, W.; Zhang, J.; Li, S.; Zhou, W. Behavioral analysis of reducing investments for farming families in circular agriculture: A case study on Shanxi, Shandong, and Hubei provinces based on the investigation of chemical fertilizer input. Resour. Sci. 2010, 32, 2407–2412. (In Chinese) [Google Scholar]
- Ye, J.; Feng, L.; Jiang, Y.; Prosterman, R.; Zhu, K. Research on rural land use right in China in 2008: 17 provincial survey results and policy recommendations. Manag. World 2010, 1, 64–73. (In Chinese) [Google Scholar]
- Jacoby, H.G.; Li, G.; Rozelle, S. Hazards of expropriation: Tenure insecurity and investment in rural China. Am. Econ. Rev. 2002, 92, 1420–1447. [Google Scholar] [CrossRef] [Green Version]
- Luo, B.; Jiang, X.; Li, S.; Qiu, T. Does land transfer lead to “non-grain growing” in agricultural planting structure. Jianghai Acad. J. 2018, 2, 94–101. (In Chinese) [Google Scholar]
- Pardey, P.G.; Alston, J.M.; Chan-Kang, C. Public Food and Agricultural Research in the United States: The Rise and Decline of Public Investments, And Policies for Renewal; Agree Meridian Institute: Washington, DC, USA, 2013. [Google Scholar]
- Jin, Y.; Huffman, W.E. Measuring public agricultural research and extension and estimating their impacts on agricultural productivity: New insights from U.S. evidence. Agric. Econ. 2016, 47, 15–31. [Google Scholar] [CrossRef] [Green Version]
- Zhao, P.; Cao, G.; Zhao, Y.; Zhang, H.; Chen, X.; Li, X.; Cui, Z. Training and organization programs increases maize yield and nitrogen-use efficiency in smallholder agriculture in China. Agron. J. 2016, 108, 1944–1950. [Google Scholar] [CrossRef]
- Wehmeyer, H.; de Guia, A.H.; Connor, M. Reduction of fertilizer use in south China—Impacts and implications on smallholder rice farmers. Sustainability 2020, 12, 2240. [Google Scholar] [CrossRef] [Green Version]
- Sun, X.; Liu, Y. Can Land Trusteeship Improve Farmers’ Green Production? Chin. Rural Econ. 2019, 10, 60–80. (In Chinese) [Google Scholar]
- Luo, B. Service scale management: Vertical division of labor, horizontal division of labor and specialization of connected farmland. Chin. Rural Econ. 2017, 11, 2–16. (In Chinese) [Google Scholar]
- Zhang, L.; Luo, B. How can small farmers be incorporated into modern agricultural development? Evidence from wheat-producing areas of China. Econ. Res. J. 2018, 53, 144–160. (In Chinese) [Google Scholar]
Figure 1.
The bootstrap distribution of the estimated coefficient of the farm structure variables in Models 1–6 for fertilizer use.
Figure 1.
The bootstrap distribution of the estimated coefficient of the farm structure variables in Models 1–6 for fertilizer use.

Figure 2.
The bootstrap distribution of the estimated coefficient of the farm structure variables in Models 7–12 for pesticide use.
Figure 2.
The bootstrap distribution of the estimated coefficient of the farm structure variables in Models 7–12 for pesticide use.


Table 1.
Descriptive statistics of variables.
| Variables | Obs. | Mean | Std. Dev. | Min | Max | |
|---|---|---|---|---|---|---|
| Agrochemical Use (kg/ha) | Fertilizer use | 240 | 365.12 | 114.89 | 150.99 | 637.55 |
| Pesticide use | 240 | 12.42 | 9.57 | 1.96 | 56.43 | |
| Farm size (ha) | 240 | 0.43 | 0.37 | 0.10 | 1.70 | |
| Farm Composition (%) | p_under_10 | 240 | 78.62 | 21.07 | 17.22 | 99.27 |
| p_10_30 | 240 | 13.87 | 12.10 | 0.49 | 43.68 | |
| p_30_50 | 239 | 3.80 | 5.61 | 0.06 | 23.17 | |
| p_50_100 | 237 | 1.39 | 2.65 | 0.00 | 12.59 | |
| p_over_100 | 237 | 2.38 | 7.88 | 0.00 | 75.35 | |
| Disposable Per capita Income (RMB) | 240 | 9224.43 | 4249.24 | 2980.10 | 25520.40 | |
| Labor Migration (%) | p_farm_I | 240 | 16.81 | 5.60 | 0.81 | 29.09 |
| p_farm_II | 240 | 8.53 | 5.12 | 1.09 | 23.27 | |
| p_farm_III | 240 | 9.78 | 10.13 | 0.45 | 52.63 | |
| Education (%) | p_primary | 240 | 35.67 | 7.10 | 17.13 | 56.02 |
| p_junior | 240 | 43.83 | 7.45 | 23.25 | 56.47 | |
| p_senior | 240 | 9.03 | 3.12 | 3.69 | 23.92 | |
| p_college | 240 | 2.65 | 1.64 | 0.67 | 11.97 | |
| Planting Structure (%) | p_grain | 240 | 65.00 | 12.58 | 40.90 | 95.70 |
| p_vegetable | 240 | 15.01 | 8.29 | 1.50 | 36.60 | |
| p_fruit | 240 | 1.78 | 1.37 | 0.10 | 6.90 | |
Table 2.
The fixed-effect modeling results between fertilizer use and farm size.
| Variables | Model_1 | Model_2 | Model_3 | Model_4 | Model_5 | Model_6 |
|---|---|---|---|---|---|---|
| Farm Size | −0.1578 | 0.0734 | −0.1534 | −0.1814 | −0.1454 | 0.0502 |
| (0.1932) | (0.1945) | (0.1945) | (0.1668) | (0.1951) | (0.1852) | |
| p_under_10 | −0.0003 | |||||
| (0.0006) | ||||||
| p_10–30 | −0.0129 *** | −0.0126 *** | ||||
| (0.0029) | (0.0031) | |||||
| p_30–50 | 0.0010 | −0.0168 ** | ||||
| (0.0103) | (0.0067) | |||||
| p_50–100 | 0.0484 ** | 0.0575 ** | ||||
| (0.0210) | (0.0223) | |||||
| p_over–100 | 0.0008 | 0.0006 | ||||
| (0.0007) | (0.0006) | |||||
| Years | X | X | X | X | X | X |
| Ln (income) | X | X | X | X | X | X |
| p_farm_I | X | X | X | X | X | X |
| p_farm_II | 0.0159 ** | 0.0157 ** | 0.0162 ** | 0.0140 ** | 0.0133 * | 0.0121 * |
| (0.0078) | (0.0070) | (0.0076) | (0.0067) | (0.0080) | (0.0072) | |
| p_farm_III | −0.0192 *** | −0.0178 *** | −0.0195 *** | −0.0183 *** | −0.0182 *** | −0.0161 *** |
| (0.0062) | (0.0053) | (0.0063) | (0.0063) | (0.0068) | (0.0056) | |
| p_primary | X | 0.0057 * | X | X | X | 0.0063 * |
| (0.0033) | (0.0034) | |||||
| p_junior | X | X | X | X | X | X |
| p_senior | X | X | X | X | X | X |
| p_college | 0.0121 * | X | 0.0123 * | X | 0.0123 * | 0.0107 * |
| (0.0070) | (0.0071) | (0.0073) | (0.0062) | |||
| p_grain | −0.0110 *** | −0.0094 *** | −0.0110 *** | −0.0109 *** | −0.0112 *** | −0.0078 ** |
| (0.0035) | (0.0035) | (0.0036) | (0.0036) | (0.0037) | (0.0031) | |
| p_vegetable | X | X | X | X | X | X |
| p_fruit | X | 0.0283 * | 0.0323 ** | 0.0294 * | X | X |
| (0.0146) | (0.0162) | (0.0160) | ||||
| intercept | 7.0583 *** | 6.8117 *** | 6.9459 *** | 6.8501 *** | 7.1282 *** | 6.2723 *** |
| (1.2992) | (1.1089) | (1.3737) | (1.2669) | (1.3432) | (1.0965) | |
| N | 240 | 240 | 239 | 237 | 237 | 237 |
| R-square | 0.4647 | 0.5328 | 0.4645 | 0.4957 | 0.4646 | 0.5733 |
| F-stat | 8.2467 | 10.832 | 8.1956 | 9.1897 | 8.1124 | 10.747 |
| P-value | 0.0000 | 0.0000 | 0.0000 | 0.0000 | 0.0000 | 0.0000 |
Standard errors in parentheses. * p < 0.10, ** p < 0.05, and *** p < 0.01. X—The variables included as a control but with statistically insignificant coefficients.
Table 3.
The fixed-effect modeling results between pesticide use and farm size.
| Variables | Model_7 | Model_8 | Model_9 | Model_10 | Model_11 | Model_12 |
|---|---|---|---|---|---|---|
| Farm Size | −0.5701 | −0.1833 | −0.5592 | −0.5934 | −0.5503 | −0.1908 |
| (0.4244) | (0.4287) | (0.4210) | (0.3852) | (0.4179) | (0.4038) | |
| p_under_10 | −0.0005 | |||||
| (0.0010) | ||||||
| p_10–30 | −0.0215 *** | −0.0217 *** | ||||
| (0.0047) | (0.0053) | |||||
| p_30–50 | 0.0031 | −0.0189 | ||||
| (0.0171) | (0.0158) | |||||
| p_50–100 | 0.0575 * | 0.0563 * | ||||
| (0.0308) | (0.0335) | |||||
| p_over_100 | 0.0012 | 0.0010 | ||||
| (0.0009) | (0.0009) | |||||
| Years | X | X | X | X | X | X |
| Ln (income) | X | X | X | X | X | X |
| p_farm_I | X | X | X | X | X | X |
| p_farm_II | X | X | X | X | X | X |
| p_farm_III | −0.0324 *** | −0.0301 *** | −0.0334 *** | −0.0333 *** | −0.0328 *** | −0.0297 *** |
| (0.0067) | (0.0068) | (0.0072) | (0.0073) | (0.0070) | (0.0069) | |
| p_primary | 0.0192 ** | 0.0201 ** | 0.0204 ** | 0.0209 ** | 0.0200 ** | 0.0214 ** |
| (0.0084) | (0.0090) | (0.0088) | (0.0091) | (0.0085) | (0.0091) | |
| p_junior | 0.0181 *** | 0.0185 *** | 0.0190 *** | 0.0185 ** | 0.0190 *** | 0.0197 *** |
| (0.0069) | (0.0069) | (0.0070) | (0.0073) | (0.0068) | (0.0069) | |
| p_senior | X | X | X | X | X | X |
| p_college | 0.0342 ** | 0.0299 ** | 0.0352 ** | 0.0335 ** | 0.0349 ** | 0.0319 ** |
| (0.0149) | (0.0146) | (0.0150) | (0.0154) | (0.0154) | (0.0146) | |
| p_grain | −0.0128 ** | −0.0102 * | −0.0131 ** | −0.0129 ** | −0.0133 ** | X |
| (0.0062) | (0.0060) | (0.0064) | (0.0061) | (0.0062) | ||
| p_vegetable | X | X | X | X | X | X |
| p_fruit | 0.0836 * | 0.0819 * | 0.0891 ** | 0.0858 ** | 0.0759 * | X |
| (0.0452) | (0.0419) | (0.0419) | (0.0426) | (0.0453) | ||
| intercept | 4.1909 * | X | X | X | 4.2080 * | X |
| (2.4437) | (2.5393) | |||||
| N | 240 | 240 | 239 | 237 | 237 | 237 |
| R-square | 0.2811 | 0.353 | 0.282 | 0.2995 | 0.2852 | 0.3759 |
| F-stat | 3.7152 | 5.1832 | 3.7115 | 3.9981 | 3.7315 | 4.7993 |
| P-value | 0.0000 | 0.0000 | 0.0000 | 0.0000 | 0.0000 | 0.0000 |
Standard errors in parentheses. * p < 0.10, ** p < 0.05, and *** p < 0.01. X—The variables included as a control but with statistically insignificant coefficients.
Publisher’s Note: MDPI stays neutral with regard to jurisdictional claims in published maps and institutional affiliations. |
© 2020 by the authors. Licensee MDPI, Basel, Switzerland. This article is an open access article distributed under the terms and conditions of the Creative Commons Attribution (CC BY) license (http://creativecommons.org/licenses/by/4.0/).
Share and Cite
MDPI and ACS Style
Xie, L.; Qiu, Z.; You, L.; Kang, Y. A Macro Perspective on the Relationship between Farm Size and Agrochemicals Use in China. Sustainability 2020, 12, 9299. https://0-doi-org.brum.beds.ac.uk/10.3390/su12219299
AMA Style
Xie L, Qiu Z, You L, Kang Y. A Macro Perspective on the Relationship between Farm Size and Agrochemicals Use in China. Sustainability. 2020; 12(21):9299. https://0-doi-org.brum.beds.ac.uk/10.3390/su12219299
Chicago/Turabian StyleXie, Lin, Zeyuan Qiu, Liangzhi You, and Yang Kang. 2020. "A Macro Perspective on the Relationship between Farm Size and Agrochemicals Use in China" Sustainability 12, no. 21: 9299. https://0-doi-org.brum.beds.ac.uk/10.3390/su12219299
Note that from the first issue of 2016, this journal uses article numbers instead of page numbers. See further details here.