Diverse Perceptions on Eco-Certification for Shrimp Aquaculture in Indonesia
by
 ,
,
Fahma Fiqhiyyah Nur Azizah
1, 
Hiroe Ishihara
1,
Aiora Zabala
2 ,
,
Yutaro Sakai
1,
Gede Suantika
3 and
Nobuyuki Yagi
1,* 1
Department of Global Agricultural Sciences, Graduate School of Agricultural and Life Sciences, The University of Tokyo, Tokyo 113-8657, Japan
2
Department of Land Economy, University of Cambridge, 19 Silver Street, Cambridge CB3 9EP, UK
3
Bandung Institute of Technology, School of Life Sciences and Technology, Ganesa 10, Bandung 40132, Indonesia
*
Author to whom correspondence should be addressed.
Sustainability 2020, 12(22), 9387; https://0-doi-org.brum.beds.ac.uk/10.3390/su12229387
Submission received: 19 October 2020
/
Revised: 5 November 2020
/
Accepted: 8 November 2020
/
Published: 11 November 2020
(This article belongs to the Section Social Ecology and Sustainability)
Abstract
:Shrimp is a major aquaculture species in Indonesia. Despite the Indonesian government’s effort to reinforce sustainability practices using a national eco-certification scheme, the uptake of stakeholders has been slow so far. This study analyzed diverse perceptions of the national eco-certification of shrimp aquaculture among stakeholders across the value chain in Indonesia. Using Q-methodology, 49 statements were selected, and they covered seven themes: conceptual understanding, priorities, motivation for eco-certification, market access, impacts of eco-certification, obstacles in Indonesia, and stakeholder involvement. Thirty respondents across the supply chain of whiteleg shrimp sorted these statements according to their level of agreement. Based on their support or opposition to eco-certification, responses were categorized into five perspectives: (1) supporter for the certification by principle, (2) market-oriented supporter, (3) collaborative supporter, (4) ambivalent self-sufficient, and (5) antagonistic business-oriented. Several reasons for stakeholder’s slow acceptance were identified. These include a limited understanding of sustainability concepts in eco-certification, uncertainty for the potential positive effects of eco-certification in terms of market access, the recognition of other priorities such as improving farm-infrastructures, and a lack of stakeholders’ participation in communication forums. The findings of this study can facilitate the process of consensus-building on eco-certification among farmers, scientists, the government, non-governmental organizations, and other stakeholders to support a viable pathway for policy development to achieve sustainable shrimp aquaculture. Ultimately, this study provides new insights on how a country in the Global South perceives eco-certification differently from the Global North.
1. Introduction
Aquaculture has grown rapidly over other animal-producing sectors [1] and is predicted to continue to expand globally [2]. In 2018, aquaculture contributed to 46% of total world fisheries production and had a total value of USD 263.8 billion. Whiteleg shrimp (Litopenaeus vannamei) is a major aquaculture species, contributing to 52.9% of the world productions for crustacean species [3]. The aquacultural sector is also subject to problems including environmental damages (e.g., [4,5,6,7,8]) and social impacts such as the privatization of public lands and waterways, conflicts over space and resources with other sectors, and conflicts with local communities [7,9].
Sustainable seafood initiatives led by environmental pressure groups have emerged to some extent as a response to those environmental and social issues, as well as to regulatory failure in preventing unsustainable activities related to aquaculture and wild fisheries [10]. Especially for aquaculture, initiatives for sustainable practices have also gained ground thanks to industries’ efforts to minimize problems related to pollution and disease such as those by Norwegian salmon farmers, the first such initiative recorded [11]. Moreover, major retailers and other key players in food value chain have pushed sustainability initiatives to get recognition by consumers [11,12]. These initiatives have encouraged the creation of sustainable certification (eco-certification) and labeling (eco-label). These are designed as market-driven voluntary schemes [10,13,14,15] that are usually assessed by third-party auditors (certification bodies) [12,16]. Eco-certification consists of a set of standards addressing environmental and social issues [17] that are applied from upstream to downstream production processes [13] that later connect producers and retailers as a Business-to-Business (B2B) scheme. Eco-labels can also be incorporated as a tool for communication between retailers and consumers as a Business-to-Consumer (B2C) scheme [12,15].
Eco-certification schemes might have potential impacts on international trade [18,19] as a non-tariff barrier [18] that further affect the governance of the shrimp value chain in producing countries [20], most of which come from the Global South, including Indonesia. The whiteleg shrimp industry is crucial for Indonesia as a high value and export-oriented commodity [21]. Production in 2017 reached 737 thousand tons, which mostly originated from aquaculture activities. The Indonesian export value for shrimp commodities reached 1.74 billion USD in 2018 [22], mostly dominated by whiteleg shrimp. In order to remain competitive in the global market, improvements to sustainable aquaculture practices as proposed by eco-certification needs to be taken into account by Indonesia.
Realizing that current global markets for shrimp products demand responsible practice, the government has harmonized multiple national certifications across the shrimp value chain by incorporating environmentally responsible and traceability aspects to each certification as a response to these market demands. In fact, there is a paucity of acceptance and uptake of national eco-certification among stakeholders across the value chain. According to government data, even though the certifications are currently free of charge, in early 2020 for all species (including whiteleg shrimp), only 3694 farmers [23] and 854 hatcheries were certified [24], and 1377 feed companies were registered [25]. This paucity and low uptake could compromise the competitiveness of Indonesia’s shrimp industries in the global market, which would further affect the national economic income. Therefore, investigating the stakeholders’ perceptions of national eco-certification is required. Moreover, in recent years, the government has made another effort toward eco-certification by combining the multiple national certifications to become a single eco-certification (i.e., Indonesian Good Aquaculture Practices (IndoGAP)); the latest one is being discussed.
Research on aquaculture development policy has assessed the level of social acceptance in other contexts, including whether the public or other stakeholders perceive the sector more positively or negatively and finding that the greater negative perception, the lower the acceptance (e.g., [26,27,28,29,30,31,32,33]). For instance, Mazur and Curtis (2006) demonstrated that a higher perceived risk than benefit in aquaculture by the public would lead to less acceptance of government’s aquaculture planning and development in Australia [27]. In addition, investigating diverse perceptions among stakeholders can uncover the most concerning issues [30], as well as factors or reasons that influence the perceptions that emerge from the problems encountered during the process of policy development [34]. Documenting these perceptions can be a useful reference for planning, management, and integrated stakeholder communication [28]. Integration and communication can, in turn, enhance mutual awareness, understanding, and consensus among stakeholders [30].
However, a precise understanding of the reasons behind the diverse stakeholder perceptions and how these perceptions associate with the slow acceptance of eco-certification is challenging. According to Chu et al. (2010), perceptions cannot be directly observed; rather, they can only be measured by self-reported responses given by respondents or drawing conclusions from observing respondent behavior [28]. Several approaches to reveal perceptions have been used in previous research using either single methods or a combination, as well as either qualitative or quantitative techniques such as interviews [35]; surveys (e.g., questionnaires) [28]; surveys and interviews [27,36,37,38]; focus group discussions (FGDs) [39]; newspaper content analysis and FGDs [40]; strength, weakness, opportunities, and threat (SWOT) analysis and analytical hierarchical process (AHP) [41,42]; surveys and AHP [43]; and Q-methodology [44,45,46,47].
In this study, Q-methodology as an approach to elicit perceptions in a rich manner was used. Q-methodology provides a systematic way to study human subjectivity, which is understood as the individual perception (e.g., views, opinions, and beliefs) to see a phenomenon or an issue; it was created by the physicist/psychologist William Stephenson in 1935 [48,49]. Mukherjee et al. (2017) suggested that Q-methodology is more suitable to understand the interlinkages between themes within a topic, as well as to evaluate views on policy [50]. Q-methodology combines statistical analysis and qualitative research to minimize the nuisance of the researcher’s view [51] and to understand the existing subjectivity by comparing several responses [49]. Moreover, this methodology can avoid potential biases such as group-think and the dominance effect, as found in group-based techniques (e.g., FGD) [50]. Q-methodology does not measure the proportion of people that hold a view; rather, it is useful to understand why and how they believe what they do, as well as what is more important for them [48]. As a result, Q-methodology allows for a small sample of respondents ranging from 10 to a few hundred responses [50], although usually less than fifty [51] as long as they represent a variety of opinions on the focal topic. Originally, Q-methodology was used in psychological research, but in recent decades, it has been widely used in many studies, including those related to natural resource management and the understanding of policy acceptability or the address of conflicts (e.g., [30,45,47,52,53,54,55,56,57,58]).
Perceptions of aquaculture producers about eco-labelling including eco-certification were studied by Weitzman and Bailey (2018) [45] and Chikudza et al. (2020) [47] using Q-methodology. However, these focused more on eco-labelling and were conducted in the Global North (e.g., Canada and Europe). The geographical and socio-cultural differences are factors that strongly influence an individual’s perception in shaping a similar phenomenon, as proven by previous research on other topics such as climate change [59] and genetically modified foods [60]. In this case, the different structures of the value chain in seafood production between the Global North and the Global South as one of the socio-cultural features would influence different views or perceptions about eco-certification among stakeholders. To the best of the author’s knowledge, knowledge perceptions on shrimp aquaculture eco-certification among stakeholder across the value chain in the Global South, especially in Indonesia, remains limited. Our study demonstrates the importance of exploring diverse prominent perceptions toward eco-certification among stakeholders in Indonesia using Q-methodology and particularly focuses on understanding their relationship with the slow acceptance of eco-certification observed at the national level.
2. Method
2.1. Background: Eco-Certification on Whiteleg Shrimp in Indonesia
Many schemes of eco-certification have been introduced to Indonesia, mostly from overseas in the forms of private eco-certification schemes (e.g., Global Aquaculture Alliance-Best Aquaculture Practices (GAA-BAP), Aquaculture Stewardship Council (ASC), and GLOBAL G.A.P (Good Aquaculture Practice)). The government is in favor of supporting these private, international eco-certification schemes. However, their standards are not flexible enough to align with the diverse aquaculture systems within the shrimp value chain. This means that the degree of cultural, technical, and political fit remains low in Indonesia [61]. The government has made efforts to harmonize eco-certification regulations by synchronizing the existing national standards with respect to environmental and traceability attributes. However, the eco-certification criteria required by international markets must be integrated throughout the shrimp production value chain, and this poses another challenge in implementing eco-certification due to fragmented shrimp production, as well as regulations, in Indonesia.
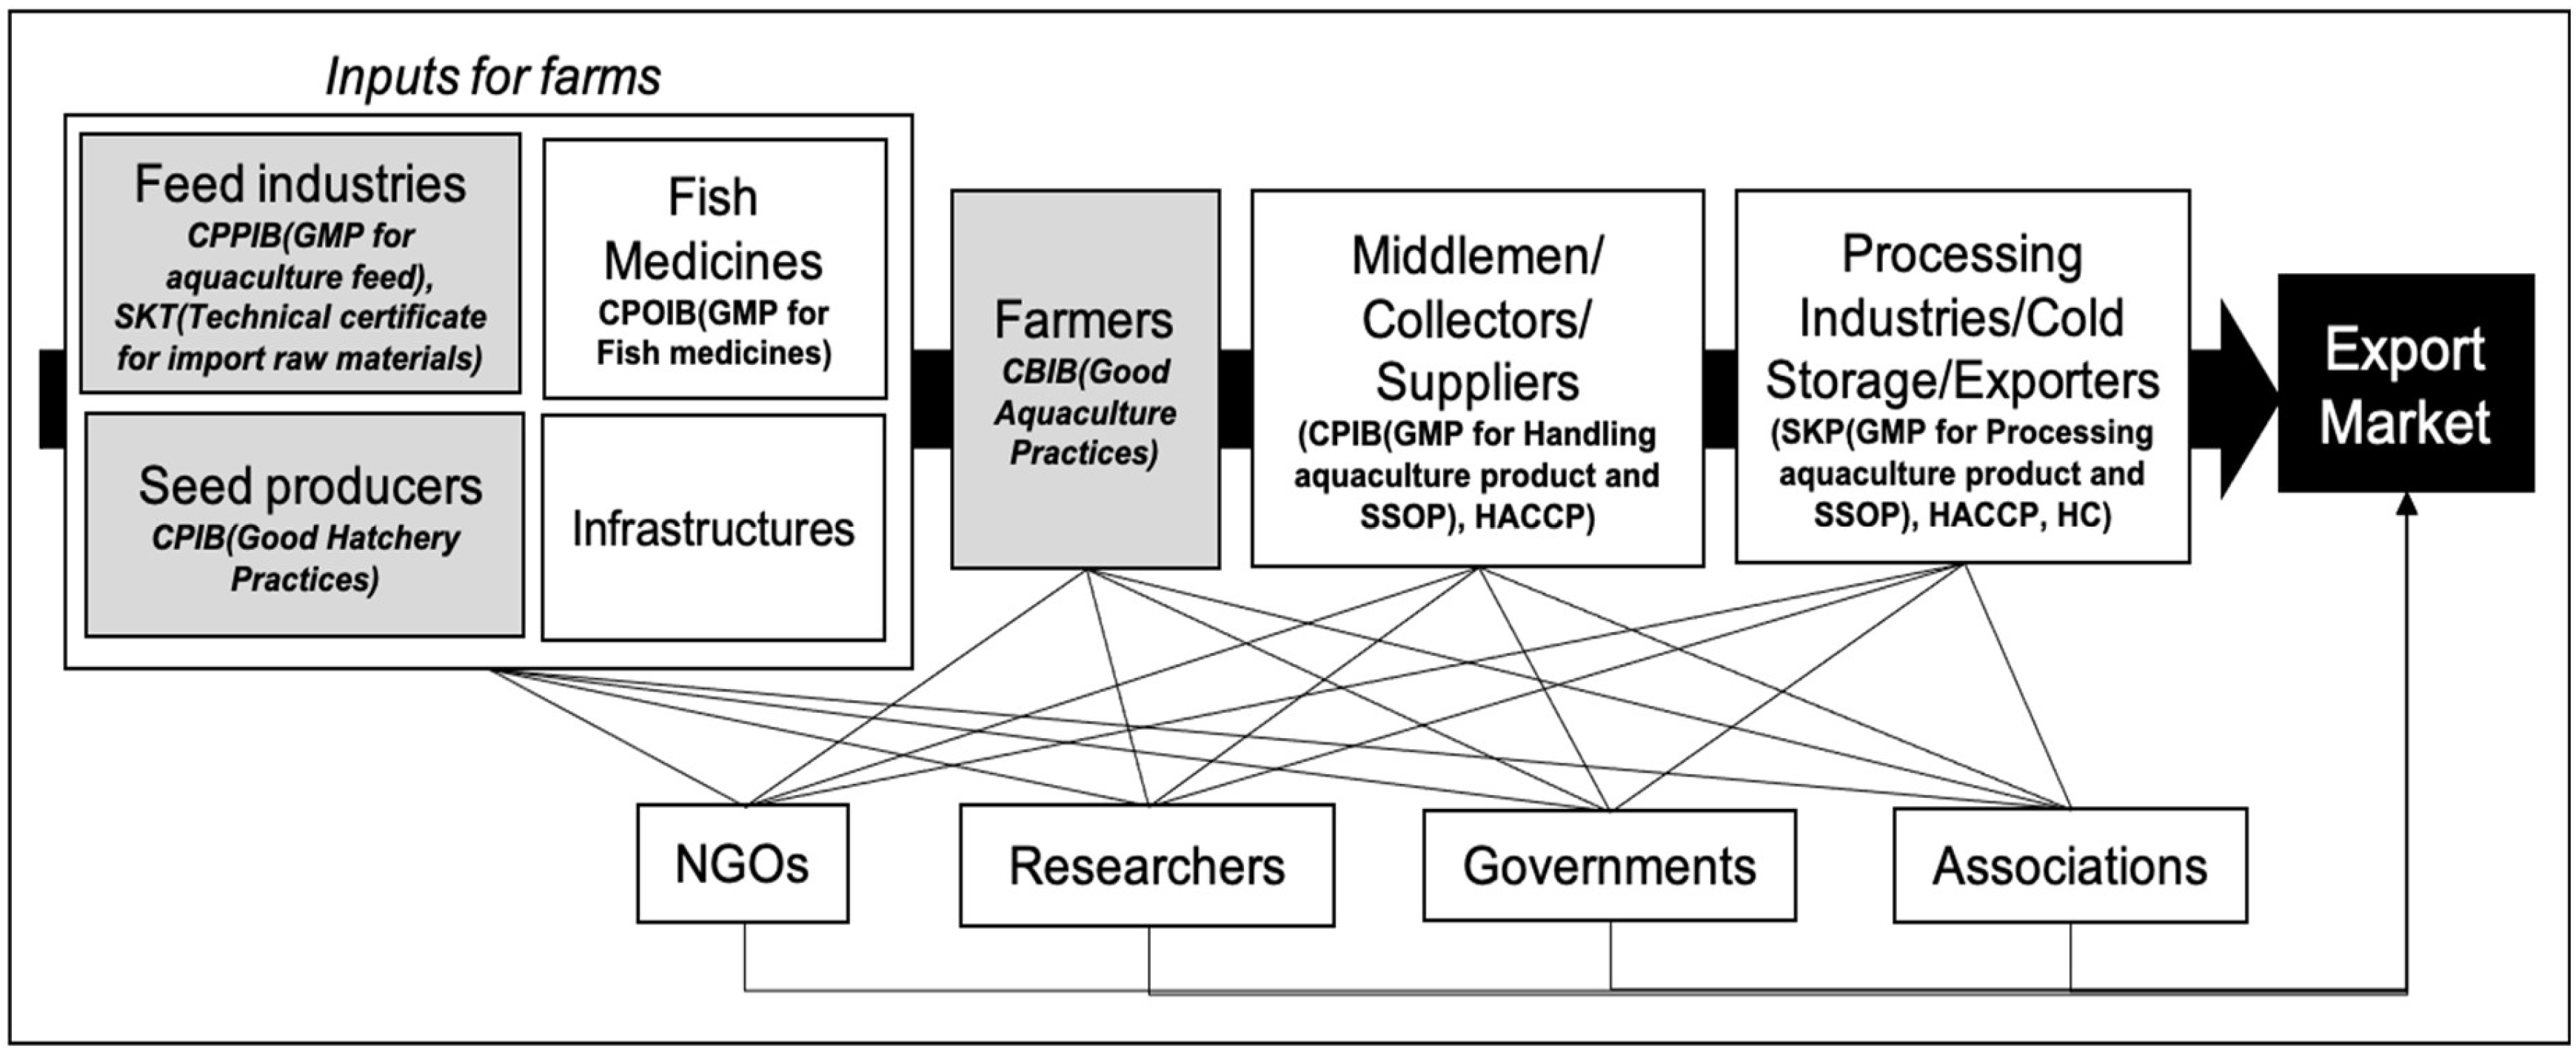
The shrimp value chain (Figure 1) starts from the input providers (e.g., feed and seeds), farmers, collectors, and the processing industries that should meet certain certifications in order to meet the quality assurance system, food safety, and/or standards of eco-certification principles that are regulated by the government in separate regulations. Feed industries, seed producers, and farmers (indicated with grey square) are strongly incorporated with eco-certification, while others are series of chains of custody of the traceability process, particularly for export orientation. A Good Manufacturing Practices (GMP) in aquaculture feed industries or Cara Pembuatan Pakan Ikan yang Baik (CPPIB) and technical certificate for importing raw materials or Surat Keterangan Teknis (SKT) consider the origin of raw materials and the feed production process. Seed producers should comply with Good Hatchery Practices or Cara Pembenihan Ikan yang Baik (CPIB) that consider the broodstock and larva origin, as well as cultivation management. Farmers should comply with Good Aquaculture Practices or Cara Budidaya Ikan yang Baik (CBIB) that focus on wastewater treatment and cultivation management. The others, such as fish medicine suppliers, middlemen/collectors/shrimp suppliers, and processing industries/cold storage/exporters, should comply with several certifications which more focus on food safety, quality control, and assurance system. For instance, fish medicines industries should implement GMP for fish medicines or Cara Pembuatan Obat Ikan yang Baik (CPOIB). Middlemen/collectors/shrimp suppliers should implement GMP for handling aquaculture product and Standard Sanitation Operating Procedures (SSOP) as prerequisites to get certificate of Good Handling Practices or Cara Penanganan Ikan yang Baik (CPIB) and Hazard Analysis and Critical Control Point (HACCP). Processing industries/cold storage/exporters should implement GMP for processing aquaculture product and SSOP to get Processing Eligibility Certificate or Surat Kelayakan Pengolahan (SKP), and Health Certificate (HC) before entering export market [62].
However, these regulations were deemed unable to meet the eco-certification criteria for the international market because they do not qualify as third-party certification schemes. Consequently, the ministry started to collaborate with the Indonesian National Standardization Body (BSN – Badan Standardisasi Nasional) to formulate aquaculture standards that are a combination of CBIB for farmers, CPIB for seed producers, and CPPIB for feed industries to create a new eco-certification scheme called IndoGAP that follows Food and Agriculture Organization (FAO) Technical Guidelines, and Association of Southeast Asian Nations of Shrimp Good Aquaculture Practices (ASEAN Shrimp GAqP). In response, they also will establish several certifying bodies that will be accredited by the Indonesia National Accreditation Committee (KAN – Komite Akreditasi Nasional) [62]. At the time of writing, the policy draft has been completed but has yet to be officially issued, and it remains at the public hearing stage [64]. The focus in this study is the stakeholder’s attitude toward eco-certification, which refers to national eco-certifications such as CBIB, CPIB, and CPPIB, even though it can possibly be related to private international eco-certifications.
2.2. Q-Methodology
Following the standard procedure [48], this study implemented Q-methodology in five steps: the generation of a sample of statements (Q-sample), the selection of participants (P-set), the Q-sorting process (whereby participants sort the statements according to their own opinion), the Q-sorting of data analysis, and factor interpretation. In Q-methodology, the selected statements represent possible and diverse views about the topic of concern that elicit a subjective opinion from the respondent. This study was approved by the Ethics Review Committee of the University of Tokyo.
2.2.1. Generation of a Set of Statements (Q-Sample)
A Q-sample was constructed by selecting statements from a ‘concourse’—a compilation of statements based on the literature and interviews. The reviewed literature included peer-reviewed papers, government websites and reports, and local magazines. Interviews were conducted face-to-face with relevant stakeholders (N = 7) and recorded. Interviewees were asked about their opinions on the eco-certification of whiteleg shrimp aquaculture, with emphasis on current implementation and reasons for the slow stakeholder acceptance of national eco-certification in Indonesia. Once the concourse was compiled, the Q-sample was selected by eliminating statements referring to the same ideas and then editing (merging or adding) and categorizing them into several themes with respect to key areas of interest. A pilot Q-sort was also implemented to interview respondents and to ensure that the Q-sample had a balance of positive, negative, and neutral statements that covered all areas of interest. Forty-nine statements were selected and classified into seven categories (please see Table 3 at page 9).
2.2.2. Selection of Participants (P-Sets)
In Q-methodology, it is necessary to select participants based on the goals of the study and the desired level of diversity in the elicited perspectives. In this study, the P-set included individuals from stakeholder groups (Table 1; N = 30) who were chosen and justified based on their knowledge and roles in the area of the eco-certification of whiteleg shrimp aquaculture in Indonesia and/or their experience of the eco-certification process.
2.2.3. Q-Sorting Process
For the Q-sorting process, participants placed the statements in the Q-sample over a board designed following a quasi-normal distribution curve that uses nine-point levels of agreement from −4 (lowest agreement) to +4 (highest agreement). The Q-sorting process was conducted from September 2019 to January 2020, either face-to-face or through online surveys. Online Q-sorting was conducted with six participants due to the remoteness of their location. In the online survey, we used the Q-methodology website applications (app.qmethodsoftware.com) developed by the authors of [65]. During the sorting process, the author made the participants place all the statements on the board space provided according to their level of agreement [66]. As suggested by a previous study [47], a post-survey interview was subsequently conducted with each participant to obtain additional contextual information for interpreting and confirming the Q-sort results, mainly asking questions regarding the reasons for putting several Q-samples placed on the extreme levels (+4, +3, −3, and −4) in the Q-board. In the online survey, the post-survey explanation was obtained through an additional section after the Q-sorting process, so participants typed their explanation.
2.2.4. Statistical Analysis
Analysis was performed using R version 1.3.959 and the ‘qmethod’ package version 1.5.5 [67]. Data were loaded into the software, and an initial correlation matrix showed which participants sorted the statements in similar ways. Then, the data were analyzed using principal components analysis (PCA) based on participants who had similar perspectives. Each identified perspective was also called a factor, and each participant was associated with each factor by means of a factor loading coefficient. Following this, the factors were rotated using the Varimax method to find the solution that maximized the explained variance in the factors. The number of factors was determined based on an eigenvalue greater than 2, which meant that each factor had at least two significantly loading sorts. The Q-sorts that loaded ±0.40 or above with p < 0.01 on a given factor were selected as most representative for each perspective [45] and were used to calculate the weighted average response that represented each factor. Respondents with high loadings on two or more perspectives were considered confounding and thus excluded from further calculations. The results for each factor were then interpreted.
2.2.5. Factor Interpretation
In the interpretation, each ‘factor’ represents a ‘perspective.’ The perspective was explained according to factor scores, distinguishing statements, and the interview information relevant to particular statements. Moreover, general points of consensus were also identified when all perspectives shared similar scores for certain statements, indicated by statistically insignificant differences.
3. Results
Table 2 shows the factor loadings of respondents, which are grouped into five perspectives, as well as explained variance, total defining Q-sort, and total Q-sort. Five perspectives were delineated, and the total explained variance of all perspectives was 57.19%. This means that 57.19% of the variation in response (Q-sort) can be explained as patterns. The total defining Q-sort means the number of respondents who have one clear (defined) pattern proved by single factor loading of more than ± 0.40. Perspective 1 (P1) consisted of six respondents, perspective 2 (P2) consisted of eight respondents, perspective 3 (P3) consisted of six respondents, perspective 4 (P4) consisted of three respondents, and perspective 5 (P5) consisted of two respondents. Additionally, the total Q-sort includes the respondents who had more than one defined factor loadings and were placed in confounded sort. Most perspectives could be associated with one or more dominant stakeholder groups, except for P5. P1, that of supporter by principle, was mainly represented by scientists; P2, that of market-oriented supporter, was mainly represented by government officials and associations; P3, that of collaborative supporter, was mainly represented by farmers; P4, that of ambivalent self-sufficient, was primarily represented by supporting suppliers; and P5, that of antagonistic business-oriented, only consisted of an environmental non-governmental officer (E-NGO) and supporting supplier.
To interpret those five perspectives, the following descriptions were based on factor scores of −3, −4, 3, and 4 marked by hashtag signs followed by respective statement numbers inside the parenthesis, as well as distinguishing statements indicated with the addition of asterisks (for details, see Table 3). Moreover, there was another important result in this study regarding the common ground: the agreements of all perspectives in understanding the eco-certification, which is reflected in statements that were not statistically significant. The statements are also marked by hashtag signs followed by respective statement numbers inside the parenthesis.
3.1. Common Ground
The results showed that all perspectives were neutral regarding certified farmers and industries receiving less conflict to expand their business (#26). In addition, all perspectives, to some extent, agreed that farm monitoring is lacking and is, sometimes, only a formality in the implementation of eco-certification in Indonesia (#38).
3.2. Perspective 1 (P1)—Supporter by Principle
The central aspect of this perspective is that eco-certification can lead to sustainability. This perspective appreciates that eco-certification supports sustainable development (#2), improves food safety and protecting the ecosystem around aquaculture ponds (#4), and benefits the social community around farms (#5). This view considers that if a farm is certified, the farm would be more likely to implement environmentally friendly practices when compared to uncertified farms (#31*). Because certified farms exist in Indonesia, this perspective believes that whiteleg shrimp farming practices in Indonesia have led to sustainability (#1*).
In the context of market access, this perspective strongly agrees that eco-certification is an important requirement to compete in global markets in the future (#21) because Indonesia is one of the largest shrimp producers in the world (#8). However, the participants who shared this perspective were found to be uncertain about the market differentiation for certified products (#20). Hence, because of its credibility (#29), this perspective places a higher priority on eco-certification than on other programs such as BMP (#10). However, they were found to not prioritize improving pond facilities such as roads and electricity (#11). In addition, they reported not agreeing that certification could widen the competition gap between large and small farmers (#25) because they think their markets are different. In addition, they did not agree that eco-certification is a non-tariff barrier (#28). They stressed that eco-certification should not only be applied to fulfill business legality and administrative requirements (#18). They believed that all involved stakeholders benefit from eco-certification (#39). To achieve successful implementation, it is necessary for national, provincial, and local governments to have a good collaboration with producers (#45); therefore, the bureaucracy for eco-certification should not be complicated (#37).
3.3. Perspective 2 (P2)—Market-Oriented Supporter
This perspective pays much attention to market access benefits. Those sharing P2 were found to perceive eco-certification as an important requirement to compete in the global market in the future (#21) and, hence, that it is important for Indonesia as a shrimp-producing country that has a strong export market (#8). However, for this view, they believed that there are more opportunities to enter particular markets for certified products (#20). They also reported an emphasis on the idea that eco-certification would increase the bargaining position of the industry in the global market (#22), regardless of the eco-certification scheme selected by the industry (#15*). They identified the main motive of farmers participating in eco-certification as economic incentive (#14), with the industry strongly influencing farmers to carry out eco-certification (#49).
This perspective strongly emphasizes that eco-certification should not only be a formality to obtain business legalization and business completeness (#18). Those with this perspective differed from other perspectives in that they did not consider the long-term impact of eco-certification (#7*). This view only believes that eco-certification would improve food safety and protect the ecosystem surrounding the farm (#4). To increase the productivity of certified shrimp, this perspective thought that improving farm-supporting infrastructures such as roads and electricity is as important as eco-certification (#11), which would increase the possibility of reaching a greater export market.
To increase the effectiveness of eco-certification, this perspective emphasizes that the existence of good collaborations of national, provincial, and local governments with producers is necessary (#45), as is support from the central government (#47). However, this perspective strongly feels that applying eco-certification is overly complicated because of bureaucracy (#37*). It also stresses that large social involvement with eco-certification and a good understanding of producers would make the certification more effective (#41). Social involvement could be extensively implemented because participants with this perspective believe that communication technology facilities are adequate to spread information (#36**). However, poor communication among stakeholders in the shrimp supply chain has been an obstacle for eco-certification effectiveness (#40).
3.4. Perspective 3 (P3)—Collaborative Supporter
In general, perspective 3 shares similarities with the perception of sustainability of perspective 1 and the market orientation of perspective 2. This perspective differs in its strong focus on building collaboration among stakeholders. However, for this perspective, the existence of eco-certification opens up greater opportunities to obtain investment funds for industry and farmers (#23*) because according to the explanation during Q-sort process, the limitations of funds can be covered by collaboration among stakeholders, such as ones between farmers and industries. Therefore, this view disagrees that the barrier to comply with eco-certification is due to limited funds (#33), but it does not mean that the processing industry strongly influences farmers to pursue eco-certification (#49).
This perspective also disagrees that certification would widen the competition gap between small and large farmers in terms of market opportunities (#25). Participants sharing this perspective think that both certified and non-certified markets have their own market niches. Thus, although the farmers are willing to participate in the eco-certification scheme, they do not think they would get a premium price (#16). Collaboration between associations and the government could notably increase shrimp production (#44), and collaboration with producers is essential to implement eco-certification (#45), especially in the eco-certification process. This is because it is thought that it is very difficult to meet the standards due to poor data and facilities (#35). It was found that this perspective strongly agrees that support from the central government enhances the effectiveness of eco-certification (#47).
3.5. Perspective 4 (P4)—Ambivalent Self-Sufficient
Perspective 4 neither supports nor opposes eco-certification. This view sees both the potentials and challenges of eco-certification. In the context of sustainability, participants sharing this perspective were found to interpret eco-certification as an effort to improve resource management (#3) and to increase productivity (#6), which could have a significant impact in the near future (#7). This is the reason why the eco-certification program was reported to be deemed more suitable than other programs (#10). However, these participants reported not being sure at all about the certification credibility (#29); compared to other perspectives, they reported a strong disagreement that eco-certification would enhance food safety and protect ecosystems around farms (#4).
This perspective disagrees that the main motives of producers applying eco-certification are only to complete administrative data and legalize businesses (#18). However, as the participants with this perspective observed, eco-certification is only a tool to smoothen the business of the industry (#15) because, among other reasons, they somewhat agrees that it gives an opportunity to enter specific markets (#20) and that eco-certification is not a non-tariff barrier (#28). However, they do not agree that eco-certification improves the bargaining position of the industry in the global market (#22). In terms of stakeholder involvement, they said that they strongly believe that the government has already facilitated farmers’ implementation of sustainable farming practices (#42*) and that the communication forum among stakeholders in the supply chain is adequate (#40*). Additionally, they thought that eco-certification remains effective even if not supported by the national government (#47). However, they agreed that collaboration between the government and the association would represent a successful milestone to increase shrimp productivity (#44). With this collaboration, all stakeholders could benefit from the certification program (#39*).
3.6. Perspective 5 (P5)—Antagonistic Business-Oriented
In general, this perspective is characterized by opposing eco-certification. This view strongly highlights that the condition of farming practices in Indonesia has not been sustainable (#1). Moreover, compared to other perspectives, participants with this perspective indicated that eco-certification could not provide benefits in the context of sustainability. As a result, they do not prioritize eco-certification; instead, they emphasize that eco-certification is not the only program that could lead to sustainability (#9). What the farmers reported requiring are supports to improve farm infrastructure, such as roads and electricity (#11), and disseminating technology to increase farm productivity (#12). However, regarding market access, they believe that the demand for certified whiteleg shrimp products would increase in the future (#19). For this reason, they believe that the main motive for industry conducting eco-certification is business orientation (#15). Nevertheless, they doubt that eco-certification would improve either the industry’s bargaining position in the global market (#22) or the obtainment of a price premium (#16*). Moreover, they do not have a specific market for certified shrimp (#20).
Based on the current situation, the introduction of too many certification schemes would confuse stakeholders in Indonesia (#30*). In addition, the standards, to a certain degree, are not easy to comply with or understand (#34), which is strongly associated with a lack of data, poor facilities (#35), and limited funds (#33*). In terms of stakeholder integration, this factor indicates that eco-certification cannot open collaborations among stakeholders (#27*). This was demonstrated by the opinion that eco-certification has no emphasis in terms of collaboration between the government and associations (#44*). If eco-certification is implemented in Indonesia, the first target should be extensive social involvement to ensure that producers understand the urgency and objectives of eco-certification (#41) by including E-NGOs to promote eco-certification and guide farmers to meet standards (#48).
4. Discussion
4.1. Conceptual Understanding of Eco-Certification
The ultimate goal of eco-certification is to achieve sustainability; therefore, it is important to understand how sustainability is interpreted by each perspective. P1, P2, and P3 highlight that eco-certification improves food safety and protects aquatic ecosystems (see statement 4 in Table 3). This perception was likely raised by farmers, associations, and industries because they were influenced by notifications about the recent regulations from the government. The predominant group of scientists who comprised P1, especially, reported being not only exposed to these regulations but also scientific literature, which has broadened their knowledge on eco-certification in the context of sustainability. It can be seen from their agreement to other statements that eco-certification could support both sustainable development and local community around farms (statements 2 and 5). However, this scientist’s view was reported to be different from other scientist’s views in Nova Scotia, Canada, which were skeptical about eco-certification, considering it to be still debatable [45]. The participants who share P4, mostly encompassing supported suppliers, reported having a remarkably different view from the three previous ones (featured mainly by other stakeholder groups). According to the interviews, this contradictive view regarding statement 4 is based on their observation that certified shrimp is not necessarily safer than non-certified ones. This perception was also supported by another study related to national certification in Vietnam (VietGAP), showing no evidence that certified shrimp is safer [68].
Regarding market access (one of the benefits promised by the eco-certification scheme), previous research has shown that it is a key driver for stakeholders to adopt eco-certification (see [12,45,47]). P1, P2, and P3 reported agreeing on this point. They consider that eco-certification should be prioritized because Indonesia is a shrimp-exporting country (statement 8) and should maintain competitive in the global market (statement 21). Those who share P2, with a predominance of government officials, were found to be the most representative for the perspective in terms of market access. Besides statements 8 and 21, they also have strong confidence that there is market differentiation for certified shrimp products (statement 20), as strongly opposed by P5, and are not concerned by P1, P3, and P4. Based on interview results, the government holds the view that the current global market has a strong preference for products that are produced in a traceable and environmentally friendly manner. Therefore, the government has attempted to achieve greater market access by creating national eco-certification standards that are expected to be recognized by global market.
Those who share P2 also assume that they need to increase the incentives because farmers would only participate in eco-certification if there is an economic incentive (statement 14). Through eco-certification, they expect to give farmers access to reach the global market and automatically increase farmers’ profits. However, this assumption does not align with P3, which predominantly comes from farmers. The interview results suggest that farmers understand that it is difficult to obtain economic incentives such as premium price at farmer level. Because of the fragmented production system, farmers do not directly interact with international market that makes them lack global market information. Moreover, the distribution of profit-sharing at the farmer level is usually lower compared to other stakeholders across the value chain (e.g., [69]). As a result, even though there is premium price in international market, the profit margin will not distribute evenly across the value chain. The main reason for farmers to apply for eco-certification is to maintain stable transactions with buyers (middlemen, cold storages, or processing industries) who suggest that they apply for the certification. Moreover, based on their view, there is substantial domestic market demand with competitive price that does not require eco-certification. Previous research has found that shrimp demand is much higher than supply in Indonesia [61]. Therefore, farmers do not have to be certified because non-certified shrimp are still widely accepted by the domestic market. However, the perspective of the industry is mostly influenced by their buyers because they interact directly with both national and international buyers. Therefore, eco-certification requirements are based on whether buyers require certified products or not.
4.2. Current Implementation and Stakeholder Engagement
Most stakeholders prioritize infrastructure support above eco-certification. They participants who share P2, P3, and P5 hold the view that increasing the productivity of aquaculture practice through improving farm infrastructure is more important than eco-certification. This view is in line with government policy to increase shrimp production to meet market demand. Moreover, for farmers, increasing productivity means an increase in income, and for industries, increased productivity means receiving a greater number of shrimps from farmers. For those who share P5 instead, providing technology that enhances environmental performance could be an alternative to increasing productivity. In general, this opinion was found to emerge from most stakeholders because it is related to the financial situation that is typically limited in developing countries. Budget allocation in aquaculture programs should prioritize infrastructure development to enhance productivity.
In terms of the legal context, all perspectives were neutral regarding statement 46, which stated that government regulations currently support the implementation of eco-certification. This is somewhat surprising given that the government has amended national certifications by including environmentally responsible and traceability objectives to address sustainability issues. An explanation for this lack of engagement with this statement is that stakeholders likely realize that existing government regulations do not fully address sustainability according to the international requirements. According to interview results, farmers think that the regulations lack technical guidance, such as how to interpret the standards. For example, the farmers mentioned that new regulations emphasize that farms must have wastewater treatment facilities. However, they had experienced difficulties constructing these facilities due to a lack of technical guidance on the design and provisions.
Regarding stakeholder engagement, the role of government in promoting eco-certification as found to be contested among the different perspectives; those who share P1, P2, and P3 are supportive of central government involvement, whereas those who share P4 are against. International eco-certification could be implemented without government involvement. Therefore, for the opposing side, international eco-certification is preferable. This very-opposed view is a form of stakeholders’ distrust of the government in regulating eco-certification. Those who share P4 argue that the government has not been able to define the urgency and tangible benefits of certification for stakeholders. Another issue for stakeholder engagement is the forums for communication. Those who share P2 think that communication forums were insufficient, while those who share P4 were found to think inversely (statement 40). As seen interview results, those who share P4 see that many active communication forums, such as association and aquaculture programs held by many stakeholders, exist. Meanwhile, for those who share P2, many forums exist but are not yet fully interactive and participative for the stakeholders.
In addition, the view of those who share P2 about communication is closely associated with that about bureaucracy (statement 37), whereby a major barrier to implementing eco-certification in Indonesia is the complexity of bureaucracy. Indonesia has a decentralized system divided into central, provincial, and local governments that has the potential to incur legal conflicts, inconsistencies, gaps, and overlaps among them [70]. Associations and farmers in those who share P2 generalize the complexity of bureaucracy in the context of their farming business licensing because business legality is included as one of the certification requirements. Meanwhile, governments those who share P2, thought this complexity of bureaucracy came from the certification process, refers to the regulation of certification guidelines (Regulation of Directorate General of Aquaculture No. 13/PER-DJPB/2018), which fully requires good integration and communication among the respective government staff of the central, provincial, and local governments. The critical point is the audit process’s effectiveness depends on the allocation of funds from central to provincial government—if the fund is limited, the audit process is also hampered. This explanation is related to common ground results of all perspectives that the audit process is lacking and sometimes only a formality.
5. Conclusions
There were five distinct perspectives identified about the eco-certification of whiteleg shrimp aquaculture in Indonesia ranging from supporting to opposite views. Perspective 1 supports eco-certification in the belief that eco-certification will improve the sustainability of shrimp aquaculture. Perspective 2 supports eco-certification as a tool to reach greater market access, whereas perspective 3 supports eco-certification with stakeholder collaboration. Respondents represented by perspective 4 either support or oppose eco-certification and share a strongly skeptical view about the government. Perspective 5 opposes the eco-certification because it is considered to be a business tool rather than a means for sustainability. These diverse perceptions show there are strong reservations about eco-certification that may have contributed to its slow acceptance thus far.
The quantitative and qualitative analysis using Q-methodology helped us identify these perceptions and to analyze the reason for stakeholders’ slow acceptance of eco-certification. The quantitative approach helped to reveal statistically how several topics were more emphasized than others, and the qualitative approach helped to reveal the reasons behind this differentiated emphasis obtained from the quantitative approach.
From the results, several key reasons for the low acceptance of national eco-certification could be identified. First, most of the perspectives are not yet concerned with sustainability, except for P1, and they are still more concerned with food safety. There is a need to change the stakeholders’ mindset about the importance of incorporating sustainable practices into their activities. This can be achieved by clearly defining the goals of sustainability in eco-certification regulation followed by clear technical guidelines. Second, there are broad differences among all perspectives in their opinions regarding market access for certified products. This is a critical point because increasing market access, as promised by eco-certification, has not yet been proven. Third, due to a limited production infrastructure (a common issue in developing countries), most perspectives still prioritize the allocation of funds for improving farm infrastructure and productivity rather than for sustainable practices. If infrastructures are adequate, farmers would be more likely to carry out certification. Eco-certification can be prioritized to clusters of farmers who already have good infrastructures or have previously improved their farms for certification. For those who still need major technical improvement, the government can support them by jointly improving their infrastructure and providing assistance to meet eco-certification standards. The final reason regards communication forums, which have not been used effectively; as result, there has been an asymmetric distribution of information. The communication forum must be more active and participative so that information is well-distributed from the central government to all stakeholders and vice versa.
Considering that stakeholder perception can help the government improve stakeholder acceptance, this could be further enhanced by involving stakeholders in the process of new eco-certification schemes such as in training or mentoring. Most importantly, each step of those processes should be carefully evaluated before establishing new regulations of eco-certification. The findings of this study can facilitate the process of consensus-building on eco-certification among farmers, scientists, government, NGOs, and other stakeholders for more sustainable aquaculture.
This study has proven that geographical and socio-cultural differences, as the basis for the difference in perceptions between the Global North and the Global South, can also be applied to eco-certification. There are contrasting perceptions of eco-certification between the Global North and the Global South. Because of different geographical locations and fragmented production in Indonesia, stakeholders, in general, are not directly exposed to the global market (except for the downstream industries); as a consequence, they are not aware that their export market requires care for sustainability. Furthermore, a lack of coordination among stakeholders across the value chain has exacerbated the flow of information that comes from global market. In addition, the stakeholders in the Global North are standard setters who yield power to set the standards as they wish, whereas the stakeholders in the Global South are standard takers who have had to follow the standards that have been set by the Global North. Conducting a study on stakeholders’ perceptions of eco-certification in Indonesia provides some pieces of evidence for the idea that there are differences in the perception of eco-certification in the Global South.
Author Contributions
Conceptualization, F.F.N.A. and H.I.; data curation, F.F.N.A.; formal analysis, F.F.N.A., Y.S. and A.Z.; funding acquisition, N.Y.; methodology, F.F.N.A., A.Z. and G.S.; software, F.F.N.A. and A.Z.; supervision, G.S. and N.Y.; validation, N.Y.; writing—original draft, F.F.N.A.; writing—review and editing, H.I., A.Z., Y.S., G.S. and N.Y. All authors have read and agreed to the published version of the manuscript.
Funding
This research was funded by JSPS (Japan Society for the Promotion of Science) Grants-in-Aid for Scientific Research (KAKENHI) grant number 16H02565.
Acknowledgments
We would like to thank to Machmud, Debora Prihatmajanti from Ministry of Marine Affairs and Fisheries of Republic of Indonesia for sharing valuable insights for the study. We also thank to M. Prima Putra and Ahmad Aki Muhaimin, for introducing the author with several respondents involved in the study.
Conflicts of Interest
The authors declare no conflict of interest.
References
- Little, D.C.; Newton, R.W.; Beveridge, M.C.M. Aquaculture: A Rapidly Growing and Significant Source of Sustainable Food? Status, Transitions and Potential. Proc. Nutr. Soc. 2016, 75, 274–286. [Google Scholar] [CrossRef] [PubMed]
- Tran, N.; Rodriguez, U.-P.; Chan, C.Y.; Phillips, M.J.; Mohan, C.V.; Henriksson, P.J.G.; Koeshendrajana, S.; Suri, S.; Hall, S. Indonesian Aquaculture Futures: An Analysis of Fish Supply and Demand in Indonesia to 2030 and Role of Aquaculture Using the AsiaFish Model. Mar. Policy 2017, 79, 25–32. [Google Scholar] [CrossRef]
- Food and Agriculture Organization of The United Nation. The State of World Fisheries and Aquaculture 2020. Sustainability in Action; Food and Agriculture Organization of The United Nation: Rome, Italy, 2020; Volume 35. [Google Scholar]
- Arifanti, V.B.; Kauffman, J.B.; Hadriyanto, D.; Murdiyarso, D.; Diana, R. Carbon Dynamics and Land Use Carbon Footprints in Mangrove-Converted Aquaculture: The Case of the Mahakam Delta, Indonesia. For. Ecol. Manag. 2019, 432, 17–29. [Google Scholar] [CrossRef]
- Bush, S.R.; Van Zwieten, P.A.M.; Visser, L.; Van Dijk, H.; Bosma, R.; de Boer, F.; Verdegem, M. Rebuilding Resilient Shrimp Aquaculture in South-East Asia: Disease Management, Coastal Ecology, and Decision Making. In Tropical Deltas and Coastal Zones: Food Production, Communities and Environment at the Land-Water Interface; Hoanh, C.T., Szuster, B.W., Suan-Pheng, K., Ismail, A.M., Noble, A.D., Eds.; CAB International: Oxfordshire, UK, 2010; pp. 117–132. [Google Scholar]
- Hukom, V.; Nielsen, R.; Asmild, M.; Nielsen, M. Do Aquaculture Farmers Have an Incentive to Maintain Good Water Quality? The Case of Small-Scale Shrimp Farming in Indonesia. Ecol. Econ. 2020, 176, 106717. [Google Scholar] [CrossRef]
- Primavera, J.H. Overcoming the Impacts of Aquaculture on the Coastal Zone. Ocean Coast. Manag. 2006, 49, 531–545. [Google Scholar] [CrossRef]
- Suantika, G.; Situmorang, M.L.; Kurniawan, J.B.; Pratiwi, S.A.; Aditiawati, P.; Astuti, D.I.; Azizah, F.F.N.; Djohan, Y.A.; Zuhri, U.; Simatupang, T.M. Development of a Zero Water Discharge (ZWD)—Recirculating Aquaculture System (RAS) Hybrid System for Super Intensive White Shrimp (Litopenaeus Vannamei) Culture under Low Salinity Conditions and Its Industrial Trial in Commercial Shrimp Urban Farming in G. Aquac. Eng. 2018, 82, 12–24. [Google Scholar] [CrossRef]
- Osmundsen, T.C.; Amundsen, V.S.; Alexander, K.A.; Asche, F.; Bailey, J.; Finstad, B.; Olsen, M.S.; Hernández, K.; Salgado, H. The Operationalisation of Sustainability: Sustainable Aquaculture Production as Defined by Certification Schemes. Glob. Environ. Chang. 2020, 60, 102025. [Google Scholar] [CrossRef]
- Jonell, M.; Tlusty, M.; Troell, M.; Rönnbäck, P. Certifying Farmed Seafood. In Sustainability Certification Schemes in the Agricultural and Natural Resource Sectors: Outcomes for Society and the Environment; Vogt, M., Ed.; Routledge: London, UK; New York, NY, USA, 2019; pp. 157–178. [Google Scholar]
- Lee, D. Aquaculture Certification. In Seafood Ecolabelling; Ward, T., Phillips, B., Eds.; Wiley-Blackwell: Hoboken, NJ, USA; Oxford, UK, 2008; pp. 106–133. [Google Scholar]
- Amundsen, V.S.; Osmundsen, T.C. Becoming Certified, Becoming Sustainable? Improvements from Aquaculture Certification Schemes as Experienced by Those Certified. Mar. Policy 2020, 119, 104097. [Google Scholar] [CrossRef]
- Samerwong, P.; Toonen, H.M.; Oosterveer, P.; Bush, S.R. A Capability Approach to Assess Aquaculture Sustainability Standard Compliance. PLoS ONE 2020, 15, e0227812. [Google Scholar] [CrossRef]
- Tlusty, M.F. Environmental Improvement of Seafood through Certification and Ecolabelling: Theory and Analysis. Fish Fish. 2012, 13, 1–13. [Google Scholar] [CrossRef]
- Washington, S.; Ababouch, L. Private Standards and Certification in Fisheries and Aquaculture: Current Practice and Emerging Issues; Aquacuture Technical Paper; FAO Fish: Roma, Italy, 2011; Volume 203. [Google Scholar]
- Tlusty, M.F.; Tausig, H. Reviewing GAA-BAP Shrimp Farm Data to Determine Whether Certification Lessens Environmental Impacts. Rev. Aquac. 2015, 7, 107–116. [Google Scholar] [CrossRef]
- Bush, S.R.; Oosterveer, P.; Bottema, M.; Meuwissen, M.; de Mey, Y.; Chamsai, S.; Lien, H.H.; Chadag, M. Inclusive Environmental Performance through ‘beyond-Farm’ Aquaculture Governance. Curr. Opin. Environ. Sustain. 2019, 41, 49–55. [Google Scholar] [CrossRef]
- Crona, B.I.; Basurto, X.; Squires, D.; Gelcich, S.; Daw, T.M.; Khan, A.; Havice, E.; Chomo, V.; Troell, M.; Buchary, E.A.; et al. Towards a Typology of Interactions between Small-Scale Fisheries and Global Seafood Trade. Mar. Policy 2016, 65, 1–10. [Google Scholar] [CrossRef]
- Foley, P.; Havice, E. The Rise of Territorial Eco-Certifications: New Politics of Transnational Sustainability Governance in the Fishery Sector. Geoforum 2016, 69, 24–33. [Google Scholar] [CrossRef] [Green Version]
- Bush, S.R. Understanding the Potential of Eco-Certification in Salmon and Shrimp Aquaculture Value Chains. Aquaculture 2018, 493, 376–383. [Google Scholar] [CrossRef]
- Rimmer, M.A.; Sugama, K.; Rakhmawati, D.; Rofiq, R.; Habgood, R.H. A Review and SWOT Analysis of Aquaculture Development in Indonesia. Rev. Aquac. 2013, 5, 255–279. [Google Scholar] [CrossRef]
- Ministry of Marine Affairs and Fisheries of Republic of Indonesia. Kelautan Dan Perikanan Dalam Angka 2018; Kementrian Kelautan dan Perikanan Republik Indonesia: Jakarta, Indonesia, 2018. [Google Scholar]
- Daftar Nama Unit Budidaya Bersertifikat CBIB. Available online: https://kkp.go.id/an-component/media/upload-gambar-pendukung/DJPB/Data Lain 2020/Daftar Nama Unit Budidaya Bersertifikat CBIB (Desember 2019).pdf (accessed on 5 October 2020).
- Daftar Unit Pembenihan Bersertifikat CPIB 2020. Available online: https://kkp.go.id/an-component/media/upload-gambar-pendukung/DJPB/Data Lain 2020/Hatchery CPIB Feb 2020_publish.pdf (accessed on 5 October 2020).
- Daftar Perusahaan Pakan ikan Dan Udang Terdaftar Per Januari 2020. Available online: https://kkp.go.id/an-component/media/upload-gambar-pendukung/DJPB/Data Lain 2020/No. Reg. Pendaftaran Pakan Aktif Hingga Januari 2020 (1377 merek pakan).pdf (accessed on 5 October 2020).
- Kaiser, M.; Stead, S.M. Uncertainties and Values in European Aquaculture: Communication, Management and Policy Issues in Times of “Changing Public Perceptions”. Aquac. Int. 2002, 10, 469–490. [Google Scholar] [CrossRef]
- Mazur, N.A.; Curtis, A.L. Risk Perceptions, Aquaculture, and Issues of Trust: Lessons from Australia. Soc. Nat. Resour. 2006, 19, 791–808. [Google Scholar] [CrossRef]
- Chu, J.; Anderson, J.L.; Asche, F.; Tudur, L. Stakeholders’ Perceptions of Aquaculture and Implications for Its Future: A Comparison of the U.S.A. and Norway. Mar. Resour. Econ. 2010, 25, 61–76. [Google Scholar] [CrossRef]
- Ahsan, D.; Brandt, U.S. Climate Change and Coastal Aquaculture Farmers’ Risk Perceptions: Experiences from Bangladesh and Denmark. J. Environ. Plan. Manag. 2015, 58, 1649–1665. [Google Scholar] [CrossRef]
- Bacher, K.; Gordoa, A.; Mikkelsen, E. Stakeholders’ Perceptions of Marine Fish Farming in Catalonia (Spain): A Q-Methodology Approach. Aquaculture 2014, 424–425, 78–85. [Google Scholar] [CrossRef]
- Knapp, G.; Rubino, M.C. The Political Economics of Marine Aquaculture in the United States. Rev. Fish. Sci. Aquac. 2016, 24, 213–229. [Google Scholar] [CrossRef]
- Froehlich, H.E.; Gentry, R.R.; Rust, M.B.; Grimm, D.; Halpern, B.S. Public Perceptions of Aquaculture: Evaluating Spatiotemporal Patterns of Sentiment around the World. PLoS ONE 2017, 12, e0169281. [Google Scholar] [CrossRef] [PubMed] [Green Version]
- Lebel, L.; Lebel, P.; Chuah, C.J. Water Use by Inland Aquaculture in Thailand: Stakeholder Perceptions, Scientific Evidence, and Public Policy. Environ. Manag. 2019, 63, 554–563. [Google Scholar] [CrossRef]
- Bacher, K. Perceptions and Misconceptions of Aquaculture. Globefish Res. Program. 2015, 120, 35. [Google Scholar]
- Alexander, K.A.; Angel, D.; Freeman, S.; Israel, D.; Johansen, J.; Kletou, D.; Meland, M.; Pecorino, D.; Rebours, C.; Rousou, M.; et al. Improving Sustainability of Aquaculture in Europe: Stakeholder Dialogues on Integrated Multi-Trophic Aquaculture (IMTA). Environ. Sci. Policy 2016, 55, 96–106. [Google Scholar] [CrossRef]
- Rivera, A.; Unibazo, J.; León, P.; Vásquez-Lavín, F.; Ponce, R.; Mansur, L.; Gelcich, S. Stakeholder Perceptions of Enhancement Opportunities in the Chilean Small and Medium Scale Mussel Aquaculture Industry. Aquaculture 2017, 479, 423–431. [Google Scholar] [CrossRef]
- D’Anna, L.M.; Murray, G.D. Perceptions of Shellfish Aquaculture in British Columbia and Implications for Well-Being in Marine Social-Ecological Systems. Ecol. Soc. 2015, 20, 57. [Google Scholar] [CrossRef] [Green Version]
- Mathé, S.; Rey-Valette, H. Local Knowledge of Pond Fish-Farming Ecosystem Services: Management Implications of Stakeholders’ Perceptions in Three Different Contexts (Brazil, France and Indonesia). Sustainability 2015, 7, 7644–7666. [Google Scholar] [CrossRef] [Green Version]
- Schlag, A.K.; Ystgaard, K. Europeans and Aquaculture: Perceived Differences between Wild and Farmed Fish. Br. Food J. 2013, 115, 209–222. [Google Scholar] [CrossRef]
- Rickard, L.N.; Noblet, C.L.; Duffy, K.; Christian Brayden, W. Cultivating Benefit and Risk: Aquaculture Representation and Interpretation in New England. Soc. Nat. Resour. 2018, 31, 1358–1378. [Google Scholar] [CrossRef]
- Henríquez-Antipa, L.A.; Cárcamo, F. Stakeholder’s Multidimensional Perceptions on Policy Implementation Gaps Regarding the Current Status of Chilean Small-Scale Seaweed Aquaculture. Mar. Policy 2019, 103, 138–147. [Google Scholar] [CrossRef]
- Ton Nu Hai, A.; Speelman, S. Involving Stakeholders to Support Sustainable Development of the Marine Lobster Aquaculture Sector in Vietnam. Mar. Policy 2020, 113, 103799. [Google Scholar] [CrossRef]
- Whitmarsh, D.; Palmieri, M.G. Social Acceptability of Marine Aquaculture: The Use of Survey-Based Methods for Eliciting Public and Stakeholder Preferences. Mar. Policy 2009, 33, 452–457. [Google Scholar] [CrossRef]
- Carr, L.M.; Liu, D.Y. Measuring Stakeholder Perspectives on Environmental and Community Stability in a Tourism-Dependent Economy. Int. J. Tour. Res. 2016, 18, 620–632. [Google Scholar] [CrossRef]
- Weitzman, J.; Bailey, M. Perceptions of Aquaculture Ecolabels: A Multi-Stakeholder Approach in Nova Scotia, Canada. Mar. Policy 2018, 87, 12–22. [Google Scholar] [CrossRef]
- Steeves, L.; Filgueira, R. Stakeholder Perceptions of Climate Change in the Context of Bivalve Aquaculture. Mar. Policy 2019, 103, 121–129. [Google Scholar] [CrossRef]
- Chikudza, L.; Gauzente, C.; Guillotreau, P.; Alexander, K.A. Producer Perceptions of the Incentives and Challenges of Adopting Ecolabels in the European Finfish Aquaculture Industry: A Q-Methodology Approach. Mar. Policy 2020, 104176. [Google Scholar] [CrossRef]
- McKeown, B.; Thomas, D. Q Methodology, 2nd ed.; Quantitative Applications in the Social Sciences, No. 66.; Sage Publications, Inc.: Thousand Oaks, CA, USA, 2013. [Google Scholar]
- Brown, S.R. A Primer on Q Methodology. Operant Subj. 1993, 16, 91–138. [Google Scholar]
- Mukherjee, N.; Zabala, A.; Huge, J.; Nyumba, T.O.; Adem Esmail, B.; Sutherland, W.J. Comparison of Techniques for Eliciting Views and Judgements in Decision-Making. Methods Ecol. Evol. 2018, 9, 54–63. [Google Scholar] [CrossRef] [Green Version]
- Ellingsen, I.T.; Størksen, I.; Stephens, P. Q Methodology in Social Work Research. Int. J. Soc. Res. Methodol. 2010, 13, 395–409. [Google Scholar] [CrossRef]
- Carr, L.M. Seeking Stakeholder Consensus within Ireland’s Conflicted Salmon Aquaculture Space. Mar. Policy 2019, 99, 201–212. [Google Scholar] [CrossRef]
- Cavanagh, R.D.; Hill, S.L.; Knowland, C.A.; Grant, S.M. Stakeholder Perspectives on Ecosystem-Based Management of the Antarctic Krill Fishery. Mar. Policy 2016, 68, 205–211. [Google Scholar] [CrossRef] [Green Version]
- Davies, B.B.; Hodge, I.D. Shifting Environmental Perspectives in Agriculture: Repeated Q Analysis and the Stability of Preference Structures. Ecol. Econ. 2012, 83, 51–57. [Google Scholar] [CrossRef]
- Gall, S.C.; Rodwell, L.D. Evaluating the Social Acceptability of Marine Protected Areas. Mar. Policy 2016, 65, 30–38. [Google Scholar] [CrossRef]
- Iofrida, N.; De Luca, A.I.; Gulisano, G.; Strano, A. An Application of Q-Methodology to Mediterranean Olive Production–Stakeholders’ Understanding of Sustainability Issues. Agric. Syst. 2018, 162, 46–55. [Google Scholar] [CrossRef]
- Moser, D.J.; Baulcomb, C. Social Perspectives on Climate Change Adaptation, Sustainable Development, and Artificial Snow Production: A Swiss Case Study Using Q Methodology. Environ. Sci. Policy 2020, 104, 98–106. [Google Scholar] [CrossRef]
- Zabala, A.; Sandbrook, C.; Mukherjee, N. When and How to Use Q Methodology to Understand Perspectives in Conservation Research. Conserv. Biol. 2018, 32, 1185–1194. [Google Scholar] [CrossRef] [Green Version]
- Lee, T.M.; Markowitz, E.M.; Howe, P.D.; Ko, C.Y.; Leiserowitz, A.A. Predictors of public climate change awareness and risk perception around the world. Nat. Clim. Chang. 2015, 5, 1014–1020. [Google Scholar] [CrossRef]
- Finucane, M.L.; Holup, J.L. Psychosocial and cultural factors affecting the perceived risk of genetically modified food: An overview of the literature. Soc. Sci. Med. 2005, 60, 1603–1612. [Google Scholar] [CrossRef]
- Schouten, G.; Vellema, S.; Van Wijk, J. Diffusion of Global Sustainability Standards: The Institutional Fit of the ASC-Shrimp Standard in Indonesia. RAE Rev. Adm. Empres. 2016, 56, 411–423. [Google Scholar] [CrossRef] [Green Version]
- Prihatmajanti, D. Ministry of Marine Affairs and Fisheries of Republic of Indonesia, Jakarta, Indonesia, Personal communication. 2020. [Google Scholar]
- van Duijn, A.P.; Beukers, R.; van der Pijl, W. The Indonesian Seafood Sector: A Value Chain Analysis; Wageningen University and Research: The Hague, The Netherlands, 2012. [Google Scholar]
- Public Hearing Petunjuk Teknis Skema Sertifikasi Produk Indonesian Good Aquaculture Practices (IndoGAP). Available online: https://www.bsn.go.id/main/berita/detail/10367/public-hearing-petunjuk-teknis-skema-sertifikasi-produk-indonesian-good-aquaculture-practices-indogap (accessed on 1 May 2020).
- Lutfallah, S.; Buchanan, L. Quantifying Subjective Data Using Online Q-Methodology Software. Ment. Lex. 2019, 14, 415–423. [Google Scholar] [CrossRef]
- Bueno, P.F.; Schiavetti, A. The Influence of Fisherman Scale in the Resilience of Socio-Ecological Systems: An Analysis Using Q Methodology. Ocean Coast. Manag. 2019, 169, 214–224. [Google Scholar] [CrossRef]
- Zabala, A. Qmethod: A Package to Explore Human Perspectives Using Q Methodology. R J. 2014, 6, 163–173. [Google Scholar] [CrossRef] [Green Version]
- Quyen, K.N.T.; Van Hien, H.; Doan Khoi, L.N.; Yagi, N.; Lerøy Riple, A.K. Quality Management Practices of Intensive Whiteleg Shrimp (Litopenaeus Vannamei) Farming: A Study of the Mekong Delta, Vietnam. Sustainability 2020, 12, 4520. [Google Scholar] [CrossRef]
- Purcell, S.W.; Crona, B.I.; Lalavanua, W.; Eriksson, H. Distribution of Economic Returns in Small-Scale Fisheries for International Markets: A Value-Chain Analysis. Mar. Policy 2017, 86, 9–16. [Google Scholar] [CrossRef]
- Wever, L.; Glaser, M.; Gorris, P.; Ferrol-Schulte, D. Decentralization and Participation in Integrated Coastal Management: Policy Lessons from Brazil and Indonesia. Ocean Coast. Manag. 2012, 66, 63–72. [Google Scholar] [CrossRef]
Figure 1.
Shrimp value chain in Indonesia (modified from [63]).
Figure 1.
Shrimp value chain in Indonesia (modified from [63]).


Table 1.
Stakeholder groups involved in the study: The number of respondents in each group is shown in parentheses.
Table 1.
Stakeholder groups involved in the study: The number of respondents in each group is shown in parentheses.
| Stakeholder Group | Definition |
|---|---|
| Supporting supplier (N = 3) | Companies or individuals who provide the inputs for farm operations, such as feed, seed suppliers or pond constructors. |
| Farmer (N = 7) | Individuals or groups who cultivate whiteleg shrimp from the stage of post larvae to marketable shrimp size, e.g., a raw shrimp producer. |
| Middleman (N = 2) | Individuals or groups who buy/collect raw shrimp from farmers, typically have small capacity for cold storage, and sell the shrimp to processing industry/cold storage company/exporter/retailer. |
| Cold storage/ processing industry/exporter (N = 3) | Companies who process the shrimp to become prepared products or pack the raw shrimp to the desired packing size for export purposes or for selling the products to domestic retailers. |
| Association (N = 4) | Organizations that have the function of connecting people who have the same objectives or interests, e.g., farmer association and seafood industry association. |
| Government (N = 5) | State authority body consisting of national, provincial, and local governments. |
| Scientist (N = 3) | Individuals who carry out the scientific research in the field of fisheries and aquaculture management and who belong to academic/research institutions. |
| Environmental non-governmental officer (E-NGO) (N = 3) | Organizations that operate independently and have a specific focus on environmental issues, including coastal and marine environment. |
Table 2.
Q-sorts by their stakeholder group and their association with each perspective: In bold are factor loadings ≥ ±0.40 and p < 0.01.
Table 2.
Q-sorts by their stakeholder group and their association with each perspective: In bold are factor loadings ≥ ±0.40 and p < 0.01.
| Stakeholders | P1 | P2 | P3 | P4 | P5 |
|---|---|---|---|---|---|
| Perspective 1 (P1) | |||||
| Farmer | 0.78 | 0.05 | 0.28 | −0.18 | −0.22 |
| Government (Local) | 0.77 | 0.29 | 0.03 | −0.07 | 0.17 |
| Industry | 0.40 | 0.36 | 0.15 | 0.15 | 0.05 |
| Scientist | 0.63 | 0.27 | 0.32 | 0.15 | −0.03 |
| Scientist | 0.74 | 0.03 | 0.31 | −0.03 | −0.04 |
| Scientist | 0.61 | 0.24 | 0.27 | 0.20 | 0.02 |
| Perspective 2 (P2) | |||||
| Association | 0.34 | 0.62 | 0.30 | 0.17 | −0.07 |
| Association | −0.06 | 0.54 | 0.40 | −0.10 | −0.09 |
| Farmer | 0.06 | 0.63 | 0.29 | 0.05 | 0.08 |
| Government (Province) | 0.34 | 0.73 | −0.09 | 0.05 | 0.18 |
| Government (Province) | 0.05 | 0.50 | 0.14 | 0.19 | 0.30 |
| Government (Central) | 0.37 | 0.47 | 0.13 | 0.24 | −0.16 |
| Industry | 0.36 | 0.64 | 0.01 | −0.04 | −0.03 |
| NGO | 0.32 | 0.57 | 0.27 | 0.03 | 0.12 |
| Perspective 3 (P3) | |||||
| Industry | 0.20 | 0.34 | 0.49 | 0.29 | 0.16 |
| Farmer | 0.29 | 0.32 | 0.53 | 0.29 | 0.00 |
| Farmer | 0.34 | −0.02 | 0.55 | 0.23 | −0.08 |
| Farmer | 0.39 | 0.20 | 0.73 | 0.02 | 0.14 |
| Farmer | −0.05 | 0.14 | 0.62 | 0.10 | −0.12 |
| Middlemen | 0.28 | 0.26 | 0.69 | −0.35 | 0.22 |
| Perspective 4 (P4) | |||||
| Association | 0.25 | 0.29 | 0.30 | −0.74 | 0.02 |
| Supporting supplier | −0.13 | 0.14 | 0.30 | 0.71 | 0.01 |
| Supporting supplier | −0.21 | 0.25 | 0.13 | 0.57 | −0.10 |
| Perspective 5 (P5) | |||||
| NGO | 0.07 | 0.04 | 0.22 | 0.31 | 0.49 |
| Supporting supplier | 0.36 | 0.05 | 0.00 | −0.13 | 0.85 |
| Confounding Q-Sorts (More Than One Perspective) | |||||
| Association | −0.48 | 0.36 | −0.03 | −0.24 | 0.43 |
| Farmer | 0.16 | 0.42 | 0.25 | −0.25 | 0.42 |
| Government (Local) | 0.50 | 0.11 | 0.46 | −0.05 | 0.01 |
| Middlemen | 0.25 | 0.40 | 0.25 | −0.03 | −0.51 |
| NGO | 0.58 | 0.44 | 0.15 | 0.10 | 0.18 |
| Explained variance (%) | 16.38 | 14.53 | 12.16 | 7.42 | 6.7 |
| Total Defining Q-sorts | 6 | 8 | 6 | 3 | 2 |
| Total Q-sorts | 9 | 11 | 7 | 3 | 5 |
Table 3.
Q-sample statements and normalized factor scores for each perspective: Bold numbers indicate the agreement scores (3 and 4) and the disagreement scores (−3 and −4).
Table 3.
Q-sample statements and normalized factor scores for each perspective: Bold numbers indicate the agreement scores (3 and 4) and the disagreement scores (−3 and −4).
| No | Statements | P1 | P2 | P3 | P4 | P5 |
|---|---|---|---|---|---|---|
| Sustainability | ||||||
| 1 | Farming practices in Indonesia currently have not yet led to sustainability | −1 * | 1 | 2 | 2 | 3 |
| 2 | Eco-certification is believed to support sustainable development | 4 | 0 | 2 | −2 | 2 |
| 3 | Eco-certification is believed to improve resource management | 2 | 1 | −1 | 2 | −2 |
| 4 | Eco-certification is believed to improve food safety and protect aquatic ecosystem surrounding the farms | 4 | 3 | 4 | −4 | 0 |
| 5 | The eco-certification program also incorporates communities around the farms | 3 | 0 | 2 | 2 | 1 |
| 6 | There is a strong correlation between eco-certification and improvements in shrimp production in Indonesia | 1 | −2 | 1 | 2 | −1 |
| 7 | Any significant impacts of the eco-certification program require time in the context of sustainability | −2 | 0 * | 3 | −3 | 2 |
| Priorities | ||||||
| 8 | Indonesia is not important for implementing eco-certification despite being one of the world’s top shrimp producers | −4 | −4 | −3 | −1 | −2 |
| 9 | Only the eco-certification program can enhance environmental and social performance | −2 | −2 | 3 | 2 | −3 |
| 10 | Other tools supporting sustainability are more suitable than eco-certification, e.g., by applying Best Management Practices (BMP) | −3 | 0 | 0 | −4 | 1 |
| 11 | Eco-certification is more important than improving farm-supporting facilities, such as roads and electricity | −1 | −4 | −4 | 1 | −3 |
| 12 | Eco-certification is more important than disseminating technology to increase farming productivity | −2 | 0 | −2 | −1 | −3 |
| 13 | Research on how eco-certification impacts shrimp aquaculture industry should be prioritized | 1 | 2 | 1 | 0 | 1 |
| Main motives | ||||||
| 14 | Farmers in Indonesia are willing to participate in eco-certification if there is a proper economic incentive | 1 | 4 | −2 | 1 | 0 |
| 15 | Business-to-business (B2B) is currently industry’s main objective in conducting particular eco-certification schemes | −1 | 1 * | −1 | 4 | 4 |
| 16 | Industries and farmers have experienced premium prices due to compliance with eco-certification | 0 | −1 | −2 | 0 | −4 * |
| 17 | Farmers and industries want to benefit from eco-certification in the near future | −2 | −1 | −1 | −2 | 0 |
| 18 | Obtaining eco-certification is only for completing administrative data and business legality | −3 | −3 | −1 | −3 | 0 |
| Market access | ||||||
| 19 | Demand for certified shrimp is increasing globally and is believed to continue to increase | 2 | 2 | 1 | 0 | 3 |
| 20 | Market differentiation for certified products offers opportunities for Indonesia to enter in certain markets | −1 | 4 | 2 | 1 | −4 |
| 21 | In the future, eco-certification will become an important requirement to compete in the global market | 4 | 3 | 4 | −2 | 0 |
| 22 | Eco-certification can improve the bargaining position of industries and exporters in the global market | 2 | 3 | 0 | −2 | −4 |
| Positive and negative implications | ||||||
| 23 | Eco-certification opens greater opportunities to obtain investment funds for industry and farmers | 0 | −2 | 2 * | 0 | −1 |
| 24 | The existence of eco-certification can create more job opportunities | 0 | −1 | 1 | 1 | −2 |
| 25 | Eco-certification has widened the competition gap between large- and small-scale farmers | −3 | −2 | −3 | −1 | −2 |
| 26 | Certified farmers and industries will receive less conflict for the development and expansion of businesses | 0 | 0 | 0 | 1 | 1 |
| 27 | Eco-certification can integrate stakeholder collaborations in the shrimp value chain | 2 | 1 | 0 | 1 | −3 * |
| 28 | Eco-certification prevents export as a non-tariff barrier | −3 | −2 | −2 | −3 | −2 |
| 29 | Credibility of eco-certification was confirmed by the involvement of accredited third parties, measurable standards, traceability, and periodic monitoring | 3 | −1 | 2 | −4 | 1 |
| 30 | Stakeholders are confused by too many certification schemes | −1 | 0 | −1 | 0 | 4 * |
| 31 | Certified farms show significantly more environmentally friendly practices than non-certified farms | 3 * | 0 | 1 | 0 | 1 |
| 32 | Certified shrimp guarantee that sustainable practices are consistently applied along the supply chain | 2 | 2 | 3 | 3 | 2 |
| Obstacles in Indonesia | ||||||
| 33 | The main impediment in conducting eco-certification in Indonesia is a limitation of funds | −2 | −1 | −3 | −3 | 2 * |
| 34 | Eco-certification standards are easily complied with and understood by stakeholders | 1 | −1 | 0 | −2 | −1 |
| 35 | Difficulties exist in meeting eco-certification standards because there are insufficient data and poor facilities | 0 | 1 | 3 | −1 | 4 |
| 36 | Barrier to distribute information about eco-certification is due to limitations in communication technology facilities | 0 | −2 * | 0 | 0 | 0 |
| 37 | One of the impediments in the eco-certification process is the complexity of bureaucracy | −4 | 4 * | −2 | −1 | −2 |
| 38 | Farm monitoring as an eco-certification audit is lacking and is sometimes only a formality | 0 | 1 | 1 | 0 | 2 |
| Stakeholder integration | ||||||
| 39 | All stakeholders receive certain benefits from eco-certification program in various ways | 3 | 2 | 0 | 4 * | −1 |
| 40 | Communication forum among stakeholders in the shrimp supply chain has been adequate | −2 | −3 | −1 | 3 * | −1 |
| 41 | Extensive social involvement followed by a good understanding of producers enhance the effectiveness of eco-certification | 0 | 3 | 1 | −1 | 3 |
| 42 | The government has facilitated farmers to be able to conduct sustainable farming practices | 1 | −1 | −2 | 3 * | 0 |
| 43 | Only small-scale farmers should receive support from governments to be able to participate in the eco-certification program | 0 | 2 | 0 | 2 | 0 |
| 44 | Collaboration between associations and government is a milestone of eco-certification to increase productivity | 2 | 2 | 4 | 3 | 0 * |
| 45 | Eco-certification does not require national, provincial, and local governments to collaborate with producers | −4 | −4 | −4 | −1 | 1 |
| 46 | Government regulations at national, province, and local levels currently support the implementation of eco-certification | 1 | 0 | 0 | 1 | −1 |
| 47 | The implementation of eco-certification remains effective, even though it is not supported by a central government authority | −1 | −3 | −3 | 4 | 1 |
| 48 | E-NGOs have an important role in promoting eco-certification and guiding farmers to meet the standards | 1 | 1 | −1 | 0 | 3 |
| 49 | Processing industries or exporters do not have a strong influence on suppliers to carry out eco-certification | −1 | −3 | −4 | −2 | 0 |
* distinguish statements for each perspective
Publisher’s Note: MDPI stays neutral with regard to jurisdictional claims in published maps and institutional affiliations. |
© 2020 by the authors. Licensee MDPI, Basel, Switzerland. This article is an open access article distributed under the terms and conditions of the Creative Commons Attribution (CC BY) license (http://creativecommons.org/licenses/by/4.0/).
Share and Cite
MDPI and ACS Style
Azizah, F.F.N.; Ishihara, H.; Zabala, A.; Sakai, Y.; Suantika, G.; Yagi, N. Diverse Perceptions on Eco-Certification for Shrimp Aquaculture in Indonesia. Sustainability 2020, 12, 9387. https://0-doi-org.brum.beds.ac.uk/10.3390/su12229387
AMA Style
Azizah FFN, Ishihara H, Zabala A, Sakai Y, Suantika G, Yagi N. Diverse Perceptions on Eco-Certification for Shrimp Aquaculture in Indonesia. Sustainability. 2020; 12(22):9387. https://0-doi-org.brum.beds.ac.uk/10.3390/su12229387
Chicago/Turabian StyleAzizah, Fahma Fiqhiyyah Nur, Hiroe Ishihara, Aiora Zabala, Yutaro Sakai, Gede Suantika, and Nobuyuki Yagi. 2020. "Diverse Perceptions on Eco-Certification for Shrimp Aquaculture in Indonesia" Sustainability 12, no. 22: 9387. https://0-doi-org.brum.beds.ac.uk/10.3390/su12229387
Note that from the first issue of 2016, this journal uses article numbers instead of page numbers. See further details here.