A Critical Review of Sensors for the Continuous Monitoring of Smart and Sustainable Railway Infrastructures

 , ,
, , 
Abstract
:1. Introduction
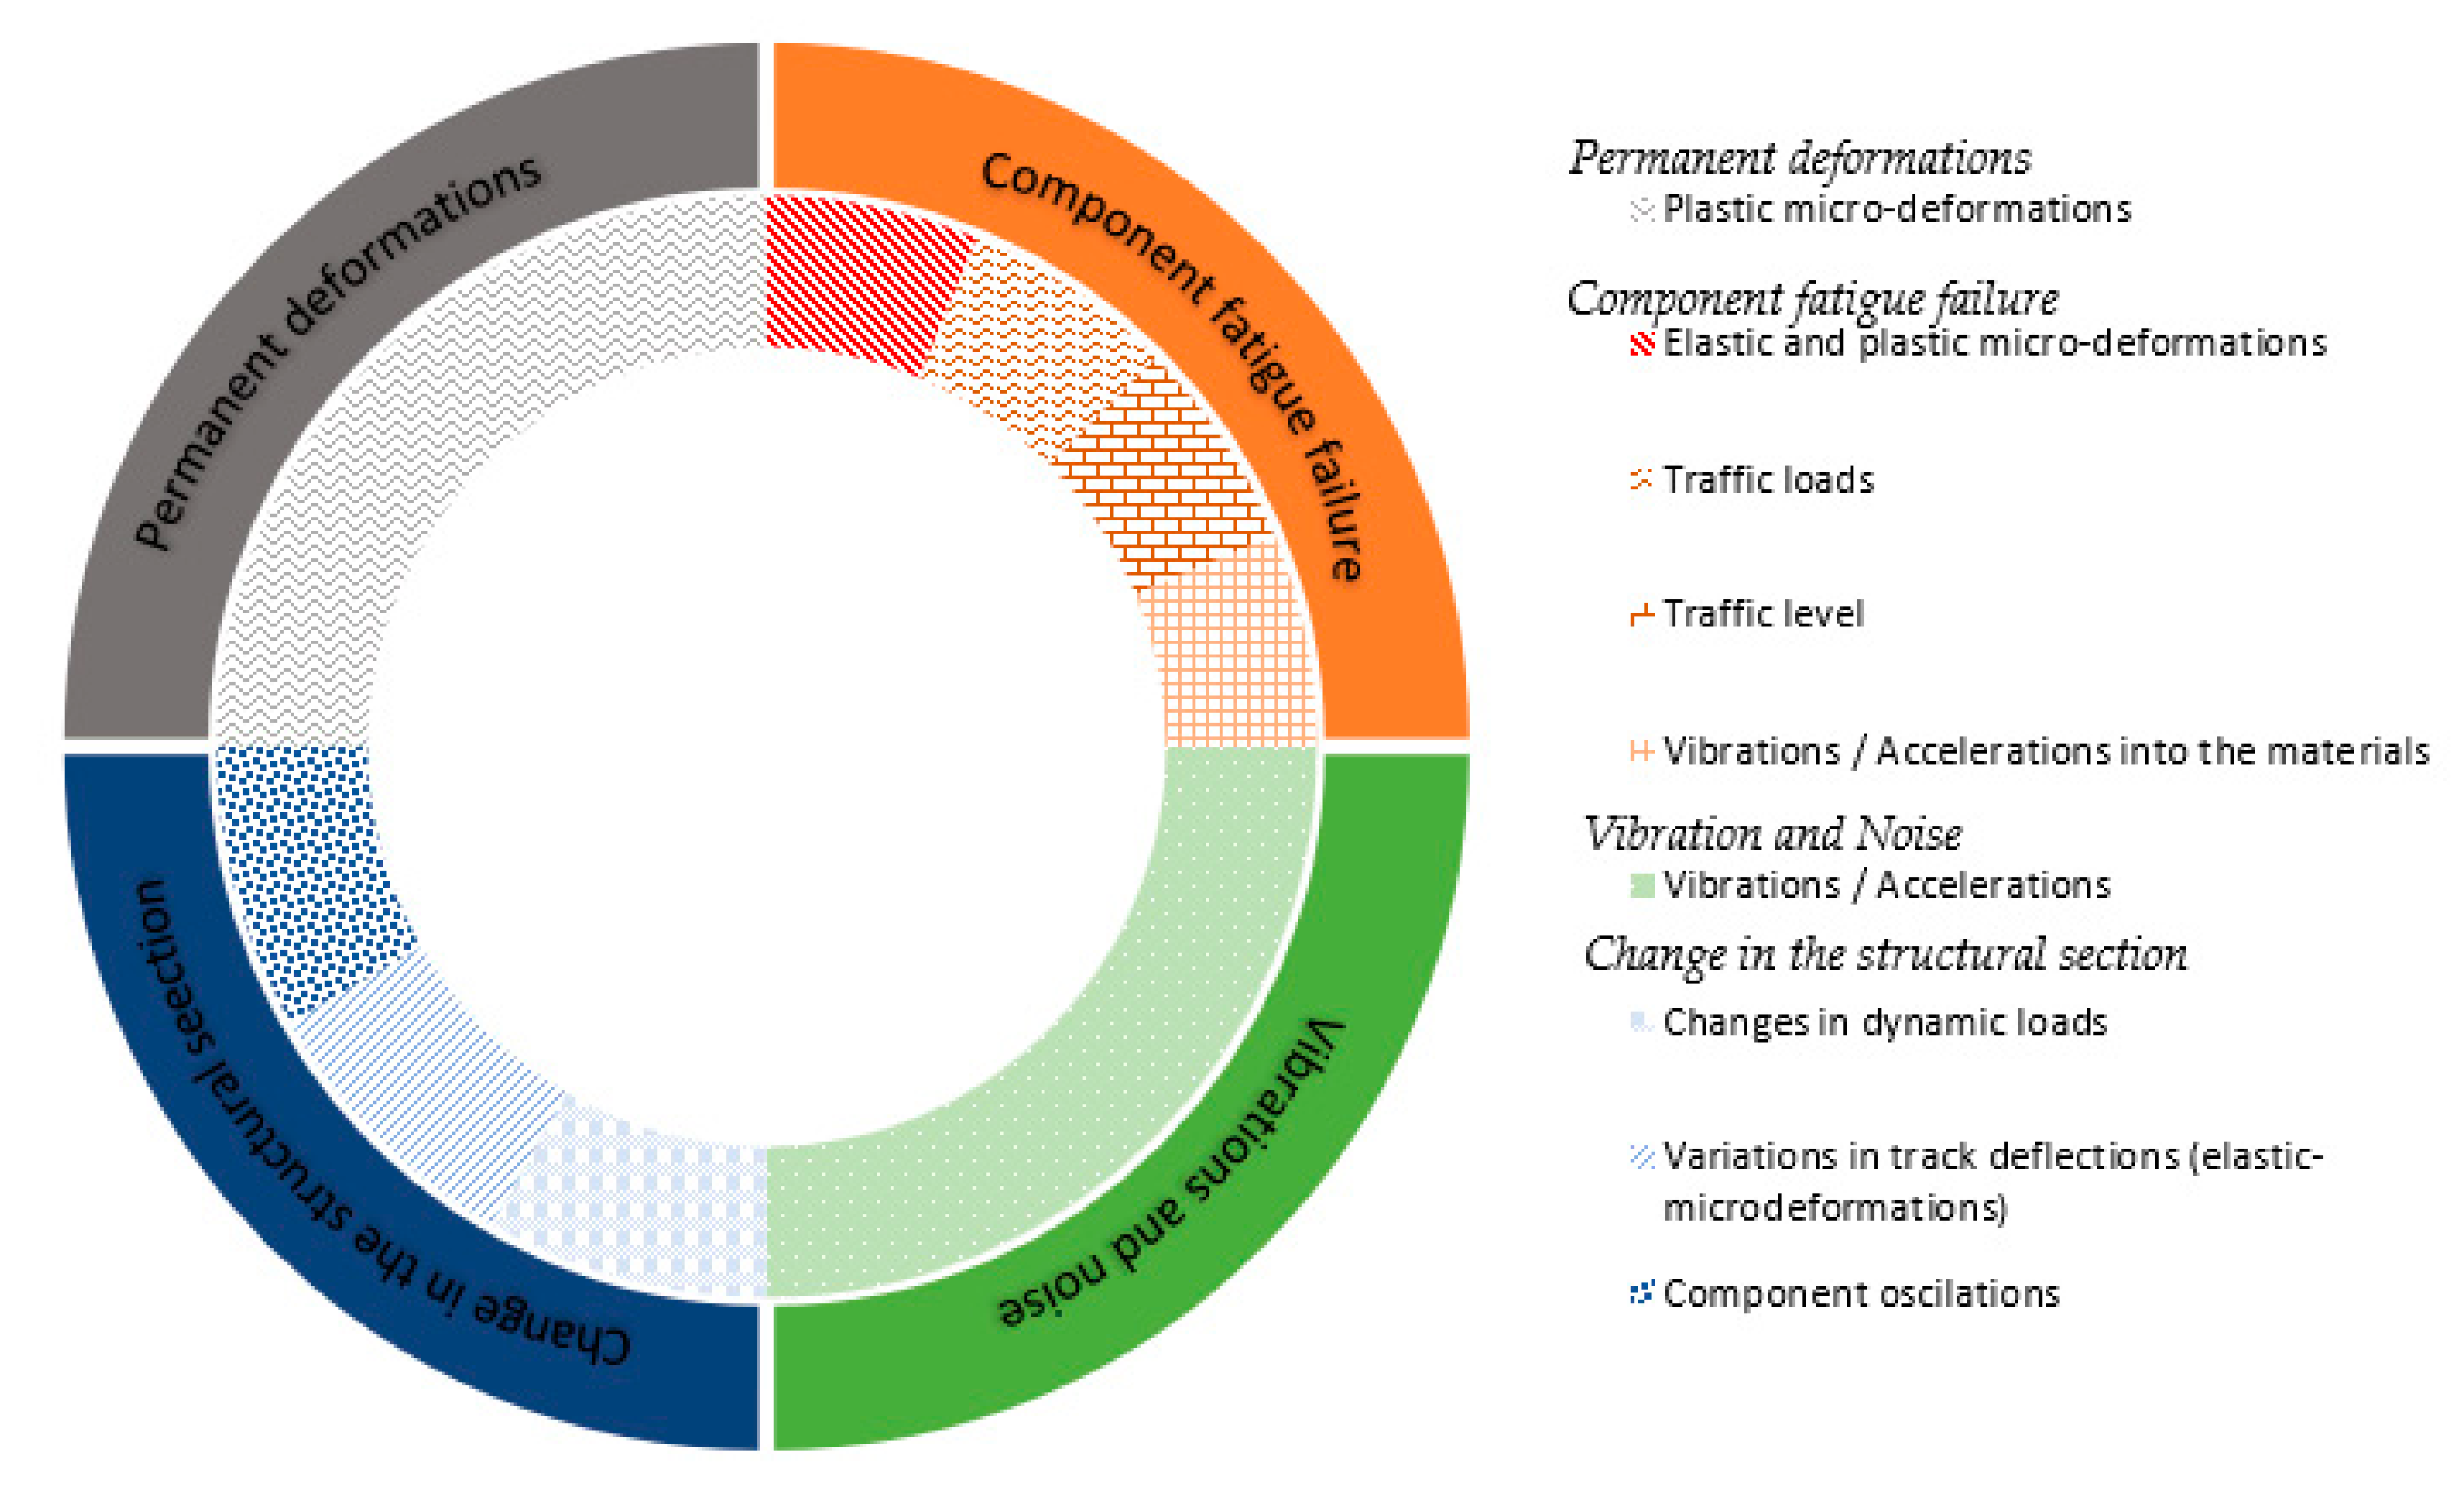
2. The Main Modes of Track Failure and Their Traditional Monitoring
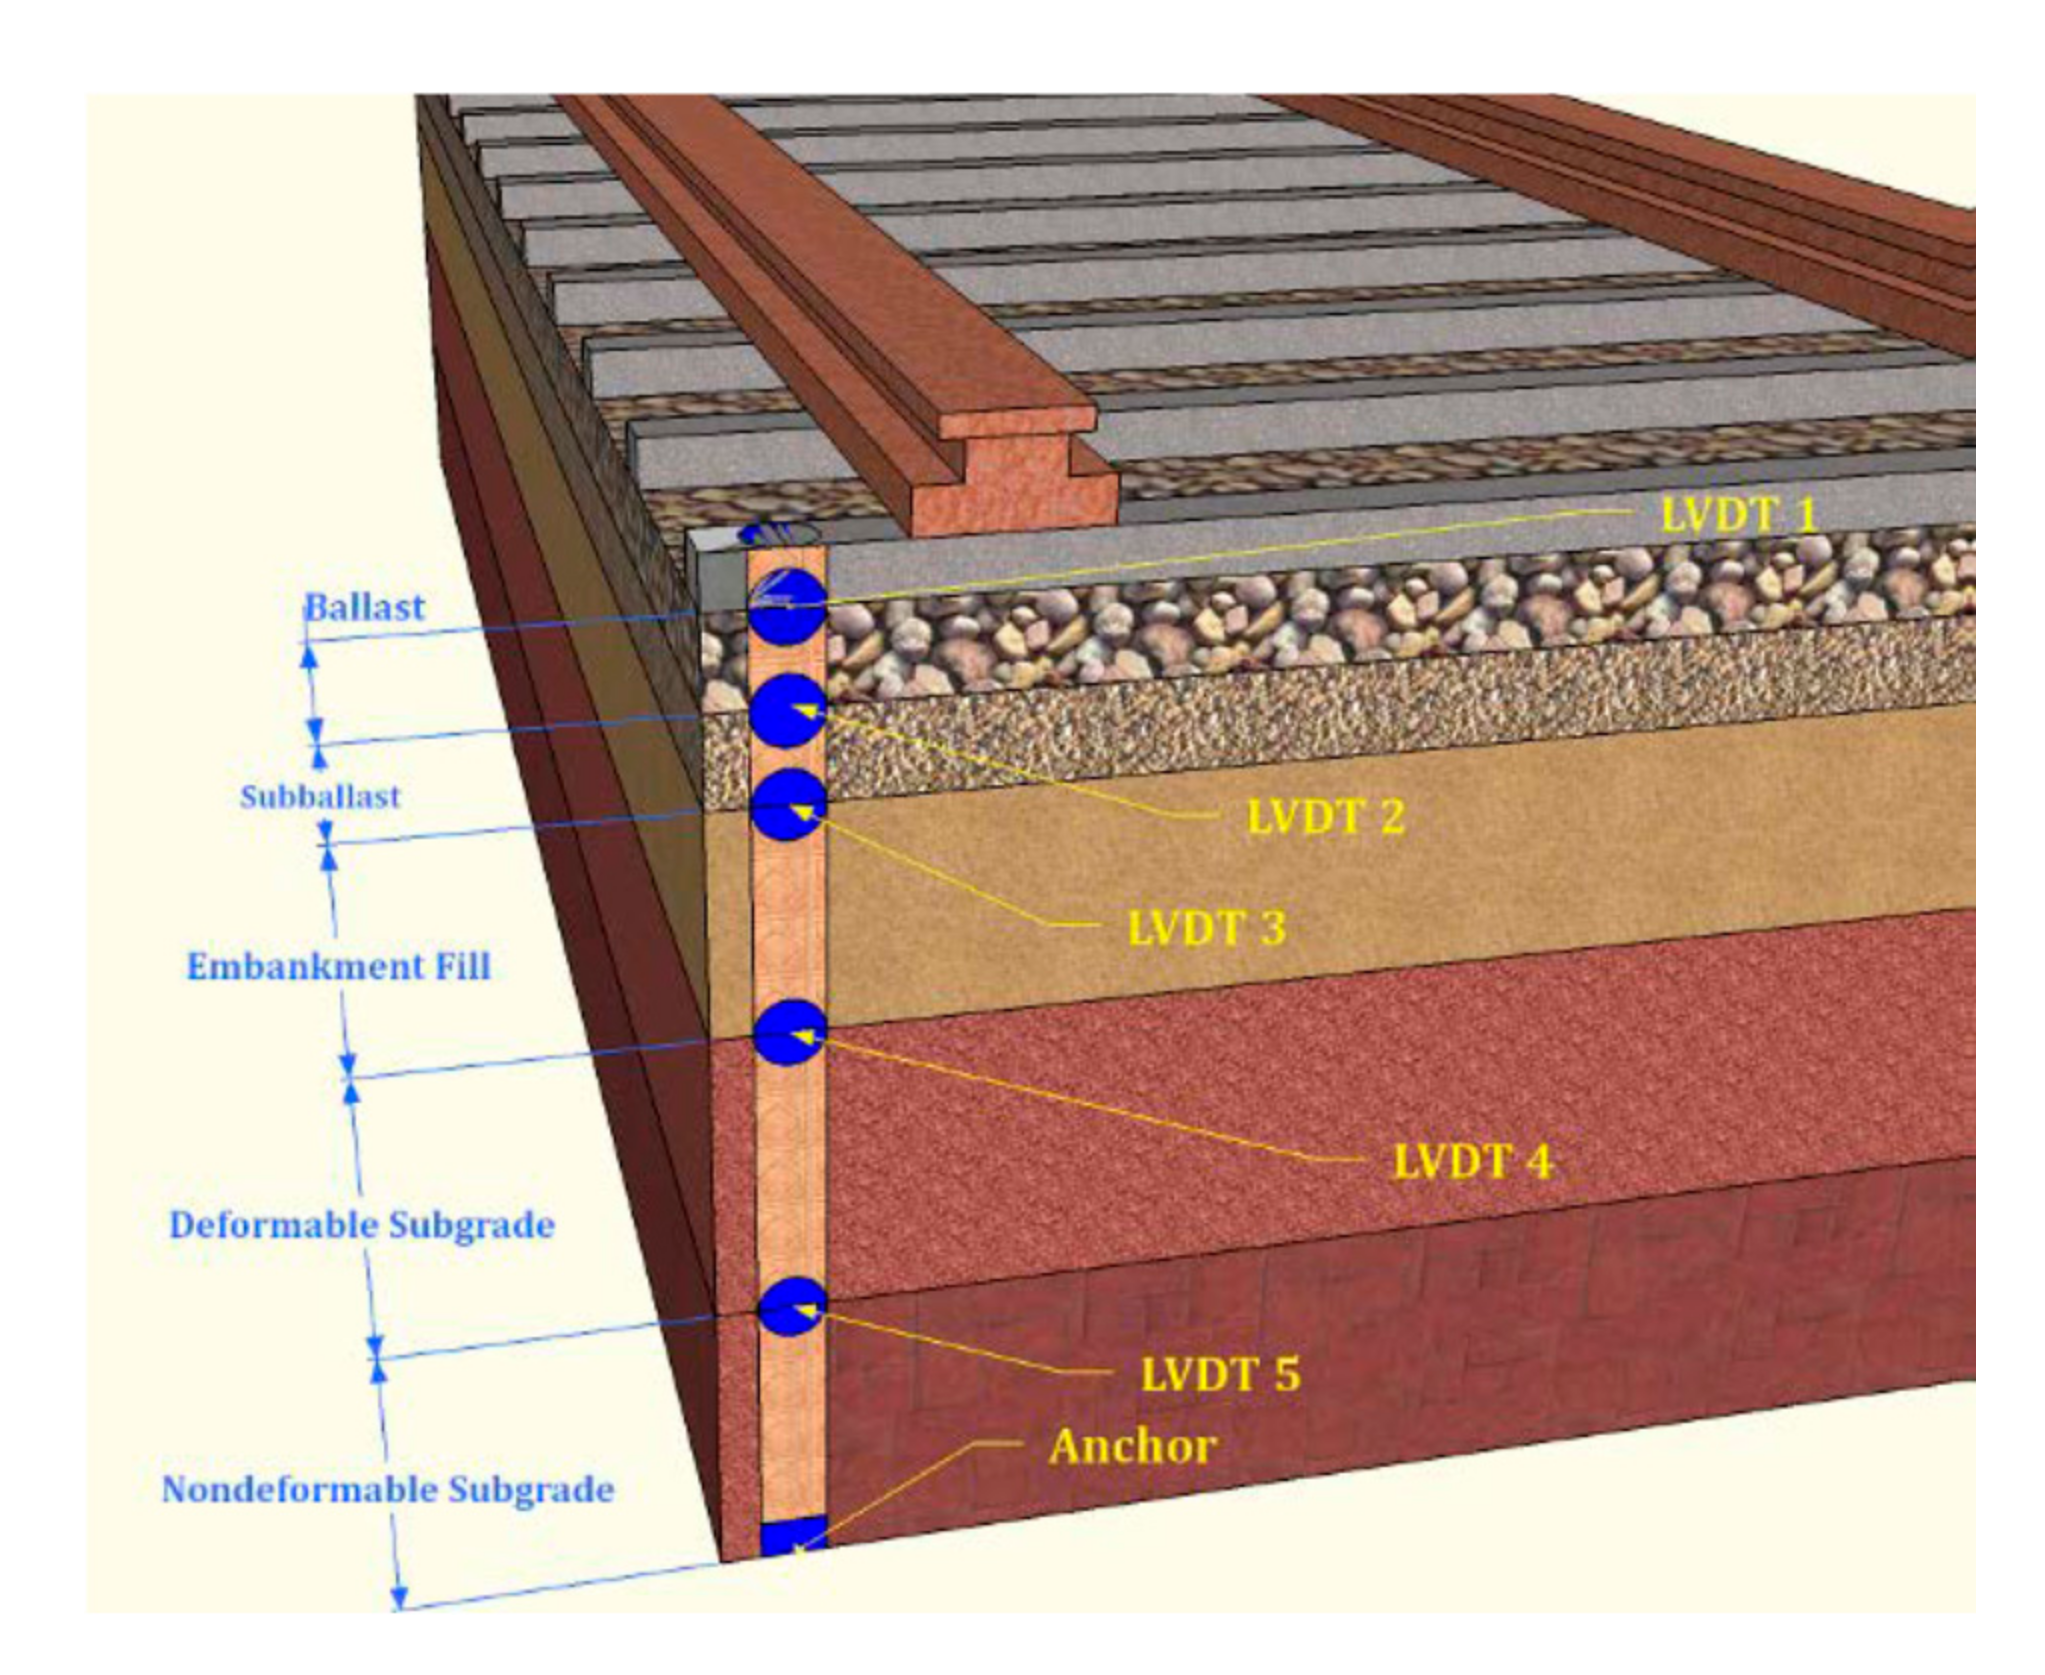
2.1. Permanent Deformation and Rail Track Settlement
2.2. Component Fatigue Failure
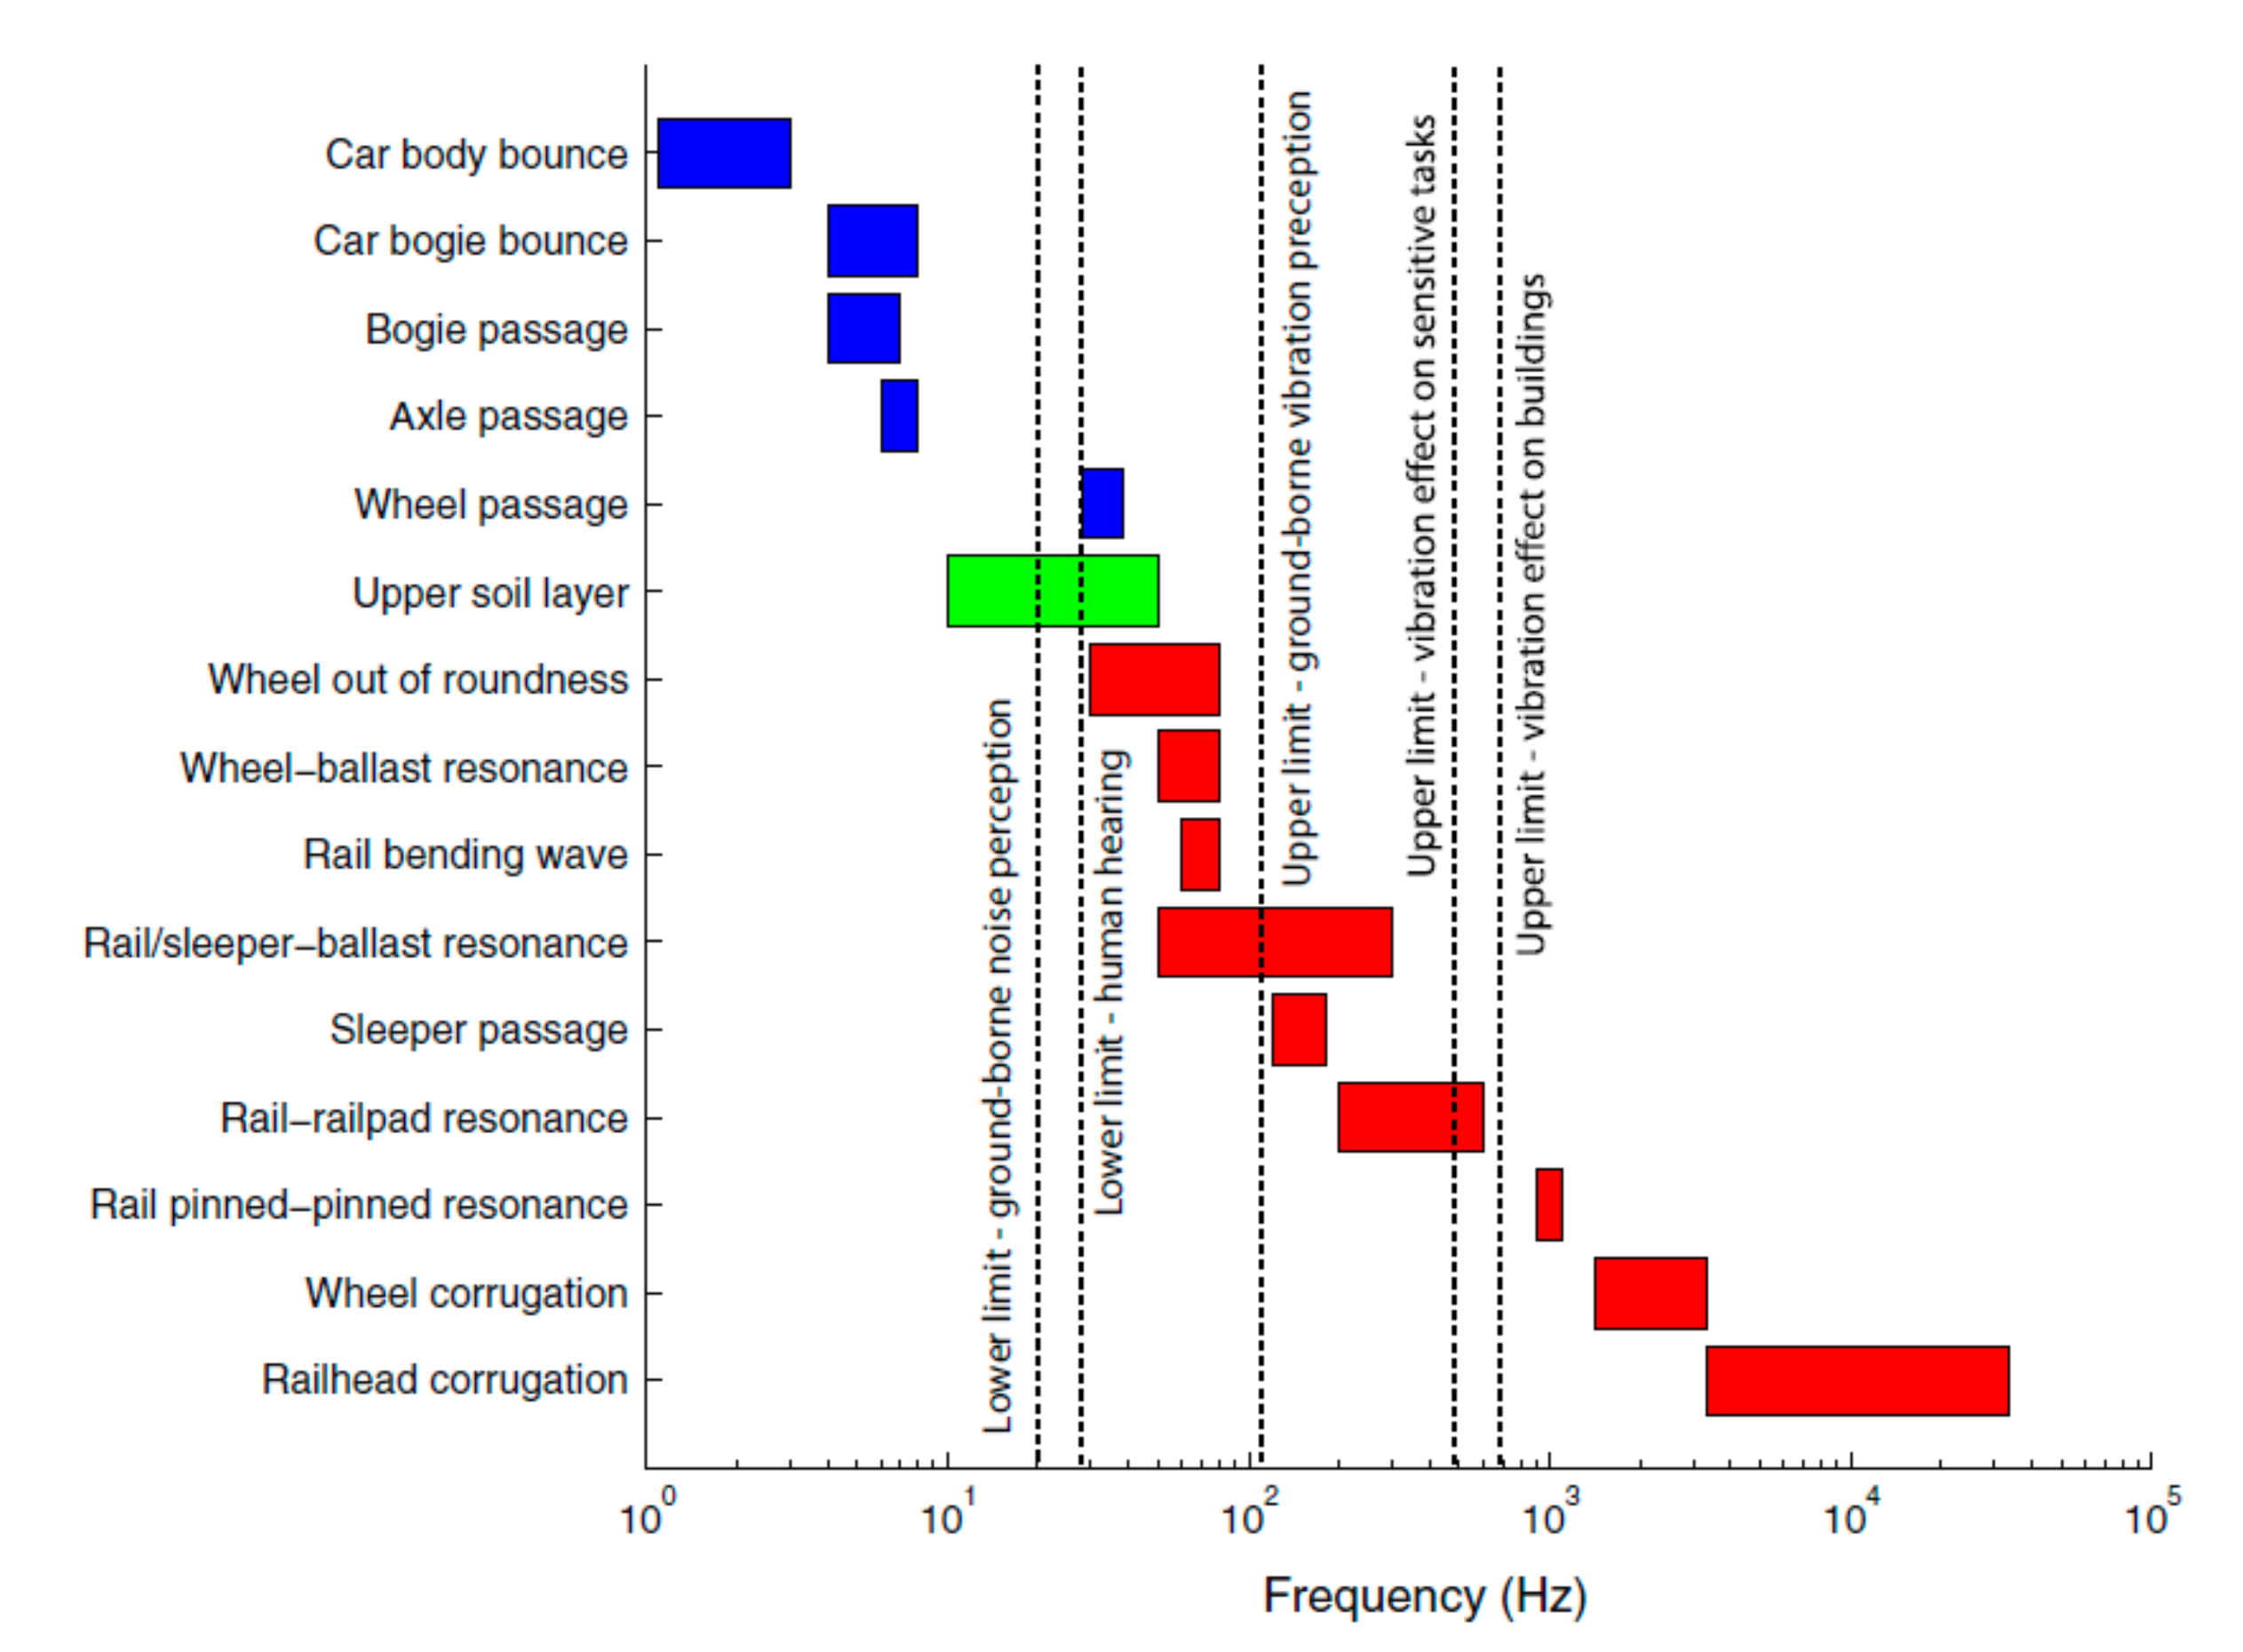
2.3. Vibration and Noise
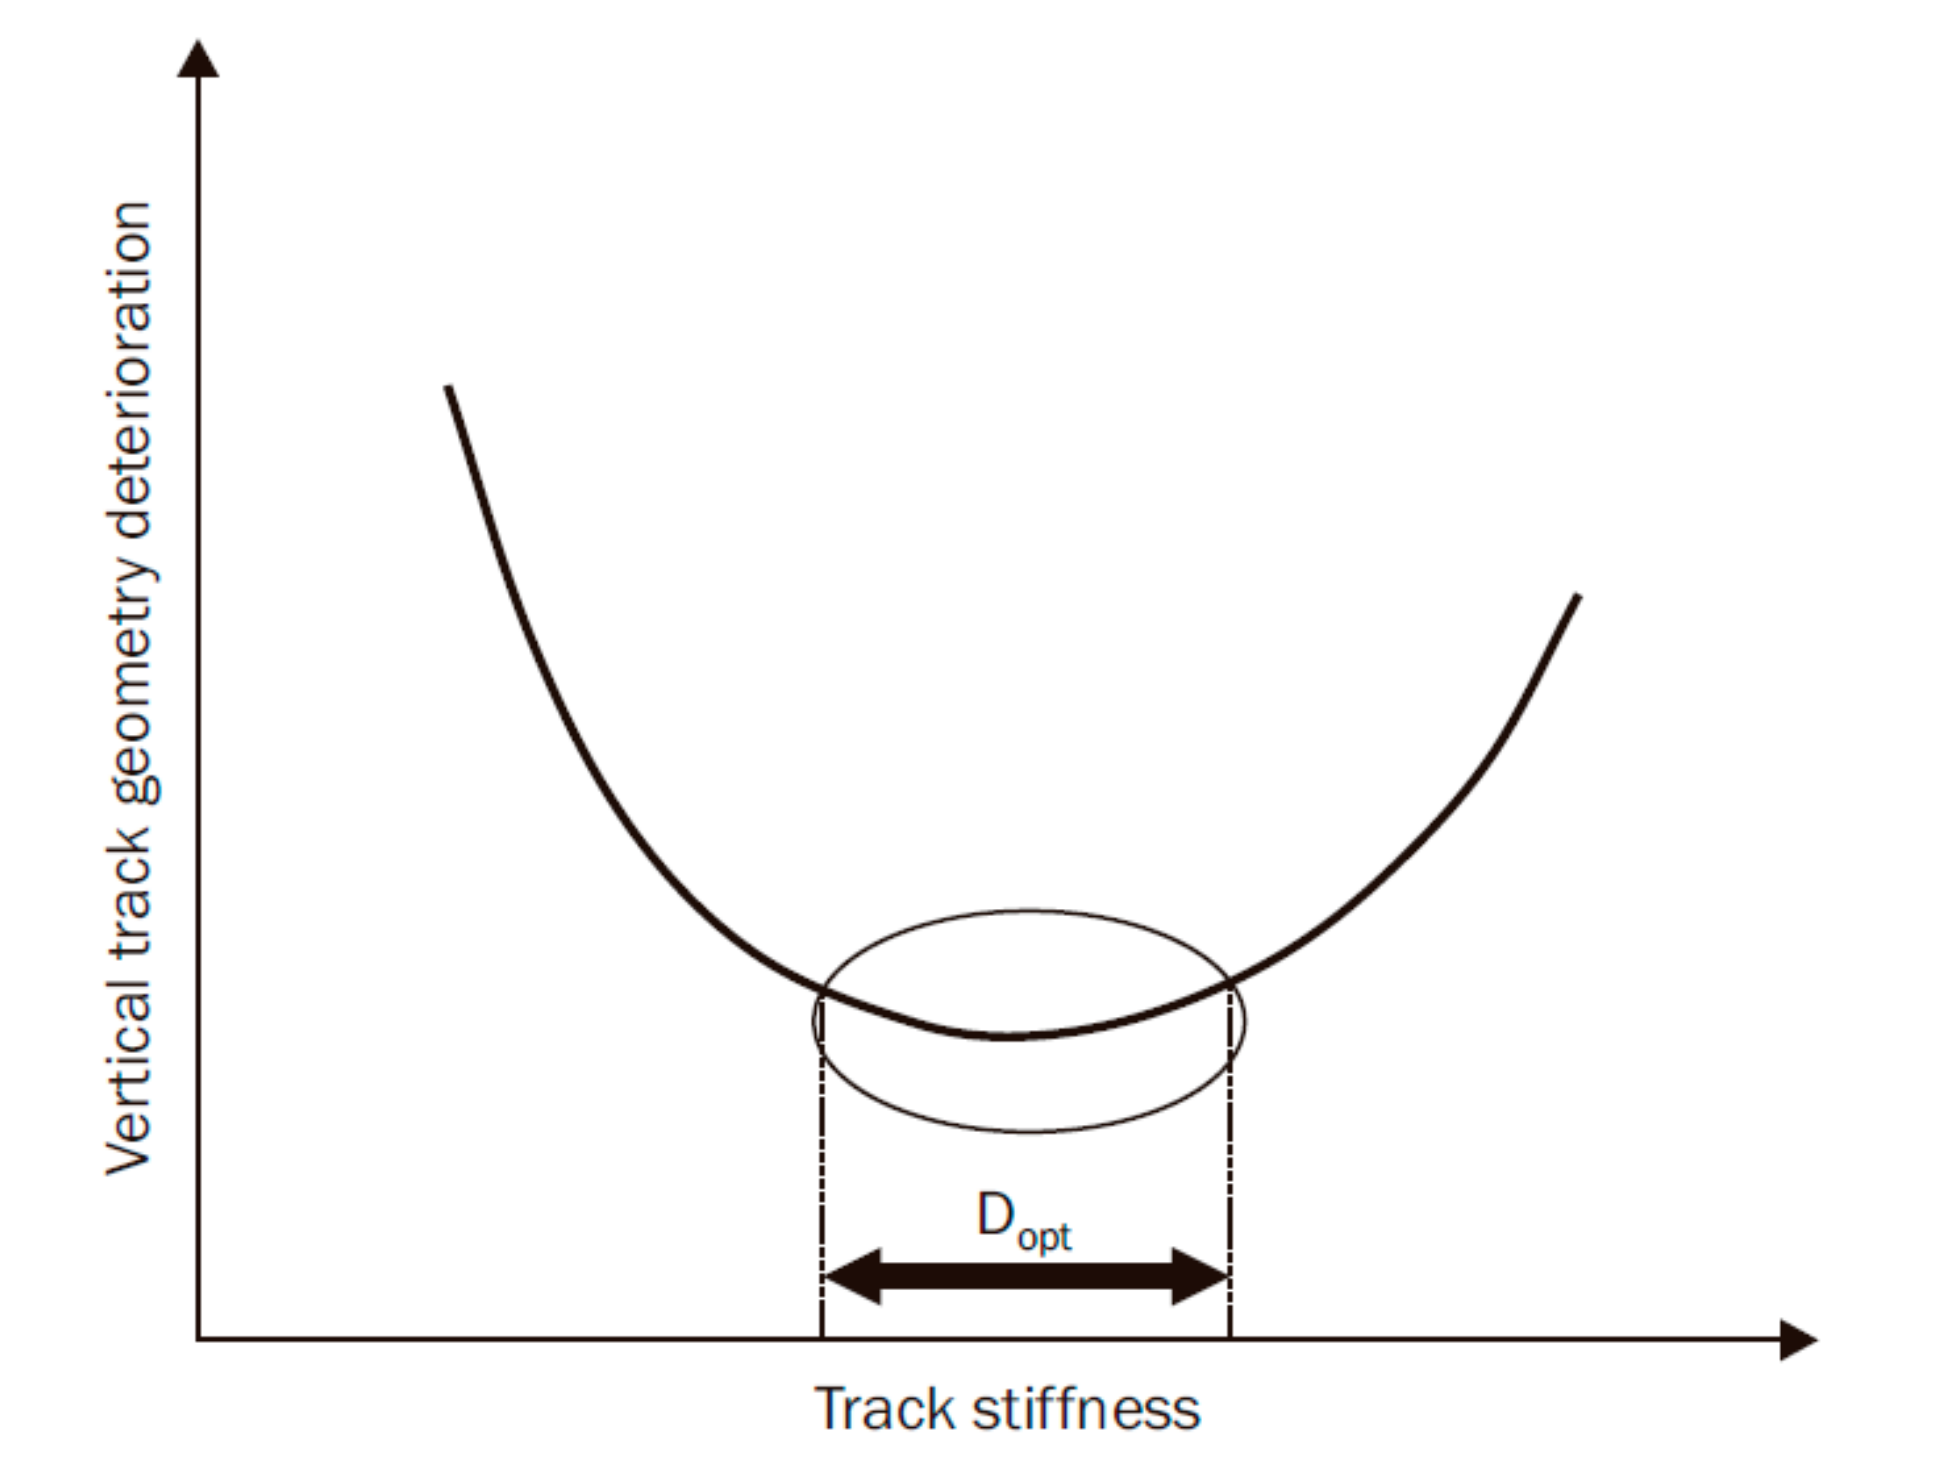
2.4. Change in the Structural Section Influence of Stiffness
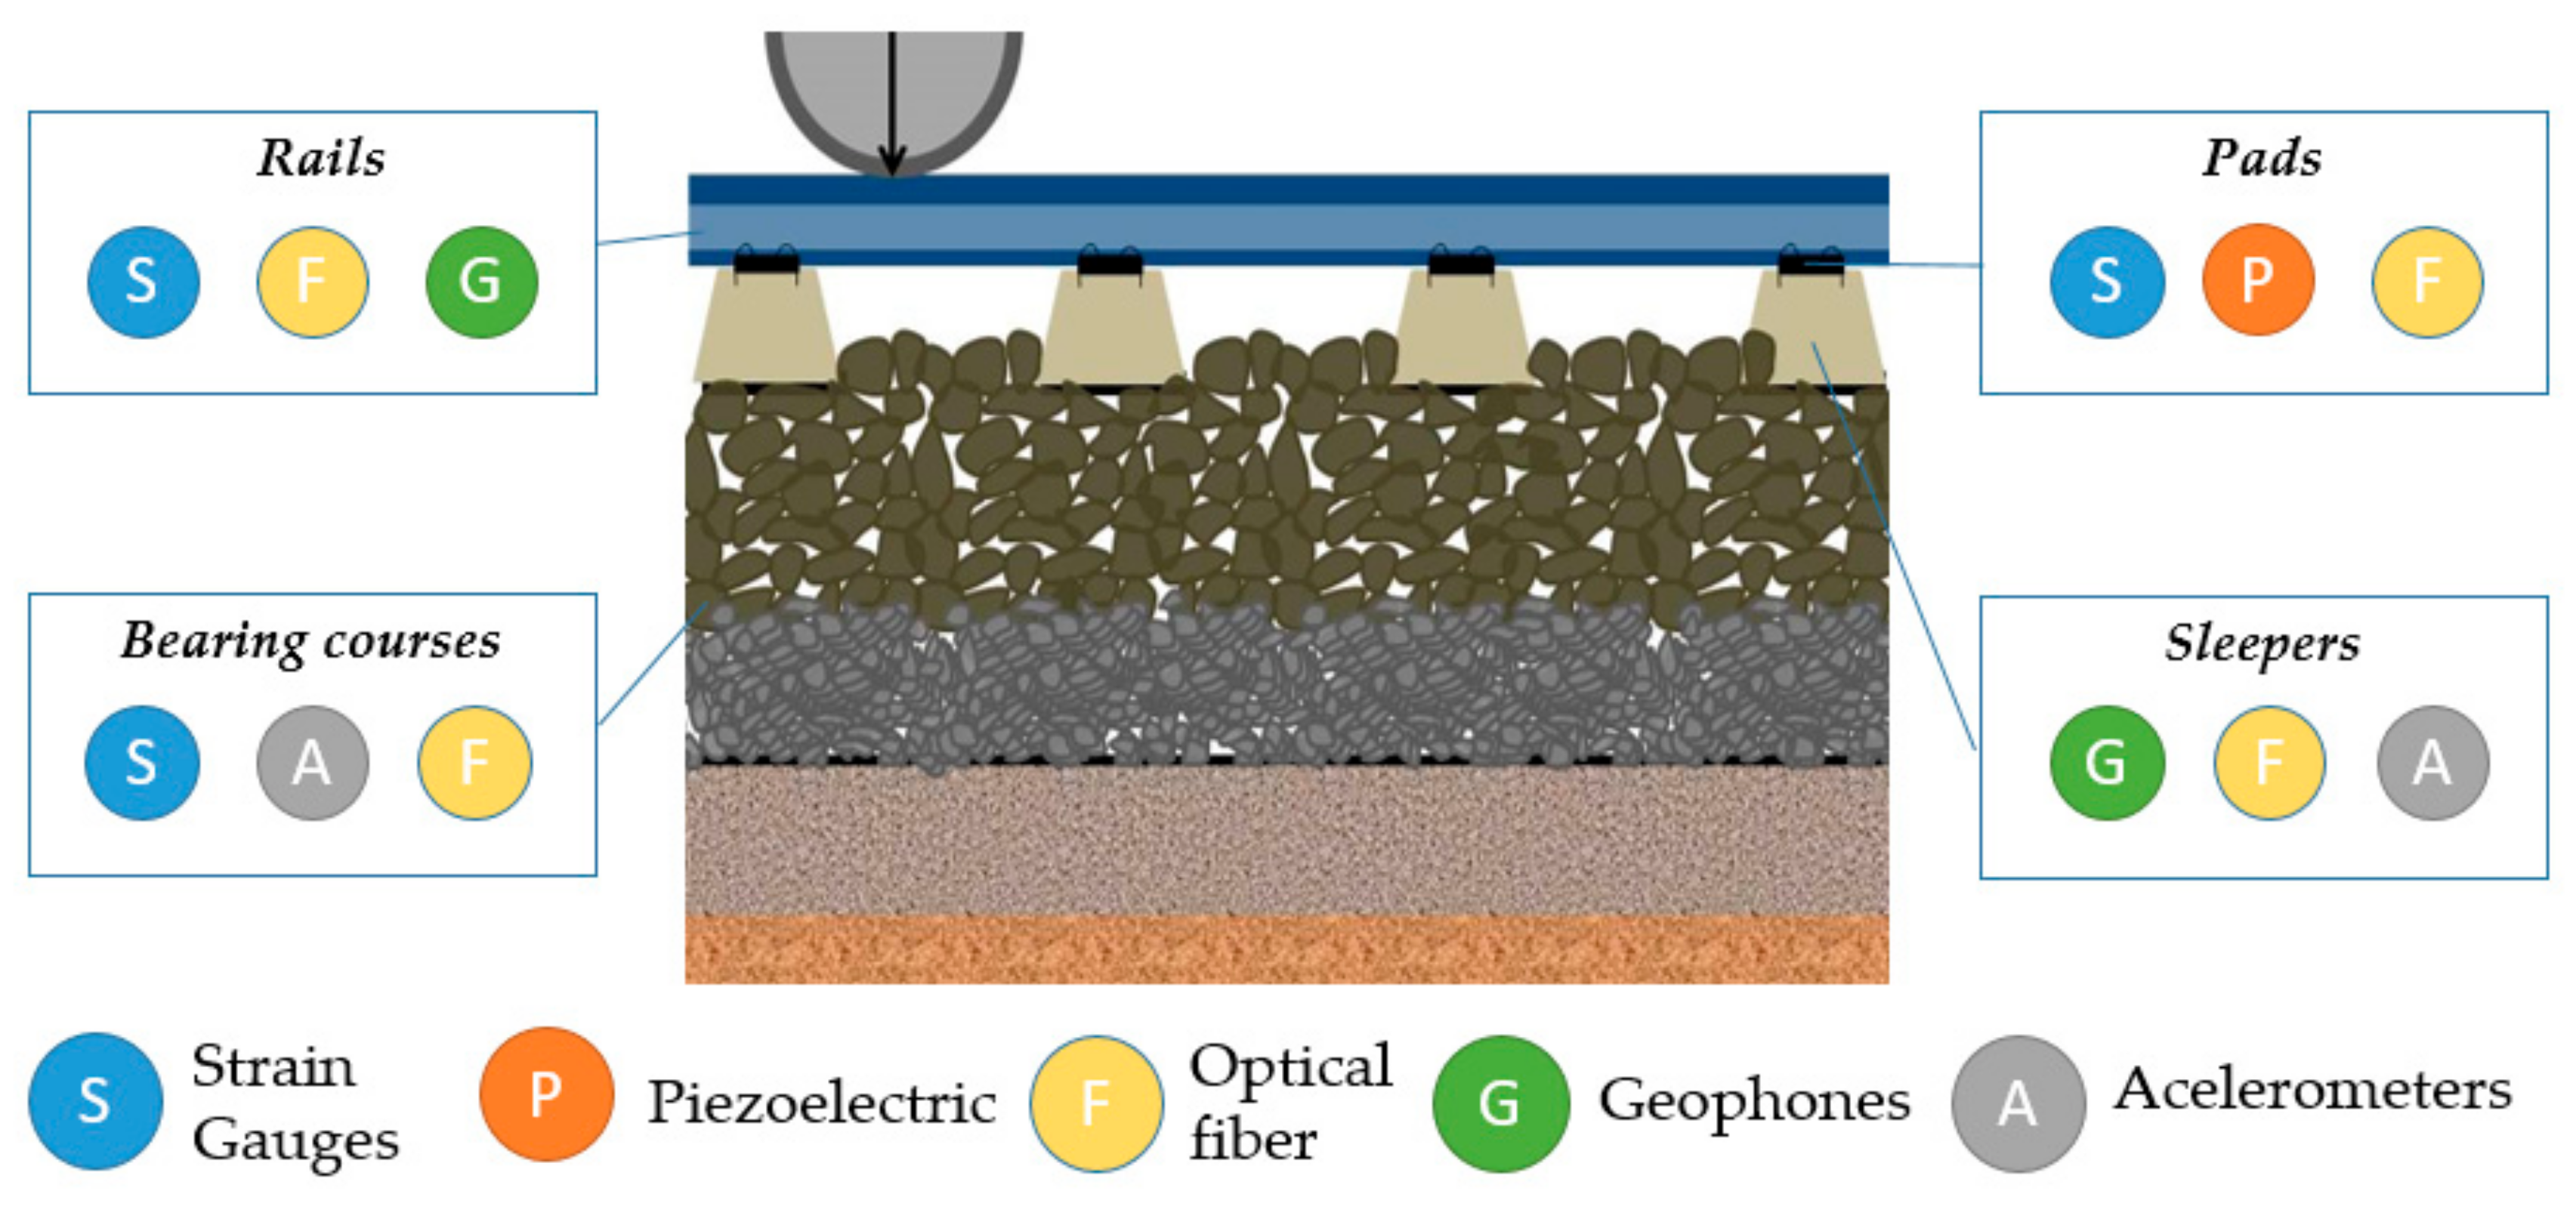
3. Monitoring Elements
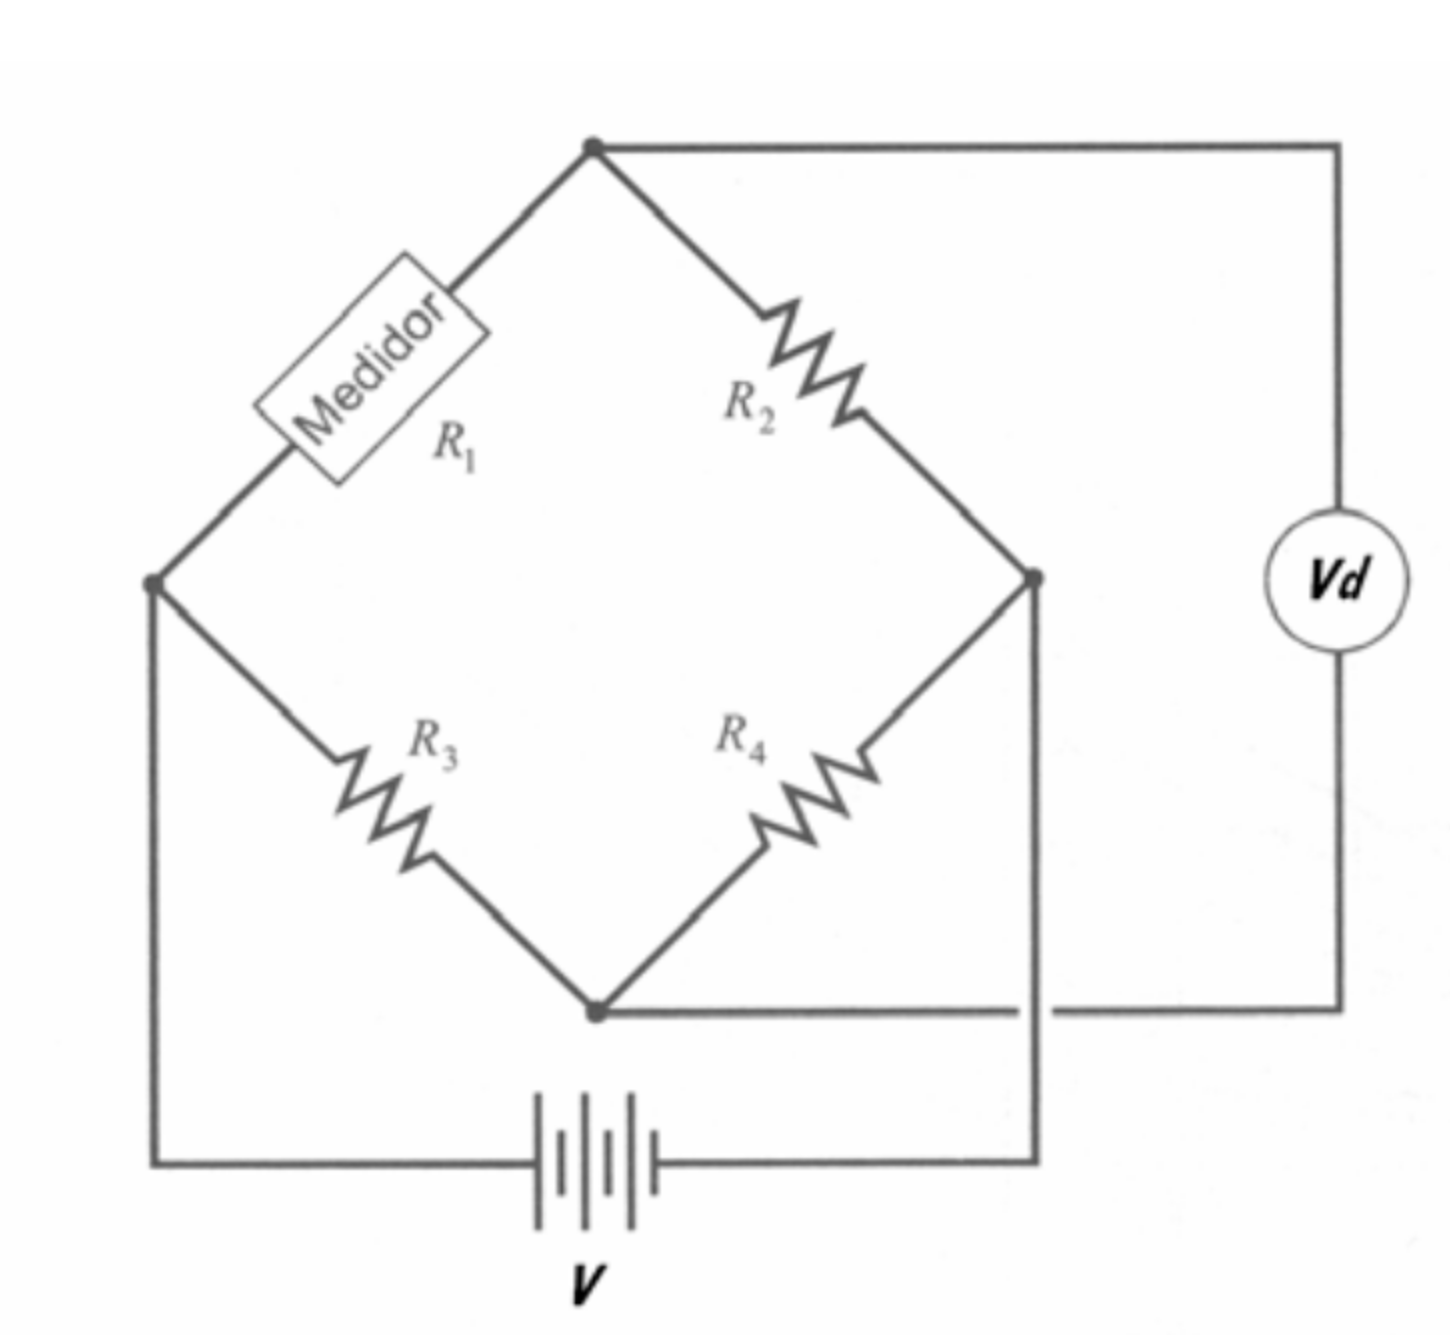
3.1. Strain Gauges
3.1.1. Main Characteristics
3.1.2. Case Studies
3.2. Piezoelectric Sensors
3.2.1. Main Characteristics
3.2.2. Case Studies
3.3. Fiber-Optic Sensor
3.3.1. Main Characteristics
3.3.2. Case Studies
3.4. Geophone
3.4.1. Main Characteristics
3.4.2. Case Studies
3.5. Accelerometer
3.5.1. Main Characteristics
3.5.2. Case Studies
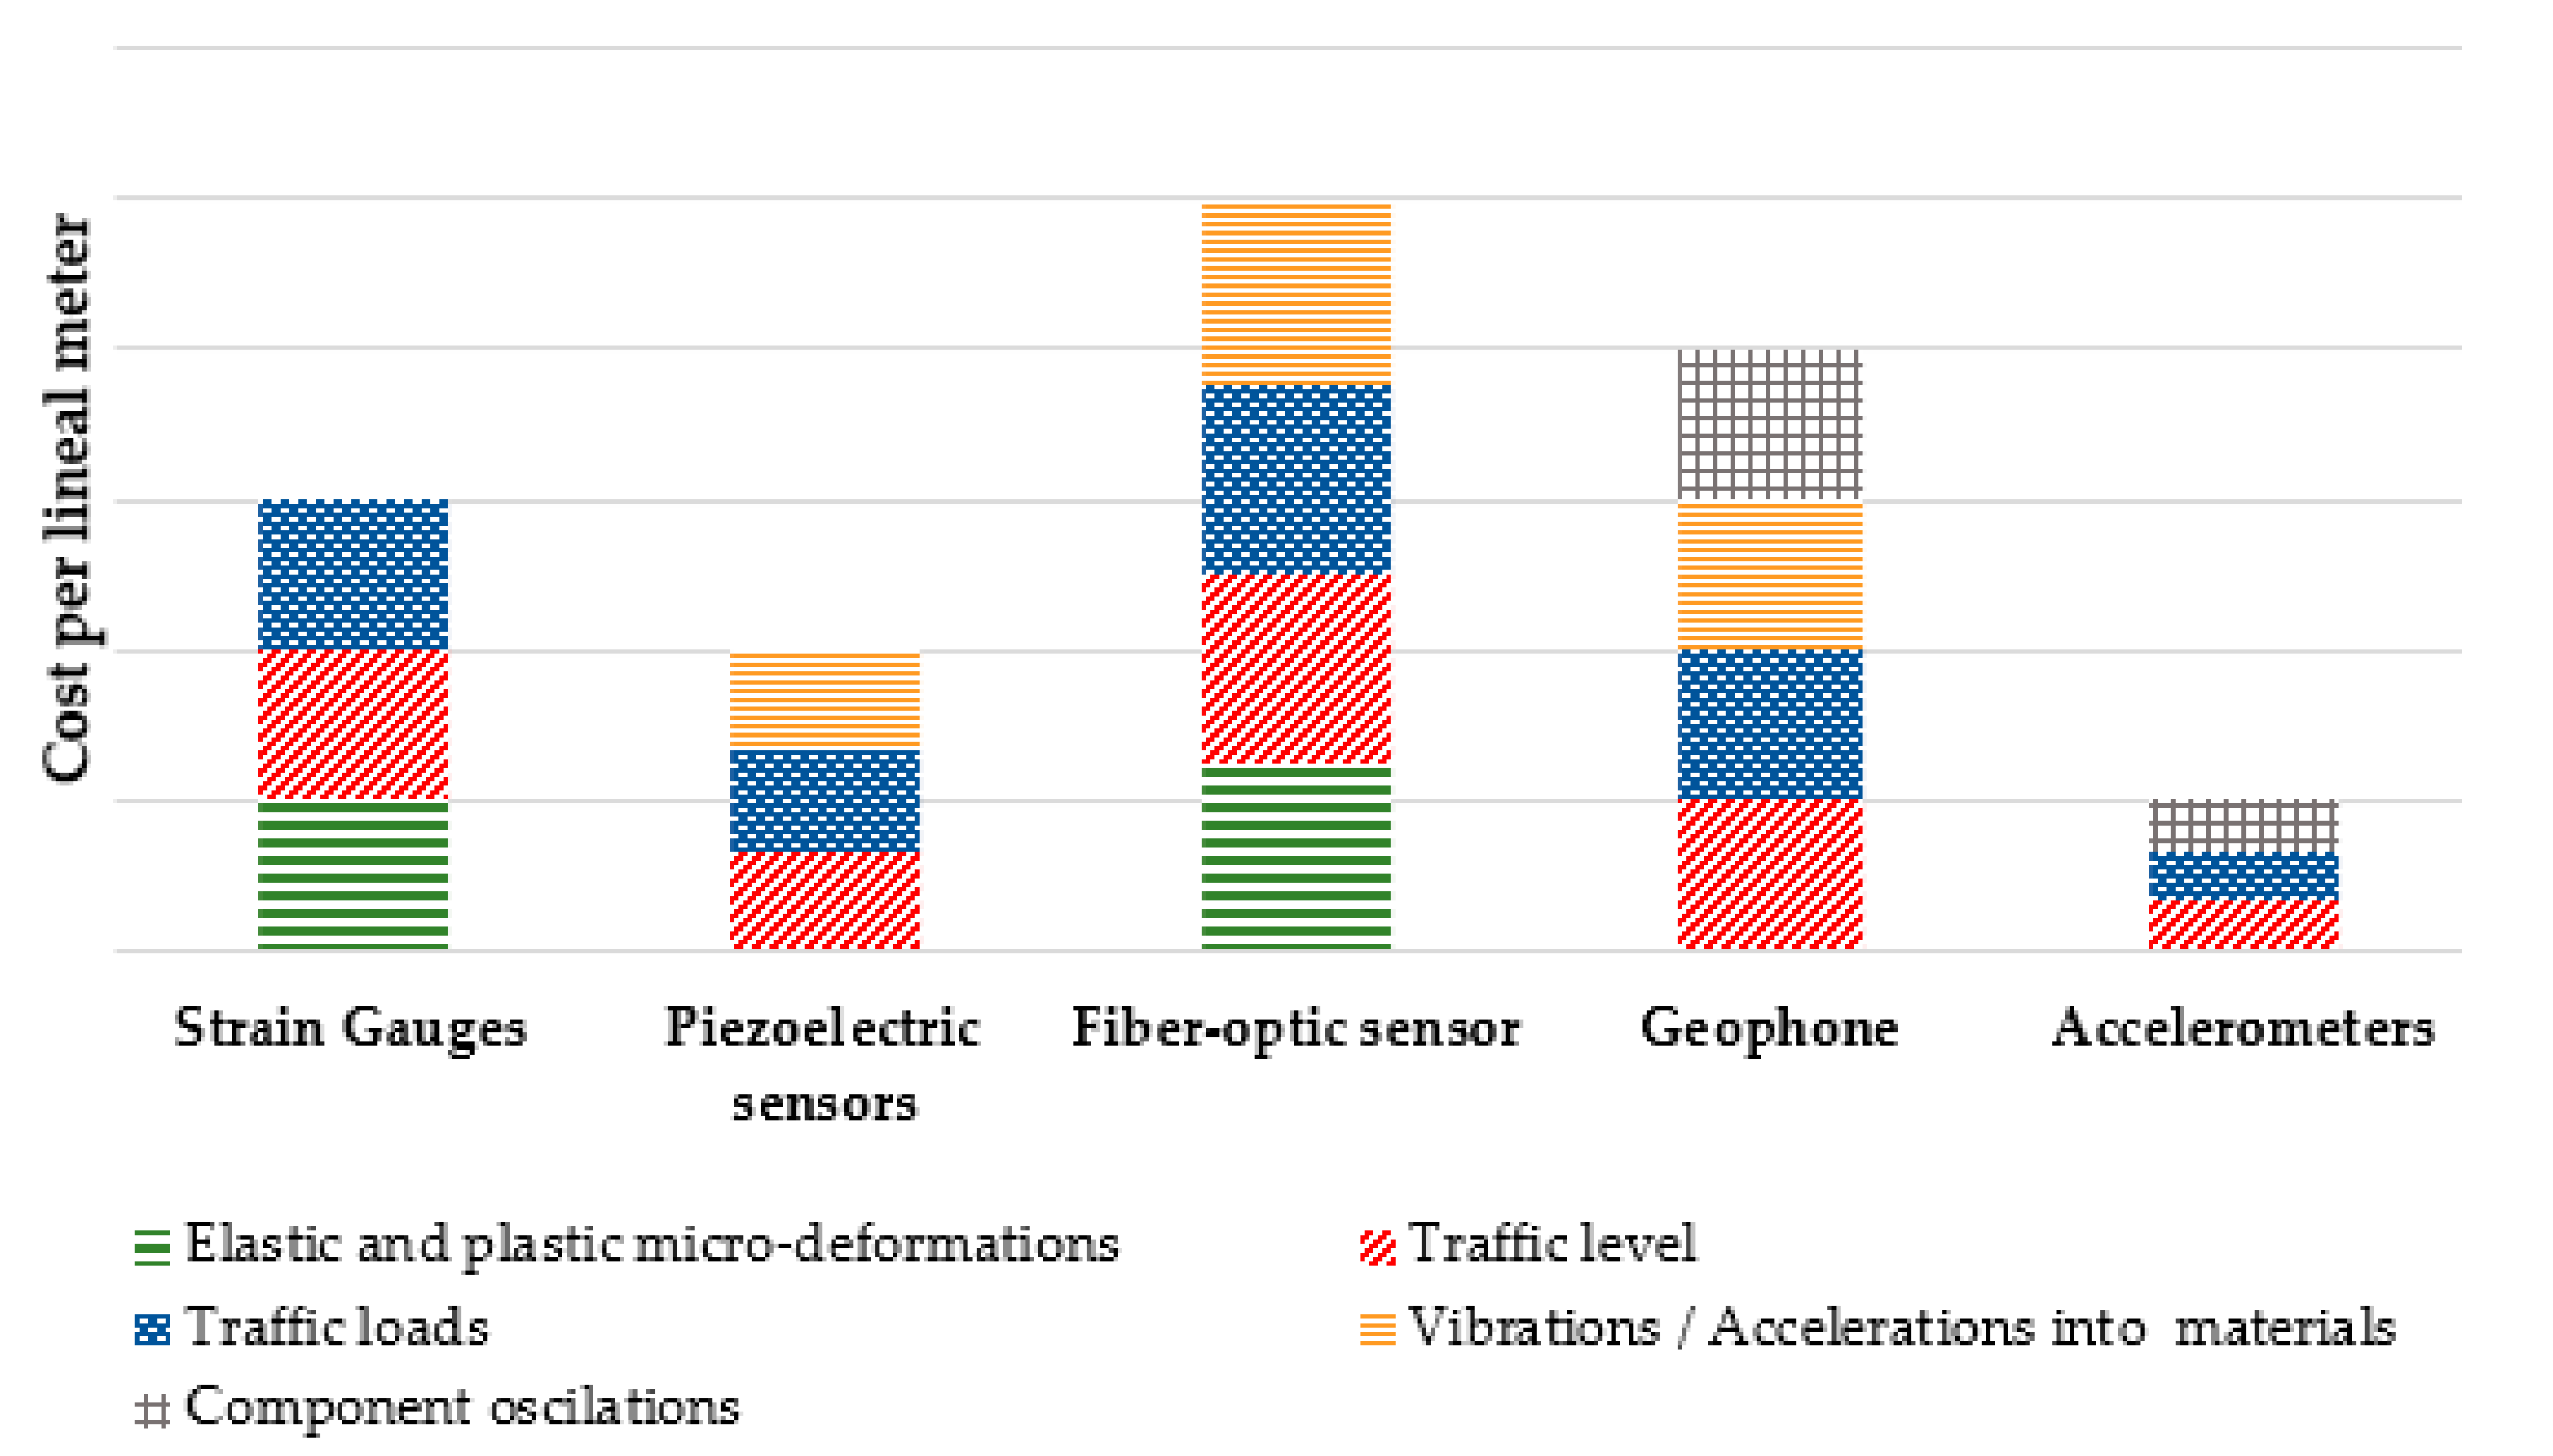
4. Discussion
5. Conclusions
- The monitoring of the different main modes of failure of ballasted railway tracks can be carried out through advanced but simple sensors able to measure diverse parameters such as component deformations and vibrations, track oscillations and dynamic forces applied by traffic.
- In this sense, optical fiber sensors were demonstrated to be among the most versatile sensors since they can track diverse properties, such as deformations, stress levels, vibrations and temperature with a single sensor. Nonetheless, it must be considered that due to the high price of these sensors, in comparison with other alternatives, they would require further research and development to enable their widespread application.
- To cover this disadvantage, a strain gauge could be used as a simple device to track the micro-deformations in components. However, its use presents certain disadvantages, such as its fragility, while also being susceptible to electromagnetic interference and having a high dependence on temperature.
- On the other hand, it has also been seen that the state of the track could be monitored through measuring the transmission of stresses and vibrations, where various experiences demonstrated that piezoelectrics and accelerometers present a good potential for this application.
- This is especially highlighted in the case of piezoelectrics because of their diverse advantages, such as their high linearity and their low cost, while allowing for a clear recording of the dynamic loads (intensity and frequency).
- On the other hand, while piezoelectrics could be more appropriate for monitoring traffic loads, accelerometers are considered to be a promising technology to measure vibrations and deflections (to calculate stiffness changes, differential settlement, hanging sleepers, etc.) because of their high accuracy and lower prices compared to other devices, such as geophones.
- Therefore, it can be concluded that piezoelectric, accelerometer or fiber optic sensors are the most ideal for being embedded into a railway track’s substructure (e.g., elastic elements, sleeper, bituminous sub ballast), while avoiding certain problems, such as stealing or vandalism.
Author Contributions
Funding
Conflicts of Interest
References
- Eurostat, Statistical Office of the European Communities. 2020. Available online: https://ec.europa.eu/eurostat/web/transport/data/database (accessed on 12 November 2020).
- Mesa, L.; Palacio, I.; Martín, S.; Manzano, G.; Domínguez, J. Atlas of High Speed Rail in Spain, Madrid (España); Fundación de los Ferrocarriles Españoles: Madrid, Spain, 2017. [Google Scholar]
- Calvo, F.; De Oña, J.; López, G.; Garach, L.; De Oña, R. Rail track costs management for efficient railway charges. Proc. Inst. Civ. Eng. Transp. 2011, 166, 325–335. [Google Scholar] [CrossRef] [Green Version]
- Williams, R. Improvement in Electric-Signaling Apparatus for Railroad. U.S. Patent US130661A, August 1872. [Google Scholar]
- Kouroussis, G.; Kinet, D.; Moeyaert, V.; Dupuy, J.; Caucheteur, C. Railway structure monitoring solutions using fibre Bragg grating sensors. Int. J. Rail Transp. 2016, 4, 135–150. [Google Scholar] [CrossRef]
- Brzozowski, K.; Ryguła, A.; Maczyński, A. The use of low-cost sensors for air quality analysis in road intersections. Transp. Res. Part D Transp. Environ. 2019, 77, 198–211. [Google Scholar] [CrossRef]
- Chilamkuri, K.; Kone, V. Monitoring of varadhi road bridge using accelerometer sensor. Mater. Today Proc. 2020, 33, 367–371. [Google Scholar] [CrossRef]
- Xue, W.; Wang, L.; Wang, D.; Druta, C. Pavement Health Monitoring System Based on an Embedded Sensing Network. J. Mater. Civ. Eng. 2014, 26, 04014072. [Google Scholar] [CrossRef]
- Ribeiro, D.; Calçada, R.; Ferreira, J.; Martins, T. Measurement of the Dynamic Displacements of Railway Bridges Using Video Technology. Matec Web Conf. 2015, 24, 2007. [Google Scholar] [CrossRef] [Green Version]
- Murray, C.A.; Take, A.; Hoult, N.A. Measurement of vertical and longitudinal rail displacements using digital image correlation. Can. Geotech. J. 2015, 52, 141–155. [Google Scholar] [CrossRef]
- Gräbe, P.J.; Shaw, F.J. Design Life Prediction of a Heavy Haul Track Foundation. Proc. Inst. Mech. Eng. Part F J. Rail Rapid Transit 2010, 224, 337–344. [Google Scholar] [CrossRef]
- Kouroussis, G.; Caucheteur, C.; Kinet, D.; Alexandrou, G.; Verlinden, O.; Moeyaert, V. Review of Trackside Monitoring Solutions: From Strain Gages to Optical Fibre Sensors. Sensors 2015, 15, 20115–20139. [Google Scholar] [CrossRef] [Green Version]
- Mishra, D.; Tutumluer, E.; Boler, H.; Hyslip, J. Instrumentation and Performance Monitoring of Railroad Track Transitions using Multidepth Deflectometers and Strain Gauges. In Proceedings of the 93rd Annual Meeting of the Transportation Research Board, Washington, DC, USA, 15 January 2014. [Google Scholar]
- Bowness, D.; Lock, A.C.; Powrie, W.; Priest, J.A.; Richardson, D.J. Monitoring the dynamic displacements of railway track. Proc. Inst. Mech. Eng. Part F J. Rail Rapid Transit 2007, 221, 13–22. [Google Scholar] [CrossRef]
- Cornners, T. Producing and Inspecting Railroad Crossties; Department of Forestry, University of Kentucky—College of Agriculture: Lexington, Kentucky, 2008. [Google Scholar]
- Ferdous, W.; Manalo, A.C. Failures of mainline railway sleepers and suggested remedies—Review of current practice. Eng. Fail. Anal. 2014, 44, 17–35. [Google Scholar] [CrossRef]
- Zeman, J.; Edwards, J.; Barkan, C.; Lange, D. Failure mode and effect analysis of concrete ties in North America. In Proceedings of the 9th International Heavy Haul Conference: Heavy Haul and Innovation Development, Shanghai, China, 22–25 June 2009. [Google Scholar]
- Zi, G.; Moon, D.Y.; Lee, S.-J.; Jang, S.Y.; Yang, S.C.; Kim, S.-S. Investigation of a concrete railway sleeper failed by ice expansion. Eng. Fail. Anal. 2012, 26, 151–163. [Google Scholar] [CrossRef]
- Uranjek, M.; Štrukelj, A.; Lenart, S.; Peruš, I. Analysis of influential parameters for accelerated degradation of ballastrailway track. Constr. Build. Mater. 2020, 261, 19938. [Google Scholar] [CrossRef]
- Nurmikolu, A. Degradation and Frost Susceptibility of Crushed Rock Aggregates Used in Structural Layers of Railway Track; Tampere University of Technology: Tampere, Finland, 2005. [Google Scholar]
- Indraratna, B.; Ngo, T.; Rujikiatkamjorn, C. Performance of Ballast Influenced by Deformation and Degradation: Laboratory Testing and Numerical Modeling. Int. J. Géoméch. 2020, 20, 04019138. [Google Scholar] [CrossRef] [Green Version]
- Berggren, E. Railway Track Stiffness: Dynamic Measurements and Evaluation for Efficient Maintenance. Ph.D. Thesis, Royal Institute of Technology KTH, Stockholm, Sweden, 2009. [Google Scholar]
- Tanaka, H.; Matsumot, M.; Harada, Y. Application of axle-box acceleration to track condition monitoring for rail corrugation management. In Proceedings of the 7th IET Conference on Railway Condition Monitoring 2016 (RCM 2016), Birmingham, UK, 27–28 September 2016. [Google Scholar]
- Connolly, D.; Kouroussis, G.; Laghrouche, O.; Ho, C.; Forde, M. Benchmarking railway vibrations—Track, vehicle, ground and building effects. Constr. Build. Mater. 2015, 92, 64–81. [Google Scholar] [CrossRef] [Green Version]
- Nielsen, J.; Johansson, A. Out-of-roun railway wheels- a literature survey. Proc. Inst. Mech. Eng. Part F J. Rail Rapid Transit 2000, 214, 79–91. [Google Scholar] [CrossRef]
- Remennikov, A.M.; Kaewunruen, S. A review of loading conditions for railway track structures due to train and track vertical interaction. Struct. Control. Health Monit. 2008, 15, 207–234. [Google Scholar] [CrossRef]
- Mueller-Boruttau, F.; Breitsamter, N.; Molzberger, H.; Buchmann, A. Detection of Brake Type and Tread Surface Quality of Passing Trains Based on Rail-Sleeper-Force Measurment. In Proceedings of the 10th International Workshop on Railway Noise, Nagahama, Japan, 18–22 October 2010. [Google Scholar]
- Pita, A.L.; Teixeira, P.F.; Robuste, F. High speed and track deterioration: The role of vertical stiffness of the track. Proc. Inst. Mech. Eng. Part F J. Rail Rapid Transit 2004, 218, 31–40. [Google Scholar] [CrossRef]
- Hunt, G. EUROBALT optimises ballasted track. Rail-Way Gaz. Int. 2000, 156, 813–816. [Google Scholar]
- Nielsen, J.; Li, X. Railway track geometry degradation due to differential settlement of ballast/subgrade—Numerical prediction by an iterative procedure. J. Sound Vib. 2018, 412, 441–456. [Google Scholar] [CrossRef]
- Puzavac, L.; Popovic, Z.; Larevic, L. Influence of track stiffness on track behavior under vertical load. Promet-Traffic Transp. 2012, 24, 405–412. [Google Scholar] [CrossRef]
- Hildebrand, G.; Rasmussen, S. Development of High Speed Deflectograph; Road Directorate, Danish Road Institute: Roskilde, Denmark, 2002. [Google Scholar]
- Wang, P.; Wang, L.; Chen, R.; Xu, J.; Xu, J.; Gao, M. Overview and outlook on railway track stiffness measurement. J. Mod. Transp. 2016, 24, 89–102. [Google Scholar] [CrossRef] [Green Version]
- Burrow, M.; Fonsenca-Teixeira, P.; Dahlberg, T.; Berggren, E. Railway Transportation: Policies, Technology and Perspectives; Nova Science Pusblisher: Hauppauge, NY, USA, 2009; Chapter 10. [Google Scholar]
- Vilotijević, M.; Brajović, L.; Lazarević, L.; Mirković, N. Methods for track stiffness measurement-state of the art. In Proceedings of the New Horizons 2017 of transport and communications, Doboj, Bosnia-Herzegovina, 17–18 November 2017. [Google Scholar]
- Woschitz, H. Development of a rail-strain-pad using FBG sensors. In Proceedings of the 5th International Conference on Structural Health Monitoring of Intelligent Infrastructure (SHMII-5), Cancún, Mexico, 11–15 December 2011. [Google Scholar]
- Milne, D.; Masoudi, A.; Ferro, E.; Watson, G.; Le Pen, L. An analysis of railway track behavior based on distributed optical fibre acoustic sensing. Mech. Syst. Signal Process. 2020, 142, 106769. [Google Scholar] [CrossRef]
- Du, C.; Dutta, S.; Kurup, P.; Yu, T.; Wang, X. A review of railway infaestructure monitoring using fiber optic sensor. Sens. Actuators A Phys. 2020, 303, 111728. [Google Scholar] [CrossRef]
- Ferrero, J.; Guijarro, E. Instrumentacion Electrónica. Sensores; Servicio de Publicaciones UPV: Valencia, Spain, 1994. [Google Scholar]
- Azate, E.; Montes, J.; Silva, C. Medidores de deformación por resistencia: Galgas extensiométricas. Sci. Tech. Año XIII 2007, 34, 7–12. [Google Scholar]
- Iskander, M. Underground Sensing. Monitoring and Hazard Detection for Environment and Infrastructure; Academic Press: Cambridge, MA, USA, 2018. [Google Scholar]
- Figliola, R.S.; Beasley, D.E. Mediciones Mecánicas: Teoría y Diseño; Alfaomega Grupo Editor: Mexico City, Mexico, 2003. [Google Scholar]
- Askarinejad, H.; Dhanasekar, M.; Cole, C. Assessing the effects of track input on the response of insulated rail joints using field experiments. Proc. Inst. Mech. Eng. Part F J. Rail Rapid Transit 2012, 227, 176–187. [Google Scholar] [CrossRef]
- Palo, M.; Galar, D.; Nordmark, T.; Asplund, M.; Larsson, D. Condition monitoring at the wheel/rail interface for decision-making support. Proc. Inst. Mech. Eng. Part F J. Rail Rapid Transit 2014, 228, 705–715. [Google Scholar] [CrossRef]
- Ahmad, S.S.; Mandal, N.K.; Chattopadhyay, G.; Powell, J. Development of a unified railway track stability management tool to enhance track safety. Proc. Inst. Mech. Eng. Part F J. Rail Rapid Transit 2013, 227, 493–516. [Google Scholar] [CrossRef]
- Delprete, C.; Rosso, C. An easy instrument and methology for the monitoring and the diagnosis of a rail. Mech. Syst. Signal Process. 2008, 23, 940–956. [Google Scholar] [CrossRef]
- Khairallah, D.; Blanc, J.; Cottineau, L.M.; Hornych, P.; Piau, J.-M.; Pouget, S.; Hosseingholian, M.; Ducreau, A.; Savin, F. Monitoring of railway structures of the high speed line BPL with bituminous and granular sublayers. Constr. Build. Mater. 2019, 211, 337–348. [Google Scholar] [CrossRef]
- Barriera, M.; Pouget, S.; Lebental, B.; Van Rompu, J. In Situ Pavement Monitoring: A Review. Infrastructures 2020, 5, 18. [Google Scholar] [CrossRef] [Green Version]
- Zhang, S.; Koh, C.G.; Kuang, K.S.C. Proposed rail pad sensor for wheel-rail contact force monitoring. Smart Mater. Struct. 2018, 27, 115041. [Google Scholar] [CrossRef]
- Ferdinand, P. The evolution of optical fiber sensors technologies during the35 last years and their applications in structure health monitoring. In Proceedings of the 7th European Workshop on Structural Health Monitoring, Nantes, France, 8–11 July 2014. [Google Scholar]
- Rogers, A. Distributed optical-fibre sensing. Meas. Sci. Technol. 1999, 10, R75–R99. [Google Scholar] [CrossRef]
- Cho, Y.T.; Alahbabi, M.N.; Brambilla, G.; Newson, T. Distributed Raman amplification combined with a remotely pumped EDFA utilized to enhance the performance of spontaneous Brillouin-based distributed temperature sensors. IEEE Photon Technol. Lett. 2005, 17, 1256–1258. [Google Scholar] [CrossRef]
- Minardo, A.; Porcaro, G.; Giannetta, D.; Bernini, R.; Zeni, L. Real-time monitoring of railway traffic using slope-assisted Brillouin distributed sensors. Appl. Opt. 2013, 52, 3770–3776. [Google Scholar] [CrossRef]
- Bao, X.; Chen, L. Recent Progress in Distributed Fiber Optic Sensors. Sensors 2012, 12, 8601–8639. [Google Scholar] [CrossRef] [Green Version]
- Speziale, S.; Marquardt, H.; Duffy, T. Brillouin Scattering and its Application in Geosciences. Rev. Mineral. Geochem. 2014, 78, 543–603. [Google Scholar] [CrossRef]
- Hartog, A. An Introduction to Disbributed Optical Fibre Sensor; CRC Press: Boca Raton, FL, USA, 2017. [Google Scholar]
- Hill, D. Distributed Acoustic Sensing (DAS): Theory and Applications. Front. Opt. 2015. [Google Scholar] [CrossRef]
- Dou, S.; Lindsey, N.; Wagner, A.M.; Daley, T.M.; Freifeld, B.; Robertson, M.; Peterson, J.; Ulrich, C.; Martin, E.R.; Ajo-Franklin, J. Distributed Acoustic Sensing for Seismic Monitoring of The Near Surface: A Traffic-Noise Interferometry Case Study. Sci. Rep. 2017, 7, 1–12. [Google Scholar] [CrossRef] [Green Version]
- Rodriguez, G.; Casas, J.; Villalba, S. SHM by DOFS in civil engineering: A review. Struct. Monit. Maint. 2015, 2, 357–382. [Google Scholar] [CrossRef] [Green Version]
- Froggatt, M.; Moore, J. High-spatial-resolution distributed strainmeasurement in optical fiber with Rayleigh scatter. Appl. Opt. 1998, 37, 1735–1740. [Google Scholar] [CrossRef] [PubMed]
- Lee, K.; Lee, K.; Ho, S. Exploration fo using FBG sensor for derailment detector. WSEAS Trasaction Syst. 2004, 3, 2433–2439. [Google Scholar]
- Alemi, A.; Corman, F.; Lodewijks, G. Condition monitoring approaches for the detection of railway wheel defects. Proc. Inst. Mech. Eng. Part F J. Rail Rapid Transit 2016, 231, 961–981. [Google Scholar] [CrossRef] [Green Version]
- Filograno, M.L.; Corredera, P.; Rodriguez-Plaza, M.; Andres-Alguacil, A.; Gonzalez-Herraez, M. Wheel Flat Detection in High-Speed Railway Systems Using Fiber Bragg Gratings. IEEE Sens. J. 2013, 13, 4808–4816. [Google Scholar] [CrossRef]
- Wei, C.; Xin, Q.; Chung, W.H.; Liu, S.-Y.; Tam, H.-Y.; Ho, S.L. Real-Time Train Wheel Condition Monitoring by Fiber Bragg Grating Sensors. Int. J. Distrib. Sens. Netw. 2012, 8. [Google Scholar] [CrossRef]
- Lai, C.; Kam, J.; Leung, D.; Lee, T.; Tam, A.; Ho, S.; Tam, H.; Liu, M. Development of a fiber-optic sensing system for train vibration and train weight measurements in Hon Kong. J. Sens. 2012, 2012, 365165. [Google Scholar] [CrossRef] [Green Version]
- Alexakis, H.; Franza, A.; Acikgoz, S.; Dejong, M. A multi-sensing monitoring system to study deterioration of a railway bridge. In Proceedings of the 9th International Conference on Structural Health Monitoring of Intelligent Infrastructure (SHMII-9), St. Louis, MO, USA, 4–7 August 2019. [Google Scholar]
- Buggy, S.J.; James, S.W.; Staines, S.; Carroll, R.; Kitson, P.; Farrington, D.; Drewett, L.; Jaiswal, J.; Tatam, R.P. Railway track component condition monitoring using optical fibre Bragg grating sensors. Meas. Sci. Technol. 2016, 27, 055201. [Google Scholar] [CrossRef] [Green Version]
- Lai, C.C.; Au, H.Y.; Liu, M.S.Y.; Ho, S.L.; Tam, H.Y. Development of Level Sensors Based on Fiber Bragg Grating for Railway Track Differential Settlement Measurement. IEEE Sens. J. 2016, 16, 6346–6350. [Google Scholar] [CrossRef]
- Yoon, H.-J.; Song, K.-Y.; Kim, J.-S.; Kim, D.-S. Longitudinal strain monitoring of rail using a distributed fiber sensor based on Brillouin optical correlation domain analysis. NDT E Int. 2011, 44, 637–644. [Google Scholar] [CrossRef]
- Wheeler, L.; Take, W.; Hoult, N.; Le, H. The Use of Fiber Optic Sensing to Measure Distributed Rail Strains and Determine Rail Seat Forces Due to a Moving Train. Can. Geotech. J. 2019, 56, 1–13. [Google Scholar] [CrossRef]
- Milne, D.; Le Pen, L.; Watson, G.; Thompson, D.; Powrie, W.; Hayward, M.; Morley, S. Proving MEMS Technologies for Smarter Railway Infraestructure. Procedia Eng. 2016, 143, 1077–1084. [Google Scholar] [CrossRef] [Green Version]
- Crespo-Chacón, I.; García-De-La-Oliva, J.L.; Santiago-Recuerda, E. On the Use of Geophones in the Low-Frequency Regime to Study Rail Vibrations. Procedia Eng. 2016, 143, 782–794. [Google Scholar] [CrossRef] [Green Version]
- Gao, R.; Zhang, L. Micromachined microsensors for manufacturing. IEEE Instrum. Meas. Mag. 2004, 7, 20–26. [Google Scholar] [CrossRef]
- Albarbar, A.; Badri, A.; Sinha, J.K.; Starr, A. Performance evaluation of MEMS accelerometers. Measurement 2009, 42, 790–795. [Google Scholar] [CrossRef] [Green Version]
- Coronado-Martínez, J. Análisis de las perturbaciones producidas por el sistema eléctrico de potencia de ferrocarriles de alta velocidad alimentados a frecuencia industrial. Vía Libre-Técnica 2014, 8, 81–100. [Google Scholar]


| Sensor Type | Characteristics [38] | Advantages | Disadvantages |
|---|---|---|---|
| >Fiber Bragg |
|
|
|
| Brillouin scattering |
|
|
|
| Rayleigh scattering-OTDR |
|
|
|
| Rayleigh scattering-OFDR |
|
| Characteristics | Geophone | Accelerometers |
|---|---|---|
| Acceleration and displacement measurement | ✓ | ✓ |
| Relatively low cost | ✓ | |
| High frequency range operation | ✓ | |
| High signal noise | ✓ | |
| High measurement precision | ✓ |
Publisher’s Note: MDPI stays neutral with regard to jurisdictional claims in published maps and institutional affiliations. |
© 2020 by the authors. Licensee MDPI, Basel, Switzerland. This article is an open access article distributed under the terms and conditions of the Creative Commons Attribution (CC BY) license (http://creativecommons.org/licenses/by/4.0/).
Share and Cite
Castillo-Mingorance, J.M.; Sol-Sánchez, M.; Moreno-Navarro, F.; Rubio-Gámez, M.C. A Critical Review of Sensors for the Continuous Monitoring of Smart and Sustainable Railway Infrastructures. Sustainability 2020, 12, 9428. https://0-doi-org.brum.beds.ac.uk/10.3390/su12229428
Castillo-Mingorance JM, Sol-Sánchez M, Moreno-Navarro F, Rubio-Gámez MC. A Critical Review of Sensors for the Continuous Monitoring of Smart and Sustainable Railway Infrastructures. Sustainability. 2020; 12(22):9428. https://0-doi-org.brum.beds.ac.uk/10.3390/su12229428
Chicago/Turabian StyleCastillo-Mingorance, Juan Manuel, Miguel Sol-Sánchez, Fernando Moreno-Navarro, and María Carmen Rubio-Gámez. 2020. "A Critical Review of Sensors for the Continuous Monitoring of Smart and Sustainable Railway Infrastructures" Sustainability 12, no. 22: 9428. https://0-doi-org.brum.beds.ac.uk/10.3390/su12229428