Harnessing Remote Sensing Derived Sea Level Rise Models to Assess Cultural Heritage Vulnerability: A Case Study from the Northwest Atlantic Ocean


Abstract
:1. Introduction
Problem Statement
2. Materials and Methods
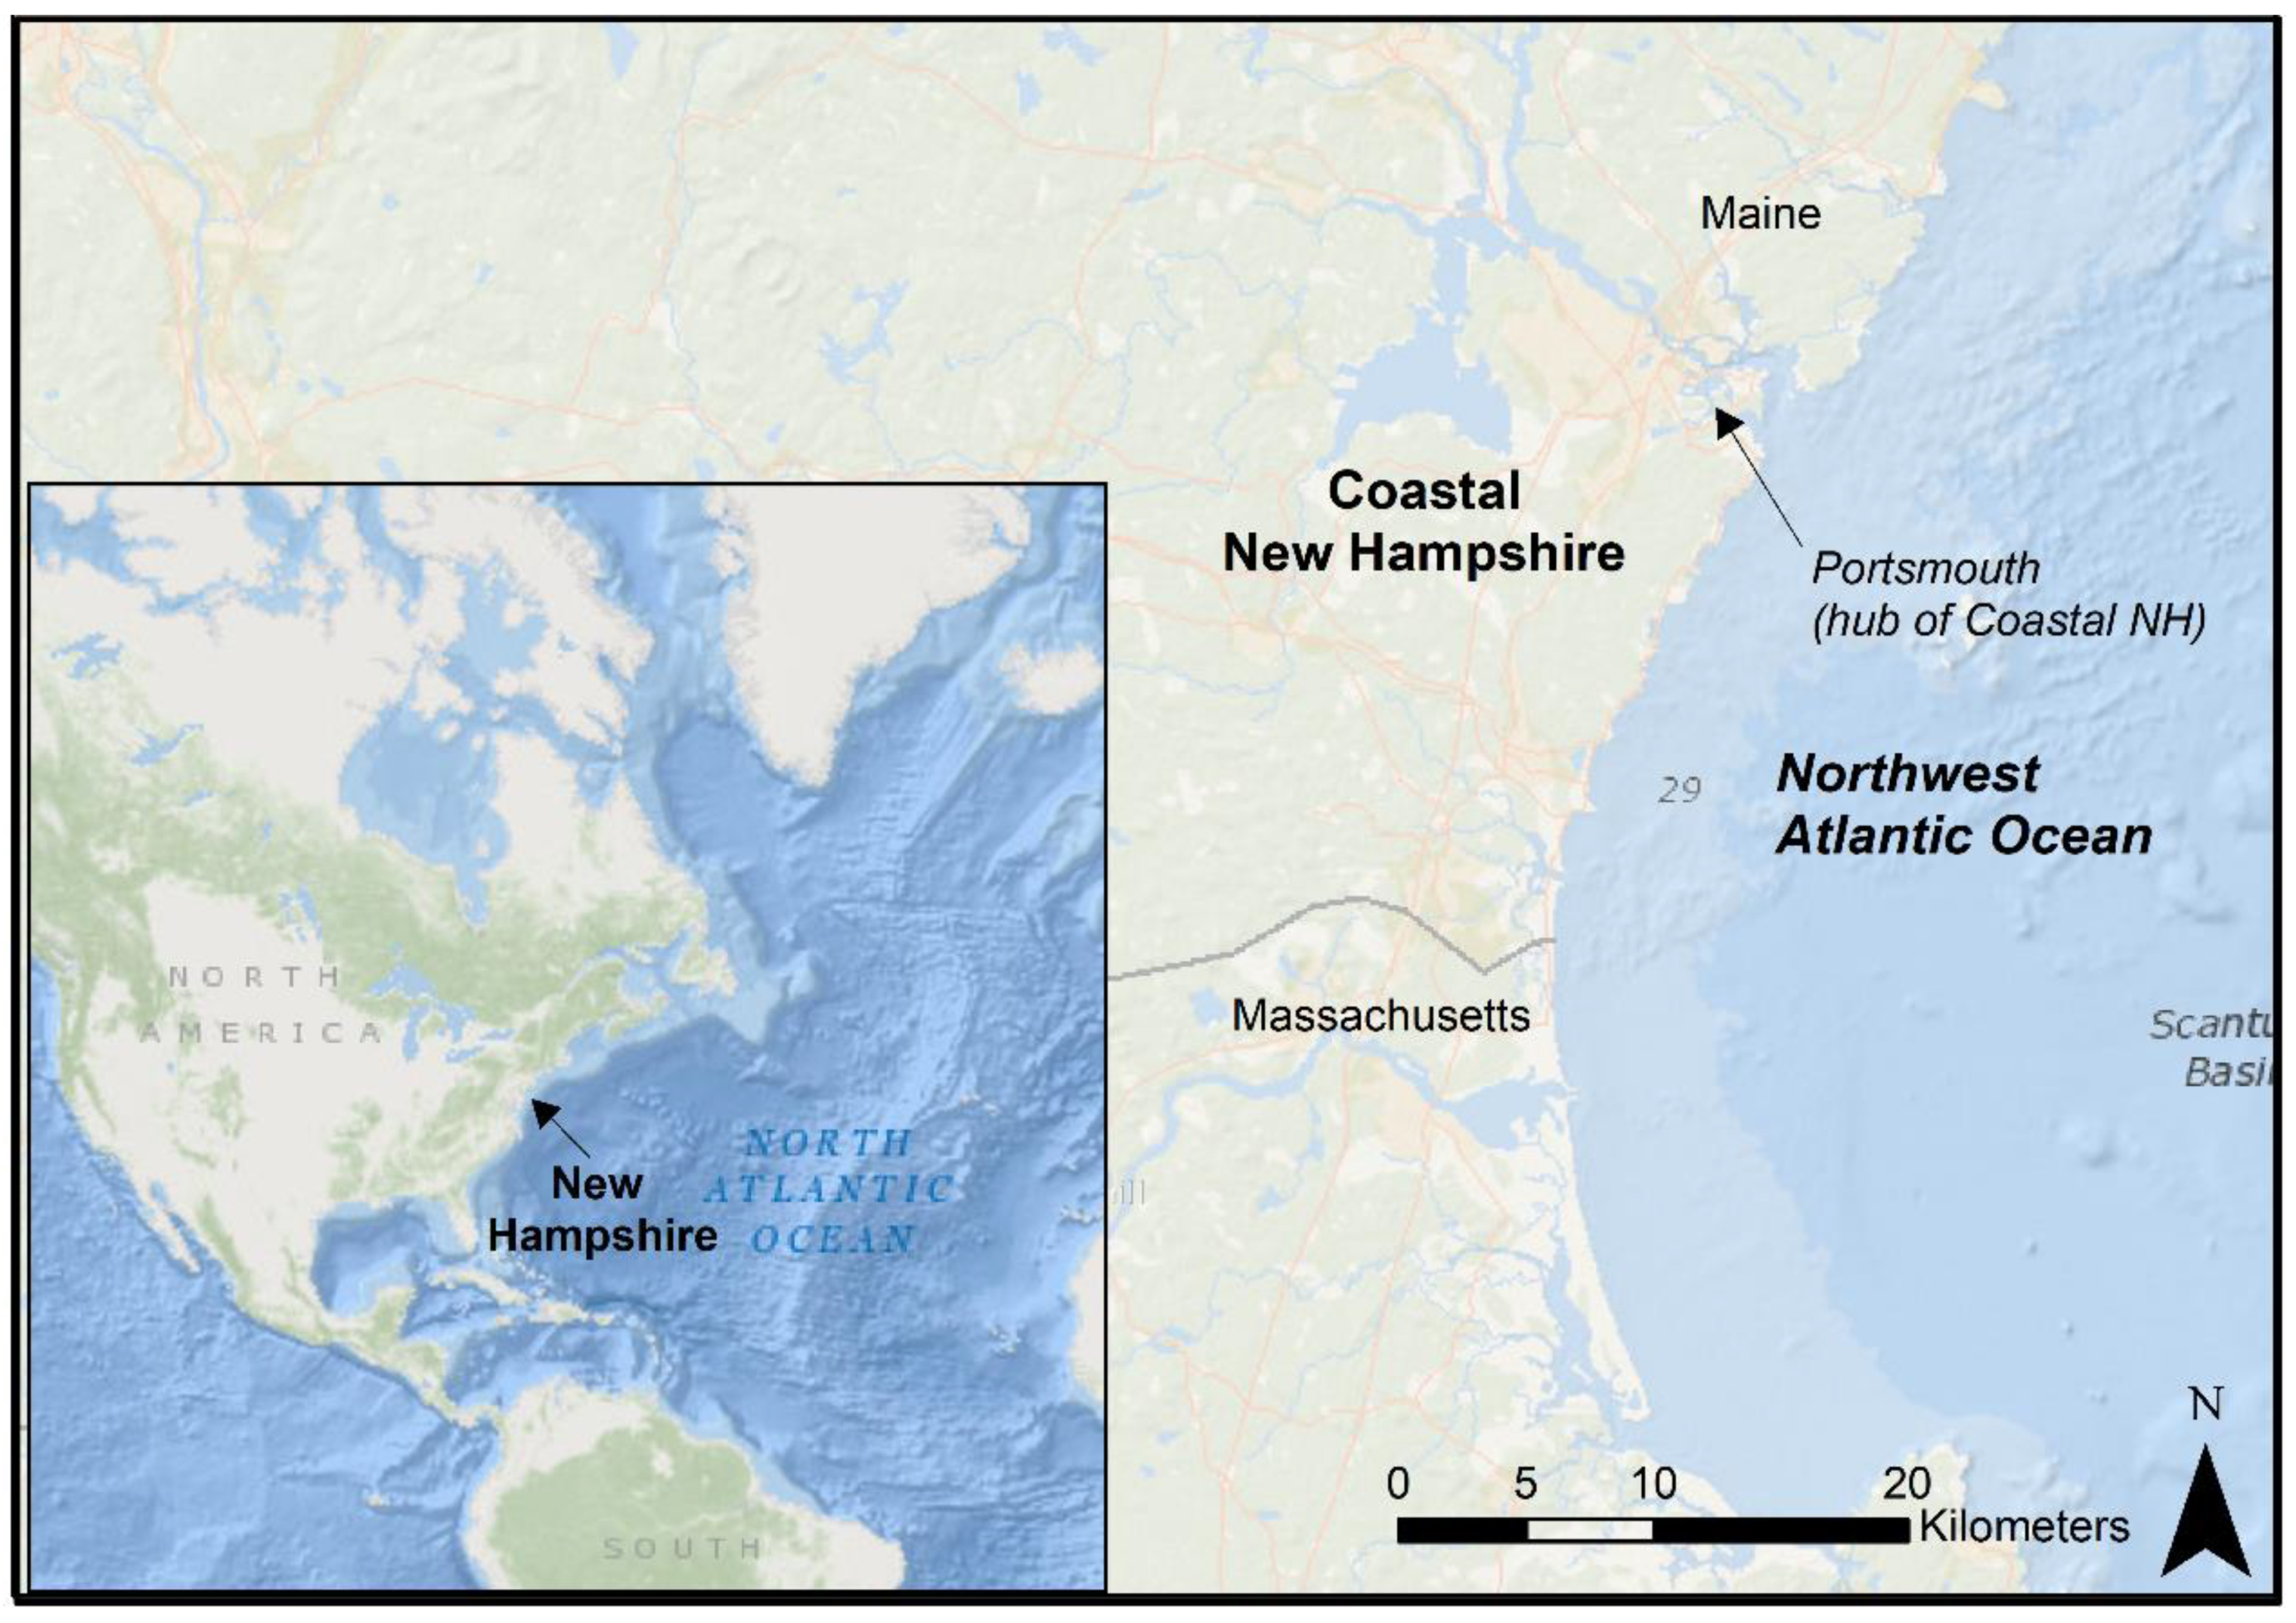
2.1. Study Area
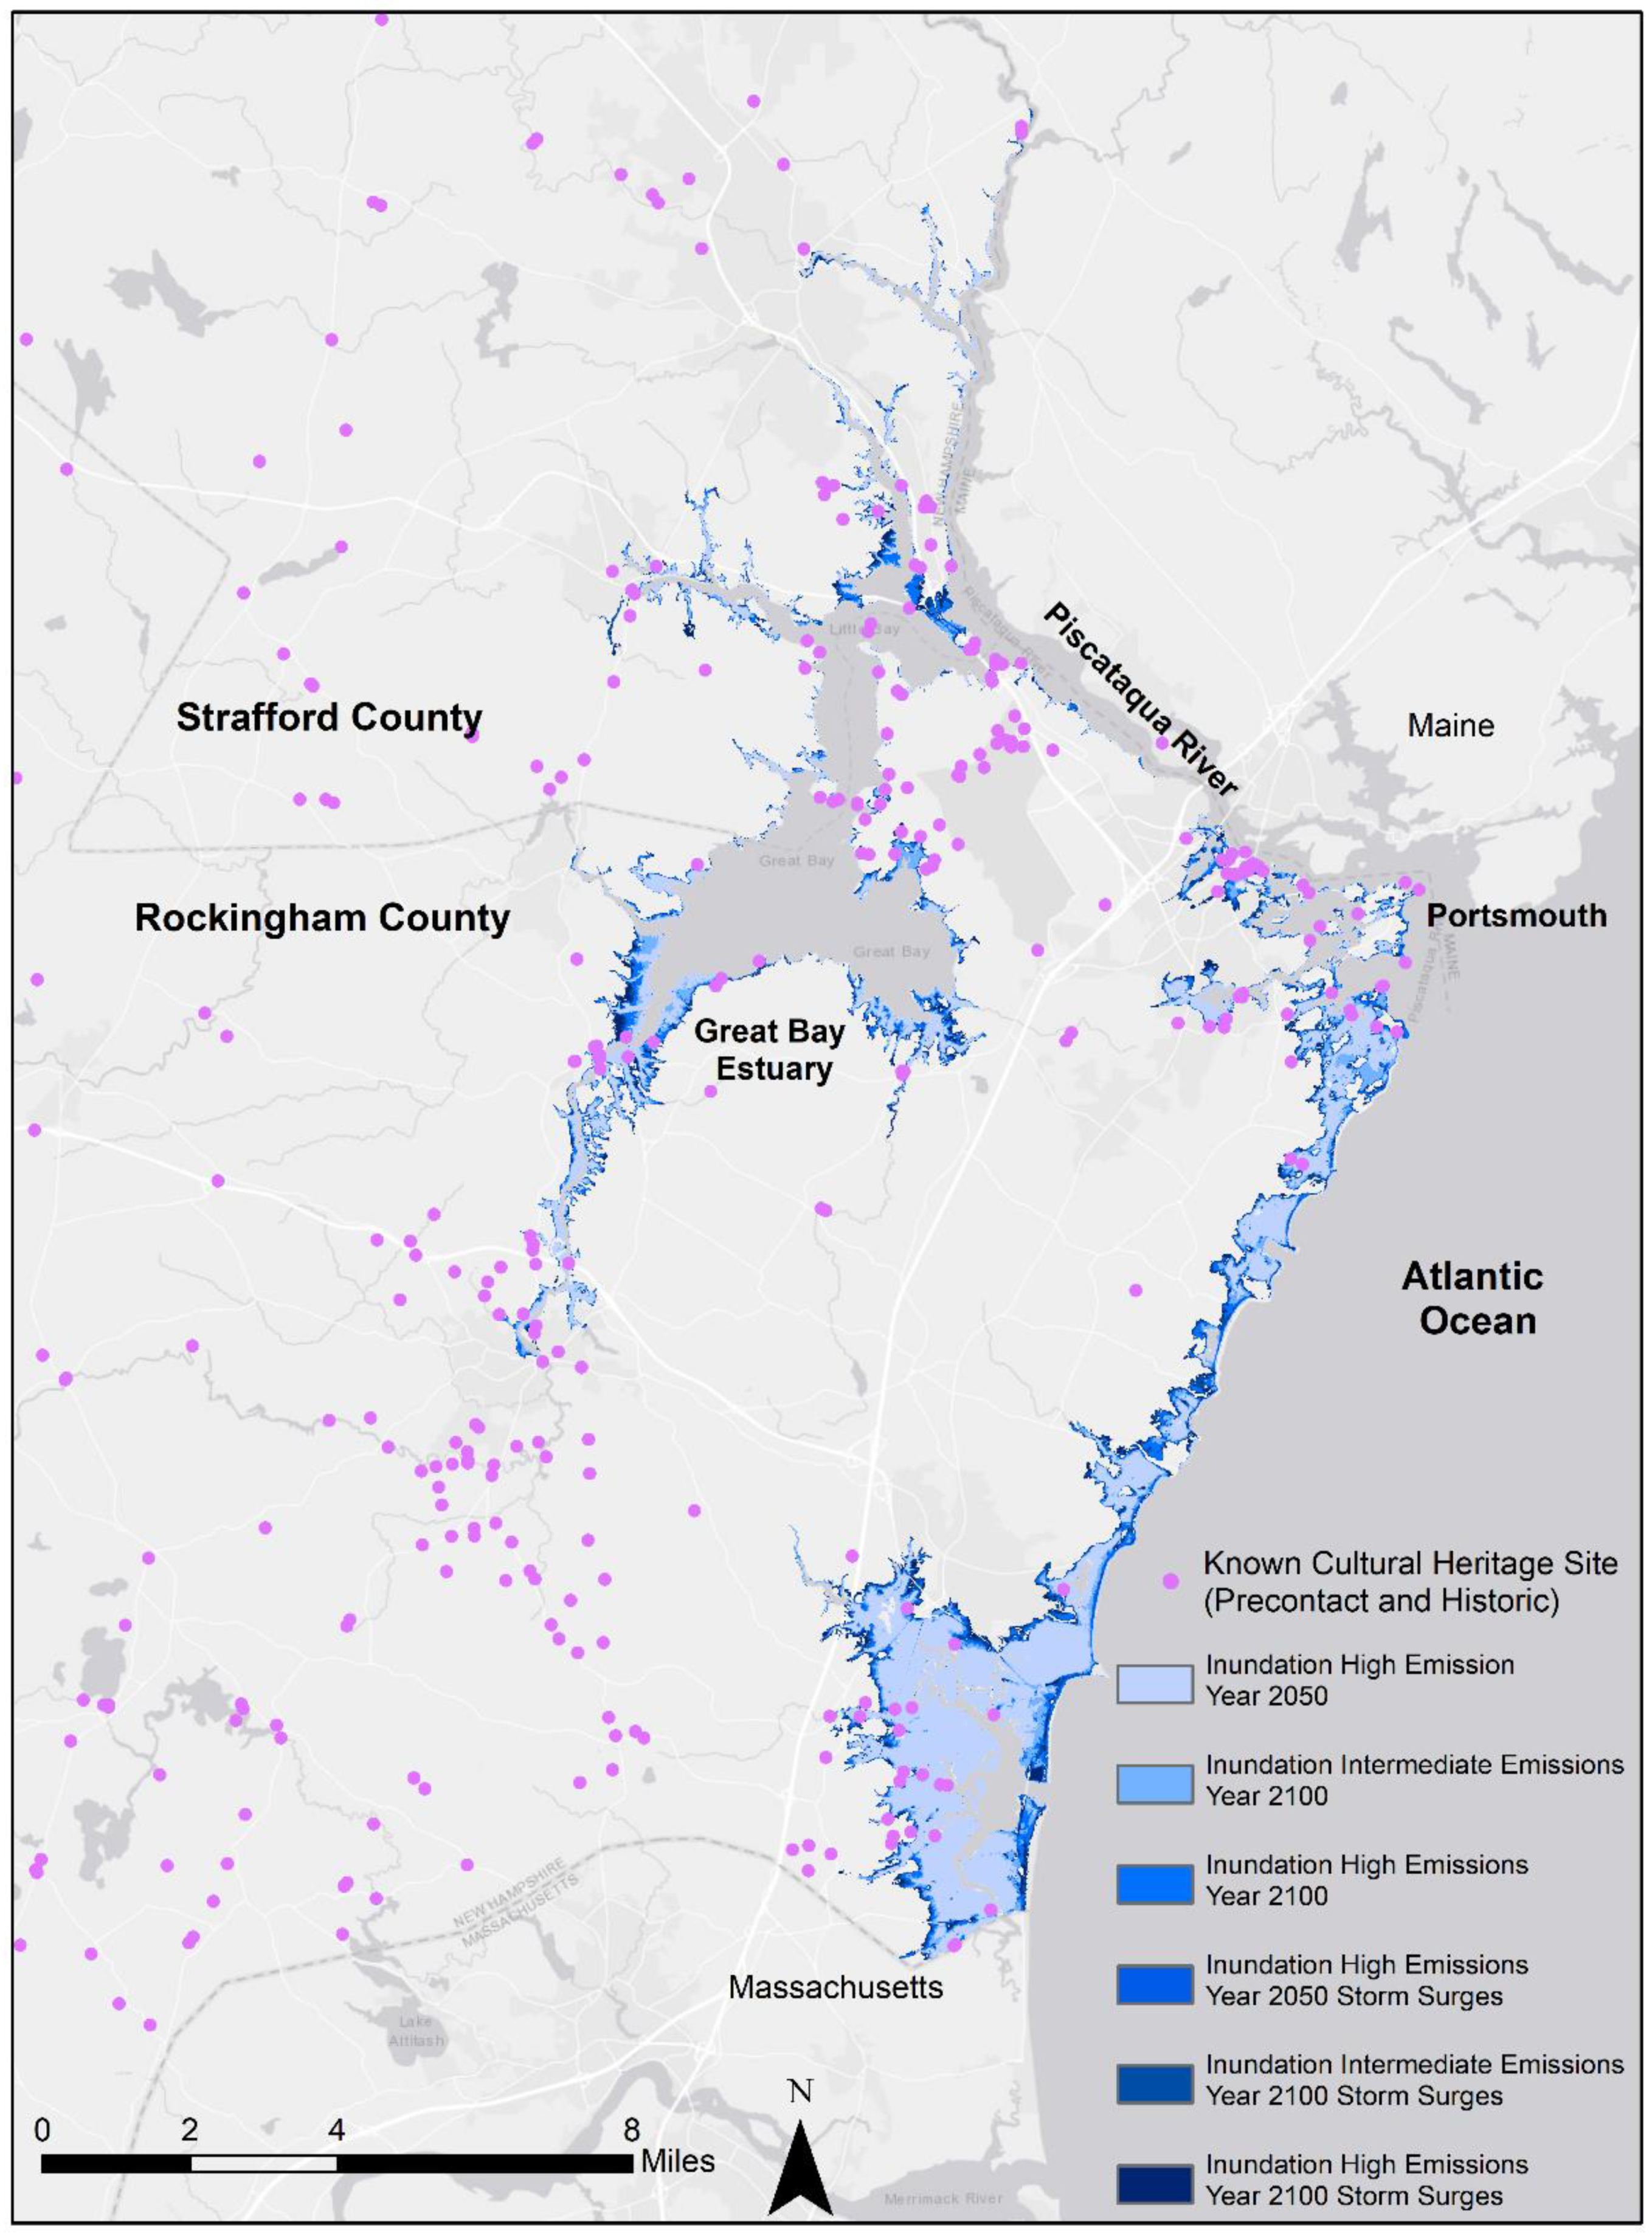
2.2. LIDAR-Derived Relative Sea Level Rise Flooding Extent Maps
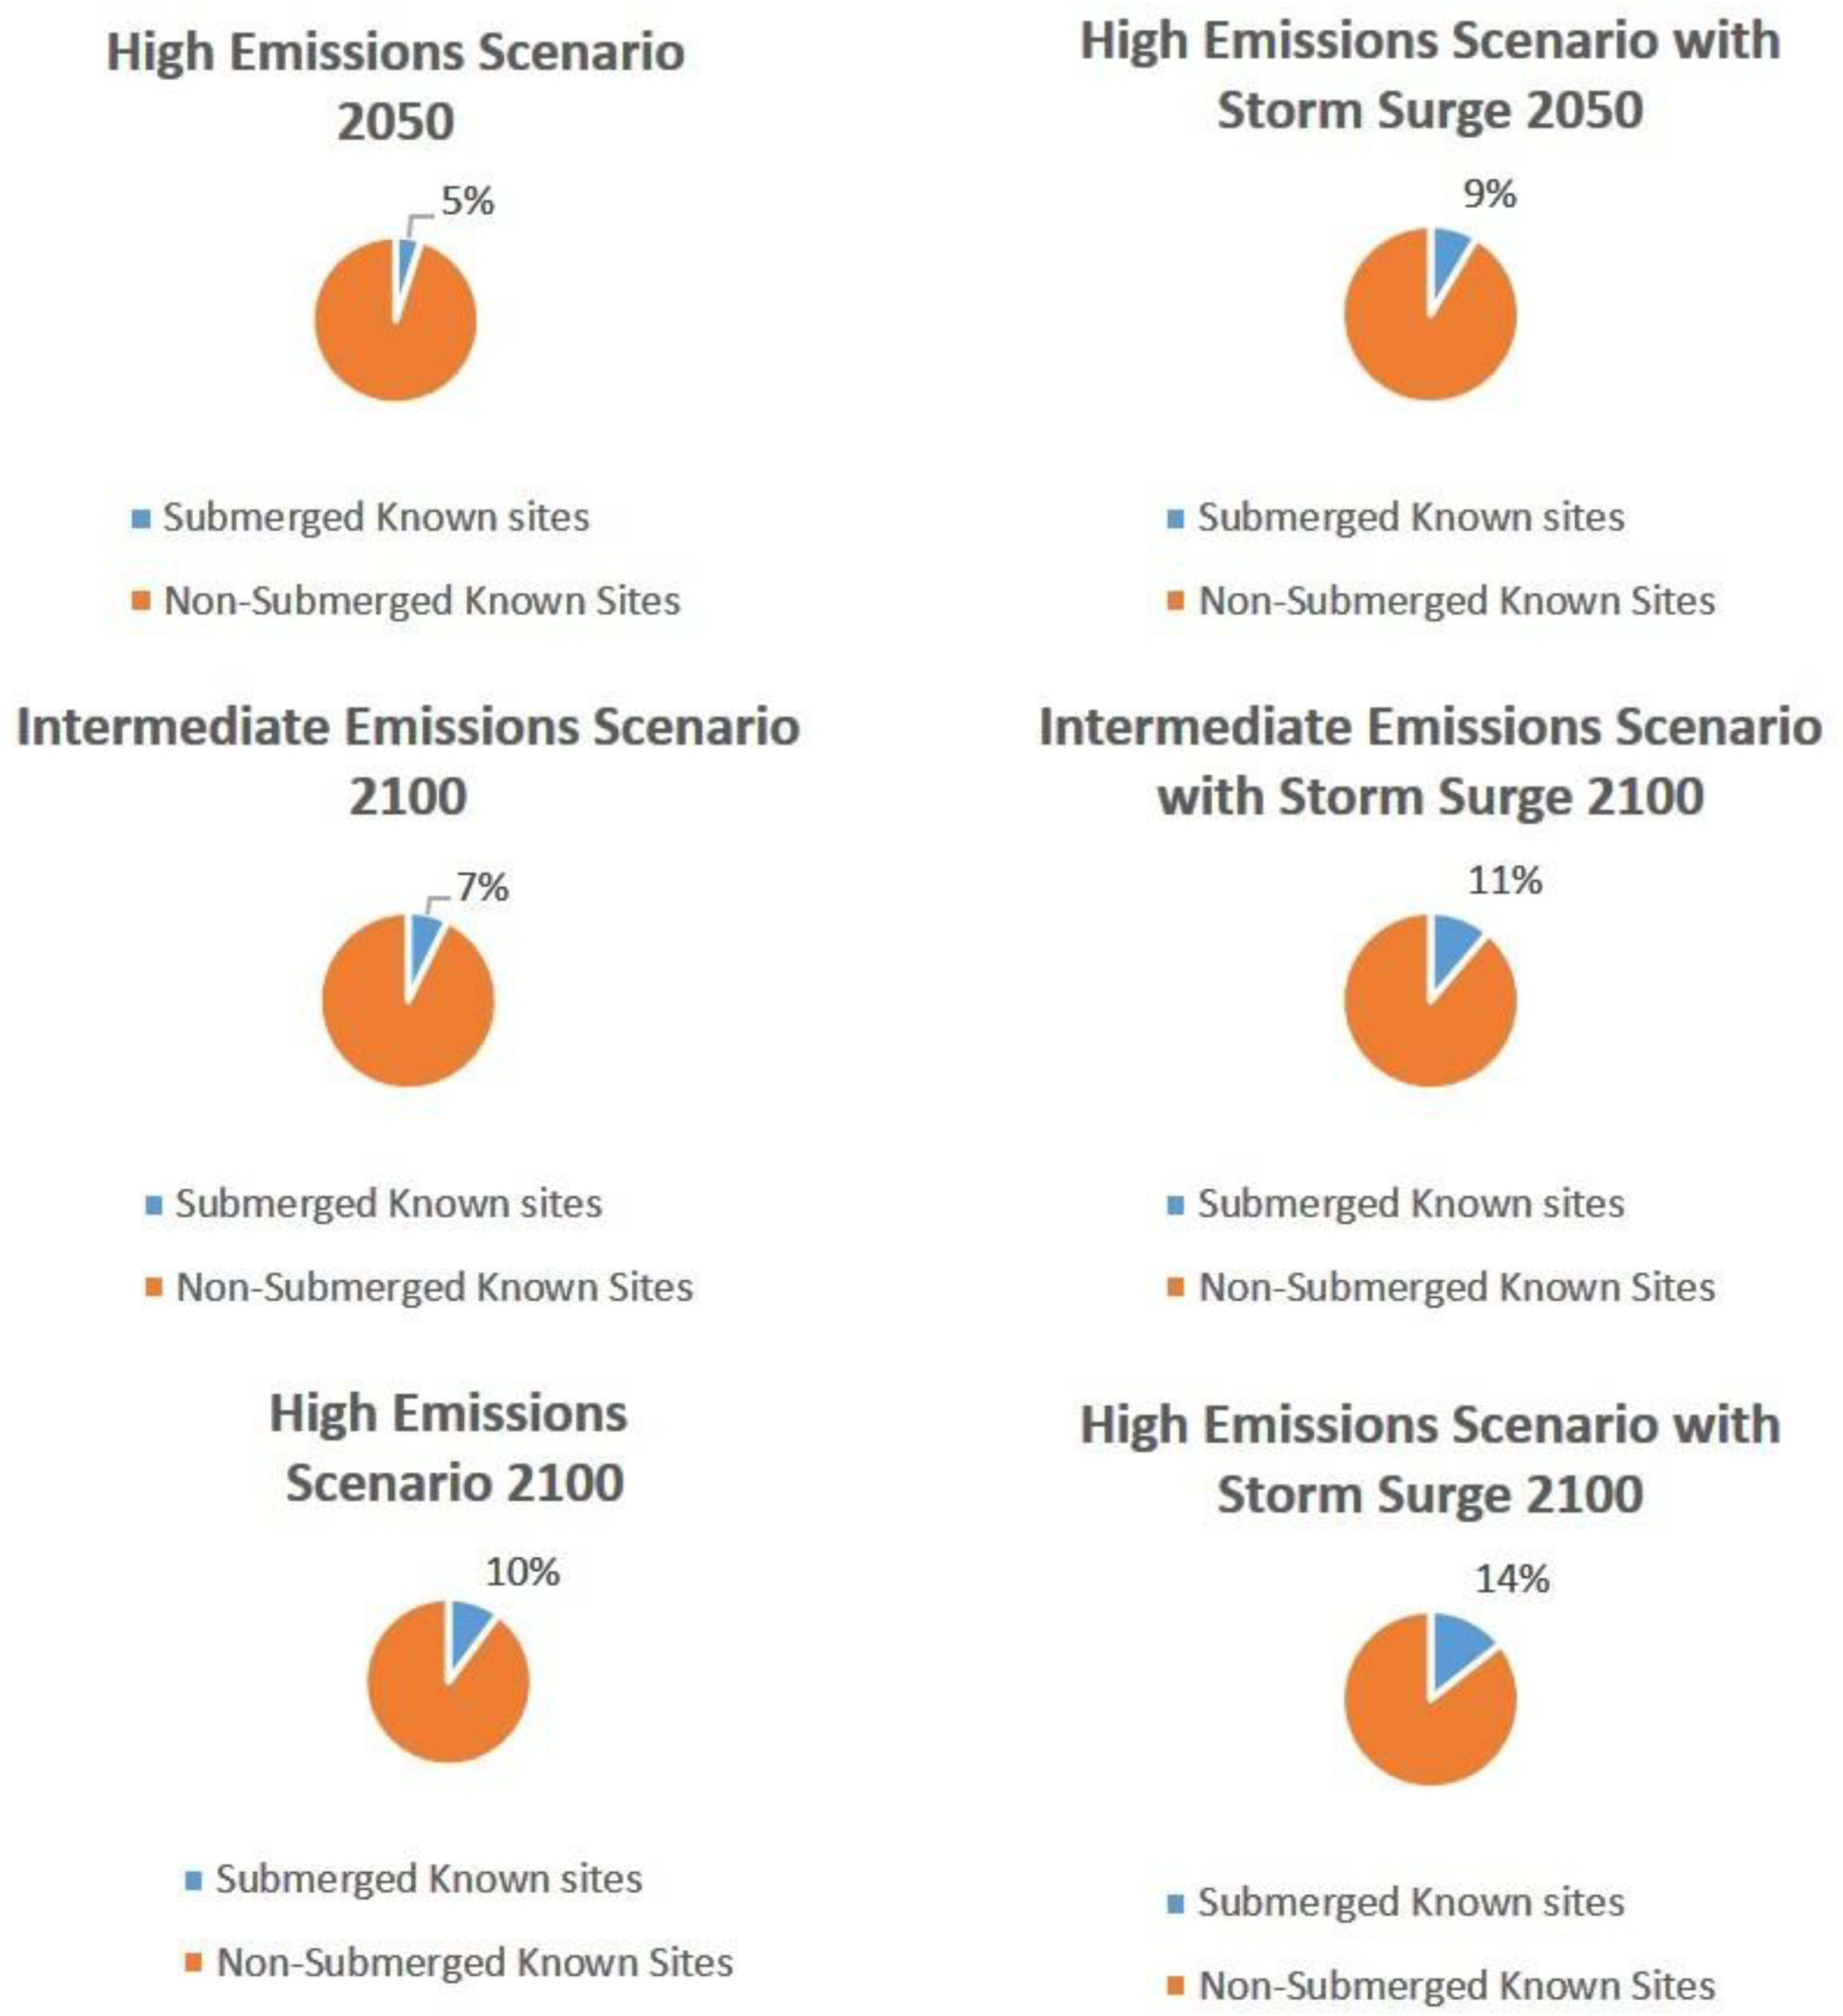
- High Emissions Scenario 2050
- High Emissions Scenario 2050 Storm Surges
- Intermediate Emissions Scenario 2100
- Intermediate Emissions Scenario 2100 Storm Surges
- High Emissions Scenario 2100
- High Emissions Scenario 2100 Storm Surges
2.3. Methodology
2.3.1. Cultural Heritage Vulnerability Assessment
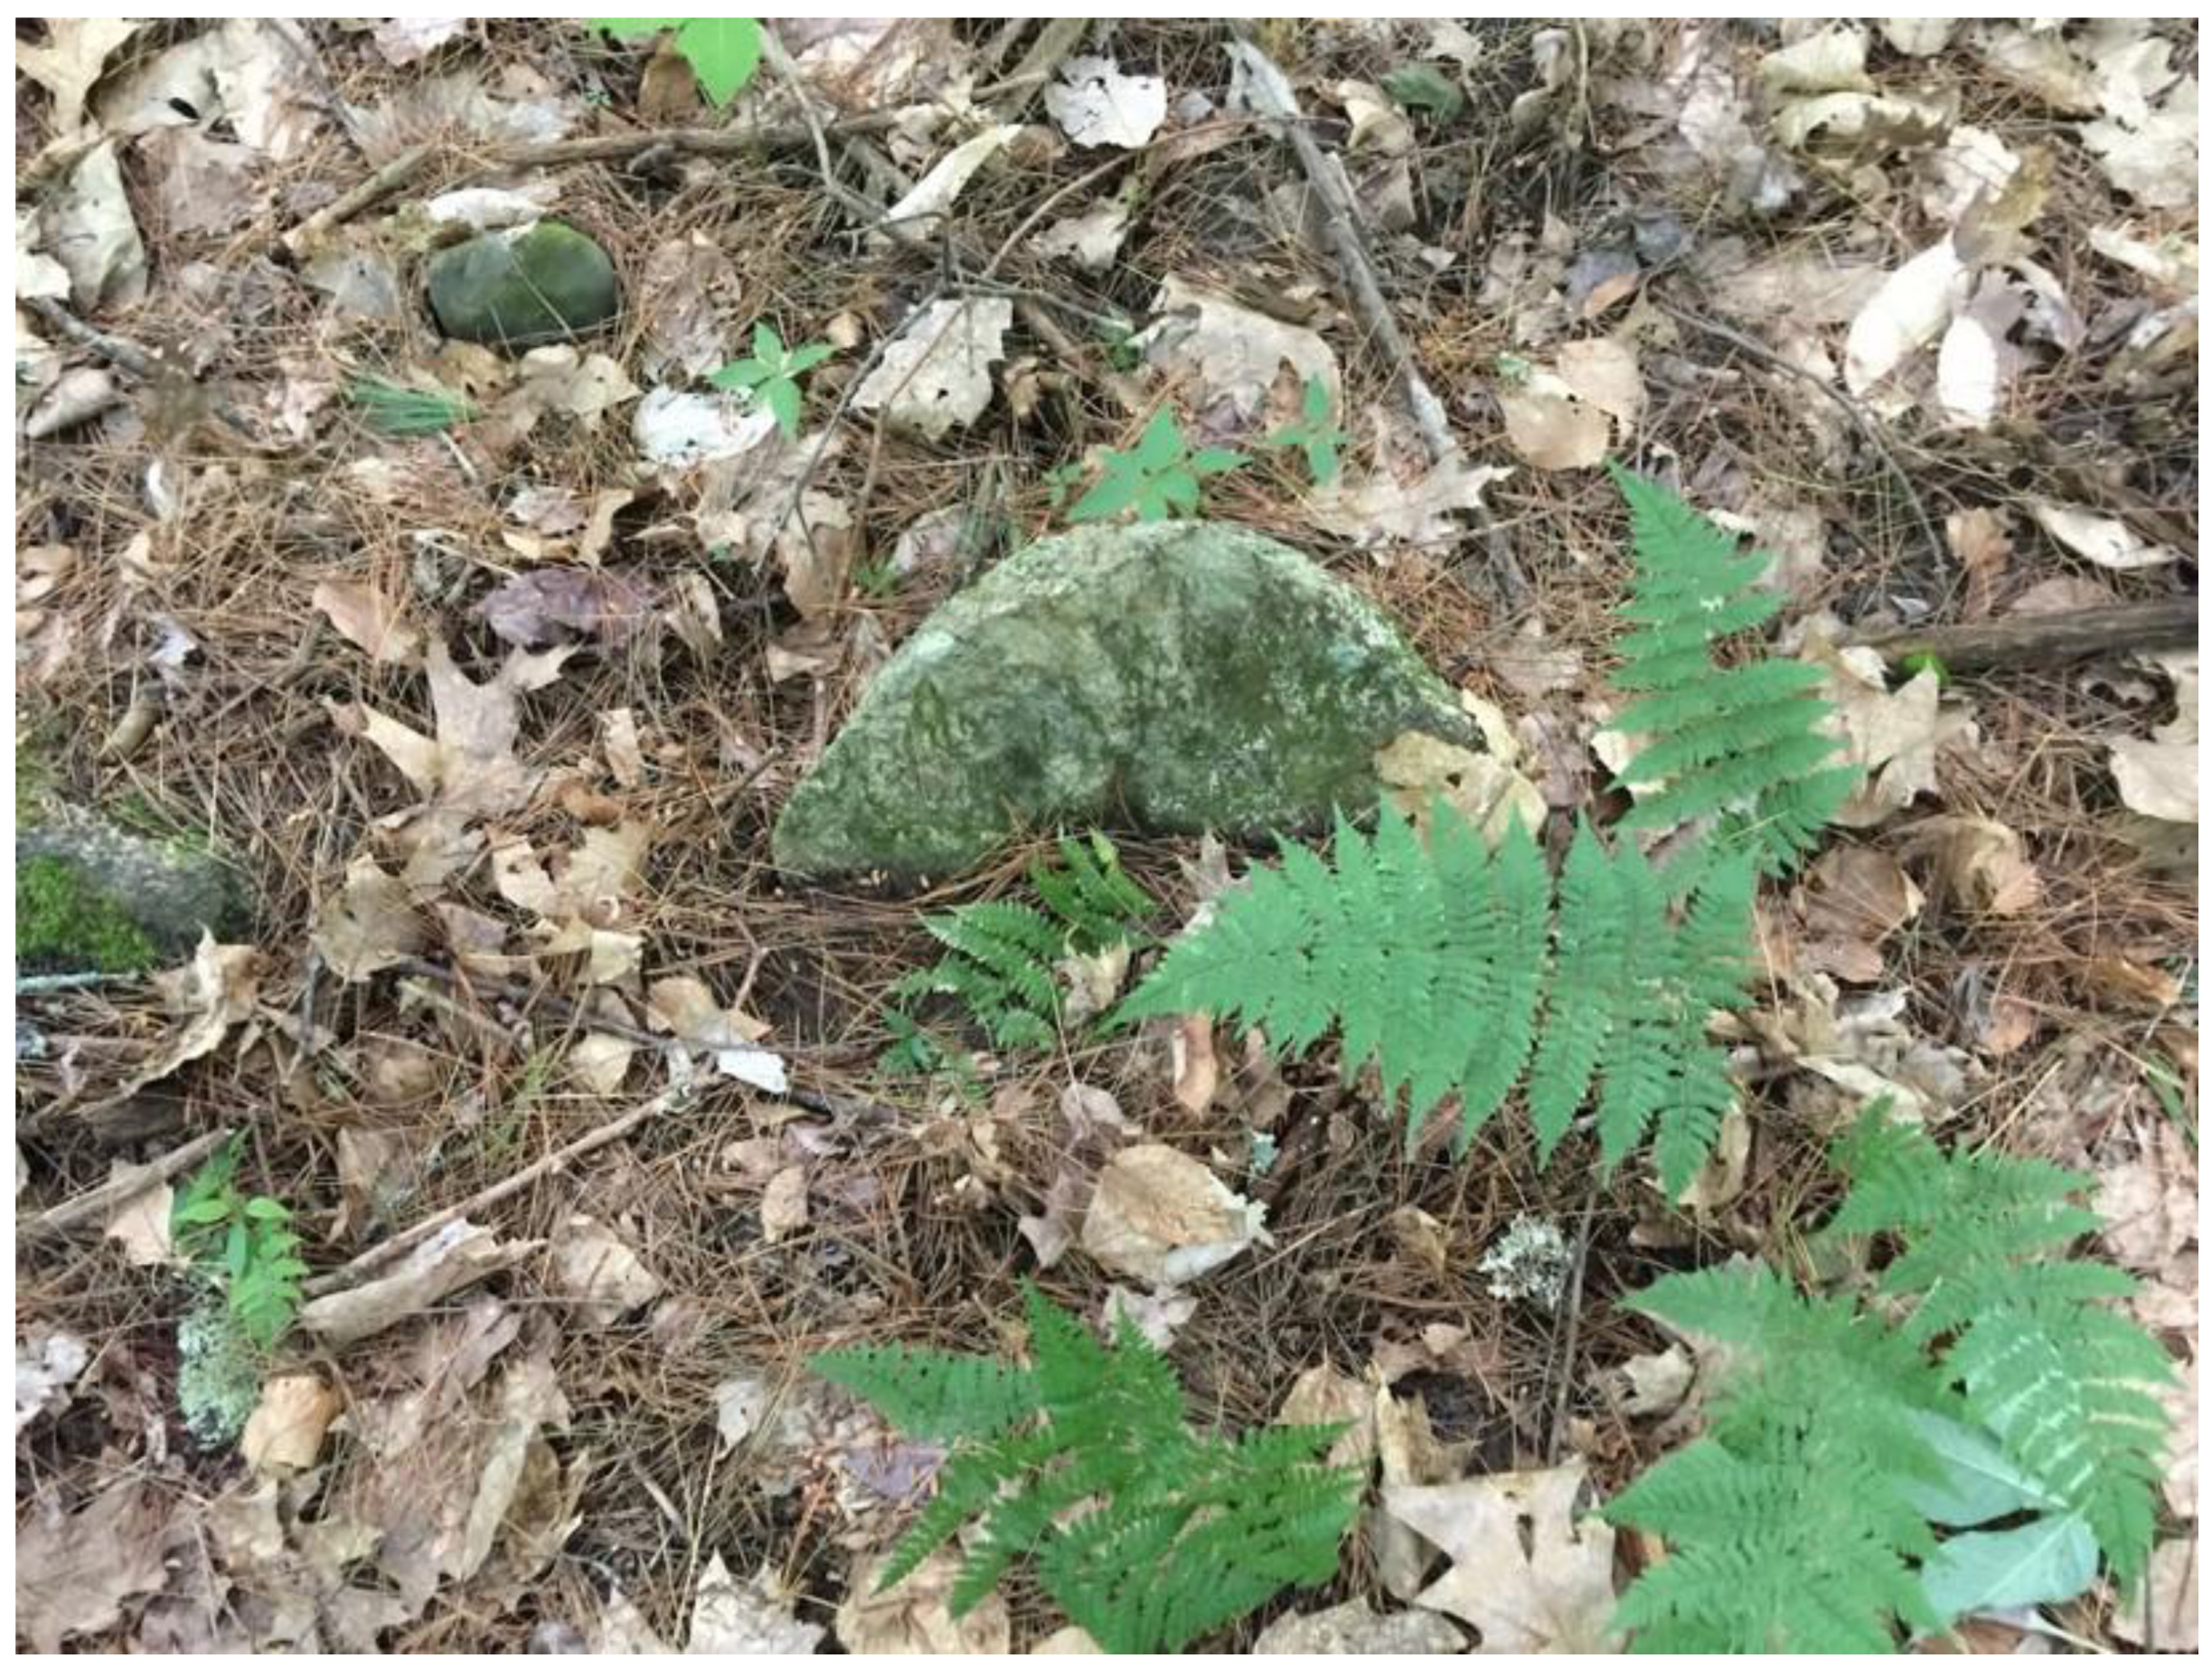
2.3.2. Historic Graveyard Assessment
3. Results
4. Discussion
5. Conclusions
Funding
Acknowledgments
Conflicts of Interest
References
- Abate, N.; Lasaponara, R. Preventive Archaeology Based on Open Remote Sensing Data and Tools: The Cases of Sant’Arsenio (SA) and Foggia (FG), Italy. Sustainability 2019, 11, 4145. [Google Scholar] [CrossRef] [Green Version]
- Araoz, G.F. Conservation Philosophy and its Development: Changing Understandings of Authenticity and Significance. Herit. Soc. 2013, 6, 144–154. [Google Scholar] [CrossRef]
- Barthel-Bouchier, D. Cultural Heritage and the Challenge of Sustainability; Left Coast Press: Walnut Creek, CA, USA, 2013. [Google Scholar]
- Brodie, N. Introduction. In Archaeology, Cultural Heritage and the Antiquities Trade; Brodie, N., Kersel, M., Luke, C., Tubb, K., Eds.; University Press of Florida: Gainesville, FL, USA, 2006; pp. 1–24. [Google Scholar]
- Casana, J.; Laugier, E.J. Satellite imagery-based monitoring of archaeological site damage in the Syrian civil war. PLoS ONE 2017, 12, e0188589. [Google Scholar] [CrossRef] [PubMed] [Green Version]
- Colwell-Chanthaphonh, C. The Archaeologist as World Citizen. In Cosmopolitan Archaeologies; Meskell, L., Ed.; Duke University Press: Durham, NC, USA, 2009; pp. 140–165. [Google Scholar]
- Hammer, E.L.; Seifried, R.M.; Franklin, K.; Lauricella, A. Remote assessments of the archaeological heritage situation in Afghanistan. J. Cult. Herit. 2018, 33, 125–144. [Google Scholar] [CrossRef] [Green Version]
- Kelleher, M. Images of the Past: Historical Authenticity and Inauthenticity from Disney to Times Square. CRM J. 2004, 1, 6–19. [Google Scholar]
- Meskell, L. Negative Heritage and Past Mastering in Archaeology. Anthr. Q. 2002, 75, 557–574. [Google Scholar] [CrossRef]
- Silverman, H. Touring Ancient Times: The Present and Presented Past in Contemporary Peru. Am. Anthr. 2002, 104, 881–902. [Google Scholar] [CrossRef]
- Smith, L. Uses of Heritage; Routledge: London, UK, 2006. [Google Scholar]
- Van Krieken-Pieters, J. Afghanistan’s Cultural Heritage: An Exceptional Case? In Archaeology, Cultural Heritage and the Antiquities Trade; Brodie, N., Kersel, M., Luke, C., Tubb, K., Eds.; University Press of Florida: Gainesville, FL, USA, 2006; pp. 227–235. [Google Scholar]
- Vecco, M. A definition of cultural heritage: From the tangible to the intangible. J. Cult. Herit. 2010, 11, 321–324. [Google Scholar] [CrossRef]
- Altschul, J. SAA Remarks: Effects of Climate Change on Cultural Resources; Union of Concerned Scientists Press Conference May 20 2014 (SAA Member Communication). Available online: https://www.eesi.org/briefings/view/052014landmarks (accessed on 4 January 2018).
- UNESCO. Predicting and Managing the Effects of Climate Change on World Heritage. 2006. Available online: http://whc.unesco.org/en/climatechange/ (accessed on 4 January 2018).
- UNESCO. World Heritage and Tourism in a Changing Climate. 2016. Available online: https://whc.unesco.org/en/activities/883/ (accessed on 4 January 2018).
- UNESCO. Climate Change and World Heritage. 2020. Available online: https://whc.unesco.org/en/climatechange/ (accessed on 4 January 2018).
- Earthjustice. Petition to the World Heritage Committee: The Role of Black Carbon in Endangering World Heritage Sites Threatened by Glacial Melt and Sea Level Rise. 2009. Available online: file:///C:/Users/mcn45/Downloads/activity-393-4.pdf (accessed on 4 January 2018).
- National Park Service, Department of the Interior (NPS). Preserving Coastal Heritage: Summary Report. 2014. Available online: http://www.achp.gov/docs/pch-summary-report.pdf (accessed on 4 January 2018).
- Union of Concerned Scientists. National Landmarks at Risk: How Rising Seas, Floods, and Wildfires are Threatening the United States’ Most Cherished Historic Sites. 2014. Available online: http://www.ucsusa.org/sites/default/files/legacy/assets/documents/global_warming/National-Landmarks-at-Risk-Full-Report.pdf (accessed on 4 January 2018).
- Church, J.A.; Clark, P.U.; Cazenave, A.; Gregory, J.M.; Jevrejeva, S.; Levermann, A.; Merrifield, M.A.; Milne, G.A.; Nerem, R.S.; Nunn, P.D.; et al. Sea Level Change. In Climate Change 2013: The Physical Science Basis; Contribution of Working Group I to the Fifth Assessment Report of the Intergovernmental Panel on Climate Change; Stocker, T.F., Qin, D., Plattner, G.-K., Tignor, M., Allen, S.K., Boschung, J., Nauels, A., Xia, Y., Bex, V., Midgley, P.M., Eds.; Cambridge University Press: Cambridge, UK, 2013. [Google Scholar]
- IPCC. Summary for Policymakers. In Global Warming of 1.5 °C; An IPCC Special Report on the impacts of global warming of 1.5 °C above pre-industrial levels and related global greenhouse gas emission pathways, in the context of strengthening the global response to the threat of climate change, sustainable development, and efforts to eradicate poverty; Masson-Delmotte, V., Zhai, P., Pörtner, H.-O., Roberts, D., Skea, J., Shukla, P.R., Pirani, A., Moufouma-Okia, W., Péan, C., Pidcock, R., Eds.; World Meteorological Organization: Geneva, Switzerland, 2018; Available online: https://www.ipcc.ch/ (accessed on 9 January 2020).
- NASA. Global Climate Change. Available online: https://climate.nasa.gov/vital-signs/sea-level/ (accessed on 9 January 2020).
- Chen, X.; Zhang, X.; Church, J.A.; Watson, C.S.; King, M.A.; Monselesan, D.; Legrésy, B.; Harig, C. The increasing rate of global mean sea-level rise during 1993–2014. Nat. Clim. Chang. 2017, 7, 492–495. [Google Scholar] [CrossRef]
- Anderson, D.G.; Bissett, T.G.; Yerka, S.J.; Wells, J.J.; Kansa, E.C.; Kansa, S.W.; Myers, K.N.; DeMuth, R.C.; White, D.A. Sea-level rise and archaeological site destruction: An example from the southeastern United States using DINAA (Digital Index of North American Archaeology). PLoS ONE 2017, 12, e0188142. [Google Scholar] [CrossRef] [Green Version]
- Carmichael, B.; Wilson, G.; Namarnyilk, I.; Nadji, S.; Brockwell, S.; Webb, B.; Hunter, F.; Bird, D. Local and Indigenous management of climate change risks to archaeological sites. Mitig. Adapt. Strat. Glob. Chang. 2017, 23, 231–255. [Google Scholar] [CrossRef]
- Erlandson, J.M. Racing a Rising Tide: Global Warming, Rising Seas, and the Erosion of Human History. J. Isl. Coast. Archaeol. 2008, 3, 167–169. [Google Scholar] [CrossRef]
- Erlandson, J.M. As the world warms: Rising seas, coastal archaeology, and the erosion of maritime history. J. Coast. Conserv. 2010, 16, 137–142. [Google Scholar] [CrossRef]
- McCoy, M. The Race to Document Archaeological Sites Ahead of Rising Sea Levels: Recent Applications of Geospatial Technologies in the Archaeology of Polynesia. Sustainability 2018, 10, 185. [Google Scholar] [CrossRef] [Green Version]
- Reeder-Myers, L.A. Cultural Heritage at Risk in the Twenty-First Century: A Vulnerability Assessment of Coastal Archaeological Sites in the United States. J. Isl. Coast. Archaeol. 2015, 10, 436–445. [Google Scholar] [CrossRef]
- Reeder-Myers, L.A.; McCoy, M.D. Preparing for the Future Impacts of Megastorms on Archaeological Sites: An Evaluation of Flooding from Hurricane Harvey, Houston, Texas. Am. Antiq. 2019, 84, 292–301. [Google Scholar] [CrossRef] [Green Version]
- Reimann, L.; Vafeidis, A.T.; Brown, S.; Hinkel, J.; Tol, R.S.J. Mediterranean UNESCO World Heritage at risk from coastal flooding and erosion due to sea-level rise. Nat. Commun. 2018, 9, 4161. [Google Scholar] [CrossRef] [Green Version]
- Bolster, W.J. The Mortal Sea: Fishing the Atlantic in the Age of Sail; Harvard University Press: Cambridge, MA, USA, 2012. [Google Scholar]
- Gillis, J. The Human Shore: Seacoasts in History; The University of Chicago Press: Chicago, IL, USA, 2012. [Google Scholar]
- UN Atlas of the Oceans. Human Settlements on the Coast. 2010. Available online: http://www.oceansatlas.org/servlet/CDSServlet?status=ND0xODc3JjY9ZW4mMzM9KiYzNz1rb3M (accessed on 10 January 2020).
- NOAA. National Coastal Population Report: Population trends from 1970 to 2020. 2013. Available online: http://stateofthecoast.noaa.gov/features/coastal-population-report.pdf> (accessed on 4 January 2018).
- Jackson, J.B.C.; Kirby, M.X.; Berger, W.H.; Bjorndal, K.A.; Botsford, L.W.; Bourque, B.J.; Bradbury, R.H.; Cooke, R.; Erlandson, J.; Estes, J.A.; et al. Historical Overfishing and the Recent Collapse of Coastal Ecosystems. Science 2001, 293, 629–637. [Google Scholar] [CrossRef] [Green Version]
- Myers, R.A.; Worm, B. Rapid worldwide depletion of predatory fish communities. Nat. Cell Biol. 2003, 423, 280–283. [Google Scholar] [CrossRef]
- Hughes, T.P.; Baird, A.H.; Bellwood, D.; Card, M.; Connolly, S.R.; Folke, C.; Grosberg, R.; Hoegh-Guldberg, O.; Jackson, J.B.C.; Kleypas, J.; et al. Climate Change, Human Impacts, and the Resilience of Coral Reefs. Science 2003, 301, 929–933. [Google Scholar] [CrossRef] [Green Version]
- Lotze, H.K. Depletion, Degradation, and Recovery Potential of Estuaries and Coastal Seas. Science 2006, 312, 1806–1809. [Google Scholar] [CrossRef] [PubMed]
- Pandolfi, J.M.; Bradbury, R.H.; Sala, E.; Hughes, T.P.; Bjorndal, K.A.; Cooke, R.G.; McArdle, D.; McClenachan, L.; Newman, M.J.H.; Paredes, G.; et al. Global Trajectories of the Long-Term Decline of Coral Reef Ecosystems. Science 2003, 301, 955–958. [Google Scholar] [CrossRef] [PubMed] [Green Version]
- Costello, C.; Ovando, D.; Hilborn, R.; Gaines, S.D.; Deschenes, O.; Lester, S.E. Status and Solutions for the World’s Unassessed Fisheries. Science 2012, 338, 517–520. [Google Scholar] [CrossRef] [PubMed] [Green Version]
- McCauley, D.J.; Pinsky, M.L.; Palumbi, S.R.; Estes, J.A.; Joyce, F.H.; Warner, R.R. Marine defaunation: Animal loss in the global ocean. Science 2015, 347, 1255641. [Google Scholar] [CrossRef] [Green Version]
- Neubauer, P.; Jensen, O.P.; Hutchings, J.A.; Baum, J.K. Resilience and Recovery of Overexploited Marine Populations. Science 2013, 340, 347–349. [Google Scholar] [CrossRef]
- Pauly, D.; Watson, R.; Alder, J. Global trends in world fisheries: Impacts on marine ecosystems and food security. Philos. Trans. R. Soc. B Biol. Sci. 2005, 360, 5–12. [Google Scholar] [CrossRef] [Green Version]
- Steneck, R.S. Human influences on coastal ecosystems: Does overfishing create trophic cascades? Trends Ecol. Evol. 1998, 13, 429–430. [Google Scholar] [CrossRef]
- Marzeion, B.; Levermann, A. Loss of cultural world heritage and currently inhabited places to sea-level rise. Environ. Res. Lett. 2014, 9, 034001. [Google Scholar] [CrossRef]
- New Hampshire Coastal Risk and Hazards Commission. Preparing New Hampshire for Projected Storm Surge, Sea-Level Rise and Extreme Precipitation. 2016. Available online: http://www.nhcrhc.org/wp-content/uploads/2016-CRHC-final-report.pdf (accessed on 4 January 2018).
- Wake, C.; Burakowski, E.; Kelsey, E.; Hayhoe, K.; Stoner, A.; Watson, C.; Douglas, E. Climate Change in the Piscataqua/Great Bay Region: Past, Present, and Future. 2011. Carbon Solutions New England. Find the Geodatabase with the Sea Level Rise Rasters they derived and that was used in this analysis. Available online: https://seagrant.unh.edu/sites/seagrant.unh.edu/files/media/pdfs/extension/climate_change_in_the_piscataqua-great_bay_region.pdf or https://granit.unh.edu/data/metadata?file=sealevelrise_2ft_scenarios/nh/sealevelrise_2ft_scenarios.html (accessed on 6 January 2018).
- Wake, C.; Knott, J.; Lippmann, T.; Stampone, M.; Ballestero, T.; Bjerklie, D.; Burakowski, E.; Glidden, S.; Hosseini-Shakib, I.; Jacobs, J. New Hampshire Coastal Flood Risk Summary—Part I: Science. Prepared for the New Hampshire Coastal Flood Risk Science and Technical Advisory Panel; University of New Hampshire: Durham, NH, USA, 2019; Available online: https://scholars.unh.edu/cgi/viewcontent.cgi?article=1209&context=ersc (accessed on 9 January 2020).
- Brooks, L. Turning the Looking Glass on King Phillip’s War: Locating American Literature in Native Space. Am. Lit. Hist. 2013, 25, 718–750. [Google Scholar] [CrossRef]
- Bourque, B.J. Diversity and Complexity in Prehistoric Maritime Societies: A Gulf of Maine Perspective; Plenum Press: New York, NY, USA, 1995. [Google Scholar]
- Bourque, B.J. Twelve Thousand Years: American Indians in Maine; Cox, S.L., Whitehead, R.H., Eds.; University of Nebraska Press: Lincoln, CA, USA, 2001. [Google Scholar]
- Robinson, B.S.; Bolian, C. A Preliminary Report on the Rocks Road Site (Seabrook Station): Late Archaic to Contact Period Occupation in Seabrook, New Hampshire. New Hamps. Archeol. 1987, 28, 19–52. [Google Scholar]
- Lotze, H.K.; Milewski, I. Two Centuries of Multiple Human Impacts and Successive Changes in a North Atlantic Food Web. Ecol. Appl. 2004, 14, 1428–1447. [Google Scholar] [CrossRef] [Green Version]
- Spiess, A.E.; Lewis, R.A. The Turner Farm Fauna: 5000 Years of Hunting and Fishing in Penobscot Bay, Maine; Original Publications in Maine Archaeology #11; Maine State Museum, Maine Historic Preservation Commission, and Maine Archaeological Society: Augusta, ME, USA, 2001.
- Spiess, A.E.; Sobolik, K.; Crader, D.; Mosher, J.; Wilson, D. Cod, Clams, and Deer: The Food Remains from Indiantown Island. Archaeol. East. North Am. 2006, 34, 141–187. [Google Scholar]
- Brooks, L.T.; Brooks, C. The Reciprocity Principle and Traditional Ecological Knowledge. Int. J. Crit. Indig. Stud. 2010, 3, 11–28. [Google Scholar] [CrossRef] [Green Version]
- Salisbury, N. Manitou and Providence: Indians, Europeans, and the Making of New England, 1500–1643; Oxford University Press: New York, NY, USA, 1984. [Google Scholar]
- Starbuck, D. The Archaeology of New Hampshire: Exploring 10,000 years in the Granite State; University Press of New England: Hanover, NH, USA, 2006. [Google Scholar]
- Kurlansky, M. Cod: A Biography of the Fish that Changed the World; Walker and Company: New York, NY, USA, 1997. [Google Scholar]
- Smith, J. A Description of New England: Or The Obseruations, and Discoueries, of Captain Iohn Smith (Admirall of that Country) in the North of America, in the Year of Our Lord 1614 With the Successe of Sixe Ships, that Went the Next Yeare 1615; and the Accidents Befell him Among the French Men of Warre: With the Proofe of the Present Benefit this Countrey Affoords: Whither this Present Yeare, 1616, Eight Voluntary Ships are Gone to Make Further Tryall; Humfrey Lownes for Robert Clerke: London, UK, 1616. [Google Scholar]
- Burke, M. The Isles of Shoals. In Cross-Grained and Wily Waters: A Guide to the Piscataqua Maritime Region; Bolster, W.J., Ed.; Peter Randall Publisher: Portsmouth, NH, USA, 2002; pp. 12–14. [Google Scholar]
- Ramsden, D. Time and Tide. The Exeter Bulletin Fall 2001. Available online: https://www.exeter.edu/documents/Exeter_Bulletin/fall_01/contents.html (accessed on 6 January 2018).
- Candee, R. Merchant and Millwright: The Water Powered Sawmills of the Piscataqua. Old-Time N. Engl. 1970, 60, 131–149. [Google Scholar]
- DeLucia, C. Memory Lands: King Phillips War and the Place of Violence in the Northeast; Yale University Press: New Haven, CT, USA, 2018. [Google Scholar]
- Brown, C.J.; Greenly, M.; Lunt, R.W.; Sablock, P. Hard by the Water’s Edge: A Preliminary Report of the Darby Field Homestead-Bickford Garrison (27-ST-71) Excavations. New Hamps. Archaeol. 2014, 54, 14–38. [Google Scholar]
- Thompson, J.R.; Carpenter, D.N.; Cogbill, C.V.; Foster, D.R. Four Centuries of Change in Northeastern United States Forests. PLoS ONE 2013, 8, e72540. [Google Scholar] [CrossRef] [PubMed] [Green Version]
- Beaudoin, C. The Mills in Dover. In Cross-Grained and Wily Waters: A Guide to the Piscataqua Maritime Region; Bolster, W.J., Ed.; Peter Randall Publisher: Portsmouth, NH, USA, 2002; pp. 162–166. [Google Scholar]
- Bolster, W.J. Introduction: The Nature of this Place. In Cross-Grained and Wily Waters: A Guide to the Piscataqua Maritime Region; Bolster, W.J., Ed.; Peter Randall Publisher: Portsmouth, NH, USA, 2002; pp. xxi–xxix. [Google Scholar]
- Egberts, L.; Hundstad, D. Coastal heritage in touristic regional identity narratives: A comparison between the Norwegian region Sørlandet and the Dutch Wadden Sea area. Int. J. Heritage Stud. 2019, 25, 1073–1087. [Google Scholar] [CrossRef] [Green Version]
- Available online: https://citiesspeak.org/2020/10/01/portsmouth-nh-restaurants-show-signs-of-resilience-to-covid-19/ (accessed on 10 January 2020).
- Curran, B.; Routhier, M.; Mulukutla, G. Sea-Level Rise Vulnerability Assessment of Coastal Resources in New Hampshire. APT Bull. J. Preserv. Technol. 2016, 47, 23–30. [Google Scholar]
- Howey, M.C.L. Climate Change, Sea-Level Rise, and the Vulnerable Cultural Heritage of Coastal New Hampshire. Carsey School of Public Policy, Regional Issue Brief #52. 2018. Available online: https://scholars.unh.edu/carsey/341/ (accessed on 10 January 2020).
- Deetz, J. Small Things Forgotten: An Archaeology of Early American Life; Anchor Books: New York, NY, USA, 1996. [Google Scholar]
- New Hampshire Old Graveyards Association. Available online: http://www.nhoga.com/ (accessed on 6 January 2018).
- NH GRANIT Graveyards Metadata. Available online: https://granit.unh.edu/data/datacat/pages/grave.pdf (accessed on 9 January 2020).
- National Register of Historic Places. Available online: https://www.nps.gov/subjects/nationalregister/index.htm (accessed on 9 January 2020).
- Harrington, F.; Kenyon, V. New Hampshire Coastal Sites Survey, Summer 1986. New Hamps. Archeol. 1987, 28, 52–62. [Google Scholar]
- Available online: http://www.goportsmouthnh.com/ (accessed on 10 January 2020).
- Available online: https://www.visit-newhampshire.com/seacoast/ (accessed on 10 January 2020).
- Chhabra, D.; Healy, R.; Sills, E. Staged authenticity and heritage tourism. Ann. Tour. Res. 2003, 30, 702–719. [Google Scholar] [CrossRef]
- O’Brien, J. Firsting and Lasting: Writing Indians Out of Existence in New England; University of Minnesota Press: Minneapolis, MN, USA, 2010. [Google Scholar]
- Den Ouden, A. Beyond Conquest: Native Peoples and the Struggle for History in New England; University of Nebraska Press: Lincoln, NE, USA, 2005. [Google Scholar]
- Available online: https://www.nhpr.org/post/re-assessing-legend-hannah-duston-0#stream/0 (accessed on 9 January 2020).
- Available online: https://indigenousnh.com/ (accessed on 9 January 2020).
- Available online: https://www.unityparkndakinna.net/ (accessed on 9 January 2020).
- McCoy, M. Maps for Time Travelers: How Archaeologists Use Technology to Bring Us Closer to the Past; California University Press: Los Angeles, CA, USA, 2020. [Google Scholar]
- NOAA Sea Level Rise Data. Available online: https://coast.noaa.gov/digitalcoast/tools/slr.html (accessed on 10 January 2020).
- Climate Center Sea Level Rise Open Source Tools. Available online: https://ss2.climatecentral.org/ (accessed on 10 January 2020).


Publisher’s Note: MDPI stays neutral with regard to jurisdictional claims in published maps and institutional affiliations. |
© 2020 by the author. Licensee MDPI, Basel, Switzerland. This article is an open access article distributed under the terms and conditions of the Creative Commons Attribution (CC BY) license (http://creativecommons.org/licenses/by/4.0/).
Share and Cite
Howey, M.C.L. Harnessing Remote Sensing Derived Sea Level Rise Models to Assess Cultural Heritage Vulnerability: A Case Study from the Northwest Atlantic Ocean. Sustainability 2020, 12, 9429. https://0-doi-org.brum.beds.ac.uk/10.3390/su12229429
Howey MCL. Harnessing Remote Sensing Derived Sea Level Rise Models to Assess Cultural Heritage Vulnerability: A Case Study from the Northwest Atlantic Ocean. Sustainability. 2020; 12(22):9429. https://0-doi-org.brum.beds.ac.uk/10.3390/su12229429
Chicago/Turabian StyleHowey, Meghan C. L. 2020. "Harnessing Remote Sensing Derived Sea Level Rise Models to Assess Cultural Heritage Vulnerability: A Case Study from the Northwest Atlantic Ocean" Sustainability 12, no. 22: 9429. https://0-doi-org.brum.beds.ac.uk/10.3390/su12229429